Review brain tumors - Telecom Paris
31
Review of Longitudinal MRI Analysis for Brain Tumors Elsa Angelini 17 Nov. 2006
Transcript of Review brain tumors - Telecom Paris

Review of Longitudinal MRI Analysis for Brain
TumorsElsa Angelini17 Nov. 2006

MRI Difference maps• « Longitudinal study of brain morphometrics
using quantitative MRI and difference analysis », Liu,Lemieux, Bell, Sisodiya, Shorvon, Sander, Duncan, NeuroImage, 2003.
• Serial volumetry and voxel-based differences• Quantify and characterize longitudinal changes.• Hippocampus, cerebellum, neocortex.• 90 subjects (14-77 years old) divided into 3
epochs (<35, 35-54, >54).• Paired MRI scans 3.5 years apart.

MRI Difference maps
• MRI Processing:– Inhomogeneity correction,– Brain extraction (Exbrain)– Registration (MReg)– Segmentation of brain+CSF (Exbrain)
• Difference Maps– MReg estimation of noise level across the data set.– Structured Difference Image (SDI) =
(Direct_MRI_Difference) > (3×Noise_level) & (Spatial_extent > 7 voxels).

MRI Difference maps
• Difference Maps (cont.)– Structured Noise Map (SNM) = Anatomical
map of artifacts built from 40 control SDI, co-registered to Talairach space (SPM99).
– Normalized SDI (n-SDI): • T1 to SPM T1 template: Transfo matrix R.• SDI → R[SDI] + NN interpolation
– Significance of n-SDI:• Threshold of significance = 1:40• n-SDI(x) if (PSNM(x) <0.025)

MRI Difference maps
MRI Difference maps
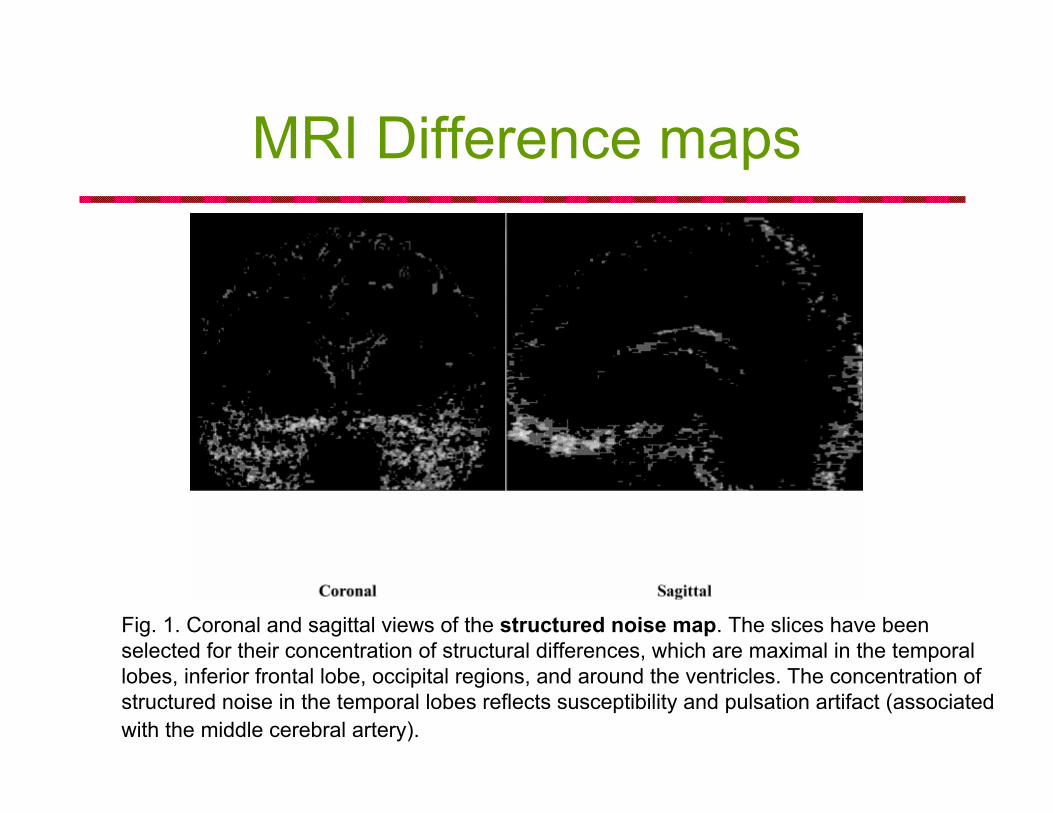
Fig. 1. Coronal and sagittal views of the structured noise map. The slices have beenselected for their concentration of structural differences, which are maximal in the temporal lobes, inferior frontal lobe, occipital regions, and around the ventricles. The concentration ofstructured noise in the temporal lobes reflects susceptibility and pulsation artifact (associatedwith the middle cerebral artery).

MRI Difference maps
Fig. 3. Distribution of age-related changes in each age band, obtained by summing the SDIs followed by filtering with the SNM. The greater the intensity of a given voxel, the greater the likelihood of that voxel showing a change in signal intensity over 3 years. The figures represent: (a) individuals under 35 years, (b) individuals between 35 and 54 years, and (c) individuals over 54 years of age. The absence of visible hippocampal changes may reflect structural heterogeneity, as well as limitations in the precision of thenormalization process.

MRI Difference maps
MRI Difference maps

MRI Difference maps
• Limitations:– Assume that normal noise maps are
applicable to patients (wrt standard artifacts).– Large lesions can affect normalization
algorithms.– Reslicing of the data involved.

MRI Longitudinal Segmentation + Deformations
• 4D segmentation of longitudinal MRI data with iterative:1. Segmentation via 4-D image-adaptive clustering based on
current estimate of longitudinal deformations in the image series.
2. Refinment of the longitudinal deformation using 4D elasticwarping.

MRI Longitudinal Segmentation + Deformations
• Pre-processing:– Inhomogeneity
correction, intensitynormalization and rigidregistration.
MRI Longitudinal Segmentation + Deformations
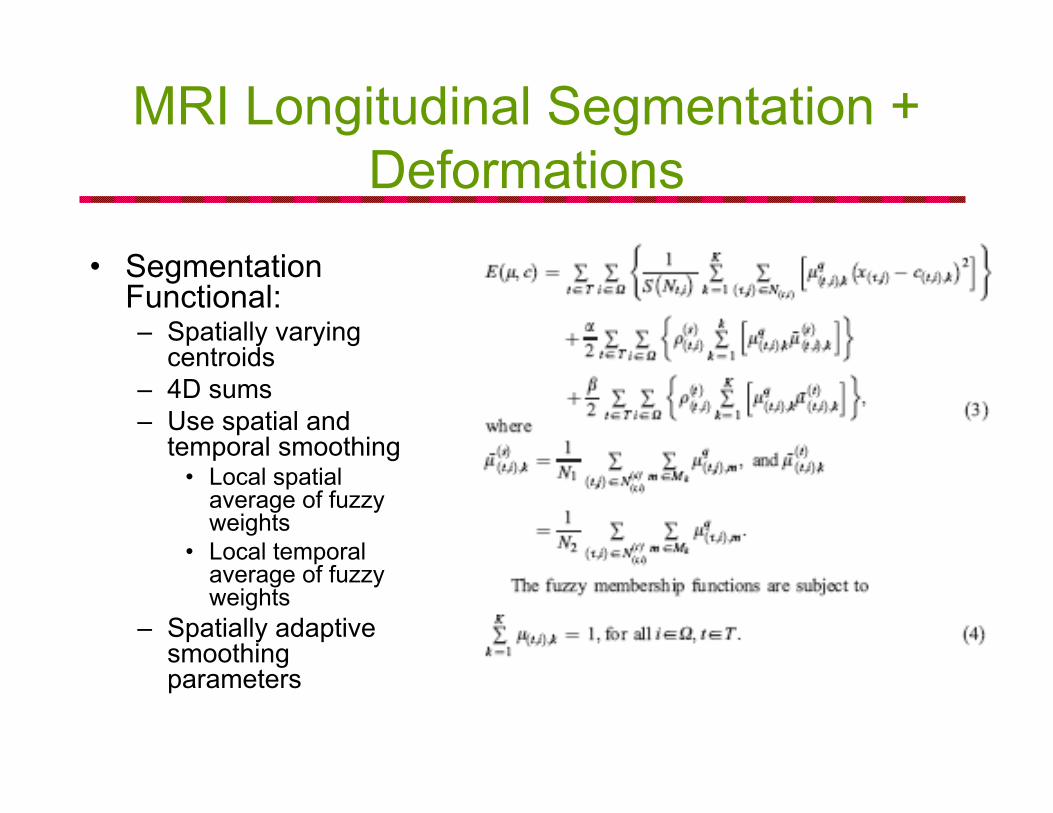
• Segmentation Functional:– Spatially varying
centroids– 4D sums– Use spatial and
temporal smoothing• Local spatial
average of fuzzyweights
• Local temporal average of fuzzyweights
– Spatially adaptive smoothingparameters

MRI Longitudinal Segmentation + Deformations
• Implementation- Evaluated on small longitudinal evolutions (atrophy) + BLSA for aging.
- Requires « smooth » longitudinal evolution.

MRI Histrogram Normalization
• Training– Global linear mapping of intensity range value to a standard range of
values.– Averaging of intensity values of percentile landmark levels.
• Normalization– Series of linear mappings between landmark levels.

MRI Histrogram Normalization

MRI Histrogram Normalization

MRI Histrogram Normalization

MRI Histrogram Normalization
• Limitations– No meaning of the landmark points wrt to
anatomical tissues: might strech differentlytwo parts of a single tissue (WM).
– Training with a priori maximum intensity range known.

Tumor-induced Assymetry
• Assess mass-effect and infiltration effects from brain tumors• Large and small structural variations + intensity variations

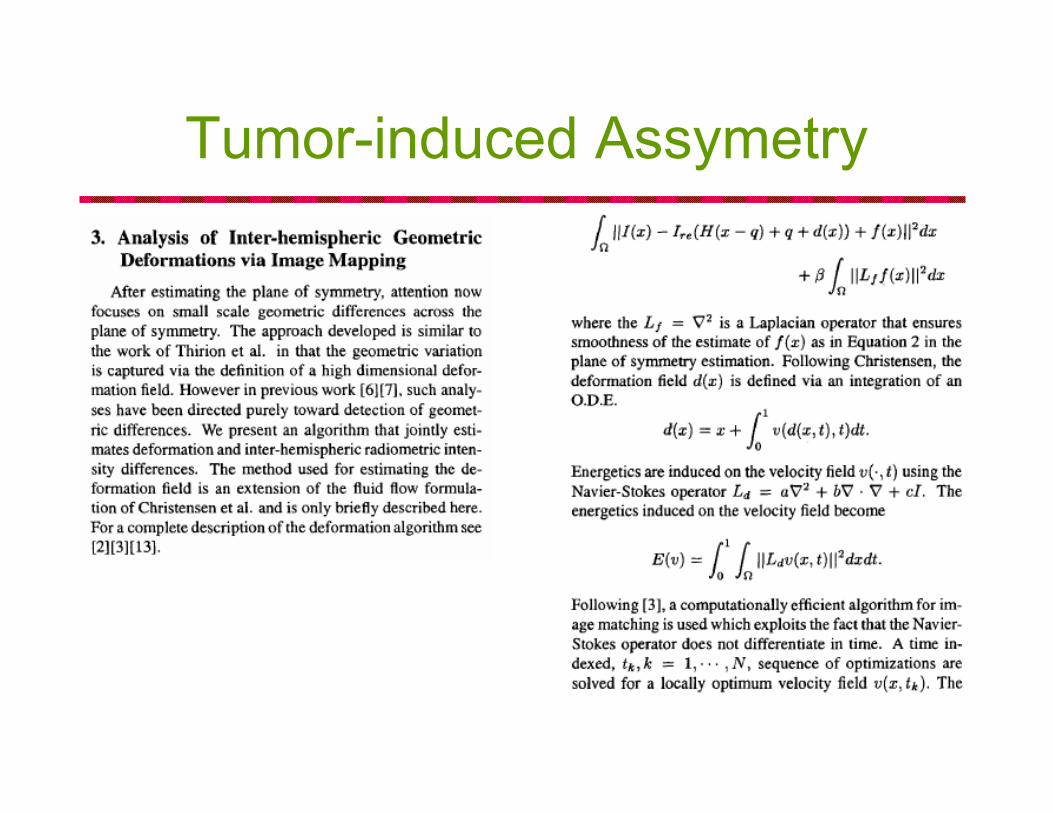
Tumor-induced Assymetry• Variational Framework
Tumor effect
Symmetry plane
TumorEffect
Tumor-induced Assymetry

Tumor-induced Assymetry
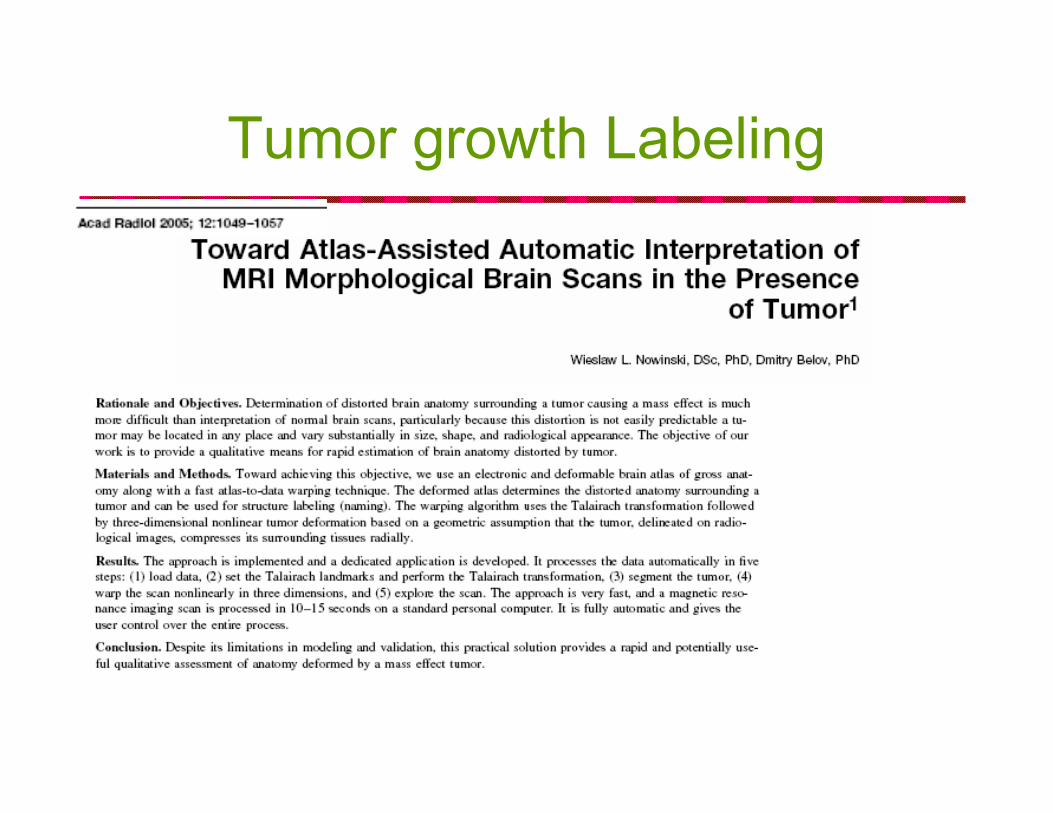
Tumor growth Labeling

Tumor growth Labeling

Tumor growth Labeling

Tumor Growth Index« Continuous growth of mean tumor diameter in a subset of grade
II gliomas », Mandonnet E, Delattre JY, Tanguy ML, SwansonKR, Carpentier AF, Duffau H, Cornu P, Van Effenterre R, AlvordEC Jr, Capelle L. Ann Neurol. 2003 Apr;53(4):524-8.
Abstract: Serial magnetic resonance images of 27 patients withuntreated World Health Organization grade II oligodendrogliomas or mixed gliomas were reviewed retrospectively to study the kinetics oftumor growth before anaplastic transformation. Analysis of the meantumor diameters over time showed constant growth. Linearregression, using a mixed model, found an average slope of 4.1mm per year (95% confidence interval, 3.8-4.4mm/year). Untreated low-grade oligodendrogliomas or mixed gliomas grow continuouslyduring their premalignant phase, and their pattern of growth can bepredicted within a relatively narrow range. These findings could beof interest to optimize patients management and follow-up.

Tumor Growth Manual Variability

Tumor Longitudinal Volume Measurement

Tumor knowledge
Tumor Longitudinal Volume Measurement

Longitudinal
Tumor Longitudinal Volume Measurement