Review Article - Hindawi Publishing...
21
Review Article Potentiostats for Protein Biosensing: Design Considerations and Analysis on Measurement Characteristics Saad Abdullah , Sarah Tonello , Michela Borghetti , Emilio Sardini , and Mauro Serpelloni Università degli Studi di Brescia, Dipartimento di Ingegneria dell’Informazione, Via Branze 38, 25123 Brescia, Italy Correspondence should be addressed to Mauro Serpelloni; [email protected] Received 29 November 2018; Accepted 14 February 2019; Published 17 March 2019 Academic Editor: Bruno C. Janegitz Copyright © 2019 Saad Abdullah et al. This is an open access article distributed under the Creative Commons Attribution License, which permits unrestricted use, distribution, and reproduction in any medium, provided the original work is properly cited. The demand for the development of swift, simple, and ultrasensitive biosensors has been increasing after the introduction of innovative approaches such as bioelectronics, nanotechnology, and electrochemistry. The possibility to correlate changes in electrical parameters with the concentration of protein biomarkers in biological samples is appealing to improve sensitivity, reliability, and repeatability of the biochemical assays currently available for protein investigation. Potentiostats are the required instruments to ensure the proper cell conditioning and signal processing in accurate electrochemical biosensing applications. In this light, this review is aimed at analyzing design considerations, electrical specifications, and measurement characteristics of potentiostats, specifically customized for protein detection. This review demonstrates how a proper potentiostat for protein quantification should be able to supply voltages in a range between few mV to few V, with high resolution in terms of readable current (in the order of 100 pA). To ensure a reliable quantification of clinically relevant protein concentrations (>1 ng/mL), the accuracy of the measurement (<1%) is significant and it can be ensured with proper digital-to-analog (10-16 bits) and analog-to-digital (10-24 bits) converters. Furthermore, the miniaturisation of electrochemical systems represents a key step toward portable, real-time, and fast point-of-care applications. This review is meant to serve as a guide for the design of customized potentiostats capable of a more proper and enhanced conditioning of electrochemical biosensors for protein detection. 1. Introduction An increasingly investigated aspect in the research field of pharmaceutics, biotechnology, and diagnostic is represented by the development of low-cost devices which could give a fast, reliable, noninvasive feedback on physiological and biological processes [1]. Most of the techniques available in biotechnology labo- ratories for biomolecule investigation are mostly expensive, time-consuming, and highly operator-dependent. More- over, they are often harmful for the samples and able to give only qualitative or semiquantitative feedbacks rather than sensitive and precise measurements. In this picture, the development of electrochemical sensing devices for the detection and investigation of biomolecules including metabolites, nucleic acids, and proteins plays an important role in medical diagnostics [2–4]. High selectivity, sensitivity, standardization, and low limit of detection (LOD) represent the key points required in order to compete with the standard biochemical assays. These aspects are primarily influenced by the choice of materials and geometries for biosensor produc- tion and of biomolecules and nanomaterials adopted for the biofunctionalization (e.g., aptamers, antibodies, and coated nanoparticles) [5]. However, in addition to those, the elec- tronic circuit for biosensor conditioning, signal acquisition, and transmission contributes strongly in enhancing the per- formances of the assay [6]. Thus, the possibility to design a circuit able to specifically select the proper electrochemical methods and to enhance the small currents from redox reac- tions represents a powerful tool to improve the performances of standard biochemical assays [7]. The instrumentation for electrochemical biosensors can be divided in four functional blocks, including signal pro- cessing, readout circuit, potentiostat, and signal generator Hindawi Journal of Sensors Volume 2019, Article ID 6729329, 20 pages https://doi.org/10.1155/2019/6729329
Transcript of Review Article - Hindawi Publishing...
Review ArticlePotentiostats for Protein Biosensing: Design Considerations andAnalysis on Measurement Characteristics
Saad Abdullah , Sarah Tonello , Michela Borghetti , Emilio Sardini ,and Mauro Serpelloni
Università degli Studi di Brescia, Dipartimento di Ingegneria dell’Informazione, Via Branze 38, 25123 Brescia, Italy
Correspondence should be addressed to Mauro Serpelloni; [email protected]
Received 29 November 2018; Accepted 14 February 2019; Published 17 March 2019
Academic Editor: Bruno C. Janegitz
Copyright © 2019 Saad Abdullah et al. This is an open access article distributed under the Creative Commons Attribution License,which permits unrestricted use, distribution, and reproduction in any medium, provided the original work is properly cited.
The demand for the development of swift, simple, and ultrasensitive biosensors has been increasing after the introduction ofinnovative approaches such as bioelectronics, nanotechnology, and electrochemistry. The possibility to correlate changes inelectrical parameters with the concentration of protein biomarkers in biological samples is appealing to improve sensitivity,reliability, and repeatability of the biochemical assays currently available for protein investigation. Potentiostats are the requiredinstruments to ensure the proper cell conditioning and signal processing in accurate electrochemical biosensing applications. Inthis light, this review is aimed at analyzing design considerations, electrical specifications, and measurement characteristics ofpotentiostats, specifically customized for protein detection. This review demonstrates how a proper potentiostat for proteinquantification should be able to supply voltages in a range between few mV to few V, with high resolution in terms of readablecurrent (in the order of 100 pA). To ensure a reliable quantification of clinically relevant protein concentrations (>1 ng/mL), theaccuracy of the measurement (<1%) is significant and it can be ensured with proper digital-to-analog (10-16 bits) andanalog-to-digital (10-24 bits) converters. Furthermore, the miniaturisation of electrochemical systems represents a key steptoward portable, real-time, and fast point-of-care applications. This review is meant to serve as a guide for the design ofcustomized potentiostats capable of a more proper and enhanced conditioning of electrochemical biosensors for protein detection.
1. Introduction
An increasingly investigated aspect in the research field ofpharmaceutics, biotechnology, and diagnostic is representedby the development of low-cost devices which could give afast, reliable, noninvasive feedback on physiological andbiological processes [1].
Most of the techniques available in biotechnology labo-ratories for biomolecule investigation are mostly expensive,time-consuming, and highly operator-dependent. More-over, they are often harmful for the samples and able togive only qualitative or semiquantitative feedbacks ratherthan sensitive and precise measurements. In this picture,the development of electrochemical sensing devices for thedetection and investigation of biomolecules includingmetabolites, nucleic acids, and proteins plays an importantrole in medical diagnostics [2–4]. High selectivity, sensitivity,
standardization, and low limit of detection (LOD) representthe key points required in order to compete with the standardbiochemical assays. These aspects are primarily influenced bythe choice of materials and geometries for biosensor produc-tion and of biomolecules and nanomaterials adopted for thebiofunctionalization (e.g., aptamers, antibodies, and coatednanoparticles) [5]. However, in addition to those, the elec-tronic circuit for biosensor conditioning, signal acquisition,and transmission contributes strongly in enhancing the per-formances of the assay [6]. Thus, the possibility to design acircuit able to specifically select the proper electrochemicalmethods and to enhance the small currents from redox reac-tions represents a powerful tool to improve the performancesof standard biochemical assays [7].
The instrumentation for electrochemical biosensors canbe divided in four functional blocks, including signal pro-cessing, readout circuit, potentiostat, and signal generator
HindawiJournal of SensorsVolume 2019, Article ID 6729329, 20 pageshttps://doi.org/10.1155/2019/6729329
[8, 9]. Among these, potentiostat represents the core unit ofthe acquisition system, which significantly influences thesensitivity of the overall measurement [10, 11]. It functionsby regulating the potential difference between referenceelectrode (RE) and working electrode (WE). Additionally, apotentiostat also measures the flow of current between WEand an auxiliary electrode, usually referred to as counterelectrode (CE) [12], due to a redox reaction in the biologicalfluid which induces the movement of charges [13, 14]. Asdiscussed in detail in the literature [15], the use of threeelectrodes is required to have a precise control of the poten-tial across the working electrode since the reference elec-trode has a stable and well-known electrode potential andit is used as a point of reference in the electrochemical cellfor the potential control and measurement. Despite thiscommon general operating principle, when dealing withbiosensing applications, the design of a sensitive and accu-rate potentiostat is necessarily related to the specific analyte,the electrochemical method, and the overall requirementsneeded for each specific biosensing application. Primarily,potentiostats are used to detect or measure specific analytessuch as metabolites (glucose, cholesterol, and lactate), ions(K+, Na+, and Ca2+), and metals (zinc, lead) in biologicalfluids [16–18]. An accurate detection of these metabolitesor ions facilitates in the diagnosis and control or treatmentof various diseases, for instance, diabetes, acute heart dis-eases, hypoxia, coronary heart disease, myocardial infarction,and hypertension [19]. Furthermore, another significanttarget is represented by proteins, due to their fundamentalrole as a primary link between information processes andreplication at the genetic level [20]. Understanding the pro-tein’s action may help in investigating the state of differentdiseases [21]. The ability to detect protein biomarkers whenstill present in very low concentrations (pg/mL) might repre-sent a powerful tool for early detection and prevention of theonset of various pathologies. In this light, researchers areincreasingly exploring the advancement in the design ofbiosensors with a properly integrated customized condition-ing circuit for achieving higher sensitivity, reliability, andstandardization of protein quantification.
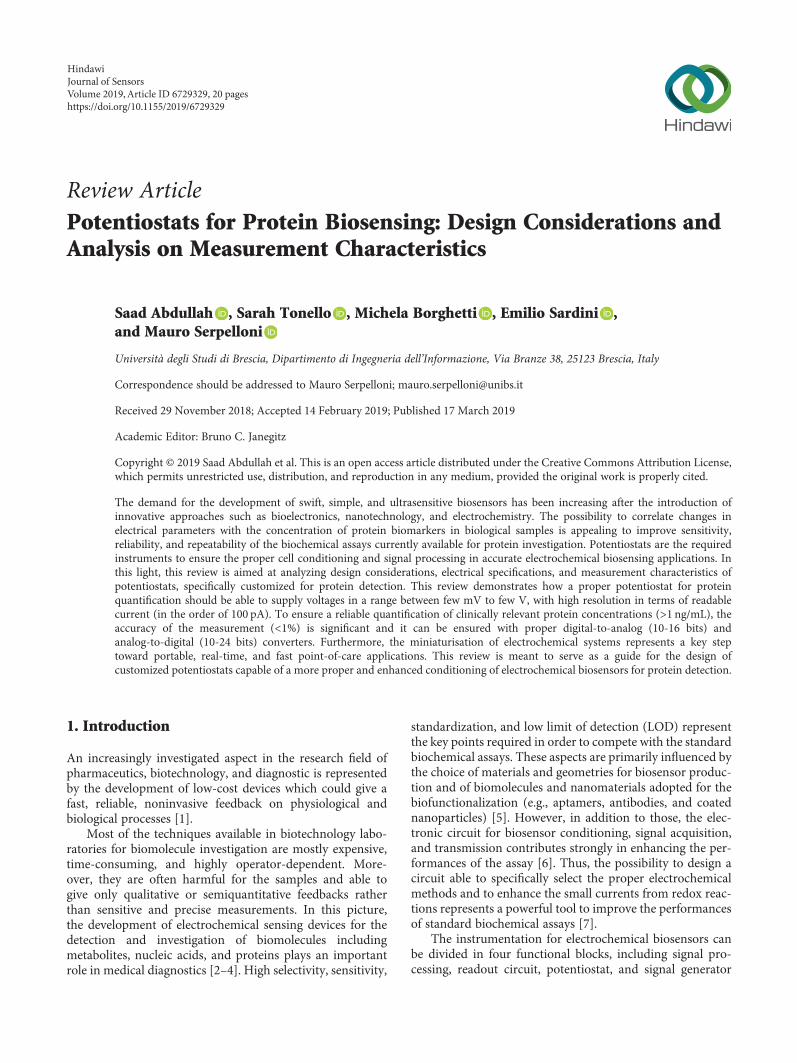
Figure 1 shows the increasing trend of using poten-tiostat for biosensing over the course of 18 years; thetrend is obtained through Scopus using specific keywords“voltammetry” and “protein detection.”
The specific focus of this review is the analysis of designconsiderations, electrical specifications, and measurementcharacteristics of potentiostats specifically customized forprotein detection. After a brief overview of the main poten-tiostat operational modes, a comprehensive and updatedreview of the most relevant and promising potentiostatdesigns for protein investigation will be given. In addition,the portability and figure of merit of the potentiostatsspecifically designed for each category application will bedeeply discussed.
1.1. Potentiostat Operational Modes. The different techniquesavailable for measuring the response or characterising bio-sensors possibly addressed to protein investigation can beclassified in three main operational modes: voltammetric/
amperometric, impedimetric and potentiometric, withDC voltages, DC currents, and AC signals as respectiveresponses.
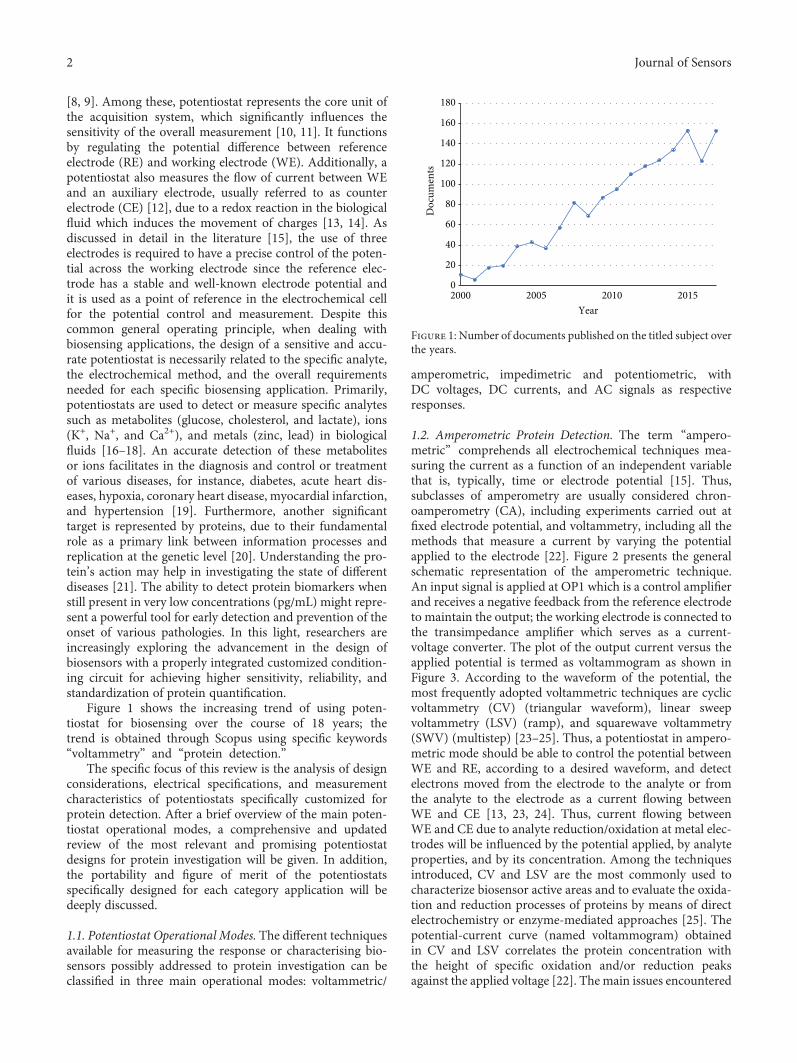
1.2. Amperometric Protein Detection. The term “ampero-metric” comprehends all electrochemical techniques mea-suring the current as a function of an independent variablethat is, typically, time or electrode potential [15]. Thus,subclasses of amperometry are usually considered chron-oamperometry (CA), including experiments carried out atfixed electrode potential, and voltammetry, including all themethods that measure a current by varying the potentialapplied to the electrode [22]. Figure 2 presents the generalschematic representation of the amperometric technique.An input signal is applied at OP1 which is a control amplifierand receives a negative feedback from the reference electrodeto maintain the output; the working electrode is connected tothe transimpedance amplifier which serves as a current-voltage converter. The plot of the output current versus theapplied potential is termed as voltammogram as shown inFigure 3. According to the waveform of the potential, themost frequently adopted voltammetric techniques are cyclicvoltammetry (CV) (triangular waveform), linear sweepvoltammetry (LSV) (ramp), and squarewave voltammetry(SWV) (multistep) [23–25]. Thus, a potentiostat in ampero-metric mode should be able to control the potential betweenWE and RE, according to a desired waveform, and detectelectrons moved from the electrode to the analyte or fromthe analyte to the electrode as a current flowing betweenWE and CE [13, 23, 24]. Thus, current flowing betweenWE and CE due to analyte reduction/oxidation at metal elec-trodes will be influenced by the potential applied, by analyteproperties, and by its concentration. Among the techniquesintroduced, CV and LSV are the most commonly used tocharacterize biosensor active areas and to evaluate the oxida-tion and reduction processes of proteins by means of directelectrochemistry or enzyme-mediated approaches [25]. Thepotential-current curve (named voltammogram) obtainedin CV and LSV correlates the protein concentration withthe height of specific oxidation and/or reduction peaksagainst the applied voltage [22]. The main issues encountered
0
20
40
60
80
100
120
140
160
180
2000 2005 2010 2015
Doc
umen
ts
Year
Figure 1: Number of documents published on the titled subject overthe years.
2 Journal of Sensors
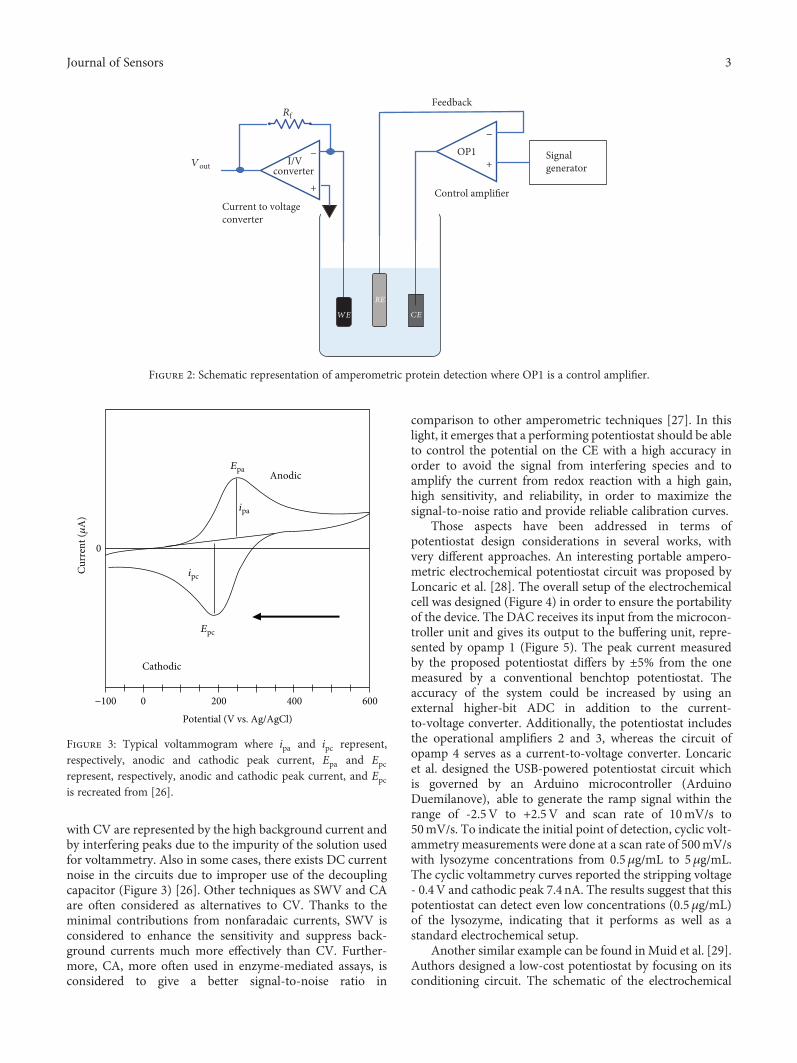
with CV are represented by the high background current andby interfering peaks due to the impurity of the solution usedfor voltammetry. Also in some cases, there exists DC currentnoise in the circuits due to improper use of the decouplingcapacitor (Figure 3) [26]. Other techniques as SWV and CAare often considered as alternatives to CV. Thanks to theminimal contributions from nonfaradaic currents, SWV isconsidered to enhance the sensitivity and suppress back-ground currents much more effectively than CV. Further-more, CA, more often used in enzyme-mediated assays, isconsidered to give a better signal-to-noise ratio in
comparison to other amperometric techniques [27]. In thislight, it emerges that a performing potentiostat should be ableto control the potential on the CE with a high accuracy inorder to avoid the signal from interfering species and toamplify the current from redox reaction with a high gain,high sensitivity, and reliability, in order to maximize thesignal-to-noise ratio and provide reliable calibration curves.
Those aspects have been addressed in terms ofpotentiostat design considerations in several works, withvery different approaches. An interesting portable ampero-metric electrochemical potentiostat circuit was proposed byLoncaric et al. [28]. The overall setup of the electrochemicalcell was designed (Figure 4) in order to ensure the portabilityof the device. The DAC receives its input from the microcon-troller unit and gives its output to the buffering unit, repre-sented by opamp 1 (Figure 5). The peak current measuredby the proposed potentiostat differs by ±5% from the onemeasured by a conventional benchtop potentiostat. Theaccuracy of the system could be increased by using anexternal higher-bit ADC in addition to the current-to-voltage converter. Additionally, the potentiostat includesthe operational amplifiers 2 and 3, whereas the circuit ofopamp 4 serves as a current-to-voltage converter. Loncaricet al. designed the USB-powered potentiostat circuit whichis governed by an Arduino microcontroller (ArduinoDuemilanove), able to generate the ramp signal within therange of -2.5V to +2.5V and scan rate of 10mV/s to50mV/s. To indicate the initial point of detection, cyclic volt-ammetry measurements were done at a scan rate of 500mV/swith lysozyme concentrations from 0.5μg/mL to 5μg/mL.The cyclic voltammetry curves reported the stripping voltage- 0.4V and cathodic peak 7.4 nA. The results suggest that thispotentiostat can detect even low concentrations (0.5μg/mL)of the lysozyme, indicating that it performs as well as astandard electrochemical setup.
Another similar example can be found inMuid et al. [29].Authors designed a low-cost potentiostat by focusing on itsconditioning circuit. The schematic of the electrochemical
WE
RE
CE
Rf
Vout
Current to voltageconverter
−
+
−
+SignalgeneratorI/V
converter
Feedback
Control amplifier
OP1
Figure 2: Schematic representation of amperometric protein detection where OP1 is a control amplifier.
Epa
Epc
Cathodic
ipa
ipc
0
Curr
ent (𝜇
A)
−100 0 200 400
Potential (V vs. Ag/AgCl)
600
Anodic
Figure 3: Typical voltammogram where ipa and ipc represent,respectively, anodic and cathodic peak current, Epa and Epcrepresent, respectively, anodic and cathodic peak current, and Epcis recreated from [26].
3Journal of Sensors
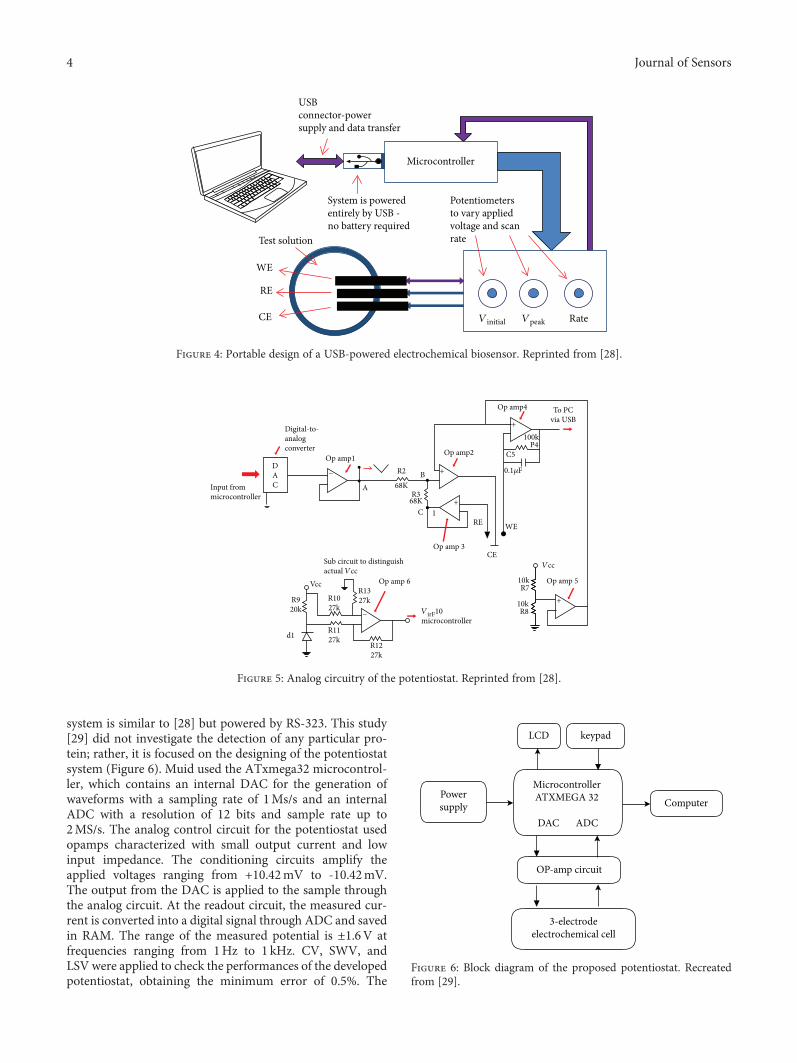
system is similar to [28] but powered by RS-323. This study[29] did not investigate the detection of any particular pro-tein; rather, it is focused on the designing of the potentiostatsystem (Figure 6). Muid used the ATxmega32 microcontrol-ler, which contains an internal DAC for the generation ofwaveforms with a sampling rate of 1Ms/s and an internalADC with a resolution of 12 bits and sample rate up to2MS/s. The analog control circuit for the potentiostat usedopamps characterized with small output current and lowinput impedance. The conditioning circuits amplify theapplied voltages ranging from +10.42mV to -10.42mV.The output from the DAC is applied to the sample throughthe analog circuit. At the readout circuit, the measured cur-rent is converted into a digital signal through ADC and savedin RAM. The range of the measured potential is ±1.6V atfrequencies ranging from 1Hz to 1 kHz. CV, SWV, andLSV were applied to check the performances of the developedpotentiostat, obtaining the minimum error of 0.5%. The
USBconnector-powersupply and data transfer
Microcontroller
Test solution
WE
RE
CE
Potentiometersto vary appliedvoltage and scanrate
System is poweredentirely by USB -no battery required
Vinitial Vpeak Rate
Figure 4: Portable design of a USB-powered electrochemical biosensor. Reprinted from [28].
+
+
+
−
−+
Digital-to-analogconverter
Op amp1
A
R2
R3
C 1
B
Op amp2
Op amp4 To PCvia USB
68K
100kP4
C5
WERE
10kR7
10k
R1227k
R1127k
R1027k
R920k
d1
VccR1327k
R8
CE
VirF10microcontroller
Vcc
Op amp 3
Op amp 5Op amp 6
Sub circuit to distinguishactual Vcc
0.1𝜇F
68K
Input frommicrocontroller
DAC
Figure 5: Analog circuitry of the potentiostat. Reprinted from [28].
LCD keypad
Computer
OP-amp circuit
3-electrodeelectrochemical cell
DAC ADC
Powersupply
MicrocontrollerATXMEGA 32
Figure 6: Block diagram of the proposed potentiostat. Recreatedfrom [29].
4 Journal of Sensors
overall design and performance of [29] made it eligible to beused for protein biosensing in an amperometric mode.
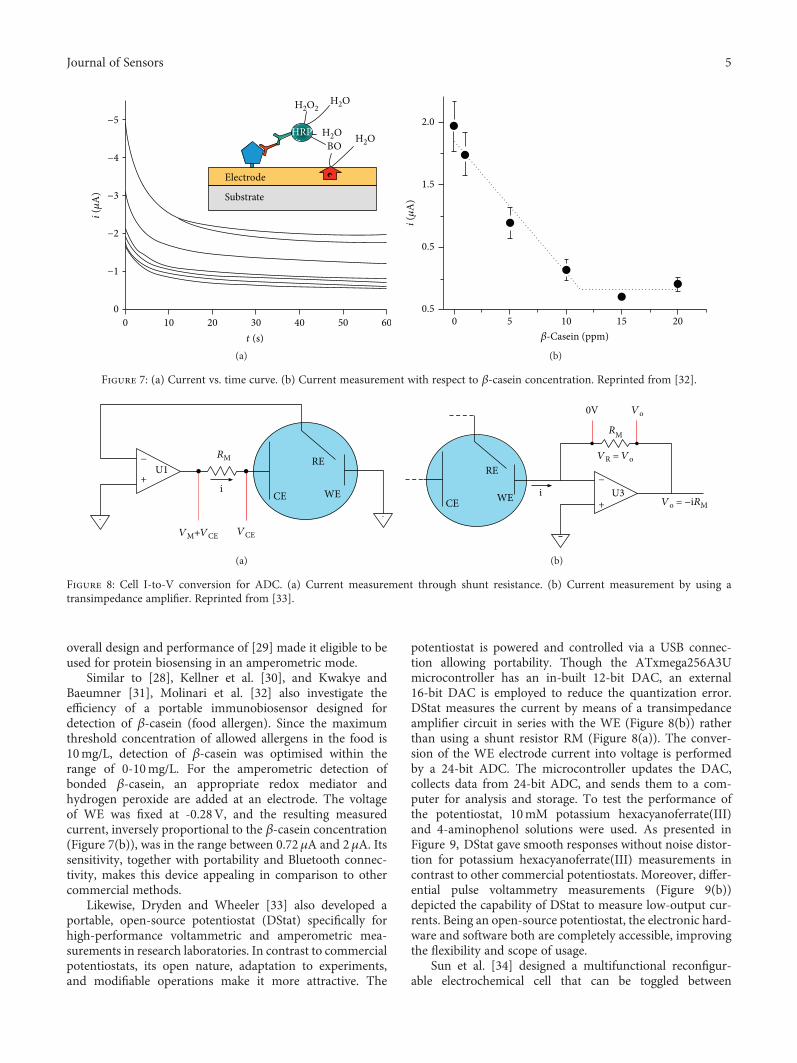
Similar to [28], Kellner et al. [30], and Kwakye andBaeumner [31], Molinari et al. [32] also investigate theefficiency of a portable immunobiosensor designed fordetection of β-casein (food allergen). Since the maximumthreshold concentration of allowed allergens in the food is10mg/L, detection of β-casein was optimised within therange of 0-10mg/L. For the amperometric detection ofbonded β-casein, an appropriate redox mediator andhydrogen peroxide are added at an electrode. The voltageof WE was fixed at -0.28V, and the resulting measuredcurrent, inversely proportional to the β-casein concentration(Figure 7(b)), was in the range between 0.72μA and 2μA. Itssensitivity, together with portability and Bluetooth connec-tivity, makes this device appealing in comparison to othercommercial methods.
Likewise, Dryden and Wheeler [33] also developed aportable, open-source potentiostat (DStat) specifically forhigh-performance voltammetric and amperometric mea-surements in research laboratories. In contrast to commercialpotentiostats, its open nature, adaptation to experiments,and modifiable operations make it more attractive. The
potentiostat is powered and controlled via a USB connec-tion allowing portability. Though the ATxmega256A3Umicrocontroller has an in-built 12-bit DAC, an external16-bit DAC is employed to reduce the quantization error.DStat measures the current by means of a transimpedanceamplifier circuit in series with the WE (Figure 8(b)) ratherthan using a shunt resistor RM (Figure 8(a)). The conver-sion of the WE electrode current into voltage is performedby a 24-bit ADC. The microcontroller updates the DAC,collects data from 24-bit ADC, and sends them to a com-puter for analysis and storage. To test the performance ofthe potentiostat, 10mM potassium hexacyanoferrate(III)and 4-aminophenol solutions were used. As presented inFigure 9, DStat gave smooth responses without noise distor-tion for potassium hexacyanoferrate(III) measurements incontrast to other commercial potentiostats. Moreover, differ-ential pulse voltammetry measurements (Figure 9(b))depicted the capability of DStat to measure low-output cur-rents. Being an open-source potentiostat, the electronic hard-ware and software both are completely accessible, improvingthe flexibility and scope of usage.
Sun et al. [34] designed a multifunctional reconfigur-able electrochemical cell that can be toggled between
(a)
i (𝜇
A)
𝛽-Casein (ppm)
0.5
0.5
1.5
2.0
0 5 10 15 20
(b)
Figure 7: (a) Current vs. time curve. (b) Current measurement with respect to β-casein concentration. Reprinted from [32].
−
+U1
RM RE
CE WEi
VM+VCE VCE
(a)
RE
0V Vo
RM
−
+U3
VR = Vo
Vo = −iRMWE i
CE
(b)
Figure 8: Cell I-to-V conversion for ADC. (a) Current measurement through shunt resistance. (b) Current measurement by using atransimpedance amplifier. Reprinted from [33].
5Journal of Sensors
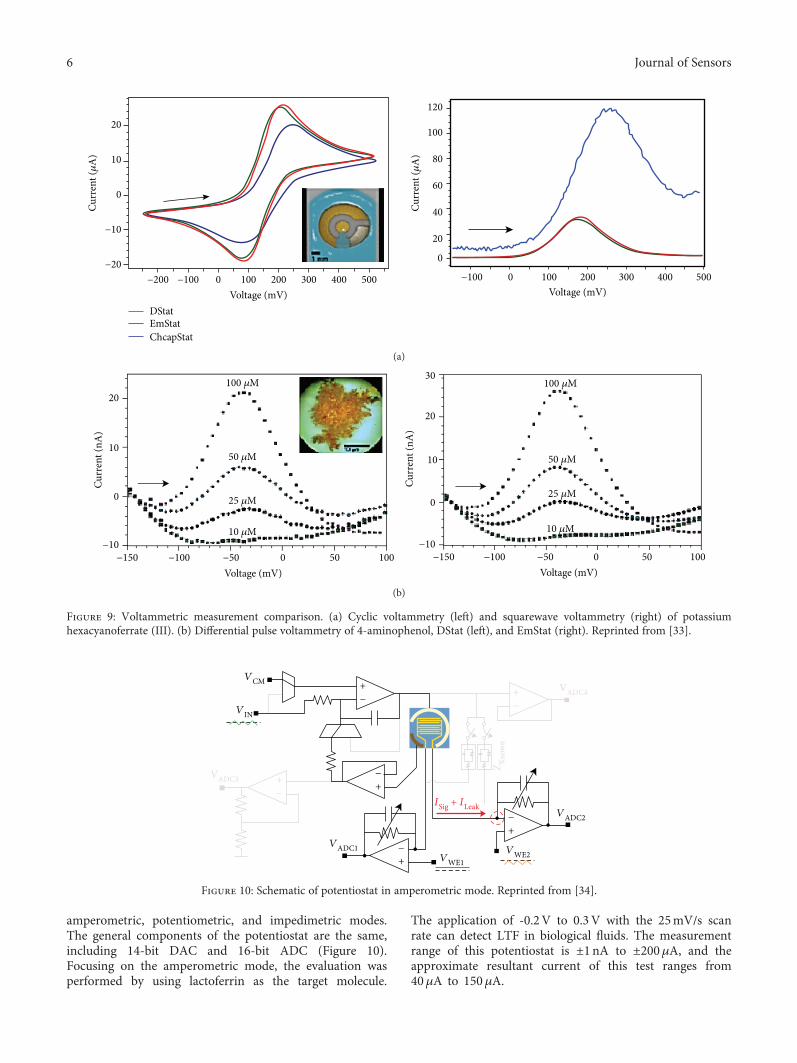
amperometric, potentiometric, and impedimetric modes.The general components of the potentiostat are the same,including 14-bit DAC and 16-bit ADC (Figure 10).Focusing on the amperometric mode, the evaluation wasperformed by using lactoferrin as the target molecule.
The application of -0.2V to 0.3V with the 25mV/s scanrate can detect LTF in biological fluids. The measurementrange of this potentiostat is ±1nA to ±200μA, and theapproximate resultant current of this test ranges from40μA to 150μA.
20
10
0
Curr
ent (𝜇
A)
−10
−20−200 −100 0 100 200 300 400 500
120
100
80
60
40
20
0
Curr
ent (𝜇
A)
500400300200Voltage (mV)Voltage (mV)
1000−100
DStatEmStatChcapStat
(a)
20
10
−10
0
Curr
ent (
nA)
100 𝜇M
50 𝜇M
25 𝜇M
10 𝜇M
100500−50Voltage (mV)
−100−150
20
30
10
−10
0
Curr
ent (
nA)
100 𝜇M
50 𝜇M
25 𝜇M
10 𝜇M
100500−50Voltage (mV)
−100−150
(b)
Figure 9: Voltammetric measurement comparison. (a) Cyclic voltammetry (left) and squarewave voltammetry (right) of potassiumhexacyanoferrate (III). (b) Differential pulse voltammetry of 4-aminophenol, DStat (left), and EmStat (right). Reprinted from [33].
VADC3
VCM
VIN
VADC4
Z Know
n
VADC2
VWE2VWE1
ISig + ILeak
VADC1
+−
+− +
−
+−
+−
+−
Figure 10: Schematic of potentiostat in amperometric mode. Reprinted from [34].
6 Journal of Sensors
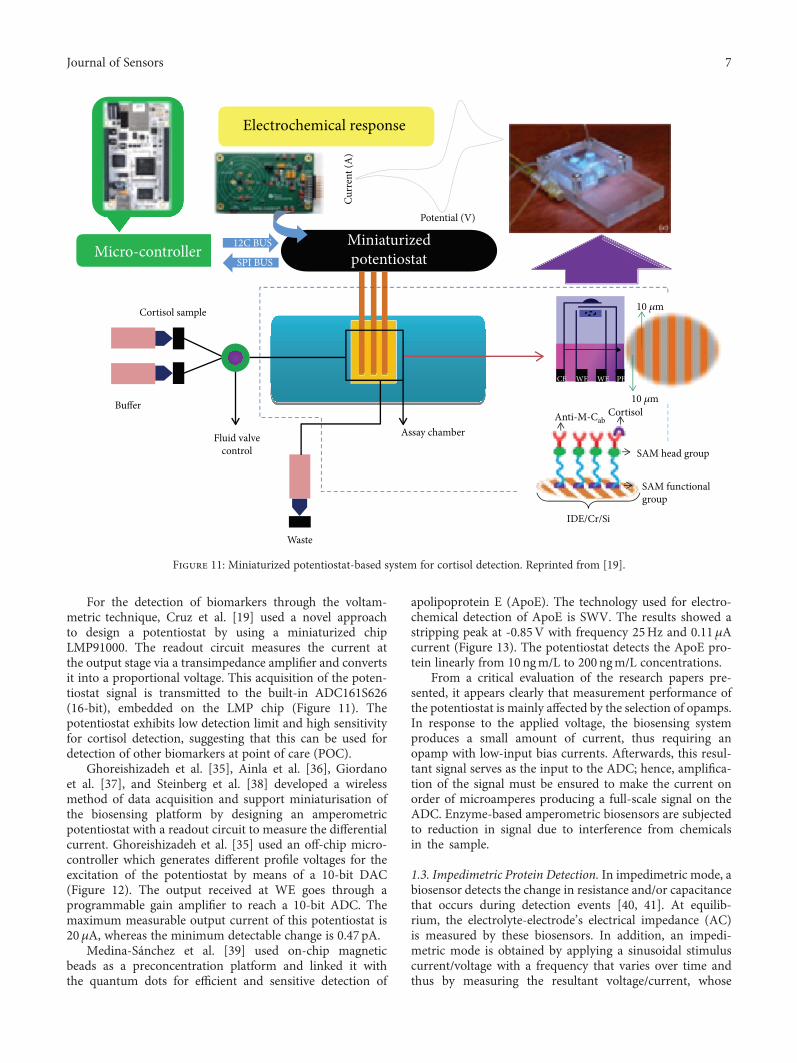
For the detection of biomarkers through the voltam-metric technique, Cruz et al. [19] used a novel approachto design a potentiostat by using a miniaturized chipLMP91000. The readout circuit measures the current atthe output stage via a transimpedance amplifier and convertsit into a proportional voltage. This acquisition of the poten-tiostat signal is transmitted to the built-in ADC161S626(16-bit), embedded on the LMP chip (Figure 11). Thepotentiostat exhibits low detection limit and high sensitivityfor cortisol detection, suggesting that this can be used fordetection of other biomarkers at point of care (POC).
Ghoreishizadeh et al. [35], Ainla et al. [36], Giordanoet al. [37], and Steinberg et al. [38] developed a wirelessmethod of data acquisition and support miniaturisation ofthe biosensing platform by designing an amperometricpotentiostat with a readout circuit to measure the differentialcurrent. Ghoreishizadeh et al. [35] used an off-chip micro-controller which generates different profile voltages for theexcitation of the potentiostat by means of a 10-bit DAC(Figure 12). The output received at WE goes through aprogrammable gain amplifier to reach a 10-bit ADC. Themaximum measurable output current of this potentiostat is20μA, whereas the minimum detectable change is 0.47 pA.
Medina-Sánchez et al. [39] used on-chip magneticbeads as a preconcentration platform and linked it withthe quantum dots for efficient and sensitive detection of
apolipoprotein E (ApoE). The technology used for electro-chemical detection of ApoE is SWV. The results showed astripping peak at -0.85V with frequency 25Hz and 0.11μAcurrent (Figure 13). The potentiostat detects the ApoE pro-tein linearly from 10ngm/L to 200ngm/L concentrations.
From a critical evaluation of the research papers pre-sented, it appears clearly that measurement performance ofthe potentiostat is mainly affected by the selection of opamps.In response to the applied voltage, the biosensing systemproduces a small amount of current, thus requiring anopamp with low-input bias currents. Afterwards, this resul-tant signal serves as the input to the ADC; hence, amplifica-tion of the signal must be ensured to make the current onorder of microamperes producing a full-scale signal on theADC. Enzyme-based amperometric biosensors are subjectedto reduction in signal due to interference from chemicalsin the sample.
1.3. Impedimetric Protein Detection. In impedimetric mode, abiosensor detects the change in resistance and/or capacitancethat occurs during detection events [40, 41]. At equilib-rium, the electrolyte-electrode’s electrical impedance (AC)is measured by these biosensors. In addition, an impedi-metric mode is obtained by applying a sinusoidal stimuluscurrent/voltage with a frequency that varies over time andthus by measuring the resultant voltage/current, whose
12C BUS
SPI BUS
Cortisol sample
Buffer
Fluid valvecontrol
Waste
Assay chamber
IDE/Cr/Si
Curr
ent (
A)
Potential (V)
CE WE WE PE
10 𝜇m
10 𝜇m
Anti-M-CabCortisol
SAM head group
SAM functionalgroup
Figure 11: Miniaturized potentiostat-based system for cortisol detection. Reprinted from [19].
7Journal of Sensors
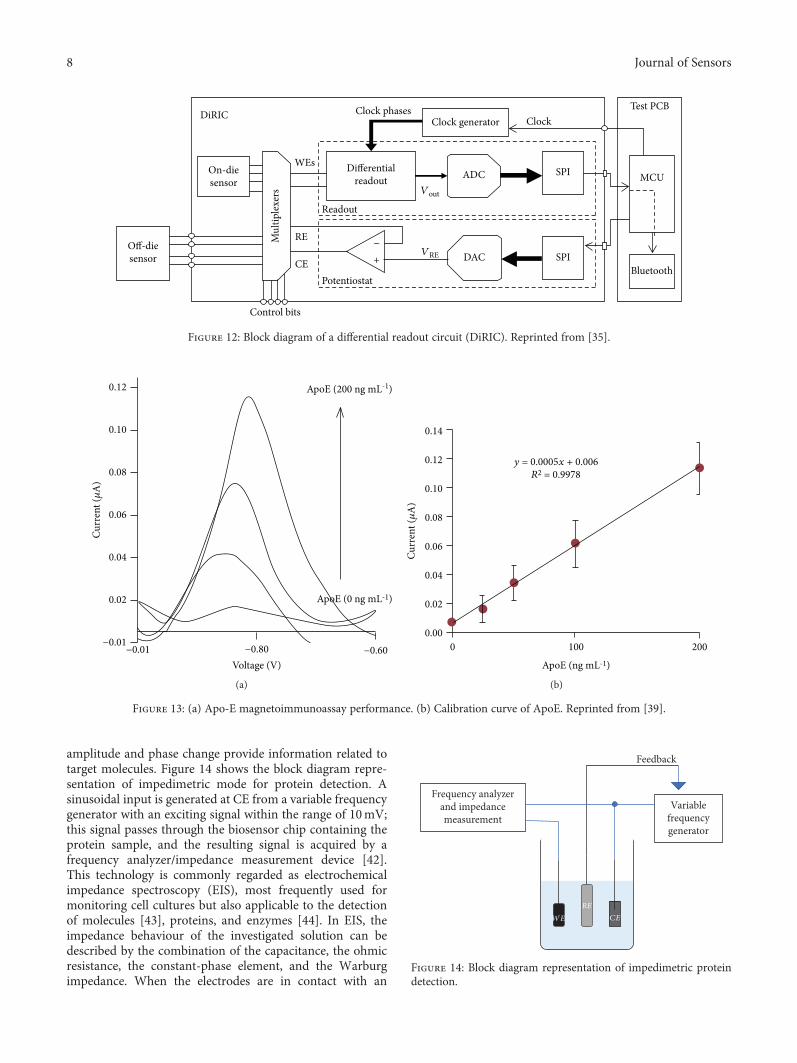
amplitude and phase change provide information related totarget molecules. Figure 14 shows the block diagram repre-sentation of impedimetric mode for protein detection. Asinusoidal input is generated at CE from a variable frequencygenerator with an exciting signal within the range of 10mV;this signal passes through the biosensor chip containing theprotein sample, and the resulting signal is acquired by afrequency analyzer/impedance measurement device [42].This technology is commonly regarded as electrochemicalimpedance spectroscopy (EIS), most frequently used formonitoring cell cultures but also applicable to the detectionof molecules [43], proteins, and enzymes [44]. In EIS, theimpedance behaviour of the investigated solution can bedescribed by the combination of the capacitance, the ohmicresistance, the constant-phase element, and the Warburgimpedance. When the electrodes are in contact with an
Curr
ent (𝜇
A)
0.12
0.10
0.08
0.06
0.04
0.02
−0.01−0.01 −0.80
Voltage (V)
ApoE (200 ng mL-1)
ApoE (0 ng mL-1)
−0.60
(a)
0.14
y = 0.0005x + 0.006R2 = 0.9978
0.12
0.10
0.08
Curr
ent (𝜇
A)
0.06
0.04
0.02
0.000 100
ApoE (ng mL-1)
200
(b)
Figure 13: (a) Apo-E magnetoimmunoassay performance. (b) Calibration curve of ApoE. Reprinted from [39].
WE
RE
CE
Variablefrequencygenerator
Frequency analyzerand impedancemeasurement
Feedback
Figure 14: Block diagram representation of impedimetric proteindetection.
DiRIC Clock phases
Differentialreadout
Clock generatorTest PCB
Clock
SPI
SPI
MCUADC
DAC
Vout
VRE
RE
WEs
CE
Readout
−+
Potentiostat
Control bits
Mul
tiple
xers
Off-diesensor
On-diesensor
Bluetooth
Figure 12: Block diagram of a differential readout circuit (DiRIC). Reprinted from [35].
8 Journal of Sensors
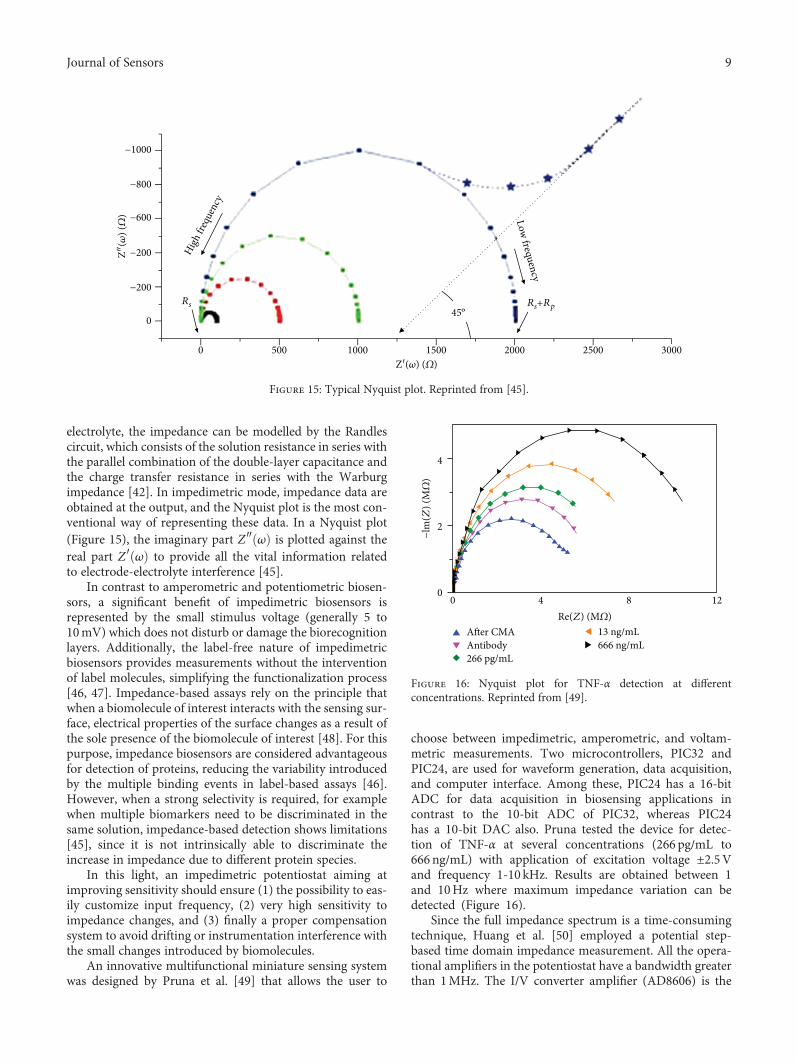
electrolyte, the impedance can be modelled by the Randlescircuit, which consists of the solution resistance in series withthe parallel combination of the double-layer capacitance andthe charge transfer resistance in series with the Warburgimpedance [42]. In impedimetric mode, impedance data areobtained at the output, and the Nyquist plot is the most con-ventional way of representing these data. In a Nyquist plot(Figure 15), the imaginary part Z″ ω is plotted against thereal part Z′ ω to provide all the vital information relatedto electrode-electrolyte interference [45].
In contrast to amperometric and potentiometric biosen-sors, a significant benefit of impedimetric biosensors isrepresented by the small stimulus voltage (generally 5 to10mV) which does not disturb or damage the biorecognitionlayers. Additionally, the label-free nature of impedimetricbiosensors provides measurements without the interventionof label molecules, simplifying the functionalization process[46, 47]. Impedance-based assays rely on the principle thatwhen a biomolecule of interest interacts with the sensing sur-face, electrical properties of the surface changes as a result ofthe sole presence of the biomolecule of interest [48]. For thispurpose, impedance biosensors are considered advantageousfor detection of proteins, reducing the variability introducedby the multiple binding events in label-based assays [46].However, when a strong selectivity is required, for examplewhen multiple biomarkers need to be discriminated in thesame solution, impedance-based detection shows limitations[45], since it is not intrinsically able to discriminate theincrease in impedance due to different protein species.
In this light, an impedimetric potentiostat aiming atimproving sensitivity should ensure (1) the possibility to eas-ily customize input frequency, (2) very high sensitivity toimpedance changes, and (3) finally a proper compensationsystem to avoid drifting or instrumentation interference withthe small changes introduced by biomolecules.
An innovative multifunctional miniature sensing systemwas designed by Pruna et al. [49] that allows the user to
choose between impedimetric, amperometric, and voltam-metric measurements. Two microcontrollers, PIC32 andPIC24, are used for waveform generation, data acquisition,and computer interface. Among these, PIC24 has a 16-bitADC for data acquisition in biosensing applications incontrast to the 10-bit ADC of PIC32, whereas PIC24has a 10-bit DAC also. Pruna tested the device for detec-tion of TNF-α at several concentrations (266 pg/mL to666 ng/mL) with application of excitation voltage ±2.5Vand frequency 1-10 kHz. Results are obtained between 1and 10Hz where maximum impedance variation can bedetected (Figure 16).
Since the full impedance spectrum is a time-consumingtechnique, Huang et al. [50] employed a potential step-based time domain impedance measurement. All the opera-tional amplifiers in the potentiostat have a bandwidth greaterthan 1MHz. The I/V converter amplifier (AD8606) is the
0
High fr
eque
ncy
Low frequency
500
0
−200
−200
−600
Z″(𝜔
) (𝛺
)
Z′(𝜔) (𝛺)
−800
−1000
1000 1500 2000 2500 3000
Rs45º
Rs+Rp
Figure 15: Typical Nyquist plot. Reprinted from [45].
4
2
00 4 8
Re(Z) (M𝛺)
−lm
(Z) (
M𝛺
)
12
After CMAAntibody266 pg/mL
13 ng/mL666 ng/mL
Figure 16: Nyquist plot for TNF-α detection at differentconcentrations. Reprinted from [49].
9Journal of Sensors
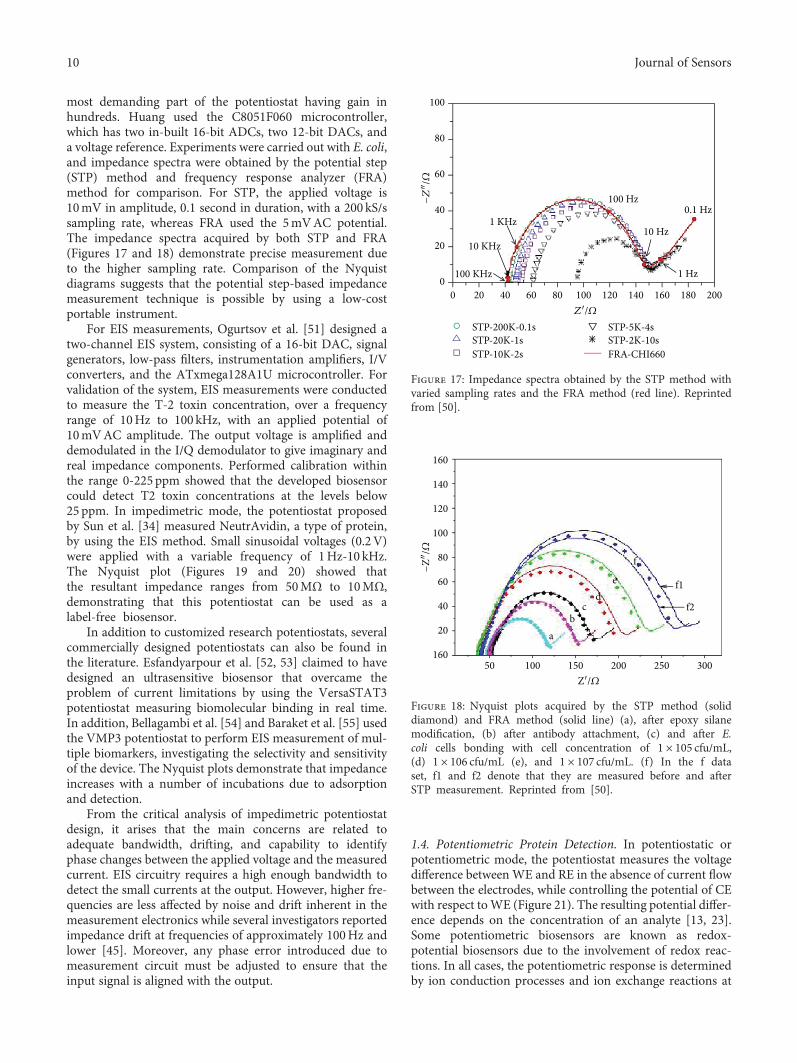
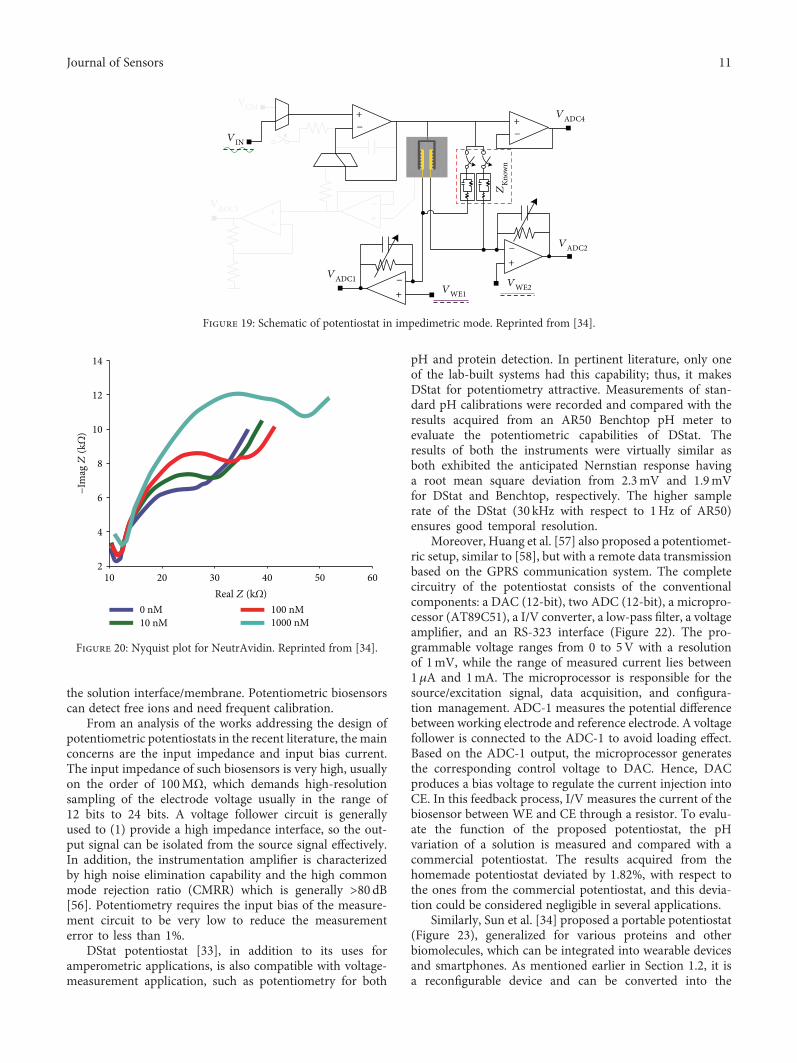
most demanding part of the potentiostat having gain inhundreds. Huang used the C8051F060 microcontroller,which has two in-built 16-bit ADCs, two 12-bit DACs, anda voltage reference. Experiments were carried out with E. coli,and impedance spectra were obtained by the potential step(STP) method and frequency response analyzer (FRA)method for comparison. For STP, the applied voltage is10mV in amplitude, 0.1 second in duration, with a 200 kS/ssampling rate, whereas FRA used the 5mVAC potential.The impedance spectra acquired by both STP and FRA(Figures 17 and 18) demonstrate precise measurement dueto the higher sampling rate. Comparison of the Nyquistdiagrams suggests that the potential step-based impedancemeasurement technique is possible by using a low-costportable instrument.
For EIS measurements, Ogurtsov et al. [51] designed atwo-channel EIS system, consisting of a 16-bit DAC, signalgenerators, low-pass filters, instrumentation amplifiers, I/Vconverters, and the ATxmega128A1U microcontroller. Forvalidation of the system, EIS measurements were conductedto measure the T-2 toxin concentration, over a frequencyrange of 10Hz to 100 kHz, with an applied potential of10mVAC amplitude. The output voltage is amplified anddemodulated in the I/Q demodulator to give imaginary andreal impedance components. Performed calibration withinthe range 0-225 ppm showed that the developed biosensorcould detect T2 toxin concentrations at the levels below25 ppm. In impedimetric mode, the potentiostat proposedby Sun et al. [34] measured NeutrAvidin, a type of protein,by using the EIS method. Small sinusoidal voltages (0.2V)were applied with a variable frequency of 1Hz-10 kHz.The Nyquist plot (Figures 19 and 20) showed thatthe resultant impedance ranges from 50MΩ to 10MΩ,demonstrating that this potentiostat can be used as alabel-free biosensor.
In addition to customized research potentiostats, severalcommercially designed potentiostats can also be found inthe literature. Esfandyarpour et al. [52, 53] claimed to havedesigned an ultrasensitive biosensor that overcame theproblem of current limitations by using the VersaSTAT3potentiostat measuring biomolecular binding in real time.In addition, Bellagambi et al. [54] and Baraket et al. [55] usedthe VMP3 potentiostat to perform EIS measurement of mul-tiple biomarkers, investigating the selectivity and sensitivityof the device. The Nyquist plots demonstrate that impedanceincreases with a number of incubations due to adsorptionand detection.
From the critical analysis of impedimetric potentiostatdesign, it arises that the main concerns are related toadequate bandwidth, drifting, and capability to identifyphase changes between the applied voltage and the measuredcurrent. EIS circuitry requires a high enough bandwidth todetect the small currents at the output. However, higher fre-quencies are less affected by noise and drift inherent in themeasurement electronics while several investigators reportedimpedance drift at frequencies of approximately 100Hz andlower [45]. Moreover, any phase error introduced due tomeasurement circuit must be adjusted to ensure that theinput signal is aligned with the output.
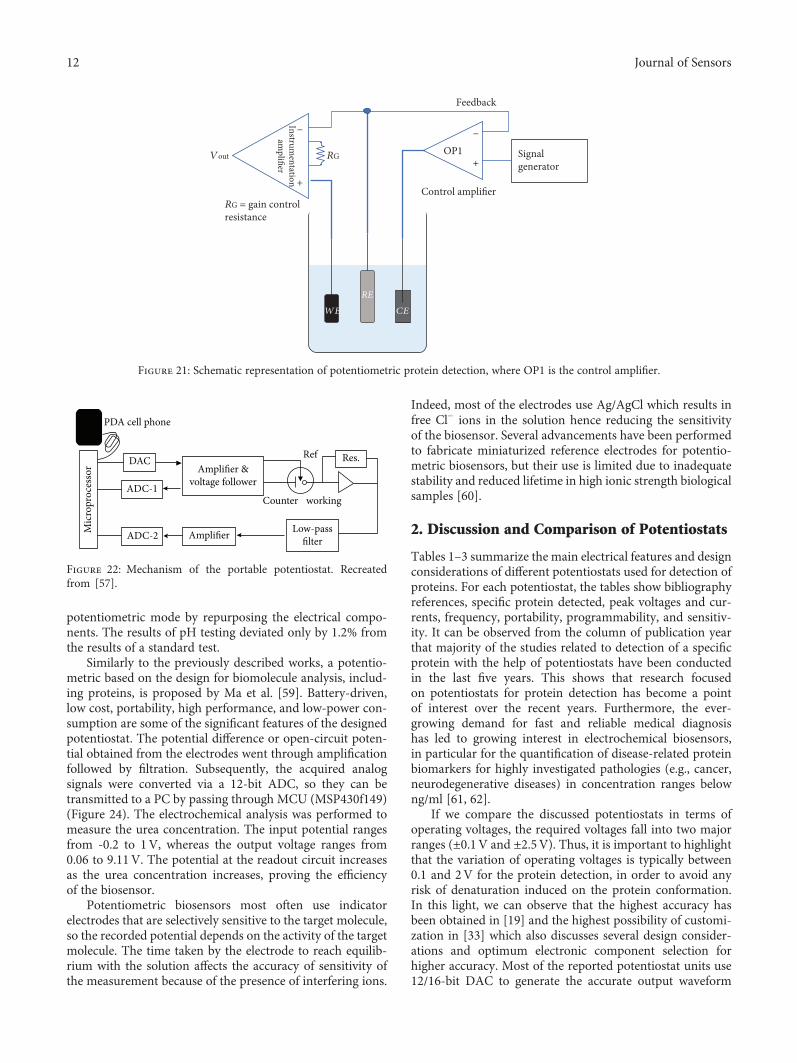
1.4. Potentiometric Protein Detection. In potentiostatic orpotentiometric mode, the potentiostat measures the voltagedifference betweenWE and RE in the absence of current flowbetween the electrodes, while controlling the potential of CEwith respect toWE (Figure 21). The resulting potential differ-ence depends on the concentration of an analyte [13, 23].Some potentiometric biosensors are known as redox-potential biosensors due to the involvement of redox reac-tions. In all cases, the potentiometric response is determinedby ion conduction processes and ion exchange reactions at
STP-200K-0.1sSTP-20K-1sSTP-10K-2s
STP-5K-4sSTP-2K-10sFRA-CHI660
1 KHz
100
80
60
−Z″/𝛺
Z′/𝛺
40
20
00 20 40 60 80 100 120 140 160 180 200
10 KHz
100 KHz
100 Hz0.1 Hz
10 Hz
1 Hz
Figure 17: Impedance spectra obtained by the STP method withvaried sampling rates and the FRA method (red line). Reprintedfrom [50].
f1
f
ed
cb
a
f2
Z′/𝛺
−Z″/𝛺
160
140
120
100
80
60
40
20
16050 100 150 200 250 300
Figure 18: Nyquist plots acquired by the STP method (soliddiamond) and FRA method (solid line) (a), after epoxy silanemodification, (b) after antibody attachment, (c) and after E.coli cells bonding with cell concentration of 1 × 10⁵ cfu/mL,(d) 1 × 10⁶ cfu/mL (e), and 1 × 10⁷ cfu/mL. (f) In the f dataset, f1 and f2 denote that they are measured before and afterSTP measurement. Reprinted from [50].
10 Journal of Sensors
the solution interface/membrane. Potentiometric biosensorscan detect free ions and need frequent calibration.
From an analysis of the works addressing the design ofpotentiometric potentiostats in the recent literature, the mainconcerns are the input impedance and input bias current.The input impedance of such biosensors is very high, usuallyon the order of 100MΩ, which demands high-resolutionsampling of the electrode voltage usually in the range of12 bits to 24 bits. A voltage follower circuit is generallyused to (1) provide a high impedance interface, so the out-put signal can be isolated from the source signal effectively.In addition, the instrumentation amplifier is characterizedby high noise elimination capability and the high commonmode rejection ratio (CMRR) which is generally >80 dB[56]. Potentiometry requires the input bias of the measure-ment circuit to be very low to reduce the measurementerror to less than 1%.
DStat potentiostat [33], in addition to its uses foramperometric applications, is also compatible with voltage-measurement application, such as potentiometry for both
pH and protein detection. In pertinent literature, only oneof the lab-built systems had this capability; thus, it makesDStat for potentiometry attractive. Measurements of stan-dard pH calibrations were recorded and compared with theresults acquired from an AR50 Benchtop pH meter toevaluate the potentiometric capabilities of DStat. Theresults of both the instruments were virtually similar asboth exhibited the anticipated Nernstian response havinga root mean square deviation from 2.3mV and 1.9mVfor DStat and Benchtop, respectively. The higher samplerate of the DStat (30 kHz with respect to 1Hz of AR50)ensures good temporal resolution.
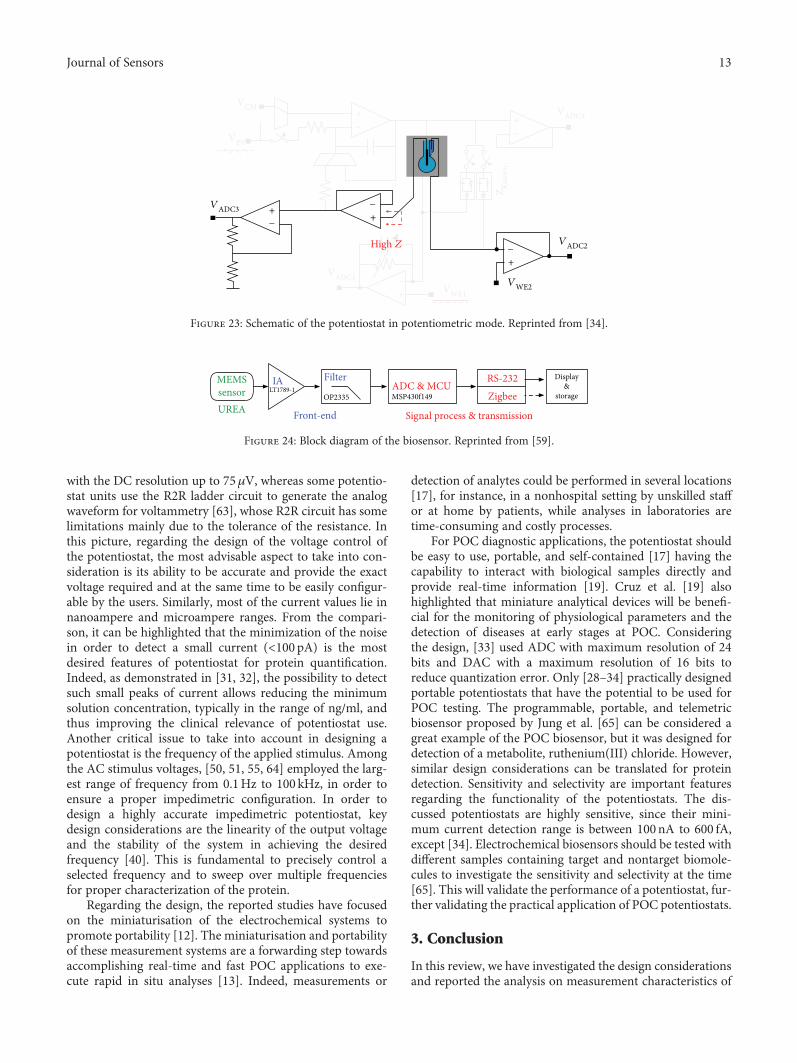
Moreover, Huang et al. [57] also proposed a potentiomet-ric setup, similar to [58], but with a remote data transmissionbased on the GPRS communication system. The completecircuitry of the potentiostat consists of the conventionalcomponents: a DAC (12-bit), two ADC (12-bit), a micropro-cessor (AT89C51), a I/V converter, a low-pass filter, a voltageamplifier, and an RS-323 interface (Figure 22). The pro-grammable voltage ranges from 0 to 5V with a resolutionof 1mV, while the range of measured current lies between1μA and 1mA. The microprocessor is responsible for thesource/excitation signal, data acquisition, and configura-tion management. ADC-1 measures the potential differencebetween working electrode and reference electrode. A voltagefollower is connected to the ADC-1 to avoid loading effect.Based on the ADC-1 output, the microprocessor generatesthe corresponding control voltage to DAC. Hence, DACproduces a bias voltage to regulate the current injection intoCE. In this feedback process, I/V measures the current of thebiosensor between WE and CE through a resistor. To evalu-ate the function of the proposed potentiostat, the pHvariation of a solution is measured and compared with acommercial potentiostat. The results acquired from thehomemade potentiostat deviated by 1.82%, with respect tothe ones from the commercial potentiostat, and this devia-tion could be considered negligible in several applications.
Similarly, Sun et al. [34] proposed a portable potentiostat(Figure 23), generalized for various proteins and otherbiomolecules, which can be integrated into wearable devicesand smartphones. As mentioned earlier in Section 1.2, it isa reconfigurable device and can be converted into the
VCMVADC4
VADC1
VADC3
VADC2
VWE2VWE1
+− +
−
+− +
−
+−
+−
VIN
ZKn
own
Figure 19: Schematic of potentiostat in impedimetric mode. Reprinted from [34].
102
4
6
8
10
−Im
ag Z
(k𝛺
)
Real Z (k𝛺)
12
14
20 30 40 50 60
0 nM10 nM
100 nM1000 nM
Figure 20: Nyquist plot for NeutrAvidin. Reprinted from [34].
11Journal of Sensors
potentiometric mode by repurposing the electrical compo-nents. The results of pH testing deviated only by 1.2% fromthe results of a standard test.
Similarly to the previously described works, a potentio-metric based on the design for biomolecule analysis, includ-ing proteins, is proposed by Ma et al. [59]. Battery-driven,low cost, portability, high performance, and low-power con-sumption are some of the significant features of the designedpotentiostat. The potential difference or open-circuit poten-tial obtained from the electrodes went through amplificationfollowed by filtration. Subsequently, the acquired analogsignals were converted via a 12-bit ADC, so they can betransmitted to a PC by passing through MCU (MSP430f149)(Figure 24). The electrochemical analysis was performed tomeasure the urea concentration. The input potential rangesfrom -0.2 to 1V, whereas the output voltage ranges from0.06 to 9.11V. The potential at the readout circuit increasesas the urea concentration increases, proving the efficiencyof the biosensor.
Potentiometric biosensors most often use indicatorelectrodes that are selectively sensitive to the target molecule,so the recorded potential depends on the activity of the targetmolecule. The time taken by the electrode to reach equilib-rium with the solution affects the accuracy of sensitivity ofthe measurement because of the presence of interfering ions.
Indeed, most of the electrodes use Ag/AgCl which results infree Cl− ions in the solution hence reducing the sensitivityof the biosensor. Several advancements have been performedto fabricate miniaturized reference electrodes for potentio-metric biosensors, but their use is limited due to inadequatestability and reduced lifetime in high ionic strength biologicalsamples [60].
2. Discussion and Comparison of Potentiostats
Tables 1–3 summarize the main electrical features and designconsiderations of different potentiostats used for detection ofproteins. For each potentiostat, the tables show bibliographyreferences, specific protein detected, peak voltages and cur-rents, frequency, portability, programmability, and sensitiv-ity. It can be observed from the column of publication yearthat majority of the studies related to detection of a specificprotein with the help of potentiostats have been conductedin the last five years. This shows that research focusedon potentiostats for protein detection has become a pointof interest over the recent years. Furthermore, the ever-growing demand for fast and reliable medical diagnosishas led to growing interest in electrochemical biosensors,in particular for the quantification of disease-related proteinbiomarkers for highly investigated pathologies (e.g., cancer,neurodegenerative diseases) in concentration ranges belowng/ml [61, 62].
If we compare the discussed potentiostats in terms ofoperating voltages, the required voltages fall into two majorranges (±0.1V and ±2.5V). Thus, it is important to highlightthat the variation of operating voltages is typically between0.1 and 2V for the protein detection, in order to avoid anyrisk of denaturation induced on the protein conformation.In this light, we can observe that the highest accuracy hasbeen obtained in [19] and the highest possibility of customi-zation in [33] which also discusses several design consider-ations and optimum electronic component selection forhigher accuracy. Most of the reported potentiostat units use12/16-bit DAC to generate the accurate output waveform
WE
RE
CE
RG
RG = gain controlresistance
−
+
−
+Signalgenerator
Vout
Feedback
Control amplifier
OP1
Instrumentation
amplifier
Figure 21: Schematic representation of potentiometric protein detection, where OP1 is the control amplifier.
Mic
ropr
oces
sor
PDA cell phone
DAC
ADC-1
ADC-2 Amplifier
Amplifier &voltage follower
Low-passfilter
Ref
workingCounter
Res.
Figure 22: Mechanism of the portable potentiostat. Recreatedfrom [57].
12 Journal of Sensors
with the DC resolution up to 75μV, whereas some potentio-stat units use the R2R ladder circuit to generate the analogwaveform for voltammetry [63], whose R2R circuit has somelimitations mainly due to the tolerance of the resistance. Inthis picture, regarding the design of the voltage control ofthe potentiostat, the most advisable aspect to take into con-sideration is its ability to be accurate and provide the exactvoltage required and at the same time to be easily configur-able by the users. Similarly, most of the current values lie innanoampere and microampere ranges. From the compari-son, it can be highlighted that the minimization of the noisein order to detect a small current (<100 pA) is the mostdesired features of potentiostat for protein quantification.Indeed, as demonstrated in [31, 32], the possibility to detectsuch small peaks of current allows reducing the minimumsolution concentration, typically in the range of ng/ml, andthus improving the clinical relevance of potentiostat use.Another critical issue to take into account in designing apotentiostat is the frequency of the applied stimulus. Amongthe AC stimulus voltages, [50, 51, 55, 64] employed the larg-est range of frequency from 0.1Hz to 100 kHz, in order toensure a proper impedimetric configuration. In order todesign a highly accurate impedimetric potentiostat, keydesign considerations are the linearity of the output voltageand the stability of the system in achieving the desiredfrequency [40]. This is fundamental to precisely control aselected frequency and to sweep over multiple frequenciesfor proper characterization of the protein.
Regarding the design, the reported studies have focusedon the miniaturisation of the electrochemical systems topromote portability [12]. The miniaturisation and portabilityof these measurement systems are a forwarding step towardsaccomplishing real-time and fast POC applications to exe-cute rapid in situ analyses [13]. Indeed, measurements or
detection of analytes could be performed in several locations[17], for instance, in a nonhospital setting by unskilled staffor at home by patients, while analyses in laboratories aretime-consuming and costly processes.
For POC diagnostic applications, the potentiostat shouldbe easy to use, portable, and self-contained [17] having thecapability to interact with biological samples directly andprovide real-time information [19]. Cruz et al. [19] alsohighlighted that miniature analytical devices will be benefi-cial for the monitoring of physiological parameters and thedetection of diseases at early stages at POC. Consideringthe design, [33] used ADC with maximum resolution of 24bits and DAC with a maximum resolution of 16 bits toreduce quantization error. Only [28–34] practically designedportable potentiostats that have the potential to be used forPOC testing. The programmable, portable, and telemetricbiosensor proposed by Jung et al. [65] can be considered agreat example of the POC biosensor, but it was designed fordetection of a metabolite, ruthenium(III) chloride. However,similar design considerations can be translated for proteindetection. Sensitivity and selectivity are important featuresregarding the functionality of the potentiostats. The dis-cussed potentiostats are highly sensitive, since their mini-mum current detection range is between 100nA to 600 fA,except [34]. Electrochemical biosensors should be tested withdifferent samples containing target and nontarget biomole-cules to investigate the sensitivity and selectivity at the time[65]. This will validate the performance of a potentiostat, fur-ther validating the practical application of POC potentiostats.
3. Conclusion
In this review, we have investigated the design considerationsand reported the analysis on measurement characteristics of
VCM
VADC1VWE1
VWE2
High Z
VADC3
VADC2
VADC4
Z Know
n
VIN
+−
+−
+−
+−
+−
+−
Figure 23: Schematic of the potentiostat in potentiometric mode. Reprinted from [34].
Display&
storage
RS-232ADC & MCU
Filter
Front-endUREA
MEMSsensor
IAMSP430f149OP2335
LT1789-1Zigbee
Signal process & transmission
Figure 24: Block diagram of the biosensor. Reprinted from [59].
13Journal of Sensors
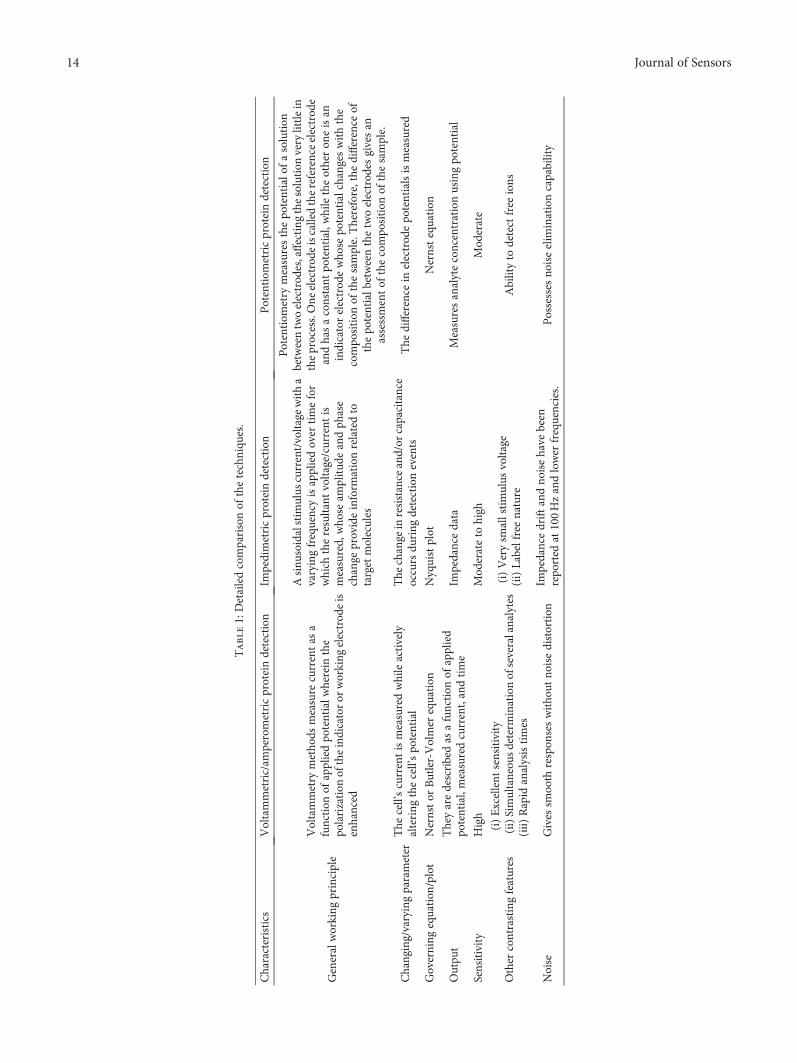
Table1:Detailedcomparisonof
thetechniqu
es.
Characteristics
Voltammetric/am
perometricproteindetection
Impedimetricproteindetection
Potentiom
etricproteindetection
Generalworking
principle
Voltammetry
metho
dsmeasure
currentas
afunction
ofappliedpo
tentialw
herein
the
polarization
oftheindicatoror
working
electrod
eis
enhanced
Asinu
soidalstim
ulus
current/voltage
witha
varyingfrequencyisappliedover
timefor
which
theresultant
voltage/current
ismeasured,
who
seam
plitud
eandph
ase
change
provideinform
ationrelatedto
targetmolecules
Potentiom
etry
measuresthepo
tentialo
fasolution
betweentwoelectrod
es,affecting
thesolution
very
littlein
theprocess.One
electrod
eiscalledthereferenceelectrod
eandhasaconstant
potential,whiletheotheron
eisan
indicatorelectrod
ewho
sepo
tentialchanges
withthe
compo
sition
ofthesample.Therefore,the
difference
ofthepo
tentialb
etweenthetwoelectrod
esgivesan
assessmentof
thecompo
sition
ofthesample.
Changing/varyingparameter
The
cell’scurrentismeasuredwhileactively
altering
thecell’spo
tential
The
change
inresistance
and/or
capacitance
occurs
during
detectionevents
The
difference
inelectrod
epo
tentialsismeasured
Governing
equation
/plot
Nernstor
Butler-Volmer
equation
Nyquistplot
Nernstequation
Outpu
tTheyaredescribedas
afunction
ofapplied
potential,measuredcurrent,andtime
Impedancedata
Measuresanalyteconcentrationusingpo
tential
Sensitivity
High
Mod
erateto
high
Mod
erate
Other
contrastingfeatures
(i)Excellent
sensitivity
(ii)Simultaneou
sdeterm
inationofseveralanalytes
(iii)
Rapid
analysistimes
(i)Verysm
allstimulus
voltage
(ii)Labelfreenature
Abilityto
detectfree
ions
Noise
Gives
smooth
respon
seswitho
utno
isedistortion
Impedancedrift
andno
isehave
been
repo
rted
at100Hzandlower
frequencies.
Possesses
noiseelim
inationcapability
14 Journal of Sensors
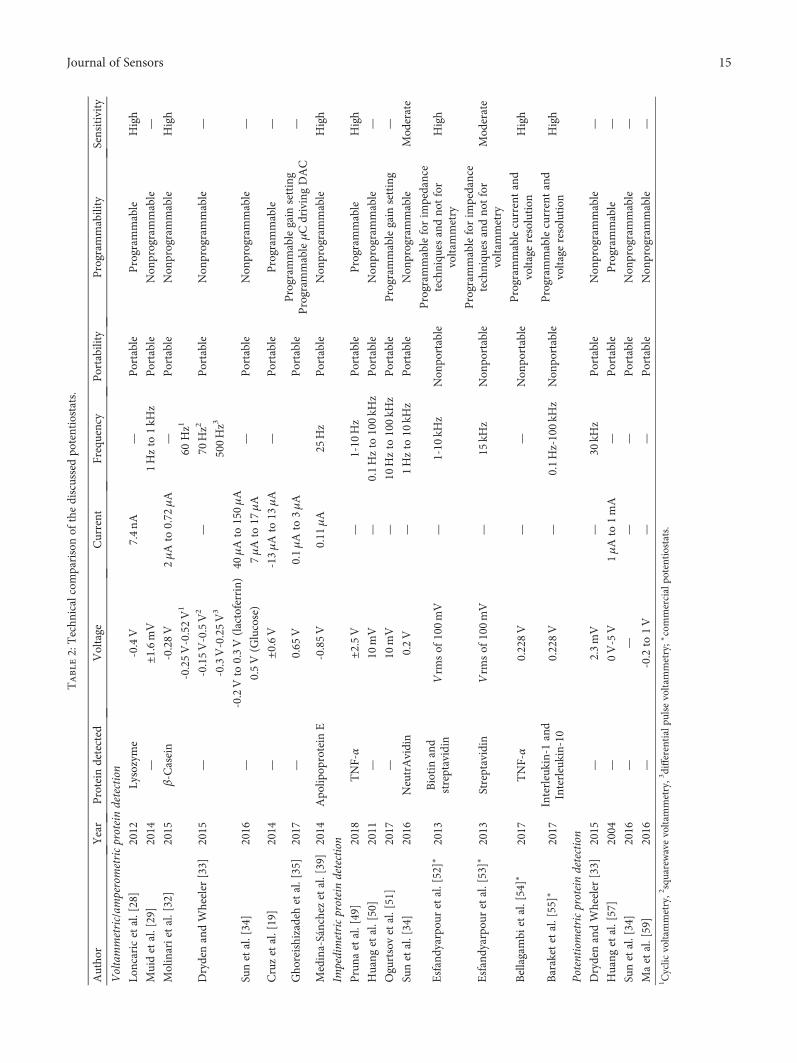
Table2:Techn
icalcomparisonof
thediscussedpo
tentiostats.
Autho
rYear
Protein
detected
Voltage
Current
Frequency
Portability
Program
mability
Sensitivity
Voltammetric/am
perometricproteindetection
Loncaricetal.[28]
2012
Lysozyme
-0.4V
7.4nA
—Portable
Program
mable
High
Muidetal.[29]
2014
—±1
.6mV
1Hzto
1kH
zPortable
Non
programmable
—
Molinarietal.[32]
2015
β-C
asein
-0.28V
2μAto
0.72
μA
—Portable
Non
programmable
High
DrydenandWheeler
[33]
2015
—
-0.25V-0.52V1
—
60Hz1
Portable
Non
programmable
—-0.15V-0.5V2
70Hz2
-0.3V-0.25V3
500Hz3
Sunetal.[34]
2016
—-0.2Vto
0.3V(lactoferrin)
40μAto
150μA
—Portable
Non
programmable
—0.5V(G
lucose)
7μAto
17μA
Cruzetal.[19]
2014
—±0
.6V
-13μAto
13μA
—Portable
Program
mable
—
Gho
reishizadehetal.[35]
2017
—0.65
V0.1μAto
3μA
Portable
Program
mablegain
setting
Program
mableμCdrivingDAC
—
Medina-Sánchezetal.[39]
2014
Apo
lipop
rotein
E-0.85V
0.11
μA
25Hz
Portable
Non
programmable
High
Impedimetricproteindetection
Pruna
etal.[49]
2018
TNF-α
±2.5V
—1-10
Hz
Portable
Program
mable
High
Huang
etal.[50]
2011
—10
mV
—0.1Hzto
100kH
zPortable
Non
programmable
—
Ogurtsovetal.[51]
2017
—10
mV
—10
Hzto
100kH
zPortable
Program
mablegain
setting
—
Sunetal.[34]
2016
NeutrAvidin
0.2V
—1Hzto
10kH
zPortable
Non
programmable
Mod
erate
Esfandyarpo
uretal.[52]∗
2013
Biotinand
streptavidin
Vrm
sof100mV
—1-10
kHz
Non
portable
Program
mableforim
pedance
techniqu
esandno
tfor
voltam
metry
High
Esfandyarpo
uretal.[53]∗
2013
Streptavidin
Vrm
sof100mV
—15
kHz
Non
portable
Program
mableforim
pedance
techniqu
esandno
tfor
voltam
metry
Mod
erate
Bellagambi
etal.[54]∗
2017
TNF-α
0.228V
——
Non
portable
Program
mablecurrentand
voltageresolution
High
Baraketetal.[55]∗
2017
Interleukin-1and
Interleukin-10
0.228V
—0.1Hz-100kH
zNon
portable
Program
mablecurrentand
voltageresolution
High
Potentiometricproteindetection
DrydenandWheeler
[33]
2015
—2.3mV
—30
kHz
Portable
Non
programmable
—
Huang
etal.[57]
2004
—0V-5V
1μAto
1mA
—Portable
Program
mable
—
Sunetal.[34]
2016
——
——
Portable
Non
programmable
—
Maetal.[59]
2016
—-0.2to
1V
——
Portable
Non
programmable
—1 C
yclic
voltammetry,2squarewavevoltammetry,3differentialpu
lsevoltammetry;∗commercialpo
tentiostats.
15Journal of Sensors
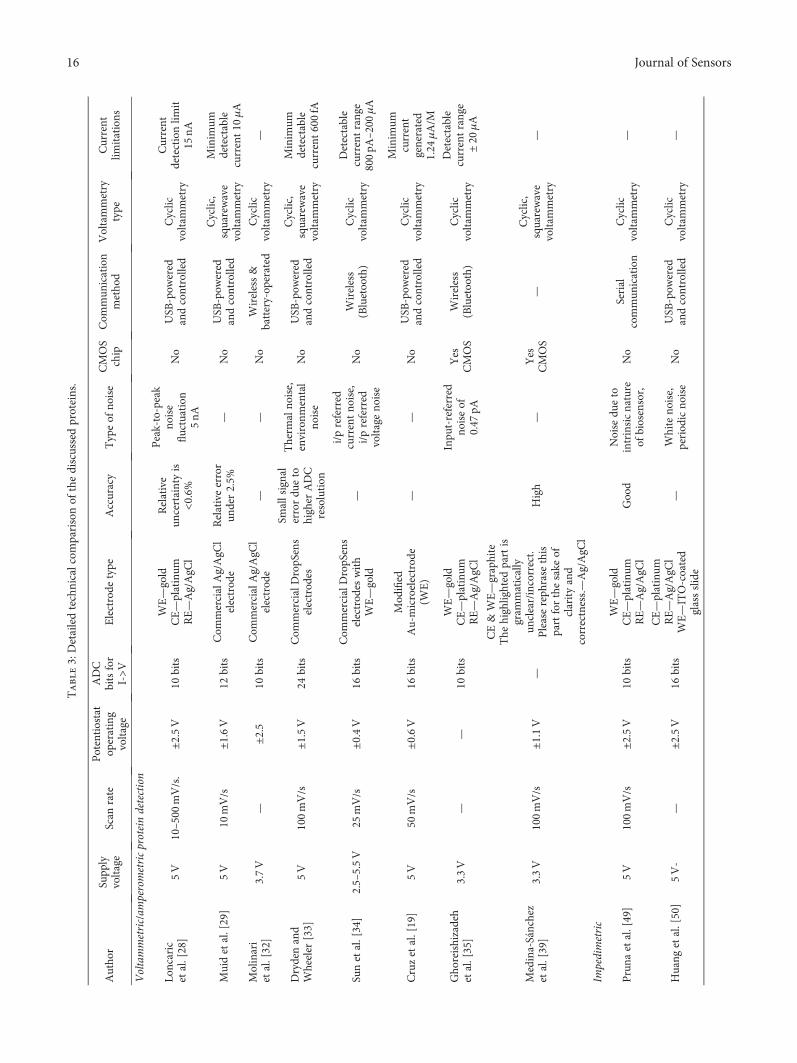
Table3:Detailedtechnicalcom
parisonof
thediscussedproteins.
Autho
rSupp
lyvoltage
Scan
rate
Potentiostat
operating
voltage
ADC
bitsfor
I->V
Electrode
type
Accuracy
Typeof
noise
CMOS
chip
Com
mun
ication
metho
dVoltammetry
type
Current
limitations
Voltammetric/am
perometricproteindetection
Loncaric
etal.[28]
5V
10–500
mV/s.
±2.5V
10bits
WE—gold
CE—platinum
RE—Ag/AgC
l
Relative
uncertaintyis
<0.6%
Peak-to-peak
noise
fluctuation
5nA
No
USB
-pow
ered
andcontrolled
Cyclic
voltam
metry
Current
detectionlim
it15
nA
Muidetal.[29]
5V
10mV/s
±1.6V
12bits
Com
mercialAg/AgC
lelectrod
eRelativeerror
under2.5%
—No
USB
-pow
ered
andcontrolled
Cyclic,
squarewave
voltam
metry
Minim
umdetectable
current10
μA
Molinari
etal.[32]
3.7V
—±2
.510
bits
Com
mercialAg/AgC
lelectrod
e—
—No
Wireless&
battery-op
erated
Cyclic
voltam
metry
—
Drydenand
Wheeler
[33]
5V
100mV/s
±1.5V
24bits
Com
mercialDropSens
electrod
es
Smallsignal
errordu
eto
higher
ADC
resolution
Therm
alno
ise,
environm
ental
noise
No
USB
-po w
ered
andcontrolled
Cyclic,
squarewave
voltam
metry
Minim
umdetectable
current600fA
Sunetal.[34]
2.5–5.5V
25mV/s
±0.4V
16bits
Com
mercialDropSens
electrod
eswith
WE—gold
—
i/preferred
currentno
ise,
i/preferred
voltage
noise
No
Wireless
(Bluetooth)
Cyclic
voltam
metry
Detectable
currentrange
800pA
–200
μA
Cruzetal.[19]
5V
50mV/s
±0.6V
16bits
Mod
ified
Au-microelectrod
e(W
E)
——
No
USB
-pow
ered
andcontrolled
Cyclic
voltam
metry
Minim
umcurrent
generated
1.24
μA/M
Gho
reishizadeh
etal.[35]
3.3V
——
10bits
WE—gold
CE—platinum
RE—Ag/AgC
l
Inpu
t-referred
noiseof
0.47
pA
Yes
CMOS
Wireless
(Bluetooth)
Cyclic
voltam
metry
Detectable
currentrange
±20
μA
Medina-Sánchez
etal.[39]
3.3V
100mV/s
±1.1V
—
CE&WE—graphite
The
highlighted
partis
gram
matically
unclear/incorrect.
Pleasereph
rase
this
partforthesake
ofclarityand
correctness.—Ag/AgC
l
High
—Yes
CMOS
—Cyclic,
squarewave
voltam
metry
—
Impedimetric
Pruna
etal.[49]
5V
100mV/s
±2.5V
10bits
WE—gold
CE—platinum
RE—Ag/AgC
lGoo
dNoise
dueto
intrinsicnature
ofbiosensor,
No
Serial
commun
ication
Cyclic
voltam
metry
—
Huang
etal.[50]
5V-
—±2
.5V
16bits
CE—platinum
RE—Ag/AgC
lWE—ITO-coated
glassslide
—Whiteno
ise,
period
icno
ise
No
USB
-pow
ered
andcontrolled
Cyclic
voltam
metry
—
16 Journal of Sensors
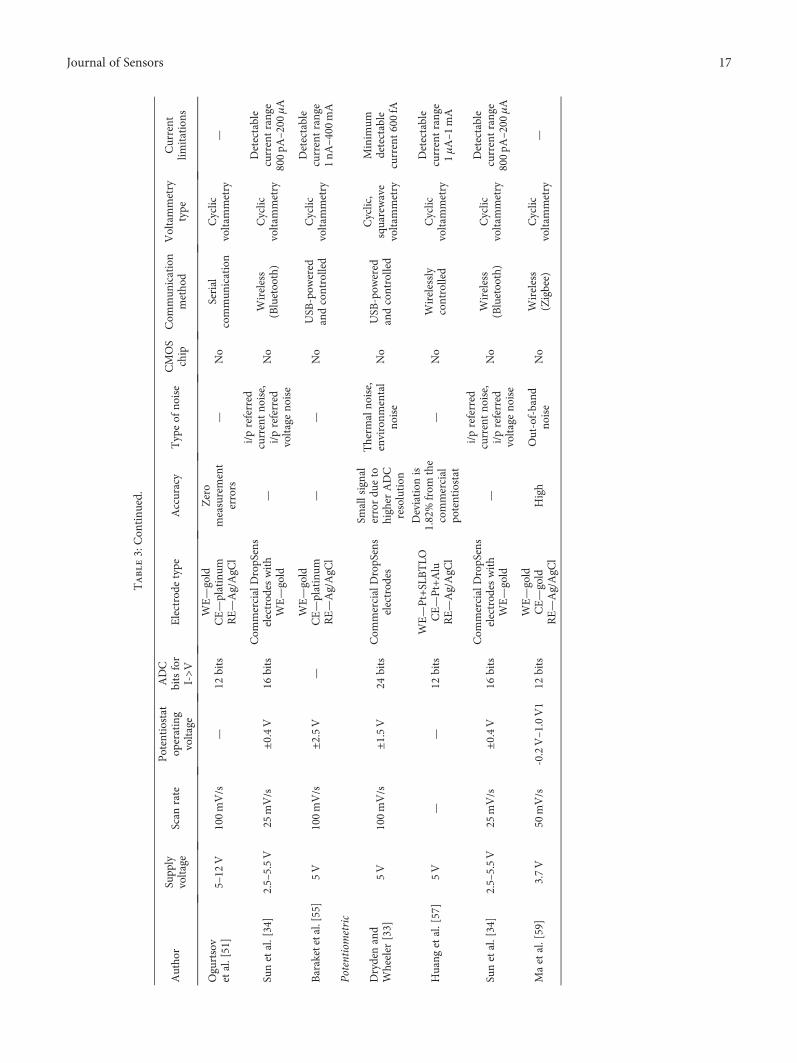
Table3:Con
tinu
ed.
Autho
rSupp
lyvoltage
Scan
rate
Potentiostat
operating
voltage
ADC
bitsfor
I->V
Electrode
type
Accuracy
Typeof
noise
CMOS
chip
Com
mun
ication
metho
dVoltammetry
type
Current
limitations
Ogurtsov
etal.[51]
5–12
V100mV/s
—12
bits
WE—gold
CE—platinum
RE—Ag/AgC
l
Zero
measurement
errors
—No
Serial
commun
ication
Cyclic
voltam
metry
—
Sunetal.[34]
2.5–5.5V
25mV/s
±0.4V
16bits
Com
mercialDropSens
electrod
eswith
WE—gold
—
i/preferred
currentno
ise,
i/preferred
voltage
noise
No
Wireless
(Bluetooth)
Cyclic
voltam
metry
Detectable
currentrange
800pA
–200
μA
Baraketetal.[55]
5V
100mV/s
±2.5V
—WE—gold
CE—platinum
RE—Ag/AgC
l—
—No
USB
-pow
ered
andcontrolled
Cyclic
voltam
metry
Detectable
currentrange
1nA
–400
mA
Potentiometric
Drydenand
Wheeler
[33]
5V
100mV/s
±1.5V
24bits
Com
mercialDropSens
electrod
es
Smallsignal
errordu
eto
higher
ADC
resolution
Therm
alno
ise,
environm
ental
noise
No
USB
-pow
ered
andcontrolled
Cyclic,
squarewave
voltam
metry
Minim
umdetectable
current600fA
Huang
etal.[57]
5V
——
12bits
WE—Pt+SLBTLO
CE—Pt+Alu
RE—Ag/AgC
l
Deviation
is1.82%from
the
commercial
potentiostat
—No
Wirelessly
controlled
Cyclic
voltam
metry
Detectable
currentrange
1μA–1
mA
Sunetal.[34]
2.5–5.5V
25mV/s
±0.4V
16bits
Com
mercialDropSens
electrod
eswith
WE—gold
—
i/preferred
currentno
ise,
i/preferred
voltage
noise
No
Wireless
(Bluetooth)
Cyclic
voltam
metry
Detectable
currentrange
800pA
–200
μA
Maetal.[59]
3.7V
50mV/s
-0.2V–1.0V1
12bits
WE—gold
CE—gold
RE—Ag/AgC
lHigh
Out-of-band
noise
No
Wireless
(Zigbee)
Cyclic
voltam
metry
—
17Journal of Sensors
potentiostats specifically used for protein biosensing. Despitethat biochemical and immune-assays are still considered thereliable gold standard for protein quantification, they showlimitations in terms of time, expertise required, cost, anddetection volumes. Therefore, there is an urgent need todevelop real-time, portable, highly sensitive, selective, minia-turized, multichannel, and easy-to-use diagnostic tools forearly detection of diseases. This review classified the poten-tiostats into three major categories (potentiometric, impedi-metric, and voltammetric) based on the operations andreported their measurement characteristics. Tables 2 and 3demonstrate how a proper potentiostat for protein character-ization should be selected based on the supply voltagetypically in the range of mV to few V; also, there is a higherdemand of readability of current, typically within the rangeof some 100pA, which requires a higher ADC resolutionranging from 10 bits to 24 bits and a sensitivity of detectionwith variable scan rates ranging from 10mV/s to 1.2V/s.Overall, this review summarizes the design considerationsfor potentiostat and how the research is moving forwardin the direction of designing portable, programmable,highly sensitive, miniaturized, and real-time potentiostats,opening the possibility of POC testing without going tothe laboratory.
Conflicts of Interest
The authors declare that they have no conflicts of interest.
References
[1] P. Mehrotra, “Biosensors and their applications - a review,”Journal of Oral Biology and Craniofacial Research, vol. 6,no. 2, pp. 153–159, 2016.
[2] S. Choi, M. Goryll, L. Y. M. Sin, P. K. Wong, and J. Chae,“Microfluidic-based biosensors toward point-of-care detectionof nucleic acids and proteins,” Microfluidics and Nanofluidics,vol. 10, no. 2, pp. 231–247, 2011.
[3] D. De Venuto, M. D. Torre, C. Boero, S. Carrara, and G. DeMicheli, “A novel multi-working electrode potentiostat forelectrochemical detection of metabolites,” in 2010 IEEESensors, pp. 1572–1577, Kona, HI, USA, 2010.
[4] S. Vigneshvar, C. C. Sudhakumari, B. Senthilkumaran, andH. Prakash, “Recent advances in biosensor technology forpotential applications–an overview,” Frontiers in Bioengineer-ing and Biotechnology, vol. 4, p. 11, 2016.
[5] A. Prasad, K. Mahato, P. K. Maurya, and P. Chandra,“Biomaterials for biosensing applications,” Journal of Analyti-cal & Bioanalytical Techniques, vol. 7, no. 2, article e124, 2016.
[6] B. Cai, S. Wang, L. Huang, Y. Ning, Z. Zhang, and G.-J. Zhang,“Ultrasensitive label-free detection of PNA–DNA hybridiza-tion by reduced graphene oxide field-effect transistor biosen-sor,” ACS Nano, vol. 8, no. 3, pp. 2632–2638, 2014.
[7] M. M. Barsan, M. E. Ghica, and C. M. A. Brett, “Electrochem-ical sensors and biosensors based on redox polymer/carbonnanotube modified electrodes: a review,” Analytica ChimicaActa, vol. 881, pp. 1–23, 2015.
[8] H. Li, X. Liu, L. Li, X. Mu, R. Genov, and A. Mason, “CMOSelectrochemical instrumentation for biosensor microsystems:a review,” Sensors, vol. 17, no. 12, p. 74, 2017.
[9] A. Bewick and M. Fleischmann, “The design and perfor-mance of potentiostats,” Electrochimica Acta, vol. 8, no. 3,pp. 89–106, 1963.
[10] Y.-H. Sheu and C.-Y. Huang, “A portable potentiostat forelectrochemical sensors,” in 3rd Kuala Lumpur Interna-tional Conference on Biomedical Engineering 2006, vol. 15 ofIFMBE Proceedings, pp. 538–542, Kuala Lumpur, Malaysia,2006, Springer.
[11] E. S. Friedman, M. A. Rosenbaum, A. W. Lee, D. A. Lipson,B. R. Land, and L. T. Angenent, “A cost-effective and field-ready potentiostat that poises subsurface electrodes to monitorbacterial respiration,” Biosensors and Bioelectronics, vol. 32,no. 1, pp. 309–313, 2012.
[12] L. Oluwole, T. O. Adegoke, and O. O. Ajide, “Development ofa field-portable digital potentiostat,” International Journal ofScientific and Engineering Research, vol. 5, pp. 654–661, 2014.
[13] J. Colomer-Farrarons, P. L. Miribel-Català, A. I. Rodríguez-Villarreal, and J. Samitier, “Portable bio-devices: design ofelectrochemical instruments fromminiaturized to implantabledevices,” in New Perspectives in Biosensors Technology andApplications, pp. 373–400, InTech, 2011.
[14] C.-Y. Huang, “Design of a portable potentiostat with dual-microprocessors for electrochemical biosensors,” UniversalJournal of Electrical and Electronic Engineering, vol. 3, no. 6,pp. 159–164, 2015.
[15] D. Harvey, “Analytical Chemistry 2.0—an open-access digitaltextbook,” Analytical and Bioanalytical Chemistry, vol. 399,no. 1, pp. 149–152, 2011.
[16] Y. Wang, H. Xu, J. Zhang, and G. Li, “Electrochemical sensorsfor clinic analysis,” Sensors, vol. 8, no. 4, pp. 2043–2081, 2008.
[17] A. Nemiroski, D. C. Christodouleas, J. W. Hennek et al.,“Universal mobile electrochemical detector designed for usein resource-limited applications,” Proceedings of the NationalAcademy of Sciences, vol. 111, no. 33, pp. 11984–11989, 2014.
[18] C. D. García, K. Y. Chumbimuni-Torres, and E. Carrilho, Eds.,Capillary electrophoresis and microchip capillary electrophore-sis: principles, applications, and limitations, John Wiley &Sons, Inc., Hoboken, NJ, USA, 2013.
[19] A. F. D. Cruz, N. Norena, A. Kaushik, and S. Bhansali,“A low-cost miniaturized potentiostat for point-of-carediagnosis,” Biosensors and Bioelectronics, vol. 62, pp. 249–254, 2014.
[20] N. Chaffey, “Alberts, B., Johnson, A., Lewis, J., Raff, M.,Roberts, K. and Walter, P. Molecular biology of the cell. 4thedn,” Annals of Botany, vol. 91, no. 3, pp. 401–401, 2003.
[21] M. W. Gonzalez and M. G. Kann, “Chapter 4: protein interac-tions and disease,” PLoS Computational Biology, vol. 8, no. 12,article e1002819, 2012.
[22] J. Wang, Analytical electrochemistry, Wiley-VCH, 2006.
[23] P. Bembnowicz, G.-Z. Yang, S. Anastasova, A.-M. Spehar-Deleze, and P. Vadgama, “Wearable electronic sensor forpotentiometric and amperometric measurements,” in 2013IEEE International Conference on Body Sensor Networks,pp. 1–5, Cambridge, MA, USA, 2013.
[24] J. Punter, J. Colomer-Farrarons, and P. L. Miribel, “Bioelec-tronics for amperometric biosensors,” in State of the Art inBiosensors-General Aspects, pp. 241–274, InTech, 2013.
[25] M. Li, Y.-T. Li, D.-W. Li, and Y.-T. Long, “Recent develop-ments and applications of screen-printed electrodes inenvironmental assays—a review,” Analytica Chimica Acta,vol. 734, pp. 31–44, 2012.
18 Journal of Sensors
[26] N. Elgrishi, K. J. Rountree, B. D. McCarthy, E. S. Rountree,T. T. Eisenhart, and J. L. Dempsey, “A practical beginner’sguide to cyclic voltammetry,” Journal of Chemical Education,vol. 95, no. 2, pp. 197–206, 2017.
[27] A. J. Bard and L. R. Faulkner, Electrochemical Methods :Fundamentals and Applications, Wiley, 2001.
[28] C. Loncaric, Y. Tang, C. Ho, M. A. Parameswaran, and H. Z.Yu, “A USB-based electrochemical biosensor prototype forpoint-of-care diagnosis,” Sensors and Actuators B: Chemical,vol. 161, no. 1, pp. 908–913, 2012.
[29] A. Muid, M. Djamal, and R. Wirawan, “Development of alow cost potentiostat using ATXMEGA32,” AIP ConferenceProceedings, vol. 1589, pp. 124–128, 2012.
[30] K. Kellner, T. Posnicek, J. Ettenauer, K. Zuser, and M. Brandl,“A new, low-cost potentiostat for environmental measure-ments with an easy-to-use PC interface,” Procedia Engineering,vol. 120, pp. 956–960, 2015.
[31] S. Kwakye and A. Baeumner, “An embedded system forportable electrochemical detection,” Sensors and Actuators B:Chemical, vol. 123, no. 1, pp. 336–343, 2007.
[32] J. Molinari, C. Moina, and G. Ybarra, “Electrochemicalimmunosensor for the determination of β-casein,” Journalof Electrochemical Science and Engineering, vol. 5, no. 1,pp. 9–16, 2015.
[33] M. D. M. Dryden and A. R. Wheeler, “DStat: a versatile,open-source potentiostat for electroanalysis and integration,”PLoS One, vol. 10, no. 10, article e0140349, 2015.
[34] A. Sun, A. G. Venkatesh, and D. A. Hall, “A multi-techniquereconfigurable electrochemical biosensor: enabling personalhealth monitoring in mobile devices,” IEEE Transactions onBiomedical Circuits and Systems, vol. 10, no. 5, pp. 945–954, 2016.
[35] S. S. Ghoreishizadeh, I. Taurino, G. DeMicheli, S. Carrara, andP. Georgiou, “A differential electrochemical readout ASIC withheterogeneous integration of bio-nano sensors for ampero-metric sensing,” IEEE Transactions on Biomedical Circuitsand Systems, vol. 11, no. 5, pp. 1148–1159, 2017.
[36] A. Ainla, M. P. S. Mousavi, M. N. Tsaloglou et al., “Open-source potentiostat for wireless electrochemical detection withsmartphones,” Analytical Chemistry, vol. 90, no. 10, pp. 6240–6246, 2018.
[37] G. F. Giordano, M. B. R. Vicentini, R. C. Murer et al., “Point-of-use electroanalytical platform based on homemade poten-tiostat and smartphone for multivariate data processing,”Electrochimica Acta, vol. 219, pp. 170–177, 2016.
[38] M. D. Steinberg, P. Kassal, I. Kereković, and I. M. Steinberg, “Awireless potentiostat for mobile chemical sensing and biosens-ing,” Talanta, vol. 143, pp. 178–183, 2015.
[39] M. Medina-Sánchez, S. Miserere, E. Morales-Narváez, andA. Merkoçi, “On-chip magneto-immunoassay for Alzheimer’sbiomarker electrochemical detection by using quantum dotsas labels,” Biosensors and Bioelectronics, vol. 54, pp. 279–284, 2014.
[40] E. B. Bahadır andM. K. Sezgintürk, “A review on impedimetricbiosensors,” Artificial Cells, Nanomedicine, and Biotechnology,vol. 44, no. 1, pp. 248–262, 2016.
[41] J.-G. Guan, Y.-Q. Miao, and Q.-J. Zhang, “Impedimetricbiosensors,” Journal of Bioscience and Bioengineering, vol. 97,no. 4, pp. 219–226, 2004.
[42] F. Lisdat and D. Schäfer, “The use of electrochemicalimpedance spectroscopy for biosensing,” Analytical and
Bioanalytical Chemistry, vol. 391, no. 5, pp. 1555–1567,2008.
[43] B.-Y. Chang and S.-M. Park, “Electrochemical impedancespectroscopy,” Annual Review of Analytical Chemistry, vol. 3,no. 1, pp. 207–229, 2010.
[44] S. Petrovic, “Cyclic voltammetry of hexachloroiridate(IV): analternative to the electrochemical study of the ferricyanideion,” The Chemical Educator, vol. 5, no. 5, pp. 231–235, 2000.
[45] S.-M. Park and J.-S. Yoo, “Electrochemical impedance spec-troscopy for better electrochemical measurements,” AnalyticalChemistry, vol. 75, no. 21, pp. 455A–461A, 2003.
[46] J. S. Daniels and N. Pourmand, “Label-free impedance biosen-sors: opportunities and challenges,” Electroanalysis, vol. 19,no. 12, pp. 1239–1257, 2007.
[47] M. Citartan, S. C. B. Gopinath, J. Tominaga, and T. H. Tang,“Label-free methods of reporting biomolecular interactionsby optical biosensors,” Analyst, vol. 138, no. 13, pp. 3576–3592, 2013.
[48] S. Sang, Y. Wang, Q. Feng, Y. Wei, J. Ji, and W. Zhang,“Progress of new label-free techniques for biosensors: areview,” Critical Reviews in Biotechnology, vol. 36, no. 3,pp. 465–481, 2016.
[49] R. Pruna, F. Palacio, A. Baraket et al., “A low-cost and minia-turized potentiostat for sensing of biomolecular species such asTNF-α by electrochemical impedance spectroscopy,” Biosen-sors and Bioelectronics, vol. 100, pp. 533–540, 2018.
[50] X. Huang, H. Chen, H. Deng, L. Wang, S. Liao, and A. Tang,“A fast and simple electrochemical impedance spectroscopymeasurement technique and its application in portable,low-cost instrument for impedimetric biosensing,” Journal ofElectroanalytical Chemistry, vol. 657, no. 1-2, pp. 158–163, 2011.
[51] V. I. Ogurtsov, K. Twomey, and J. Pulka, “A portable sensingsystem for impedance based detection of biotoxin substances,”in Proceedings of the 10th International Joint Conference onBiomedical Engineering Systems and Technologies (BIOSTEC2017), pp. 54–62, Porto, Portugal, 2017.
[52] R. Esfandyarpour, H. Esfandyarpour, M. Javanmard, J. S.Harris, and R. W. Davis, “Microneedle biosensor: a methodfor direct label-free real time protein detection,” Sensors andActuators B: Chemical, vol. 177, pp. 848–855, 2013.
[53] R. Esfandyarpour,M. Javanmard, Z. Koochak, H. Esfandyarpour,J. S. Harris, and R. W. Davis, “Thin film nanoelectronic probefor protein detection,” MRS Proceedings, vol. 1572, 2013.
[54] F. G. Bellagambi, A. Baraket, A. Longo et al., “Electrochemicalbiosensor platform for TNF-α cytokines detection in bothartificial and human saliva: heart failure,” Sensors and Actua-tors B: Chemical, vol. 251, pp. 1026–1033, 2017.
[55] A. Baraket, M. Lee, N. Zine, M. Sigaud, J. Bausells, andA. Errachid, “A fully integrated electrochemical biosensorplatform fabrication process for cytokines detection,” Biosen-sors and Bioelectronics, vol. 93, pp. 170–175, 2017.
[56] A. Das, P. Bhadri, F. R. Beyette, A. Jang, P. Bishop, andW. Timmons, “A potentiometric sensor system with inte-grated circuitry for in situ environmental monitoring,” in2006 Sixth IEEE Conference on Nanotechnology, pp. 917–920,Cincinnati, OH, USA, 2006.
[57] C. Y. Huang, H. Y. Lin, Y. C. Wang, W. Y. Liao, and T. C.Chou, “A portable and wireless data transmission potentio-stat,” in The 2004 IEEE Asia-Pacific Conference on Circuitsand Systems, pp. 633–636, Tainan, Taiwan, 2004.
19Journal of Sensors
[58] C. Berggren, B. Bjarnason, and G. Johansson, “An immunolog-ical interleukine-6 capacitive biosensor using perturbationwith a potentiostatic step,” Biosensors and Bioelectronics,vol. 13, no. 10, pp. 1061–1068, 1998.
[59] W. J. Ma, C. H. Luo, J. L. Lin et al., “A portable low-poweracquisition system with a urease bioelectrochemical sensorfor potentiometric detection of urea concentrations,” Sensors,vol. 16, no. 4, 2016.
[60] B. J. Privett, J. H. Shin, and M. H. Schoenfisch, “Electrochem-ical sensors,” Analytical Chemistry, vol. 80, no. 12, pp. 4499–4517, 2008.
[61] F. J. Gruhl, B. E. Rapp, and K. Länge, Biosensors for DiagnosticApplications, Springer, Berlin, Heidelberg, 2011.
[62] S. Tonello, G. Abate, M. Borghetti et al., “Wireless point-of-care platform with screen-printed sensors for biomarkersdetection,” IEEE Transactions on Instrumentation and Mea-surement, vol. 66, no. 9, pp. 2448–2455, 2017.
[63] B. Aremo, M. Oyebamiji Adeoye, I. B. Obioh, and O. A.Adeboye, “A simplified microcontroller based potentiostatfor low-resource applications,” Open Journal of Metal, vol. 5,no. 4, pp. 37–46, 2015.
[64] C.-Y. Huang, Y.-C. Wang, H.-C. Chen, and K.-C. Ho, “Designof a portable potentiostat for electrochemical sensors,” inProceedings of the 2004 Intelligent Sensors, Sensor Networksand Information Processing Conference, 2004, pp. 331–336,Melbourne, VIC, Australia, 2004.
[65] J. Jung, J. Lee, S. Shin, and Y. Kim, “Development of atelemetric, miniaturized electrochemical amperometric ana-lyzer,” Sensors, vol. 17, no. 10, 2017.
20 Journal of Sensors

International Journal of
AerospaceEngineeringHindawiwww.hindawi.com Volume 2018
RoboticsJournal of
Hindawiwww.hindawi.com Volume 2018
Hindawiwww.hindawi.com Volume 2018
Active and Passive Electronic Components
VLSI Design
Hindawiwww.hindawi.com Volume 2018
Hindawiwww.hindawi.com Volume 2018
Shock and Vibration
Hindawiwww.hindawi.com Volume 2018
Civil EngineeringAdvances in
Acoustics and VibrationAdvances in
Hindawiwww.hindawi.com Volume 2018
Hindawiwww.hindawi.com Volume 2018
Electrical and Computer Engineering
Journal of
Advances inOptoElectronics
Hindawiwww.hindawi.com
Volume 2018
Hindawi Publishing Corporation http://www.hindawi.com Volume 2013Hindawiwww.hindawi.com
The Scientific World Journal
Volume 2018
Control Scienceand Engineering
Journal of
Hindawiwww.hindawi.com Volume 2018
Hindawiwww.hindawi.com
Journal ofEngineeringVolume 2018
SensorsJournal of
Hindawiwww.hindawi.com Volume 2018
International Journal of
RotatingMachinery
Hindawiwww.hindawi.com Volume 2018
Modelling &Simulationin EngineeringHindawiwww.hindawi.com Volume 2018
Hindawiwww.hindawi.com Volume 2018
Chemical EngineeringInternational Journal of Antennas and
Propagation
International Journal of
Hindawiwww.hindawi.com Volume 2018
Hindawiwww.hindawi.com Volume 2018
Navigation and Observation
International Journal of
Hindawi
www.hindawi.com Volume 2018
Advances in
Multimedia
Submit your manuscripts atwww.hindawi.com