Reverberation mapping of high luminosity quasarswebusers.fis.uniroma3.it/~agn10/file/perna.pdf ·...
25
Reverberation mapping of high luminosity quasars ACTIVE GALACTIC NUCLEI 10 - Rome 10-14 september 2012
-
Upload
truongduong -
Category
Documents
-
view
237 -
download
0
Transcript of Reverberation mapping of high luminosity quasarswebusers.fis.uniroma3.it/~agn10/file/perna.pdf ·...

Reverberation mapping of high luminosity quasars
ACTIVE GALACTIC NUCLEI 10 - Rome 10-14 september 2012

Summary
• Reverberation Mapping
• SPEAR (Stochastic Process Estimation for AGN Reverberation, Zu et al. 2011) to estimate the lags between the AGN continuum and emission line light curves and their statistical confidence limits.
• Spectrophotometric monitoring campaign at Asiago 1.82 m telescope, for intermediate z, high luminosisty QSOs.
• The mass of PG 1247+267, the most luminous QSO ever analyzed with RM

Reverberation Mapping: BLR very close to BH.
High velocity, ionized clouds give rise broad emission lines.
Virial reverberation mass:
f, scale factor;V, line width ;
R, RBLR = c t .
The emission-lines “reverberate” to the continuum changes.
t
tlag = RBLR /c
The masses of the AGN’s black holes
Peterson 2001

Time Lag
Transfer function
BLR uniform thin shell
Transfer function for a thin spherical shellwithin the range 0 t’ 2 r/c
gas
cloud
rΔτ1 = r / c
Δτ2 = 0
Δτ4 = 2r / c
Δτ3 = r / c
1
2
3
4
ob
server
Transfer function

“discrete” CCF method (DCF)(Edelson & Krolik 1988)
Time Lag
“Interpolation” metod (ICCF)(Gaskell & Peterson 1987)
Peterson 2001
Cross-correlation function
Unbinned cross-correlation function
Averaging over M pairs for which,
the discrete cross-correlation function is
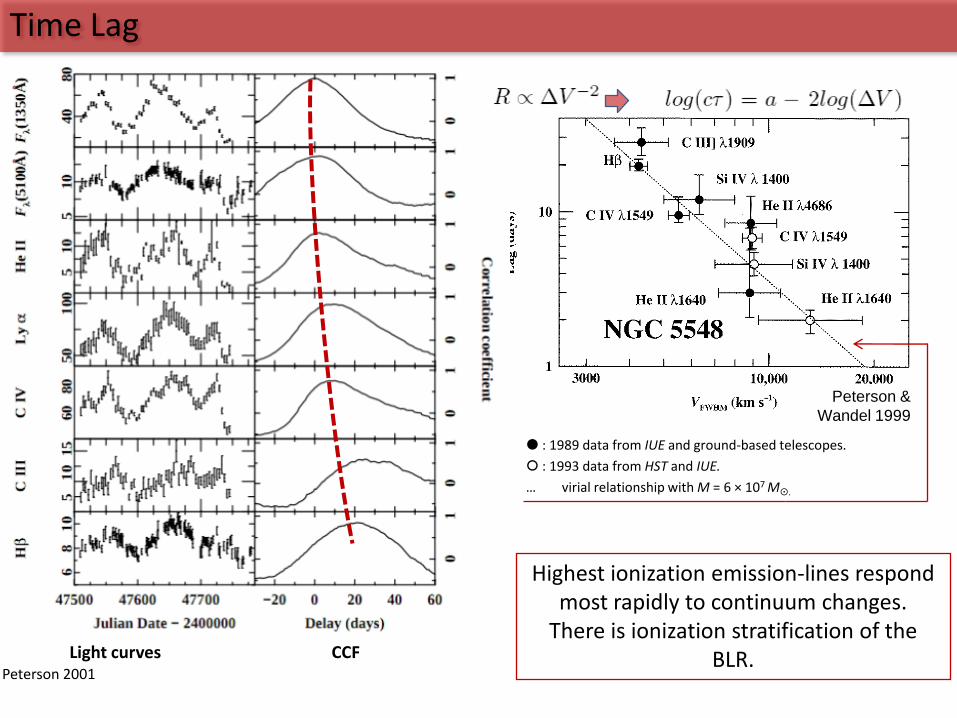
: 1989 data from IUE and ground-based telescopes.
: 1993 data from HST and IUE.
… virial relationship with M = 6 × 10⁷ M.
Peterson &
Wandel 1999
Highest ionization emission-lines respond most rapidly to continuum changes.
There is ionization stratification of the BLR.
Time Lag
Light curves CCFPeterson 2001

L-R relation
BLR size scales withthe 5100 Å luminosity as
(Kaspi et al. 2005; Bentz et al. 2006, 2009)
(Bentz et al. 2006)
Kaspi et al. 2000, for qso with , obtain:
Expand the range to high L will require some 5-10 yr of observation

S.E. relation requised the extrapolation to high luminosity and redshift of a relation whosecalibration performed for and
Single-epoch determination
From R-L relation:
M ergs/s10
)5100(λL
km/s10
β) FWHM(H108.3M
0.50
44
λ
2
3
6
BH
New campaign for spectrophotometric monitoring of luminous, intermediate redshift QSOs
single-epoch (S.E.) determination of the MBH from their luminosityand with FWHM of emission-line.
Vestergaard & Peterson 2006
Empirical method for large statistical sample: cosmological evolution of the mass function.

rest-frame delay of 188 days
From Kaspi et al. 2007
Single-epoch determination

The campaign, PG 1247+267
Copernico telescopeclassic Cassegrain, 1820 mm
(Osservatorio Astronomico di Asiago)
Absence of H, H, H observedin the low redshift study ofKaspy et al. (2000)

PG 1247+267: discrete cross-correlation
line
long
short
con
short
long
line
con

PG 1247+267: discrete cross-correlation
387 days obs
790 days obs
line
long
con
line
con
short

SPEAR (Stochastic Process Estimation for AGN Reverberation)

SPEAR (Stochastic Process Estimation for AGN Reverberation)
Zu et al. 2011
Each interpolated point is a linear
combination of all measured points,
based on the available
information on the autocorrelation
function

SPEAR (Stochastic Process Estimation for AGN Reverberation)
Quasar variability well describet by a damped random walk;Power spectrum of the process is
Amplitude
Damping time scale
Covariance continuum-continuum
Transfer function
Mean lag
Temporal width
Covariance line-continuum

PG 1247+267: SPEAR
CIV
CIII]
Log(
Like
liho
od
)
Log(
Like
liho
od
)

PG 1247+267: SPEAR
(Onken & Peterson 2002; Wandel & Peterson 1999)

To determine FWHM and line
, with
and their associated uncertainties, we employ a bootstrap method.
PG1247+267: measures of Line Width
Mean spectrum Rms spectrum
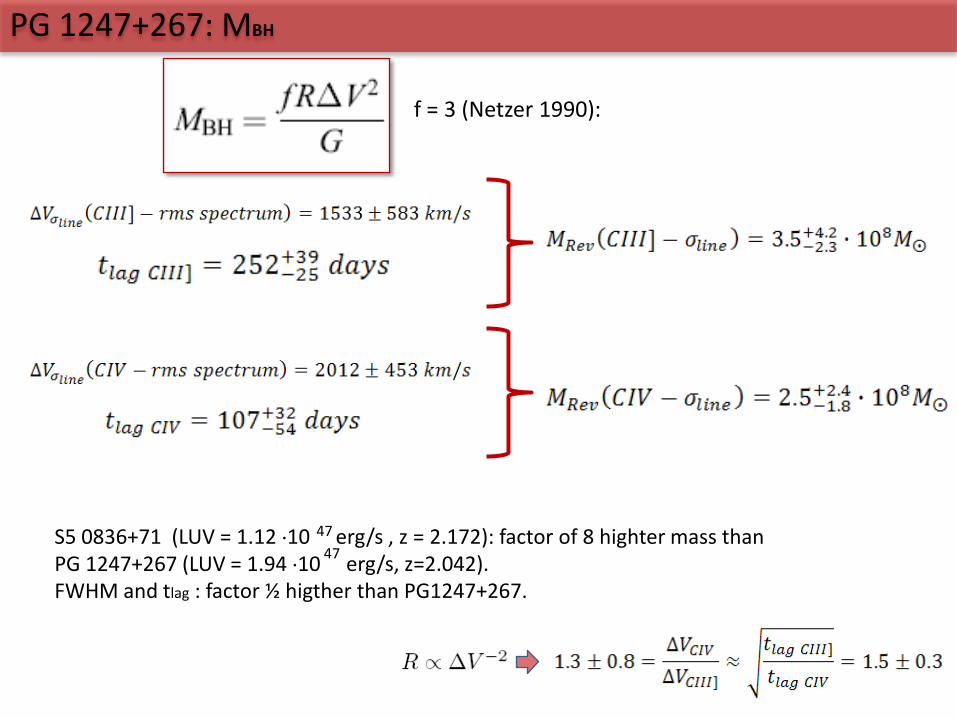
PG 1247+267: MBH
S5 0836+71 (LUV = 1.12 10 erg/s , z = 2.172): factor of 8 highter mass thanPG 1247+267 (LUV = 1.94 10 erg/s, z=2.042).FWHM and tlag : factor ½ higther than PG1247+267.
47
47
f = 3 (Netzer 1990):

Mergs/s10
)1350(λL
km/s10
FWHM(CIV)104.5M
0.53
44
λ
2
3
6
BH
PG 1247+267: MBH
Single-Epoch determination:
Vestergaard & Peterson 2006
S.E. relation from R(H)-LUV, not from R(CIV)-LUV.

R(H)-LUV vs R(CIV)-LUV
R(H)-LUV, Vestergaard & Peterson 2006;slope =0.53.
Kaspi et al. 2007
Points confirms and accentuates the decrease in slope suggested by Kaspi et al. 2007
Adapted from Chelouche, Daniel, Kaspi 2012

Conclusions
• We used the SPEAR method to estimate continuum-line lags tCIV and tCIII]
• We estimated the mass of PG 1247+267, the most luminous QSO ever analyzed with RM
• The CIV lag confirms and accentuates the decrease in slope of LUV-RCIV
relation.
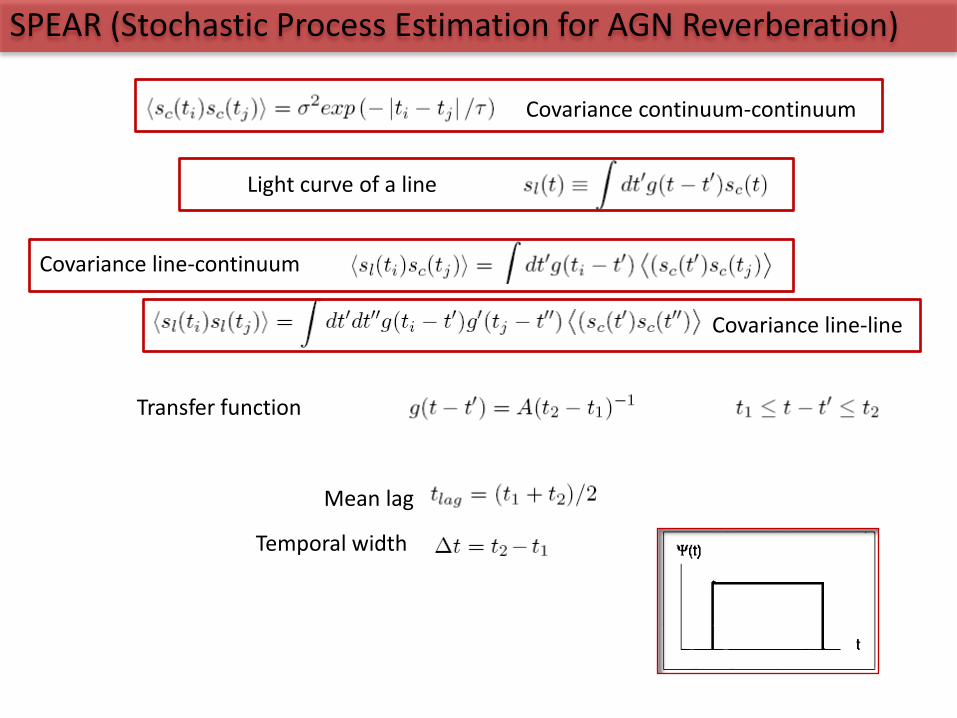
SPEAR (Stochastic Process Estimation for AGN Reverberation)
Light curve of a line
Covariance line-continuum
Covariance continuum-continuum
Covariance line-line
Transfer function
Mean lag
Temporal width

PG 1247+267: MBH
f = 3 (Netzer 1990):
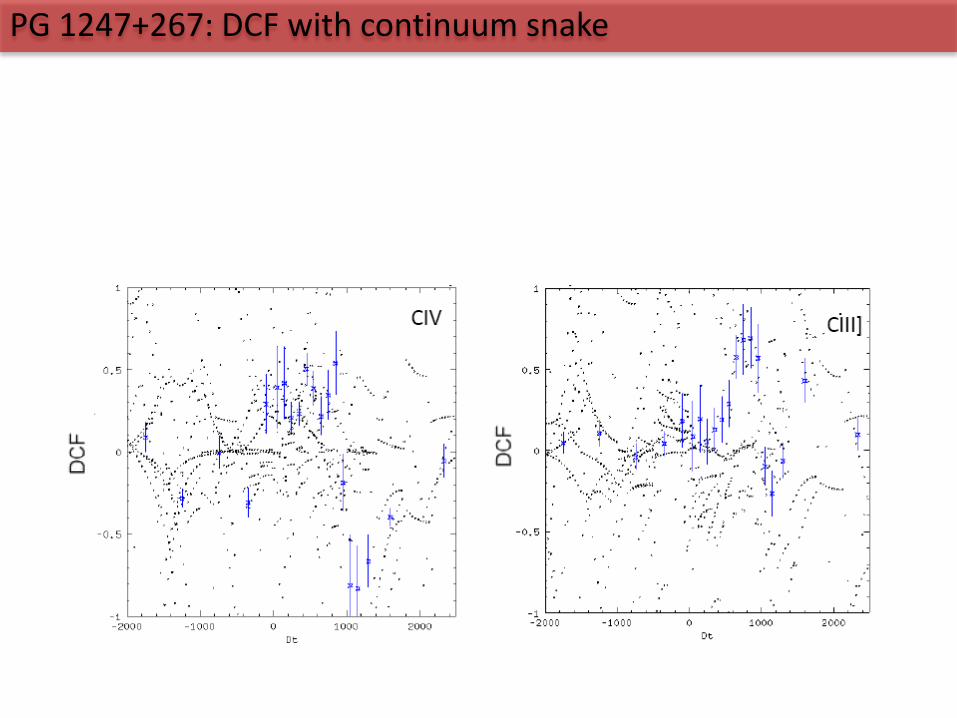
PG 1247+267: DCF with continuum snake