2012 Fiscalis Revenue Administration VAT Department Ankara 1 VAT SYSTEM in TURKEY.
REVENUE IMPLICATIONS OF ALTERNATIVE VAT RATES AND DERIVATION OF
REVENUE NEUTRAL RATES
Technical Note
PAWAN K. AGGARWAL
A.V.L. NARAYANA
N i M P K y
33S.2712B64 Mi i
1995
National Institute of Public Finance and PolicyNew Delhi
FOREWORD
This technical note on "Revenue Implications of Alternative VAT Rates and Derivation of Revenue Neutral Rates" seeks to assess the likely revenue impact of the Value Added Tax (VAT) regime recommended in the NIPFP (1994) study on "The Reform of Domestic Trade Taxes in India: Issues and Options". It also tries to estimate what could be the range of revenue neutral rates under the recommended regime.
The NIPFP (1994) study was sponsored by the Ministry of Finance, Government of India. The objective of the study was to prepare the design of a possible system of VAT for India on which there could be broad agreement among the Centre and the States.
The note was prepared mainly by Pawan K. Aggarwal and A.V.L. Narayana in consultation with State government officials, under the supervision of A. Bagchi who also took active part in designing the study. They also had the benefit of interacting with Satya N. Poddar who was a Consultant for the NIPFP (1994) study. It is hoped that this technical note would serve a useful purpose by providing details of the methodologies used and the data relied upon in deriving the results reported in the NIPFP study.
The governing body of the Institute does not bear any responsibility for the contents or views expressed in the reports of the Institute. That responsibility primarily lies with the authors and the Director.
February 23,1995 New Delhi
A. BAGCHI Director
ACKNOWLEDGEMENTS
During the period of this study, we have benefited enormously from the generous and unstinted help of several academicians/scholars and State officials. This formal acknowledgement cannot convey our real gratitude.
We are deeply indebted to A. Bagchi for his able guidance and constructive suggestions throughout the period of the study.
We are extremely grateful to Satya N. Poddar for very useful discussions and suggestions.
Our sincere thanks are due to Arindam Das-Gupta, Mahesh C. Purohit, Uma Dutta Roy Choudhuary and M.R. Narayana for useful comments on an earlier draft.
Our thanks are also due to the sales tax administration of the States for their help and cooperation. Of the State officials with whom we had close interaction throughout, special mention should be made of V.S. Gopalakrishan, H.B. Nawab, C.K. Thanu Pillai, S.R. Govinda Rajan, K.M. Sahni, T.V. Somanathan, S.A. Subramani and Anil Vaish. We are deeply indebted to them for very useful discussions and suggestions.
We are grateful to H.K. Nath and Soumya K. Ghosh for compiling and processing the data with patience and care.
We are thankful to Ms. Promila Rajvanshi for adept secretarial assistance.
While the help of all these people has been indispensable, we accept, without any reservation, the responsibility for any error that may have remained.
February 23,1995 New Delhi
PAWAN K. AGGARWAL A.V.L. NARAYANA
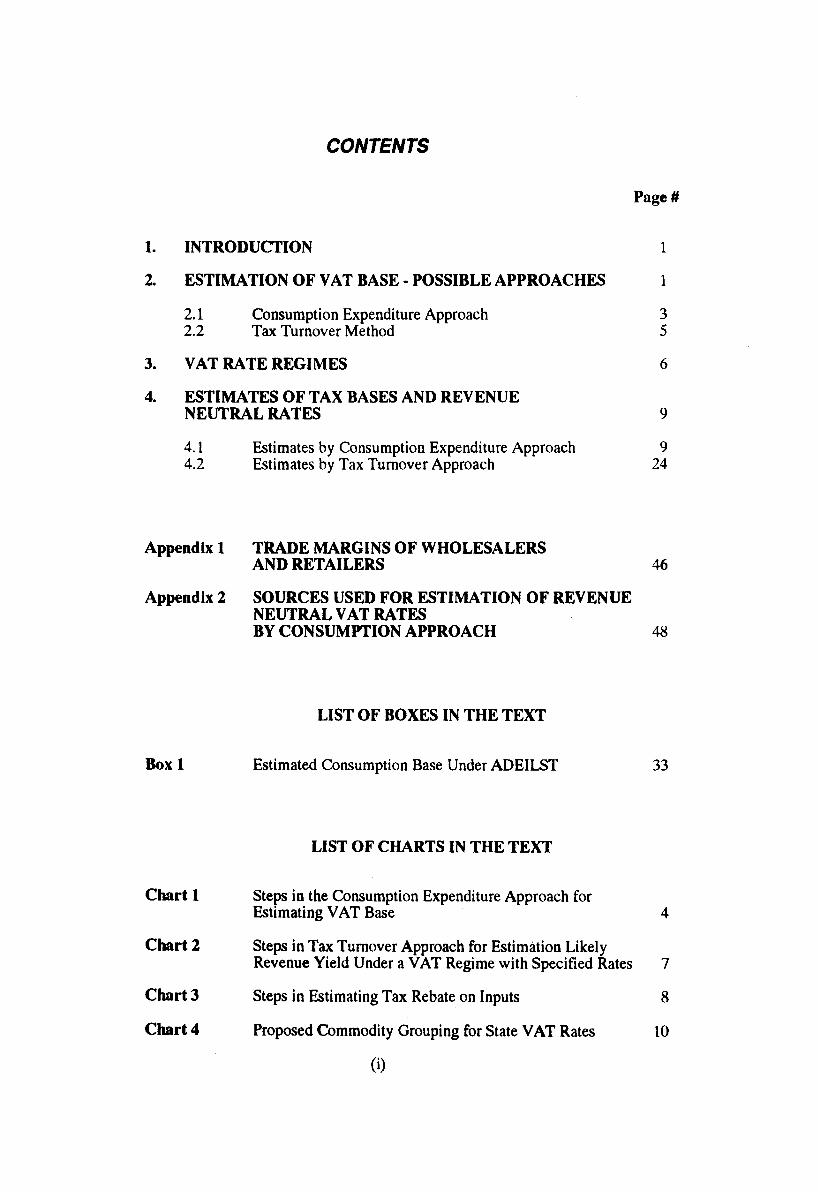
CONTENTS
Page#
1. INTRODUCTION 1
2. ESTIMATION OF VAT BASE - POSSIBLE APPROACHES 1
2.1 Consumption Expenditure Approach 32.2 Tax Turnover Method 5
3. VAT RATE REGIMES 6
4. ESTIMATES OF TAX BASES AND REVENUENEUTRAL RATES 9
4.1 Estimates by Consumption Expenditure Approach 94.2 Estimates by Tax Turnover Approach 24
Appendix 1 TRADE MARGINS OF WHOLESALERSAND RETAILERS 46
Appendix 2 SOURCES USED FOR ESTIMATION OF REVENUE NEUTRAL VAT RATESBY CONSUMPTION APPROACH 48
LIST OF BOXES IN THE TEXT
Box 1 Estimated Consumption Base Under ADEILST 33
LIST OF CHARTS IN THE TEXT
Chart 1 Steps in the Consumption Expenditure Approach forEstimating VAT Base 4
Chart 2 Steps in Tax Turnover Approach for Estimation LikelyRevenue Yield Under a VAT Regime with Specified Rates 7
Chart 3 Steps in Estimating Tax Rebate on Inputs 8
Chart 4 Proposed Commodity Grouping for State VAT Rates 10
(0
Page#
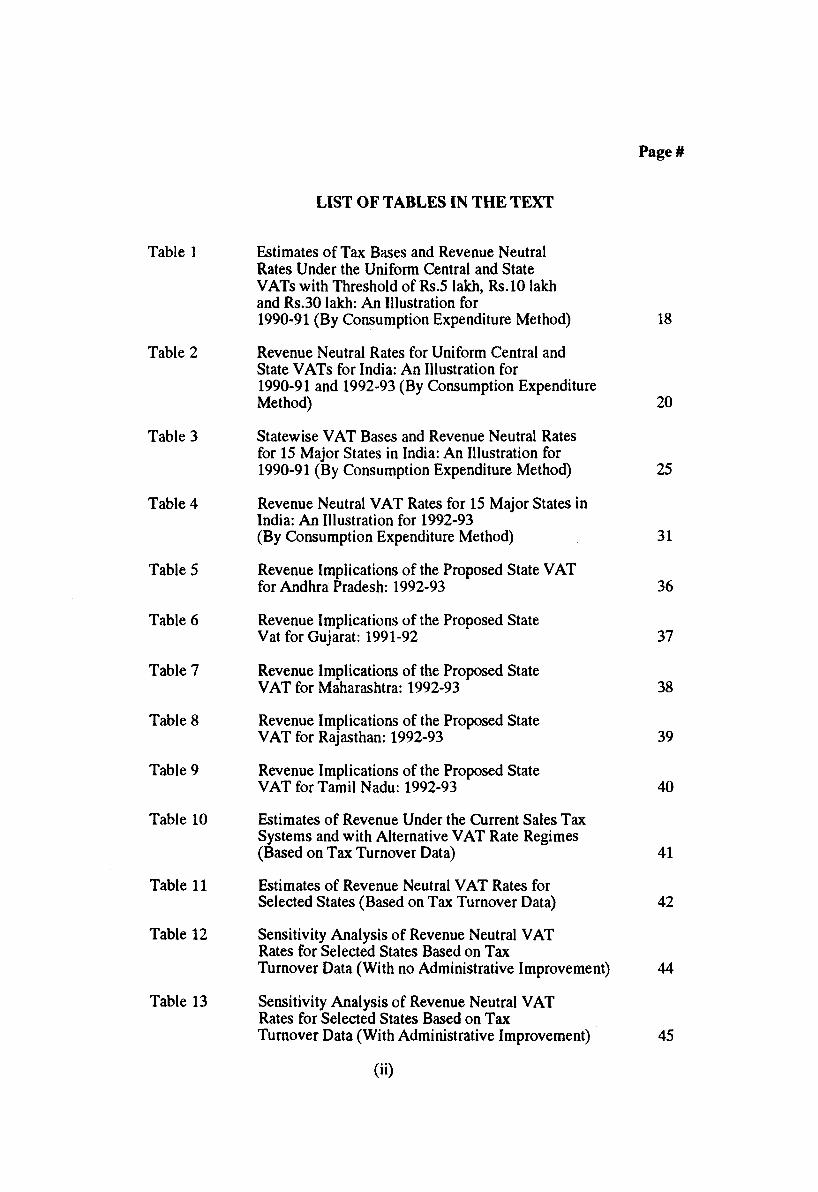
LIST OF TABLES IN THE TEXT
Table 1 Estimates of Tax Bases and Revenue NeutralRates Under the Uniform Central and State VATs with Threshold of Rs.5 lakh, Rs.10 lakh and Rs.30 lakh: An Illustration for 1990-91 (By Consumption Expenditure Method)
Table 2 Revenue Neutral Rates for Uniform Central andState VATs for India: An Illustration for 1990-91 and 1992-93 (By Consumption Expenditure Method)
Table 3 Statewise VAT Bases and Revenue Neutral Ratesfor 15 Major States in India: An Illustration for 1990-91 (By Consumption Expenditure Method)
Table 4 Revenue Neutral VAT Rates for 15 Major States inIndia: An Illustration for 1992-93 (By Consumption Expenditure Method)
Table 5 Revenue Implications of the Proposed State VATfor Andhra Pradesh: 1992-93
Table 6 Revenue Implications of the Proposed StateVat for Gujarat: 1991-92
Table 7 Revenue Implications of the Proposed StateVAT for Maharashtra: 1992-93
Table 8 Revenue Implications of the Proposed StateVAT for Rajasthan: 1992-93
Table 9 Revenue Implications of the Proposed StateVAT for Tamil Nadu: 1992-93
Table 10 Estimates of Revenue Under the Current Sales TaxSystems and with Alternative VAT Rate Regimes (Based on Tax Turnover Data)
Table 11 Estimates of Revenue Neutral VAT Rates forSelected States (Based on Tax Turnover Data)
Table 12 Sensitivity Analysis of Revenue Neutral VATRates for Selected States Based on Tax Turnover Data (With no Administrative Improvement)
Table 13 Sensitivity Analysis of Revenue Neutral VATRates for Selected States Based on Tax Turnover Data (With Administrative Improvement)
(ii)
18
20
25
31
36
37
38
39
40
41
42
44
45
REVENUE IMPLICATIONS OF ALTERNATIVE VAT RATES AND DERIVATION OF REVENUE NEUTRAL RATES
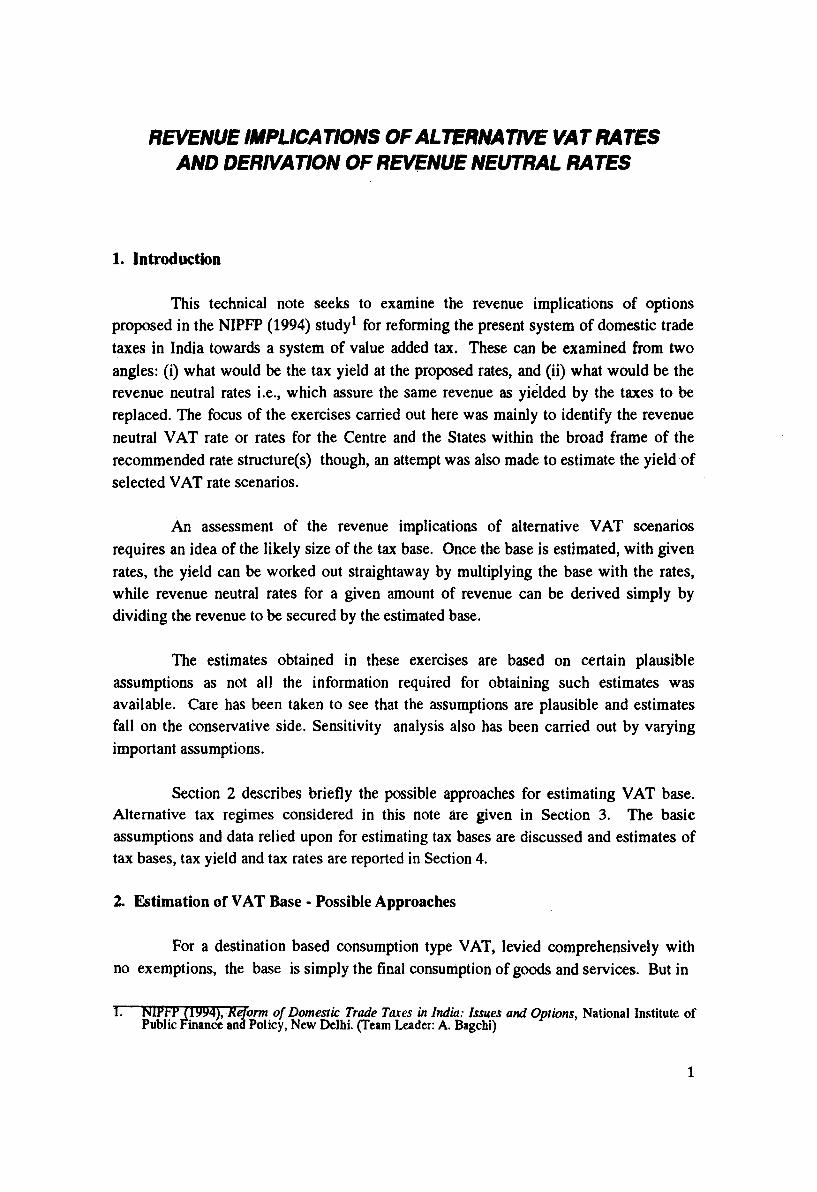
1. Introduction
This technical note seeks to examine the revenue implications of options proposed in the NIPFP (1994) study1 for reforming the present system of domestic trade taxes in India towards a system of value added tax. These can be examined from two angles: (i) what would be the tax yield at the proposed rates, and (ii) what would be the revenue neutral rates i.e., which assure the same revenue as yielded by the taxes to be replaced. The focus of the exercises carried out here was mainly to identify the revenue neutral VAT rate or rates for the Centre and the States within the broad frame of the recommended rate structure(s) though, an attempt was also made to estimate the yield of selected VAT rate scenarios.
An assessment of the revenue implications of alternative VAT scenarios requires an idea of the likely size of the tax base. Once the base is estimated, with given rates, the yield can be worked out straightaway by multiplying the base with the rates, while revenue neutral rates for a given amount of revenue can be derived simply by dividing the revenue to be secured by the estimated base.
The estimates obtained in these exercises are based on certain plausible assumptions as not all the information required for obtaining such estimates was available. Care has been taken to see that the assumptions are plausible and estimates fall on the conservative side. Sensitivity analysis also has been carried out by varying important assumptions.
Section 2 describes briefly the possible approaches for estimating VAT base. Alternative tax regimes considered in this note are given in Section 3. The basic assumptions and data relied upon for estimating tax bases are discussed and estimates of tax bases, tax yield and tax rates are reported in Section 4.
2. Estimation of VAT Base - Possible Approaches
For a destination based consumption type VAT, levied comprehensively with no exemptions, the base is simply the final consumption of goods and services. But in
r (1994), Reform of Domestic Trade Taxes in India: Issues and Options, National Institute ofPublic Finance ana Policy, New Delhi. (Team Leader: A. Bagchi)
1
Revenue Implications o f Alternative VAT Rates and Derivation of Revenue Neutral Rates
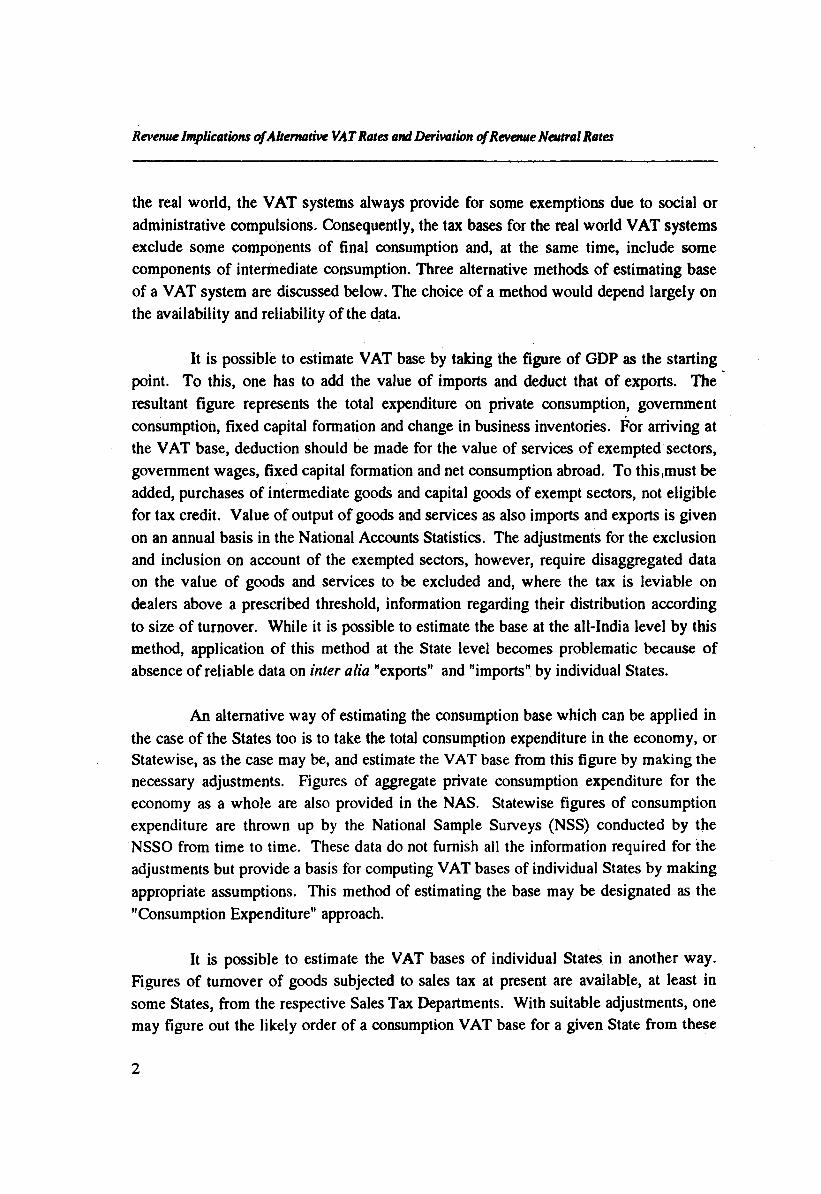
the real world, the VAT systems always provide for some exemptions due to social or administrative compulsions. Consequently, the tax bases for the real world VAT systems exclude some components of final consumption and, at the same time, include some components of intermediate consumption. Three alternative methods of estimating base of a VAT system are discussed below. The choice of a method would depend largely on the availability and reliability of the data.
It is possible to estimate VAT base by taking the figure of GDP as the starting point. To this, one has to add the value of imports and deduct that of exports. The resultant figure represents the total expenditure on private consumption, government consumption, fixed capital formation and change in business inventories. For arriving at the VAT base, deduction should be made for the value of services of exempted sectors, government wages, fixed capital formation and net consumption abroad. To this,must be added, purchases of intermediate goods and capital goods of exempt sectors, not eligible for tax credit. Value of output of goods and services as also imports and exports is given on an annual basis in the National Accounts Statistics. The adjustments for the exclusion and inclusion on account of the exempted sectors, however, require disaggregated data on the value of goods and services to be excluded and, where the tax is leviable on dealers above a prescribed threshold, information regarding their distribution according to size of turnover. While it is possible to estimate the base at the all-India level by this method, application of this method at the State level becomes problematic because of absence of reliable data on inter alia "exports" and "imports" by individual States.
An alternative way of estimating the consumption base which can be applied in the case of the States too is to take the total consumption expenditure in the economy, or Statewise, as the case may be, and estimate the VAT base from this figure by making the necessary adjustments. Figures of aggregate private consumption expenditure for the economy as a whole are also provided in the NAS. Statewise figures of consumption expenditure are thrown up by the National Sample Surveys (NSS) conducted by the NSSO from time to time. These data do not furnish all the information required for the adjustments but provide a basis for computing VAT bases of individual States by making appropriate assumptions. This method of estimating the base may be designated as the "Consumption Expenditure" approach.
It is possible to estimate the VAT bases of individual States in another way. Figures of turnover of goods subjected to sales tax at present are available, at least in some States, from the respective Sales Tax Departments. With suitable adjustments, one may figure out the likely order of a consumption VAT base for a given State from these
2
Revenue Implications of Alternative VATRates and Derivation of Revenue Neutral Rates
figures which can then be used to derive estimates of the revenue impact of alternative rate regimes as well as the likely order of revenue neutral rates. This is referred to here as the "Tax Turnover" approach. Since the basic figures required for the Tax Turnover approach are compiled directly from the tax returns filed by dealers for sales tax, estimates made with this method might be regarded as firm and more reliable than those obtained by the aggregative consumption expenditure approach.
Between the consumption expenditure approach and the tax turnover approach, the former is likely to give a higher estimate of the VAT base as it employs potential tax base while the latter uses the actual tax base that has been realised subject to administrative limitations of the prevailing sales tax systems.
Both the consumption expenditure and tax turnover methods, however, involve a series of steps and assumptions to provide for the adjustments and/or to make up for deficiencies of data. The steps to be gone through to derive the base under each method and the underlying assumptions are described below.
2.1 Consumption Expenditure Approach
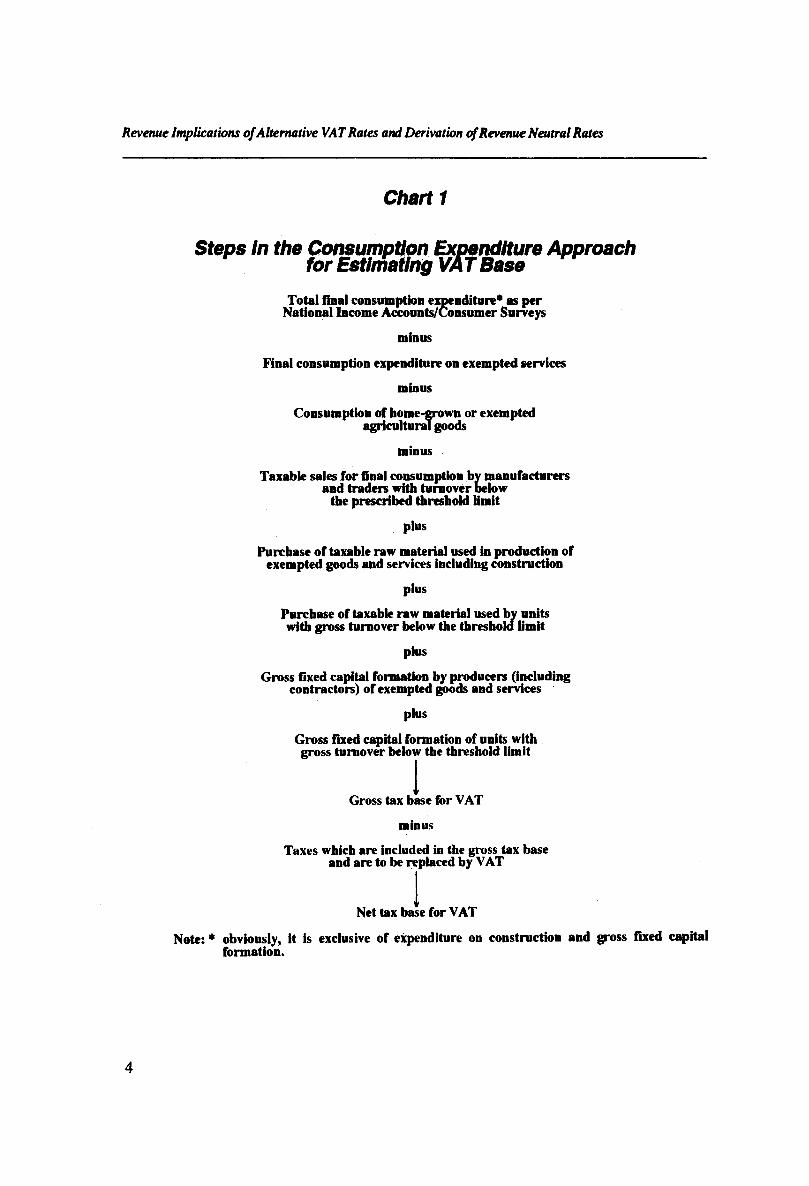
In working out the base for a VAT by this method, adjustments have to be made to the aggregated consumption expenditure data available from the NAS to allow for: (i) exemption of agricultural products and (ii) exemption of dealers with turnover below the taxable limit. Further allowance has to be made for consumption of services if services are not included in the base. While the adjustments for exclusion of services and exempt agricultural products from the base can be made with the help of information provided in the NAS, that for the exemption of dealers with turnover below the taxable limit have to be made on the basis of the share of exempt dealers in aggregate consumption expenditure of a given State, under alternative assumptions regarding thresholds. Specifically, exclusions from the final consumption comprise (i) consumption of "home-grown" or exempted goods and services, and (ii) sales to final consumers by the specified exempted sectors such as small dealers/manufacturers with turnover below a given threshold. Intermediate consumption of taxable goods/services in production of exempted goods/services or specified exempted sectors or dealers needs to be added to the final consumption as no tax rebate is allowed on such intermediate consumption. In effect, such intermediate consumption is treated as final consumption. The tax base for a countrywide VAT can be derived in this way. The consumption expenditure approach for estimating VAT base is described briefly in Chart 1.
3
Revenue Implications of Alternative VAT Rates and Derivation of Revenue Neutral Rates
Chart 1
Steps In the Consumption Expenditure Approach for Estimating VAT Base
Total final consumption expenditure* as per National Income Accounts/Consumer Surveys
minus
Final consumption expenditure on exempted services
minus
Consumption of home-grown or exempted agricultural goods
minus
Taxable sales for final consumption by manufacturers and traders with turnover below
the prescribed threshold limit
plus
Purchase of taxable raw material used in production of exempted goods and services including construction
plus
Purchase of taxable raw material used bv units with gross turnover below the threshold limit
plus
Gross fixed capital formation by producers (including contractors) of exempted goods and services
plus
Gross fixed capital formation of units with gross turnover below the threshold limit
Gross tax base for VAT
minus
Taxes which are included in the gross tax base and are to be replaced by VAT
Net tax base for VAT
Note: * obviously, it is exclusive of expenditure on construction and gross fixed capital formation.
4
Revenue Implications ofAlternative VAT Rates and Derivation ofRevenue Neutral Rates
Once the base is estimated, revenue neutral rate for a VAT levied at a uniform rate throughout the country by any one level of government to replace both Central excises and State sales taxes can be worked out straightaway by dividing the revenue to be replaced by the base. (However, this model, being undesirable and impracticable, has been ruled out as a possible option of VAT for India). Similarly, the revenue neutral rate of a Central VAT to replace Central excises and the revenue neutral rate of a State VAT to replace States sales taxes, levied at a uniform rate across the States, on the same base, can be worked out with alternative thresholds.
The proposals put forward in the Report envisage replacement of Central excises by a Central VAT only upto the manufacturer level and of State sales taxes by State VATs down to the retail level. It may be noted that the revenue neutral rate of a State VAT, uniform across the States, is unlikely to be revenue neutral for individual States. Estimation of revenue neutral VAT rates for individual States requires computation of VAT base for each State separately. For individual States, figures of only household consumption expenditure are available from reports of NSS. Further, the data on relevant components of the consumption expenditure required for making necessary adjustments are not available for individual States. It however is possible to estimate the magnitude of these components from all-India data relying on certain assumptions. Consumption expenditure bases so estimated can be used to obtain revenue neutral VAT rates for individual States.
2.2 Tax Turnover Method
The starting point under this method is the taxable turnover data for a given State. These data include both final consumption products and services as also inputs (including plant and machinery). Since under a VAT, the tax paid on inputs would be rebated, when used by a VAT registered dealer, it is necessary to estimate, in addition to the value of exempt products and services under the contemplated VAT regime, the total amount of rebate which would have to be allowed for tax on purchases when sales taxes are replaced by VAT. However, only locally (i.e., within the State) produced inputs would be eligible for tax rebate. So an estimate has to be made of the inputs which are locally produced.
At the same time, taxable turnover excludes (i) trade margins of wholesalers and retailers as most of the commodities are subject to the first point tax in all the States and Union Territories, and (ii) turnover relating to sugar, textiles and tobacco - as these
5
Revalue Implications ofAlternative VA T Rates and Derivation of Revenue Neutral Rates
commodities are not subjected to sales tax under a tax rental arrangement with the Centre. Accordingly, these components need to be estimated and added to the taxable turnover to obtain the VAT base.
It may be noted that taxable turnover excludes all turnover of exempted goods/services and turnover of dealers below the threshold limit under the current sales tax system in a State. However, in computing the VAT base a further deduction from the turnover figure is required to the extent of turnover of dealers above the threshold limit under the current system but below the threshold that would be fixed under the VAT in a given State.
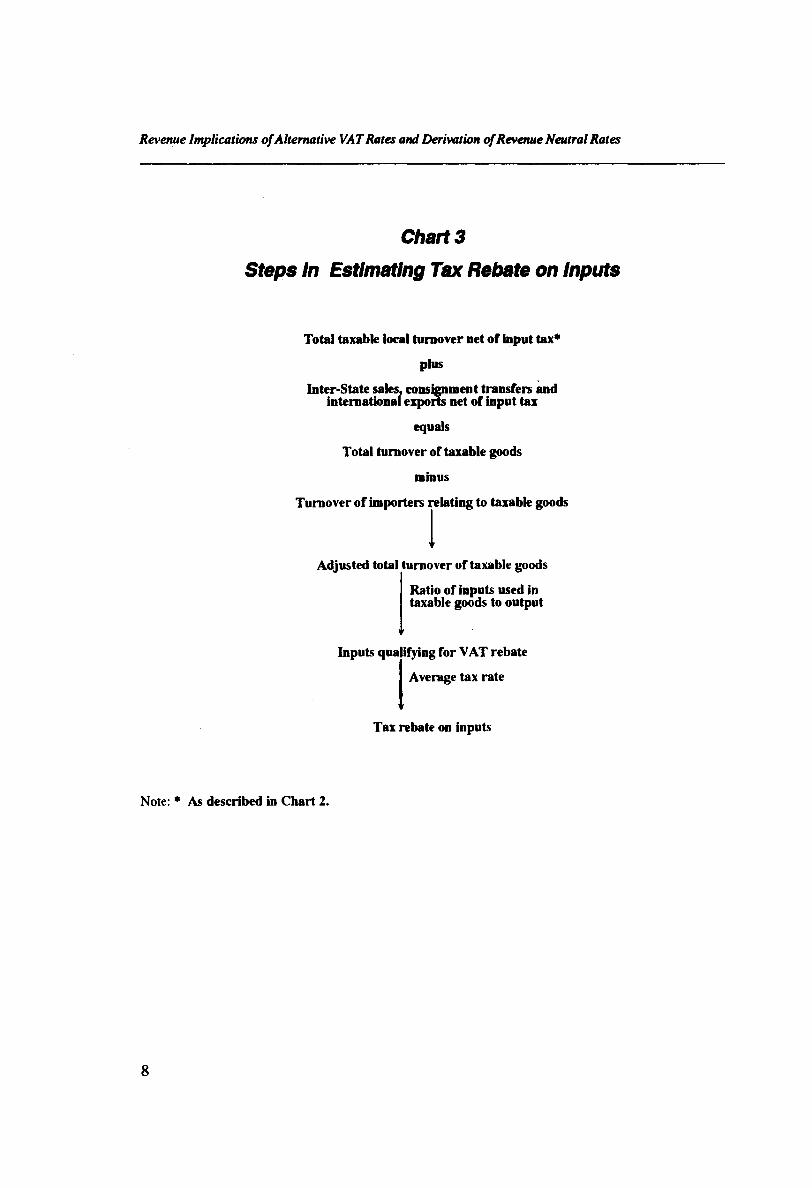
Estimation of intermediate consumption included in the taxable turnover, for which tax rebate would be allowed under VAT, requires estimation of value of locally produced taxable goods used as input in the production of taxable goods in the State. Assuming that there is no change in stocks, taxable goods produced within a State are accounted for by (i) local sales (ii) inter-State sales/consignments, and (iii) international exports. Under the current systems of sales taxes, taxable turn-over comprise only local sale of taxable goods because inter-State sales and international exports are not subjected to general sales tax (GST)2. Since inter-State sales are subjected to Central Sales Tax (CST), it is possible to estimate the value of inter-State sales based on the yield and rate(s) of CST. Estimation of value of consignment transfers and international exports from a State has to be based on primary data.
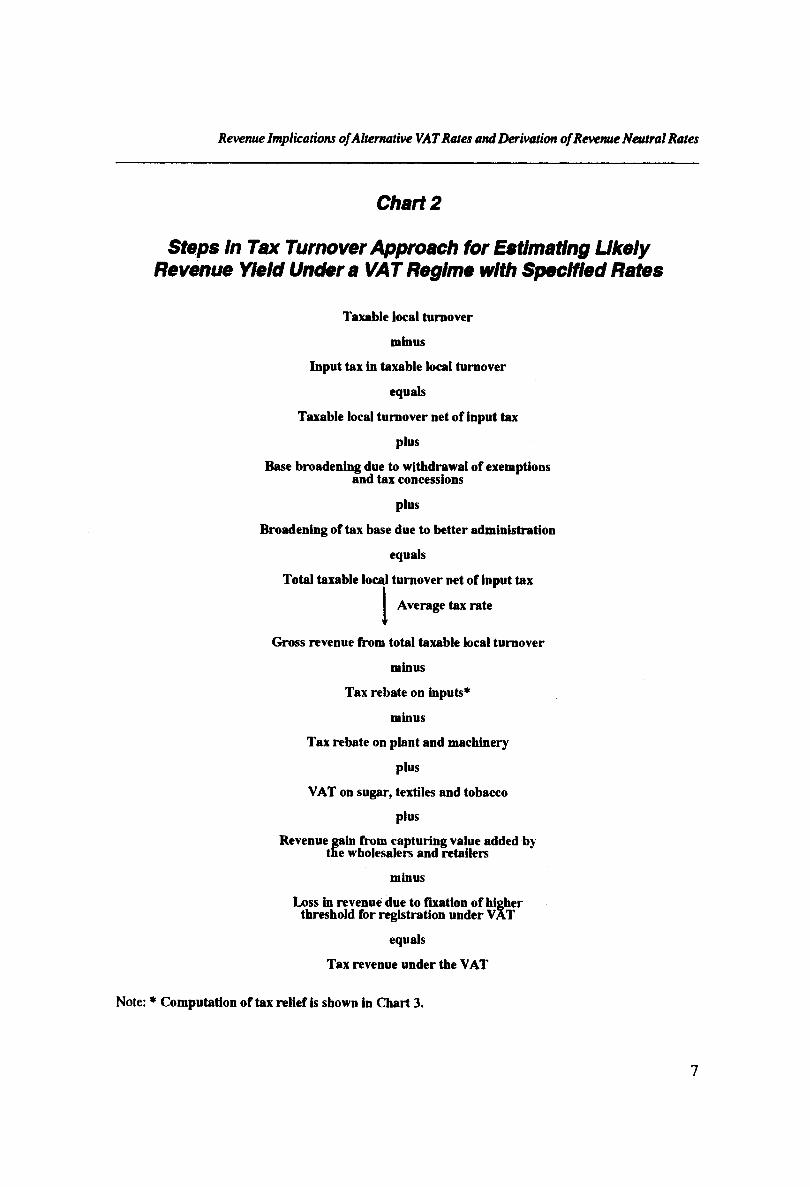
Estimates of tax revenue with a VAT rate regime can be obtained by applying the VAT rates to the relevant components of the tax base, or by applying an average VAT rate to the global VAT base. The tax turnover approach is described briefly in Chart 2. Computation of tax relief on input use of goods and services is explained separately in Chart 3.
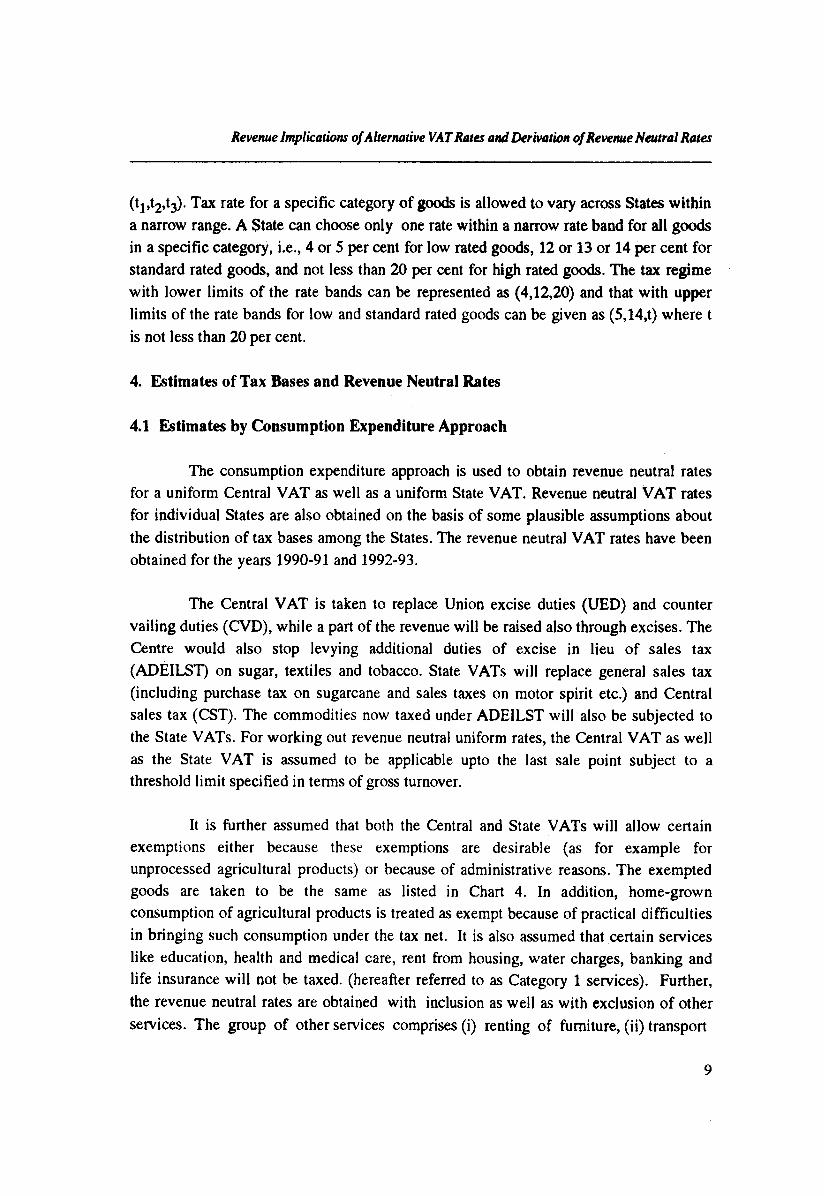
3. VAT Rate Regimes
Under the VAT rate structure recommended in the Study, all commodities except certain unprocessed food items which would be exempt, are classified into three broad categories - those subjected to low, standard and high rate as shown in Chart 4. A VAT rate regime of low rate (tj), standard rate (t^ and high rate (t3) is represented as
Z It may however be noted that inter-State sales are subjected to Central Sales Tax (CST) whereas inter-State consignment transfers and international exports are allowed to cross the State borders free of tax.
6
Revenue Implications ofAlternative VAT Rates and Derivation of Revenue Neutral Rates
Chart 2
Steps In Tax Turnover Approach for Estimating Ukely Revenue Yield Under a VAT Regime with Specified Rates
Taxable local turnover
minus
Input tax in taxable local turnover
equals
Taxable local turnover net of input tax
plus
Base broadening due to withdrawal of exemptions and tax concessions
plus
Broadening of tax base due to better administration
equals
Total taxable local turnover net of input tax
Average tax rate
Gross revenue from total taxable local turnover
minus
Tax rebate on inputs*
minus
Tax rebate on plant and machinery
plus
VAT on sugar, textiles and tobacco
plus
Revenue gain from capturing value added by the wholesalers and retailers
minus
Loss in revenue due to fixation of higher threshold for registration under VAT
equals
Tax revenue under the VAT
Note: * Computation of tax relief is shown in Chart 3.
7
Revenue Implications ofAlternative VA T Rates and Derivation of Revenue Neutral Rates
Note:
Chart 3
Steps In Estimating Tax Rebate on Inputs
Total taxable local turnover net of input tax*
plus
Inter-State sales, consignment transfers and international exports net of input tax
equals
Total turnover of taxable goods
minus
Turnover of importers relating to taxable goods
Adjusted total turnover of taxable goods
Ratio of inputs used in taxable goods to output
Inputs qua ifying for VAT rebate
Average tax rate
Tax rebate on inputs
1 As described in Chart 2.
8
Revenue Implications of Alternative VAT Rates and Derivation of Revenue Neutral Rates
(ti,t2,t3). Tax rate for a specific category of goods is allowed to vary across States within a narrow range. A State can choose only one rate within a narrow rate band for all goods in a specific category, i.e., 4 or 5 per cent for low rated goods, 12 or 13 or 14 per cent for standard rated goods, and not less than 20 per cent for high rated goods. The tax regime with lower limits of the rate bands can be represented as (4,12,20) and that with upper limits of the rate bands for low and standard rated goods can be given as (5,14,t) where t is not less than 20 per cent.
4. Estimates of Tax Bases and Revenue Neutral Rates
4.1 Estimates by Consumption Expenditure Approach
The consumption expenditure approach is used to obtain revenue neutral rates for a uniform Central VAT as well as a uniform State VAT. Revenue neutral VAT rates for individual States are also obtained on the basis of some plausible assumptions about the distribution of tax bases among the States. The revenue neutral VAT rates have been obtained for the years 1990-91 and 1992-93.
The Central VAT is taken to replace Union excise duties (UED) and counter vailing duties (CVD), while a part of the revenue will be raised also through excises. The Centre would also stop levying additional duties of excise in lieu of sales tax (ADEILST) on sugar, textiles and tobacco. State VATs will replace general sales tax (including purchase tax on sugarcane and sales taxes on motor spirit etc.) and Central sales tax (CST). The commodities now taxed under ADEILST will also be subjected to the State VATs. For working out revenue neutral uniform rates, the Central VAT as well as the State VAT is assumed to be applicable upto the last sale point subject to a threshold limit specified in terms of gross turnover.
It is further assumed that both the Central and State VATs will allow certain exemptions either because these exemptions are desirable (as for example for unprocessed agricultural products) or because of administrative reasons. The exempted goods are taken to be the same as listed in Chart 4. In addition, home-grown consumption of agricultural products is treated as exempt because of practical difficulties in bringing such consumption under the tax net. It is also assumed that certain services like education, health and medical care, rent from housing, water charges, banking and life insurance will not be taxed, (hereafter referred to as Category 1 services). Further, the revenue neutral rates are obtained with inclusion as well as with exclusion of other services. The group of other services comprises (i) renting of furniture, (ii) transport
9
Revenue Implications of Alternative VAT Rates and Derivation of Revenue Neutral Rates
Chart 4
Proposed Commodity Grouping for State VAT Rates
Exemptions
1. Unprocessed cereals including rice and wheat.
2. Rice flour, atta, maida and suji
3. Pulses
4. Fresh vegetables and fruits
5. Fresh meat, fish and livestock excluding race horses.
6. Unprocessed salt
7. Fresh milk
8. All types of eggs
9. Plain water not including mineral water, aerated water, tonic water, distilled water, scented water or water sold in sealed containers/sockets, etc.
Rate of Tax (4 to 5%)
1. Oilseeds, edible oils and oil cake
2. Processed salt
3. Dried fish, vegetables and meat
4. Pasteurised milk
5. Chillies, turmeric, tamarind, cumin seed, dried ginger, etc.
6. Kerosene
7. Sugar
High Rate of Tax (Minimum 20%)
1. Diesel, petrol and aviation fuel
2. Opium, ganja, bhang, narcotics, etc.
3. Liquor
4. Tobacco and tobacco products.
All Other Commodities: Standard Rate (12 to 14%)
10
Revenue Implications ofAlternative VA T Rates and Derivation of Revenue Neutral Rates
and communication, (iii) recreation and cultural services, (iv) hotels and restaurants and (v) other miscellaneous services (excluding LIC premia, banking and legal and business services). This group is referred to as Category 2 services. It may be noted that public services such as defence and public administration are already outside the consumption expenditure base. As discussed earlier, exemptions imply certain exclusions from and inclusions in the consumption expenditure in order to arrive at the base under a VAT as outlined in Chart 1.
For convenience, we first describe the computation of VAT base and revenue neutral rates for the uniform Central and State VATs, and take up later the computation of Statewise VAT bases and revenue neutral rates.
a. Revenue Neutral Rates of Uniform Central and State VATs
Tax base for the Central or the State VAT by using the consumption approach, is derived by following the scheme described in Chart 1. Not all the information required for estimating the tax bases was readily available. The computations had, therefore to be based on certain assumptions. The computations based on the basic set of assumptions are set out in Table 1. The estimates and the basic assumptions are discussed below.
The latest year for which the data on total final consumption expenditure on goods and services were available is 1990-91. These data, for all-India, were compiled from the National Accounts Statistics, 1993, and are reported in lines A and B in Table1. Regarding the final consumption of services of both the categories 1 and 2, the data relating to only private final consumption could be obtained and the same has been reported in line B. Further, among category 2 services, for hotels and restaurants, the value added instead of final consumption has been used.
The data on private final consumption expenditure (PFCE) on exempted goods, excluded from the tax base, has also been compiled from the National Accounts Statistics, 1993. It is of the order of Rs. 90108 crore for the year 1990-913 and is reported in line C. This accounts for about 26.83 per cent of total PFCE, and constitutes about 48.19 per cent of the agricultural output.
7. This is taken to include Rs 70111 crore of imputed value of home-grown consumption estimated at 37.5 per cent of the agricultural output including forestry, logging and fishing. (See Government of India, CSO, Sources and Methods, 1989.)
11
Revatue Implications ofAlternative VAT Rates and Derivation of Revenue Neutral Rates
Values of sales to final consumers by units with gross turnover below the threshold limits were estimated separately for three categories of manufacturers/traders,i.e., for registered manufacturing establishments, small scale non-factory units and trade establishments. In the first two cases, sales to final consumers have been taken as 15 per cent of the value of gross output of the units with gross turnover below the threshold limit. This assumption seems to be reasonable because most of the tiny manufacturing units prefer to operate as ancillaries and concentrate on products like raw material and spare parts used by large and medium scale units. For the third category, i.e., traders, 50 per cent of the output of traders operating below Rs.5 lakh is taken as sale to final consumers, while 100 per cent of the output of other traders having turnover between Rs 5-30 lakh is treated as final consumption. This requires estimating the value of output of the manufacturers/traders separately for a given threshold limit such as Rs.5 lakh, Rs.10 lakh and Rs. 30 lakh.
At the all-India level, the data on value of gross output of services, construction and exempted goods were compiled for the year 1990-91 from the National Accounts Statistics, CSO, 1993 and are reported in line D in Table 1. The figures of value of gross output at the all-India level for the above discussed three categories of manufacturersAraders were also obtained for 1990-91 from the same source.
Estimation of value of gross output of registered manufacturers with gross turnover less than a given threshold limit requires information on the distribution of output by size class of turnover. The latest year for which such information is available was 1988-89, from the Annual Survey of Industries (ASI), 1988-89 (Summary Results for Factory Sector). The lowest class interval for which the data were available is Rs 0-25 lakh per annum. The value of output for size classes Rs 0-5 lakh, Rs 5-10 lakh and Rs 10-25 lakh has been assumed to be respectively 50,30 and 20 per cent of the value of output of the size class Rs 0-25 lakh. The value of output of the size class Rs 25-30 lakh was estimated through linear interpolation of the output of the next size class Rs 25-50 lakh. With these details, the shares of different size classes in total gross output were obtained for the year 1988-89. These are 1.31, 0.79 and 0.17 per cent respectively for size classes Rs 0-5 lakh, Rs. 5-10 lakh and Rs. 10-30 lakh. Accordingly, the cumulated shares of manufacturers operating below the threshold limits of Rs 5 lakh, Rs 10 lakh and Rs 30 lakh work out to 1.31, 2.10 and 2.27 per cent respectively. The value of output of these manufacturers in 1990-91 was obtained by applying the same shares to the total output of 1990-91 and is reported in line E(i). The sales to final consumers by these units are taken at 15 per cent of their output and shown in line F(i).
12
Revenue Implications ofAlternative VAT Rates and Derivation of Revenue Neutral Rates
Value of gross output of small scale non-factory units (SSNFU) operating below a threshold level has been estimated on the basis of investment data available in the Report on the Second All-India Census of Small Scale Industrial Units, 1987-88 (SSI Census). The SSI Census data include both factory and non-factory units. The distribution of investment separately for factory and non-factory units by investment slabs is not available. Therefore, we have used the combined distribution of investment for all SSI units to obtain the distribution of output for 1987-88 simply by multiplying the values of investment and the slab limits by output-investment ratios. From this, the distribution of output at 1990-91 prices was obtained by using an inflation index based on the wholesale price indices. From this distribution of output, shares of the units operating below the threshold levels of Rs.5 lakh, Rs. 10 lakh and Rs.30 lakh were derived.4 The shares thus obtained were applied to the estimated value of total output of the non-factory units for 1990-91 to deduce the corresponding values of output of units below the threshold limits for that year. These estimates are shown in line E(ii). Sales to final consumers by these units were taken to be 15 per cent of their output and are reported in line F(ii).
Values of gross turnover of trade establishments operating below the threshold levels were obtained on the basis of the total number of non-agricultural establishments for the year 1990, as available from the Economic Census of Non-agricultural Establishments (Summary Results for 1990). These establishments were divided into two classes - directory (which employ more than 5 hired workers) and non-directory (which employ 1 to 5 hired workers) trade establishments (DTEs and NDTEs) by using their proportions for the year 1980 derived on the basis of information available from the Economic Census of Non-Agricultural Establishments, 1980. The size distribution of DTEs and NDTEs in 1989-90 was estimated on the basis of their frequency distribution by different classes of annual gross turnover for the year 1985-86. The relevant data were abstracted from the publications of CSO, namely, the Survey of Directory Trade Establishments, 1985-86 (October-September), and the Survey of Non-Directory Trade Establishments, 1985-86 (July-June). The value of gross turnover for a size class was computed by multiplying the mid-point of the class interval by the frequency of that class. To adjust for inflation between 1985-86 and 1989-90, class limits and the values of gross turnover were inflated by the wholesale price index. The contribution to gross turnover of the units falling in classes Rs.0-5 lakh, Rs.5-10 lakh and Rs.10-30 lakh was estimated through linear interpolation separately for DTEs and NDTEs and then merged.
3! hor this purpose, the distribution of output relating to size class Rs.0-10 lakh was broken up in the ratio 3:1 to generate output for size classes Rs.0-5 lakh and Rs.5-10 lakh. The output for the size class Rs. 10-30 laid) was estimated by linear interpolation.
13
Revenue Implications ofAlternative VA T Rates and Derivation of Revenue Neutral Rates
Based on the merged distribution of gross turnover, shares of these three size classes in the total gross turnover were computed. These shares were applied to the estimated total gross turnover for the year 1990-91 to obtain gross turnover of these classes for that year. For this purpose, gross turnover for the year 1990-91 was estimated by inflating the gross turnover per establishment in the year 1985-86 at 1989-90 prices and multiplying the same by the number of non-agricultural establishments in the year 1989-90 as available from the Economic Census, 1990. Finally, the figures of turnover relating to the units below the threshold limits of Rs.5 lakh, Rs.10 lakh and Rs.30 lakh were obtained and are shown in line E(iii). Sales to final consumers by traders operating below the threshold of Rs.5 lakh were taken to be 50 per cent of their total sales, while 100 per cent of sales turnover of the traders with turnover above Rs.5 lakh was taken as sales to final consumers. Sales turnovers of the traders operating below the threshold limits of Rs.5 lakh, Rs.10 lakh and Rs.30 lakh, so obtained, are show in line F(iii).
As discussed earlier, raw materials used in the production of exempted goods and services or used by the exempted sectors have to be added to the final consumption expenditure to obtain the base under a VAT as no tax rebate would be allowable on such inputs. The values of taxable raw materials used in the production of category 1 services, category 2 services and construction were estimated by multiplying their output values by the input-output ratios of these sectors viz., 0.121, 0.251 and 0.472 respectively, and are reported in lines G(i) to G(iii). The input-output ratios were computed on the basis of input-output tables relating to the year 1989-90. Value of output of exempted goods accounts for 64.46 per cent of the value of total output of agricultural sector including forestry and fishing, that is Rs 186956 crore. Accordingly, taxable raw materials5 used in the production of exempted or home-grown goods were taken at 64.46 per cent of the taxable raw materials used in the production of all agricultural products including logging and fishing, and is reported in line G(iv). These are taken to be the same for all categories of dealers irrespective of their turnover thresholds.
In the case of taxable goods sold by units operating below the threshold limits, only the total value of raw materials rather than taxable raw materials could be estimated. For registered manufacturing establishments, the distribution of gross value added was also estimated for 1987-88 following the same analogy as used in obtaining the size class distribution of gross output. Value of raw materials used by a size class was computed as value of gross output minus gross value added. By using this
y. Taxable raw materials used in the production of exempted agricultural goods include chemical fertilisers, electricity and irrigation charges, pesticides and insecticides, and diesel oil. Value of these raw materials for the year 1990-91 was compiled from the National Accounts Statistics, 1993.
14
Revenue Implications ofAlternative VA T Rates and Derivation of Revenue Neutral Rates
distribution, the shares of units operating below the threshold limits in the total value of raw materials used were obtained. These shares were then applied to the total value of raw material used by the registered manufacturing units in the year 1990-91 to obtain the values of raw material used by the units operating below the threshold limits. The resulting figures are shown in line H(i).
For small scale non-factory units, the distribution of raw materials for the year 1987-88 was obtained by using the same method as used in estimating the size class distribution of gross output. The shares of units operating below the threshold limits in the total value of raw material were computed, and applied to the value of total raw material used by the small scale non-factory units in the year 1990-91 to obtain the corresponding values of raw material used by the units operating below the threshold limits. These are reported in line H(ii). In the same manner, the respective values of raw material used by traders operating below the threshold limits were obtained and are presented in line H(iii).
Gross fixed capital formation (GFCF) by the producers of exempted goods and services or by the exempted sectors had also to be added to the final consumption expenditure to obtain the VAT base as no tax rebate is allowable on such GFCF. The data on GFCF by the producers of services and exempted goods, contractors, the registered manufacturers, small scale non-factory units and traders were taken from National Accounts Statistics, CSO, 1993 for the year 1990-91. GFCF by the producers of exempted goods and services and by the contractors is reported in line I.
The values of GFCF by registered manufacturers operating in the turnover ranges of Rs. 0-5 lakh, Rs. 5-10 lakh and Rs. 10-30 lakh were taken respectively as 1.5 per cent, 1 per cent and 2.75 per cent of the total GFCF by all the registered manufacturers. Accordingly, the values of GFCF by registered manufacturers operating below the threshold limits of Rs 5 lakh, Rs 10 lakh and Rs 30 lakh were taken respectively as 1.5 per cent, 2.5 per cent and 5.25 per cent of the total GFCF and are reported in line J(i). GFCF by small scale non-factory units operating below a threshold limit was obtained by applying their share in gross output to the total GFCF by all the small scale non-factory units in the year 1990-91. These figures were computed for all the three threshold levels and are reported in line J(ii). The same procedure was followed for estimating the values of GFCF by traders operating below the threshold limits of Rs. 5 lakh, Rs. 10 lakh and Rs. 30 lakh and the ratios used respectively are 16.21 per cent, 27.66 per cent and 45.06 per cent. The estimates of GFCF relating to the traders are given in line J(iii).
15
Revenue Implications o f Alternative VAT Rates and Derivation of Revenue Neutral Rates
Another adjustment which had to be made in the final consumption expenditure relates to taxes embedded in the consumption base. Under a VAT system, the rate may be specified with reference to the base exclusive of the tax raised through the VAT. In the Study, a Central VAT is proposed to replace Union excise duties and CVD. Revenue raised through these taxes was Rs. 25427 crore in 1990-91, of which Rs. 5278 crore is to be raised through non-rebatable excises. So, the net revenue to be raised through Central VAT worked out to Rs. 20149 crore for 1990-91 and is shown in line K. State VAT, will replace revenue from GST, CST and ADEILST. Revenue raised through these taxes was Rs. 19129 crore in 1990-91 (vide line L).
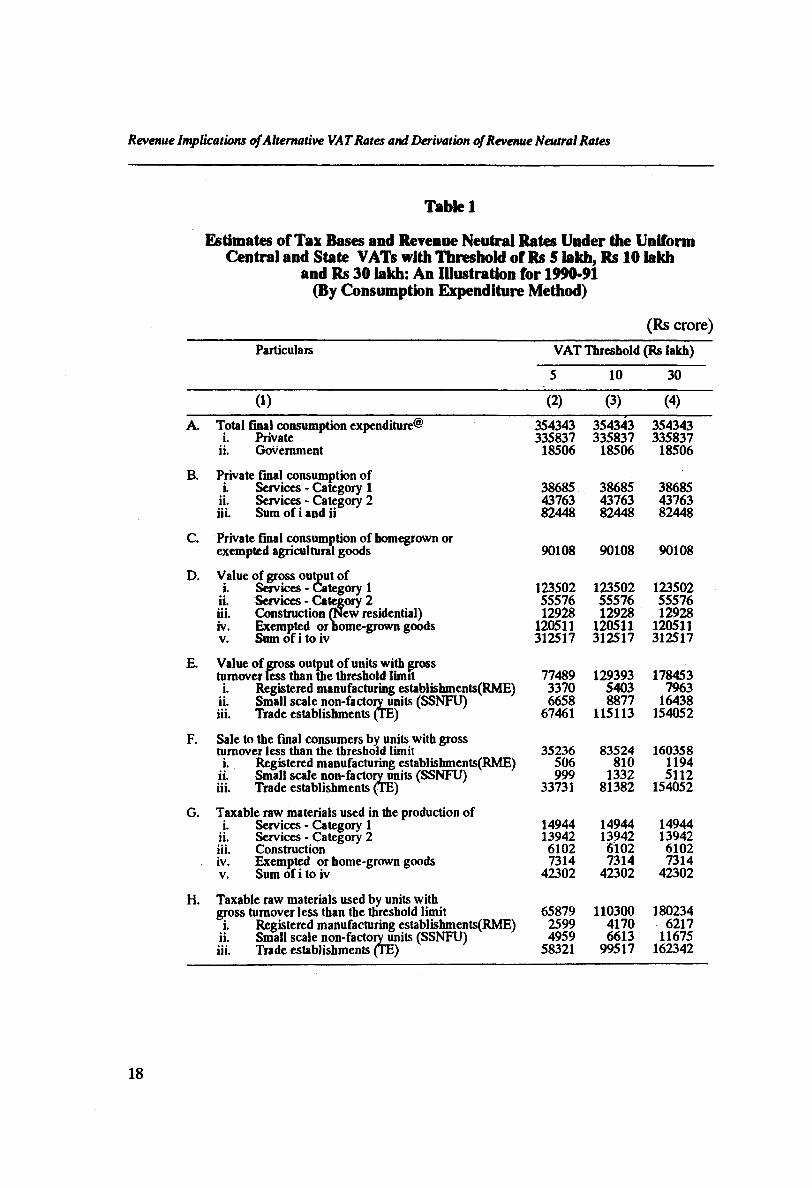
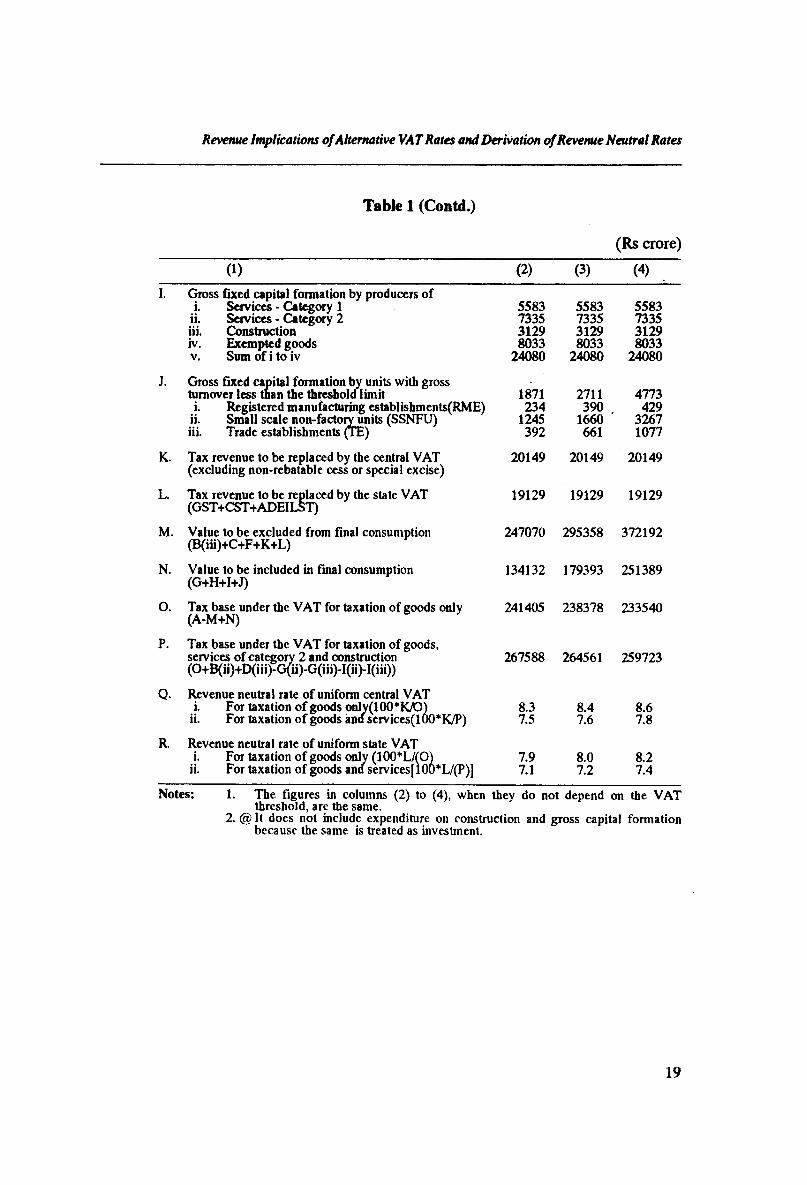
In computing the tax base under the Central VAT for taxation of goods only, the following items had to be excluded from the final consumption: (1) private final consumption of services vide line B(iii), (2) private final consumption of home-grown or exempted agricultural goods (line C), (3) sales to the final consumers by the units operating below the threshold limits (line F), (4) revenue to be replaced by the Central VAT (line K), and (5) revenue to be replaced by the State VAT (line L). Estimate of value of these items is given in line M. At the same time additions had to be made to the final consumption for (1) taxable raw materials used in production of services and exempted or home-grown goods (line G), (2) taxable raw materials used by units operating below the threshold limits (line H), (3) gross fixed capital formation by producers of services and exempted or home-grown goods (line I), and (4) gross fixed capital formation by units operating below the threshold limits (line J). Estimated value of these additions is given in line N. Tax base under the Central VAT for taxation of goods only was obtained by taking into account these adjustments as (A-M+N). This is reported in line O. This works out to Rs. 2,41,405 crore, Rs. 2,38,378 crore and Rs. 2,33,540 crore respectively for the threshold levels of Rs. 5 lakh, Rs. 10 lakh and Rs. 30 lakh. Incidentally, this implies that the tax base under VAT does not vary substantially with the variation in the threshold limit.
The base of the Central VAT for taxation of goods and services was obtained by adding to the tax base estimated above for taxation of goods only, the consumption of category 2 services B(ii) and expenditure *>n new residential construction D(iii), and by subtracting from it the value of raw materials used [G(ii) & G(iii)] and gross fixed capital formation [I(ii) & l(iii)] relating to these services and construction. The estimate of tax base for Central VAT for taxation of goods and services is shown in line P.
16
Revenue Implications o f Alternative VAT Rates and Derivation of Revenue Neutral Rates
Given the revenue to be raised through the Central VAT and the tax bases, revenue neutral rates of uniform Central VAT for the year 1990-91 were obtained and are reported in lines Q(i) and Q(ii) respectively for taxation of goods only, and for taxation of goods and services.
Given the revenue to be raised through the State VAT and the same tax bases as for the Central VAT, revenue neutral rates of uniform State VAT with alternative threshold limits were computed for the year 1990-91 and are presented in line R.
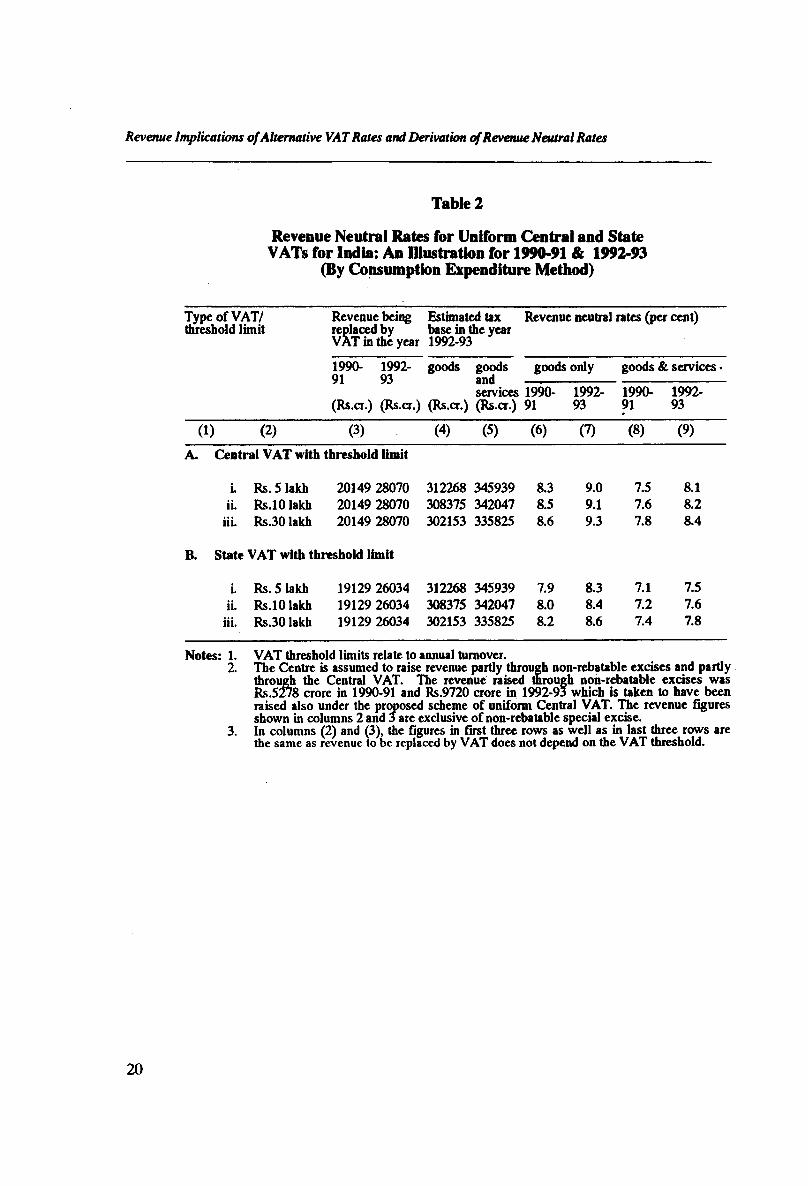
Revenue neutral rates for both the Central and the State VATs were also estimated for 1992-93 based on the projections of tax bases and budget estimates of yield of these taxes in the year 1992-93. The information relating to the tax bases for the year in question was available from the cross quick estimates of final consumption6 expenditure available at the all-India level only. Therefore, for projecting the tax base for 1992-93 the ratio of the tax base to the final consumption for the year 1990-91 was applied to the total final consumption expenditure for the year 1992-93. Using the projected tax bases and the revenue to be replaced by the Central and the State VATs, revenue neutral rates for the year 1992-93 were obtained and are given in Table 2. For purposes of comparison, revenue neutral rates relating to the year 1990-91 are also presented in Table 2.
From Table 2, it will be seen that with a uniform Central VAT (for taxation of goods only) extending to the retail level, a tax rate of about 8.5 per cent could be revenue neutral in 1990-91 (Column 6) and about 9.1 per cent could be revenue neutral in 1992-93 (column 7). Bringing the Category 2 services in the ambit of Central VAT could help to reduce the revenue neutral rate by about 0.9 percentage point in both the years 1990-91 (columns 6 and 8) and 1992-93 (columns 7 and 9). These findings are supported also by the pattern of revenue neutral rates for a uniform State VAT (columns 6 to 9). The revenue neutral rate for a uniform State VAT (with taxation of goods only) works out to about 8.0 and 8.4 per cent respectively for the years 1990-91 and 1992-93. Inclusion of services in the tax base reduces the revenue neutral rate of uniform State VAT by about 0.8 percentage point in both the years.
Conceptually, in deriving this ratio, final consumption should be taken to be net of Central and State taxes being replaced by VATs. However, this can not be done at the State level as the distribution of Union excise duties by States is not known. Therefore, final consumption gross of Central and State taxes has been used both at the all-India and State levels in deriving the ratio under consideration, and this has been used appropriately.
17
Revenue Implications ofAlternative VA T Rates and Derivation of Revenue Neutral Rates
Table 1
Estimates of Tax Bases and Revenue Neutral Rates Under the Uniform Central and State VATs with Threshold of Rs 5 lakh, Rs 10 lakh
and Rs 30 lakh: An Illustration for 1990-91 (By Consumption Expenditure Method)
(Rs crore)Particulars VAT Threshold (Rs lakh)
5 10 30
0 ) (2) (3) (4)A. Total final consumption expenditure®
i. Privateii. Government
354343335837
18506
354343335837
18506
354343335837
18506
B. Private final consumption ofi. Services - Category 1
ii. Services - Category 2iii. Sum of i and ii
386854376382448
386854376382448
386854376382448
C. Private final consumption of homegrown or exempted agricultural goods
D. Value of gross output ofi. Services - Category 1
ii. Services • Category 2iii. Construction (New residential)iv. Exempted or nome-grown goodsv. Sum of i to iv
90108 90108 90108
1235025557612928
120511312517
1235025557612928
120511312517
1235025557612928
120511312517
E. Value o f gross output of units with grossturnover less than the threshold limit 77489 129393 178453
i. Registered manufacturing establishments(RME) 3370 5403 7963ii. Small scale non-factory units (SSNFU) 6658 8877 16438iii. Trade establishments (TE) 67461 115113 154052
F. Sale to the final consumers by units with grossturnover less than the threshold limit 35236 83524 160358
i. Registered manufacturing establishments(RME) 506 810 1194ii. Small scale non-factory units (SSNFU) 999 1332 5112iii. Trade establishments (TE) 33731 81382 154052
G. Taxable raw materials used in the production ofi. Services - Category 1 14944 14944 14944
ii. Services - Category 2 13942 13942 13942iii. Construction 6102 6102 6102iv. Exempted or home-grown goods 7314 7314 7314v. Sum of i to iv 42302 42302 42302
H. Taxable raw materials used by units withgross turnover less than the threshold limit 65879 110300 180234
i. Registered manufacturing establishments(RME) 2599 4170 6217ii. Small scale non-factory units (SSNFU) 4959 6613 11675iii. Trade establishments (TE) 58321 99517 162342
18
Revenue Implications ofAlternative VAT Rata and Derivation of Revenue Neutral Rates
Table 1 (Contd.)
(Rs crore)
0) (2) (3) (4)
K.
L.
M.
N.
O.
P.
Q.
R.
Gross fixed capital formation by producers ofi. Services - Category 1
ii. Services - Category 2iii. Constructioniv. Exempted goodsv. Sum of i to iv
Gross fixed capital formation by units with gross turnover less than the threshold limiti. Registered manufacturing establishments(RME)
ii. Small scale non-factory units (SSNFU)iii. Trade establishments (TE)
Tax revenue to be replaced by the centra] VAT (excluding non-rebatable cess or special excise)
Tax revenue to be replaced by the state (GST+CST+ADEILST)
VAT
Value to be excluded from final consumption (B(iii)+C+F+K+L)
Value to be included in final consumption (G+H+I+J)
Tax base under the VAT for taxation of goods only (A-M+N)
Tax base under the VAT for taxation of goods, services of category 2 and construction (0+B(ii)+D(iii)-G(ii)-G(iii)-I(ii)-I(iii))
Revenue neutral rate of uniform central VATi. For taxation of goods onlv(100*K/0)
ii. For taxation of goods ana services(luO*K/P)
Revenue neutral rate of uniform state VATi. For taxation of goods only (100*L/(0)
ii. For taxation of goods ana services[iOO*L/(P)]
5583733531298033
24080
5583733531298033
24080
5583733531298033
24080
1871234
1245392
2711390
1660661
4773429
32671077
20149 20149 20149
19129 19129 19129
247070 295358 372192
134132 179393 251389
241405 238378 233540
267588 264561 259723
8.37.5
8.47.6
8.67.8
7.97.1
8.07.2
8.27.4
Notes: 1. The figures in columns (2) to (4), when they do not depend on the VATthreshold, are the same.
2. @ It does not include expenditure on construction and gross capital formation because the same is treated as investment.
19
Revenue Implications o f Alternative VAT Rates and Derivation ofRevenue Neutral Rates
Table 2
Revenue Neutral Rates for Uniform Central and State VATs for India: An Illustration for 1990-91 & 1992-93
(By Consumption Expenditure Method)
Type of VAT/ threshold limit
Revenue being Estimated tax replaced by base in the year VAT in the year 1992-93
Revenue neutral rates (per cent)
1990- 1992- 91 93
(Rs.cr.) (Rs.cr.)
goods
(Rs.cr.)
goods goods onlyand — ------------------services 1990- 1992- (Rs.cr.) 91 93
goods & services •
1990- 1992- 91 93
(1) (2) (3) (4) (5) (6) (7) (8) (9)A. Central VAT with threshold limit
i. Rs. 5 lakh 20149 28070 312268 345939 8.3 9.0 7.5 8.1ii. Rs.10 lakh 20149 28070 308375 342047 8.5 9.1 7.6 8.2
iii. Rs.30 lakh 20149 28070 302153 335825 8.6 9.3 7.8 8.4
B. State VAT with threshold limit
i. Rs. 5 lakh 19129 26034 312268 345939 7.9 8.3 7.1 7.5ii. Rs.10 lakh 19129 26034 308375 342047 8.0 8.4 7.2 7.6
iii. Rs.30 lakh 19129 26034 302153 335825 8.2 8.6 7.4 7.8
Notes: 1. VAT threshold limits relate to annual turnover.2. The Centre is assumed to raise revenue partly through non-rebatable excises and partly
through the Central VAT. The revenue raised through non-rebatable excises was Rs.5z78 crore in 1990-91 and Rs.9720 crore in 1992-93 which is taken to have been raised also under the proposed scheme of uniform Central VAT. The revenue figures shown in columns 2 and 3 are exclusive of non-rebatable special excise.
3. In columns (2) and (3), the figures in first three rows as well as in last three rows are the same as revenue to be replaced by VAT does not depend on the VAT threshold.
20
Revenue Implications of Alternative VAT Rates and Derivation of Revenue Neutral Rates
b. Revenue Neutral VAT Rates for Individual States
At the State level, the methodology used to derive the revenue neutral VAT rates is broadly the same as that followed for estimating revenue neutral rates at the
consumption of exempted or home-grown goods, consumption of services and tax revenue to be replaced by the State VATs. Also, for State VATs threshold level of only Rs. 5 lakh was considered. For individual States, the tax base is taken to be inclusive of Central VAT.
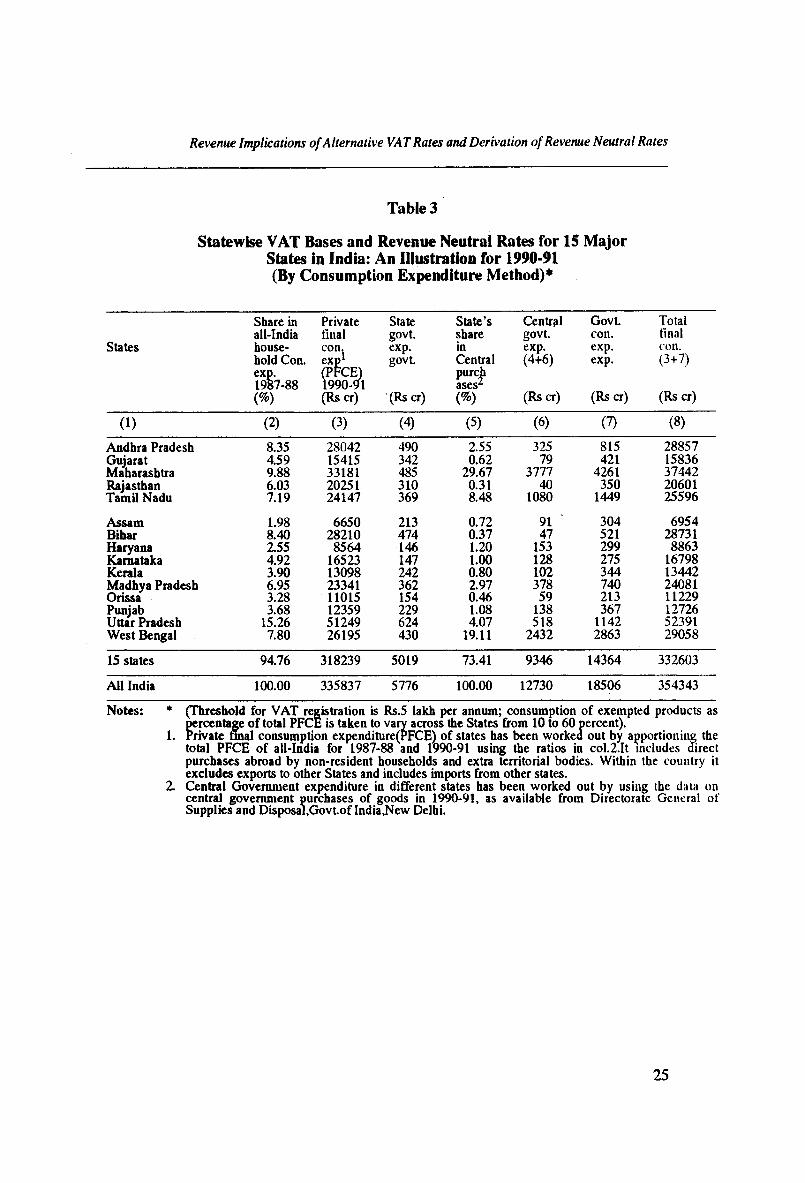
The data on statewise consumption expenditure were however not readily available. These were obtained by distributing among the States, the all-India private and government final consumption expenditures for 1990-91 for which the data as given in the National Accounts Statistics (NAS), CSO, 1993 were used. The figures of statewise private final consumption expenditure were computed by multiplying the all-India figure by the shares of different states in total household consumption expenditure for the year 1987-88. The requisite data on statewise household consumption expenditure were taken from the survey results reported by National Sample Survey Organisation (vide Sarvekshana, July-September 1991). Shares of states in total household consumption expenditure in the year 1987-88 are given in column 2 while the statewise private final consumption expenditure is given in column 3 of Table 3.
Government consumption expenditure consists of two components viz. purchases made by the State governments and those by the Central government. For the former, statewise unpublished data obtained from CSO were used (for a period of 10 years, from 1980-81 to 1989-90). Based on these, expenditures of state governments were projected for the year 1990-91. Regarding the consumption expenditure of the Central government, the data on statewise purchases of the Centre in the year 1990-91 were obtained from the Directorate General of Supplies and Disposal (DGS&D)7. Total government consumption expenditure of a given State was obtained by adding these two components. Using these data, the shares of different States in the total government consumption expenditure were arrived at. Finally, the Statewise figures of government final consumption expenditure were obtained by multiplying the shares of States so computed by the all-India government final consumption expenditure given in NAS.
T. The IXiS&D data when added up over all States and UTs, do not conform to the respective all-Indiafigure as given in the National Accounts Statistics because of incomplete coverage of the former. So the DGS&D data for different States were revised upwards on a pro-rata basis so as to make the aggregate of all States and UTs consistent with the all-India figure.
national level. A few modifications were made which pertain to the tax base,
13&- /;M " 9 |
21
Revenue Implications o f Alternative VAT Rates and Derivation of Revenue Neutral Rates
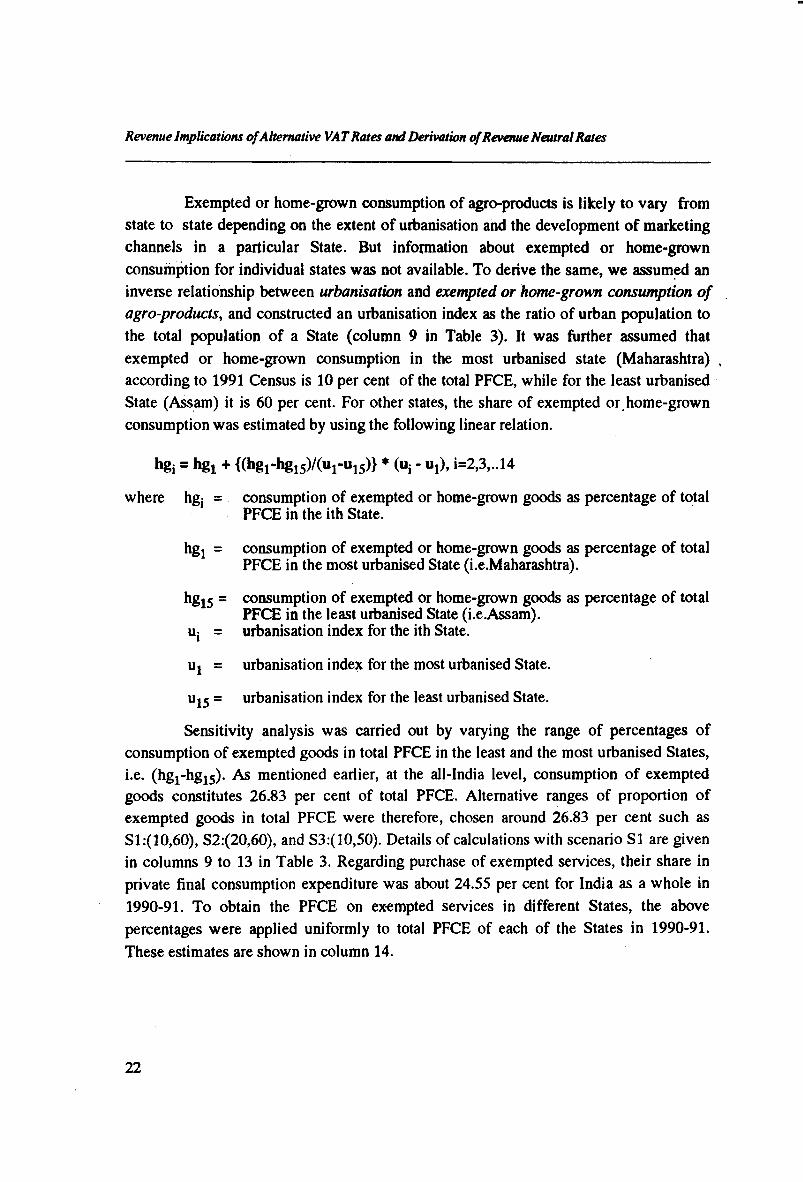
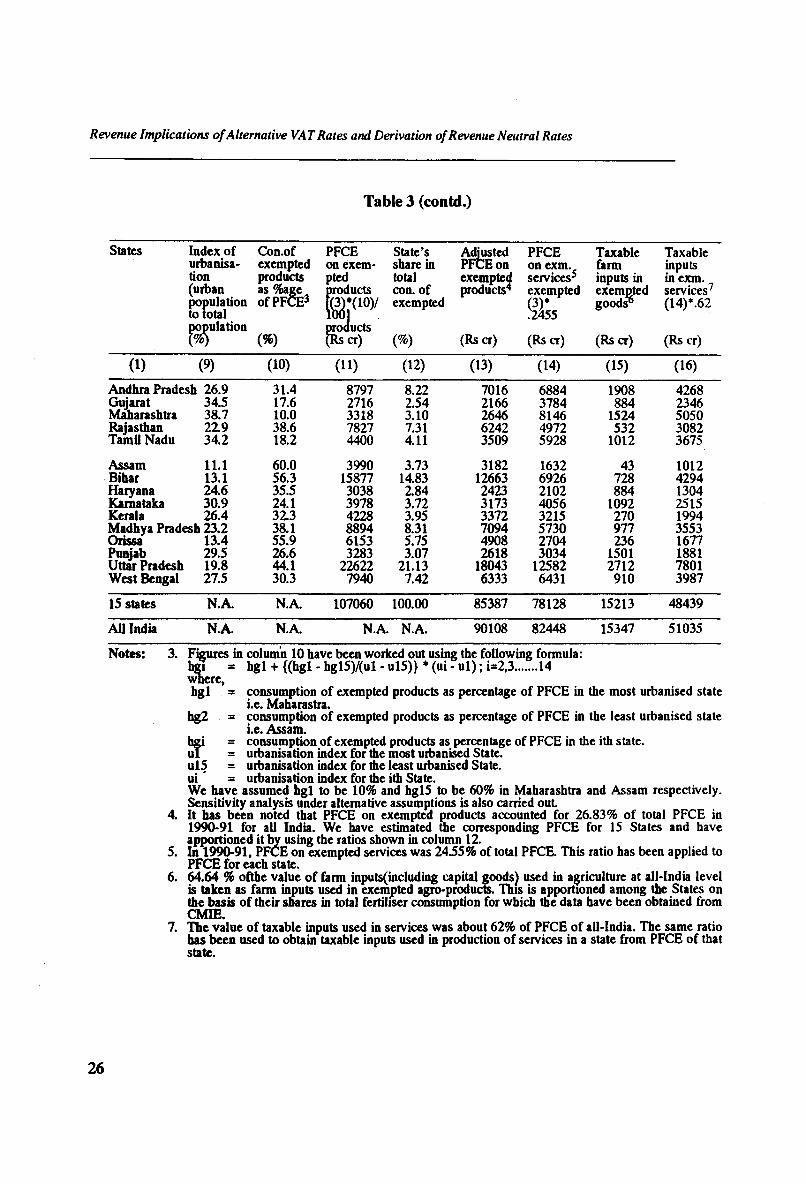
Exempted or home-grown consumption of agro-products is likely to vary from state to state depending on the extent of urbanisation and the development of marketing channels in a particular State. But information about exempted or home-grown consumption for individual states was not available. To derive the same, we assumed an inverse relationship between urbanisation and exempted or home-grown consumption o f agro-products, and constructed an urbanisation index as the ratio of urban population to the total population of a State (column 9 in Table 3). It was further assumed that exempted or home-grown consumption in the most urbanised state (Maharashtra) according to 1991 Census is 10 per cent of the total PFCE, while for the least urbanised State (Assam) it is 60 per cent. For other states, the share of exempted or home-grown consumption was estimated by using the following linear relation.
hgj = hgt + {(hgj-hg^/O ij-u^)} * (Uj - uj), i=2,3,..14
where hgj = consumption of exempted or home-grown goods as percentage of total PFCE in the ith State.
hgj = consumption of exempted or home-grown goods as percentage of total PFCE in the most urbanised State (i.e.Maharashtra).
hg15 = consumption of exempted or home-grown goods as percentage of total PFCE in the least urbanised State (i.e.Assam).
Uj = urbanisation index for the ith State.
Uj = urbanisation index for the most urbanised State.
Uj5 = urbanisation index for the least urbanised State.
Sensitivity analysis was carried out by varying the range of percentages of consumption of exempted goods in total PFCE in the least and the most urbanised States,i.e. (hg1-hg15). As mentioned earlier, at the all-India level, consumption of exempted goods constitutes 26.83 per cent of total PFCE. Alternative ranges of proportion of exempted goods in total PFCE were therefore, chosen around 26.83 per cent such as Sl:(10,60), S2:(20,60), and S3:(10,50). Details of calculations with scenario SI are given in columns 9 to 13 in Table 3. Regarding purchase of exempted services, their share in private final consumption expenditure was about 24.55 per cent for India as a whole in 1990-91. To obtain the PFCE on exempted services in different States, the above percentages were applied uniformly to total PFCE of each of the States in 1990-91. These estimates are shown in column 14.
22
Revenue Implications of Alternative VAT Rates and Derivation of Revenue Neutral Rates
As for the value of taxable inputs used in exempted or home-grown products, fertilisers being the most important item, the all-India figure of such inputs as worked out in the case of Central VAT was apportioned among the States on the basis of their shares in total fertiliser consumption for which information could be obtained from CMIE. These are reported in column 15 of Table 3. The State-wise values of tax-paid inputs used in exempted services were estimated on a pro-rata basis using the all-India input-output ratios relating to services and are shown in column 16.
For units which would fall below the VAT threshold of Rs.5 lakh per annum, use was made of distribution of output and inputs available from ASI for 1988-89 and Trade Survey of Directory Establishments for 1985-86. At the all-India level, however, similar data were available for 1990-91. Using these details, Statewise results for 1990-91 were derived in the same way as adopted for the estimation of the Central VAT base. The outcome of these calculations relating to registered manufacturing and small scale non-factory sector is presented in columns 17 to 20 of Table 3.
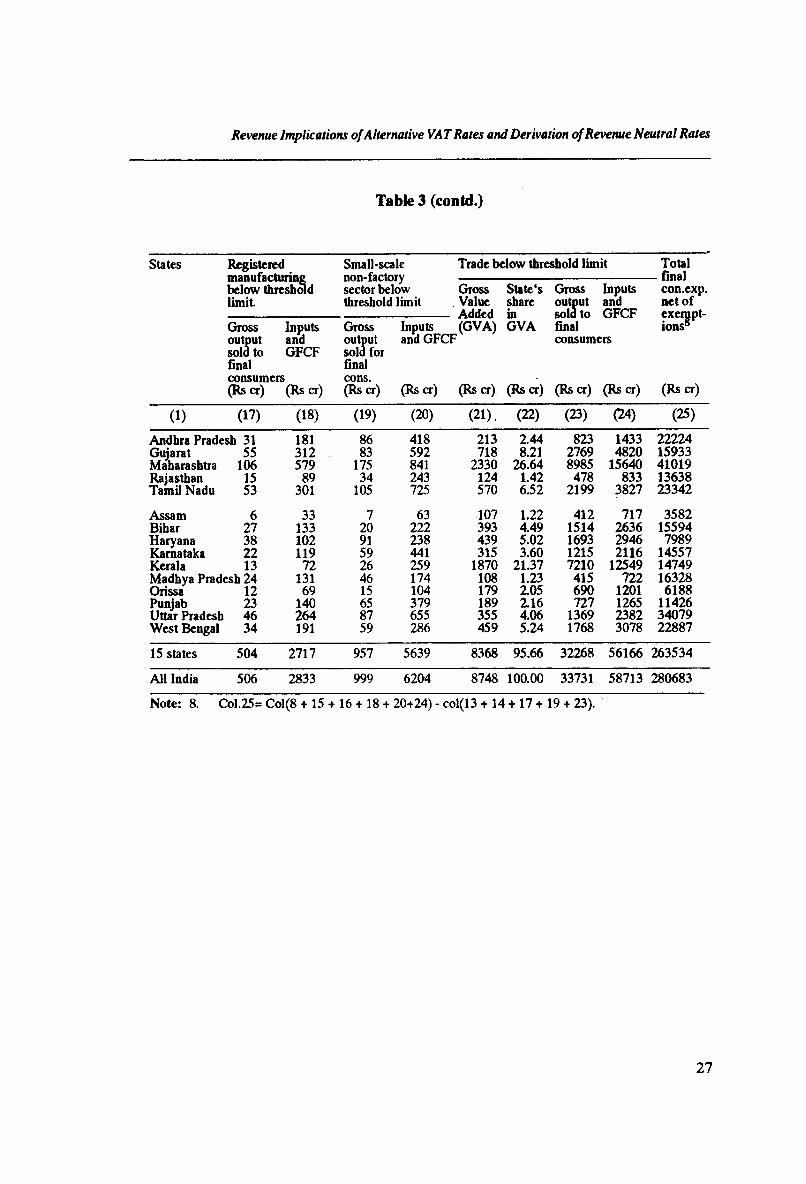
In the case of trade sector, the value of gross output sold to final consumers and inputs (including GFCF), at all-India level, as derived earlier, were apportioned among the States by using their shares in gross value added for which data could be obtained from NAS. The State-wise estimates are given in columns 23 and 24. Total final consumption expenditure net of all exemptions and inclusions relating to taxable inputs used in production of exempted goods and services and gross fixed capital formation by their producers is given in column 25.
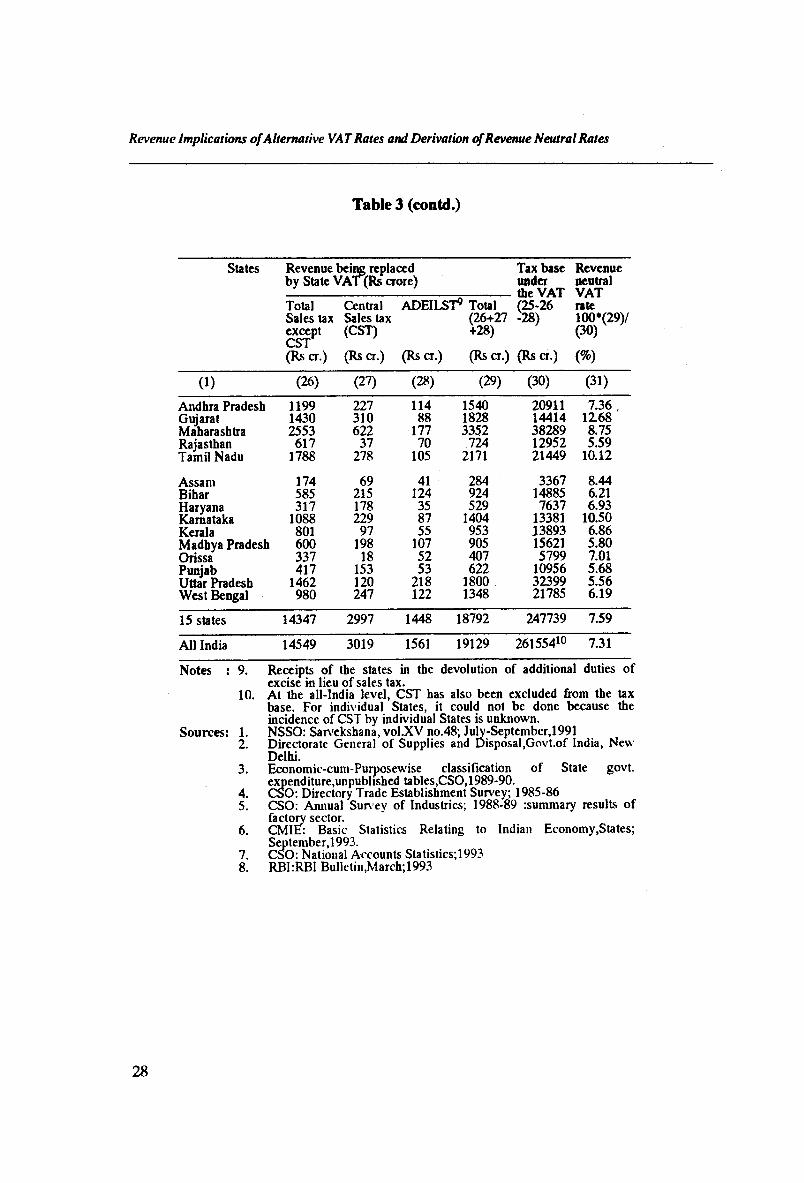
Finally, the VAT base for a State was obtained by subtracting from the net final consumption expenditure computed above, the amount of revenue raised by the State from GST and tax devolution of ADEILST, and is reported in column 30. Tax on inter-State sales (CST) paid by residents of a given state was not deducted, though logically it should be, because the incidence of CST on final consumption by States is unknown. The revenue neutral rates were worked out by dividing the total amount of revenue raised from GST, CST and tax devolution from ADEILST by the tax base of that State. The results for scenario Sl(10,60) are presented in column 31. The revenue neutral rates for the scenarios S2(20,60) and S3(10,50) were also worked out. These do not differ appreciably from those for the scenario Sl(10,60).
23
Revenue Implications o f Alternative VAT Rates and Derivation of Revenue Neutral Rates
From Table 3, it may be noted that there is a substantial variation in the revenue neutral VAT rate across the States. The rates for Gujarat, Karnataka and Tamil Nadu are above 10 per cent while those for Bihar, Haryana, Kerala, Madhya Pradesh, Punjab, Rajasthan, Uttar Pradesh and West Bengal are below 7 per cent.
Computations of revenue neutral VAT rates for 1992-93 are given in Table 4. For 1992-93, the only available information relating to the tax base was the CSO’s quick estimate of total final consumption expenditure, at the all-India level (CSO, February 1994). Consumption expenditure of a State for 1992-93 was jcomputed from all-India consumption expenditure by multiplying it by the share of the State in all-India consumption expenditure in 1990-91. Statewise consumption expenditure figures thus obtained are given in column 2 of Table 4. Consumption expenditure net of exemptions and inclusions was then obtained for 1992-93 by multiplying the ratio of the former to the latter for* the year 1990-91 by the value of final consumption in 1992-93. These estimates have been obtained separately for the three scenarios, Sl(10,60), S2(20,60) and S3(10,50) and are reported in columns 3 to 5. The corresponding tax bases were obtained by subtracting sales tax and ADEILST from the net consumption expenditure so computed, and are given in columns 7 to 9. Finally, revenue from taxes to be replaced by VAT in 1992-93 is shown in column 10. Revenue neutral VAT rates are given in columns 11 to 13.
From Table 4, it would be noted that there is little variation in the revenue neutral VAT rate for a State across the three scenarios considered.
4.2 Estimates by Tax Turnover Approach
This sub-section describes step-by-step computation of VAT base, yield of a VAT regime and revenue neutral rate for a given State by using the tax turnover approach. Revenue implications of the selected tax regimes including the regimes (4,12,20) and (5,14,25) are explored. This exercise is done for five major States for which some of the requisite data could be obtained within the time available. These States are: Andhra Pradesh, Gujarat, Maharashtra, Rajasthan and Tamil Nadu. The computations relating to revenue estimates based on the basic set of assumptions are explained in Tables 5 to 9 respectively for Andhra Pradesh, Gujarat, Maharashtra, Rajasthan and Tamil Nadu. The basic assumptions and other related statistics are set out below.
24
Revenue Implications of Alternative VAT Rates and Derivation of Revenue Neutral Rates
Table 3
Statewise VAT Bases and Revenue Neutral Rates for 15 Major States in India: An Illustration for 1990-91 (By Consumption Expenditure Method)*
States
Share in all-India household Con. exp. 1987-88 (%)
Privatefinalcon.exp1(PFCE)1990-91(Rs a )
Stategovt.exp.govt.
(Rs cr)
State’sshareinCentralpurchasesz(%)
Centrplgovt.exp.(4+6)
(Rs cr)
Govt.con.exp.exp.
(Rs cr)
Totalfinalcon.(3+7)
(Rs cr)
(1) (2) (3) (4) (5) (6) (7) (8)
Andhra Pradesh 8.35 28042 490 2.55 325 815 28857Gujarat 4.59 15415 342 0.62 79 421 15836Maharashtra 9.88 33181 485 29.67 3777 4261 37442Rajasthan 6.03 20251 310 0.31 40 350 20601Tamil Nadu 7.19 24147 369 8.48 1080 1449 25596
Assam 1.98 6650 213 0.72 91 304 6954Bihar 8.40 28210 474 0.37 47 521 28731Haryana 2.55 8564 146 1.20 153 299 8863Karnataka 4.92 16523 147 1.00 128 275 16798Kerala 3.90 13098 242 0.80 102 344 13442Madhya Pradesh 6.95 23341 362 2.97 378 740 24081Orissa 3.28 11015 154 0.46 59 213 11229Punjab 3.68 12359 229 1.08 138 367 12726Uttar Pradesh 15.26 51249 624 4.07 518 1142 52391West Bengal 7.80 26195 430 19.11 2432 2863 29058
IS states 94.76 318239 5019 73.41 9346 14364 332603
All India 100.00 335837 5776 100.00 12730 18506 354343
Notes: * (Threshold for VAT registration is Rs.5 lakh per annum; consumption of exempted products aspercentage of total PFCE is taken to vary across the States from 10 to 60 percent).
1. Private final consumption expenditure(PFCE) of states has been worked out by apportioning the total PFCE of all-India for 1987-88 and 1990-91 using the ratios in col.2.It includes direct purchases abroad by non-resident households and extra territorial bodies. Within the country it excludes exports to other States and includes imports from other states.
2. Central Government expenditure in different states has been worked out by using the data on central government purchases of goods in 1990-91, as available from Directorate General of Supplies and Disposal,Govt.of India,New Delhi.
25
Revenue Implications of Alternative VAT Rates and Derivation of Revenue Neutral Rates
Table 3 (contd.)
States Index of urbanisation (urban population to total jrajnilation
Con.of exempted products as %age of PFCE3
PFCE on exemptedproducts
products (Rs cr)
State’s share in total con. of exempted
(%)
Adjusted PFCE on exempted products4
PFCE on exm. services5 exempted (3)*.2455
Taxable farm inputs in exempted goods6
Taxable inputs in exm. services7 (14)*.62
(Rs cr) (Rs cr) (Rs cr) (Rs cr)
(1) (9) (10) (11) (12) (13) (14) (15) (16)
Andhra Pradesh 26.9 31.4 8797 8.22 7016 6884 1908 4268Gujarat 34.5 17.6 2716 2.54 2166 3784 884 2346Maharashtra 38.7 10.0 3318 3.10 2646 8146 1524 5050Rajasthan 22.9 38.6 7827 7.31 6242 4972 532 3082Tamil Nadu 34.2 18.2 4400 4.11 3509 5928 1012 3675
Assam 11.1 60.0 3990 3.73 3182 1632 43 1012Bihar 13.1 56.3 15877 14.83 12663 6926 728 4294Haryana 24.6 35.5 3038 2.84 2423 2102 884 1304Karnataka 30.9 24.1 3978 3.72 3173 4056 1092 2515Kerala 26.4 32.3 4228 3.95 3372 3215 270 1994Madhya Pradesh 23.2 38.1 8894 8.31 7094 5730 977 3553Orissa 13.4 55.9 6153 5.75 4908 2704 236 1677Punjab 29.5 26.6 3283 3.07 2618 3034 1501 1881Uttar Pradesh 19.8 44.1 22622 21.13 18043 12582 2712 7801West Bengal 27.5 30.3 7940 7.42 6333 6431 910 3987
15 states N.A. N.A. 107060 100.00 85387 78128 15213 48439
All India N.A. N.A. N.A. N.A. 90108 82448 15347 51035
Notes: 3. Figures in column 10 have been worked out using the following bgi = hg l + {(hgl - hg!5)/(ul - u!5)} * (ui - u l ) ; i=2,3......
formula:.14
wnere, hgl consumption of exempted products as percentage of PFCE in the most urbanised state
i.e. Maharastra.hg2 = consumption of exempted products as percentage of PFCE in the least urbanised state
i.e. Assam.hgi = consumption of exempted products as percentage of PFCE in the ith state,u l = urbanisation index for the most urbanised State.u l5 = urbanisation index for the least urbanised State,ui ' = urbanisation index for the ith State.We have assumed hgl to be 10% and hgl5 to be 60% in Maharashtra and Assam respectively.Sensitivity analysis under alternative assumptions is also carried out.It has been noted that PFCE on exempted products accounted for 26.83% of total PFCE in1990-91 for all India. We have estimated the corresponding PFCE for 15 States and have
5.
6.
7.
apportioned it by using the ratios shown in column 12. In 1990-91, PFCE on ejexempted services was 24.55% of total PFCE. This ratio has been applied to PFCE for each state.64.64 % ofthe value of farm inputs(includuig capital goods) used in agriculture at all-India level is taken as farm inputs used in exempted agro-products. This is apportioned among the States on the basis of their shares in total fertiliser consumption for which the data have been obtained from CMIE.The value of taxable inputs used in services was about 62% of PFCE of all-India. The same ratio has been used to obtain taxable inputs used in production of services in a state from PFCE of that state.
26
Revenue Implications of Alternative VAT Rates and Derivation of Revenue Neutral Rates
Table 3 (contd.)
States Registered manufacturing below threshold limit.
Small-scale non-factory sector below threshold limit
Trade below threshold limit Totalfinal
GrossValueAdded(GVA)
(Rs cr)
State'sshareinGVA
(Rs cr)
Gross Inputs output and sold to GFCF finalconsumers
(Rs cr) (Rs cr)
con.exp. net of exemptions®
(Rs cr)
Gross Inputs output and sold to GFCF finalconsumers (Rs cr) (Rs cr)
Gross output sola for final cons. (Rs cr)
Inputs and GFCF
(Rs cr)
(1) (17) (18) (19) (20) (21), (22) (23) (24) (25)
Andhra Pradesh 31 181 86 418 213 2.44 823 1433 22224Gujarat 55 312 83 592 718 8.21 2769 4820 15933Maharashtra 106 579 175 841 2330 26.64 8985 15640 41019Rajasthan 15 89 34 243 124 1.42 478 833 13638Tamil Nadu 53 301 105 725 570 6.52 2199 3827 23342
Assam 6 33 7 63 107 1.22 412 717 3582Bihar 27 133 20 222 393 4.49 1514 2636 15594Haryana 38 102 91 238 439 5.02 1693 2946 7989Karnataka 22 119 59 441 315 3.60 1215 2116 14557Kerala 13 72 26 259 1870 21.37 7210 12549 14749Madhva Pradesh 24 131 46 174 108 1.23 415 722 16328Orissa 12 69 15 104 179 2.05 690 1201 6188Punjab 23 140 65 379 189 2.16 727 1265 11426Uttar Pradesh 46 264 87 655 355 4.06 1369 2382 34079West Bengal 34 191 59 286 459 5.24 1768 3078 22887
15 states 504 2717 957 5639 8368 95.66 32268 56166 263534
All India 506 2833 999 6204 8748 100.00 33731 58713 280683
Note: 8. Col.25= Col(8 + 15 + 16 + 18 + 20+24) - col(13 + 14 + 17 + 19 + 23).
27
Revenue Implications ofAlternative VAT Rates and Derivation of Revenue Neutral Rates
Table 3 (contd.)
States Revenue being replaced by State VAT (Rs crore)
Tax base wider
Revenueneutral
Total Sales tax except CST (Rs cr.)
Central Sales tax (CST)
(Rs cr.)
ADEILST9 Total (26+27 +28)
(Rs a . ) (Rs a .)
(25-26-28)
(Rs cr.)
rate100*(29)/(30)
(%)
(1) (26) (27) (28) (29) (30) (31)
Andhra Pradesh 1199 227 114 1540 20911 7.36 .Gujarat 1430 310 88 1828 14414 12.68Maharashtra 2553 622 177 3352 38289 8.75Rajasthan 617 37 70 724 12952 5.59Tamil Nadu 1788 278 105 2171 21449 10.12
Assam 174 69 41 284 3367 8.44Bihar 585 215 124 924 14885 6.21Haryana 317 178 35 529 7637 6.93Karnataka 1088 229 87 1404 13381 10.50Kerala 801 97 55 953 J3893 6.86Madhya Pradesh 600 198 107 905 15621 5.80Orissa 337 18 52 407 5799 7.01Punjab 417 153 53 622 10956 5.68Uttar Pradesh 1462 120 218 1800 32399 5.56West Bengal 980 247 122 1348 21785 6.19
IS states 14347 2997 1448 18792 247739 7.59
All India 14549 3019 1561 19129 26155410 7.31
Notes : 9. Receipts of the states in the devolution of additional duties ofexcise in lieu of sales tax.
10. At the all-India level, CST has also been excluded from the taxbase. For individual States, it could not be done because the incidencc of CST by individual States is unknown.
Sources: 1. NSSO: Sarvekshana, vol.XV no.48; July-September,19912. Directorate General of Supplies and Disposal,Govt.of India, New
Delhi.3. Economic-cum-Purposewise classification of State govt,
expenditure,unpublished tables.CSO,1989-90.4. CSO: Directory Trade Establishment Survey; 1985-865. CSO: Annual Survey of Industries; 1988-89 :summary results of
factory sector.6. CMIE: Basic Statistics Relating to Indian Economy,States;
September,1993.7. CSO: National Accounts Statistics;!9938. RBI-.RBI Bulletin,March;1993
28
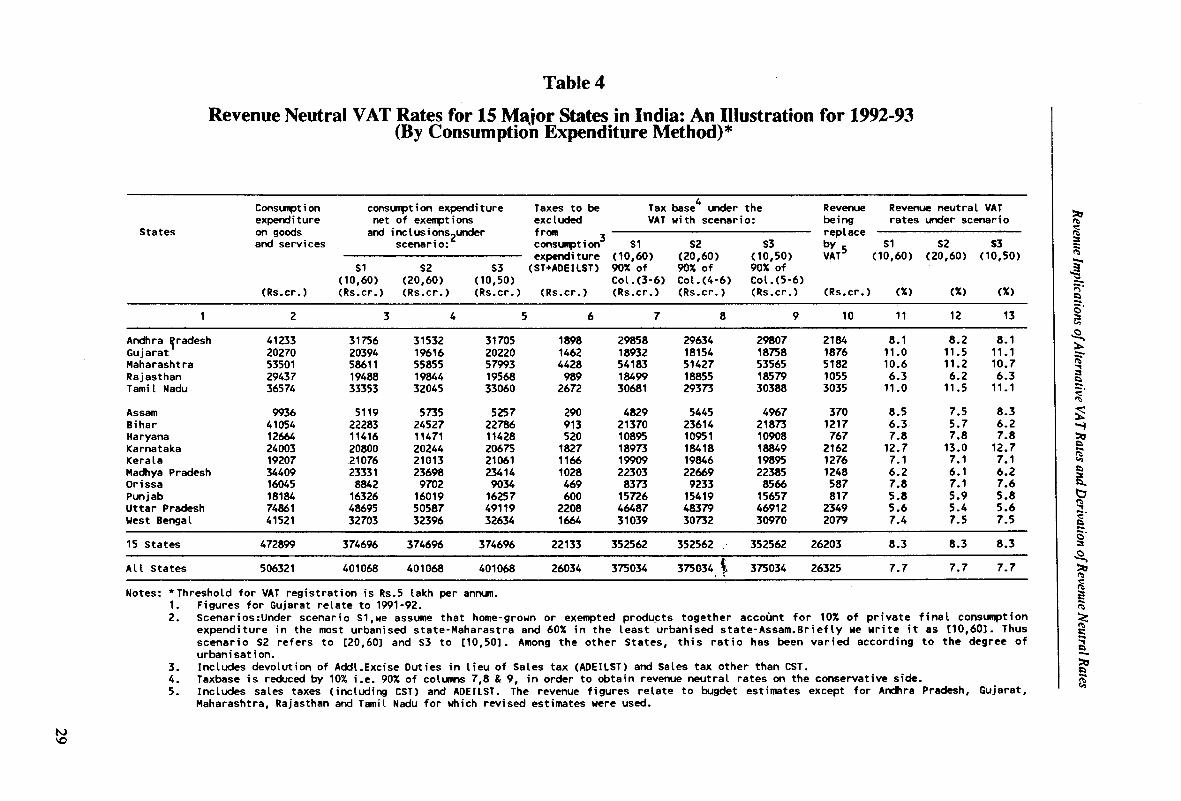
Table 4
Revenue Neutral VAT Rates for 15 Major States in India: An Illustration for 1992-93(By Consumption Expenditure Method)*
Consumpt i on consumption expenditure Taxes to be Tax base^ under the Revenue Revenue neutral VATexpendi ture net of exemptions excluded VAT with scenario: being rates under scenario
States on goods and i ncIus i ons,under from _ - replaceand services scenario: consumpt i on S1 S2 S3 by 5 S1 S2 S3
expendi ture (10,60) (20,60) (10,50) VAT (10,60) (20,60) (10,50)S1 S2 S3 (ST+ADEILST) 90% of 90% of 90% of
(10,60) (20,60) (10,50) Col.(3-6) Col.(4-6) Col.(5-6)(Rs.cr.) (Rs.cr.) (Rs.cr.) (Rs.cr.) (Rs.cr.) (Rs.cr.) (Rs.cr.) (Rs.cr.) (Rs.cr.) (%) (%) (%)
1 2 3 4 5 6 7 8 9 10 11 12 13
Andhra ^radesh 41233 31756 31532 31705 1898 29858 29634 29807 2184 8.1 8.2 8.1Gujarat 20270 20394 19616 20220 1462 18932 18154 18758 1876 11.0 11.5 11.1Maharashtra 53501 58611 55855 57993 4428 54183 51427 53565 5182 10.6 11.2 10.7Rajasthan 29437 19488 19844 19568 989 18499 18855 18579 1055 6.3 6.2 6.3Tami I Nadu 36574 33353 32045 33060 2672 30681 29373 30388 3035 11.0 11.5 11.1
Assam 9936 5119 5735 5257 290 4829 5445 4967 370 8.5 7.5 8.3Bihar 41054 22283 24527 22786 913 21370 23614 21873 1217 6.3 5.7 6.2Haryana 12664 11416 11471 11428 520 10895 10951 10908 767 7.8 7.8 7.8Karnataka 24003 20800 20244 20675 1827 18973 18418 18849 2162 12.7 13.0 12.7Kerala 19207 21076 21013 21061 1166 19909 19846 19895 1276 7.1 7.1 7.1Madhya Pradesh 34409 23331 23698 23414 1028 22303 22669 22385 1248 6.2 6.1 6.2Or i ssa 16045 8842 9702 9034 469 8373 9233 8566 587 7.8 7.1 7.6Punj ab 18184 16326 16019 16257 600 15726 15419 15657 817 5.8 5.9 5.8Uttar Pradesh 74861 48695 50587 49119 2208 46487 48379 46912 2349 5.6 5.4 5.6West Bengal 41521 32703 32396 32634 1664 31039 30732 30970 2079 7.4 7.5 7.5
15 States 472899 374696 374696 374696 22133 352562 352562 352562 26203 8.3 8.3 8.3
All States 506321 401068 401068 401068 26034 375034 375034 i 375034 26325 7.7 7.7 7.7
Notes: ‘ Threshold for VAT registration is Rs.5 lakh per annum.1. Figures for Gujarat relate to 1991-92.2. Scenariosrllnder scenario S1,we assume that home-grown or exempted products together account for 10% of private final consumption
expenditure in the most urbanised state-Maharastra and 60% in the least urbanised state-Assam.Briefly He write it as [10,60]. Thus scenario S2 refers to [20,60] and S3 to [10,50]. Among the other States, this ratio has been varied according to the degree of urbanisation.
3. Includes devolution of Addl.Excise Duties in lieu of Sales tax (ADEILST) and Sales tax other than CST.4. Taxbase is reduced by 10% i.e. 90% of columns 7,8 & 9, in order to obtain revenue neutral rates on the conservative side.5. Includes sales taxes (including CST) and ADEILST. The revenue figures relate to bugdet estimates except for Andhra Pradesh, Gujarat,
Maharashtra, Rajasthan and Tamil Nadu for which revised estimates were used.
N)VO
Revenue Im
plications of Alternative
VA T
Rates and
Derivation
of Revenue Neutral R
ates
Revenue Implications o f Alternative VAT Rates and Derivation of Revenue Neutral Rates
The taxes that the proposed VAT system would replace in a State comprise, general sales tax including tax on diesel, petrol etc. and purchase tax on sugarcane (GST), Central Sales Tax (CST) and additional duties of excise in lieu of sales tax (ADEILST). The relevant revenue figures are reported in line A in Tables 5 to 9.
Taxable turnover relating to the local sale of goods subjected to GST in a State was obtained by using commodity-wise data on yield and tax rate. The taxable local turnover so obtained is reported in line B of Tables 5 to 9.
Taxable local turnover figures include taxes on inputs. To obtain the tax exclusive base relevant for a VAT system, input tax has to be taken out from the taxable local turnover. Value of inputs embedded in taxable local turnover in a State was estimated by using the all-India input-output ratio for taxable commodities which is 51 per cent as per the latest input-output matrix available for the year 1989-90. In the absence of State specific ratios, the all-India ratio was used to estimate the input content of the taxable turnover. Estimates of input tax were then obtained by multiplying the value of inputs so derived by the tax rate applicable to inputs. Taxable local turnover net of input tax was obtained by subtracting input tax from taxable local turnover. The estimated values of inputs, input tax and taxable local turnover net of input tax are reported in lines C,D and E respectively.
In the above computations, to be on the conservative side, tax on all inputs is assumed to be 4 per cent. For most States this overestimates the input tax and accordingly underestimates the corresponding tax base because in most cases, 4 per cent is the ceiling rate on inputs - in general, many inputs are taxed at a lower rate.
Most of the States exempt many commodities or sectors (such as small scale units), and give tax concessions in various forms such as tax holidays and deferral of payment of sales tax. It is presumed that the proposed withdrawal of such exemptions and concessions will result in substantial increase in the tax base. In some States e.g., Maharashtra, exemptions were said to be responsible for eroding this base by as much as 20 per cent. However, to be on the safe side, the base broadening due to withdrawal of exemptions and tax concessions is taken to be only 10 per cent of ‘taxable local turnover net of input tax’. The increases so resulting are reported in line F. The likely total local sales turnover for VAT, i.e., sum of base broadening and taxable local turnover net of input tax is given in line G. This gives the tax base available under a VAT system.
30
Revenue Implications of A llernalive VA T Rates and Derivation of Revenue Neutral Rates
Under a VAT system, while revenue would be collected from only local sale of taxable goods, tax rebate has to be allowed for all local purchase of taxable inputs used up in production of taxable commodities, whether or not the output is sold locally. Therefore, input rebate had to be estimated in respect of total turnover comprising local sales, inter-State sales, consignment transfers and international exports. Information on the last three components was not readily available. An attempt was therefore made to estimate inter-State sales and consignment transfers from a State indirectly.
The value of inter-State sales from a State was estimated by dividing revenue from CST by CST rate of 4 per cent (which is the ceiling rate) on such sales. The estimate is given in line H.
No reliable information was available on consignment transfers from a State as these are not subjected to taxation by the exporting State under the current systems of sales taxes. For estimating consignment transfers, use was made of the data on sales and purchases of 142 major dealers of Maharashtra provided by the Sales Tax Commissioner, Maharashtra. Using these data and after discussions with Senior officials of sales tax departments, the ratio of consignment transfers to inter-State sales was set up at 100 per cent8. Thus, the value of consignment transfers from a State was taken to be the same as the value of its inter-State sales and is reported in line I. Input tax in these transactions was then computed following the same method as in the case of taxable local turnover. The estimate of this input tax is shown in line J. Total turnover was obtained by adding to the figures of total local turnover, inter-State sales and consignment transfers, and subtracting input tax borne by the latter. Line K shows the total turnover figures.
In estimating the value of inputs qualifying for VAT rebate, it should be noted that there is no input rebate for (i) inputs relating to turnover of importers (international or inter-State), (ii) inputs procured from outside the State, and (iii) input use of exempted goods. Consequently, rebate would be available only for purchase of locally produced taxable inputs used in manufacturing taxable products. Data on turnover of importers and locally purchased inputs were not available. In the present exercises, as a rough guess, 25 per cent of the ‘taxable local turnover net of input tax’ was assumed to be the turnover of importers.
8! The data indicated this ratio to be 190 per cent for Maharashtra, but these relate to both taxable and exempted goods.
31
Revenue Implications o f Alternative VAT Rates and Derivation of Revenue Neutral Rates
For estimating the local purchase of inputs, one needs again the ratio of such inputs to output. Such a ratio can be viewed as a multiple of three ratios, viz. (i) input-output ratio for taxable goods, (ii) ratio of taxable inputs to total inputs in the taxed sectors, and (iii) the ratio of local purchase of inputs to total inputs. The first two ratios were derived from the all-India input-output matrix for the year 1989-90, which are 51 per cent and 68 per cent respectively. For the ratio of local purchase of inputs to total inputs, the data relating to 142 large dealers of Maharashtra, discussed above, were used. This data set, indicates that the ratio of local purchase of inputs to total inputs is about 60 per cent. Thus, the ratio of local purchase of taxable inputs to output of taxable commodities works out to 21 per cent (.51x.68x.60). The ratio so computed has been adopted for estimating rebatable inputs in all the States under consideration. The estimate of inputs qualifying for VAT rebate was obtained by applying this ratio to the total turnover net of turnover of importers. This is reported in line L. Figures of purchase of plant and machinery were also compiled and are reported in line M.
Now, gross revenue under a VAT system can be obtained by applying the average VAT rate to the local taxable turnover. Similarly, tax rebate can be obtained by applying the average VAT rate to the inputs and plant and machinery qualifying for VAT rebate. For estimating gross revenue and tax rebate on inputs based on aggregate data on total turnover and inputs, average VAT rates for the three rate VAT regimes were computed as the weighted averages of the three rates using the proportions of turnover of goods falling under the respective rate categories as weights. The average rates for the specified VAT rate regimes are given in line N. Estimates of gross revenue were obtained by multiplying the local taxable turnover by average VAT rates and are reported in line O. Tax rebate was also estimated by applying the average VAT rates to inputs including plant and machinery qualifying for VAT rebate. The estimates are shown in line P. Net revenue figures were derived by subtracting tax rebate from the gross revenue. This is given in line Q.
The above estimates do not take into account the revenue likely to accrue from textiles, tobacco and sugar, on reversion of these commodities to the States from the present tax rental arrangement with the Centre. The revenue likely to be derived from these commodities was estimated on the basis of their consumption. For rate purposes, sugar, textiles and tobacco are taken to fall in the low rated, standard rated and high rated categories respectively. However, these broad commodity groups include some components of consumption which are currently subjected to sales tax. For example, sugar category includes sugar, khandsari and gur. While ‘sugar’ is subjected to ADEILST, khandsari and gur are taxable under the State sales taxes. Therefore, broad
32
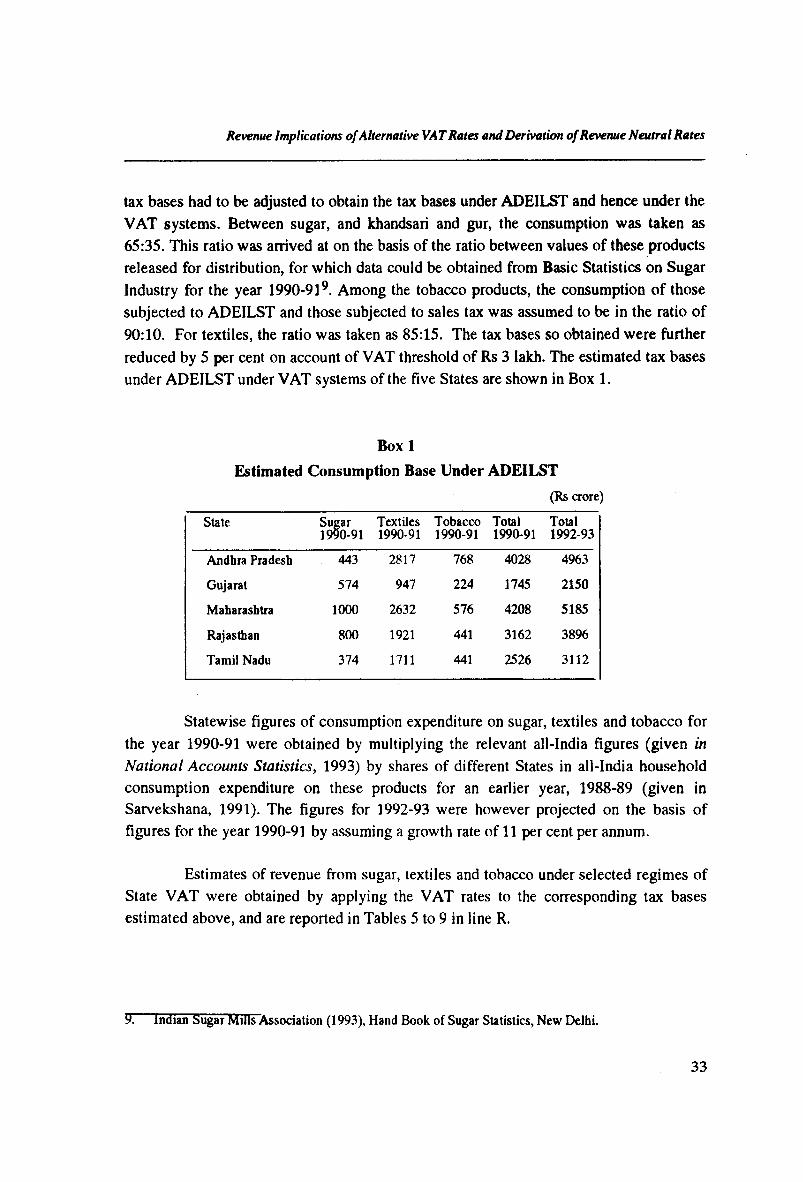
Revenue Implications of Alternative VAT Rates and Derivation of Revenue Neutral Rates
tax bases had to be adjusted to obtain the tax bases under ADEILST and hence under the VAT systems. Between sugar, and khandsari and gur, the consumption was taken as 65:35. This ratio was arrived at on the basis of the ratio between values of these products released for distribution, for which data could be obtained from Basic Statistics on Sugar Industry for the year 1990-919. Among the tobacco products, the consumption of those subjected to ADEILST and those subjected to sales tax was assumed to be in the ratio of 90:10. For textiles, the ratio was taken as 85:15. The tax bases so obtained were further reduced by 5 per cent on account of VAT threshold of Rs 3 lakh. The estimated tax bases under ADEILST under VAT systems of the five States are shown in Box 1.
Box 1Estimated Consumption Base Under ADEILST
(Rs crore)
State Sugar1990-91
Textiles1990-91
Tobacco1990-91
Total1990-91
Total1992-93
Andhra Pradesh 443 2817 768 4028 4963
Gujarat 574 947 224 1745 2150
Maharashtra 1000 2632 576 4208 5185
Rajasthan 800 1921 441 3162 3896
Tamil Nadu 374 1711 441 2526 3112
Statewise figures of consumption expenditure on sugar, textiles and tobacco for the year 1990-91 were obtained by multiplying the relevant all-India figures (given in National Accounts Statistics, 1993) by shares of different States in all-India household consumption expenditure on these products for an earlier year, 1988-89 (given in Sarvekshana, 1991). The figures for 1992-93 were however projected on the basis of figures for the year 1990-91 by assuming a growth rate of 11 per cent per annum.
Estimates of revenue from sugar, textiles and tobacco under selected regimes of State VAT were obtained by applying the VAT rates to the corresponding tax bases estimated above, and are reported in Tables 5 to 9 in line R.
W. Indian Sugar Milts Association (1993), Hand Book of Sugar Statistics, New Delhi.
33
Revenue Implications of Alternative VAT Rates and Derivation of Revenue Neutral Rates
The gain from value added in the process of distribution of goods, i.e., from trade margins of wholesalers and retailers, was taken to be 15 per cent of the first point sale value of the commodities. This assumption is also on the conservative side. In most industries, the wholesale and retail margins would exceed this percentage. A notable exception is petroleum. On the basis of available data on receipts on trade account of the directory trade establishments10, it can be shown that, under certain plausible assumptions, at the all-India level, value added in distribution of goods works out to about 16 per cent (See Appendix 1). The estimates of revenue gain from value added in the process of distribution of goods (or due to multistage taxation) are given in line S. These estimates indicate that the States would have substantial revenue gain, if the power to tax sugar, textiles and tobacco is transferred to them as contemplated under the State VAT system proposed in the Study. All States will get substantially higher revenue from these items under a VAT regime than they have been getting from ADEILST or through purchase tax on sugarcane. This finding corroborates the findings of an earlier study of the NIPFP11. Revenue under this head is not less than 10 per cent of total sales tax revenue in any of the five States and it could account for as high a share as 40 per cent in States like Rajasthan.
Under the current sales tax systems, the threshold limit for registration of dealers in any State is less than Rs 3 lakh. Raising this limit to the proposed threshold level of Rs 3 lakh under the VAT regimes would obviously result in some revenue loss due to exclusion of value added by those dealers whose gross turnover falls in the range of present threshold level and the proposed level. From available data it would appear however that the loss on this account is likely to be insignificant, around 1 per cent of the current revenue of the States. Estimates of revenue loss on this account are given in line T.
Total revenue likely to be obtained under VAT by a given State was finally obtained by adding to the net revenue from total taxable local turnover, the revenue from (i) sugar, textiles and tobacco, and (ii) value added in multistage taxation, and subtracting from this total, the revenue loss likely to be entailed from the proposed increase in the threshold limit for registration under VAT. This is reported in line U. Gain or loss in revenue from the change to a VAT regime is shown in line V.
m CSO (1989), Directory Trade Establishment Survey, 1985-86 (Report on Trade Sector).
11. See Purohit, Mabesb C. (1990), Exemptions Under Additional Duties of Excise in Lieu of Sales Tax: An Empirical Analysis of Loss of Revenue to the States, New Delhi, National Institute of Public Finance and Policy (mimeo).
34
Revenue Implications of Alternative VAT Rates and Derivation of Revenue Neutral Rates
The basic estimates obtained in Tables 5 to 9 are put together in Tables 10 and11. Estimates of tax yield under the current sales tax systems as well as under two basic VAT rate regimes for each of the five States are given in Table 10. One of the basic VAT rate regimes (4,12,20) comprises the lower limits of the rate bands and the other (5,14,25) consists of upper limits of the low and standard rated bands. Table 11 displays plausible revenue neutral VAT rate regimes and the corresponding revenue neutral average VAT rates for the said five States.
From Table 10, it would be seen that Andhra Pradesh, Maharashtra and Rajasthan may be able to obtain a significant revenue gain by substituting their sales tax systems by VAT even at the lower limits of the rate bands, viz., with the VAT rate regime (4,12,20) (see columns 2 to 4). With a high VAT rate regime (5,14,25), Gujarat may still have a small shortfall in revenue but Tamil Nadu will obtain substantial revenue advantage. The shortfall disappears even for Gujarat if one allows for some increase in collections through improvement in administration. In fact, if one assumes only a 10 per cent increase in the tax base from improvement in administrative efficiency because of introduction of VAT, the low VAT rate regime (4,12,20) works out to be revenue neutral even for Tamil Nadu (columns 5 and 6).
It would thus appear that some States would be able to choose revenue neutral VAT rate regimes within the proposed rate bands, while others will end up with substantial revenue surpluses which can be used for development. Alternatively they might go in for higher standard rates a little slowly.
Table 11 suggests that, with no improvement in administrative efficiency, to ensure revenue neutrality, the standard rate for some States such as Andhra Pradesh and Rajasthan would have to be no more than 8 or 9 per cent, and the average rate across the States would vary from 10.3 per cent for Andhra Pradesh to 13.1 per cent for Tamil Nadu (columns 2 and 3). Even a small improvement in tax compliance and administrative efficiency would facilitate lowering of both the standard (columns 2 and 4) and average (columns 3 and 5) rates by about 1 percentage point.
A comparison of the revenue neutral average VAT rates with those obtained by using the consumption expenditure approach reveals that these rates are higher than those under the latter for all the five States (column 3 of Table 11 and column 11 of Table 4) and, for some States, the gap is significant. Possibly, in these States a significant part of the potential consumption base remains outside the fold of taxation.
35
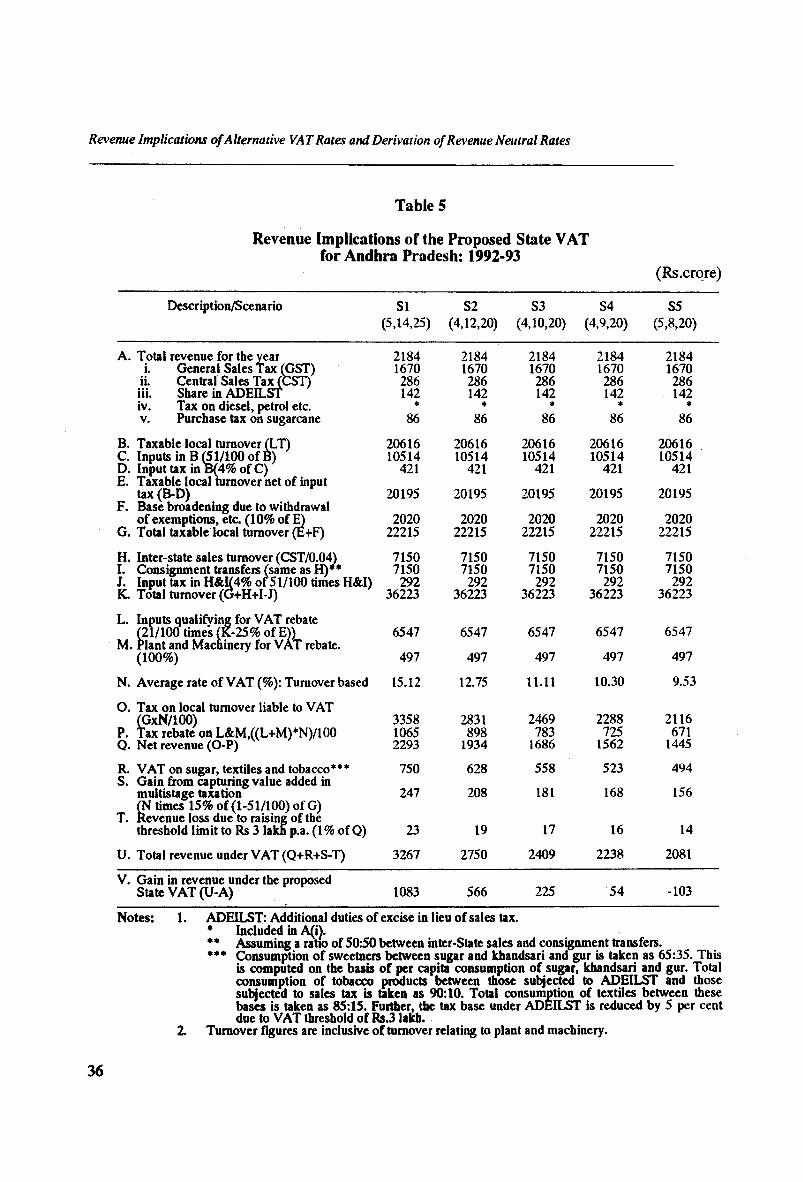
Revenue Implications o f Alternative VAT Rates and Derivation of Revenue Neutral Rates
Table 5
Revenue Implications of the Proposed State VAT for Andhra Pradesh: 1992-93
(Rs.crore)
Description/Scena rio SI S2 S3 S4 S5(5,14,25) (4,12,20) (4,10,20) (4,9,20) (5,8,20)
A. Total revenue for the year 2184 2184 2184 2184 2184i. General Sales Tax (GST)
ii. Central Sales Tax (CST)iii. Share in ADEILST
1670 1670 1670 1670 1670286 286 286 286 286142 142 142 142 142
iv. Tax on diesel, petrol etc. ♦ * ♦ ' ♦ *v. Purchase tax on sugarcane 86 86 86 86 86
B. Taxable local turnover (LT)C. Inputs in B (51/100 of B)
20616 20616 20616 20616 2061610514 10514 10514 10514 10514
D. Input tax in B(4% of C) 421 421 421 421 421E. Taxable local turnover net of input
tax (B-D) 20195 20195 20195 20195 20195F. Base broadening due to withdrawal
of exemptions, etc. (10% of E)G. Total taxable local turnover (E+F)
202022215
202022215
202022215
202022215
202022215
H. Inter-state sales turnover (CST/0.04)I. Consignment transfers (same as H)**
7150 7150 7150 7150 71507150 7150 7150 7150 7150
J. Input tax in H&I(4% o f 51/100 times H&I) 292 292 292 292 292K. Total turnover (G+H+I-J) 36223 36223 36223 36223 36223
L. Inputs qualifying for VAT rebate (21/100 times (K-25% of E)) 6547 6547 6547 6547 6547
M. Plant and Machinery for VAT rebate.(100%) 497 497 497 497 497
N. Average rate of VAT (%): Turnover based 15.12 12.75 11.11 10.30 9.53
O. Tax on local turnover liable to VAT(GxN/100)
P. Tax rebate on L&M,((L+M)*N)/1003358 2831 2469 2288 21161065 898 783 725 671
Q. Net revenue (O-P) 2293 1934 1686 1562 1445
R. VAT on sugar, textiles and tobacco*** 750 628 558 523 494S. Gain from capturing value added in
156multistage taxation 247 208 181 168(N times 15% of (1-51/100) of G)
T. Revenue loss due to raising of thethreshold limit to Rs 3 lakn p.a. (1% of Q) 23 19 17 16 14
U. Total revenue under VAT (Q+R+S-T) 3267 2750 2409 2238 2081
V. Gain in revenue under the proposed State VAT (U-A) 1083 566 225 54 -103
Notes: 1. ADEILST: Additional duties of excise in lieu of sales tax.* Included in A(i).** Assuming a ratio of 50:50 between inter-State sales and consignment transfers.*** Consumption of sweetners between sugar and khandsari and gur is taken as 65:35. This
is computed on the basis of per capita consumption of sugar, khandsari and gur. Total consumption of tobacco products between those subjected to ADEILST and those subjected to sales tax is taken as 90:10. Total consumption of textiles between these bases is taken as 85:15. Further, the tax base under ADEILST is reduced by 5 per cent due to VAT threshold of Rs.3 lakh.
2. Turnover figures are inclusive of turnover relating to plant and machinery.
36
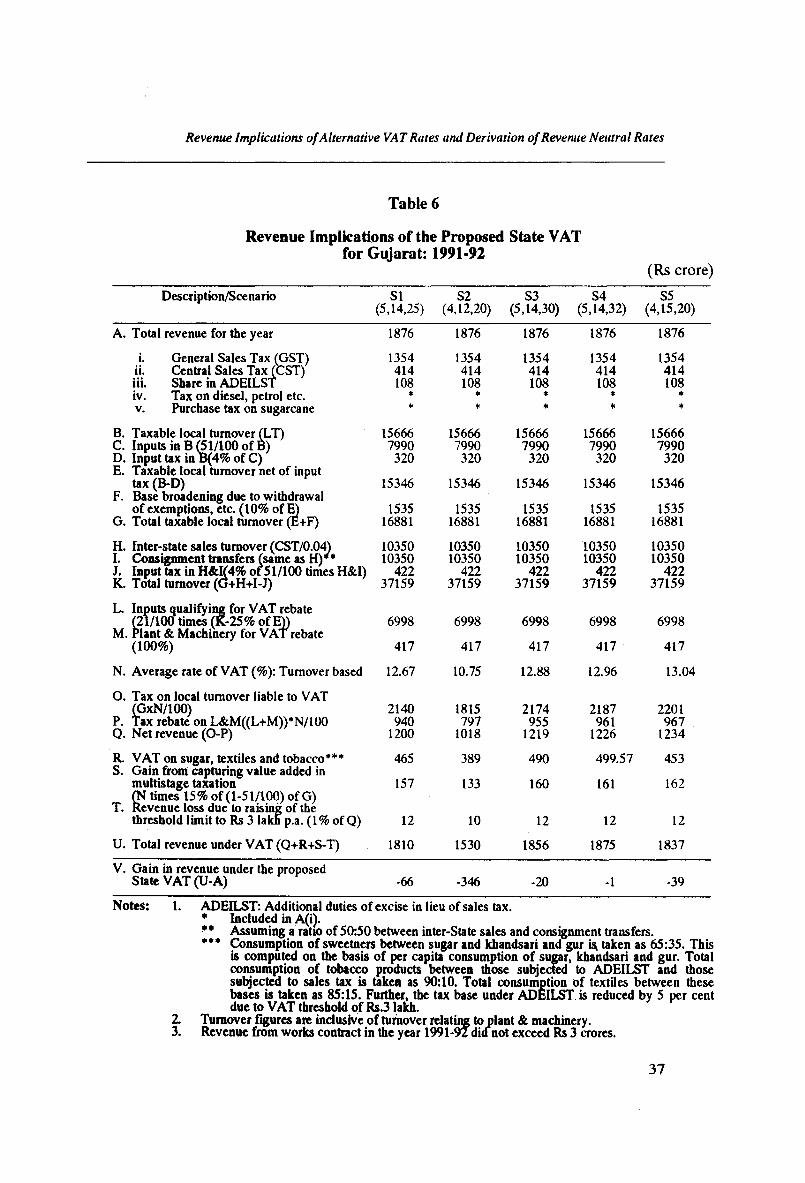
Revenue Implications of Alternative VAT Rates and Derivation of Revenue Neutral Rates
Table 6
Revenue Implications of the Proposed State VAT for Gujarat: 1991-92
(Rs crore)Description/Scenario SI S2 S3 S4 S5
(5,14,25) (4,12,20) (5,14,30) (5,14,32) (4,15,20)
A. Total revenue for the year 1876 1876 1876 1876 1876
i. General Sales Tax (GST)ii. Central Sales Tax (CST)
1354 1354 1354 1354 1354414 414 414 414 414
iii. Share in ADEILST 108 108 108 108 108iv. Tax on diesel, petrol etc. * * * * *v. Purchase tax on sugarcane * * * * *
B. Taxable local turnover (LT)C. Inputs in B (51/100 of B)
15666 15666 15666 15666 156667990 7990 7990 7990 7990
D. Input tax in B(4% of C) 320 320 320 320 320E. Taxable local turnover net of input
tax (B-D) 15346 15346 15346 15346 15346F. Base broadening due to withdrawal
of exemptions, etc. (10% of E) 1535 1535 1535 1535 1535G. Total taxable local turnover (E+F) 16881 16881 16881 16881 16881
H. Inter-state sales turnover (CST/0.04)I. Consignment transfers (same as H)**J. Input tax in H&I(4% o f 51/100 times H&I)
10350 10350 10350 10350 1035010350
42210350
42210350
42210350
42210350
422K. Total turnover (G+H+I-J) 37159 37159 37159 37159 37159
L. Inputs qualifying for VAT rebate (21/100 times (K-25% of E)) 6998 6998 6998 6998 6998
M. Plant & Machinery for VAT rebate(100%) 417 417 417 417 417
N. Average rate of VAT (%): Turnover based 12.67 10.75 12.88 12.96 13.04
O. Tax on local turnover liable to VAT(GxN/100)
P. Tax rebate on L&M((L+M))*N/1002140 1815 2174 2187 2201
940 797 955 961 967Q. Net revenue (O-P) 1200 1018 1219 1226 1234
R. VAT on sugar, textiles and tobacco*** 465 389 490 499.57 453S. Gain from capturing value added in
multistage taxation 157 133 160 161 162(N times 15% of (1-51/100) of G)
T. Revenue loss due to raising of thethreshold limit to Rs 3 lakn p.a. (1% of Q) 12 10 12 12 12
U. Total revenue under VAT (Q+R+S-T) 1810 1530 1856 1875 1837
V. Gain in revenue under the proposed State VAT (U-A) -66 -346 -20 -1 -39
Notes: 1. ADEILST: Additional duties of excise in lieu of sales tax.******
2.3.
Included in A(i).Assuming a ratio of 50:50 between inter-State sales and consignment transfers. Consumption of sweetners between sugar and khandsari and gur i* taken as 65:35. This is computed on the basis of per capita consumption of sugar, khandsari and gur. Total consumption of tobacco products between those subjected to ADEILST and those subjected to sales tax is taken as 90:10. Total consumption of textiles between these bases is taken as 85:15. Further, the tax base under ADEILST is reduced by 5 per cent due to VAT threshold of Rs.3 lakh.
Turnover figures are inclusive of turnover relating to plant & machinery.Revenue from works contract in the year 1991-9Z did not exceed Rs 3 crores.
37
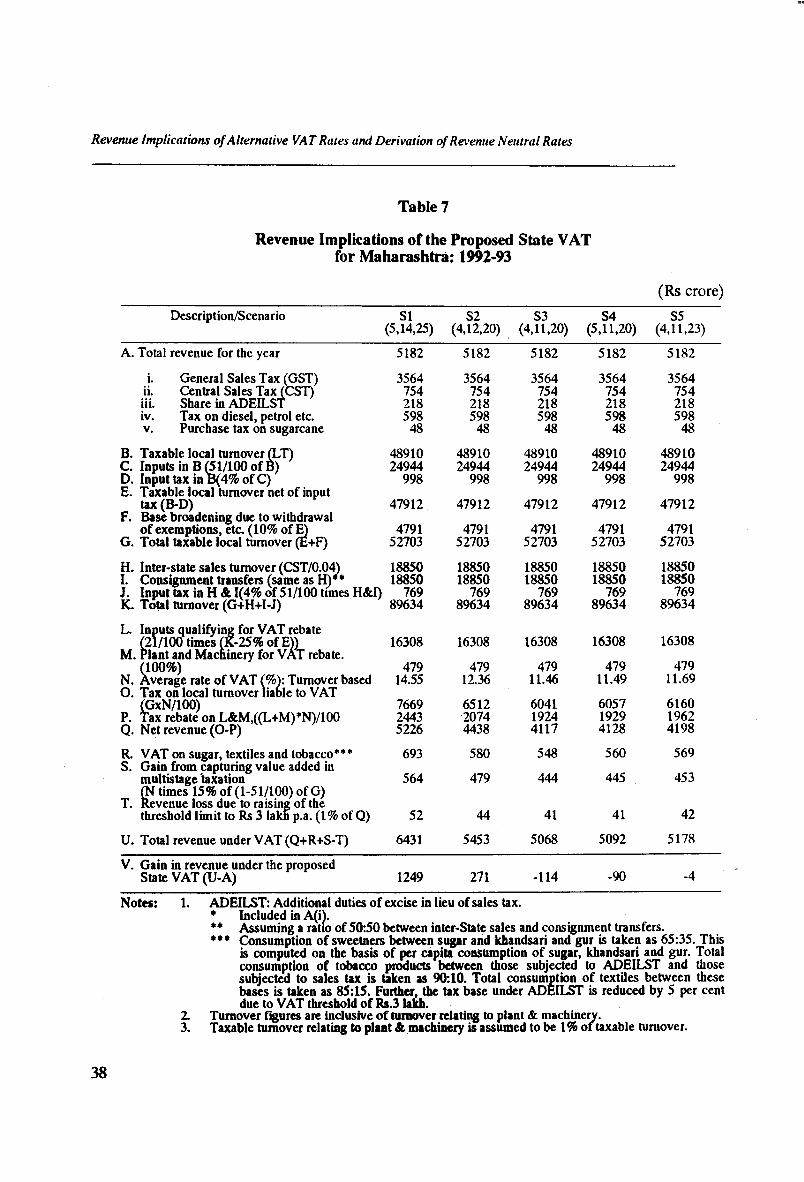
Revenue Implications of Alternative VAT Rates and Derivation of Re\’enue Neutral Rates
Table 7
Revenue Implications of the Proposed State VAT for Maharashtra: 1992-93
(Rs crore)Description/Scenario SI S2 S3 S4 S5
(5,14,25) (4,12,20) (4,11,20) (5,11,20) (4,11,23)
A. Total revenue for the year 5182 5182 5182 5182 5182
i. General Sales Tax (GST)ii. Central Sales Tax (CST)
3564 3564 3564 3564 3564754 754 754 754 754
iii. Share in ADEILST 218 218 218 218 218iv. Tax on diesel, petrol etc. 598 598 598 598 598v. Purchase tax on sugarcane 48 48 48 48 48
B. Taxable local turnover (LT)C. Inputs in B (51/100 of B)
48910 48910 48910 48910 4891024944 24944 24944 24944 24944
D. Input tax in B(4% of C) 998 998 998 998 998E. Taxable local turnover net of input
tax (B-D) 47912 47912 47912 47912 47912F. Base broadening due to withdrawal
of exemptions, etc. (10% of E) 4791 4791 4791 4791 4791G. Total taxable local turnover (E+F) 52703 52703 52703 52703 52703
H. Inter-state sales turnover (CST/0.04)I. Consignment transfers (same as H)**
18850 18850 18850 18850 1885018850 18850 18850 18850 18850
J. Input tax in H & 1(4% of 51/100 times H&I) 769 769 769 769 769K. Total turnover (G+H+I-J) 89634 89634 89634 89634 89634
L. Inputs qualifying for VAT rebate (21/100 times (K-25% of E)) 16308 16308 16308 16308 16308
M. rian t and Machinery for VAT rebate.(100%)
N. Average rate o f VAT (%): Turnover based O. Tax on local turnover liaole to VAT
479 479 479 479 47914.55 12.36 11.46 11.49 11.69
(GxN/100)P. Tax rebate on L&M,((L+M)*N)/100
7669 6512 6041 6057 61602443 ■2074 1924 1929 1962
Q. Net revenue (O-P) 5226 4438 4117 4128 4198
R. VAT on sugar, textiles and tobacco*** 693 580 548 560 569S. Gain from capturing value added in
445 453multistage taxation 564 479 444(N times 15% of (1-51/100) of G)
T. Revenue loss due to raising of thethreshold limit to Rs 3 lakh p.a. (1% of Q) 52 44 41 41 42
U. Total revenue under VAT (Q+R+S-T) 6431 5453 5068 5092 5178
V. Gain in revenue under the proposed State VAT (U-A) 1249 271 -114 -90 -4
Notes: 1. ADEILST: Additional duties of excise in lieu of sales tax.******
2.3.
Included in A(i).Assuming a ratio of 50:50 between inter-State sales and consignment transfers. Consumption of sweetners between sugar and khandsari and gur is taken as 65:35. This is computed on the basis of per capita consumption of sugar, khandsari and gur. Total consumption of tobacco products between those subjected to ADEILST and those subjected to sales tax is taken as 90:10. Total consumption of textiles between these bases is taken as 85:15. Further, the tax base under ADEILST is reduced by 5 per cent due to VAT threshold o f Rs.3 la u .
Turnover figures are inclusive o f turnover relating to plant & machinery.Taxable turnover relating to plant & machinery is assumed to be 1% or taxable turnover.
38
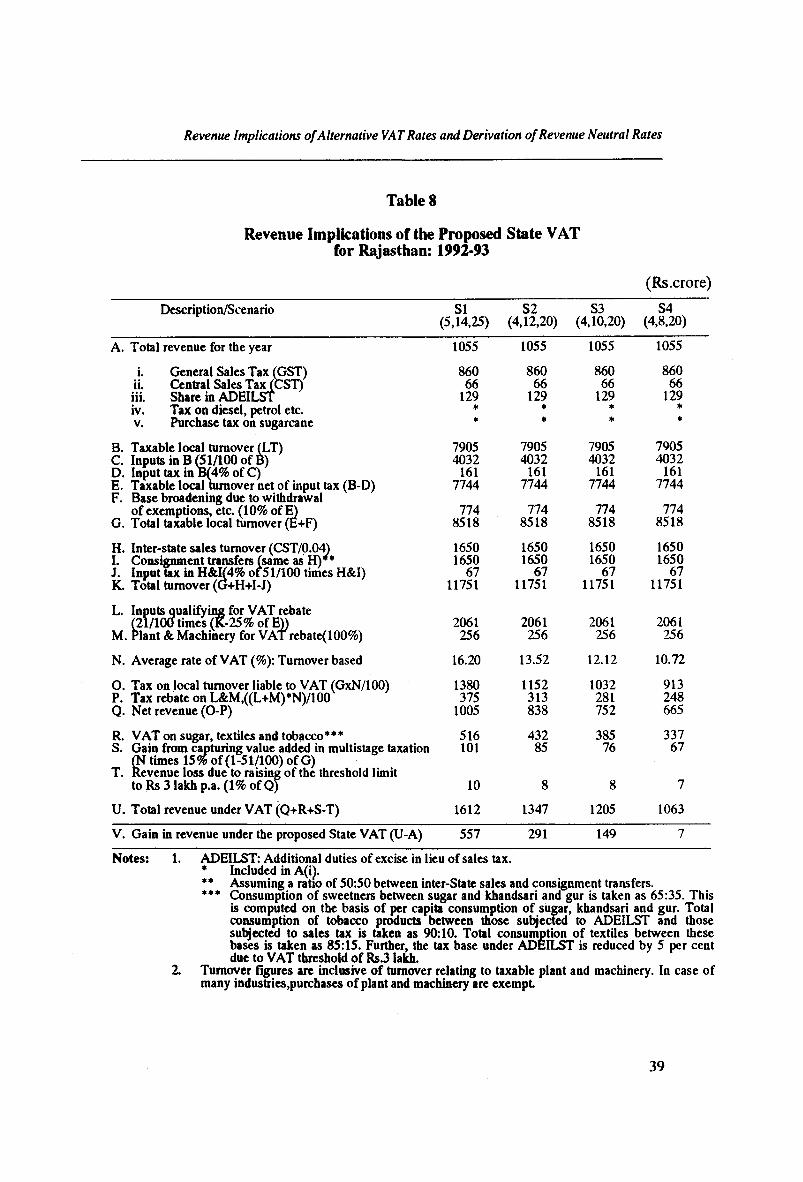
Revenue Implications of Alternative VAT Rates and Derivation of Revenue Neutral Rates
Table 8
Revenue Implications of the Proposed State VAT for Rajasthan: 1992*93
(Rs.crore)
Description/Scenario SI(5,14,25)
S2(4,12,20)
S3(4,10,20)
S4(4,8,20)
A. Total revenue for the year 1055 1055 1055 1055
i. General Sales Tax (GST)ii. Central Sales Tax (CST)iii. Share in ADEILSTiv. Tax on diesel, petrol etc.v. Purchase tax on sugarcane
86066
129**
86066
129**
86066
129**
86066
129**
B. Taxable local turnover (LT)C. Inputs in B (51/100 of B)D. Input tax in B(4% of C)E. Taxable local turnover net of input tax (B-D)F. Base broadening due to withdrawal
of exemptions, etc. (10% of E)G. Total taxable local turnover (E+F)
79054032
1617744
7748518
79054032
1617744
7748518
79054032
1617744
7748518
79054032
1617744
7748518
H. Inter-state sales turnover (CST/0.04)I. Consignment transfers (same as H)**J. Input tax in H&I(4% o f 51/100 times H&I) K. Total turnover (G+H+I-J)
16501650
6711751
16501650
6711751
16501650
6711751
16501650
6711751
L. Inputs qualifying for VAT rebate (21/10(1 times (K-25% of E))
M. Plant & Machinery for VAT rebate(100%)2061
2562061
2562061
2562061
256
N. Average rate of VAT (%): Turnover based 16.20 13.52 12.12 10.72
O. Tax on local turnover liable to VAT (GxN/100) P. Tax rebate on L&M,((L+M)*N)/100 Q. Net revenue (O-P)
1380375
1005
1152313838
1032281752
913248665
R. VAT on sugar, textiles and tobacco***S. Gain from capturing value added in multistage taxation
(N times 15% of (1-51/100) of G)T. Revenue loss due to raising of the threshold limit
to Rs 3 lakh p.a. (1% of Q)
516101
10
43285
8
38576
8
33767
7
U. Total revenue under VAT (Q+R+S-T) 1612 1347 1205 1063
V. Gain in revenue under the proposed State VAT (U-A) 557 291 149 7
Notes: 1. ADEILST: Additional duties of excise in lieu of sales tax.* Included in A(i).** Assuming a ratio of 50:50 between inter-State sales and consignment transfers.*** Consumption of sweetners between sugar and khandsari and gur is taken as 65:35. This
is computed on the basis of per capita consumption of sugar, khandsari and gur. Total consumption of tobacco products between those subjected to ADEILST and those subjected to sales tax is taken as 90:10. Total consumption of textiles between these bases is taken as 85:15. Further, the tax base under ADEILST is reduced by 5 per cent due to VAT threshold of Rs.3 lakh.
2. Turnover figures are inclusive of turnover relating to taxable plant and machinery. In case of many industries,purchases of plant and machinery are exempt
39
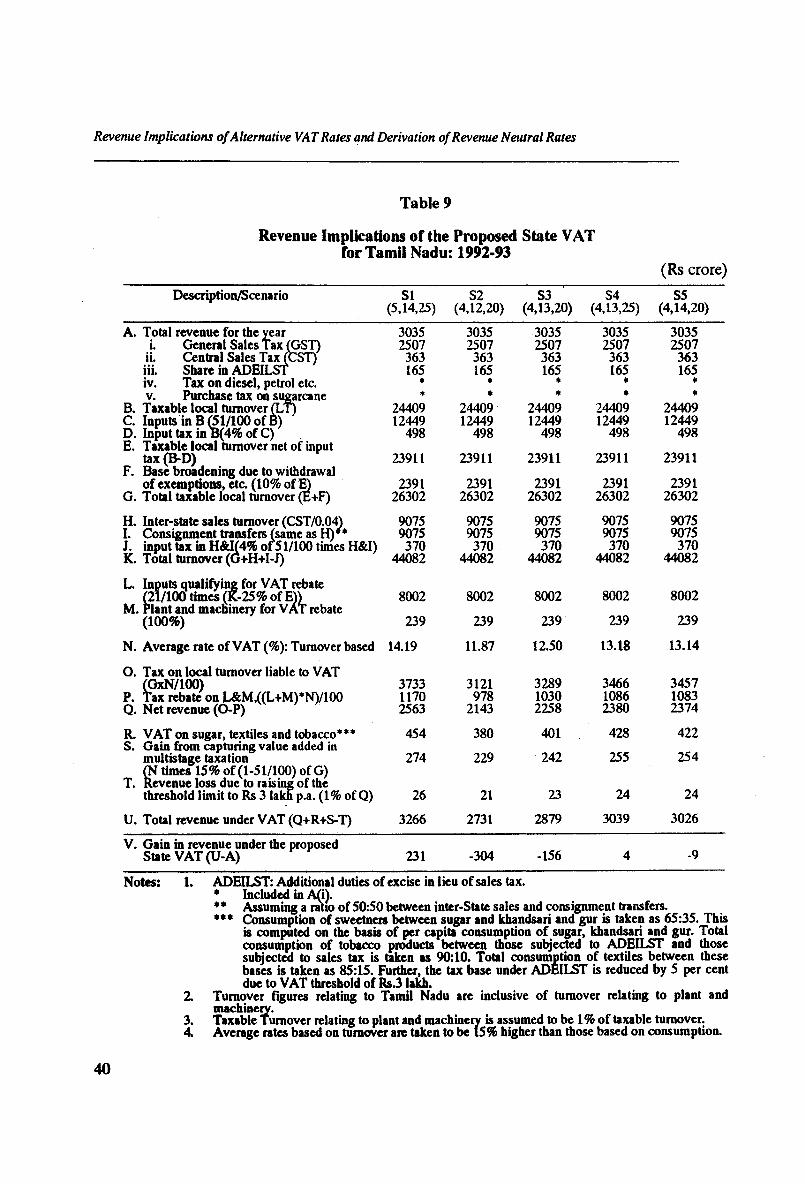
Revenue Implications o f Alternative VAT Rates and Derivation of Revenue Neutral Rates
Table 9
Revenue Implications of the Proposed State VAT for Tamil Nadu: 1992-93
(Rs crore)Description/Scenario SI
(5,14,25) (4,12,20)S3
(4,13,20)S4
(4,13,25)S5
(4,14,20)
l.ii.iii.iv.v.
Total revenue for the yearGeneral Sales Tax (GST)Central Sales Tax (CST)Share in ADEILST Tax on diesel, petrol etc.Purchase tax on sugarcane
B. Taxable local turnover (LT)C. Inputs in B (51/100 of B)D. Input tax in U(4% of C)E. Taxable local turnover net of input
tax (B-D)F. Base broadening due to withdrawal
o f exemptions, etc. (10% of E)G. Total taxable local turnover (E+F)
H. Inter-state sales turnover (CST/0.04)I* Consignment trsnsfcrs (saiuc 3S H)J. input tax in H&I(4% o f 51/100 times H&I) K. Total turnover (G+H+I-J)
rebate
L. Inputs qualifying for VAT reb (21/100 times (K-25% of E))
M. Plant and machinery for VAT (100%)
N. Average rate of VAT (%): Turnover based
O. Tax on local turnover liable to VAT (GxN/100)
P. Tax rebate on L&M,((L+M)*N)/100 Q. Net revenue (O-P)
R. VAT on sugar, textiles and tobacco***S. Gain from capturing value added in
multistage taxation (N times 15% of (1-51/100) of G)
T. Revenue loss due to raising of thethreshold limit to Rs 3 lakh p.a. (1% of Q)
U. Total revenue under VAT (Q+R+S-T)
3035 3035 3035 3035 30352507 2507 2507 2507 2507
363 363 363 363 363165 165 165 165 165
* * * * ♦* ♦ * * *
24409 24409 24409 24409 2440912449 12449 12449 12449 12449
498 498 498 498 498
23911 23911 23911 23911 23911
2391 2391 2391 2391 239126302 26302 26302 26302 26302
9075 9075 9075 9075 90759075 9075 9075 9075 9075
370 370 370 370 37044082 44082 44082 44082 44082
8002 8002 8002 8002 8002
239 239 239 239 239
14.19 11.87 12.50 13.18 13.14
3733 3121 3289 3466 34571170 978 1030 1086 10832563 2143 2258 2380 2374
454 380 401 428 422
274 229 242 255 254
26 21 23 24 24
3266 2731 2879 3039 3026
V. Gain in revenue under the proposed State VAT (U-A) 231 -304 -156
Notes: 1. ADEILST: Additional duties of excise in lieu of sales tax.***«««
3.4.
Included in A(i).Assuming a ratio of 50:50 between inter-State sales and consignment transfers. Consumption of sweetners between sugar and khandsari and gur is taken as 65:35. This is computed on the basis of per capita consumption of sugar, khandsari and gur. Total consumption of tobacco products between those subjected to ADEILST and those subjected to sales tax is taken as 90:10. Total consumption of textiles between these bases is taken as 85:15. Further, the tax base under ADEILST is reduced by 5 per cent due to VAT threshold of Rs.3 lakh.
Turnover figures relating to Tamil Nadu are inclusive of turnover relating to plant and machinery.Taxable Turnover relating to plant and machinery is assumed to be 1% of taxable turnover. Average rates based on turnover are taken to be l5% higher than those based on consumption.
40
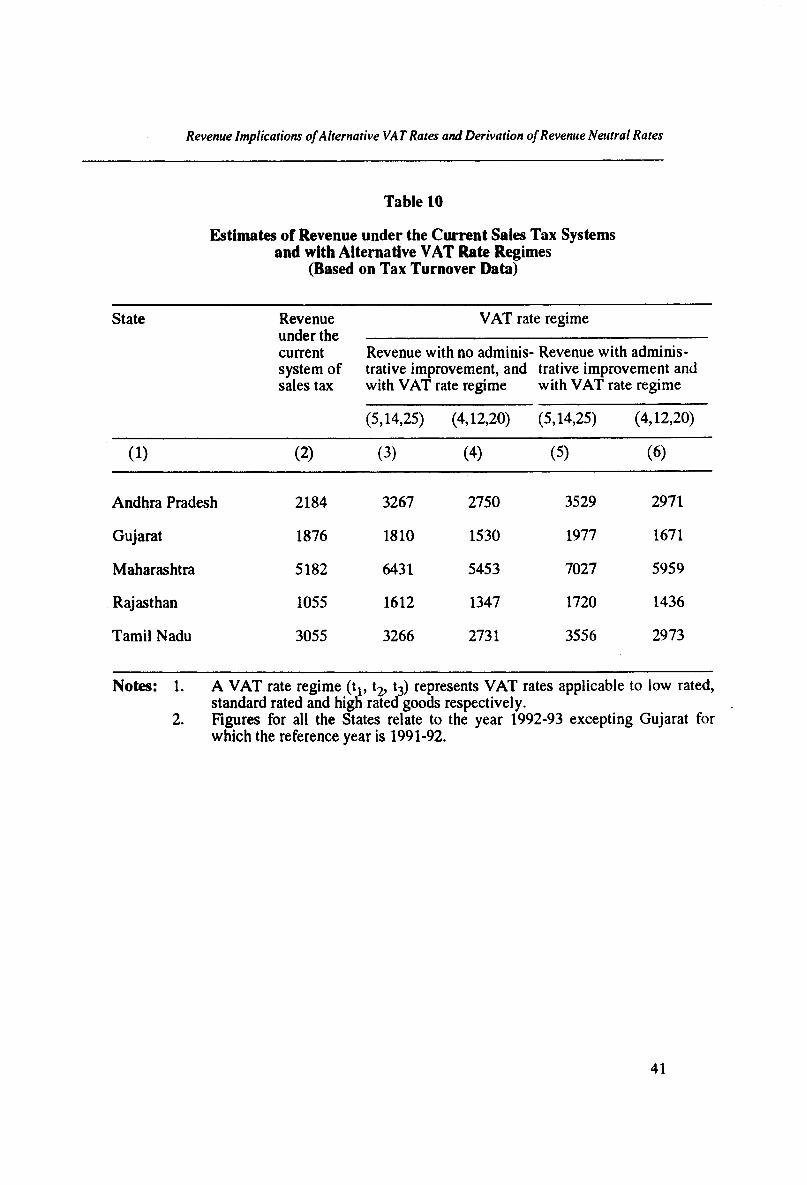
Revenue Implications of Alternative VAT Rates and Derivation of Revenue Neutral Rates
Table 10
Estimates of Revenue under the Current Sales Tax Systems and with Alternative VAT Rate Regimes
(Based on Tax Turnover Data)
State Revenue under the current system of sales tax
VAT rate regime
Revenue with no adminis- Revenue with administrative improvement, and trative improvement and with VAT rate regime with VAT rate regime
(5,14,25) (4,12,20) (5,14,25) (4,12,20)
(1) (2) (3) (4) (5) (6)
Andhra Pradesh 2184 3267 2750 3529 2971
Gujarat 1876 1810 1530 1977 1671
Maharashtra 5182 6431 5453 7027 5959
Rajasthan 1055 1612 1347 1720 1436
Tamil Nadu 3055 3266 2731 3556 2973
Notes: 1. A VAT rate regime (tls t2, t3) represents VAT rates applicable to low rated, standard rated and hign rated goods respectively.
2. Figures for all the States relate to the year 1992-93 excepting Gujarat for which the reference year is 1991-92.
41
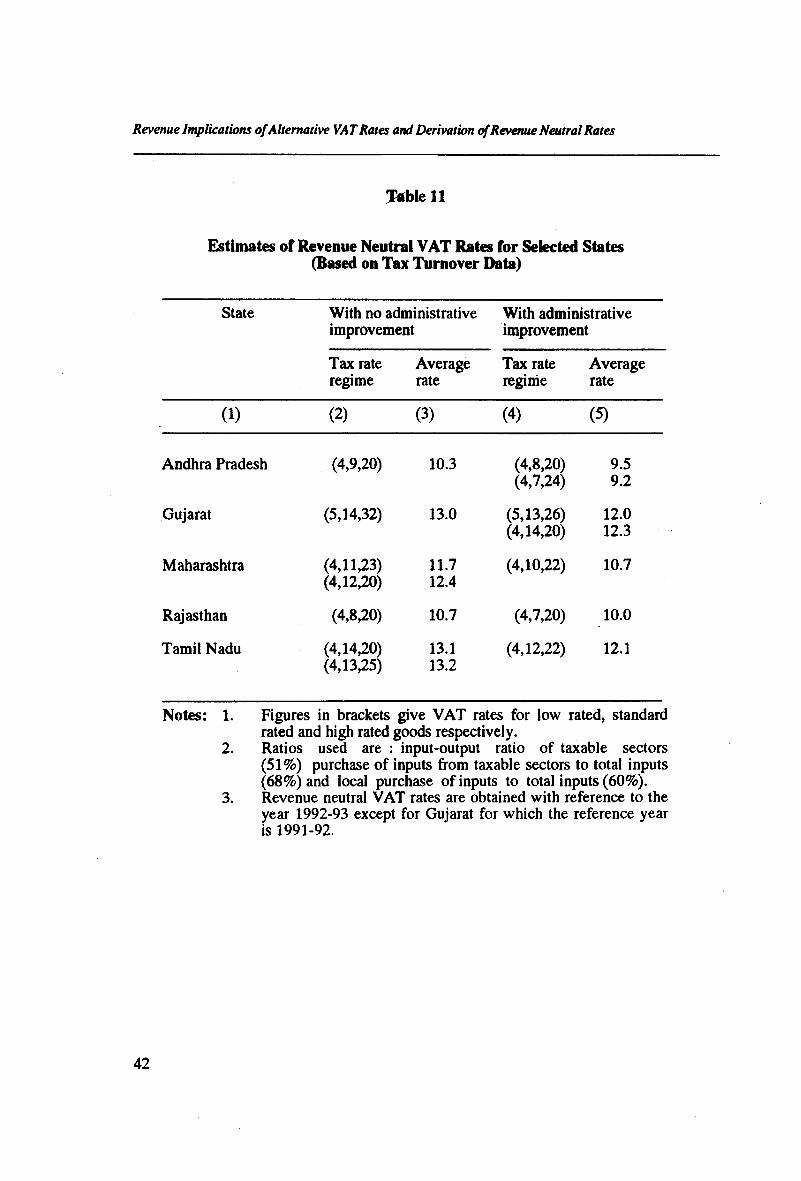
Revenue Implications ofAlternative VA T Rates and Derivation of Revenue Neutral Rates
Tfeble 11
Estimates of Revenue Neutral VAT Rates for Selected States (Based on Tax Turnover Data)
State With no administrative improvement
With administrative improvement
Tax rate regime
Averagerate
Tax rate regime
Averagerate
(1) (2) (3) (4) (5)
Andhra Pradesh (4,9,20) 10.3 (4,8,20) 9.5(4,7,24) 9.2
Gujarat (5,14,32) 13.0 (5,13,26) 12.0(4,14,20) 12.3
Maharashtra (4,11,23) 11.7 (4,10,22) 10.7(4,12,20) 12.4
Rajasthan (4,8,20) 10.7 (4,7,20) 10.0
Tamil Nadu (4,14,20) 13.1 (4,12,22) 12.1(4,13,25) 13.2
Notes: 1. Figures in brackets give VAT rates for low rated, standard rated and high rated goods respectively.
2. Ratios used are : input-output ratio of taxable sectors (51%) purchase of inputs from taxable sectors to total inputs (68%) and local purchase of inputs to total inputs (60%).
3. Revenue neutral VAT rates are obtained with reference to the year 1992-93 except for Gujarat for which the reference year is 1991-92.
42
Revenue Implications o f Alternative VAT Rates and Derivation of Revenue Neutral Rates
However, with expected improvement in tax administration usually associated with switchover to a VAT, it is unlikely that a State would need to have revenue neutral average VAT rate higher than 11 per cent.
Sensitivity analysis was also carried out under both the conditions: with and without improvement in administrative efficiency, by varying two of the three ratios used for estimating the value of rebatable inputs in taxable turnover. The results under the assumption of no administrative improvement are given in Table 12 and those with administrative improvement are reported in Table 13. These results indicate that revenue neutral average VAT rates do not vary much even if one allows for a 10 per cent margin in one or both of the ratios (columns 3,5 and 7). The increase in the average VAT rate for a State following a 10 per cent increase in both the ratios does not exceed 1.1 percentage points, and the increase for Andhra Pradesh and Rajasthan is only of the order of 0.3 or0.4 percentage point (columns 3 and 7).
It should be noted that these estimates do not allow for the revenue impact of zero-rating of international exports. Roughly, the loss on this account may be of the order of Rs. 1000 crore for the country as a whole. This might have given an upward bias in the estimates of revenue and a corresponding downward bias in the estimates of revenue neutral rates presented here. It may, however, be added that it was not possible to estimate the likely gain in revenue from the disallowance of input rebate which is envisaged in the proposed scheme of State VATs in respect of items bearing high rate of tax, viz., petrol, diesel, aviation fuel, liquor and tobacco. The omission of this gain would correct, at least partly, for the bias resulting from the omission of likely revenue loss from tax credit relating to international exports. Notwithstanding these shortcomings, the estimates presented here provide a reasonable basis for assessing the revenue impact of the proposed reforms. With the data normally available with the State tax authorities, it should be possible to replicate these exercises for all States.
43
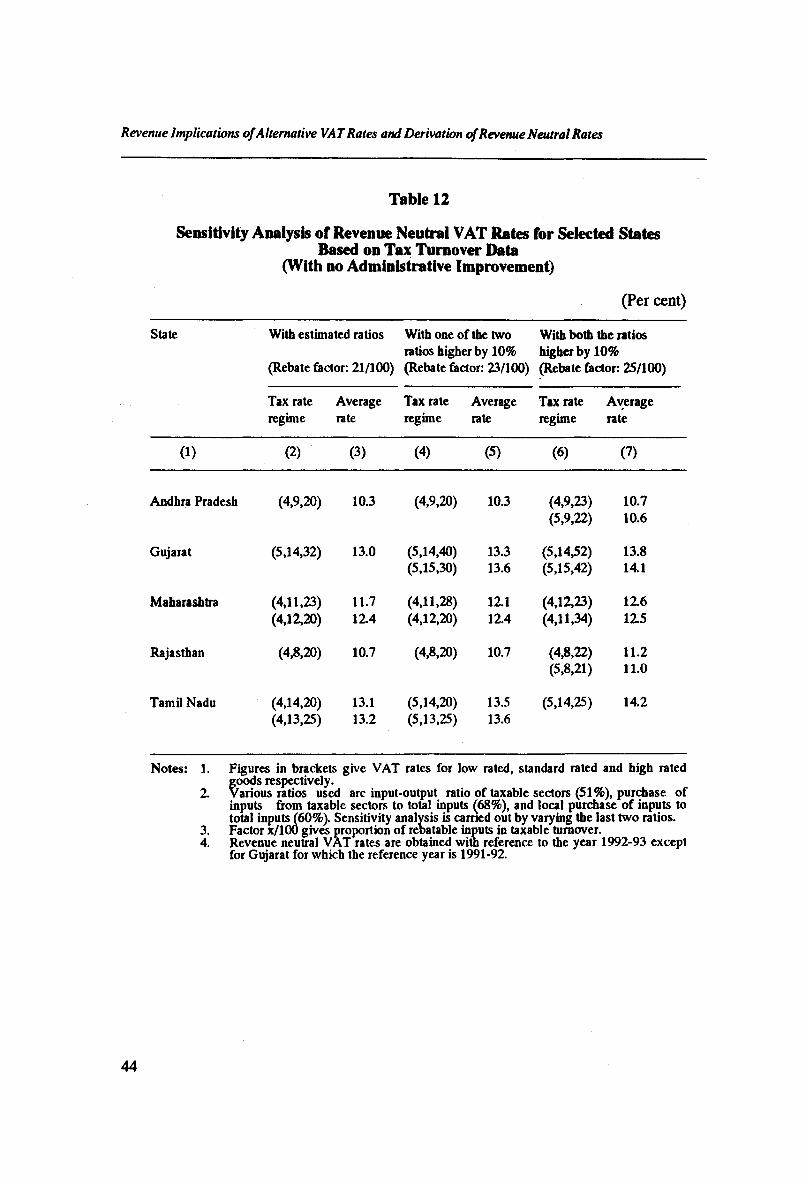
Revenue Implications o f Alternative VAT Rates and Derivation of Revenue Neutral Rates
Table 12
Sensitivity Analysis of Revenue Neutral VAT Rates for Selected States Based on Tax Turnover Data
(With no Administrative Improvement)
(Per cent)
State With estimated ratios
(Rebate factor: 21/100)
With one of the two ratios higher by 10% (Rebate factor: 23/100)
With both the ratios higher by 10%(Rebate factor: 25/100)
Tax rate regime
Averagerate
Tax rate regime
Averagerate
Tax rate regime
Averagerate
0 ) (2) (3) (4) (5) (6) (7)
Andhra Pradesh (4,9,20) 10.3 (4,9,20) 10.3 (4,9,23) 10.7(5,9,22) 10.6
Gujarat (5,14,32) 13.0 (5,14,40) 13.3 (5,14,52) 13.8(5,15,30) 13.6 (5,15,42) 14.1
Maharashtra (4,11,23) 11.7 (4,11,28) 12.1 (4,12,23) 12.6(4,12,20) 12.4 (4,12,20) 12.4 (4,11,34) 115
Rajasthan (4,8,20) 10.7 (4,8,20) 10.7 (4,8,22) 11.2(5,8,21) 11.0
Tamil Nadu (4,14,20) 13.1 (5,14,20) 13.5 (5,14,25) 14.2(4,13,25) 13.2 (5,13,25) 13.6
Notes: 1. Figures in brackets give VAT rates for low rated, standard rated and high ratedgoods respectively.
2. Various ratios used are input-output ratio of taxable sectors (51%), purchase of inputs from taxable sectors to total inputs (68%), and local purchase of inputs to total inputs (60%). Sensitivity analysis is carried out by varying the last two ratios.
3. Factor x/100 gives proportion of rebatable inputs in taxable turnover.4. Revenue neutral VAT rates are obtained with reference to the year 1992-93 except
for Gujarat for which the reference year is 1991-92.
44
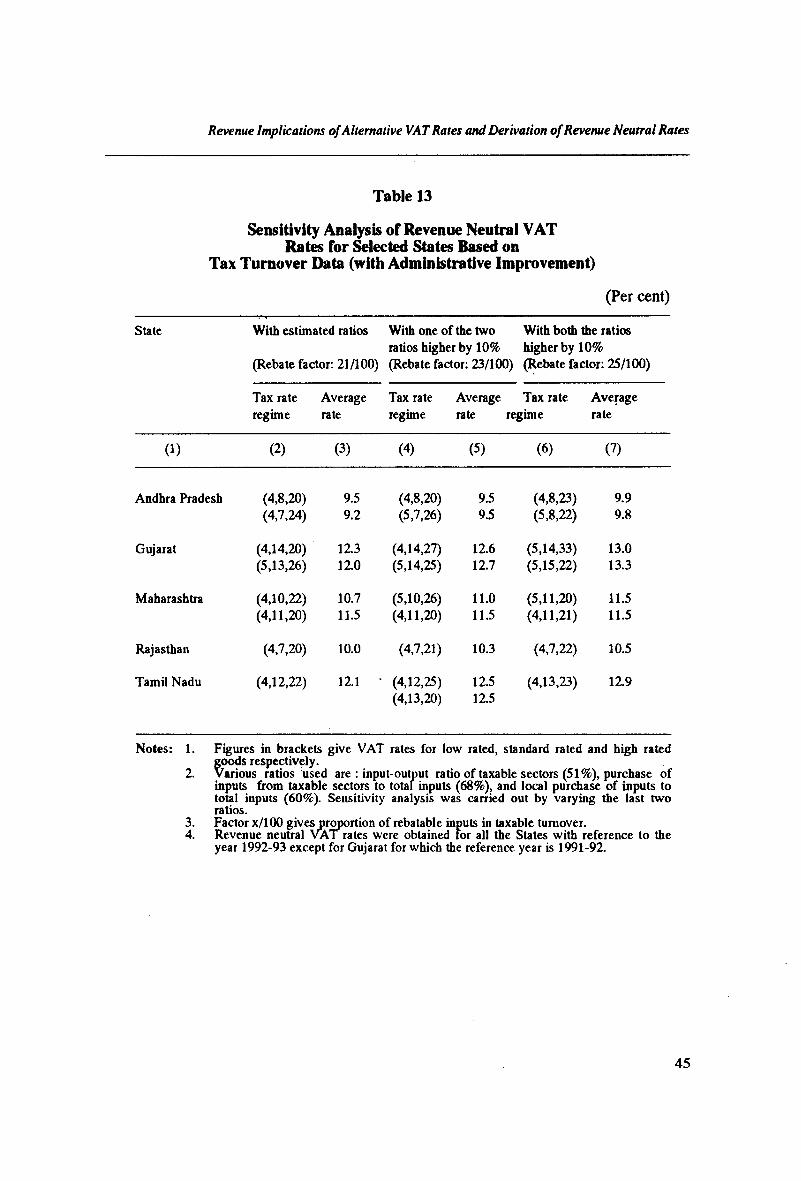
Revenue Implications of Alternative VAT Rates and Derivation o f Revenue Neutral Rates
Table 13
Sensitivity Analysis of Revenue Neutral VAT Rates for Selected States Based on
Tax Turnover Data (with Administrative Improvement)
(Per cent)
State With estimated ratios
(Rebate factor: 21/100)
With one of the two ratios higher by 10% (Rebate factor: 23/100)
With both the ratios higher by 10%(Rebate factor: 25/100)
Tax rate Average Tax rate Average Tax rate Averageregime rate regime rate regime rate
(1) (2) (3) (4) (5) (6) (7)
Andhra Pradesh (4,8,20) 9.5 (4,8,20) 9.5 (4,8,23) 9.9(4,7,24) 9.2 (5,7,26) 9.5 (5,8,22) 9.8
Gujarat (4,14,20) 12.3 (4,14,27) 12.6 (5,14,33) 13.0(5,13,26) 12.0 (5,14,25) 12.7 (5,15,22) 13.3
Maharashtra (4,10,22) 10.7 (5,10,26) 11.0 (5,11,20) 11.5(4,11,20) 11.5 (4,11,20) 11.5 (4,11,21) 11.5
Rajasthan (4,7,20) 10.0 (4,7,21) 10.3 (4,7,22) 10.5
Tamil Nadu (4,12,22) 12.1 ' (4,12,25) 12.5 (4,13,23) 12.9(4,13,20) 12.5
Notes: 1.2.
3.4.
Figures in brackets give VAT rates for low rated, standard rated and high rated goods respectively.Various ratios used are : input-output ratio of taxable sectors (51%), purchase of inputs from taxable sectors to total inputs (68%), and local purchase of inputs to total inputs (60%). Sensitivity analysis was carried out by varying the last two ratios.Factor x/100 gives proportion of rebatable inputs in taxable turnover.Revenue neutral VAT rates were obtained for all the States with reference to the year 1992-93 except for Gujarat for which the reference year is 1991-92.
45
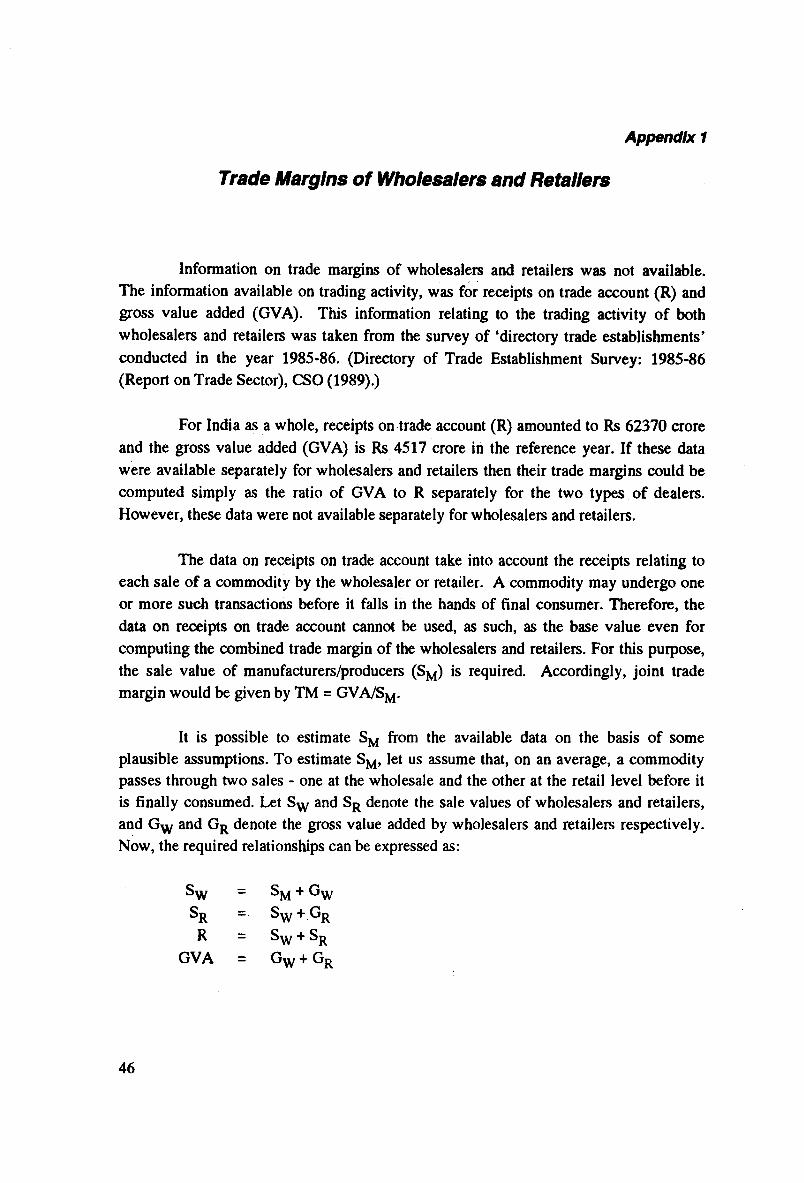
Trade Margins of Wholesalers and Retailers
Appendix 1
Information on trade margins of wholesalers and retailers was not available. The information available on trading activity, was for receipts on trade account (R) and gross value added (GVA). This information relating to the trading activity of both wholesalers and retailers was taken from the survey of ‘directory trade establishments’ conducted in the year 1985-86. (Directory of Trade Establishment Survey: 1985-86 (Report on Trade Sector), CSO (1989).)
For India as a whole, receipts on trade account (R) amounted to Rs 62370 crore and the gross value added (GVA) is Rs 4517 crore in the reference year. If these data were available separately for wholesalers and retailers then their trade margins could be computed simply as the ratio of GVA to R separately for the two types of dealers. However, these data were not available separately for wholesalers and retailers.
The data on receipts on trade account take into account the receipts relating to each sale of a commodity by the wholesaler or retailer. A commodity may undergo one or more such transactions before it falls in the hands of final consumer. Therefore, the data on receipts on trade account cannot be used, as such, as the base value even for computing the combined trade margin of the wholesalers and retailers. For this purpose, the sale value of manufacturers/producers (SM) is required. Accordingly, joint trade margin would be given by TM = GVA/SM.
It is possible to estimate SM from the available data on the basis of some plausible assumptions. To estimate SM, let us assume that, on an average, a commodity passes through two sales - one at the wholesale and the other at the retail level before it is finally consumed. Let Sw and SR denote the sale values of wholesalers and retailers, and Gw and GR denote the gross value added by wholesalers and retailers respectively. Now, the required relationships can be expressed as:
sw SM + G WSr SW + g r
R Sw + Sr
GVA = g w + g r
46
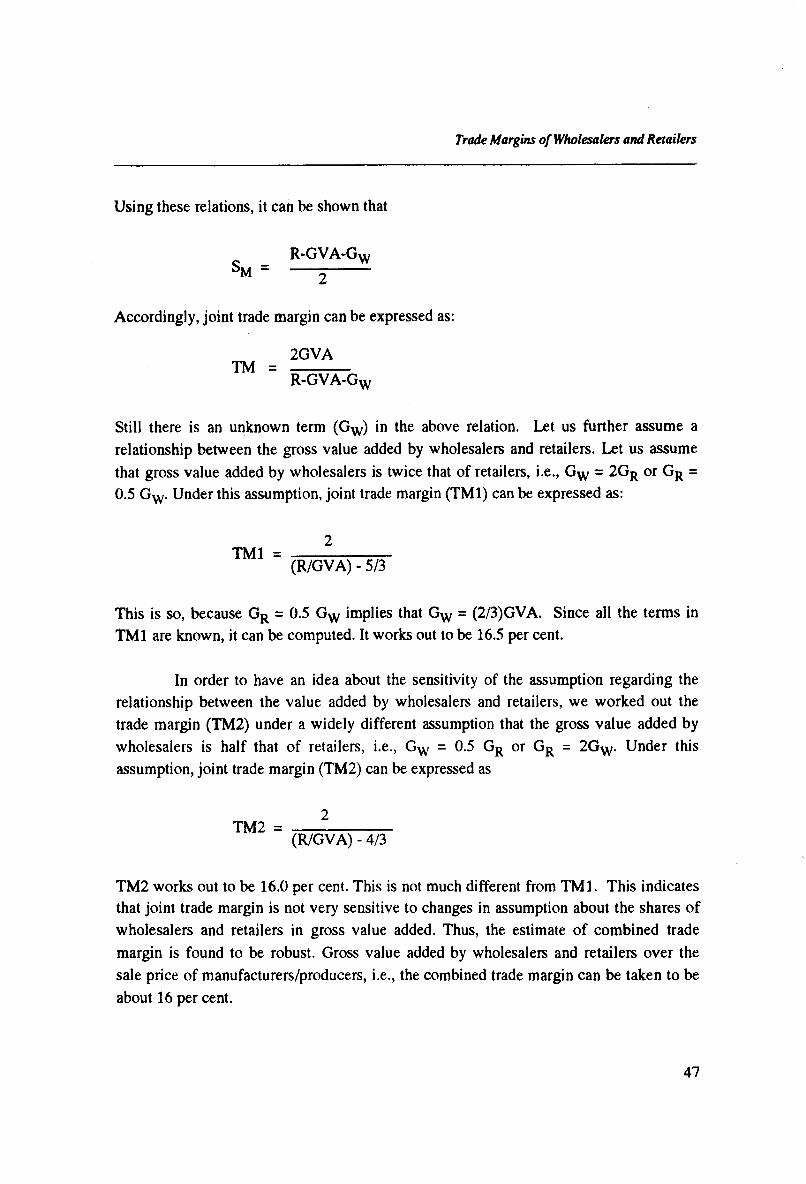
Trade Margins of Wholesalers and Retailers
Using these relations, it can be shown that
R-GVA-GWSM = -- 2----
Accordingly, joint trade margin can be expressed as:
2GVATM =
R-GVA-GW
Still there is an unknown term (Gw) in the above relation. Let us further assume a relationship between the gross value added by wholesalers and retailers. Let us assume that gross value added by wholesalers is twice that of retailers, i.e., Gw = 2GR or GR =0.5 Gw. Under this assumption, joint trade margin (TM1) can be expressed as:
2TM1 =
(R/GVA) - 5/3
This is so, because GR = 0.5 Gw implies that Gw = (2/3)GVA. Since all the terms in TM1 are known, it can be computed. It works out to be 16.5 per cent.
In order to have an idea about the sensitivity of the assumption regarding the relationship between the value added by wholesalers and retailers, we worked out the trade margin (TM2) under a widely different assumption that the gross value added by wholesalers is half that of retailers, i.e., Gw = 0.5 GR or GR = 2GW. Under this assumption, joint trade margin (TM2) can be expressed as
TM2 =(R/GVA) - 4/3
TM2 works out to be 16.0 per cent. This is not much different from TM1. This indicates that joint trade margin is not very sensitive to changes in assumption about the shares of wholesalers and retailers in gross value added. Thus, the estimate of combined trade margin is found to be robust. Gross value added by wholesalers and retailers over the sale price of manufacturers/producers, i.e., the combined trade margin can be taken to be about 16 per cent.
47
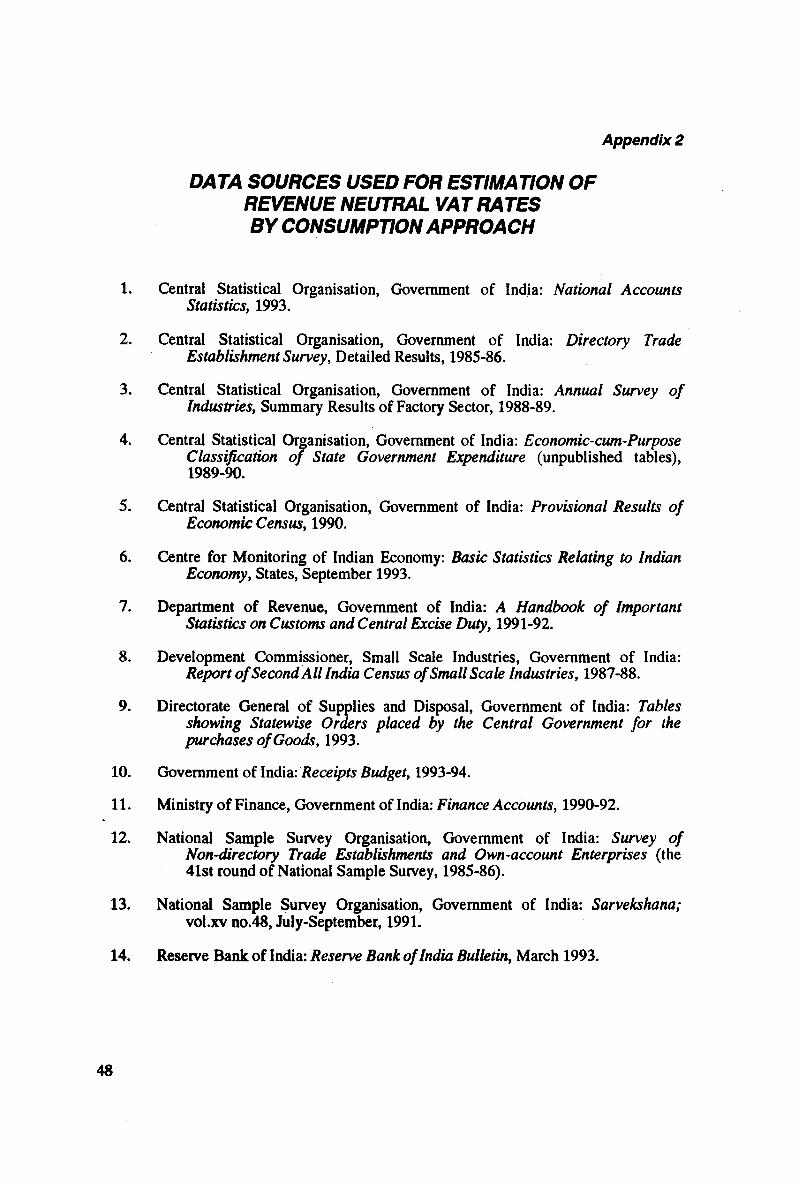
Appendix 2
DATA SOURCES USED FOR ESTIMATION OF REVENUE NEUTRAL VAT RATES BY CONSUMPTION APPROACH
1. Central Statistical Organisation, Government of India: National AccountsStatistics, 1993.
2. Central Statistical Organisation, Government of India: Directory TradeEstablishment Survey, Detailed Results, 1985-86.
3. Central Statistical Organisation, Government of India: Annual Survey o fIndustries, Summary Results of Factory Sector, 1988-89.
4. Central Statistical Organisation, Government of India: Economic-cum-PurposeClassification o f State Government Expenditure (unpublished tables), 1989-90.
5. Central Statistical Organisation, Government of India: Provisional Results o fEconomic Census, 1990.
6. Centre for Monitoring of Indian Economy: Basic Statistics Relating to IndianEconomy, States, September 1993.
7. Department of Revenue, Government of India: A Handbook o f ImportantStatistics on Customs and Central Excise Duty, 1991-92.
8. Development Commissioner, Small Scale Industries, Government of India:Report o f Second All India Census of Small Scale Industries, 1987-88.
9. Directorate General of Supplies and Disposal, Government of India: Tablesshowing Statewise Orders placed by the Central Government for the purchases o f Goods, 1993.
10. Government of India: Receipts Budget, 1993-94.
11. Ministry of Finance, Government of India: Finance Accounts, 1990-92.
12. National Sample Survey Organisation, Government of India: Survey ofNon-directory Trade Establishments and Own-account Enterprises (the 41st round of National Sample Survey, 1985-86).
13. National Sample Survey Organisation, Government of India: Sarvekshana;vol.xv no.48, July-September, 1991.
14. Reserve Bank of India: Reserve Bank of India Bulletin, March 1993.
48