Revealing the relationship between vegetable oil ...
31
Accepted Manuscript Title: Revealing the relationship between vegetable oil composition and oxidative stability: a multifactorial approach Authors: Luc´ ıa Redondo-Cuevas, Gloria Castellano, Francisco Torrens, Vassilios Raikos PII: S0889-1575(17)30305-8 DOI: https://doi.org/10.1016/j.jfca.2017.12.027 Reference: YJFCA 3015 To appear in: Received date: 9-5-2017 Revised date: 9-10-2017 Accepted date: 14-12-2017 Please cite this article as: Redondo-Cuevas, Luc´ ıa., Castellano, Gloria., Torrens, Francisco., & Raikos, Vassilios., Revealing the relationship between vegetable oil composition and oxidative stability: a multifactorial approach.Journal of Food Composition and Analysis https://doi.org/10.1016/j.jfca.2017.12.027 This is a PDF file of an unedited manuscript that has been accepted for publication. As a service to our customers we are providing this early version of the manuscript. The manuscript will undergo copyediting, typesetting, and review of the resulting proof before it is published in its final form. Please note that during the production process errors may be discovered which could affect the content, and all legal disclaimers that apply to the journal pertain.
Transcript of Revealing the relationship between vegetable oil ...

Accepted Manuscript
Title: Revealing the relationship between vegetable oilcomposition and oxidative stability: a multifactorial approach
Authors: Lucı́a Redondo-Cuevas, Gloria Castellano, FranciscoTorrens, Vassilios Raikos
PII: S0889-1575(17)30305-8DOI: https://doi.org/10.1016/j.jfca.2017.12.027Reference: YJFCA 3015
To appear in:
Received date: 9-5-2017Revised date: 9-10-2017Accepted date: 14-12-2017
Please cite this article as: Redondo-Cuevas, Lucı́a., Castellano, Gloria., Torrens,Francisco., & Raikos, Vassilios., Revealing the relationship between vegetableoil composition and oxidative stability: a multifactorial approach.Journal of FoodComposition and Analysis https://doi.org/10.1016/j.jfca.2017.12.027
This is a PDF file of an unedited manuscript that has been accepted for publication.As a service to our customers we are providing this early version of the manuscript.The manuscript will undergo copyediting, typesetting, and review of the resulting proofbefore it is published in its final form. Please note that during the production processerrors may be discovered which could affect the content, and all legal disclaimers thatapply to the journal pertain.

1
Type of paper: Original Research Article
TITLE: Revealing the relationship between vegetable oil composition and oxidative stability: a
multifactorial approach
Lucía Redondo-Cuevasa,b,c,*, Gloria Castellanob, Francisco Torrensd, Vassilios Raikosa
a Rowett Institute, University of Aberdeen, Foresterhill, AB25 2ZD, Aberdeen, UK.
b Departamento de Ciencias Experimentales y Matemáticas, Facultad de Veterinaria y Ciencias
Experimentales, Universidad Católica de Valencia San Vicente Mártir, 46001 Valencia, Spain.
c Escuela de Doctorado. Universidad Católica de Valencia San Vicente Mártir, 46008 Valencia, Spain.
d Institut Universitari de Ciència Molecular, Universitat de València, Edifici d’Instituts de Paterna, P.O.
Box 22085, E-46071 València, Spain.
* Corresponding author:
Departamento de Ciencias Experimentales y Matemáticas, Facultad de Veterinaria y Ciencias
Experimentales, Universidad Católica de Valencia San Vicente Mártir, 46001 Valencia, Spain. Tel: +36-
659976047. E-mail address: [email protected]
HIGHLIGHTS
22 oils and fats samples showed a huge diversity in composition
Oils and fats were grouped in 3 differentiated clusters by PCA
TPC and SFA correlate positively with IP
UFA, PUFA and total tocopherols correlate negatively with IP
SFA, MUFA and PUFA account for 67% of variability of IP
ABSTRACT
A detailed composition analysis was performed for 22 diverse oils and fats and included determination
of tocopherols (α, γ and δ), β-carotene, chlorophyll, total phenolic compounds (TPC) and fatty acid (FA)
composition, as well as the determination of their oxidative stability (Rancimat test). Principal
components analysis was applied to obtain an overview of the sample variations and to identify
ACCEPTED MANUSCRIP
T

2
behavioural patterns. Linear regression correlations and a multiple linear regression model were
performed to quantify the relationship between the composition of oils and fats and their oxidative
stability. The TPC and saturated FA were the main individual factors that correlated positively with
oxidative stability (r2 = 0.417, r2 = 0.321 respectively, p < 0.01), whereas unsaturated FA,
polyunsaturated FA and total tocopherols correlated negatively (r2 = 0.304, r2 = 0.264, r2 = 0.223
respectively, p < 0.01). Saturated, monounsaturated and polyunsaturated FA together accounted for
67% of variability and are considered the most important parameters to affect oxidative stability.
Results of this study provide a better understanding of the complex relationship between oil and fat
composition and their oxidative stability, which is an essential step for designing strategies to increase
stability and shelf-life of culinary oils.
ABBREVIATIONS
GAE, gallic acid equivalent
Keywords: Oxidative stability; Rancimat; PCA; regression model; oil; fat; food analysis; food
composition.IP, induction period
MUFA, monounsaturated fatty acid
PC, principal component
PUFA, polyunsaturated fatty acid
TPC, total phenolic content
SFA, saturated fatty acid
UFA, unsaturated fatty acid
ACCEPTED MANUSCRIP
T

3
1. Introduction
Edible vegetable oils are commercially available as fully refined, partially refined, virgin or cold-
pressed, depending on the processing steps involved in oil production. According to Codex
Alimentarius (2015), virgin oils are obtained by mechanical procedures (e.g., expelling or pressing) and
the application of heat only. Cold-pressed oils are obtained by mechanical procedures only without
the application of heat. Both types (virgin or cold-pressed) may have been clarified by washing with
water, settling, filtering and centrifuging. No food additives are permitted in virgin or cold-pressed oils.
Refined oils are typically subjected to several chemical and physical refining processes, including
degumming, neutralization, bleaching and deodorization. Consequently, they suffer losses of phenolic
compounds, tocopherols, phytosterols, and carotenoids and as a result are more susceptible to
oxidative deterioration (Chaiyasit et al., 2007); refined vegetables oils are often fortified with additives,
including synthetic or natural antioxidants, to compensate for losses of endogenous compounds during
the various steps of the manufacturing process (Aladedunye, 2014). An increase of carbonyl
compounds and triglyceride dimers is observed during the refining process; meanwhile a reduction in
oxidizable compounds, such as free fatty acids and oxidised triglyceride monomers and total polar
compounds, is typically observed (Farhoosh et al., 2009). The quality of the oil should be determined
holistically by simultaneously considering the industrial process involved, the chemical composition of
the product and its resulting oxidative stability (Castelo-Branco et al., 2016).
Oxidative stability is an important parameter for evaluating the quality of oils and fats; it refers to the
ability of oils and fats to resist oxidative rancidity (or deterioration) over processing and storage
periods (Hu & Jacobsen, 2016). Lipid oxidation is one of the major causes of oil and fat degradation
during processing and storage, resulting in an alteration of major quality parameters such as color,
flavor, aroma, and nutritive value, due to essential fatty acids degradation and production of toxic
compounds. Many of the oxidation products are highly reactive and may be responsible or contribute
to undesirable in vivo effects in human health, such as cancer, atherosclerosis, heart disease and
allergic responses (Yanishlieva & Marinova, 2001). These processes affect shelf life and their suitability
ACCEPTED MANUSCRIP
T

4
for consumption. The process of oxidation depends mainly on exposure to light, temperature,
availability of oxygen, glyceridic composition, and the nature and concentration of the anti-oxidants
and pro-oxidants (Kochhar, 2016; Choe & Min, 2006). It has been established that oxidation of edible
oils and fats takes place through a chain reaction mechanism that essentially involves an induction
stage; specifically, the time before a dramatic increase in the rate of lipid oxidation is a measure of
oxidative stability and is referred to as the induction time or induction period (Tan et al., 2002). Rapid
and reliable methods are required to assess the stability of edible oils and fats. The Rancimat method
developed by Hadorn & Zurcher (1974), as described in the AOCS Official Method Cd 12b-92, is used
to assess the oxidative stability index (AOCS, 1998). The Rancimat method is a well-established method
to assess the oxidative stability of oils, which is based on the conductometric determination of volatile
degradation products generated by the thermally-induced oxidation of the oils. The end point of
Rancimat is determined by the induction period (time before rapid deterioration of fat occurs), which
is a numerical value used to assess the relative stability of oils and fats. Rancimat is based on the
release of volatiles, indicating the onset of advanced oxidation (termination). This method correlates
with specific measures of advanced oxidation, such as differential scanning calorimetry (Tan et al.,
2002), but also with measures of primary oxidation, such as peroxide value (Gordon & Mursi, 1994)
and electron spin resonance spectroscopy (Velasco et al., 2004). Finally, induction period correlates
with sensory evaluations of rancid flavors and odors in oils (Coppin & Pike, 2001).
Despite the fact that fatty acid composition and other minor compounds such as antioxidants are
known to be of fundamental importance for the process of lipid oxidation, consistent quantifications
of the magnitude of their relative contribution to oxidative stability have proved elusive in edible oils
and fats. Furthermore, although the association between fatty acid composition (saturated vs
unsaturated) and oxidation is well documented, studies have usually demonstrated substantial
deviations from the simple expectation that “the higher the content of unsaturated fatty acids the
lower the corresponding oxidative stability” (Kerrihard et al., 2015). Non-saponifiable components,
naturally present in fats and oils, such as tocopherols or phenol compounds, could also significantly
ACCEPTED MANUSCRIP
T

5
affect oxidative stability (Kamal-Eldin, 2006). Previous studies could not detect correlations between
chemical composition and oxidative stability of edible oils (Ayyildiz et al., 2015; Bozan & Temelli, 2008);
meanwhile others reported significant differences between refined and cold-pressed oils (Castelo-
Branco et al., 2016). The compositional diversity of edible oils and fats, often subjected to variable
processing steps during the manufacturing process, leads to inconclusive or misinterpreted data.
The aim of this study was to elucidates the complex relationship between composition and oxidative
stability of vegetable oils and fats. To meet this objective a high number of products was analysed for
potential components that could singly or in combination affect the induction period of the vegetable
oils. Primarily 22 types of oils and fats were analyzed for fatty acid composition, tocopherols, β-
carotene, chlorophyll, total phenolic content (TPC) and oxidative stability. Secondly, a statistical
evaluation that allows the identification of behaviour patterns (principal components analysis, PCA)
and signifies the relationship between oils’ and fats’ composition and oxidative stability (linear
regression correlations and a multiple linear regression model) was applied. Results generate valuable
information for the oxidative stability of edible vegetable oils and fats, which is one of the critical
factors determining their shelf life.
2. Materials and methods
2.1. Samples
Details of the oils/fats purchased are presented in Table 1. Products without the addition of
tocopherols were selected. Oils and fats were stored in a dark cool place and butter at ‒6 ºC to
prevent oxidation. Methanol, cyclohexane, ethanol, FeCl3, TPTZ reagent, HCl, FeSO4, Folin-
Ciocalteu reagent, sodium carbonate and gallic acid were purchased from Sigma-Aldrich (St
Louis, MO). All reagents used were of analytical grade. Stripped corn oil was purchased from
MP Biomedicals LLC (Santa Ana, CA).
2.2. Determination of Total Lipids as Fatty Acid Methyl Esters (FAMEs)
ACCEPTED MANUSCRIP
T

6
The fatty acid composition is determined by analyzing methyl ester derivatives with gas
chromatography (Liu, 1994). Analysis of the fatty acid methyl esters (FAMEs) was carried out
using a gas chromatograph (HP6890, Hewlett Packard, Avondale, PA) using 50 m × 20 mm
Chrompac CP7488 CP Sil-88 capillary column (film thickness 0.20 μm). Helium was used as
carrier gas at a rate of 0.5 mL/min, and the split/splitless injector was used at a split ratio of
20:1. The injector and detector temperatures were 250 °C. The column oven temperature was
maintained at 80 °C for 1 min after sample injection and was programmed to increase then at
25 °C/min to 160 °C where it was maintained for 3 min. Temperature was then increased to
190 °C at 1 °C/min and then to 230 °C at 10 °C/min. The temperature was maintained at 230
°C for 30 min. Data were analyzed using Chemstation software (Hewlett Packard, Avondale,
PA). The FAMEs were identified by comparison to previously essayed standards.
Measurements were taken in duplicate. Results are expressed as % of total fatty acids.
2.3. Tocopherol and β-carotene content
A reverse-phase HPLC method was used to quantify β-carotene, α-tocopherol, γ-tocopherol and δ-
tocopherol in oils using fluorescence and visible detection according to Hess et al. (1991). The
measurements were taken in triplicate.
β-Carotene and tocopherols were extracted from the oil phase as follows: 20 mg of oil were mixed
with 280 μL Η2Ο and 400 μL ethanol. Each tube was vortexed for 10 seconds and 700 μL of hexane
(containing BHT) and 100 μL of echinone were added and the samples were shaken for 10 min in a
Vortex Genie before centrifugation for 5 min. The supernatant hexane layer (600 μL) was removed and
dried down on a speed vacuum for 10 min. Each sample was then dissolved in 200 μL of DEA (20 %
(v/v) 1,4 dioxan, 20 % (v/v) ethanol, 60 % (v/v) acetonitrile) and was shaken for 5–10 min before
injected for HPLC analysis. The HPLC analysis was performed using a Waters 717 plus Autosampler
Module (Waters Corporation, Milford, MA) equipped with a Waters 2475 scanning fluorescence
detector, a 2487 UV/VIS absorbance detector and a C-18 silica (Beckman Ultrasphere ODS) analytical
ACCEPTED MANUSCRIP
T

7
column (250 × 4.6 mm ID, 5 μm particle size). The eluent used was 67.4% acetonitrile, 22%
tetrahydrofuran, 6.8% methanol containing 1% (w/v) BHT, and 3.8% ammonium acetate. Elution flow
rate was 1.1 mL/min, sample run was 30 min and injection volume was 150 μL. Measurements were
determined with mixed standards containing carotenoids and tocopherols at appropriate
concentrations and results were expressed in μg/g of oil. Echinone was used as an internal standard.
2.4. Total phenolic content (TPC)
Extraction and testing sample preparation was performed as follows: 1 g of oil was measured
into a test tube and then 3 mL of methanol were added. The test tube was vortexed and then
centrifuged at 6000 rpm using a CompactStar CS4 centrifuge (VWR International Ltd, East
Grinstead, UK) for 5 min and the supernatant was collected. The oil residues were re-extracted
twice with methanol (3 mL × 2). The three methanol extracts were combined and the final
volume was brought to 10 mL with methanol to obtain the testing sample solutions. The
resulting antioxidant solution was then kept at 4 °C in the dark for one night until the analysis.
The TPCs of the samples were determined using the Folin-Ciocalteu reagent as described by
Parry et al. (2005). In brief, the reaction mixture contained 50 µL of testing sample solutions,
250 µL of the Folin-Ciocalteu reagent, 0.75 mL of 20% sodium carbonate and 3 mL of pure
water. After 2 h of reaction at ambient temperature, the absorbance at 765 nm was measured by
a Pye Unicam UV-4 UV-Vis scanning spectrophotometer (Spectronic Camspec Ltd., Leeds,
UK) and was used to calculate the phenolic contents of oils using gallic acid as standard.
Measurements were taken in triplicate. The results were expressed as gallic acid equivalents
(GAEs) in micrograms per gram of oil.
2.5. Determination of chlorophyll
The chlorophyll content of oils samples was determined by the method of Minguez-Mosquera
et al. (1991). Oil (7.5 g) was accurately weighed and dissolved in cyclohexane up to a final
volume of 25 mL. Chlorophyll content was calculated from the absorption spectra of the oils at
ACCEPTED MANUSCRIP
T

8
670 nm, measured by a Pye Unicam UV-4 UV-Vis scanning spectrophotometer (Spectronic
Camspec Ltd., Leeds, UK). Absorption at 670 nm is usually considered to be related to the
chlorophyll fraction with pheophytin-a being its major component. The chlorophyll content was
calculated as follows: Chlorophyll (mg/kg) = A670 106/(613 100 d), where A is the
absorbance and d is the spectrophotometer cell thickness (1 cm). Data is reported as mg of
chlorophyll per kg of oil.
2.6. Rancimat - Induction period (IP)
Oxidative stability of oils was determined by the oxidation induction period (IP) in a 743
Rancimat apparatus (Metrohm Ltd., Herisau, Switzerland) according to the AOCS Official
Method Cd 12b-92 (AOCS, 1998). Oil samples (3 g) were heated at 120 °C with a constant
airflow of 20 L/h. The times required for a sharp increase in water conductivity is calculated
automatically by the software and corresponds to the induction period in hours. Measurements
were taken in quadruplicate.
2.7. Statistical analysis
All chemical analyses were performed in duplicate (FAME), triplicate or quadriplicate (the others).
Results of this study were expressed as means with standard deviations. One-way ANOVA followed by
Tukey’s or Games-Howell post-hoc test was used to compare chemical composition and oxidative
stability between oils or fats. These treatments were carried out using SPSS (v.21.0, IBM Corporation,
USA) and the level of statistical significance was set at p < 0.05. Principal component analysis (PCA),
linear regression correlation and multiple linear regression model were performed using Minitab
(Release 17.1.0 for Windows).
3. Results and discussion
3.1. Composition of oils and fats
Details of the studied oils/fats are presented in Table 1, and the fatty acid composition of 22 oils and
fats is presented in Table 2. As expected the fatty acid composition varied considerably between the
ACCEPTED MANUSCRIP
T

9
samples, which is attributed mainly to varietal and genetic differences among plant species, different
stages of seed maturity, geographical and climatic conditions as well as processing effects during the
production (Kamal-Eldin & Andersson, 1997). The fatty acid composition was in accordance with the
Codex Alimentarius Standards (Codex Alimentarius, 2015, 2009) for olive, coconut, rapeseed, sesame
and sunflower (both regular and high oleic acid) oils. The composition of the other oils and fats
included in this study is not described in the Codex Alimentarius.
Coconut oil showed the highest saturated fatty acid composition (94.3 and 92.7% for virgin cold-
pressed and refined respectively), followed by butter (65.2%), ghee (64.1%) and virgin red palm oil
(49.3%). Distinctive differences in the distribution of saturated fatty acids were detected between the
above products. Coconut oil was rich in lauric acid (C12:0), accounting for 52.2% and 47.2% of the total
fatty acid composition for virgin cold-pressed and refined respectively. Meanwhile butter, ghee and
red palm oil were rich in palmitic acid (C16:0), with distributions of 32.8%, 31.8% and 41.2%
respectively. Rapeseed oils (both refined and VCP) were the richest source of α-linolenic acid (C18:33)
contributing 9.24% and 10.8% to the fatty acid composition, respectively. With respect to the
polyunsaturated to saturated fatty acids ratio (PUFA/SFA), sunflower VCP and sunflower oil generated
the highest values (6.48 and 5.23 respectively), whereas coconut VCP and coconut oil showed the
lowest values (0.01 and 0.02 respectively). In addition, butter, ghee, red palm oil and all types of olive
oils showed a low PUFA/SFA ratio.
Tocopherols, β-carotene, TPC and chlorophyll content of oils and fats are shown in Table 3.
Tocopherol content was in accordance with the Codex Alimentarius standards for coconut,
rapeseed, sunflower oils and small differences were observed for sesame and high oleic
sunflower oil (Codex Alimentarius, 2009). Tocopherol content in oils may be affected by
climate, genetic variety and is also largely dependent on the production process, as reported for
Brazil-nut oil (Funasaki et al., 2013), flaxseed oil (Obranović et al., 2015) and olive oil (Špika
et al., 2016). The highest amounts of total tocopherols without significant differences between
ACCEPTED MANUSCRIP
T
10
them were presented by sunflower and rapeseed oil in the following order: sunflower oil,
sunflower oil VCP, rapeseed oil and rapeseed oil VCP. Szydłowska-Czerniak et al. (2008)
analyzed the total tocopherol content of rapeseed and olive oils subjected to different grades of
refining; data from rapeseed oils were in accordance with our results (between 555 and 690
mg/kg), but not for olive oils, which demonstrated lower levels (80–190 mg/kg) compared to
our results. In agreement with Dauqan et al. (2011), tocopherols were not detected in coconut
oils. Unsurprisingly, the lowest tocopherol levels were detected in stripped corn oil followed
by butter and ghee. α-Tocopherol was the major tocopherol in all olive oils, without significant
differences between them, whereas γ-tocopherol was the most abundant in rapeseed oils,
sesame oils and corn oil. With respect to vitamin E activity, α-tocopherol is the most effective
form because of the specificity of absorption and distribution within the human body (Galli et
al., 2016). However, γ-tocopherol might be more effective in increasing oxidative stability
(Seppanen et al., 2010) and antioxidant activity of oils (Castelo-Branco et al., 2016).
Red palm oil was the only sample to contain significant amounts of β-carotene (133 g/g). Dauqan et
al. (2011) reported an even higher content of β-carotene in red palm oil (542 g/g). β-Carotene, a
provitamin A molecule, is the main pigment that gives red palm oil its distinctive orange-red color.
Bioavailability of β-carotene from red palm oil is higher compared to other vegetable sources and this
type of oil is highly efficacious in improving vitamin A status among populations at risk of vitamin A
deficiency (You et al., 2002).
Surprisingly, refined coconut oil followed by virgin cold-pressed coconut oil showed the highest TPC,
compared to all other samples. This is because they are different samples from different soil types.
Marina et al. (2009) reviewed coconut composition and reported a higher TPC in virgin coconut oils
compared to refined oils of the same source. It was concluded that TPC is highly variable depending
on coconut varieties and the oil extraction processes, which could account for the opposing results of
the present study. Arlee et al. (2013) reported relatively lower TPC data for cold-pressed coconut oil
ACCEPTED MANUSCRIP
T

11
from six varieties of coconut cultivars (486–579 g GAE/g oil), which are not distinctively different from
our results. Toasted sesame oil also showed higher TPC (50155.1 g GAE/g oil), compared to
untoasted sesame oil. Toasted sesame oil is produced by pressing toasted sesame seeds at
approximately 200 °C which gives oil its dark colour and characteristic flavour, mainly because of the
generation of Maillard reaction-mediated products. It has been reported that TPC increased
significantly with the roasting process of sesame seeds (Jannat et al., 2013). Virgin cold-pressed
rapeseed oil (VCP) showed the lowest TPC value (137 μg GAE/g) which was even lower than the one
determined for refined rapeseed oil (202 μg GAE/g). Koski et al. (2003) reported a decrease in the
phenolic content detected in rapeseed oil with increasing degree of refining. This suggests that our
results are most likely attributed to other variability factors (i.e. cultivar). When comparing the TPC of
olive oil samples, virgin and extra virgin demonstrated higher values than the blended one with one
exception (VA2). Olive oils showed TPC values between 294 and 459 g GAE/g, which is in agreement
with reported values (148 to 1,212 g GAE/g) measured in 22 commercial extra virgin olive oils
(Galvano et al., 2007).
Chlorophyll content is typically high in virgin olive oils and accounts for their distinctive light green
color. Chlorophyll acts as antioxidant when the oils are kept in the dark at low temperatures and may
have a pro-oxidant activity when samples are exposed to light (Giuliani et al., 2011). Concentration of
chlorophyll pigments in virgin olive oil is strongly related to the ripening stage of the fruit at the time
of harvest, regardless of the variety of olives. Oils produced from unripe olives show a higher content
of chlorophylls than those obtained from fruits harvested when completely ripe (Giuliani, et al., 2011).
In the present study, this is noticeably evident when comparing the chlorophyll content of Cornicabra
variety made from 80% green olives (ECV2, 8.26 mg/kg) with the one from 100% ripe olives (VC1, 1.74
mg/kg).
Virgin vegetable oils contain different types of natural antioxidants in variable amounts. During the
refining process, vegetable oils suffer a reduction of antioxidants (Chen et al., 2011). For example, the
overall loss of total tocopherols during refining was reported to be 37.9% for sunflower oil (Naz et al.,
ACCEPTED MANUSCRIP
T

12
2011). In the present study, it was not feasible to directly compare refined and virgin versions of the
same vegetable oil since the oils are not produced from the same source. Vegetable oil composition of
the finished product including antioxidants, is dependent on several parameters, which are
summarized by the extraction process and type of refining, olive or seed variety, edaphoclimatic
conditions, harvesting period and technique, fruit ripening degree and others (Santos et al., 2013).
3.2. Oxidative stability (IP) of oils and fats
Data from induction period (IP) of 22 fats and oils are presented in Figure 1. Virgin cold-pressed
coconut oil (VCP) showed the highest oxidative stability, which was significantly different (p < 0.05)
compared to all other oils. The IP of coconut oil VCP was not calculated directly using Rancimat
software because the apparatus failed to terminate the measurement automatically within a
reasonable period of time. Instead measurements were taken at 140 ºC (16.44 0.11 h), 160 ºC (3.16
0.14 h) and 180 ºC (0.68 0.01h) and IP at 120 ºC was calculated (65.01 2.69) from the temperature
acceleration factor, known as Q10. The determination of Q10 that based on the increase in oxidation
rate produced by a 10 °C increase in temperature (Frankel, 2012).
Virgin olive oil from Cornicabra variety made with 80% green olives (ECV2), generated the second
highest IP, which was significantly higher (p < 0.05) than the IP of all the remaining olive oils and even
the refined coconut oil. Montaño et al. (2016) compared the IP of oils from seven varieties of olives
(Arbequina, Cornicabra, Manzanilla Cacereña, Manzanilla de Sevilla, Morisca, Pico Limón and Picual)
using a Rancimat apparatus under a different experimental set-up to the one of the present study (100
ºC, air flow 15 L/h). The highest IP values (p < 0.05) reported were for oils from Picual and Cornicabra
olives, whereas Arbequina and Morisca varieties showed the lowest values. In the same study, olives
were collected on three harvesting dates from at least three different groves in varied locations; hence,
the results are conclusive with respect to the effect of olive variety and not the ripeness state. In the
present study, the lowest IP (p < 0.05) between monovarietal virgin olive oils was found in Hojiblanca
and the highest in Cornicabra olive oil.
ACCEPTED MANUSCRIP
T

13
Previous studies determined the IP oils and fats using the same experimental conditions as the present
study (120 ºC, air flow 20 L/h) and the results are documented as follows: ghee ‒ 10.57 h (Pawar et al.,
2014); refined rapeseed oil ‒ 4.10 h (Anwar et al., 2003) and 5.9 h (Kowalski et al., 2004); refined
sunflower oil ‒ 1.89 h (Anwar et al., 2003), 3.05h (Ayyildiz et al., 2015) and 3.5 h (Kowalski et al., 2004);
butter ‒ 5.00 to 6.03h (Anwar et al., 2003); olive oil ‒ 6.42 h (Läubli & Bruttel, 1985); virgin olive oils ‒
3.7 to 48.3 h (Mateos et al., 2006). As a general rule, virgin oils showed a longer IP, due to the presence
of minor antioxidant compounds (Chaiyasit et al., 2007); however, refined sunflower and rapeseed oils
showed longer IP values than their respective virgin cold-pressed oils. Wroniak et al. (2008) also
reported Rancimat data which suggest that cold-pressed rapeseed oils (5.08 h) were more readily
oxidized in comparison with the same oil subjected to a full refining process (5.37 h).
Farhoosh & Moosavi (2007) confirmed that oxidative stability of oils determined via the Rancimat test
cannot guarantee or predict the actual frying performance of the oil, but it is considered that this
method can be useful to act as a “screening” test and eliminate the possibility of introducing lower
stability oils into the production area with its consequences. They proposed that assuming a value of
24% of total polar compounds that indicates the maximum permitted levels in frying oils (i.e. discard
point level), the corresponding IP of the oil should be 2.32 h for frying oils (Farhoosh & Moosavi,
2007). According to the findings of the present study, sunflower VCP, sesame and sunflower oil are
below this point (Figure 1). Hence it may be concluded that these oils not suitable for frying purposes.
Stripped corn oil is also below the limit; however, this product is not intended for human or animal
consumption and is supplied for laboratory use only.
3.3. Principal components analysis (PCA)
The following fourteen variables were used for statistical assessment: IP, α-tocopherol, γ-tocopherol,
δ-tocopherol, total tocopherols, β-carotene, chlorophyll, TPC, saturated fatty acids (SFA),
monounsaturated fatty acids (MUFA), polyunsaturated fatty acids (PUFA), unsaturated fatty acids
(UFA), PUFA/SFA and UFA/SFA ratios.
ACCEPTED MANUSCRIP
T

14
PCA was applied to reduce the initial variables to a small number of principal components (PCs), in
order to obtain an overview of the sample variations and identify behavioral patterns. Figure 2 shows
the bi-dimensional representation of oils and fats (Figure 2A) and all the variables taken into
consideration (Figure 2B) for the first two PCs. The variance explained by PC1 and PC2 is 66.6%. PC1
(46.3% of the total variance) showed positive loading mainly with total tocopherols, UFA/SFA ratio,
UFA and PUFA/SFA ratio, and negative loading with SFA, TPC and IP. PC2, which explained 20.3% of
the total variance, was positively correlated with MUFA and chlorophyll, and negatively with PUFA.
Figure 2B describes the behaviour of the variables. The most remote properties of the 0.0 point are
more important for describing PCs, and those closest to 0.0, as β-carotene, are less important.
Oils and fats are distributed into three major clusters (Figure 2A). Cluster 1 exclusively includes samples
characterized by the presence of SFA, TPC and IP, and is low in UFA content. It can be shown that
coconut oils are more separated from red palm oil, butter and ghee, due to the higher values in SFA,
TPC and IP. All the samples included in Cluster 1 are solids at room temperature, due to their relative
high content of SFA. Olive oils and high oleic sunflower oil are grouped in Cluster 2, due mainly to their
high MUFA content. High oleic sunflower oil was separated from olive oils because of differences in
chlorophyll content. Finally, seed oils (except high oleic sunflower oil), which are all high in PUFA
content and tocopherols (primarily δ-tocopherol), are distributed in Cluster 3.
3.4. Influence of chemical composition on oxidative stability (IP)
Linear regression correlation analysis showed that TPC, SFA, UFA, PUFA and total tocopherols were the
major contributors to the oxidative stability (IP), as indicated by the correlation values (Table 4). TPC
and SFA were positively correlated with IP. A positive correlation between TPC and IP in virgin olive
oils has been extensively documented (Montaño et al., 2016; Manai-Djebali et al., 2012; Martínez
Nieto et al., 2010; Caponio et al., 2001). On the other hand, Ayyildiz et al. (2015) concluded that no
correlation between the IP of six fully-refined edible oils and fatty acid composition or tocopherols
content could be detected. Furthermore, Bozan & Temelli (2008) reported similar findings (no
ACCEPTED MANUSCRIP
T

15
correlation) between the oxidative stability of flax, safflower and poppy oils and their corresponding
fatty acid composition, tocopherols or total phenolic compounds.
The UFA, PUFA and total tocopherols were negatively correlated with IP (Table 4). The antioxidant
behaviour of tocopherols in vegetable oils is not yet fully understood and there is evidence that it is
manifested in a concentration-dependent manner. The “loss of efficacy” of tocopherols at high
concentrations, sometimes referred to as a “pro-oxidant effect”, is witnessed by an increase in the rate
of oxidation during the induction period. This effect is more profound for α-tocopherol, but is also
evident for other tocopherols (Kamal-Eldin, 2006). A positive correlation was observed for tocopherols
with UFA and PUFA (r = 0.665 and r = 0.613, respectively, p < 0.01), and a negative correlation with SFA
(r = ‒0.664, p < 0.01). This suggests that tocopherols are predominantly present in oils or fats with high
unsaturated fatty acid content to confer protection against oxidation. A multivariate analysis of 14
vegetable oils showed natural interrelations between α-tocopherol and linoleic acid (r = 0.549, p <
0.05) and between α-linolenic acid and γ-tocopherol (Kamal-Eldin & Andersson, 1997). Kamal-Eldin
(2006) suggested that vegetable oils which are more susceptible to oxidation (i.e. high unsaturated
content), are privileged by nature to contain optimal tocopherol levels for their stabilization.
A multiple linear regression model approach was adopted to determine the quantitative importance
of the combined presence of 9 variables (α-tocopherol, γ-tocopherol, δ-tocopherol, β-carotene,
chlorophyll, TPC, SFA, MUFA, and PUFA) on the oxidative stability of the oils and fats. The equation for
this model between the summary of analyzed compounds and oxidative stability (IP) was as follows:
IP = ‒1356 + 0.0125[α-tocopherol] + 0.0161[γ-tocopherol] – 0.02[δ-tocopherol] – 0.074[β-carotene]
+ 1.99[chlorophyll] – 0.0333[TPC] + 14.32[SFA] + 13.66[MUFA] + 13.51[PUFA]; r2 = 0.765 (1)
The three variables that showed a higher coefficient in the equation (SFA, MUFA and PUFA) are the
same that mainly grouped the three clusters in PCA analysis. Taking into account these compounds,
the equation was further simplified in the form below:
IP = -904 + 9.49 [SFA] + 9.16 [MUFA] + 8.94 [PUFA]; r2 = 0.670 (2)
ACCEPTED MANUSCRIP
T

16
Some notable exceptions for both equations include coconut oil (both refined and VCP) samples. The
later samples exhibited a much higher stability which would not fit to the multiple linear regression
model signified by the above equations.
Linear regressions suggest that TPC is the most important individual factor (explaining 41.7% of
variability); when all the parameters are considered, SFA, MUFA and PUFA in combination appear to
be the most important factors (explaining 67% of variability). These results are in agreement with
previously published studies aiming to correlate oxidative stability of 50 refined plant-based oils and
fats with fatty acid composition (Kerrihard et al., 2015). According to the findings of this study, the
concentrations of MUFA, di and tri-unsaturated fatty acids (DiUFA and TriUFA, respectively) in
combination correlate strongly (r2 = 0.915) with the oxidative stability of the samples. The
contributions of MUFA, DiUFA and TriUFA in the present study were also assessed by a multiple linear
regression model approach, resulting in a lower correlation value (r2 = 0.401). When refined, non-
refined and cold-pressed oils and fats are studied, the presence of minor compounds (e.g., phenolic
compounds) also impacts on the oxidative stability. This may at least partially explain the lower
correlation observed between fatty acid composition and IP in the present study. Castelo-Branco et al.
(2016) described that α- and γ-tocopherol in combination correlated (r2 = 0.916) with oxidative
stability of 17 samples (9 different oils, refined and cold-pressed). In the present study α- and γ-
tocopherol explained significantly lower variability (r2 = 0.223).
4. Conclusions
The selected oils and fats (n = 22) showed a huge diversity in composition, which helped to better
understand distinctive differences in their oxidative stability. PCA enabled us to group samples into
three different clusters according to their compositional data and oxidative stability:
1. high in SFA, fats (solids at ambient temperature),
2. high in MUFA, olive oils and high oleic sunflower oil,
3. high in PUFA, seed oils.
ACCEPTED MANUSCRIP
T

17
Edible oils and fats contain natural compounds that could act as antioxidants or pro-oxidants. Linear
regressions suggested, on one hand, that TPC and SFA were the most important individual factors
(explaining 41.7% and 32.1% of variability, respectively), which correlated positively with IP. On the
other hand, UFA, PUFA and total tocopherols showed a negative correlation with oxidative stability
(30.4%, 26.4% and 22.3%, respectively). When all the parameters were taken in account, nine
compounds (SFA, MUFA, PUFA, chlorophyll, β-carotene, TPC, δ-, γ- and α-tocopherol) explained 76.5%
of total variability (equation 1), whereas SFA, MUFA and PUFA combined explained 67% of variability
(equation 2). This suggests that the type of fatty acid is critically important for the oxidative stability of
oils and fats, but to a lesser extent than previously described for refined oils (Kerrihard et al., 2015).
The study of a diversity of oils and fats (refined, but also non-refined and cold-pressed) leads to a better
understanding of the behavior of their oxidation stability.
ACKNOWLEDGEMENTS
Funds for the study were provided by the Scottish Government's Rural and Environment
Science and Analytical Services Division and conducted as part of the Scottish Government
Strategic Research program. The authors acknowledge financial support from Generalitat
Valenciana (Project No. PROMETEO/2016/094) and Universidad Católica de Valencia San
Vicente Mártir (Projects Nos. PRUCV/2015/617 and 2017). Authors would like to thank
Agrovillaserra S.L. (Villajos) for providing monovariatal virgin olive oils. L. Redondo-Cuevas
acknowledges Catholic University of Valencia San Vicente Mártir for providing the grant to
support the stay in Scotland.
References
Aladedunye, F.A. (2014). Natural antioxidants as stabilisers of frying oils. European Journal of Lipid
Science and Technology, 116, 688-706.
ACCEPTED MANUSCRIP
T
18
Anwar, F., Bhangerb, M.I., Kazib, T.G. (2003). Relationship between rancimat and active oxygen
method values at varying temperatures for several oils and fats. Journal of the American Oil
Chemists' Society, 80, 151–155.
AOCS (1998) Official methods and recommended practices of the American Oil Chemists’ Society (5th
ed)., edited by D. Firestone. In: AOCS Press, Champaign, Illinois.
Arlee, R., Suanphairoch, S., Pakdeechanuan, P. (2013). Differences in chemical components and
antioxidant-related substances in virgin coconut oil from coconut hybrids and their parents.
International Food Research Journal, 20, 2103–2109.
Ayyildiz, H.F., Topkafa, M., Kara, H., Sherazi S.T. (2015). Evaluation of Fatty Acid Composition, Tocols
Profile, and Oxidative Stability of Some Fully Refined Edible Oils. International Journal of Food
Properties, 18, 2064–2076.
Bozan, B. Temelli, F. (2008). Chemical composition and oxidative stability of flax, safflower and poppy
seed and seed oils. Bioresource Technology, 99, 6354–6359.
Caponio, F., Gomes, T., Pasqualone, A. (2001). Phenolic compounds in virgin olive oils: influence of the
degree of olive ripeness on organoleptic characteristics and shelf-life. European Food Research
and Technology, 212, 329–333.
Castelo-Branco, V.N., Santana, I., Di-Sarli, V.O., Pereira Freitas, S. Guedes Torres. A. (2016). Antioxidant
capacity is a surrogate measure of the quality and stability of vegetable oils. European Journal
of Lipid Science and Technology, 118, 224–235.
Chaiyasit, W., Elias, R.J., McClements, D.J., Decker, E.A. (2007). Role of Physical Structures in Bulk Oils
on Lipid Oxidation. Critical Reviews in Food Science and Nutrition, 47, 299-317.
Chen, B., McClements, D.J., Decker, E.A. (2011). Minor components in food oils: a critical review of
their roles on lipid oxidation chemistry in bulk oils and emulsions. Critical Reviews in Food
Science and Nutrition, 51, 901-916.
ACCEPTED MANUSCRIP
T

19
Choe, E., Min, D.B. (2006). Mechanisms and Factors for Edible Oil Oxidation. Food Science and Food
Safety, 5, 169–186.
Codex Alimentarius (2015). Standard for Olive oils and Olive Pomace oils (CODEX STAN 33 – 1981, Rev.
3-2015).
Codex Alimentarius (2009). Standard for Named Vegetable Oils (CODEX-STAN 210 – 1999,
Rev. 3-2009).
Coppin, E.A., Pike, O.A. (2001). Oil stability index correlated with sensory determination of oxidative
stability in light-exposed soybean oil. Journal of the American Oil Chemists' Society, 78, 13–18.
Dauqan, E., Sani, H.M., Abdullah A., Muhamad, H., Gapor, A. (2011). Vitamin E and Beta Carotene
Composition in Four Different Vegetable Oils. American Journal of Applied Sciences, 8, 407-412.
Farhoosh, R., Einafshar, S., Sharayei, P. (2009). The effect of commercial refining steps on the rancidity
measures of soybean and canola oils. Food Chemistry, 115, 933–938.
Farhoosh, R., Moosavi, S. M. R. (2007). Rancimat test for the assessment of used frying oils quality.
Journal of Food Lipids, 14, 263–271.
Frankel, E.N. (2012). Lipid oxidation. (2nd ed). Sawston, Cambridge, UK: Woodhead Publishing Ltd.
Funasaki, M., Menezes, I.S., Barroso, H.S., Zanotto, S.P., Carioca, C.R.F. (2013). Tocopherol profile of
Brazil nut oil from different geographic areas of the Amazon region. Acta Amazonica, 43, 505-
510.
Galli, F., Azzi, A., Birringer, M., Cook-Mills, J.M., Eggersdorfer, M., Frank, J., Cruciani, G., Lorkowski, S.,
Özer, N.K. (2016). Vitamin E: Emerging aspects and new directions. Free Radical Biology &
Medicine, 102, 16-36. ACCEPTED M
ANUSCRIPT

20
Galvano, F., La Fauci, L., Graziani, G., Ferracane, R., Masella, R., Di Giacomo, C., Scacco, A., D'Archivio,
M., Vanella, L., Galvano, G. (2007). Phenolic compounds and antioxidant activity of Italian extra
virgin olive oil Monti Iblei. Journal of Medicinal Food, 10, 650-656.
Giuliani, A., Cerretani, L., Cichelli, A. (2011). Chlorophylls in olive and in olive oil: chemistry and
occurrences. Critical Reviews in Food Science and Nutrition, 51, 678-690.
Gordon, M.H., Mursi, E. (1994). A comparison of oil stability based on the metrohm rancimat with
storage at 20°C. Journal of the American Oil Chemists’ Society, 71, 649–651.
Hadorn, H., Zurcher, K. (1974). Zur Bestimmung der Oxydations-stabilitat von Olen und
Fetten. Deutsche Lebensmittel Rundschau, 70, 57–65.
Hess, D., Keller, H. E., Oberlin, B., Bonfanti, R., Schüep, W. (1991). Simultaneous
determination of retinol, tocopherols, carotenes and lycopene in plasma by means of high-
performance liquid chromatography on reversed phase. International Journal of Vitamin
and Nutrition Research, 61, 232–238.
Hu, M., Jacobsen, C. (2016). Oxidative stability and shelf life of foods containing oils and fats. San Diego,
CA: AOCS Press.
Jannat, B., Oveisi, M.R., Sadeghi, N., Hajimahmoodi, M., Behzad, M., Nahavandi, B, Tehrani, S., Sadeghi,
F., Oveisi, M. (2013). Effect of Roasting Process on Total Phenolic Compounds and γ-tocopherol
Contents of Iranian Sesame Seeds (Sesamum indicum). Iranian Journal of Pharmaceutical
Research, 12, 751-758.
Kamal-Eldin, A. (2006). Effect of fatty acids and tocopherols on the oxidative stability of vegetable oils.
European Journal of Lipid Oxidation, 108, 1051–1061.
Kamal-Eldin, A., Andersson, R. (1997). A multivariate study of the correlation between tocopherol
content and fatty acid composition in vegetable oils. Journal of the American Oil Chemists'
Society, 74, 375–380.
ACCEPTED MANUSCRIP
T

21
Kerrihard, A.L., Nagy, K., Craft, B.D., Beggio, M., Pegg, R.B. (2015). Oxidative Stability of Commodity
Fats and Oils: Modeling Based on Fatty Acid Composition. Journal of the American Oil Chemists'
Society, 92, 1153–1163.
Kochhar, P. (2016). Thermal Stability of Fats for High Temperature Applications. In T. A. B.
Sanders (Ed.), Functional Dietary Lipids: Food Formulation, Consumer Issues and
Innovation for Health, (pp.103-148). United Kingdom: Woodhead Publishing, Elsevier.
Koski, A., Pekkarinen, S., Hopia, A., Wähälä, K., Heinonen, M. (2003). Processing of rapeseed oil: effects
on sinapic acid derivative content and oxidative stability. European Food Research and
Technology, 217, 110-114.
Kowalski, B., Ratusz, K., Kowalska, D., Bekas, W. (2004). Determination of the oxidative stability of
vegetable oils by Differential Scanning Calorimetry and Rancimat measurements. European
Journal of Lipid Science and Technology, 106, 165–169.
Läubli, M.W., Bruttel, P.A. (1985). Determination of the oxidative stability of fats and oils: Comparison
between the active oxygen method (AOCS Cd 12-57) and the rancimat method. Journal of the
American Oil Chemists’ Society, 63, 792–795.
Liu K-S. (1994). Preparation of fatty acid methyl esters for gas-chromatographic analysis of lipids in
biological materials. Journal of the American Oil Chemists’ Society, 71, 1179–1187.
Manai-Djebali, H., Krichène, D., Ouni, Y, Gallardo, L., Sánchez, J., Osorio, E., Daoud, D., Guido, F.,
Zarrouk, M. (2012). Chemical profiles of five minor olive oil varieties grown in central Tunisia.
Journal of Food Composition and Analysis, 27, 109-119.
Marina, A.M., Che Man, Y.B., Amin I. (2009). Virgin coconut oil: emerging functional food oil. Trends in
Food Science & Technology, 20, 481–487.
ACCEPTED MANUSCRIP
T

22
Martínez Nieto, L., Hodaifa, G., Lozano Peña, J.L. (2010). Changes in phenolic compounds and Rancimat
stability of olive oils from varieties of olives at different stages of ripeness. Journal of the Science
of Food and Agriculture, 90, 2393-2398.
Mateos, R., Uceda, M., Aguilera, M.P., Escuderos, M.E., Beltrán Maza, G. (2006). Relationship of
Rancimat method values at varying temperatures for virgin olive oils. European Food Research
and Technology, 223, 246–252.
Minguez-Mosquera, M.I., Rejano, L., Gandul, B., Sanchez, A.H., Garrido, J. (1991). Color
pigment correlation in virgin olive oil. Journal of the American Oil Chemists' Society, 68,
332–336.
Montaño, A., Hernández, M., Garrido, I., Llerena, J.L., Espinosa, F. (2016). Fatty Acid and
Phenolic Compound Concentrations in Eight Different Monovarietal Virgin Olive Oils
from Extremadura and the Relationship with Oxidative Stability. International Journal
of Molecular Sciences, 17(11).
Naz, S., Sherazi, S.T.H., Talpur, F. (2011). Changes of total tocopherol and tocopherol species during
sunflower oil processing. Journal of the American Oil Chemists' Society, 88, 127–132.
Obranović, M., Škevin, D. Kraljić, K. Pospišil, M., Neđeral, S. Blekić, M., Putnikc, P. (2015). Influence of
Climate, Variety and Production Process on Tocopherols, Plastochromanol-8 and Pigments in
Flaxseed Oil. Food Technology and Biotechnology, 53, 496–504.
Parry, J.W., Su, L., Luther, M., Zhou, K., Yurawecz M. P., Whittaker, P., Yu, L. (2005). Fatty
Acid Content and Antioxidant Properties of Cold-Pressed Marionberry, Boysenberry,
Red Raspberry, and Blueberry Seed Oils. Journal of Agricultural and Food Chemistry,
53, 566–573.
Pawar, N. Purohit, A., Gandhi, K., Arora, S., Singh, R.R.B. (2014). Effect of operational parameters on
determination of oxidative stability measured by Rancimat method. International Journal of
Food Properties, 17, 2082–2088.
ACCEPTED MANUSCRIP
T

23
Santos, C.S.P., Cruz, R., Cunha, S.C., Casal, S. (2013). Effect of cooking on olive oil quality attributes.
Food Research International, 54, 2016–2024.
Seppanen, C.M., Song, Q., Csallany, A.S. (2010). The antioxidant functions of tocopherol and
tocotrienol homologues in oils, fats, and food systems. Journal of the American Oil
Chemists' Society, 87, 469-481.
Špika, M.J., Kraljić, K., Škevin, D. (2016). Tocopherols: Chemical Structure, Bioactivity, and Variability in
Croatian Virgin Olive Oils. In D. Boskou, & M. L. Clodoveo (Eds.), Products from Olive Tree. InTech.
Szydłowska-Czerniak, A., Karlovits, G., Dianoczki, C., Recseg, K., Szłyk, E. (2008).
Comparison of Two Analytical Methods for Assessing Antioxidant Capacity of Rapeseed
and Olive Oils. Journal of the American Oil Chemists' Society, 85, 141–149.
Tan, C.P, Che Man, Y.B., Selamat, K., Yusoff, M.S.A. (2002). Comparative studies of oxidative stability
of edible oils by differential scanning calorimetry and oxidative stability index methods. Food
Chemistry, 76, 385–389.
Velasco, J., Andersen, M.L., Skibsted, L.H. (2004). Evaluation of oxidative stability of vegetable oils by
monitoring the tendency to radical formation. A comparison of electron spin resonance
spectroscopy with the Rancimat method and differential scanning calorimetry. Food Chemistry,
85, 623–632.
Wroniak, M., Krygier, K., Kaczmarczyk, M. (2008). Comparison of the quality of cold pressed and virgin
rapeseed oils with industrially obtained oils. Polish Journal of Food and Nutrition Sciences, 58,
85-89.
Yanishlieva, N.V., Marinova, E.M. (2001). Stabilisation of edible oils with natural antioxidants, European
Journal of Lipid Science and Technology, 103, 752-767.
ACCEPTED MANUSCRIP
T

24
You, C.S., Parker, R.S., Swanson, J.E. (2002). Bioavailability and vitamin A value of carotenes from red
palm oil assessed by an extrinsic isotope reference method. Asia Pacific Journal of Clinical
Nutrition, 11, S438-42.
Figure Caption
ACCEPTED MANUSCRIP
T

25
Figr-1
ACCEPTED MANUSCRIP
T

26
Figr-2
ACCEPTED MANUSCRIP
T

27
Table 1
Abbreviated names, description and origin of oils and fats
Oil or fat Characteristics Brand Place of purchase
Corn oil Tocopherol stripped, for
laboratory use only
MP
Biomedicals
Sigma–Aldrich, Co Ltd
(Dorset, UK)
Olive oil Blended (refined and
virgin) Tesco
Tesco supermarket
(Aberdeen, Scotland)
Olive oil EV Extra virgin Tesco Tesco supermarket
(Aberdeen, Scotland)
Olive oil VC1 Virgin, from Cornicabra
olives (100% ripe) Villajos
Villajos, Agrovillasierra
S.L. (Spain)
Olive oil
EVC2
Extra virgin, from
Cornicabra olives (80%
green)
Villajos Villajos, Agrovillasierra
S.L. (Spain)
Olive oil VA1 Virgin, from Arbequina
olives (70% green) Villajos
Villajos, Agrovillasierra
S.L. (Spain)
Olive oil VA2 Virgin, from Arbequina
olives (10% green) Villajos
Villajos, Agrovillasierra
S.L. (Spain)
Olive oil EVP Extra virgin, from Picual
olives (50% green) Villajos
Villajos, Agrovillasierra
S.L. (Spain)
Olive oil
EVH
Extra virgin, from
Hojiblanca olives (10%
green)
Villajos Villajos, Agrovillasierra
S.L. (Spain)
Sunflower oil Refined Tesco Tesco supermarket
(Aberdeen, Scotland)
Sunflower oil
VCP Virgin cold pressed, organic NaturGreen
Sabor del Monte,
Valencia (Spain)
Sunflower oil
HO High oleic, refined, organic Spectrum iHerb (USA)
Rapeseed oil Refined Goldenfields Tesco supermarket
(Aberdeen, Scotland)
Rapeseed oil
VCP Virgin cold pressed Tesco
Tesco supermarket
(Aberdeen, Scotland)
Sesame oil Refined Spectrum iHerb (USA)
Sesame oil
VCP Virgin cold pressed, organic
Sabor del
Monte
Sabor del Monte,
Valencia (Spain)
Toasted
sesame oil V
With toasted seed, virgin,
organic Spectrum iHerb (USA)
Coconut oil Refined KTC Tesco supermarket
(Aberdeen, Scotland)
Coconut oil
VCP Virgin cold pressed, organic Dr. Goerg
Sabor del Monte,
Valencia (Spain)
Red palm oil
V Virgin, organic Nutiva iHerb (USA)
Butter Tesco Tesco supermarket
(Aberdeen, Scotland)
ACCEPTED MANUSCRIP
T

28
Ghee East End Tesco supermarket
(Aberdeen, Scotland)
Table 2
Fatty acid composition (expressed as % of total fatty acids) of 22 oils and fats:
OIL/FAT 12
:0 14:0
16:
0
18:
0
18:
1
9
18:
2
6
18:
3
3
M
U
F
A
P
U
F
A
U
F
A
S
F
A
PU
FA
/S
FA
U
F
A/
S
F
A
1 Corn oil 0.0 0.03
0.0
11.
1
0.0
2
1.9
8
0.0
28.
3
0.0
1
55.
8
0.0
6
1.1
7
0.0
1
2
8.
5
5
7.
2
8
5.
7
14
4.09
6.14
2 Olive oil 0.0 0.02
0.0
11.
20.0
2
3.6
70.0
1
74.
70.0
3
7.3
60.0
5
0.9
4
0.0
7
5
.
8
8
.
5
9
8
4
.
3
1
5
.
6
0.5
5
5.
40
3 Olive oil EV 0.0 0.01
0.0
10.
50.0
1
3.8
00.0
1
76.
60.0
1
6.0
50.0
1
0.9
20.0
7
7
.
7
7
.
2
2
8
4
.
9
1
5
.
0
0.4
8
5.
65
4 Olive oil VC1 0.0 0.01
0.0
7.2
4
0.1
8
3.0
8
0.0
9
82.
7
0.4
3
4.4
0
0.1
1
0.8
4
0.0
3
8
3.
8
5
.6
1
8
8.
8
1
1.
4
0.49
8.00
5 Olive oil EVC2 0.0 0.01
0.0
10.
60.0
1
3.1
7
0.0
79.
40.1
0
3.5
70.0
5
0.8
8
0.0
8
0
.
5
4
.
8
1
8
5
.
1
1
4
.
7
0.3
3
5.
81
6 Olive oil VA1 0.0 0.02
0.0
12.
80.0
3
2.2
10.0
1
74.
30.0
1
7.3
00.0
1
0.7
50.0
7
5
.
7
8
.
2
8
8
4
1
5
.
8
0.5
3
5.
34
7 Olive oil VA2 0.0 0.02
0.0
12.
4
0.0
1
2.0
9
0.0
74.
5
0.0
5
7.6
1
0.0
2
0.7
7
0.0
7
5.
9
8
.6
5
8
4.
5
1
5.
3
0.57
5.55
8 Olive oil EVP 0.0 0.01
0.0
11.
00.0
3
3.6
10.0
1
78.
20.0
1
4.2
10.0
0.8
40.0
7
9
.
2
5
.
3
1
8
4
.
5
1
5
.
4
0.3
5
5.
51
9 Olive oil EVH 0.0 0.02
0.0
13.
20.0
1
3.0
20.0
1
70.
90.0
2
9.2
40.0
3
0.9
30.0
7
2
.
4
1
0
.
4
8
2
.
8
1
7
.
0
0.6
1
4.
87
10 Sunflower oil 0.0 0.08
0.0
6.6
1
0.0
4
3.4
6
0.0
1
27.
8
0.1
6
60.
2
0.2
5
0.0
0.
0
2
8.
2
6
0.
6
8
8.
4
1
1.
6
5.23
7.66
11 Sunflower oil
VCP 0.0
0.07
0.0
5.9
80.0
1
3.5
00.0
19.
50.0
4
69.
40.0
8
0.0
0.0
1
9
.
6
6
9
.
5
8
9
.
0
1
0
.
7
6.4
8
8.
31
12 Sunflower oil
HO 0.0
0.05
0.0
4.0
7
0.01
2.9
70.0
81.
7
0.40
8.4
0
0.40
0.3
40.0
8
2
.
4
9
.
4
5
9
1
8
.
7
2
1.0
8
10
.5
13 Rapeseed oil 0.0
0.08
0.0
4
4.9
7
0.7
6
1.9
7
0.4
3
62.
4
0.8
3
18.
4
0.4
4
9.2
4
0.2
3
6
3.
9
2
8.
9
9
1.
1
9
.2
5
3.12
11.4
14 Rapeseed oil
VCP 0.0
0.05
0.0
4.3
80.1
2
1.5
90.0
2
62.
20.2
5
18.
50.0
9
10.
80.0
6
6
3
2
9
.
8
9
2
.
3
7
.
2
9
4.0
9
12
.9
15 Sesame oil 0.0
0.04
0.01
10.
4
0.06
4.2
70.0
40.
8
0.31
41.
6
0.76
0.7
2
0.19
4
1
.
4
4
3
.
5
8
3
.
7
1
5
.
7
2.7
7
5.
34
ACCEPTED MANUSCRIP
T

29
16 Sesame oil
VCP 0.0
0.03
0.01
9.6
30.1
6
5.9
0.03
39.
20.0
1
43.
20.1
6
0.5
40.0
3
9
.
3
4
4
.
1
8
3
.
2
1
6
.
7
2.6
4
5.
04
17 Toasted sesame oil V
0.0
0.04
0.0
1
10.
4
0.0
7
3.8
8
0.0
1
39.
1
0.0
5
43.
8
0.1
0
0.7
5
0.0
3
9.
4
45
8
4.
3
1
5.
6
2.88
5.44
18 Coconut oil
47.
21.8
1
19.2
0.7
6
10.
70.4
8
3.4
70.0
1
7.9
91.0
1
1.8
60.1
3
0.0
0.
0
9
.
2
5
2
.
1
1
1
0
.
1
9
2
.
7
0.0
2
0.
11
19 Coconut oil
VCP
52.
20.1
3
20.0
0.2
8.7
90.1
2
3.3
90.0
6
5.2
30.0
4
0.9
40.0
1
0.0
0.0
5
.
2
7
0
.
9
5
6
.
1
7
9
4
.
3
0.0
1
0.
07
20 Red palm oil V
0.5
1
0.2
8
0.95
0.0
9
41.
2
0.4
7
4.9
7
0.1
9
40.
8
0.4
5
10.
2
0.0
8
0.0
0.
0
4
1.
5
1
0.
6
5
1.
5
4
9.
3
0.21
1.07
21 Butter
3.6
80.0
11.5
0.16
32.
80.1
5
11.
80.1
4
24.
10.0
2.0
90.0
5
0.8
30.0
2
9
.
1
4
.
0
0
3
2
.
4
6
5
.
2
0.0
6
0.
50
22 Ghee
3.7
50.0
4
11.7
0.11
31.
80.0
4
11.
50.0
8
24.
60.1
0
1.7
90.0
1
0.9
20.0
4
2
9
.
8
3
.
8
6
3
2
.
9
6
4
.
1
0.0
6
0.
52
Results are expressed as mean SD (standard deviation). Abbreviations: MUFA; monounsaturated
fatty acid, PUFA; polyunsaturated fatty acid, UFA; unsaturated fatty acid, SFA; saturated fatty acid.
The most abundant fatty acids are selected for presentation in the table
Table 3
α-Tocopherol, γ-tocopherol, δ-tocopherol, total tocopherol, β-carotene, total phenolic and
chlorophyll content in 22 oils and fats:
oil or fat
α-
tocopher
ol
γ-
tocopher
ol
δ-
tocopher
ol
total
tocopher
ols
β-
carotene
total
phenolic
content
chloroph
yll
g/g g/g g/g g/g g/g g GAE/g mg/kg
1 Corn oil 2.190.07 19.90.77 0.680.04 22.780.2
9
n.d. 14937.8 0.000.02
2 Olive oil 22021.1 15.21.43 0.830.10 2367.55 0.100.02 30630.8 0.530.03
3 Olive oil EV 20916.8 19.21.54 0.880.09 2296.13 0.450.01 36130.2 1.880.05
4 Olive oil
VC1 1689.44 10.70.57 0.910.06 1803.35 0.230.03 34424.5 1.740.04
5 Olive oil EVC2
1829.49 11.60.42 1.270.05 1953.32 1.720.13 45911.3 8.260.02
6 Olive oil
VA1 1778.74 4.570.26 0.950.08 1823.03 1.240.07 45727.9 7.020.01
7 Olive oil
VA2 12110.8 3.930.21 0.580.05 1263.70 1.200.09 29437.8 6.780.12
8 Olive oil
EVP 1698.80 20.71.15 0.890.09 1903.35 0.760.07 38910.1 3.950.03
9 Olive oil
EVH 24425.3 16.21.72 0.870.03 2619.00 0.810.12 41114.8 3.280.05
1
0 Sunflower
oil 57820.4 25.41.01 6.661.77 6107.73 n.d. 30919.8 0.040.02
1
1 Sunflower
oil VCP 44928.1 221.27 8.170.56 4809.99 0.090.02 32914.9 0.220.02
1
2 Sunflower
oil HO 38725.1 17.81.10 4.580.24 4108.82 n.d. 1799.62 0.030.02
1
3 Rapeseed oil 2147.33 33512.7 9.280.33 5586.79 n.d. 20227.4 0.080.02
1
4 Rapeseed oil
VCP 17913.0 37429.8 14.81.21 56814.7 1.130.06 13722.1 0.390.30
ACCEPTED MANUSCRIP
T
30
1
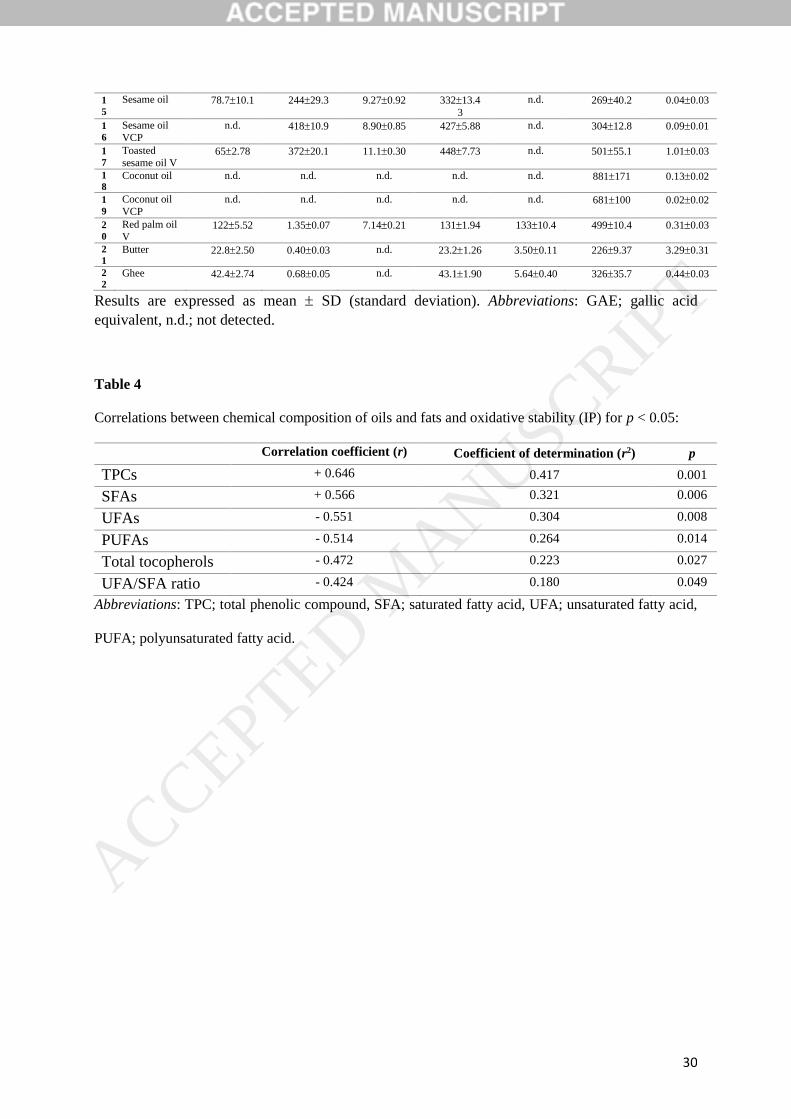
5 Sesame oil 78.710.1 24429.3 9.270.92 33213.4
3
n.d. 26940.2 0.040.03
1
6 Sesame oil
VCP
n.d. 41810.9 8.900.85 4275.88 n.d. 30412.8 0.090.01
1
7 Toasted
sesame oil V 652.78 37220.1 11.10.30 4487.73 n.d. 50155.1 1.010.03
1
8 Coconut oil n.d. n.d. n.d. n.d. n.d. 881171 0.130.02
1
9 Coconut oil
VCP
n.d. n.d. n.d. n.d. n.d. 681100 0.020.02
2
0 Red palm oil
V 1225.52 1.350.07 7.140.21 1311.94 13310.4 49910.4 0.310.03
2
1 Butter 22.82.50 0.400.03 n.d. 23.21.26 3.500.11 2269.37 3.290.31
2
2 Ghee 42.42.74 0.680.05 n.d. 43.11.90 5.640.40 32635.7 0.440.03
Results are expressed as mean SD (standard deviation). Abbreviations: GAE; gallic acid
equivalent, n.d.; not detected.
Table 4
Correlations between chemical composition of oils and fats and oxidative stability (IP) for p < 0.05:
Correlation coefficient (r) Coefficient of determination (r2) p
TPCs + 0.646 0.417 0.001
SFAs + 0.566 0.321 0.006
UFAs - 0.551 0.304 0.008
PUFAs - 0.514 0.264 0.014
Total tocopherols - 0.472 0.223 0.027
UFA/SFA ratio - 0.424 0.180 0.049
Abbreviations: TPC; total phenolic compound, SFA; saturated fatty acid, UFA; unsaturated fatty acid,
PUFA; polyunsaturated fatty acid.
ACCEPTED MANUSCRIP
T