
Rev.10.2.10 ACCOUNTABILITY TOOLS Section 1. “All effective accountability systems are dynamic.”...
59
Rev.10.2.10 Rev.10.2.10 ACCOUNTABILITY ACCOUNTABILITY TOOLS TOOLS Section 1 Section 1
-
Upload
timothy-roberts -
Category
Documents
-
view
217 -
download
0
Transcript of Rev.10.2.10 ACCOUNTABILITY TOOLS Section 1. “All effective accountability systems are dynamic.”...

Rev.10.2.10Rev.10.2.10
ACCOUNTABILITYACCOUNTABILITY
TOOLSTOOLS
Section 1Section 1

“All effective accountability systems
are dynamic.”
““Accountability is not Accountability is not about measurement; it is about measurement; it is about change.”about change.”

AccountabilityAccountability Crosses Divisions, Departments and Crosses Divisions, Departments and
Responsibilities at State and Local LevelResponsibilities at State and Local Level
(Communication is a good thing!)(Communication is a good thing!)
Standards and AssessmentsStandards and Assessments Title Programs and ServicesTitle Programs and Services Special Education and Assessment ServicesSpecial Education and Assessment Services KIDS/ITKIDS/IT

The Communication Thing The Communication Thing Superintendent & PrincipalsSuperintendent & Principals
[Technology Dir/Crd][Technology Dir/Crd]Test CoordinatorTest Coordinator
SIS Data Person(s)SIS Data Person(s)KIDS Data Person(s)KIDS Data Person(s)
LEAMIS Data Person(s)LEAMIS Data Person(s)
AYP/QPA/SOEAYP/QPA/SOE
Coordination would be a good thing!Coordination would be a good thing!
ReminderReminderAccountability = AYP/QPAAccountability = AYP/QPA
Instruction = AYP/QPAInstruction = AYP/QPA
#1. Teach to S / B / I(s)#1. Teach to S / B / I(s) AlignmentAlignment
AccessAccess
#2. Interventions/Improvement Strategies#2. Interventions/Improvement Strategies Research basedResearch based Track recordTrack record

Accountability Governance Accountability Governance BoardBoard
KSDE LeadershipKSDE Leadership Division Directors and Assistant DirectorsDivision Directors and Assistant Directors
Meets on regular basis to review and establish Meets on regular basis to review and establish policy relative to accountability issues AYP – policy relative to accountability issues AYP – QPA.QPA.

Accountability Accountability
How does a school/district meet AYP?How does a school/district meet AYP? Outright meets targetOutright meets target 99% Confidence Interval99% Confidence Interval Safe Harbor ---- Does safe harbor apply?Safe Harbor ---- Does safe harbor apply?
Must meet other measures:Must meet other measures: Elementary K-8 – 90% Attendance rateElementary K-8 – 90% Attendance rate High School 75% Graduation rateHigh School 75% Graduation rate District – Both Attendance and GraduationDistrict – Both Attendance and Graduation
Meets other measures… Safe Harbor appliesMeets other measures… Safe Harbor applies Reduces % non-proficient by 10%Reduces % non-proficient by 10% 75% confidence interval75% confidence interval

2008-2009 Targets2008-2009 Targets ReadingReading
K-8 was 75.6 – this year 79.7K-8 was 75.6 – this year 79.7 HS was 72.0 – this year 76.7HS was 72.0 – this year 76.7
MathMath K-8 was 73.4 – this year 77.8K-8 was 73.4 – this year 77.8 HS was 64.6 – this year 70.5HS was 64.6 – this year 70.5

2008-2009 Targets2008-2009 Targets
Static Targets QPAStatic Targets QPA
ScienceScience 44thth-71-71 77thth-71-71 HS-69HS-69
H-GH-G 66thth-70-70 88thth-70-70 HS-68HS-68
WritingWriting 55thth-67-67 88thth-73-73 HS-76HS-76

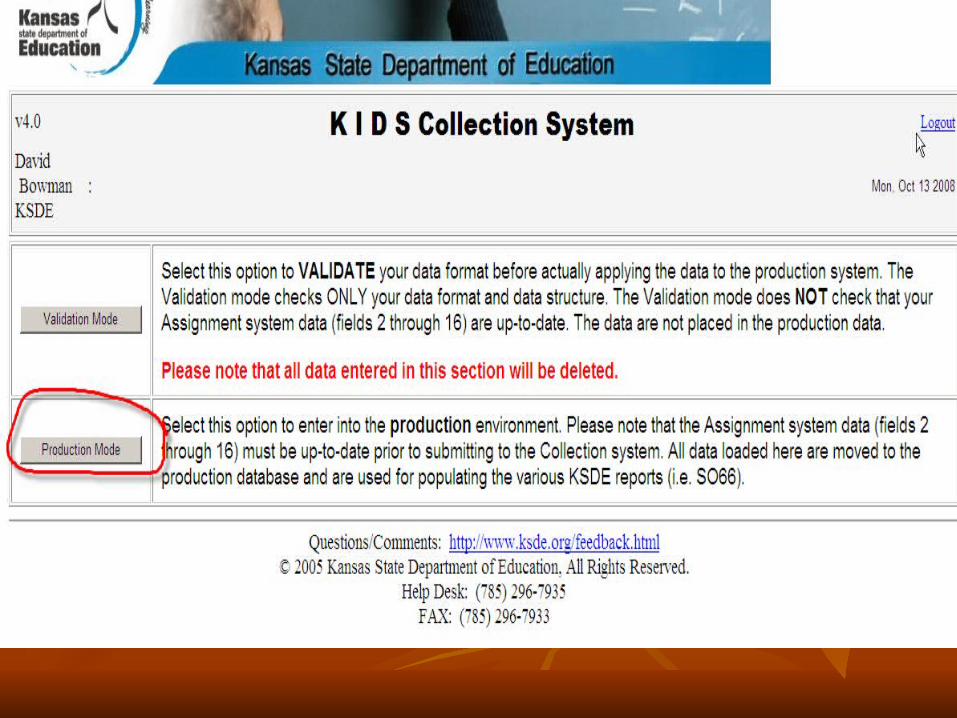
https://online.ksde.org/https://online.ksde.org/authentication/login.aspxauthentication/login.aspx


Attendance & Graduation RateAttendance & Graduation Rate
Does attendance or graduation apply to Does attendance or graduation apply to subgroups (i.e. students with disabilities)?subgroups (i.e. students with disabilities)?
Graduation and attendance comes into play when a Graduation and attendance comes into play when a particular subgroup does not meet target, or the particular subgroup does not meet target, or the 99% confidence interval and needs to apply the 99% confidence interval and needs to apply the safe harbor calculation. safe harbor calculation.
Do we have a clue about past performance on Do we have a clue about past performance on other measures for our subgroups?other measures for our subgroups?


WATCH FORWATCH FOR
Dropout and Graduation Summary Dropout and Graduation Summary ReportReport
COMING SOON Nov. 3COMING SOON Nov. 3


Section 2 KIDSSection 2 KIDS


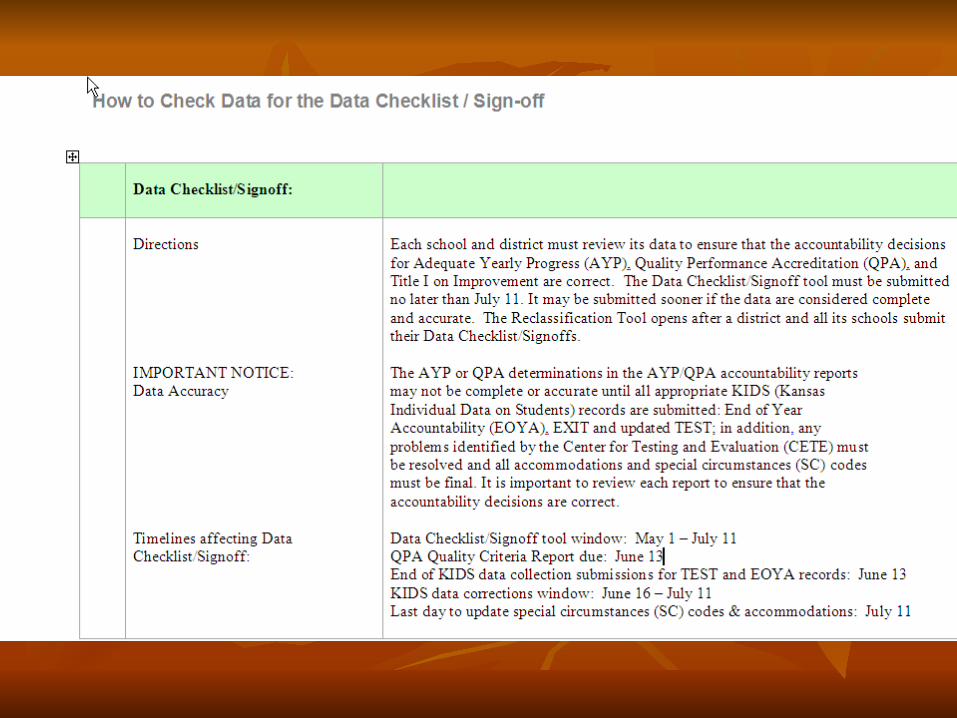
This report shows all students for whom a This report shows all students for whom a TEST record has been submitted in KIDS TEST record has been submitted in KIDS indicating that they will take one or more indicating that they will take one or more state assessments. Users can see all state assessments. Users can see all students whom they submitted with their students whom they submitted with their school listed as the AYP school, as well as school listed as the AYP school, as well as records submitted by another attendance records submitted by another attendance school or district with the user’s school as school or district with the user’s school as the AYP school. the AYP school.
Students for whom an EXIT record has Students for whom an EXIT record has been submitted will not display on this been submitted will not display on this report. Student TEST records for which a report. Student TEST records for which a clear code “C” have been submitted will not clear code “C” have been submitted will not display.display. A drop-down menu allows users to choose A drop-down menu allows users to choose to see all students submitted, or to select to see all students submitted, or to select from five different types of assessments: from five different types of assessments: PDF, Online, Paper and Pencil, KELPA, PDF, Online, Paper and Pencil, KELPA, and Alternate.and Alternate.


Review and Sign-OffReview and Sign-Off
Plan now for May – June sign offPlan now for May – June sign off
Available staffingAvailable staffing
Check list sign offCheck list sign off


CETE Section 3CETE Section 3


Section 4 Misc.Section 4 Misc.
Reclassification ImpactsReclassification Impacts
AYPAYP
SOESOE
QPA – Quality Criterion ChecklistQPA – Quality Criterion Checklist

What the SPED Discrepancy Report IS:A document comparing the most recent Special Education/IEP data that was submitted to
KIDS and the most recent SPED/IEP data that was submitted to the local Special Education MIS system (sometimes referred to as “LEAMIS”). The specific data elements that are being
compared are:D33 Primary Exceptionality
D34 Secondary ExceptionalityD35 SPED Program End Date
A tool that highlights student records that should be reviewed to ensure that student data is being consistently and accurately reported to both data collection systems.
LEAMISLEAMIS

What is the Expected Gains What is the Expected Gains Formula?Formula?
A method to recognize schools that are making A method to recognize schools that are making gains even though the school has not met gains even though the school has not met targets yet for QPA targets yet for QPA (not Title I improvement (not Title I improvement
status)status)..
The formula that demonstrates The formula that demonstrates “increased “increased overall student achievement” overall student achievement” as per as per 91-31-91-31-32 32 in QPA regulations.in QPA regulations.

Expected Gains FormulaExpected Gains Formula
Expected Gain = (# of students scoring below “meet standard” x average % gain across the state for the previous year or 2% whichever is the greater of the two) + (# of students meeting or exceeding standard)
36/112 = students meeting standard/students tested or 32% in 2007
112-36 = 76 students who did not meet standard in 2007
----------------------------------------------------------------
76 x .04 = students not meeting standards x sample expected growth-improvement rate of 4%
76 x .04 = 3.04
3.04 + 36 =39; 39/112 = 35% expected gain “target” for 2008
NOTE: No-end date of 2014 exists in this system. Expected Gains would be calculated each year.

Box Turtle SchoolBox Turtle SchoolDid the school
meet performance
targets?
QPA Status(without Expected
Gains)
QPA Status(with
Expected Gains)
Title I(Title & Sanctions
No Accredited(On Watch)
Accredited(On Watch
1st Data Point)
On Watch
No Accredited On Improvement
Accredited(Made EG
2nd Data Point)
On ImprovementChoice
No Accredited On Improvement
Accredited(Made EG)
On ImprovementChoice + SES
No Accredited On Improvement
Accredited(Made EG)
On ImprovementChoice + SES+
Corrective Action
No Accredited On Improvement
Accredited(Made EG)
On ImprovementChoice + SES+
Corrective Action + Planning for Restructuring
No Accredited On Improvement
Accredited(Made EG)
On ImprovementChoice + SES+
Corrective Action + Restructuring

Expected Gains FormulaExpected Gains Formula
Part 1:Each subgroup that did not make standard needs to demonstrate movement toward the target.
Part 2:Then Expect Gains formula is applied tothe all group

Accreditation StatusAccreditation StatusAccredited
Accredited On Improvement
Conditionally Accredited
Not Accredited

Pilot YearPilot Year
2007-2008 was the first year schools on 2007-2008 was the first year schools on improvement for QPA had an option of using improvement for QPA had an option of using the Expected Gains Formula.the Expected Gains Formula.
The Expected Gains Formula is in development. The Expected Gains Formula is in development. Expect adjustments.Expect adjustments.
Expected GainsExpected Gains
All schools participating in the KansasAll schools participating in the Kansas
Accreditation system can choose to use Accreditation system can choose to use
the Expected Gains Formula, if the school the Expected Gains Formula, if the school
is eligible. is eligible.
A school is eligible when it A school is eligible when it is is not making AYP for not making AYP for one year accredited on improvement one year accredited on improvement conditionally accredited or not accredited conditionally accredited or not accredited andandsubmits the Integrated Improvement Plan submits the Integrated Improvement Plan and and participates in a KSDE sponsored peer review.participates in a KSDE sponsored peer review.

Expected GainsExpected Gains
Expected Gains does not apply to districts.Expected Gains does not apply to districts.
Expected Gains does not apply to the Title I Expected Gains does not apply to the Title I Improvement Status (based on AYP).Improvement Status (based on AYP).
Expected Gains Questions: Sarah Thomas – Expected Gains Questions: Sarah Thomas – [email protected] [email protected]


