Rev. sci. tech. Off. int. Epiz., 1999, 18 (2), 315-342
28
Rev. sci. tech. Off. int. Epiz., 1999, 18 (2), 315-342 Methods of economic impact assessment J. Rushton P.K. Thornton (2) & M.J. Otte (3) (1) Unidad Nacional de Vigilancia Epidemiológica y Control de Enfermedades Animales (UNIVEP), Av. Ejército Nacional No. 141, Casilla 486, Santa Cruz, Bolivia (2) International Livestock Research Institute, P.O. Box 30709, Nairobi, Kenya (3) Food and Agriculture Organization of the United Nations (FAO), Animal Production and Health Division, Viale delle Terme di Caracalla, 00100 Rome, Italy Summary A broad framework for the assessment of the economic impact of animal diseases and control of these diseases is described. Various levels of analysis are discussed, from the herd, to the household, the sector, the nation and the region. For each of these levels, methods of economic impact assessment are outlined and discussed with respect to the objectives, data requirements and outputs of each type of assessment. In addition, the authors attempt to describe the conditions under which the various methods might be used. To conclude, a discussion of the state of the art is presented, and areas of further research are identified. Keywords Animal diseases - Budgeting - Cost-benefit analysis - Economics - Economic surplus - Gross margin - Mathematical programming - Simulation. Introduction Crop diseases have had a profound and well-recognised influence on human welfare and migration patterns throughout history, and the social and economic importance of these diseases has been relatively well documented (3). In contrast, the economic implications of animal diseases have received comparatively less attention, to the point where a recent presidential address to the Agricultural Economics Society of the United Kingdom (UK) urged that more work be done in applying 'old economics' to the 'new problem' of livestock disease (50). That livestock disease has still not been thoroughly explored within the analytical framework of production economics seems extraordinary. Part of the reason may be that while animal diseases have direct impacts, the more subtle implications of these diseases must also be considered (57). Another possible reason is the relative difficulty of studying livestock systems and economics compared with crop systems, because of various important differences, as follows: a) most livestock systems take longer than a year to complete a full cycle b) livestock are mobile c) in comparison with crop systems, livestock populations are smaller and less common, which makes collecting a representative sample more difficult d) livestock can reproduce in agricultural systems (while annual crops are generally managed so that they do not reproduce) e) livestock have an inherent capital value. An economic impact assessment of an animal disease requires methods of analysis that provide measures of comparison. The distinction between production and productivity in such work is crucial, production being the overall level of output, and productivity indicating the return from the important limiting resource of the system. The limiting resource is not necessarily the same in all systems, and even in one system, may change over time. Farmers keep livestock as a means of transforming resources into a wide range of outputs such as milk, meat, traction power, dung (for fertiliser, fuel or buildings), hides, wool, fibre and animals. These outputs may be used for home consumption or sold. In many societies, the ownership of livestock is important in terms of social status, and in countries with chronic inflation problems, livestock are one of
Transcript of Rev. sci. tech. Off. int. Epiz., 1999, 18 (2), 315-342

Rev. sci. tech. Off. int. Epiz., 1999, 18 (2), 315-342
Methods of economic impact assessment J . Rushton P.K. Thornton ( 2 ) & M . J . O t t e ( 3 )
(1) Unidad Nacional de Vigilancia Epidemiológica y Control de Enfermedades Animales (UNIVEP), Av. Ejército Nacional No. 141, Casilla 486, Santa Cruz, Bolivia (2) International Livestock Research Institute, P.O. Box 30709, Nairobi, Kenya (3) Food and Agriculture Organization of the United Nations (FAO), Animal Production and Health Division, Viale delle Terme di Caracalla, 00100 Rome, Italy
Summary A broad f r a m e w o r k for the a s s e s s m e n t of the economic impact of animal diseases and control of these diseases is descr ibed. Var ious levels of analysis are d i s c u s s e d , f rom the herd, to the household, the sector, the nation and the region. For e a c h of these levels, methods of e c o n o m i c impact a s s e s s m e n t are outlined and discussed w i t h r e s p e c t to the object ives, data requirements and outputs of e a c h type of assessment. In addition, the authors attempt to descr ibe the conditions under w h i c h the var ious methods might be used. To conclude, a discussion of the state of the art is p r e s e n t e d , and areas of further r e s e a r c h are identified.
Keywords Animal diseases - Budgeting - Cost-benefit analysis - Economics - Economic surplus -Gross margin - Mathematical programming - Simulation.
Introduction Crop diseases have had a profound and well-recognised influence on human welfare and migration patterns throughout history, and the social and economic importance of these diseases has been relatively well documented (3). In contrast, the economic implications of animal diseases have received comparatively less attention, to the point where a recent presidential address to the Agricultural Economics Society of the United Kingdom (UK) urged that more work be done in applying 'old economics' to the 'new problem' of livestock disease (50) . That livestock disease has still not been thoroughly explored within the analytical framework of production economics seems extraordinary. Part of the reason may be that while animal diseases have direct impacts, the more subtle implications of these diseases must also be considered (57) . Another possible reason is the relative difficulty of studying livestock systems and economics compared with crop systems, because of various important differences, as follows:
a) most livestock systems take longer than a year to complete a full cycle
b) livestock are mobile
c) in comparison with crop systems, livestock populations are smaller and less common, which makes collecting a representative sample more difficult
d) livestock can reproduce in agricultural systems (while annual crops are generally managed so that they do not reproduce)
e) livestock have an inherent capital value.
An economic impact assessment of an animal disease requires methods of analysis that provide measures of comparison. The distinction between production and productivity in such work is crucial, production being the overall level of output, and productivity indicating the return from the important limiting resource of the system. The limiting resource is not necessarily the same in all systems, and even in one system, may change over time.
Farmers keep livestock as a means of transforming resources into a wide range of outputs such as milk, meat, traction power, dung (for fertiliser, fuel or buildings), hides, wool, fibre and animals. These outputs may be used for home consumption or sold. In many societies, the ownership of livestock is important in terms of social status, and in countries with chronic inflation problems, livestock are one of

316 Rev. sci. tech. Off. int. Epiz, 18 (2)
the few relatively safe investment options. Where owners have a social objective to increase the number of animals owned (and thus increase wealth), the output can be viewed as a process of reinvestment. At the agricultural sector or national level, it is the interests of society that livestock provide food in the most efficient manner. This system needs to be balanced against the possibility of being able to import similar products at competitive prices. The simple model shown in Figure 1 can be applied at both farm and sector/national levels.
Table I Productivity (MJ gross energy) of Boran cattle raised using two systems (17)
Inputs W a t e r Feed Forage Vaccines Drugs Labour Capital - Land - Animals - Infrastructure Management
L i v e s t o c k s y s t e m
Outputs E n d p r o d u c t s Meat Milk Skin Wool/hair
I n t e r m e d i a r y p r o d u c t s Animals Manure Traction power
Fig. 1 Simple model of a livestock system
The efficiency of the conversion of inputs into outputs is commonly referred to as productivity. This term can be applied to animals, individual farm enterprises, production systems or entire industries. In this paper, efficiency is defined as the rate of output divided by the rate of input. Because a livestock production system uses many different kinds of input (e.g. feed, labour, medicines) and produces several kinds of output (e.g. milk, meat, traction, manure) a common unit of productivity would be desirable. In commercial livestock systems this unit is usually the economic value of each type of input and output expressed in monetary units. Thus the productivity of a livestock production system could be defined as follows:
Productivity = Total value of outputs per unit of time
Total value of inputs per unit of time
However, it must be stressed that the transformation process involves real resources and real products and that a money value expresses the possession of, or ability to acquire, diverse real resources and commodities (37) . For livestock systems that are only partially, or not at all integrated into a monetary economy, the above measure of productivity may be of little value and another measure must be sought. The numerator, or output value, should reflect the objectives of the producer, and the denominator, or input value, should reflect the most limiting constraint(s). It would thus be totally misleading to measure the 'productivity' of a pastoral system, where milk is more highly valued than meat, and labour is not the most limiting constraint, in terms of meat offtake per person employed (84) . Table I compares pastoralism with ranching, using two different productivity measures (17) .
P r o d u c t i v i t y m e a s u r e P a s t o r a l i s m R a n c h i n g
Production/hectare 148 94
Production/man-day 84 136
Where sufficient labour is available to operate a pastoral system and land is the most limiting resource, output per person and per day would not be an appropriate measure of production efficiency, while in a situation where labour is limiting, output per hectare would be misleading. This example also provides an illustration of the dilemma between meeting needs at the farm level and meeting those at the national level. At the farm level, the pastoral unit is obviously interested in producing sufficient food to feed and clothe a family. The system that has evolved over time is successful in achieving this objective. However, at the national level there are demands for meat in urban centres, and the pastoral system is relatively poor at supplying this demand in comparison with ranching systems. Such conflicts of interest require an understanding of the constraints at different levels to understand why livestock farmers and policy makers react in certain ways.
The effect of animal diseases in a given production system is to reduce the efficiency with which inputs are converted into outputs - i.e. decrease productivity. This effect can result either by decreasing the value of outputs for a given level of inputs or by requiring a higher level of inputs to achieve a given level of output, or both. There are various mechanisms by which disease affects animal productivity. The direct reduction in productivity caused by disease can result in losses that are clearly visible to the farmer. These losses may include the following:
a) the death of affected animals due to diseases such as anthrax or blackleg
b) lower milk yield caused by clinical mastitis
c) reduced live weight gain due to parasitosis
d) reduced capacity for work due to foot infections
e) inferior product quality such as damaged hides due to high tick burdens.
However, there may also be invisible losses such as unrealised production potential. For example, decreased levels of fertility result in 'calves not born', which in turn alters the herd structure. In some cases a disease causes indirect losses. Where herd structure is modified, the capacity of the farmer to maintain and improve the herd through selection is limited. Diseases may also incur additional costs to avoid or diminish incidence (e.g. vaccination and quarantine) or to treat cases. In some situations, farmers and livestock sectors are denied access to (better) markets because of the presence of disease.

Rev. sci. tech. Off. int. Epiz., 18 (2) 317
Finally, some diseases may force the adoption of production methods which do not allow the full exploitation of the available resources, such as the use of trypanotolerant cattle of low milk production potential. Figure 2 provides a summary of the impact of disease (77) .
The total cost (C) of a disease is thus the sum of the production losses (L), both direct and indirect, and the control expenditures (E):
C = L + E.
The cost of a particular disease will vary between production systems. Foot and mouth disease (FMD), for example, will cause higher production losses in dairy herds than in beef herds, but within a given production system an inverse relationship will exist between production losses and control expenditure. This implies that the higher the treatment and prevention expenditure, the lower the losses. In most cases, this relationship between losses and expenditure will be non-linear, reflecting the non-linear nature of the classical production function.
In addition to economic impact, diseases can affect animal welfare and in turn can have a profound impact on human welfare. In the mixed crop/livestock farming systems of the tropics and subtropics, interactions between livestock and other components of the agricultural and communal system are often highly complex and, in the absence of in-depth understanding, difficult to quantify objectively. A good example of this complexity can be seen in the extensive study of the introduction of trypanosomosis in an area of smallholder fanning systems in south-western Ethiopia (71) .
Trypanosomosis is transmitted by the blood-sucking tsetse fly and causes morbidity and mortality in both humans and livestock. The livestock disease is spread over 10 million k m 2
of Africa (38). Figure 3 shows that the impact of an animal disease can go beyond the reduction of livestock productivity to impact on human health and welfare. Fortunately, it appears that the processes in Figure 3 are reversible; tsetse control is being undertaken in these study sites, and improvements in human welfare are now being reported by smallholders in these areas. Animal disease affects livestock populations directly, but in south-western Ethiopia human populations are also directly affected, as are the extent and effectiveness of cropped agriculture (72) .
Faced with such complexity, it is not surprising that the economic implications of animal diseases and animal disease control are under-studied. However, decisions still have to be taken: in an intensive dairy production system, given prevailing economic conditions where profit margins are tight, how much disease can be tolerated? For mixed farming systems in the tsetse areas of Africa, which control strategy for dealing with trypanosomosis is most appropriale? Or is trypanosomosis control even desirable in some areas, given the overgrazing and environmental problems that some see as an inevitable result? For the government policy maker, the decision to invest in an animal disease control programme has to be compared with investing in other types of development projects, such as building dams, improving education or perhaps controlling plant diseases. These are the types of question that impact assessment must address, if decision makers, from smallholder to government policy maker, are to be advised objectively on appropriate courses of action.
Effect of disease
Direct Indirect
Visible Invisible losses losses
Additional costs
Revenue foregone
- Deaths - Stunting
- Reduced fertility - Changed herd structure
- Drugs - Vaccines
- Denied access to better markets
- Use of sub-optimal production technology
Fig. 2
The impact of disease on a livestock system

318 Rev. sci. tech. Off. int. Epiz., 18 (2)
(++) (++) Human Human
mortality out-migration
Fig. 3 Effects of the invasion of trypanosomosis on human welfare: perceptions of farmers in the Ghibe Valley of Ethiopia (71) Recent evidence suggests that these pathways are reversible, i.e. decreases in trypanosomosis brought about by tsetse control (the use of pour-on insecticides in this case) are translating into improvements in human health, reduced human mortality and increased human in-migration
control, then the analyst has to consider the level of the analysis, and from whose point of view the analysis is to be carried out. Once a level and the target group have been identified, an appropriate method of analysis has to be selected, often together with a method of classifying the systems under study. In choosing a method of analysis, a compromise will often have to be made between a method that is sufficiently thorough to represent the livestock system and the disease, and one that produces results that the target group will understand and be able to utilise. The method of analysis and the classification system employed will then determine data requirements.
With regard to data requirements, various questions have to be answered. Are data available on the livestock system, the disease, and the control measure? If data are missing or inadequate, are resources available to enable collection? If resources are available, which data need to be collected and in what quantity, and with which spatial and temporal resolution? Are sufficient resources available for a rigorous scientific procedure to be performed, such as the methods employed in Zambia to investigate the control of East Coast fever (ECF) (56) or is it necessary to employ cheaper, more rapid means of collecting data such as those detailed by Waters-Bayer and Bayer (87) or those used by Catley and Aden (15) in Somalia?
The various steps that have to be addressed are illustrated in Figure 4 . The remainder of this paper attempts to answer the questions posed within the framework, with the exception of
The need for economic impact assessment of animal diseases is clear, as is the need to include the environmental and social implications of change. Below, a conceptually simple framework for studying animal disease control is discussed, particularly with respect to the type of information that may be required at different levels in the system hierarchy. Possible methods for generating some of this information are then outlined, with an indication of their data requirements and analytical complexity; first, at the farm and household levels, and then at the higher levels of country and region. To conclude, a summary of the state of the art is presented, outlining some problems, and offering the views of the authors regarding useful avenues for further research in order to expand the horizons of economic impact assessment related to animal diseases and control.
A framework for economic impact assessment of animal diseases and control Some important issues have to be addressed before an economic impact assessment is undertaken. First, will the economic impact assessment be of the disease and/or control of the disease? Second, if the impact of a disease control strategy is to be assessed, is the control technically feasible and socially acceptable? If the impact assessment concerns a disease and/or a technically and socially acceptable means of

Rev. sci. tech. Off. int. Epiz., 18 (2) 319
Does the a s s e s s m e n t relate to a disease or control of a disease?
Control Is the control technical ly and socially acceptable?
disease
A t w h a t level is the analysis?
Y e s N o
W h o are the target group(s) for the analysis?
Select method(s) of analysis
A r e data avai lable for the analysis?
N o A r e resources available for data collection? — N o
Y e s Y e s
D e t e r m i n e data collection
Perform the analysis Data
Results
Present results to target group
Fig. 4
A framework for the impact assessment of livestock diseases and disease control
determining whether disease control measures are technically and socially acceptable. In discussing the level of the analysis and the target group, a simple classification of levels will be used, namely: the enterprise or herd, the farm or household, the sector, the nation, and the region. In particular cases, more complex classification of analytical level may be
necessary. For example, at the sector level it may be necessary to identify sub-systems according to the main product produced. At the farm or household level, classification of the system by some measure of productivity may be necessary. Methods of classification are diverse, from simple criteria such as number of livestock per household, to a range of factors

320 Rev. sci. tech. Off. int. Epiz., 18 (2)
concerning animal production which can then be analysed using complex statistical methods (88) . The method used to classify the systems should not affect the choice of analytical technique for performing the impact assessment. An introduction to complex statistical methods of classification has been provided by Alt (2) .
Any impact assessment of animal disease requires a baseline. An impact assessment does not consider overall production levels of a herd or flock, but the difference between the herd or flock with and without disease. In an analysis of a disease control strategy, the costs of the control have to be included. Within this basic model, an analyst must consider if the baseline situation is static. For example, a disease control programme may simply accelerate the process of adoption of control technologies, implying that benefits cannot be assumed to continue ad infinitum. In other situations, changes in movement and marketing systems may reduce the need for control measures, which again may reduce benefits in the future.
Methods at the herd and farm household levels Herd level Gross margin analysis and enterprise budgets Gross margin analysis is used to evaluate the economic viability of an enterprise. This analysis is based on actual records and because fixed costs (defined below) are ignored, the problem of assigning these costs to enterprises is avoided. The result from a gross margin analysis is commonly expressed as output per standard unit. The standard unit is usually hectares, acres or livestock units.
The gross margin is defined as the enterprise output less the variable costs attributable to the enterprise:
gross margin = output - variable costs.
The enterprise output should include livestock and livestock product sales and purchases in addition to the change in the value of the herd or flock over time. An example of the latter component is given in Table II for a sheep enterprise.
Variable costs are resources that vary according to the enterprise chosen by the farmer and the scale of those enterprises, such as the number of cattle maintained. The variable costs should satisfy two criteria, as follows:
a) be specific to a single enterprise
b) vary approximately in proportion to the size of the enterprise.
Figure 5 details the items to include in gross margin analyses of non-grazing and grazing livestock. Although this
Table II Change in value of a flock for a smallholder sheep enterprise over an analysis period (US$)
F l o c k at the b e g i n n i n g of F l o c k at the end of A n i m a l V a l u e t h e a n a l y s i s p e r i o d the a n a l y s i s p e r i o d
N u m b e r F l o c k v a l u e N u m b e r F l o c k v a l u e
Female lamb 0 0 0 0 0 Young female 27 10 270 9 243 Breeding e w e 50 24 1,200 25 1,250 Male lamb 0 0 0 0 0 Breeding ram 80 2 160 2 160 Total 1,630 1,653 C h a n g e in f l o c k v a l u e US$23
information is based on gross margin analysis from a British farm management perspective, it still provides a useful starting point for analysis and data collection.
An enterprise gross margin measures the contribution of that enterprise to farm profit. However, the profit of the enterprise is not directly measured as fixed costs are ignored. To determine the profit of an enterprise, an enterprise budget is used; this is defined as the enterprise output minus the fixed and variable costs, or the enterprise gross margin minus the fixed costs, as follows:
enterprise budget = output - variable costs - fixed costs
or
enterprise budget = gross margin - fixed costs.
Fixed costs are resources that are assumed not to vary with the scale of the enterprise and usually include land, labour and capital.
Gross margins and enterprise budgets are useful for enterprise comparisons and for assessing enterprise productivity. These budgets can be used to perform price sensitivity analysis (discussed with respect to break-even analysis below), and a collection of gross margins can be used to select the best combination of enterprises. Dent et al. (21) recommend that the selection of enterprises for a farm system should proceed by first selecting the enterprise with the highest gross margin, then scaling this enterprise up to the maximum level possible within the constraints of the fixed assets. Subsequent enterprises would be selected in a similar manner.
Gross margins can either be generated from on-farm records or taken from standard reference books such as Farm management pocketbook by Nix (62) . Both sources depend on gross margin analysis techniques being appropriate for the farming system. In smallholder farming systems, gross margin analysis has limited applicability. A gross margin values an enterprise using final financial output, which is usually represented as an output per unit of land area. In many smallholder farming systems, financial returns are not the

Rev. sci. tech. Off. int. Epiz., 18 (2) 321
Non-grazing livestock
Enterprise output
minus
Variable costs Concentrates (including home-grown)
Purchased roughage
Veterinary and medical
Miscellaneous
Grazing livestock
Enterprise output
minus
Variable costs Concentrates (including home-grown)
Purchased roughage
Veterinary and medical
Miscellaneous
equals
Gross margin (excluding
forage variable costs)
minus
Variable costs Seed (including home-grown)
Fertiliser
Sprays and chemicals
Contract
Casual labour
Miscellaneous
equals equals
Gross margin Gross margin
Fig. 5 Determination of gross margins for non-grazing livestock and grazing livestock Source: adapted from the Ministry of Agriculture, Fisheries and Food, United Kingdom (55)
only criteria for enterprise selection. Other constraints, such as the need to generate traction power or manure, can play an important part in decision-making. Limited applicability of gross margin analysis at farm level reduces the incentive to collect gross margin data. The resulting lack of data reduces the number of gross margin models available for enterprise comparisons.
Gross margin analysis is a useful technique for farming systems analysis where quantitative enterprise data are
available, and farmers are primarily motivated by profit maximisation. Where profit maximisation is not the main goal, the gross margin analysis structure needs to be adapted. This would probably require graphical output of resource use and production, and less reliance on the final financial figure summary. Gross margin analysis should only be used as a comparative tool if the analyst fully understands both the farming systems for which the gross margins have been derived and the underlying economic concepts of gross margin analysis itself.

322 Rev. sci. tech. Off. int. Epiz., 18 (2)
These basic methods of analysis would appear to be rather simple and undeserving of discussion. However, these methods form the basis for many types of data collection activities when investigating livestock systems and are also the main generators of data for more complex methods applied at sector, national and regional levels. A poor understanding of these methods will therefore affect the quality of analysis at all levels, and for this reason space is devoted below to detailing the main components of gross margins and enterprise budgets. It should also be noted that these are the most popular methods of analysis for literate farmers, and have yet to be replaced by more complex methods at the farm/household level.
In terms of the applicability of gross margin and enterprise budget data to animal disease impact assessment, high-quality gross margin and enterprise budget data provide the baseline productivity information for a system that enables much further analysis. Table III presents gross margins and enterprise budgets for an extensive cattle system after an outbreak of FMD under different control strategies. These results demonstrate how gross margin and enterprise budget analyses can be used to compare the impact of disease.
Strictly speaking, gross margins and enterprise budgets should be based on actual data. However, where time is limited for the collection of such information and where reliable data are lacking, models may be used to simulate gross margins or enterprise budgets. Such models can be
developed using spreadsheets or commercial packages such as LPEC (Livestock Production Efficiency Calculator, PAN Livestock Services, Reading) (39) and PRY (Prying Livestock Productivity, Richard Baptist, University of Nairobi) (5). The latter are based on static herd models, which eliminates the need to calculate a change in herd value. The advantage of using such simulation models is that these models can be combined with rapid rural appraisal data collection methods to develop an idea of the baseline productivity of the livestock system under study. Expert opinion can then be sought to determine the potential impact of a change in disease status brought about by an intervention. This rapid look and see' methodology is a powerful tool for determining the need for further work, and can also help to explain the reasons for poor adoption of disease control strategies at the farm level.
Break-even analysis One of the problems in using gross margin and enterprise budget analysis is the fixed nature of the prices and the outputs. This restriction can be overcome by using break-even analysis. Break-even analysis searches for the price or the yield that will return a zero gross margin or enterprise budget. The break-even price is useful if some doubt exists about the variation in the price of an output or input. Where the break-even price is below the lowest possible value of an output, the enterprise can be assumed to be relatively robust. Likewise, where the break-even price of an input is above the highest possible value of the input, then the enterprise is robust.
Table III Gross margins of extensive beef systems after an outbreak of foot and mouth disease, having employed different vaccination strategies (USS)
N o v a c c i n a t i o n S i n g l e v a c c i n a t i o n per y e a r T w o v a c c i n a t i o n s per y e a r
I tem H e r d C o w H e c t a r e H e r d C o w H e c t a r e H e r d C o w H e c t a r e
Output
Animal sales 6,952.35 69.52 34.76 6,960.67 69.61 34.80 7,268.13 72.68 36.34 Milk sales 0.00 - - 0.00 - - 0.00 - -Change in herd value (904.57) (9.05) (4.52) (299.22) (2.99) (1.50) (237.92) (2.38) (1.19) Total output 6,047.78 60.48 30.24 6,661.44 66.61 33.31 7,030.21 70.30 35.15
V a r i a b l e costs
Feed - - - - - - - - -Vaccine - - - 180.64 1.81 0.90 307.86 3.08 1.54 Medicines 63.57 0.64 0.32 21.47 0.21 0.11 - -Total variable costs 63.57 0.64 0.32 202.12 2.02 1.01 307.86 3.08 1.54
G r o s s m a r g i n e x c l u d i n g f o r a g e costs 5,984.21 59.84 29.92 6,459.33 64.59 32.30 6,722.35 67.22 33.61 Forage costs 2,000.00 20.00 10.00 2,000.00 20.00 10.00 2,000.00 20.00 10.00
G r o s s m a r g i n 3,984.21 39.84 19.92 4,459.33 44.59 22.30 4,722.35 47.22 23.61
F i x e d costs
Labour 2,400.00 24.00 12.00 2,400.00 24.00 12.00 2,400.00 24.00 12.00 Capital 1,000.00 10.00 5.00 1,000.00 10.00 5.00 1,000.00 10.00 5.00 Total fixed costs 3,400.00 34.00 17.00 3,400.00 34.00 17.00 3,400.00 34.00 17.00
E n t e r p r i s e budget 584.21 5.84 2.92 1,059.33 10.59 5.30 1,322.35 13.22 6.61

Rev. sci. tech. Off. int. Epiz., 18 (2) 323
A break-even analysis comprises the following two steps: the identification of the important inputs and outputs that affect enterprise profitability; and the determination of the break-even points for prices and quantities. Examination of combinations of prices and quantities may also be useful. Analysis of these problems using a spreadsheet package such as Microsoft Excel® makes this process relatively easy. Once a gross margin or enterprise budget model has been constructed, 'solver' functions can be used to identify break-even points.
In the example shown in Table III, the fixed costs are of greater importance than the variable costs. In addition, the areas where the vaccine is applied are known to be difficult to access and the variation in vaccine price and delivery is known to be large. In terms of disease impact, therefore, calculation of the break-even price of vaccine and vaccine delivery may be important. Using the break-even value for the enterprise budget, a result of US$4.35 was obtained, which is seven times the value used for the gross margin analysis. It is thus unlikely that variation in vaccine price will greatly influence the control of disease.
In summary, gross margin and enterprise budgets are powerful and popular tools for farmers who are motivated largely by profit. Data in these formats abound in the developed world and in the more commercial livestock sectors of the developing world. These tools provide key information regarding the baseline productivity of livestock systems, which is needed for disease impact assessments. In situations where such data are not available, such as smallholder livestock systems, the analyst must implement data collection to generate gross margin or enterprise budget information. The type of data collection methodology applied will depend on the resources available, but in all situations reasonable estimates of gross margins should be possible with some modifications to the original technique. Such analyses should be complemented by sensitivity or break-even analysis once key inputs and outputs have been identified. To assess changes to the existing system it is recommended that the analyst consider only the additional costs and benefits, or partial budgets.
Partial budgets Partial budgeting is probably the simplest form of budgeting analysis and deals with the effect of relatively small changes in the existing system. This marginal analysis is not designed to show the profit or loss of the farm as a whole but the net increase or decrease in net farm income resulting from proposed changes. Partial budgeting is based on expected values and can be used as an evaluation tool in estimating the economic impact of disease. The economic concept of a partial budget is important for investment appraisal and cost-benefit analysis (CBA) of disease control projects, which are discussed below.
Partial budgets are concerned with four basic items (Table IV): new costs, revenue foregone, costs saved and new revenue. For the analyst, the quantity of interest is the difference between the benefits and the costs. If the benefits exceed the costs then the change would be advantageous for the farm; conversely, if the costs are equal to or greater than the benefits, then the existing system is the better option. Partial budgets are most often used for considering the use of a new input, enterprise or farm practice. Thus, this technique is useful to test the viability of introducing a new medication or a different animal management practice. The analysis should carefully consider changes that utilise (perceived) surplus resources. Many suggested changes are rarely, if ever, adopted because farmers are simply unable to put them into practice.
Table IV Basic elements of a partial budget
Costs B e n e f i t s
N e w costs Costs saved
Revenue foregone N e w revenue
Technical feasibility is an essential precondition of partial budgeting. A change is only technically feasible if the following factors are present:
a) the soil, climate and other physical and biological factors are conducive to the proper growth of the livestock
b) the change made in the system will not place undue strain on the existing organisation.
A partial budget for a change in a FMD vaccination strategy for an extensive beef system is shown in Table V. This analysis is based on income from the herd following a disease outbreak and takes no account of the possibility that herd output with no vaccination may improve over time.
In summary, partial budgets assess the areas of an enterprise that are affected by the change being considered, and thus can only be used to consider changes that can be isolated from the rest of the enterprise. These budgets are based on expected values and do not incorporate uncertainty or risk. Partial budgets are appropriate for analysis of endemic diseases or for retrospective analysis of disease outbreaks. Partial budgets compare enterprises in a steady state, and ignore the time taken to reach that steady state. The time value of money is thus assumed to be zero, and this shortcoming can only be resolved by introducing discounting methods, which are discussed in the section on investment appraisal below.
Decision analysis In contrast to endemic diseases, some diseases are of sporadic or epidemic occurrence, so that the actual incidence of the disease on a particular farm cannot be predicted. If the probability of the occurrence of the disease or of the outcomes

324 Rev. sci. tech. Off. int. Epiz., 18 (2)
Table V Changing the vaccination strategy of an extensive beef system from single to double vaccination against foot and mouth disease (US$)
Costs N o . Cost/unit T o t a l B e n e f i t s N o . Cost/unit T o t a l
N e w costs Costs s a v e d
Vaccines 94 0.29 26.86 Treatments 48.1 0.45 21.47
Labour 94 0.36 33.57
R e v e n u e f o r g o n e N e w r e v e n u e
Animal sales Animal sales
Mature recovering females 1.50 182.81 274.22 Mature healthy females 2.85 203.13 578.91
Recovering males (2-3 years of age) 0.11 130.00 13.65 Healthy males (2-3 years of age) 0.11 143.75 15.09
Recovering males (3-4 years of age) 1.90 196.88 374.06 Healthy males (3-4 years of age) 1.70 218.75 371.88
Mature recovering males 0.13 253.13 31.64 Mature healthy males 0.13 281.25 35.16
Total [754.00] [1.022.50]
C h a n g e in i n c o m e due to v a c c i n a t i o n p r o g r a m m e 268.50
of events need to be considered, then some form of decision analysis is more appropriate than a partial budget for deciding on the best course of action. Decision analysis is a method of describing complex economic problems in an explicit fashion, identifying the available courses of action, assessing the value and probability of all possible outcomes, and then making a simple calculation to estimate the value of each possible course of action. There are three principal elements to be considered in decision analysis, as follows:
a) the events over which the decision maker has control (alternatives)
b) the probability of the occurrence of chance events
c) the value of various outcomes (normally expressed in monetary terms).
Multiplying the value of an outcome, such as the death of an animal, by the probability of occurrence, yields the expected value of the outcome.
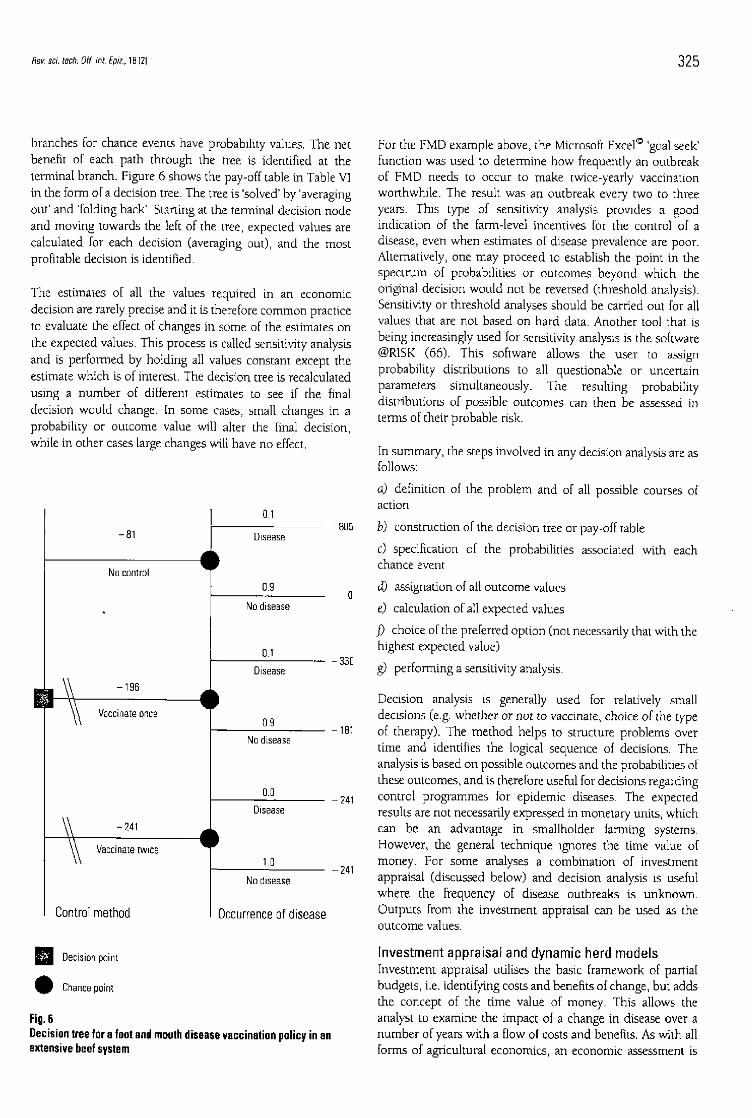
Decision analysis involves the construction of pay-off tables or decision trees. Table VI shows an example of a pay-off table constructed to assess the impact of different vaccination control strategies for FMD. The cost of the disease where vaccination has not been performed has been estimated by
calculating the difference between the gross margins of the herd being vaccinated twice a year and the herd not being vaccinated (Table III). The cost of no disease for the two vaccination strategies is dependent on the cost of vaccinating animals. Under each programme there are three columns: the net benefit of the programme-outcome combination (US$), the probability of the programme-outcome combination (p), and the expected value of the programme-outcome combination (US$ X p). The sum of the expected values of the programme-outcome combinations for a particular programme is the expected value of the programme.
All pay-off tables can also be presented as decision trees. Decision trees, however, have the advantage that the chronology of events is explicitly depicted and a sequence of decisions can thereby be evaluated. By convention, decision trees are constructed from left to right, beginning with the earliest decision to be made. Decision points (nodes) are drawn as squares, and lines (branches) extending from such decision nodes represent the complete set of mutually-exclusive options being considered. Circles represent chance nodes. Branches extending from chance nodes represent the complete set of mutually-exclusive chance events that might occur at that point. All branches must be labelled, and
Table VI Hypothetical pay-off table for three programmes for the control of foot and mouth disease in a herd of 100 cows under an extensive management system (US$)
O u t c o m e
Disease
No disease
E x p e c t e d v a l u e
N e t benef i t (US$)
- 8 0 5
0
N o c o n t r o l
P
P r o g r a m m e
V a c c i n a t i o n o n c e a y e a r
0.1
0.9
E x p e c t e d v a l u e ( U S $ x p )
-81
0
-81
N e t benef i t (US$)
-330
-181
0.1
0.9
E x p e c t e d v a l u e ( U S S x p )
- 3 3
-163
-196
V a c c i n a t i o n t w i c e a y e a r
N e t benef i t p E x p e c t e d v a l u e (US$)
-241
-241
0.0
1.0
( U S $ x p )
0
-241
-241
p : probability of the programme-outcome combination
Rev. sci. tech. Off. int. Epiz., 18 (2) 325
branches for chance events have probability values. The net benefit of each path through the tree is identified at the terminal branch. Figure 6 shows the pay-off table in Table VI in the form of a decision tree. The tree is 'solved' by 'averaging out' and 'folding back'. Starting at the terminal decision node and moving towards the left of the tree, expected values are calculated for each decision (averaging out), and the most profitable decision is identified.
The estimates of all the values required in an economic decision are rarely precise and it is therefore common practice to evaluate the effect of changes in some of the estimates on the expected values. This process is called sensitivity analysis and is performed by holding all values constant except the estimate which is of interest. The decision tree is recalculated using a number of different estimates to see if the final decision would change. In some cases, small changes in a probability or outcome value will alter the final decision, while in other cases large changes will have no effect.
-81
No control
196
Disease
0.9
-805
No disease
0.1
Vaccinate once
-241
Disease
0.9
-33C
No disease
0.0
Vaccinate twice
Disease
1.0
No disease
Occurrence of d isease
-241
- 2 4 1
Control m e t h o d
Decision point
Chance point
Fig. 6 Decision tree for a foot and mouth disease vaccination policy in an extensive beef system
For the FMD example above, the Microsoft Excel® 'goal seek' function was used to determine how frequently an outbreak of FMD needs to occur to make twice-yearly vaccination worthwhile. The result was an outbreak every two to three years. This type of sensitivity analysis provides a good indication of the farm-level incentives for the control of a disease, even when estimates of disease prevalence are poor. Alternatively, one may proceed to establish the point in the spectrum of probabilities or outcomes beyond which the original decision would not be reversed (threshold analysis). Sensitivity or threshold analyses should be carried out for all values that are not based on hard data. Another tool that is being increasingly used for sensitivity analysis is the software @RISK (66) . This software allows the user to assign probability distributions to all questionable or uncertain parameters simultaneously. The resulting probability distributions of possible outcomes can then be assessed in terms of their probable risk.
In summary, the steps involved in any decision analysis are as follows:
a) definition of the problem and of all possible courses of action
b) construction of the decision tree or pay-off table
c) specification of the probabilities associated with each chance event
d) assignation of all outcome values
e) calculation of all expected values
f) choice of the preferred option (not necessarily that with the highest expected value)
g) performing a sensitivity analysis.
Decision analysis is generally used for relatively small decisions (e.g. whether or not to vaccinate, choice of the type of therapy). The method helps to structure problems over time and identifies the logical sequence of decisions. The analysis is based on possible outcomes and the probabilities of these outcomes, and is therefore useful for decisions regarding control programmes for epidemic diseases. The expected results are not necessarily expressed in monetary units, which can be an advantage in smallholder farming systems. However, the general technique ignores the time value of money. For some analyses a combination of investment appraisal (discussed below) and decision analysis is useful where the frequency of disease outbreaks is unknown. Outputs from the investment appraisal can be used as the outcome values.
Investment appraisal and dynamic herd models Investment appraisal utilises the basic framework of partial budgets, i.e. identifying costs and benefits of change, but adds the concept of the time value of money. This allows the analyst to examine the impact of a change in disease over a number of years with a flow of costs and benefits. As with all forms of agricultural economics, an economic assessment is

326
not possible without a good understanding of the biological processes underlying the economics. For this reason the following section includes a short discussion on the types of herd models available to simulate the outputs and inputs from a livestock system to be used in an investment appraisal.
For partial budgets, the following steps were outlined:
a) identify all the benefits b) identify all the costs.
For investment appraisal, this list alters slightly to include the following:
a) identify all benefits and the times when these benefits occur b) identify all costs and the times when these costs occur.
The costs and the benefits of a change are then compared, but investment appraisal recognises that the value of money changes over time. For example, receiving US$100,000 now is worth more than receiving US$ 100,000 a year later because the US$100,000 could be invested. If the money was placed in a bank account with an interest rate of 10%, then one year later the account would hold US$ 110,000 and after two years, US$121,000.
Conversely, if a person is to be given a sum of money in the future rather than a sum now, it is necessary to calculate what the sum is worth in present value terms. In the example above, US$121 ,000 received after two years would be worth no more than US$100 ,000 received now, so that the present value of receiving US$121 ,000 two years later, is US$100,000. Converting future values into present values is known as discounting. Discounting requires knowledge of a rate known as a discount rate. The discount rate does not necessarily equate to the rate of interest offered at banks. The formula for discounting is as follows:
where:
PV is the present value X t is the amount of money in year t r is the rate of discount (expressed as a proportion, i.e. 1 0 % = 0.1) , and t is the number of years from the present date.
When all benefits and costs are converted to present values, comparison is possible. Comparison is commonly made using three decision-making criteria: net present value, internal rate of return, and the benefit-cost ratio.
The net present value (NPV) is the difference between the sum of the present value of the benefits and the sum of the present
Rev. sci. tech. Off. int. Epiz., 18 (2)
value of the costs. The formula to calculate the net present value is as follows:
NPV = PV B - PV C .
If the NPV is negative, then investment is not worthwhile, while a positive NPV indicates only that the investment might be considered.
An alternative approach to assessing an investment is the calculation of the internal rate of return (IRR) of the investment. The IRR is the discount rate that will make the net present value equal to zero. In simpler terms, the IRR is the interest rate that will make the investment just break even. In mathematical terms it is the discount rate for which:
If the IRR exceeds the minimum acceptable discount rate or the opportunity cost of money, the project is worth further consideration.
A third criterion, the benefit-cost ratio (BCR), is calculated by dividing the sum of the present value of benefits by the sum of the present value of costs, as follows:
An investment is worth considering if the BCR is greater than 1.
Each of these three investment appraisal criteria has strengths and weaknesses (29) , and for this reason the results of an investment appraisal are commonly presented with all three measures of project worth.
Investment appraisal provides the basis for much economic impact assessment of livestock diseases and control However, it is important to recognise the difficulties of assessing costs and benefits from livestock systems. Livestock are difficult investments to appraise, because animals take a number of years to reach maturity and have the ability to reproduce. These characteristics mean that modelling of the livestock system under study is often necessary for satisfactory impact assessments.

Rev. sci. tech. Off. int. Epiz., 18 (2) 327
Performing a CBA of disease control projects requires a process similar to partial budgeting. The value of the whole livestock system is not what is of interest. Instead, the analyst examines how proposed changes in health management and treatment will affect the output of the livestock system under study. To do this, the losses incurred due to the disease must be calculated, generally either through mortality or morbidity, and in addition, the costs of control or eradication of the disease must be calculated.
Mortality The cost of losing an animal to disease can in most cases be taken as the market value of that animal, as this should reflect the expected future income from the animal. However, if the animal can be sold after death there may be a salvage value. It is also important to recognise that acutely sick animals may be slaughtered. An animal slaughtered because of illness will probably have a lower value than if slaughtered at the time the farmer planned. However, slaughtering sick animals will reduce the mortality rates and increase offtake, which may appear to increase output. In this case, information should be obtained from farmers about their attitude to sick animals and to see if the slaughtering of a sick animal is classified as a death or as normal offtake. The classification used can hide the true cost of a death due to disease.
Morbidity A disease is likely to have an effect on those animals that survive. This will usually affect the performance of the animals in terms of:
a) fertility b) delays in reaching maturity (for reproduction or sale) c) decreased production of milk, eggs, wool, etc. d) decreased draught power available e) decreased weight of fattened or culled animals.
Once the effects have been quantified the different control options must be considered.
Perhaps the most efficient way of converting observations of morbidity and mortality into livestock outputs and inputs is through the use of herd models. Various dynamic, deterministic herd models have been developed within a spreadsheet containing the investment appraisal model. One example of such a model for analysing livestock diseases and disease control is CLIPPER (80) . Another is TIES (73) , a stochastic household model developed by a team from the International Laboratory for Research on Animal Diseases (ILRAD) and the Texas A&M University, incorporating a dynamic, deterministic livestock model with a constraint on herd size. TIES has been used to assess ECF control in smallholder farming systems in Kenya (63, 64) . Yields and prices are treated stochastically, and the model produces output in the form of means and standard deviations using an investment appraisal framework. However, the model is not ideal as a tool to examine disease control options within the whole-farm system. Another study in Kenya used a separate
livestock model to examine system changes more thoroughly than is possible with TIES (86) .
Another alternative is to use a static herd model to generate inputs and outputs from the livestock system (5, 39) , however the incorporation of these results into an investment appraisal framework is problematic. Finally, McLeod developed a stochastic, discrete time dynamic model to analyse the epidemiology of infectious disease (52) . This model has been adapted and incorporated into a household resource model that includes an investment appraisal component (76) . Brockington et al. (12) describe the use of a similar model (11) to analyse short-term feeding and breeding management decisions of smallholder dairy producers in Brazil.
As an example, analysis of FMD in an extensive beef system has been presented above. Differing answers were produced, including the results that effective control of the disease would be favourable and that a high prevalence of the disease would be necessary to make control worthwhile. An investment appraisal analysis is presented in Table VII, which examines the returns of a change from single to double vaccination per year in this type of system. The analysis in Table VII indicates that there are no advantages to the change, which agrees with the results from the decision tree analysis. However, if the analysis is performed again with the assumption that FMD is eradicated after five years, thereby making vaccination after year five unnecessary, returns are positive.
With such assumptions, the level of analysis starts to shift from the farm/household to the sector level. To place this analysis of disease impact and control at sector or national level, a number of questions have to be answered, including the following:
a) how many livestock owners have extensive beef systems?
b) how many extensive beef farmers vaccinate twice per year, once per year, or not at all?
c) what are the additional costs and benefits from having a national FMD control programme?
To answer these questions requires a classification of livestock systems and an analysis of the market, social and environmental implications. In some situations, farm/ household models that predict the behaviour of livestock owners in response to a change in disease status (and hence productivity of the livestock system) are used. A brief discussion of these types of models is presented below in relation to the farm level. The models are also discussed in relation to analysis at the sectoral and national levels.
In summary, investment appraisal takes account of the time involved for a system to reach a steady state and of the time value of money. As most livestock systems have cycles that are longer than a year, this technique is extremely valuable in the economic impact assessment of livestock diseases and disease

328 Rev. sci. tech. Off. int. Epiz., 18 (2)
Table VII Changing a foot and mouth disease control strategy from single to double vaccination per year: analysis of the costs and benefits (US$)
I tem Y e a r
5 6 7 8 9 10
1. L o s s e s and costs of the d i s e a s e (benef i ts )
Medication 21.47
Annual losses 3 0 7 . 4 6 . 9 6 . 7 9 17.31 127.79 487.66 115.39 58.43 31.20 35.00 87.04
Difference between the herd values -803.93
Total benefits 328.93 96.79 17.31 127.79 487.66 115.39 58.43 31.20 35.00 -716.88
2. Costs of c o n t r o l l i n g the d i s e a s e
Animals less than two years old
Vaccine 26.86 27.29 27.14 26.89 26.67 26.58 26.58 26.56 26.49 26.40
Vaccine application 33.57 34.11 33.93 33.61 33.34 33.22 33.23 33.20 33.12 33.00
Animals more than two years old
Vaccine 0.00 0.00 0.00 0.00 0.00 0.00 0.00 0.00 0.00 0.00
Vaccine application 0.00 0.00 0.00 0.00 0.00 0.00 0.00 0.00 0.00 0.00
Total cost 60.43 61.39 61.07 60.51 60.01 59.80 59.81 59.76 59.61 59.39
3. Benef i ts m i n u s costs (the d i f f e r e n c e b e t w e e n 1 and 2)
Total benefits minus cost 268.50 35.39 -43.76 67.28 427.65 55.59 -1.38 -28.56 -24.61 -776.28
Discount rate 10%
P r e s e n t v a l u e
1. Benefits 299.03 79.99 13.00 87.28 302.80 65.13 29.98 14.56 14.84 -276.39
2. Costs 54.94 50.74 45.88 41.33 37.26 33.75 30.69 27.88 25.28 22.90
3. Benefits minus costs 244.09 35.39 -43.76 67.28 427.65 55.59 -1.38 -28.56 -24.61 -776.28
Net present value (NPV): -44.58 internal rate of return (IRR): 0% Benefit-cost ratio (BCR): 0.98
control. The framework of investment appraisal is the basis of CBA, which is discussed below with reference to analysis at the sectoral, national and regional levels. A weakness of investment appraisal for investigating the impact of animal diseases is the lack of a component that can consider the probability of an event occurring. As disease outbreaks are random events, this failing has to be addressed using other methodologies, which are discussed below.
Farm/household level Farm management analysis techniques may be divided into two basic categories: optimisation and simulation. Optimisation techniques identify a solution to a problem within a farming system that is optimal with respect to a set objective. Simulation methods use a combination of decision structures to determine how a plan will proceed. These approaches are briefly discussed below, together with an outline of (economic) household models.
Optimisation approaches Construction of an optimisation model requires the specification of a resource and activity matrix, which includes all possible activities and the constraints on resource use and production. The matrix is solved according to an objective function, which should reflect the priorities of the manager of
the farming system. Early models relied on the assumption that farm families were profit maximisers, or some other simple objective, and that the activity inputs and outputs were certain and had non-integer output. The simple objective functions proved unsatisfactory as a representation of farm family priorities (20 , 9 1 ) and in some cases can lead to conclusions that are impractical to apply to the actual farming system (45) .
Other factors may need to be embedded in the objective function, such as the need to guarantee certain levels of home-grown food grains, social status in the community, and dislike of the drudgery of labour. A list of priorities might be proposed, rather than a single goal (74) . This has given rise to an interest in the use of multiple objective or multiple criteria decision analysis, where an objective function can include more than one goal and the list can be satisfied in some chosen order (75) . McGregor et al. discuss the use of this approach for guiding decision-making in grazing systems (48) . Whilst this may provide a better method of representing the decision-making unit, it requires careful data collection to determine the objective function.
Zuckerman also found problems with the type of output generated by optimisation models in terms of non-integer

Rev. sci. tech. Off. int. Epiz., 18 (2| 329
output (91) . He recommended the use of integer programming, a technique described by France and Thornley (28) .
The problem posed by incorporating farm activities with uncertain inputs and outputs into an optimisation framework has been overcome by a number of mathematical techniques, such as parametric programming, to examine the way an optimal solution changes as one or more input coefficient varies (28) . These models allow the generation of a mean and a variance for different plans. To determine the minimum variance for each expected level of income from a plan, it is necessary to minimise a quadratic statement. This can be done by quadratic programming algorithms (32). However, this programming method can only deal with a limited number of dimensions, and other techniques have been developed to overcome this problem, such as MOTAD (minimum of total absolute deviations) programming (32) . The use of these techniques increases the complexity of the optimisation procedure further.
The literature contains many examples of optimisation models applied to farming systems analysis (10, 58) and some more specifically to livestock systems and animal health (36, 42 , 47, 61) .
In summary, the identification of an 'optimal' solution, and also the availability of shadow prices as outputs from optimisation models, make them an attractive structure with which to analyse a production process. These models essentially replace the need for a decision maker, and in some instances are used to assess how a general decision maker will react to a change in an environment. Optimisation models are, therefore, of interest to analysts carrying out impact assessment of diseases and disease control at sector and national levels.
Constructing and interpreting optimisation models is intellectually stimulating and requires considerable skill. However, when applied to farming systems, optimisation techniques suffer a number of problems. These are as follows:
a) Optimisation models require the specification of an objective function and constraints, which in turn require either data collection and analysis or trial-and-error to produce an objective function that can adequately mimic the original system.
b) Given that an objective function can be defined, the subsequent use of an optimisation model as a predictive tool has an underlying assumption that the objective function will remain unchanged over time. Evidence of the evolution of farming systems suggests that objective functions are not always (perhaps rarely) static.
c) The structure of an optimisation model does not allow easy adaptation to different farming systems.
d) The complexity of optimisation, and the basic idea that an optimisation model produces an 'optimal' solution, restricts and confines willingness to question model output. This problem is experienced with highly-qualified researchers (45) as well as with farmers.
e) The provision of an optimal solution discourages the discussion of results between researchers and the people whose systems the researchers are trying to model.
f) The assumption that an optimal solution can be found implies that all relevant data are available. This raises the question of whether the search for these data is optimal or even appropriate.
Simulation techniques Simulation models constitute a class of symbolic models, which are abstract representations of particular facets of reality that are built for specific purposes. Examples include: conceptual models such as that in Figure 3 to represent the impact of trypanosomosis in south-western Ethiopia; farm management budget analysis; and much more complex farm simulation models. The range of simulation models is immense and is growing rapidly. The more important simple simulation techniques have been covered in detail with examples above. The remainder of this section describes more complex simulation methods.
A complex simulation is taken to be the process of setting up a model of a real situation and then performing experiments with the model (90) . A simulation model is computer-based and is essentially mathematical; complete flexibility is allowed as to the underlying structure; a good simulation model operates upon input data to produce output data by mimicking particular processes and parts of reality that are of interest to the analyst. They are built essentially for prediction, and this predictive ability can be used for many purposes. Generally, a simulation model may be appropriate where the system under study:
a) cannot be solved or investigated by optimisation methods
b) involves highly dynamic relationships possibly over many time periods
c) contains many subsystems that cannot easily be controlled and studied simultaneously
d) cannot be subjected to experimentation (83) .
Simulation model building can be very expensive and time-consuming, and data shortages may mean that simplifying assumptions have to be made which seriously compromise the integrity and validity of the model. Recent developments in computer software, however, mean that powerful platforms (e.g. Stella® [34]) are now available for constructing dynamic simulation models relatively quickly. A considerable number of simulation models are also available 'off-the-shelf that can be used for particular purposes, sometimes with minimal modification.
330 Rev. sci. tech. Off. int. Epiz., 18 (2)
Some well-known herd simulation models were mentioned in the investment appraisal section with reference to herd modelling techniques, however, more complex systems models also exist. Jarvis used a simulation model to obtain a suitable age of sale for cattle systems in Argentina and Africa (40, 41 ) . The model selects the optimal age at sale by identifying the point at which the increase in animal value equals the rate of interest. Ariza-Nino and Shapiro (4) and Steinfeld (82) also used the model to determine the age-of-sale of livestock in African pastoralist and mixed farming systems, respectively. Recent developments have seen the construction and application of rather detailed biophysical models of the crop/livestock system for decision support (for example Herrero et al. [33]), and such models could also be used to investigate disease control impacts at the farm level.
Simulation models have been criticised on the grounds that the results obtained are not objective in the same way as those generated from 'more formal and general optimising algorithms' (23) . On the other hand, simulation models have enormous flexibility and can be structured in almost any way that is appropriate to the problem under investigation. Only within the last few years have some of the more complex farm management analysis techniques started to be applied by commercial farmers, particularly related to the irrigation, nutrient and pest management of relatively high-value crops in Europe and North America, under the general rubric of precision farming. While the vast majority of livestock farmers see limited applicability of these modelling techniques in managing their own operations, simulation models of proven predictive power in assessing farm-level responses to changes in disease status and technology have much potential in the arena of sector- and national-level analysis.
Household modelling techniques The differences between complex farm management modelling techniques and household modelling techniques are, in some instances, not great. One component that sets household modelling apart is the recognition of the value of household time in any production or consumption activity. Many farm household models draw on the farm household theory of Chayanov and on 'new home economics' (24) . The latter subject originates from a paper by Becker on time allocation within the househofd (7) . Nakajima introduced the notion of the farm household as an economic unit into economic theory (60) . The farm household can be represented as three interacting sub-systems: 'the farm-firm, the labourer's household and the household consumer'.
Household models have been developed and used for a number of mixed farming systems around the world (6, 13, 19, 35 , 46 ) . However, the authors are not aware of any such models having been developed and applied for the impact assessment of animal diseases and disease control. The combination of the modelling methods of livestock systems with those of household economics would most probably produce such a complex model that only the analyst who
constructed the model would fully understand the output. If such a model were available it would undoubtedly be applied at the sector or national level.
Summary of methods at the herd and farm household levels A series of techniques has been presented for economic impact assessment of animal disease and disease control. Gross margin analysis and enterprise budgets are key methods for directing data collection to obtain baseline information on the productivity of livestock systems. This information is necessary to compare livestock systems with different disease status and/or under different disease control regimes. The analysis of a change from one disease control strategy to another is best performed using partial budgeting that assesses additional costs and benefits. Where the impact of disease is spread over a number of years, investment appraisal is necessary in recognition of the time value of money. Decision analysis can be used to investigate the impact of the frequency of disease at the farm level. Approaches which attempt to model processes and decisions at the farm or household level were divided into three categories, namely:
- optimisation approaches - simulation approaches - household modelling techniques.
The implementation of these methods requires much data and considerable skill. While such approaches provide information at the farm or household level, most of the applications to animal disease control problems (where these exist) have involved aggregation of results up to the sector or national level. None of the techniques presented is sufficient in isolation to assess the economic impact of disease, but a combination will often provide useful insights to the incentives at the farm level for controlling livestock disease. A point to be stressed is that all these methods are dependent on the quality of data employed for the analysis. Where problems exist with data availability, an analysis will only provide guidelines to target key data that need to be collected for more comprehensive impact assessments.
Methods at the sector, national and international levels The effectiveness of economic impact assessment at higher levels in the system hierarchy depends heavily on appropriate specification of the decision problem. By definition, many players are involved, and the objectives of the various stakeholders concerned have to be considered. These objectives can often be identified using some of the methods of participatory research that have emerged over the last 20 years in response to widespread concern regarding the relevance of many development activities. Proponents would see such approaches as involving a new paradigm of research

Rev. sci. tech. Off. int. Epiz., 18 (2) 331
(16). A wide array of different approaches is currently in use, but all attempt to involve stakeholders directly in the planning, execution, monitoring and evaluation of development activities (26) . The development and application of frameworks such as the sustainable rural livelihoods approach (14, 79) uses people and their existing strengths and constraints as a starting point, with problem analysis being based on inclusive, iterative, holistic and dynamic livelihood assessment (14) . The role of participatory approaches in identifying the objectives of the stakeholders is becoming more important when, as will increasingly be the case, these objectives are in direct conflict with each other, particularly over natural resource issues.
At the sector, national and international levels, some of the methods that can be used to assess economic impact are related, and some of the terms used have different meanings for different practitioners. In addition, a satisfactory distinction between a tool, a method, and a framework is not always easily made. With this caveat, discussion below proceeds by way of CBA (including a brief discussion on quantifying and valuing environmental impacts), economic surplus methods, mathematical programming or optimisation methods, and simulation and systems analysis. The text is not a comprehensive classification of methods available, but is intended to provide a practical set of major headings under which various approaches and issues can be discussed. All economic impact assessments require methods to identify and determine costs and benefits. In a broad sense, CBA can be seen as the over-arching framework into which the outputs from other tools and methods can be incorporated.
Cost-benefit analysis Cost-benefit analysis is one of the most common methods of project appraisal (89) . In the strict sense of the term, as used by Dasgupta and Pearce (18) , for instance, the province of CBA is defined as projects or activities that involve public expenditure, because what is being valued are the costs and benefits to society. Determining the advantages and disadvantages of particular choices is the basis of all impact assessment, and has enormous intuitive appeal. However, as noted above, the definition of costs and benefits is not always straightforward. For societal impact assessment, which is the aim of CBA, the same problem exists. Cost-benefit analysis is a framework that attempts to incorporate the costs and benefits that arise from particular choices, these costs and benefits can be economic, environmental, biological and medical. However, serious problems arise in attempting to value environmental and medical impacts; the effects may not be obvious; quantification may be difficult; and valuation in economic terms may pose immense problems.
Despite this, CBA in the strict sense, can combine rigour and comprehensiveness in a way that few other frameworks can match (89) ; at least the framework forces the analyst to consider very seriously the major impacts of what is proposed. The basis of CBA is social welfare, but the outputs include
similar criteria to those of investment appraisal. The term CBA is now often used to denote any analysis involving a comparison of the costs of some change with the benefits that accrue, whether performed at the societal level involving the use of public funds or not. In addition, Alston et al. (1) argue that when CBA is used to assess research benefits in a partial equilibrium framework, then the analysis constitutes a special case of the economic surplus method outlined below.
Dijkhuizen et al. note that if the subject is long-term disease control programmes at the regional or national levels, then CBA is typically the analytical structure of choice (22) . In general, this involves estimating streams of costs and benefits associated with a particular control programme (for example) which are then discounted using the methods described above in the investment appraisal section. The discount rate to use in CBA is often a source of considerable uncertainty, but for practical purposes the real rate of interest is sometimes used (the difference between the prevailing rate of inflation and the current interest rate on saved money, for example).
Cost-benefit analyses are typically carried out to compare and contrast different strategies (disease control programmes, for example), and the outputs of such analyses include a set of investment criteria introduced above, such as the NPV, IRR, and the BCR. An example is shown in Table VIII, which details projected future costs and benefits for development and implementation of a vaccine against ECF in sub-Saharan Africa (43) . Table VIII shows the maximum benefits possible (from Mukhebi et al. [59]). These benefits are then multiplied by an estimated adoption rate, the probability of success of the vaccine being developed, and a depreciation factor that arises from the fact that even a yet-to-be developed vaccine will not maintain its effectiveness over thirty years, to obtain the adjusted benefits. The total costs of the research programme, which is assumed to end in 2 0 0 1 , are subtracted from these adjusted benefits to provide a stream of discounted net benefits stretching to the year 2025 . The NPV of this benefit stream is US$160 million, the IRR is approximately 3 1 % , and the BCR is 15:1.
Various examples exist of the application of CBA (in the strict sense, or what Bennett [8] terms 'social CBA') to animal health problems (25 , 68 ) . The data requirements of social CBA are very heavy, the final analyses may be very sensitive to small changes in assumptions (discount rates, adoption rates, etc.), and some of the costs and benefits may be extremely difficult (and contentious) to value appropriately.
The term CBA is currently widely used to include studies that consider individual and societal costs and benefits. In this broad sense, CBA often involves fairly simple frameworks that compare costs and benefits not necessarily over the long term, and is fairly widely used in animal disease control problems. For example, Bennett et al. use a standard methodology to study the economic importance of non-notifiable diseases of

332 Rev. sci. tech. Off. int. Epiz., 18 (2|
Table VIII Estimated benefits of a hypothetical East Coast fever vaccine in sub-Saharan Africa (43, 59) Discount rate 5%, research period 1996-2001,10 years to maximum adoption, ceiling adoption level 30%, probability of research success 50%
Y e a r M a x i m u m
benef i ts (US$ m i l l i o n s )
A d o p t i o n rate P r o b a b i l i t y of
s u c c e s s D e p r e c i a t i o n
f a c t o r
A d j u s t e d benef i ts
(US$ m i l l i o n s )
T o t a l c o s t s (US$ m i l l i o n s )
N e t benef i ts (US$ m i l l i o n s )
1996 168 0.00 0.50 1.00 0.00 1.80 -1.80
1997 168 0.00 0.50 1.00 0.00 2.00 -2.00
1998 168 0.00 0.50 1.00 0.00 2.20 -2.20
1999 168 0.00 0.50 1.00 0.00 2.40 -2.40
2000 168 0.00 0.50 1.00 0.00 2.60 -2.60
2001 168 0.00 0.50 1.00 0.00 2.80 -2.80
2002 168 0.02 0.50 1.00 1.68 0.00 1.68
2003 168 0.03 0.50 1.00 2.52 0.00 2.52
2004 168 0.06 0.50 1.00 5.04 0.00 5.04
2005 168 0.10 0.50 1.00 8.40 0.00 8.40
2006 168 0.15 0.50 1.00 12.60 0.00 12.60
2007 168 0.20 0.50 0.99 16.63 0.00 16.63
2008 168 0.24 0.50 0.98 19.76 0.00 19.76
2009 168 0.26 0.50 0.97 21.18 0.00 21.18
2010 168 0.28 0.50 0.96 22.58 0.00 22.58
2011 168 0.29 0.50 0.95 23.14 0.00 23.14
2012 168 0.29 0.50 0.94 22.90 0.00 22.90
2013 168 0.30 0.50 0.93 23.44 0.00 23.44
2014 168 0.30 0.50 0.92 23.18 0.00 23.18
2015 168 0.30 0.50 0.91 22.93 0.00 22.93
2016 168 0.30 0.50 0.90 22.68 0.00 22.68 2017 168 0.30 0.50 0.90 22.68 0.00 22.68 2018 168 0.30 0.50 0.89 22.43 0.00 2.43 2019 168 0.30 0.50 0.88 22.18 0.00 22.18 2020 168 0.30 0.50 0.87 21.92 0.00 21.92 2021 168 0.30 0.50 0.86 21.67 0.00 21.67 2022 168 0.30 0.50 0.85 21.42 0.00 21.42 2023 168 0.30 0.50 0.84 21.17 0.00 21.17 2024 168 0.30 0.50 0.83 20.92 0.00 20.92 2025 168 0.30 0.50 0.83 20.92 0.00 20.92 P r e s e n t v a l u e 171.82 11.53 160.29
Net present value (NPV) of the benefits: US$160 million Internal rate of return (IRR): 31% Benefit-cost ratio (BCR): 15
farm animals in the UK (9). A spreadsheet was compiled for various diseases of cattle, sheep, pigs and poultry. The methodology involved, for each disease, the consideration of the systems affected, the livestock population at risk, the disease incidence, and resultant disease effects. The financial loss and the total cost of the disease, together with treatment and control costs where then calculated. Similarly, McLeod estimated the costs of the major parasites to the Australian livestock industry using a simple spreadsheet of costs and benefits, which was then used to assess the farm-level profitability resulting from improved parasite management (53). This spreadsheet model is subsequently being extended to assess the importance of tick-borne diseases of cattle in Asia and Africa as well as Australia (54) .
In the strict sense, CBA purports to be a method of analysis for helping society decide what is acceptable and what is not. Population increases, concomitant pressure on natural resources, and questions of sustainability are placing the environment firmly in the centre of the development stage. Environmental impacts have to be valued and brought into the equation, for without these, the indicators of economic performance and sustainable development that are generated will be seriously incomplete and probably fatally flawed. No-one contends that the economic valuation of environmental impacts is easy, and some would define certain environmental factors to be inherently non-quantifiable, such as beauty and life itself. However, techniques do exist for valuing such apparent imponderables, and the consideration

Rev. sci. tech. Off. int. Epiz., 18 (2) 333
of such factors, even very imperfectly, is surely preferable to ignoring them altogether. Winpenny has reviewed common estimators of environmental effects, such as the effect on production approach, contingent valuation, travel costs methods, and the human capital approach (89) . He notes that the amount of space devoted to these respective methods in the literature is sharply at odds with the extent to which the methods have actually been used in the tropics and subtropics. Thus, while tools do exist with which to value environmental costs and benefits, the data requirements, especially for the more sophisticated techniques, are considerable.
Economic surplus methods In discussing the approaches used to measure the economic consequences of agricultural research, Alston et al. (1) present a relationship (a production function) between the following:
a) current output or productivity, which is dependent on current flows of inputs such as concentrates or fertiliser
b) uncontrolled factors such as the weather
c) current and past investments in agricultural research and extension.
Alston et al. divide most of the approaches used into two groups, namely: econometric approaches, which seek to quantify such relationships directly; and approaches based on economic surplus methods, which progress beyond the production function to study impacts of change on supply functions.
At aggregated levels in the hierarchy of systems, economic surplus methods have been used fairly widely to assess the economic impacts of change. These changes may be brought about by new agricultural technology, such as the application of an animal disease control technology or strategy in a region. For this reason, economic surplus methods have been used to assess past or future research activities. Rather than trying to assess the algebraic relationship between outputs and inputs, economic surplus methods are based on the premise that change, brought about by new technology or policy shifts, has an effect on the supply of the commodity (or commodities) being produced. This in turn changes the price paid for the commodity by consumers in society. Economic surplus methods attempt to quantify these shifts and to estimate the impact that change has for both the producers of the commodity and the consumers who purchase the commodity.
The basis of the economic surplus model in a closed economy is shown in Figure 7 (this discussion is based on Alston et al. [1]). The demand for a commodity (for example, beef) is shown as the demand curve D. The supply of beef before any change occurs is S 0 , and as this system is in equilibrium, the market produces Q 0 tons of beef at a market price of P 0 . These supply and demand curves relate to a flow of the commodity per unit time. In such a system, technical change could be
brought about by a wide-ranging cattle disease control strategy, for example, that reduces production costs for farmers and generates the production of more beef per unit of input cost than before the change. In this situation, the supply curve shifts downwards to S1 and a new equilibrium is (instantaneously) created that provides a quantity Ql of beef to the market that is purchased by consumers at price P 1 . Consumers are in a better position than before, because the price of beef has dropped from P 0 to P1. Farmers may be better off; the unit production costs have decreased because of the change, the price they receive from the market has decreased, but the quantity farmers are selling has increased. The total benefit arising from the shifting of the supply curve from S 0 to S1 is equal to the area shaded in the top part of Figure 7, i.e. the area below the demand curve between the old and new supply curves. This total benefit can be partitioned between the cost saving on the original quantity produced and the total value of the increase in production minus the total cost of this increase in production (Figure 7, bottom graph A). More usually, the total surplus is partitioned between benefits to consumers and benefits to producers (Figure 7, bottom graph B for a parallel shift in the supply curve). In general, the distribution of the benefits depends on the shape and slopes (elasticities) of the supply and demand curves and on the size and nature of the supply shift.
The key steps of economic surplus methods are as follows:
a) technological change occurs (or is posited to occur)
b) the change has an impact on the location of the supply curve of the commodity
c) analysis takes place to estimate this shift in supply and to identify the new market equilibrium
d) the partitioning of the benefits are calculated.
The basic model has been extended in numerous ways. Non-linear supply and demand curves, non-parallel shifts in the supply curve (pivotal shifts, for example), multiple markets for a single commodity, multiple commodities, shifts in the demand curve as a result of quality changes, for instance: all these adjustments and more can be incorporated within the economic surplus framework.
Various criticisms have been made of economic surplus methods from both a conceptual and a practical point of view. Some of the conceptual problems concern the need to make value judgements and issues of policy irrelevance, although Alston et al. see few of these problems as being insurmountable (1) . From a practical point of view, perhaps the major problem of the approach is that substantial efforts are required to collect, process and analyse economic and technical data (27) .
Various examples exist of the application of economic surplus methods to assess economic impacts of animal disease control technology. Kristjanson et al. study the potential impact of an as-yet-undeveloped vaccine for trypanosomosis in Africa (44) .

334 Rev. sci. tech. Off. int. Epiz., 18 (2)
S: supply D: d e m a n d
Increment to production and consumption
Cost saving on original quantity
Change in consumer surplus
Change in producer surplus
Fig. 7 Effect of technological change on the economic surplus, and two ways in which the total surplus may be partitioned for a parallel shift in the supply curve (A and B)
The study involved a multi-disciplinary collaborative effort to specify and integrate models examining the biophysical, economic and spatial aspects of trypanosomosis in Africa. First, a biophysical herd simulation model, using field data from Ghibe, Ethiopia, was used to estimate the productivity of cattle before and after tsetse control. Second, an economic surplus model was estimated to value this increase in productivity and capture the uncertainties involved in on-going development of a new technology (i.e. a trypanosomosis vaccine). Third, tsetse distribution data were overlaid with cattle densities in a geographic information system (GIS) to determine the livestock population at risk, to estimate cattle densities in tsetse versus non-tsetse areas, and
to extrapolate the Ghibe results to the rest of Africa. The potential productivity gains estimated in the herd model (comparing the productivity of cattle before and after successful tsetse control) suggest that a vaccine could significantly reduce the cost of producing milk and meat in Africa. The lower production costs would lead to increased meat and milk supplies and reduced prices to consumers. The value of the potential increase in milk and meat production with trypanosomosis control was estimated to range from US$420 million to US$1.1 billion per year. The net present value of trypanosomosis vaccine research carried out by the International Livestock Research Institute and national partners was estimated to be in the range of US$ 170 million to
Quantity

Rev. sci. tech. Off. int. Epiz., 18 (2) 335
US$470 million, with an internal rate of return of between 2 8 % and 3 8 % and a benefit-cost ratio varying from 20:1 to 54 :1 . (In the same way, the calculation of the maximum benefits arising from an ECF vaccine shown in Table VIII took account of the increased production arising from the use of the vaccine and the resultant drop in consumer price that is calculated to occur.)
Another example of the explicit use of economic surplus methods is provided by Ott et al., who used the framework to measure the national economic benefits of reducing livestock mortality (with an example of pigs in the United States of America) (65) .
Data requirements for this type of analysis are considerable. Information is required on the following:
a) productivity impacts, which may be difficult to quantify
b) costs and prices and elasticities of supply and demand for the commodities involved
c) adoption data have to be assembled, for ex post studies either by collection through adoption studies or rapid surveys, while for ex ante studies, expert opinion must be sought concerning likely adoption lag time and ceiling adoption levels
d) a decision must be made about the appropriate discount rate to use in the analysis
e) if the study is ex ante, then a decision must be made, again using expert opinion, about the likely success of the intervention (control programme or research activity).
Especially for analyses in the tropics and subtropics, many of these data are difficult to obtain, in particular, productivity impacts and adoption levels. On the other hand, the framework is fairly flexible, and for impact assessments that seek to quantify the effects of animal disease control programmes or technology changes at the sectoral, national or international level, then few (if any) realistic alternatives exist to methods based on notions of economic surplus.
Mathematical programming methods The optimisation methods outlined above with regard to the farm level have not been used widely for animal health purposes at the regional or national levels. One example is Habtemariam et al., who investigated the economics of trypanosomosis control in Ethiopia using linear programming methods (30) . Dynamic programming (which is not a variant of linear programming) involves the search for an optimal solution involving a sequence of decisions over time. This method has been used by Hall et al. to model the economics of different animal health control programmes, specifically the control of ECF in zebu cattle on the Lilongwe Plateau in central Malawi (31) . The objective function was the present value of net benefits arising from treatment (defined as mortality savings minus treatment costs). Model constraints included herd size, herd nutritional requirements and the
budget available for the various control programmes. Treatment options were tank dipping in acaricide and vaccination. Total optimal net benefits of long-term treatment from vaccination were found to exceed benefits from tank dipping.
In practice, decision makers do not generally have simple objective functions. Mathematical programming methods have been developed that allow multiple objectives to be dealt with, such as maximising profit while minimising income variability, or maximising profit while minimising soil loss. Especially when dealing with the regional or national level, the set of objectives that have to be incorporated may become very complicated. The various stakeholders may have competing objectives, which imply that compromises have to be reached. Examples of multi-criteria programming applications to animal health issues at the regional or national level are rare. Models such as that of van Keulen and Veeneklaas seem to present considerable scope for the incorporation of animal health issues (85) . That particular model treated animal traction in some detail, and the goals related to physical production, monetary targets and risk in a dry year, employment and emigration, all within an interactive multiple goal programming framework. Indeed, the utility of decision support systems based on multi-objective programming methods would appear to be substantial, in allowing stakeholders the opportunity to investigate 'what-if' scenarios of different options, in an effort to reach compromises interactively between the various objectives of the different groups affected.
Much ingenuity and time can be spent on specifying mathematical programming models to overcome some of the technical limitations of particular methods. However, the effectiveness of such approaches depends heavily on appropriate specification of the decision problem and appropriate specification of the objectives of the various stakeholders. As noted above, participatory approaches are particularly important in this context.
Simulation and systems analysis Although modelling and systems analysis have been widely used to address many types of problems, including animal health issues at the animal, herd and farm levels, use of these methods at national or regional level is relatively uncommon. Such models have often been used to help derive input-output relationships which are then used in other analytical frameworks, such as CBA and economic surplus methods. Saatkamp et al. describe a simulation model based on a Markov process designed to evaluate national identification and recording schemes with respect to epidemiological impact on outbreaks of classical swine fever (78) . Snow et al. used systems analysis to investigate the problem of African animal trypanosomosis in The Gambia, and identified a few trends as being of major importance: human population growth, declining rainfall, reduced fallowing, etc. (81) . The existence of these trends raised

336 Rev. sci. tech. Off. int. Epiz., 18 (2)
serious concerns in regard to the sustainability of traditional grazing on common land, although the study concluded that improved, intensive management strategies could help to alleviate these problems.
Considerable scope exists for relatively simple, spatial-explicit simulation models built on the basis of GIS. There are many facets to the work mentioned in the introduction to this paper, namely: the study of trypanosomosis and its control at sites in south-western Ethiopia. The field work carried out in this project has contributed to continent-wide assessments of the distribution of the tsetse fly. Recently, spatial databases of environmental conditions, land use, livestock populations and future human population scenarios, have been used to estimate the distribution of the tsetse fly in 2040 , in response to predicted human population expansion and associated habitat destruction for some species of the tsetse fly (70) . Such studies allow researchers to hypothesise about the future distribution of the tsetse fly, given changes in human population patterns. These databases can also be used to
predict changes in tsetse fly distribution in response to small but important changes in global climate patterns; if average temperature increases by 1°C, for instance, the distribution of the fly is likely to change markedly. The role of environmental parameters in determining the distribution of tsetse is sufficiently well-known that simple spatial models can now be built of what may happen under such scenarios. This type of spatial modelling can easily be linked with simple CBAs to provide information on future changes in the range, role and relevance of these animal diseases that can have a devastating impact on human populations.
Summary of methods at the sector, national and international levels Table IX attempts a synthesis of the various tools and methods discussed above, in terms of the type of problem that each tool may be amenable to solving, data requirements, outputs, and particular strengths and weaknesses. At the national and regional levels, the major framework is clearly provided by CBA, defined loosely, often incorporating notions of
Table IX Some characteristics of the methods discussed for economic impact assessment at the regional and national levels
M e t h o d O b j e c t i v e Data r e q u i r e m e n t s Outputs S t r e n g t h s W e a k n e s s e s
Cost-benef i t a n a l y s i s Compare programmes and Productivity impacts NPV A framework that can Data requirements (str ict s e n s e ) interventions in terms of Costs and prices IRR combine rigour wi th Analytical skills required
societal welfare effects Elasticities BCR comprehensiveness are substantial (including valuation of Adoption data
comprehensiveness
environmental effects) Discount rate Environmental valuation of impacts
Cost-benef i t a n a l y s i s Compare programmes and Productivity impacts Net benefits A framework that is The lack of a (broad s e n s e ) interventions in terms of Costs, prices NPV generally not rigorous or comprehensive
costs and benefits IRR comprehensive but that framework may affect BCR can be set up, applied and the realism of the
understood relatively analysis easily
E c o n o m i c s u r p l u s Quantify the impacts of a Productivity impacts Economic surplus A framework that can be Data requirements shift in the supply curve Costs and prices NPV extended with The economic surplus and the resultant Elasticities IRR considerable flexibility to concept lacks intuitive economic surplus; Adoption data BCR attain realistic results at appeal partition this between Discount rate the national and Analytical skills required consumers and producers international levels are substantial
M a t h e m a t i c a l Maximise an objective Input-output coefficients Activity mixes A flexible framework for Data requirements p r o g r a m m i n g function, subject to Attitudes and objectives Shadow prices well-behaved and Analytical skills required
resource and other of stakeholders Other outputs can be well-formulated problems are substantial constraints Cost-price data obtained, depending on Need a very clear
the objective function understanding of the objectives of stakeholders
S i m u l a t i o n m o d e l l i n g Use a systems model to Detailed understanding of System response to The ultimately flexible Analytical skills required and s y s t e m s a n a l y s i s perform 'what-if scenario the system under study particular input conditions framework are enormous
analysis Ability to incorporate risk, Problem definition can uncertainty, component be somewhat unclear interactions - some models become
tools looking for an application
NPV : net present value IRR : internal rate of return BCR : benefit-cost ratio

Rev. sci. tech. Off. int. Epiz., 18 (2) 337
economic surplus. Mathematical programming and simulation modelling/systems analysis have a great deal to offer in terms of provision of useful information for decision-making and in quantifying costs and benefits for impact assessments, but generally these methods require considerable inventiveness for their application. Spatial simulation modelling and GIS would seem to offer exciting possibilities in the future for providing a basis for economic impact assessment of disease at regional, national and continental scales. Approaches based on a hybridisation of methods may offer considerable potential for decision makers at the sector and national levels. Farm-level information might be generated using optimisation or simulation methods, which could then be related to characteristic or 'typical' farms identified from some sort of classification (possibly GIS-based). The response from the farm level could be aggregated to the sector level using cost-benefit and economic surplus methods, to identify impacts of change at various levels in the hierarchy.
Almost all these methods require considerable analytical skill, but various trends suggest that for many institutions or organisations, this may not remain a major stumbling block in the future. Sophisticated, user-friendly software is more readily available, and in some national agricultural research programmes, impact assessment activities are becoming increasingly common as personnel are trained in the use of appropriate methods and tools. The major problem, now and in the foreseeable future, is data, and this problem is so all-pervasive in economic impact assessment in general that it warrants considerable attention.
Conclusion A variety of tools and methods is available for performing economic impact assessment of animal diseases and disease control. These methods differ greatly in complexity and in the analytical skill required for application, but all are limited by the requirements for appropriate data. Methodologically, livestock systems are relatively difficult to investigate in comparison with many annual crop systems. In addition, many livestock systems are an integral component of mixed farm systems, so that analyses have to examine impacts at the farm or household level. Such systems are particularly common in developing countries. However, the predictive power of biophysical and ecosystem simulation models that can feed impact assessments is growing, as is the development and use of hybridisation approaches, which combine a number of the methods and tools presented above to provide the information required. Methodologies for the economic impact assessment of animal disease control undoubtedly need to be developed and refined, but at least some of the various avenues for research that might profitably be explored are comparatively clear.
In applying these models, the availability of good quality data is critical for meaningful economic impact assessment. This problem can be particularly severe in developing countries, where resources are rarely available for data collection activities. In many situations, however, models can play an important role in pinpointing variables that strongly affect system outcomes, and in this way can help to reduce the time and resources required to collect appropriate data.
An issue related to the data problem is that of how closely a model should mimic the system under investigation. One possible approach is the development of 'rough-and-ready' impact assessment methods that are less demanding of data, time and resources than those currently available, and that provide general ideas of the impact of disease. Ultimately, the choice of method will depend on the time, human and financial resources available, with due regard for the end-users. Complicated analyses will be of little use to livestock keepers unaccustomed to scientific investigation.
A systems approach to the problem of animal disease and disease control is of considerable importance. Without a clear understanding of the system and how it operates, impact assessment will be at best incomplete and at worst positively misleading. Animal diseases are an important constraint in many smallholder livestock systems, but many additional constraints exist. Elimination of one constraint will not necessarily result in potential production levels being obtained. If trypanosomosis is eliminated from large areas of Africa, the impact on cattle numbers may well be considerable, but other constraints may then operate: feed may be limiting, access to markets for selling cattle may be non-existent, or perhaps tick-borne diseases will become more important. This understanding of how systems may operate in response to change can be illuminated by the use of models, and in complex systems even relatively simple models may be able to provide the analyst with some of the information required for impact assessment.
Finally, one of the points made by Mclnemey (49) and Mclnerney et al. (51) and echoed by Perry and Randolph (67) should be reiterated. For every disease, there is a total loss associated with the disease. The exact level of total loss is not important, however. The concept of avoidable loss, and the cost of avoiding this loss, is much more useful. In the field of crop science, de Wit was the first to view crop production as a series of production levels (see, for example, Rabbinge and van Ittersum [69]), as follows:
a) potential production, defined by factors such as radiation, temperature, carbon dioxide, and plant characteristics
b) attainable production, production being limited by water and nutrients
c) actual production, production being reduced by factors such as weeds, diseases and pests.
338 Rev. sci. tech. Off. int. Epiz., 18 (2)
This concept defined an entire approach to studying and modelling cropping systems that still has enormous influence. The concept can be applied to animal production, and economic impact assessment most usefully should deal with attempting to protect production levels by reducing the influence of the production-reducing factors, so that production more nearly approximates attainable production -production limited by water, herbage intake, etc. Economic
impact assessment of animal diseases and disease control should inform decision-making, and thus needs to be strongly focused on what is achievable, what is practical, and what is acceptable.
Méthodes d'évaluation de l'impact économique J . Rushton, P.K. Thornton & M . J . Otte
Résumé Les auteurs décr ivent un cadre général pour l'évaluation de l'impact é c o n o m i q u e des maladies animales et de leur prophylaxie. La discussion porte sur plusieurs n iveaux d'analyse, du t r o u p e a u à l'établissement d'élevage, au secteur, à la nation et à la région. Pour c h a c u n de ces niveaux, les auteurs présentent des méthodes d'évaluation de l'impact économique et les c o m m e n t e n t en fonct ion des objectifs, des besoins en données et des résultats de chaque type d'évaluation. De plus, les auteurs s'efforcent de décr i re les conditions dans lesquelles les diverses méthodes peuvent être utilisées. Pour c o n c l u r e , ils font le point sur l'état des connaissances en la matière, et indiquent de n o u v e a u x domaines de r e c h e r c h e .
Mots-clés A n a l y s e coûts-bénéfice - Budgétisation - Économie - Excédent économique - M a l a d i e s animales - M a r g e brute - Programmation mathématique - Simulation.
Métodos de evaluación del impacto económico J . Rushton, P.K. Thornton & M . J . Otte
Resumen Los autores descr iben un sistema completo para evaluar el impacto e c o n ó m i c o de las enfermedades animales y de su profilaxis. Dicho sistema contempla distintos niveles de análisis, desde el rebaño, el hogar, el s e c t o r y el país hasta la región. Para cada uno de esos niveles los autores apuntan métodos de evaluación del impacto e c o n ó m i c o , estudiándolos en función de sus objetivos, los datos que necesita y los resultados que ofrece cada tipo de método, intentando describir además las condiciones en las que podrían aplicarse los d i v e r s o s métodos. Por último examinan la situación actual e n este c a m p o , y señalan los aspectos que podrían abordarse en futuras investigaciones.
Palabras clave Anál is is de la relación coste/beneficio - Beneficio bruto - Economía - Elaboración de presupuestos - Enfermedades animales - Programación matemática - Simulación -Superávit económico.

Rev. sci. tech. Off. int. Epiz., 18 (2) 339
References
1. Alston J.M., Norton G.W. & Pardey P.G. (1995). - Science under scarcity. Cornell University Press, Ithaca and London, 585 pp.
2. Alt M. (1990). - Exploring hyperspace. A non-mathematical explanation of multivariate analysis. McGraw-Hill Book Company, London, 139 pp.
3. Apple J.L. (1978). - Impact of plant disease on world food production. In World food, pest losses and the environment (D. Pimentel, ed.). American Association for the Advancement of Science Symposium 13. Westview Press, Boulder, Colorado, 39-49.
4. Ariza-Nino E. & Shapiro K.H. (1984). - Cattle as capital, consumables and cash: modelling age-of-sale decisions in African pastoral production. In Livestock development in sub-Saharan Africa: constraints, prospects and policy (J.R. Simpson & P. Evangelou, eds). Westview Press, Boulder, Colorado, 317-333.
5. Baptiste R. (1992). - Derivation of steady-state herd productivity. Agric. Syst., 39, 253-272.
6. Barnum H.N. & Squire L. (1979). - A model of an agricultural household. Theory and evidence. World Bank Staff Occasional Papers, No. 27. Johns Hopkins University Press, Baltimore, 107 pp.
7. Becker G.S. (1965). - A theory of the allocation of time. Econ. J., 5, 493-517.
8. Bennett R.M. (1992). - The use of 'economic' quantitative modelling techniques in livestock health and disease-control decision making: a review. Prey. vet. Med., 13, 63-76.
9. Bennett R., Christiansen K. & Clifton-Hadley R. (1997). -An economic study of the importance of non-notifiable diseases of farm animals in Great Britain. Epidémiol. Santé anim., 31-32, 10.19.1-10.19.3.
10. Bhende M.J. & Venkataram J.V. (1994). - Impact of diversification on household income and risk: a whole-farm modelling approach. Agric. Syst., 44, 301-312.
11. Brockington N.R., Gonzalez C.A., Veil J.M., Vera R.R., Teixeira N.M. & de Assis A.G. (1983). - A bio-economic modelling project for small-scale milk production systems in south-east Brazil. Part I. Agric. Syst., 12, 37-60.
12. Brockington N.R., de Assis A.G., Martinez M.L. & Veil J.M. (1986). - A bio-economic modelling project for small-scale milk production systems in south-east Brazil. Part II: Refinement and use of the model to analyse some short and long-term management strategies. Agric. Syst., 20, 53-81.
13. Caillavet F., Guyomard H. & Lifran R. (eds) (1994). -Agricultural household modelling and family economics. Elsevier, Amsterdam, 326 pp.
14. Carney D. (ed.) (1998). - Sustainable rural livelihoods: what contribution can we make? United Kingdom Government Department for International Development, London, 213 pp.
15. Catley A.P. & Ahmed Aden (1996). - Use of participatory rural appraisal (PRA) tools for investigating tick ecology and tick-borne disease in Somaliland. Trop. Anim. Hlth Prod., 28, 91-98.
16. Chambers R., Pacey A. & Thrupp L.A. (1989). - Farmer first. Farmer innovation and agricultural research. Intermediate Technology Publications, London, 219 pp.
17. Cossins N.J. (1985). - The productivity and potential of pastoral systems. International Livestock Centre for Africa (ILCA). Bulletin No. 21. ILCA, Addis Ababa, Ethiopia, 10-15.
18. Dasgupta A.K. & Pearce D.W. (1978). - Cost-benefit analysis: theory and practice. Macmillan, London, 270 pp.
19. Delforce J.C. (1993). - Smallholder agriculture in The Kingdom of Tonga: a farm-household analysis. Agricultural Economics Bulletin No. 40, Department of Agricultural Economics & Business Management, University of New England, Armidale, Australia, 302 pp.
20. Delforce J.C. (1994). - Separability in farm-household economics: an experiment with linear programming. Agric. Econ., 10, 165-177.
21. Dent J.B., Harrison S.R. & Woodford K.B. (1986). - Farm planning with linear programming: concept and practice. Butterworths, London, 209 pp.
22. Dijkhuizen A.A., Huirne R.B.M. & Jalvingh A.W. (1995). -Economic analysis of animal diseases and their control. Prev. vet. Med., 25, 135-149.
23. Dorward A.R. (1984). - Farm management methods and their role in agricultural extension to smallholder farmers: a case study from Northern Malawi. PhD thesis, University of Reading, 301 pp.
24. Ellis F. (1988). - Peasant economics: farm households and agrarian development. Cambridge University Press, Cambridge, 257 pp.
25. Ellis P.R., James A.D. & Shaw A.P. (1977). - Studies on the epidemiology and economics of swine fever eradication in the EEC. EUR 5738, Commission of the European Communities, Brussels, 90 pp.
26. Estrella M. & Gaventa J . (1998). - Who counts reality? Participatory monitoring and evaluation: a literature review. IDS Working Paper 70. Institute of Development Studies (IDS), University of Sussex, Brighton, 76 pp.
27. Falconi C.A. (1993). - Economic evaluation. In Monitoring and evaluating agricultural research (D. Horton, P. Ballantyne, W. Peterson, B. Uribe, D. Gapasin & K. Sheridan, eds). CAB International, Wallingford, 65-75.

340 Rev. sci. tech. Off. int. Epiz., 18 (2)
28. France J . & Thornley J.H.M. (1984). - Mathematical models in agriculture: a quantitative approach to problems in agriculture and related sciences. Butterworths, London, 335 pp.
29. Gittinger J.P. (1982). - Economic analysis of agricultural projects, 2nd Ed. Johns Hopkins University Press, Baltimore, 505 pp.
30. Habtermariam T., Howitt R., Ruppanner R. & Riemann H.P. (1984). - Application of a linear programming model to the control of African trypanosomiasis. Prev. vet. Med., 3, 1-14.
31. Hall D.C., Kaiser H.M. & Blake R.W. (1998). - Modelling the economics of animal health control programs using dynamic programming. Agric. Syst., 56, 125-144.
32. Hazell P.B.R. & Norton R.D. (1986). - Mathematical programming for economic analysis in agriculture. Macmillan, New York, 400 pp.
33. Herrero M., Fawcett R.H., Perez E. & Dent J.B. (1997). - T h e role of systems research in grazing management: applications to sustainable cattle production in Latin America. In Application of systems approaches at the farm and regional levels (P.S. Teng, M.J. Kropff, H.F.M. ten Berge, J.B. Dent, F.P. Lansigan & H.H. van Laar, eds). Kluwer Academic Publishers, Dordrecht, 129-136.
34. High Performance Systems (HPS), Inc. (1997). - Getting started with the Stella(R) software. HPS Inc., Hanover, New Hampshire, 72 pp.
35. Holden S.T. (1993). - Peasant household modelling: farming systems evolution and sustainability in northern Zambia. Agric. Econ., 9, 241-267.
36. Houben E.H.P. (1995). - Economic optimization of decisions with respect to dairy cow health management. PhD thesis, Landbouwuniversiteit Wageningen, The Netherlands, 146 pp.
37. Howe K.S. (1987). - Some economic aspects of bovine virus diarrhoea at national level. In Proc. Meeting of the Society of Veterinary Epidemiology and Preventive Medicine (SVEPM), 1-3 April, Solihull, England. SVEPM, Edinburgh, 26-37.
38. Jahnke H.E., Tacher G., Keil P. & Rojat D. (1988). -Livestock production in tropical Africa, with special reference to the tsetse-affected areas. In Livestock production in tsetse-affected areas of Africa. International Livestock Centre for Africa/International Laboratory for Research on Animal Diseases, Nairobi, 3-21.
39. James A.D. & Carles A. (1996). - Measuring the productivity of grazing and foraging livestock. Agric. Syst., 52, 271-291.
40. Jarvis L.S. (1974). - Cattle as capital goods and ranchers as portfolio managers: an application to the Argentine cattle sector. J . pol. Econ., 82, 489-520.
41. Jarvis L.S. (1980). - Cattle as a store of wealth: comment. Am. J. agric. Econ., 62, 606-613.
42. Kennedy J.O.S. (1986). - Dynamic programming: applications to agriculture and natural resources, Chapter 7. Elsevier Applied Science Publishers, London, 341 pp.
43. Kristjanson P.M. (1997). - Measuring returns to ILRI's research. Systems Analysis and Impact Assessment Working Paper 97-1. International Livestock Research Institute, Nairobi, 65 pp.
44. Kristjanson P.M., Swallow B.M., Rowlands G.J., Kruska R.L. & de Leeuw P.N. (1999). - Measuring the potential benefits to control African animal trypanosomosis and the returns to research. Agric. Syst., 59, 79-98.
45. Lopes G.M.B. (1990). - The constraints to production by the small fanners in the Agresti region of Pernambulo, Brazil. PhD thesis, University of Reading, 223 pp.
46. Low A.R.C. (1986). - Agricultural development in Southern Africa: farm household theory and the food crisis. James Currey, London, 215 pp.
47. Mace R. & Houston A. (1989). - Pastoralist strategies for survival in unpredictable environments: a model of herd composition that maximises household viability. Agric. Syst., 31, 185-204.
48. McGregor M.J., Dent J.B. & Cropper M. (1996). - The role of multi-criteria decision making methods in guiding grazing systems development. In Livestock farming systems: research, development and socio-economics and the land manager (J.B. Dent, M.J. MacGregor & A.R. Sibbald, eds). European Association for Animal Production (EEAP) Publication No. 79, Wageningen Pers, Wageningen, 337-345.
49. McInerney J.P. (1988). - The economic analysis of livestock disease: the developing framework. In Proc. 5th International Symposium on veterinary epidemiology and economics (P. Willeberg, J.F. Agger & H.P. Riemann, eds), 25-29 July, Copenhagen. Acta vet. scand., 84 (Suppl.), 66-74.
50. McInerney J.P. (1996). - Old economics for new problems -livestock disease. J . agric. Econ., 47, 295-314.
51. McInerney J.P., Howe K.S. & Schepers J.A. (1992). - A framework for the economic analysis of disease in farm livestock. Prev. vet. Med., 13, 137-154.
52. McLeod A. (1993). - A model for infectious diseases of livestock. PhD thesis, Veterinary Epidemiology and Economics Research Unit, University of Reading, 125 pp.
53. McLeod R.S. (1995). - Costs of major parasites to the Australian livestock industries. Int. J . Parasitol., 25, 1363-1367.
54. McLeod R.S. (1998). - TickCost. The annual costs of tick-borne diseases in Africa, Asia and Australia, Version 1.0. Website: http://www.esys.com.au/tickcost.htm (document accessed on 29 March 1999).
55. Ministry of Agriculture, Fisheries and Food (1977). - Gross margins for livestock producers. Her Majesty's Stationery Office, London, 7.
56. Minjauw B., Rushton J . , James A.D. & Upton M. (1999). -Financial study of different ECF control strategies on Sanga cattle in Zambia. Prev. vet. Med., 38, 35-45.
Rev. sci. tech. Off. int. Epiz., 18 (2)
57. Morris R.S. (1997). - How economically important is animal disease and why? In Animal health economics: principles and applications (A.A. Dijkhuizen & R.S. Morris, eds). Post Graduate Foundation in Veterinary Science, University of Sydney, 1-11.
58. Morrison D.A., Kingwell R.S. & Pannell DJ . (1986). - A mathematical programming model of a crop-livestock farm system. Agric. Syst., 20, 243-268.
59. Mukhebi A.W., Perry B.D. & Kruska R.L. (1992). -Estimated economics of theileriosis control in Africa. Prev. vet. Med., 12, 73-85.
60. Nakajima C. (1986). - Subjective equilibrium theory of the farm household. Elsevier, Amsterdam, 302 pp.
61. Nicholson C.F., Lee D.R., Boisvert R.N., Blake R.W. & Urbina C.I. (1994). - An optimization model of the dual-purpose cattle production system in the humid lowlands of Venezuela. Agric. Syst., 46, 311-334.
62. Nix J . (1995). - Farm management pocketbook. Wye College, University of London, Ashford, Kent, 220 pp.
63. Nyangito H.O., Richardson J.W., Mukhebi A.W., Mundy D.S., Zimmel P., Namken J . & Perry B.D. (1994). - Whole farm economic analysis of East Coast fever immunization strategies in Kilifi District, Kenya. Prev. vet. Med., 21, 215-235.
64. Nyangito H.O., Richardson J.W., Mukhebi A.W., Mundy D.S., Zimmel P. & Namken J . (1995). - Whole farm economic evaluation of East Coast fever immunization strategies on farms in the Uasin Gishu District of Kenya. Comput. Electron. Agric., 12, 19-33.
65. Ott S.L., Seitzinger A.H. & Hueston W.D. (1995). -Measuring the national economic benefits of reducing livestock mortality. Prev. vet. Med., 24, 203-211.
66. Palisade Corporation (1997). - Guide to using @RISK. Palisade Corporation, Newfield, New York, 319 pp.
67. Perry B.D. & Randolph T.F. (1999). - Improving the assessment of the economic impact of parasitic diseases and of their control in production animals. Vet. Parasitol., 84 (3-4), 143-166.
68. Power A.P. & Harris S.A. (1973). - A cost-benefit evaluation of alternative control policies for foot-and-mouth disease in Great Britain. J . agric. Econ., 24, 573-596.
69. Rabbinge R. & van Ittersum M.K. (1994). - Tension between aggregation levels. In The future of the land: mobilising and integrating knowledge for land use options (L.O. Fresco, L. Stroosnijder, J . Bouma & H. van Keulen, eds). Wiley, Chichester, 409 pp.
70. Reid R.S., Kruska R.L., Deichmann U., Thornton P.K. & Leak S.G.A. (1999). - Will human population growth and land-use change control tsetse during our lifetimes? Agric. Ecosyst. Environ. (submitted for publication).
71. Reid R.S., Kagwanja J . & Galvin K. (1999). - Impacts of controlling livestock trypanosomosis on human welfare: hypotheses and preliminary findings for south-western Ethiopia. Hum. Ecol. (submitted for publication).
341
72. Reid R.S., Thornton P.K. & Kruska R.L. (1999). - Predicting agricultural expansion: livestock disease control and changing landscapes in south-western Ethiopia. Paper presented at the Center for International Forestry Research (CIFOR) workshop on Technological change in agriculture and deforestation. Centro Agronómico Tropical de Investigación y Enseñanza (CATIE), 11-13 March, Turrialba, Costa Rica (in press).
73. Richardson J.W., Mukhebi A.W., Zimmel P.T., Nyangito H.O., Moehring C.A. & Namken J. (1993). - Technical description of TIES: a farm-level technology impact evaluation system. International Laboratory for Research on Animal Disease, Nairobi and Texas A&M University, Texas.
74. Romero C. & Rehman T. (1984). - Goal programming and multiple criteria decision-making in farm planning: an expository analysis. J . agric. Econ., 35, 177-190.
75. Romero C. & Rehman T. (1989). - Multiple criteria analysis for agricultural decisions. Elsevier, Amsterdam, 258 pp.
76. Rushton J . (1996). - Quantitative methods for the economic assessment of smallholder crop-livestock farming systems. PhD thesis, Veterinary Epidemiology and Economics Research Unit, University of Reading, 200 pp.
77. Rushton J . & Otte M.J. (1997). - Animal health economics. Teaching notes. Veterinary Epidemiology and Economics Research Unit, University of Reading, 26 pp.
78. Saatkamp H.W., Huirne R.B.M., Geers R., Dijkhuizen A.A., Noordhuizen J.P.T.M. & Goedseels V. (1996). -State-transition modelling of classical swine fever to evaluate national identification and recording systems: general aspects and model description. Agric. Syst., 51, 215-236.
79. Scoones I. (1998). - Sustainable rural livelihoods: a framework for analysis. IDS Working Paper 72, Institute of Development Studies (IDS), University of Sussex, Brighton, 72 pp.
80. Shaw A.P.M. (1989). - CLIPPER. Computerised livestock project planning exercise. User Notes. AP Consultants, Andover, United Kingdom, 35 pp.
81. Snow W.F., Norton G.A. & Rawlings P. (1996). -Application of a systems approach to problem analysis of African animal trypanosomiasis in The Gambia. Agric. Syst., 51 , 339-356.
82. Steinfeld H. (1988). - Livestock development in mixed farming systems. A study of smallholder livestock production systems in Zimbabwe. In Farming systems and resource economics in the tropics, Vol. 3. Wissenschaftsverlag Vauk, Kiel, 244 pp.
83. Thornton P.K. (1999). - Simulation models for planning agricultural research. In Planning agricultural research: a sourcebook (W. Janssen, ed.). CAB International and International Service for National Agricultural Research (ISNAR), Wallingford (in press).
84. Upton M. (1989). - Livestock productivity assessment and herd growth models. Agric. Syst., 29, 149-164.

342 Rev. sci. tech. Off. int. Epiz., 18 (2)
85. Van Keulen H. & Veeneklaas F.R. (1993). - Options for agricultural development: a case study for Mali's fifth Region. In Systems approaches for agricultural development (F.W.T. Penning de Vries, P.S. Teng & K. Metselaar, eds). Kluwer, Dordrecht, 367-380.
86. Van Schaik G. (1995). - An economic study of smallholder dairy farms in Murang'a District Kenya. Thesis, Department of Farm Management, Wageningen Agricultural University, Wageningen, The Netherlands, in collaboration with the International Laboratory for Research on Animal Diseases, Nairobi, 39 pp.
87. Waters-Bayer A. & Bayer W. (1994). - Planning with pastoralists: PRA and more. A review of methods focused on Africa. Deutsche Gesellschaft für Technische Zusammenarbeit (GTZ) working paper. GTZ, Eschborn, Germany, 153 pp.
88. Williams T.O. (1994). - Identifying target groups for livestock improvement research: the classification of sedentary livestock producers in Western Niger. Agric. Syst., 46, 227-237.
89. Winpenny J.T. (1991). - Values for the environment. A guide to economic appraisal. Her Majesty's Stationery Office, London, 277 pp.
90. Wright A. (1971). - Farming systems, models and simulation. In Systems analysis in agricultural management (J.B. Dent & J.R. Anderson, eds). John Wiley & Sons, Sydney, 17-33.
91. Zuckerman P.S. (1973). - Yoruba smallholders' farming systems. PhD thesis, University of Reading, 253 pp.

![[XLS] · Web view317 317 317 317 316 239 316 239 315 94 315 94 86 86 86 398 426 426 426 316 239 316 239 317 317 317 315 94 315 94 315 315 315 315 426 316 239 274 136 274 136 274 136](https://static.fdocuments.in/doc/165x107/5abaa3447f8b9a567c8bbc29/xls-view317-317-317-317-316-239-316-239-315-94-315-94-86-86-86-398-426-426-426.jpg)


![[XLS] · Web view317 317 317 317 315 94 315 94 86 86 86 426 426 426 316 239 316 239 317 317 317 315 94 315 94 315 315 315 315 426 274 136 274 136 274 136 274 136 274 188 274 188 274](https://static.fdocuments.in/doc/165x107/5abaa3447f8b9a567c8bbc31/xls-view317-317-317-317-315-94-315-94-86-86-86-426-426-426-316-239-316-239-317.jpg)