Rev. 03 STP 3 & 4 Environmental Report Radiological Impacts of Normal Operation STP 3 & 4...
16
Radiological Impacts of Normal Operation 5.4-1 STP 3 & 4 Environmental Report 5.4 Radiological Impacts of Normal Operation This section describes the radiological impacts of normal plant operation on members of the public, plant workers, and biota. A 50-mile region of interest is chosen for determining impacts to the general public although maximum impacts to individuals are calculated for the immediate plant environs. The analysis is done for operation of two new units, with single unit results presented for comparison to specific dose requirements. Subsection 5.4.1 describes the exposure pathways by which radiation and radioactive effluents could be transmitted from STP 3 & 4 to organisms living near the plant. Subsection 5.4.2 estimates the maximum doses to the public from the operation of one new unit. Subsection 5.4.3 evaluates the impacts of these doses by comparing them to regulatory limits for one unit. In addition, the impact of two new units in conjunction with the existing units is compared to the corresponding regulatory limit. Subsection 5.4.4 considers the impact to nonhuman biota. Subsection 5.4.5 describes the radiation doses to plant workers from the new units. 5.4.1 Exposure Pathways Radioactive liquids and gases would be discharged to the environment during normal operation of STP 3 & 4. The released quantities have been estimated in Table s 12.2 - 20 (gases) and 12.2-22 (liquids) of the ABWR DCD Tables 3.5-1 (liquids) and 3.5-2 (gases) . The impact of these releases and any direct radiation to individuals, population groups, and biota in the vicinity of the new units was evaluated by considering the most important pathways from the release to the receptors of interest. The major pathways are those that could yield the highest radiological doses for a given receptor. The relative importance of a pathway is based on the type and amount of radioactivity released, the environmental transport mechanism, and the consumption or usage factors of the receptor. The exposure pathways considered and the analytical methods used to estimate doses to the maximally exposed individual (MEI) and to the population surrounding the new units are based on NRC Regulatory Guide 1.109, “Calculation of Annual Doses to Man from Routine Releases of Reactor Effluents for the Purpose of Evaluating Compliance with 10 CFR 50,” Appendix I (Rev.1, October 1977) (Reference 5.4-1) and NRC Regulatory Guide (RG) 1.111, “Methods for Estimating Atmospheric Transport and Dispersion of Gaseous Effluents in Routine Releases from Light-Water-Cooled Reactors,” (Revision 1, July 1977) (Reference 5.4-2). An MEI is a member of the public located to receive the maximum possible calculated dose. The annual dose to each nearby receptor indicated in Section 2.7, corresponding to those in Table B4-6 (Reference 5.4-3 5.4-14 ) from the estimated new unit releases was calculated, and the maximum of those was denoted the MEI. The use of the MEI allows comparisons with established dose criteria to the public. 5.4.1.1 Liquid Pathways STP 3 & 4 would release liquid effluents first to the Main Cooling Reservoir (MCR) which could then release its effluents to either Little Robbins Slough or the Colorado River and ultimately to Matagorda Bay. The NRC-endorsed LADTAP II computer program (Reference 5.4-4) was used to calculate these doses, with parameters Rev. 03
-
Upload
duongthuan -
Category
Documents
-
view
219 -
download
0
Transcript of Rev. 03 STP 3 & 4 Environmental Report Radiological Impacts of Normal Operation STP 3 & 4...

STP 3 & 4 Environmental Report
Rev. 03
5.4 Radiological Impacts of Normal OperationThis section describes the radiological impacts of normal plant operation on members of the public, plant workers, and biota. A 50-mile region of interest is chosen for determining impacts to the general public although maximum impacts to individuals are calculated for the immediate plant environs. The analysis is done for operation of two new units, with single unit results presented for comparison to specific dose requirements. Subsection 5.4.1 describes the exposure pathways by which radiation and radioactive effluents could be transmitted from STP 3 & 4 to organisms living near the plant. Subsection 5.4.2 estimates the maximum doses to the public from the operation of one new unit. Subsection 5.4.3 evaluates the impacts of these doses by comparing them to regulatory limits for one unit. In addition, the impact of two new units in conjunction with the existing units is compared to the corresponding regulatory limit. Subsection 5.4.4 considers the impact to nonhuman biota. Subsection 5.4.5 describes the radiation doses to plant workers from the new units.
5.4.1 Exposure PathwaysRadioactive liquids and gases would be discharged to the environment during normal operation of STP 3 & 4. The released quantities have been estimated in Tables 12.2-20 (gases) and 12.2-22 (liquids) of the ABWR DCD Tables 3.5-1 (liquids) and 3.5-2 (gases). The impact of these releases and any direct radiation to individuals, population groups, and biota in the vicinity of the new units was evaluated by considering the most important pathways from the release to the receptors of interest. The major pathways are those that could yield the highest radiological doses for a given receptor. The relative importance of a pathway is based on the type and amount of radioactivity released, the environmental transport mechanism, and the consumption or usage factors of the receptor.
The exposure pathways considered and the analytical methods used to estimate doses to the maximally exposed individual (MEI) and to the population surrounding the new units are based on NRC Regulatory Guide 1.109, “Calculation of Annual Doses to Man from Routine Releases of Reactor Effluents for the Purpose of Evaluating Compliance with 10 CFR 50,” Appendix I (Rev.1, October 1977) (Reference 5.4-1) and NRC Regulatory Guide (RG) 1.111, “Methods for Estimating Atmospheric Transport and Dispersion of Gaseous Effluents in Routine Releases from Light-Water-Cooled Reactors,” (Revision 1, July 1977) (Reference 5.4-2). An MEI is a member of the public located to receive the maximum possible calculated dose. The annual dose to each nearby receptor indicated in Section 2.7, corresponding to those in Table B4-6 (Reference 5.4-3 5.4-14) from the estimated new unit releases was calculated, and the maximum of those was denoted the MEI. The use of the MEI allows comparisons with established dose criteria to the public.
5.4.1.1 Liquid PathwaysSTP 3 & 4 would release liquid effluents first to the Main Cooling Reservoir (MCR) which could then release its effluents to either Little Robbins Slough or the Colorado River and ultimately to Matagorda Bay. The NRC-endorsed LADTAP II computer program (Reference 5.4-4) was used to calculate these doses, with parameters
Radiological Impacts of Normal Operation 5.4-1

STP 3 & 4 Environmental Report
Rev. 03
specific to each of these water bodies. This program implements the radiological exposure models described in RG 1.109 for radioactivity releases in liquid effluent. The following important exposure pathways are considered in LADTAP II:
Ingestion of aquatic organisms as food
External exposure to contaminated sediments deposited along the shoreline (shoreline exposure)
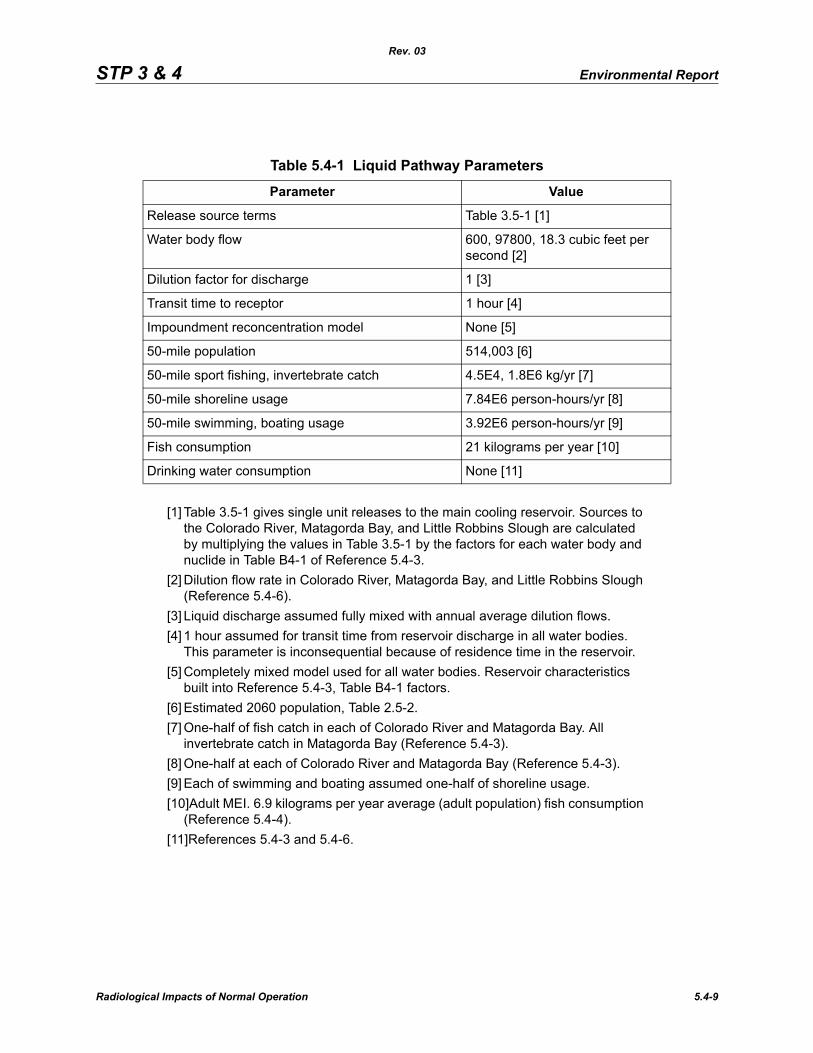
Although less important, as determined by LADTAP II calculations, the swimming and boating exposure pathways are also considered in this analysis. The program also considers ingestion of drinking water and irrigation. However, the water downstream from STP 3 & 4 is not used for either of these purposes (Reference 5.4-3). Reference 5.4-3 gives the population usage rates for the exposure pathways. The site-specific input parameters for the liquid pathway are presented in Table 5.4-1.
5.4.1.2 Gaseous PathwaysThe GASPAR II computer program was used to calculate the doses to offsite receptors (the general public within 50 miles and the nearest individual receptors in various directions) from the new units. This program implements the radiological exposure models described in RG 1.109 (Reference 5.4-1) to estimate the doses resulting from radioactive releases in gaseous effluent. The atmospheric dispersion component of the analysis was calculated with the NRC-sponsored program, XOQDOQ (Reference 5.4-5). Dispersion and deposition factors were calculated from validated onsite meteorological parameters (wind speed, wind direction, stability class) for the combined years 1997, 1999, and 2000 as described in Section 2.7.
Section 2.7 describes the meteorological data, gives the dispersion and deposition factors, and gives the locations of the individual receptors (distance and direction) relative to STP 3 & 4. Those same receptors are described, with locations relative to STP 1 & 2, in Reference 5.4-3 5.4-14.
The following exposure pathways are considered in GASPAR II:
External exposure to contaminated ground
External exposure to gases in air
Inhalation of airborne activity
Ingestion of contaminated meat and milk
Ingestion of contaminated garden vegetables
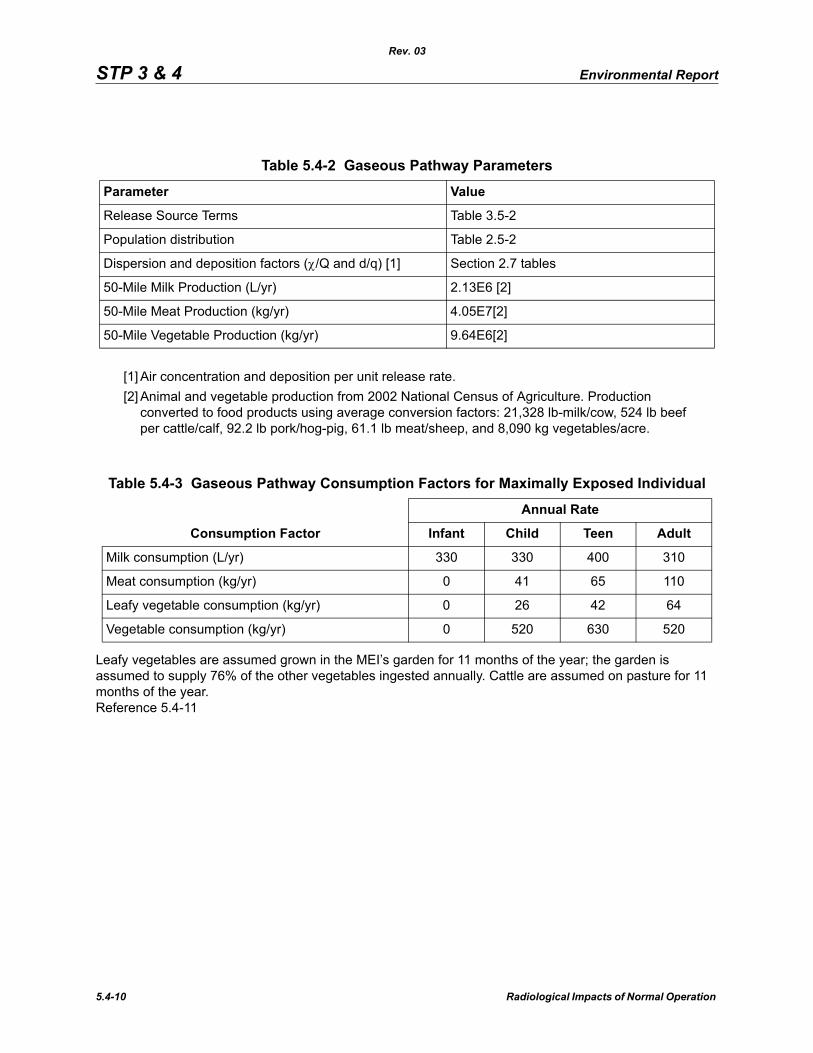
The spatial distribution of population was discussed in Section 2.5. The agricultural production for the 50 miles surrounding the site was obtained from 2002 National Census of Agriculture county data. The input parameters for the gaseous pathway are presented in Tables 5.4-2 and 5.4-3, and the receptor locations of maximum exposure, determined from GASPAR calculations are shown in Table 5.4-3 5.4-4.
5.4-2 Radiological Impacts of Normal Operation
STP 3 & 4 Environmental Report
Rev. 03
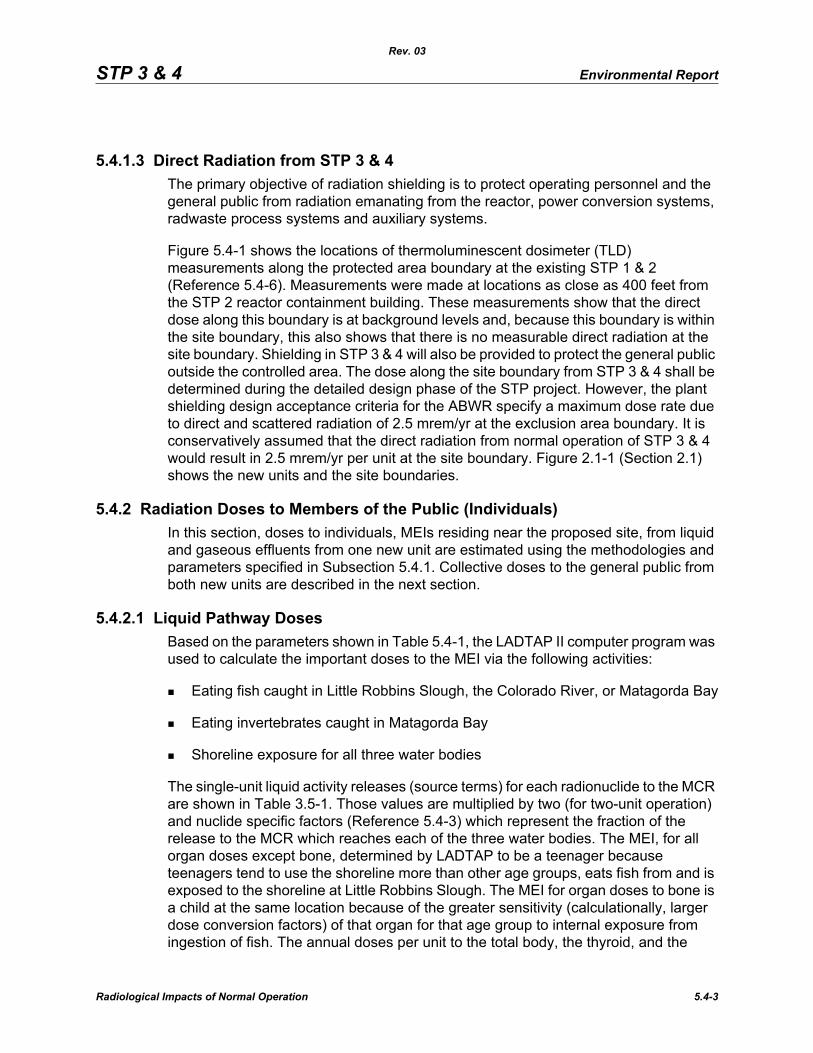
5.4.1.3 Direct Radiation from STP 3 & 4The primary objective of radiation shielding is to protect operating personnel and the general public from radiation emanating from the reactor, power conversion systems, radwaste process systems and auxiliary systems.
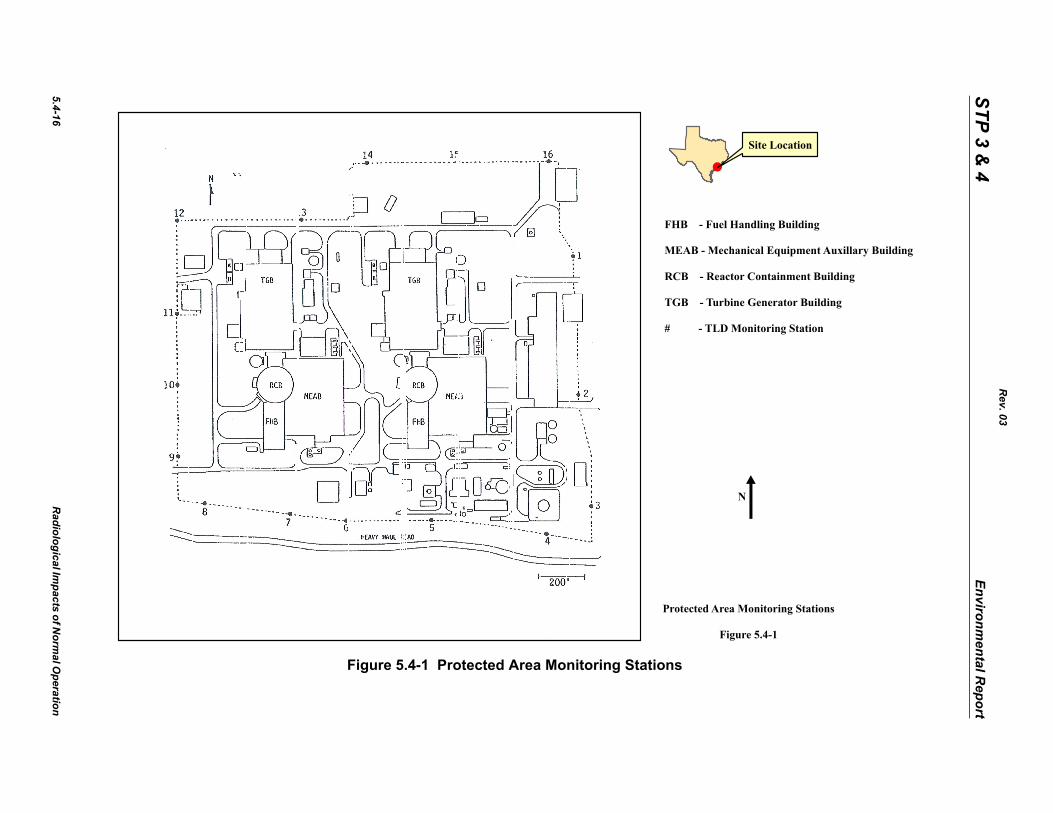
Figure 5.4-1 shows the locations of thermoluminescent dosimeter (TLD) measurements along the protected area boundary at the existing STP 1 & 2 (Reference 5.4-6). Measurements were made at locations as close as 400 feet from the STP 2 reactor containment building. These measurements show that the direct dose along this boundary is at background levels and, because this boundary is within the site boundary, this also shows that there is no measurable direct radiation at the site boundary. Shielding in STP 3 & 4 will also be provided to protect the general public outside the controlled area. The dose along the site boundary from STP 3 & 4 shall be determined during the detailed design phase of the STP project. However, the plant shielding design acceptance criteria for the ABWR specify a maximum dose rate due to direct and scattered radiation of 2.5 mrem/yr at the exclusion area boundary. It is conservatively assumed that the direct radiation from normal operation of STP 3 & 4 would result in 2.5 mrem/yr per unit at the site boundary. Figure 2.1-1 (Section 2.1) shows the new units and the site boundaries.
5.4.2 Radiation Doses to Members of the Public (Individuals)In this section, doses to individuals, MEIs residing near the proposed site, from liquid and gaseous effluents from one new unit are estimated using the methodologies and parameters specified in Subsection 5.4.1. Collective doses to the general public from both new units are described in the next section.
5.4.2.1 Liquid Pathway DosesBased on the parameters shown in Table 5.4-1, the LADTAP II computer program was used to calculate the important doses to the MEI via the following activities:
Eating fish caught in Little Robbins Slough, the Colorado River, or Matagorda Bay
Eating invertebrates caught in Matagorda Bay
Shoreline exposure for all three water bodies
The single-unit liquid activity releases (source terms) for each radionuclide to the MCR are shown in Table 3.5-1. Those values are multiplied by two (for two-unit operation) and nuclide specific factors (Reference 5.4-3) which represent the fraction of the release to the MCR which reaches each of the three water bodies. The MEI, for all organ doses except bone, determined by LADTAP to be a teenager because teenagers tend to use the shoreline more than other age groups, eats fish from and is exposed to the shoreline at Little Robbins Slough. The MEI for organ doses to bone is a child at the same location because of the greater sensitivity (calculationally, larger dose conversion factors) of that organ for that age group to internal exposure from ingestion of fish. The annual doses per unit to the total body, the thyroid, and the
Radiological Impacts of Normal Operation 5.4-3

STP 3 & 4 Environmental Report
Rev. 03
maximally exposed organ (bone) calculated by the computer program for this location are presented in Table 5.4-5.
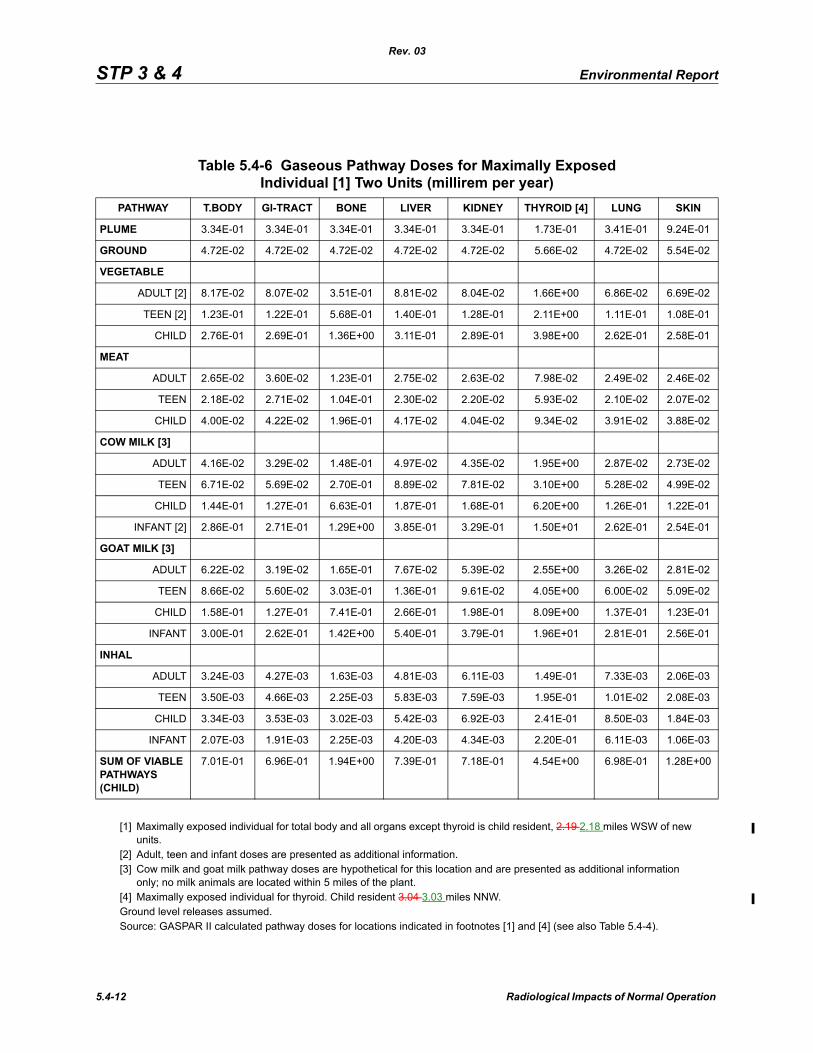
5.4.2.2 Gaseous Pathway DosesBased on the parameters in Table 5.4-2 and Table 5.4-3, the GASPAR II computer program was used to calculate doses to the maximally exposed individual child (MEI), who represents the bounding age group for total body and all organs. GASPAR determined that a child was the MEI because of the greater sensitivity of that age group to internal exposure from vegetables and meat. The location of this individual is given in Table 5.4-4. The single-unit gaseous activity releases (source terms) for each radionuclide are shown in Table 3.5-2. GASPAR II limits the number of source nuclides to 33. The nuclide source terms were broken into two groups that were analyzed independently, multiplied by two (for two-unit operation) and their resulting doses then added together. The annual pathway components for the total body, thyroid, and other organ doses calculated by the GASPAR computer program for this individual are presented, as calculated by the program, for two new units in Table 5.4-6; doses from a single unit would be one-half of these values.
The annual total body dose to the MEI is 0.35 mrem per unit as calculated by GASPAR to a child residing 2.19 2.18 miles WSW of the new units that would be exposed through plume, ground, inhalation, and ingestion of locally grown meat and vegetables pathways. Milk consumption was not considered because, based on annual Land Use Census results (Reference 5.4-3), no milk animals are located within 5 miles of the plant. The maximum GASPAR calculated annual thyroid dose of 2.27 mrem per unit is to a child residing 3.04 3.03 miles NNW of the new units. Experience at STP 1 & 2 (e.g., Reference 5.4-6), indicates that these calculations are likely conservative.
5.4.3 Impacts to Members of the Public (Individual and Collective Dose to the Public and Comparison with Regulations)
In this section, the radiological impacts to individuals and population groups from liquid and gaseous effluents are presented using the methodologies and parameters specified in Subsection 5.4.1. Table 5.4-7 estimates the total body and organ doses to the MEI from liquid effluents and gaseous releases from STP 3 & 4 for analytical endpoints prescribed in 10 CFR 50, Appendix I. The MEI receptor age group and location are those described in Subsection 5.4.2, a teenager using Little Robbins Slough for liquid pathway doses to all organs except bone, a child using Little Robbins Slough for liquid pathway doses to bone, a child residing 2.19 2.18 miles WSW of STP 3 & 4 for total body gaseous pathway doses, and a child residing 3.04 3.03 miles NNW of STP 3 & 4 for gaseous doses to the thyroid. Appendix I design limits are prescribed in terms of dose from a single unit; doses from STP 3 & 4 are presented likewise. As the table indicates, the single-unit doses are below Appendix I limits.
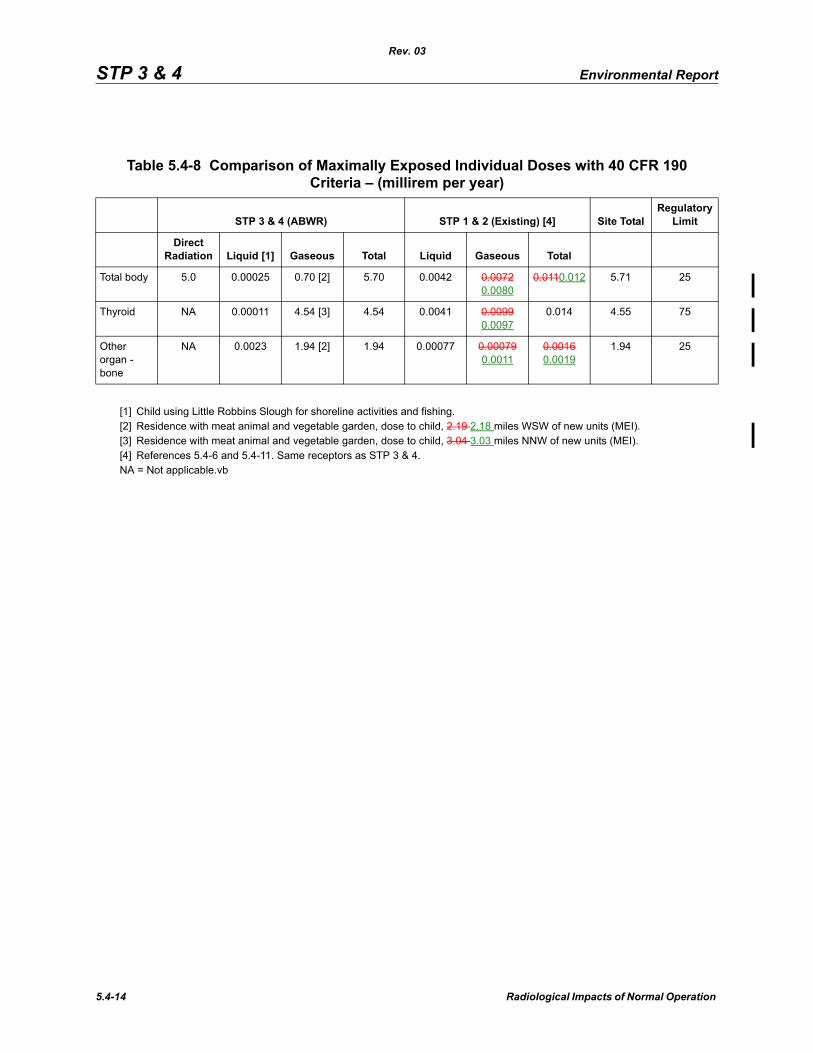
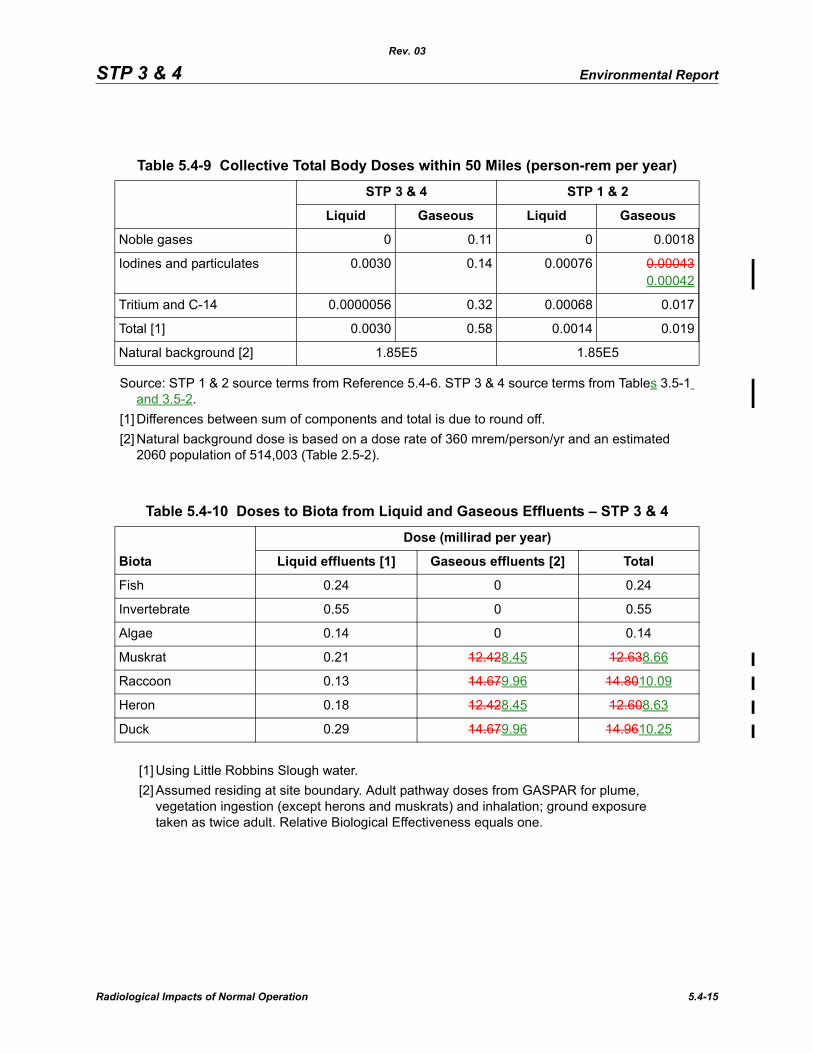
The total site liquid and gaseous effluent doses from STP 1 & 2 plus STP 3 & 4 would be well within the regulatory limits of 40 CFR 190 (Table 5.4-8). As indicated in NUREG-1555, demonstration of compliance with the limits of 40 CFR 190 is considered to be in compliance with the 0.1 rem limit of 10 CFR 20.1301. Table 5.4-9 shows the collective total body dose to the population within 50 miles of the STP site
5.4-4 Radiological Impacts of Normal Operation

STP 3 & 4 Environmental Report
Rev. 03
that would be attributable to both STP 1 & 2 and STP 3 & 4. This collective dose is less than 0.001% of that received by the population from natural causes. Impacts to members of the public from operation of the new units would be SMALL and would not warrant additional mitigation.
5.4.4 Impacts to Biota Other than Members of the PublicRadiation exposure pathways to biota are expected to be the same as those to humans, i.e., inhalation, external (from ground, airborne plume, water submersion, and shoreline), drinking water and ingestion. These pathways were examined to determine if they could result in doses to biota significantly greater than those predicted for humans from operation of STP 3 & 4. This assessment used surrogate species that provide representative information about the various dose pathways potentially affecting broader classes of living organisms. The gaseous pathway doses for raccoons and ducks were taken as equivalent to adult human doses for the inhalation, vegetation ingestion, plume, and twice the ground pathways. Neither muskrats nor heron ingest terrestrial vegetation and that pathway was deleted for those species. The doubling of doses from ground deposition reflects the closer proximity of these organisms to the ground. Doses to those same species plus fish are calculated by the LADTAP II computer program.
Doses to biota from liquid and gaseous effluents from STP 3 & 4 are shown in Table 5.4-10. The total body dose is taken as the sum of the internal and external dose. Annual doses to all of the surrogates meet the requirements of 40 CFR 190 (Table 5.4-8). Liquid doses were calculated for three separate receiving water bodies: the Colorado River, Little Robbins Slough, and Matagorda Bay. Table 5.4-10 presents doses to organisms using water from Little Robbins Slough because this water body has the calculated highest dose.
Use of exposure guidelines, such as 40 CFR 190, which apply to members of the public in unrestricted areas, is considered very conservative when evaluating calculated doses to biota. The International Council on Radiation Protection states that “…if man is adequately protected then other living things are also likely to be sufficiently protected,” and uses human protection to infer environmental protection from the effects of ionizing radiation (References 5.4-7 and 5.4-8). This assumption is appropriate in cases where humans and other biota inhabit the same environment and have common routes of exposure. It is less appropriate in cases where human access is restricted or pathways exist that are much more important for biota than for humans.
Species in most ecosystems experience dramatically higher mortality rates from natural causes than man, as witnessed by their lesser life spans. From an ecological viewpoint, population stability is considered more important to the survival of the species than the survival of individual organisms. Thus, higher dose limits could be permitted. In addition, no biota has been discovered that show significant changes in morbidity or mortality due to radiation exposures predicted from nuclear power plants.
An international consensus has been developing with respect to permissible dose exposures to biota. The International Atomic Energy Agency (IAEA) (Reference 5.4-9) evaluated available evidence including the “Recommendations of the International
Radiological Impacts of Normal Operation 5.4-5

STP 3 & 4 Environmental Report
Rev. 03
Commission on Radiological Protection” (Reference 5.4-7). The IAEA found that appreciable effects in aquatic populations will not be expected at doses lower than 1 rad per day and that limiting the dose to the maximally exposed individual organisms to less than 1 rad per day will provide adequate protection of the population. The IAEA also concluded that chronic dose rates of 0.1 rad per day or less do not appear to cause observable changes in terrestrial animal populations. The assumed lower threshold occurs for terrestrial rather than for aquatic animals primarily because some species of mammals and reptiles are considered more radiosensitive than aquatic organisms. The permissible dose rates are considered screening levels and higher species-specific dose rates could be acceptable with additional study or data. This gives further confidence that if the screening levels are met, such as they are here, then biota are protected.
A rad (radiation absorbed dose) is the absorption of 100 ergs per gram of, in this case, biological mass. The absorbed dose can be related to the biological effects on humans through the unit of rem (roentgen equivalent man). For many types of radiation, including almost all of those normally released by nuclear power plants (gamma and beta emitters), one rem is equivalent to the absorption of one rad.
The calculated total body doses in Table 5.4-10 can be compared to the 1 rad per day dose criteria evaluated in the “Effects of Ionizing Radiation on Plants and Animals at Levels Implied by Current Radiation Protection Standards” (Reference 5.4-9). The biota doses meet the dose guidelines by a large margin. In these cases, the annual dose to biota is much less than the daily allowable doses to aquatic and terrestrial organisms. Impacts to biota other than members of the public from exposure to sources of radiation would be SMALL and would not warrant mitigation.
5.4.5 Occupational Radiation DosesBased on the available data for the ABWR design, the projected annual occupational dose, including outages, is estimated to be 98.9 person-rem per unit or 197.8 person-rem for both units. For 2005, a two-unit outage year representative of maximum annual exposure, the collective radiation dose to workers at STP 1 & 2 was 248 person-rem (Reference 5.4-10), and the 2003 and 2004 doses to these workers were 143 and 120 person-rem (References 5.4-12 and 5.4-13).
With the collective worker dose for STP 3 & 4 expected to be comparable to that received from STP 1 & 2 and with the impacts to individual construction workers SMALL (see Section 4.5), impacts to workers from occupational radiation doses would be SMALL and would not warrant additional mitigation.
5.4.6 References5.4-1 “Calculation of Annual Doses to Man from Routine Releases of Reactor
Effluents for the Purpose of Evaluating Compliance with 10 CFR Part 50, Appendix I,” Regulatory Guide (RG) 1.109, Revision 1, NRC, Office of Standards Development, Washington D.C., October 1977.
5.4-6 Radiological Impacts of Normal Operation
STP 3 & 4 Environmental Report
Rev. 03
5.4-2 “Methods for Estimating Atmospheric Transport and Dispersion of Gaseous Effluents in Routine Releases from Light-Water-Cooled Reactors,” RG 1.111, Revision 1, NRC, Office of Standards Development, Washington, D.C., July 1977.
5.4-3 “Offsite Dose Calculation Manual,” STP (South Texas Project), Revision 13, January 1, 2006.
5.4-4 “LADTAP II Technical Reference and User Guide,” NUREG/CR-4013, NRC Office of Nuclear Reactor Regulation, Washington, D.C., April 1986.
5.4-5 “XOQDOQ: Computer Program for the Meteorological Evaluation of Routine Effluent Releases at Nuclear Power Stations Final Report,” NUREG/CR-2919, NRC, Office of Nuclear Reactor Regulation, Washington, D.C., September 1982.
5.4-6 “2005 Radioactive Effluent Release Report,” STP, South Texas Project Electric Generating Station, April 27, 2006.
5.4-7 “Recommendations of the International Commission on Radiological Protection,” ICRP (International Council on Radiation Protection) Publication 26, 1977.
5.4-8 “Recommendations of the International Commission on Radiological Protection,” ICRP, Publication 60, 1991.
5.4-9 “Effects of Ionizing Radiation on Plants and Animals at Levels Implied by Current Radiation Protection Standards,” Report Series No. 332, AEA (International Atomic Energy Agency) 1992.
5.4-10 “Annual Whole Body Doses at Licensed Nuclear Power Facilities 2005,” NUREG-0713, Volume 27, NRC 2006, Occupational Radiation Exposure at Commercial Nuclear Power Reactors and Other Facilities, Appendix B, Office of Nuclear Regulatory Research, Washington, D.C., December 2005.
5.4-11 “GASPAR II Technical Reference and User Guide,” NUREG/CR-4653, NRC, Office of Nuclear Reactor Regulation, Washington, D.C., March 1987.
5.4-12 “Annual Whole Body Doses at Licensed Nuclear Power Facilities 2003,” NUREG-0713, Volume 25, NRC 2004, Occupational Radiation Exposure at Commercial Nuclear Power Reactors and Other Facilities, Appendix B, Office of Nuclear Regulatory Research, Washington, D.C., December 2003.
Radiological Impacts of Normal Operation 5.4-7

STP 3 & 4 Environmental Report
Rev. 03
5.4-13 “Annual Whole Body Doses at Licensed Nuclear Power Facilities 2004,” NUREG-0713, Volume 26, NRC, Occupational Radiation Exposure at Commercial Nuclear Power Reactors and Other Facilities 2004, Appendix B, Office of Nuclear Regulatory Research, Washington, D.C., December 2005.
5.4-14 “Offsite Dose Calculation Manual,” STP (South Texas Project), Revision 15, October 1, 2007.
5.4-8 Radiological Impacts of Normal Operation
STP 3 & 4 Environmental Report
Rev. 03
Table 5.4-1 Liquid Pathway Parameters
Parameter Value
Release source terms Table 3.5-1 [1]
[1] Table 3.5-1 gives single unit releases to the main cooling reservoir. Sources to the Colorado River, Matagorda Bay, and Little Robbins Slough are calculated by multiplying the values in Table 3.5-1 by the factors for each water body and nuclide in Table B4-1 of Reference 5.4-3.
Water body flow 600, 97800, 18.3 cubic feet per second [2]
[2] Dilution flow rate in Colorado River, Matagorda Bay, and Little Robbins Slough (Reference 5.4-6).
Dilution factor for discharge 1 [3]
[3] Liquid discharge assumed fully mixed with annual average dilution flows.
Transit time to receptor 1 hour [4]
[4] 1 hour assumed for transit time from reservoir discharge in all water bodies. This parameter is inconsequential because of residence time in the reservoir.
Impoundment reconcentration model None [5]
[5] Completely mixed model used for all water bodies. Reservoir characteristics built into Reference 5.4-3, Table B4-1 factors.
50-mile population 514,003 [6]
[6] Estimated 2060 population, Table 2.5-2.
50-mile sport fishing, invertebrate catch 4.5E4, 1.8E6 kg/yr [7]
[7] One-half of fish catch in each of Colorado River and Matagorda Bay. All invertebrate catch in Matagorda Bay (Reference 5.4-3).
50-mile shoreline usage 7.84E6 person-hours/yr [8]
[8] One-half at each of Colorado River and Matagorda Bay (Reference 5.4-3).
50-mile swimming, boating usage 3.92E6 person-hours/yr [9]
[9] Each of swimming and boating assumed one-half of shoreline usage.
Fish consumption 21 kilograms per year [10]
[10]Adult MEI. 6.9 kilograms per year average (adult population) fish consumption (Reference 5.4-4).
Drinking water consumption None [11]
[11]References 5.4-3 and 5.4-6.
Radiological Impacts of Normal Operation 5.4-9
STP 3 & 4 Environmental Report
Rev. 03
Leafy vegetables are assumed grown in the MEI’s garden for 11 months of the year; the garden is assumed to supply 76% of the other vegetables ingested annually. Cattle are assumed on pasture for 11 months of the year.Reference 5.4-11
Table 5.4-2 Gaseous Pathway Parameters
Parameter Value
Release Source Terms Table 3.5-2
Population distribution Table 2.5-2
Dispersion and deposition factors (χ/Q and d/q) [1]
[1] Air concentration and deposition per unit release rate.
Section 2.7 tables
50-Mile Milk Production (L/yr) 2.13E6 [2]
[2] Animal and vegetable production from 2002 National Census of Agriculture. Production converted to food products using average conversion factors: 21,328 lb-milk/cow, 524 lb beef per cattle/calf, 92.2 lb pork/hog-pig, 61.1 lb meat/sheep, and 8,090 kg vegetables/acre.
50-Mile Meat Production (kg/yr) 4.05E7[2]
50-Mile Vegetable Production (kg/yr) 9.64E6[2]
Table 5.4-3 Gaseous Pathway Consumption Factors for Maximally Exposed Individual
Consumption Factor
Annual Rate
Infant Child Teen Adult
Milk consumption (L/yr) 330 330 400 310
Meat consumption (kg/yr) 0 41 65 110
Leafy vegetable consumption (kg/yr) 0 26 42 64
Vegetable consumption (kg/yr) 0 520 630 520
5.4-10 Radiological Impacts of Normal Operation

STP 3 & 4 Environmental Report
Rev. 03
Source: From GASPAR II (Reference 5.4-11) calculations of dose at nearby receptors (receptors given in Reference 5.4-3). Locations of to maximum dose reported above.
Table 5.4-4 Gaseous Pathway Receptor Locations
Receptor DirectionDistance (miles)
Site boundary NW NNW 0.58 0.69
Maximally exposed individual (MEI), total body and all organs but thyroid
WSW 2.19 2.18
MEI, thyroid NNW 3.04 3.03
Table 5.4-5 Liquid Pathway Doses for Maximally Exposed Individual [1] (1 Unit) (millirem per year)
[1] Liquid pathway MEI is a teenager ingesting fresh water sport fish and receiving shoreline exposure from the Little Robbins Slough for all organs except bone. MEI for dose to bone is a child at the same location.
Skin Bone Liver Total Body Thyroid Kidney Lung GI-LLI [2]
[2] GI-LLI = Gastrointestinal-lining of lower intestine.References 5.4-3 and 5.4-4
2.12E-4 1.15E-3 2.92E-4 2.63E-4 2.03E-4 2.13E-4 2.05E-4 4.34E-4
Radiological Impacts of Normal Operation 5.4-11
STP 3 & 4 Environmental Report
Rev. 03
Table 5.4-6 Gaseous Pathway Doses for Maximally Exposed Individual [1] Two Units (millirem per year)
[1] Maximally exposed individual for total body and all organs except thyroid is child resident, 2.19 2.18 miles WSW of new units.
PATHWAY T.BODY GI-TRACT BONE LIVER KIDNEY THYROID [4] LUNG SKIN
PLUME 3.34E-01 3.34E-01 3.34E-01 3.34E-01 3.34E-01 1.73E-01 3.41E-01 9.24E-01
GROUND 4.72E-02 4.72E-02 4.72E-02 4.72E-02 4.72E-02 5.66E-02 4.72E-02 5.54E-02
VEGETABLE
ADULT [2]
[2] Adult, teen and infant doses are presented as additional information.
8.17E-02 8.07E-02 3.51E-01 8.81E-02 8.04E-02 1.66E+00 6.86E-02 6.69E-02
TEEN [2] 1.23E-01 1.22E-01 5.68E-01 1.40E-01 1.28E-01 2.11E+00 1.11E-01 1.08E-01
CHILD 2.76E-01 2.69E-01 1.36E+00 3.11E-01 2.89E-01 3.98E+00 2.62E-01 2.58E-01
MEAT
ADULT 2.65E-02 3.60E-02 1.23E-01 2.75E-02 2.63E-02 7.98E-02 2.49E-02 2.46E-02
TEEN 2.18E-02 2.71E-02 1.04E-01 2.30E-02 2.20E-02 5.93E-02 2.10E-02 2.07E-02
CHILD 4.00E-02 4.22E-02 1.96E-01 4.17E-02 4.04E-02 9.34E-02 3.91E-02 3.88E-02
COW MILK [3]
ADULT 4.16E-02 3.29E-02 1.48E-01 4.97E-02 4.35E-02 1.95E+00 2.87E-02 2.73E-02
TEEN 6.71E-02 5.69E-02 2.70E-01 8.89E-02 7.81E-02 3.10E+00 5.28E-02 4.99E-02
CHILD 1.44E-01 1.27E-01 6.63E-01 1.87E-01 1.68E-01 6.20E+00 1.26E-01 1.22E-01
INFANT [2] 2.86E-01 2.71E-01 1.29E+00 3.85E-01 3.29E-01 1.50E+01 2.62E-01 2.54E-01
GOAT MILK [3]
[3] Cow milk and goat milk pathway doses are hypothetical for this location and are presented as additional information only; no milk animals are located within 5 miles of the plant.
[4] Maximally exposed individual for thyroid. Child resident 3.04 3.03 miles NNW.Ground level releases assumed. Source: GASPAR II calculated pathway doses for locations indicated in footnotes [1] and [4] (see also Table 5.4-4).
ADULT 6.22E-02 3.19E-02 1.65E-01 7.67E-02 5.39E-02 2.55E+00 3.26E-02 2.81E-02
TEEN 8.66E-02 5.60E-02 3.03E-01 1.36E-01 9.61E-02 4.05E+00 6.00E-02 5.09E-02
CHILD 1.58E-01 1.27E-01 7.41E-01 2.66E-01 1.98E-01 8.09E+00 1.37E-01 1.23E-01
INFANT 3.00E-01 2.62E-01 1.42E+00 5.40E-01 3.79E-01 1.96E+01 2.81E-01 2.56E-01
INHAL
ADULT 3.24E-03 4.27E-03 1.63E-03 4.81E-03 6.11E-03 1.49E-01 7.33E-03 2.06E-03
TEEN 3.50E-03 4.66E-03 2.25E-03 5.83E-03 7.59E-03 1.95E-01 1.01E-02 2.08E-03
CHILD 3.34E-03 3.53E-03 3.02E-03 5.42E-03 6.92E-03 2.41E-01 8.50E-03 1.84E-03
INFANT 2.07E-03 1.91E-03 2.25E-03 4.20E-03 4.34E-03 2.20E-01 6.11E-03 1.06E-03
SUM OF VIABLE PATHWAYS (CHILD)
7.01E-01 6.96E-01 1.94E+00 7.39E-01 7.18E-01 4.54E+00 6.98E-01 1.28E+00
5.4-12 Radiological Impacts of Normal Operation

STP 3 & 4 Environmental Report
Rev. 03
Table 5.4-7 Comparison of Annual Maximally Exposed Individual Doses with 10 CFR 50, Appendix I Criteria
Annual Dose
Type of Dose LocationABWR
(per unit) Limit
Liquid effluent Little Robbins Slough
Total body (mrem) [5] 2.63E-4 [1]
[1] Teenager using Little Robbins Slough.[2] Northwest North-northwest Site Boundary. Ground level releases assumed.[3] Includes Tritium and Carbon-14 terrestrial food chain dose (and inhalation dose for calculation
ease and conservatism), consistent with Table 1 of (Reference 5.4-1).[4] Child eating home grown meat and vegetables. Difference between Table 5.4-7 and 5.4-8
thyroid dose is 0.087 millirem per unit from noble gases in the plume.[5] One-one thousandth of a rem (roentgen equivalent man). For gamma and beta exposure, one
mrem = one mrad. [6] One-one thousandth of a rad (radiation absorbed dose), or 0.1 ergs per gram of biological
mass.[7] Child using Little Robbins Slough.Source: GASPAR II and LADTAP II calculated doses.
3
Maximum organ – Bone (mrem) 1.15E-3 [7] 10
Gaseous effluent [2] Site Boundary
Gamma air (mrad) [6] 5.303.30 10
Beta air (mrad) 6.854.28 20
Total external body (mrem) 4.843.20 5
Skin (mrem) 11.37.25 15
Iodines and particulates [3] (gaseous effluents)
Maximum organ – thyroid (mrem) MEI 2.182.19 [4] 15
Radiological Impacts of Normal Operation 5.4-13
STP 3 & 4 Environmental Report
Rev. 03
Table 5.4-8 Comparison of Maximally Exposed Individual Doses with 40 CFR 190Criteria – (millirem per year)
STP 3 & 4 (ABWR) STP 1 & 2 (Existing) [4] Site TotalRegulatory
Limit
Direct Radiation Liquid [1]
[1] Child using Little Robbins Slough for shoreline activities and fishing.[2] Residence with meat animal and vegetable garden, dose to child, 2.19 2.18 miles WSW of new units (MEI).[3] Residence with meat animal and vegetable garden, dose to child, 3.04 3.03 miles NNW of new units (MEI).[4] References 5.4-6 and 5.4-11. Same receptors as STP 3 & 4.NA = Not applicable.vb
Gaseous Total Liquid Gaseous Total
Total body 5.0 0.00025 0.70 [2] 5.70 0.0042 0.00720.0080
0.0110.012 5.71 25
Thyroid NA 0.00011 4.54 [3] 4.54 0.0041 0.00990.0097
0.014 4.55 75
Other organ - bone
NA 0.0023 1.94 [2] 1.94 0.00077 0.000790.0011
0.00160.0019
1.94 25
5.4-14 Radiological Impacts of Normal Operation
STP 3 & 4 Environmental Report
Rev. 03
Source: STP 1 & 2 source terms from Reference 5.4-6. STP 3 & 4 source terms from Tables 3.5-1 and 3.5-2.
[1] Differences between sum of components and total is due to round off.[2] Natural background dose is based on a dose rate of 360 mrem/person/yr and an estimated
2060 population of 514,003 (Table 2.5-2).
Table 5.4-9 Collective Total Body Doses within 50 Miles (person-rem per year)
STP 3 & 4 STP 1 & 2
Liquid Gaseous Liquid Gaseous
Noble gases 0 0.11 0 0.0018
Iodines and particulates 0.0030 0.14 0.00076 0.000430.00042
Tritium and C-14 0.0000056 0.32 0.00068 0.017
Total [1] 0.0030 0.58 0.0014 0.019
Natural background [2] 1.85E5 1.85E5
Table 5.4-10 Doses to Biota from Liquid and Gaseous Effluents – STP 3 & 4
Biota
Dose (millirad per year)
Liquid effluents [1]
[1] Using Little Robbins Slough water.
Gaseous effluents [2]
[2] Assumed residing at site boundary. Adult pathway doses from GASPAR for plume, vegetation ingestion (except herons and muskrats) and inhalation; ground exposure taken as twice adult. Relative Biological Effectiveness equals one.
Total
Fish 0.24 0 0.24
Invertebrate 0.55 0 0.55
Algae 0.14 0 0.14
Muskrat 0.21 12.428.45 12.638.66
Raccoon 0.13 14.679.96 14.8010.09
Heron 0.18 12.428.45 12.608.63
Duck 0.29 14.679.96 14.9610.25
Radiological Impacts of Normal Operation 5.4-15
5.4-16R
adiological Impacts of N
ormal O
peration
STP 3 & 4
Environmental R
eport
m
Monitoring Stations
ure 5.4-1
Site Location
N
andling Building
anical Equipment Auxillary Building
tor Containment Building
ne Generator Building
Monitoring Station
Rev. 03
Figure 5.4-1 Protected Area Monitoring Stations
Protected Area
Fig
!
FHB - Fuel H
MEAB - Mech
RCB - Reac
TGB - Turbi
# - TLD