Facts on the Seashore: Conflict, Population Displacement ...
HAL Id: halshs-01828477https://halshs.archives-ouvertes.fr/halshs-01828477
Preprint submitted on 3 Jul 2018
HAL is a multi-disciplinary open accessarchive for the deposit and dissemination of sci-entific research documents, whether they are pub-lished or not. The documents may come fromteaching and research institutions in France orabroad, or from public or private research centers.
L’archive ouverte pluridisciplinaire HAL, estdestinée au dépôt et à la diffusion de documentsscientifiques de niveau recherche, publiés ou non,émanant des établissements d’enseignement et derecherche français ou étrangers, des laboratoirespublics ou privés.
Returning Home After Conflict Displacement: LaborSupply and Schooling Outcomes Among Kosovar
HouseholdsIva Trako
To cite this version:Iva Trako. Returning Home After Conflict Displacement: Labor Supply and Schooling OutcomesAmong Kosovar Households. 2018. �halshs-01828477�
WORKING PAPER N° 2018 – 35
Returning Home After Conflict Displacement: Labor Supply and Schooling Outcomes Among Kosovar Households
Iva Trako
JEL Codes: I20, J22, O12, O15 Keywords : conflict displacement, education, labor, instrumental variables
PARIS-JOURDAN SCIENCES ECONOMIQUES
48, BD JOURDAN – E.N.S. – 75014 PARIS TÉL. : 33(0) 1 80 52 16 00=
www.pse.ens.fr
CENTRE NATIONAL DE LA RECHERCHE SCIENTIFIQUE – ECOLE DES HAUTES ETUDES EN SCIENCES SOCIALES
ÉCOLE DES PONTS PARISTECH – ECOLE NORMALE SUPÉRIEURE INSTITUT NATIONAL DE LA RECHERCHE AGRONOMIQUE – UNIVERSITE PARIS 1
Returning Home After Conflict Displacement: Labor
Supply and Schooling Outcomes Among Kosovar
Households∗
Iva Trako†
July 3, 2018
Abstract
This paper uses the 1998-1999 Kosovo war and the following massive displacement of peo-
ple as a natural experiment in order to estimate the impact of conflict displacement on
labor market and education outcomes of Kosovars after they returned from exile. I exploit
the interaction of the spatial variation in conflict intensity -as measured by casualties and
bombings- and distance to the Albanian border as a source of exogenous variation in the
displacement status. Results indicate that displaced Kosovar men are less likely to be em-
ployed in the agricultural sector and to work on their own account, while displaced Kosovar
women are more likely to be inactive. Loss of assets (e.g. land, livestock) in an agrarian
skill-based economy and also loss of social networks in an informal labor market might have
further decreased the probability to find employment relative to stayers. However, shortly
after the return home, the results also indicate that displaced Kosovar men and women are
more likely to be working off-farm, especially in the construction and public administration
sectors, which indicates a relatively quick recovery. In addition, displaced Kosovar girls are
more likely to be enrolled in primary school, but I find no effect on education for boys.
The refugee camp experience might have provided better conditions to young Kosovar girls
compared to the the precarious pre-war “parallel” education system.
JEL Classification: I20, J22, O12, O15
Keywords: conflict displacement, education, labor, instrumental variables
∗I am very grateful to my advisors, Karen Macours and Oliver Vanden Eynde, for their special supportand guidance on the elaboration of this paper and to Christophe Bergouignan from Universite Montesquieu -Bordeaux IV for providing me the 1999 Kosovo Socio-Demographic and Health Survey (DSHS). I also gratefullyacknowledge all the helpful comments and suggestions from Gustavo Bobonis, John Giles, Pascaline Dupas, SureshNaidu, Pamela Jakiela, Jeremie Gignoux, Christian Fons-Rosen, Ivan Torre and all the participants of the CasualFriday’s Development Seminar at Paris School of Economics, the European Doctoral Programme Conference andthe Oxford Development Conference. I am also very thankful to Guadalupe Kavanaugh who provided excelentresearch assitance. The views expressed in this paper are those of the author and do not necessarily representthose of Paris School of Economics. I am responsible for all remaining errors.†Paris School of Economics, 48 Boulevard Jourdan, 75014, Paris. Email: [email protected]
1 Introduction
Every year millions of people around the world are being forced to abandon their homes due
to conflict, either as refugees or internally displaced persons (IDPs). According to the UNHCR
(2017) Global Trends Report, by the end of 2016 the number of forcibly displaced individuals
worldwide as a result of persecution, conflict, violence, or human rights violations reached 65.6
million, which has been the highest on record.1 It is not just the scale of global forced dis-
placement that is disconcerting but also its rapid acceleration in the recent years (Martin, 2016;
IMDC, 2016; Crawford et al., 2015).
Migration and displacement may look very similar ways of movement of people, but while the
former can be considered an optimization problem for the household, the latter is an exogenous
shock to the household.2 Displacement is a direct side-effect of armed conflict, where individuals
are forced to abandon their original place of residence due to life threatening situations. This
condition puts individuals and families in a very vulnerable situation where they lose their social
network, physical assets and often family members. However, little is known about the short-
to long-term impacts of displacement on livelihoods. In order to identify policies that might
mitigate the challenges and adverse conditions that the displaced people face, it is necessary to
evaluate the effects of displacement on individuals so that post-war aid can be better targeted.
There is already an extensive economic literature on the impacts of voluntary migration and
the impacts of war and violence, but the literature on the economics of forced displacement
is still in its early stages.3 One of the principal reasons for the limited number of studies
using quantitative methods is the lack of reliable data. Similarly, methodological difficulties in
establishing exogeneity in the displacement shock complicates claims of causality. However, this
literature is starting to gain attention in the last years as the micro data sets on conflict areas
are becoming more available. There are few examples of quantitative estimates of the effect of
displacement and the consequences seem to be mixed.4 For instance, Sarvimaki, Uusitalo and
Jantti (2009) find increased mobility among displaced Finns due to WWII and consequently
higher long-run incomes. Nevertheless, most of the previous literature suggests that there are
1During 2016, 10.3 million people were newly displaced by conflict or persecution. This includes 6.9 millionindividuals displaced within the borders of their own countries and 3.4 million new refugees and new asylum-seekers. The UNHCR (2017) Global Trends Report can be found here: http://www.unhcr.org/5943e8a34.pdf.
2The discussion on the determinants of forced displacement, its definition and how forced migrants compareto “voluntary” migrants is out of the scope of this paper. See Czaika and Kis-Katos (2009); Engel and Ibanez(2007); Cortes (2004) and Stark (2004) for this discussion.
3The literature on the impacts of conflict has found mixed consequences. For instance, a number of studieshave found that civil war has little or no lasting effects on an area (Brakman, Garretsen and Schramm, 2004;Chen, Loayza and Reynal-Querol, 2008; Davis and Weinstein, 2002; Miguel and Roland, 2011). Other studies havefound that conflicts in fact might have positive impacts, especially in terms of political participation (Valente,2013; Bellows and Miguel, 2009; Blattman and Annan, 2010). There is also evidence of long-run negative impactsfrom conflict on labor market and education outcomes (Swee, 2015; Akbulut-Yuksel, 2014; Leon, 2012; Blattmanand Annan, 2010; Shemyakina, 2011; Kondylis, 2008).
4Ruiz and Vargas-Silva (2013) provides a literature review on the effect of displacement on migrating individ-uals as well as on hosting communities.
1
serious negative consequences of forced displacement for those forced to migrate. Fiala (2015)
finds a sizeable reduction in consumption smoothing for displaced households in Uganda. Eder
(2014) analyzing post-war Bosnia, shows that displaced individuals invest less on their children’s
education. Kondylis (2010) also using data from post-war Bosnia, finds higher unemployment
for men and lower labor force participation for women. Bauer, Braun and Kvasnicka (2013),
analyzing the integration of Germans from Easter Europe, conclude that the first generation of
migrants has lower incomes and ownership rates. Abdel-Rahim, Jaimovich and Ylonen (2015),
studying displacement in Nuba Mountains of Sudan, conclude that displaced households hold
fewer assets and are less involved in production. Verwimp and Munoz-Mora (2018) investigate
the food security and nutritional status of formerly displaced households in Burundi and they
find that individuals who remain much longer in a displacement status are worse off compared
to those who returned earlier.
This paper contributes to this literature by analyzing the impact of conflict displacement on
labor market and education outcomes for the case of post-war Kosovo. During the 1998-1999
Kosovo war and especially during the NATO bombing campaign (March-June 1999), around
13,140 individuals were killed or went missing in Kosovo and more than 1 million were displaced
either as refugees or IDPs, which represents approximately 70% of Kosovo’s pre-war population.
However, after the end of the conflict in June 1999, the displaced individuals started returning
immediately to their previous residences and by the end of 1999 almost 95% had returned. The
aim of this study is to use the Kosovo war and this massive displacement of people as a natural
experiment in order to compare the labor market and education outcomes of those individuals
that were displaced and decided to return relative to those that stayed in Kosovo.
For this purpose, I use two post-conflict individual and household survey data (e.g. 1999
Kosovo Demographic Social and Health Survey and 2000 Kosovo Living Standard Measurement
Survey) containing rich information on labor market and education outcomes, displacement
status and other individual characteristics. Both household surveys have several remarkable
features that make them convenient for measuring displacement. For instance, they record
the place of residence before, during and after the conflict for each individual and they were
both collected post-war, that is, after most of the displaced individuals returned to their homes.
Displacement status is defined using the place of residence: a person who reports having migrated
during the period of the conflict —while resettlement or returned refugee is considered a displaced
person, regardless of whether or not she resettled in her municipality of origin.5 I also use two
municipality level data on conflict intensity: the 1998-2000 Kosovo Memory Book database on
casualties from the Kosovo war and the Human Rights Data Analysis Group database on NATO
bombing airstrikes, which both can be geo-matched to the household data at the municipality
5Municipalities are the second political division of Kosovo, below districts and above villages or settlements.There were 29 municipalities in 1991 Kosovo, and some were divided after the war to form 30 municipalities. In1991, the median population in the municipalities was 54,544 and the mean was 65,206, with a minimum of 4,611and a maximum of 199,654.
2
level.
Despite the fact that displacement is to a great extent a forced action, it is still partly a result
of a decision and therefore it is an endogenous variable.6 In order to reduce unobserved selection
and biases that may be present in the displacement decision, I use an instrumental variables
approach where I exploit the interaction of the spatial variation in conflict intensity and distance
to the Albanian border as a source of exogenous variation in the displacement decision.7 This
empirical strategy uses two sources of variation. First, the severity of the conflict is a good
candidate to serve as instrument since the pattern of the Serb invasion in 1998/99 was governed
by the will to create an ethnically homogeneous Serb territory. Likewise, the patterns of the
NATO bombing raids generated the necessary fear to make people flee their homes (Ball et al.,
2002; OSCE, 1999). Second, distance has been generally assumed in the literature to discourage
migration by raising transaction costs. However, in this context distance is used to capture
affinity with the customs and culture over the border and mainly ethnic heterogeneity. Basically,
areas with higher ethnic heterogeneity (i.e. located further away from Albania) were also more
likely to suffer forced displacement. Indeed, most of forced expulsions in 1999 were carried
out by the Serb forces in large towns across the north-eastern region of the province, which
also corresponds with the most ethnically heterogenous municipalities in terms of Albanian and
Serb populations (OSCE, 1999). Hence, I argue that forced displacement in Kosovo was highly
influenced by conflict intensity and distance to the Albanian border.
This identification strategy relies on the idea that the relationship between the severity of the
conflict and the decision to be displaced depends on the distance to the Albanian border, but the
relationship between the severity of the conflict and the outcomes of interest does not depend
on the distance to the Albanian border. In practice, I use the war casualties and the number of
NATO bombing days at the municipality level as two proxies for the level of conflict intensity.
While, distance to the Albanian border is measured as the driving distance (in kilometers) from
the village of residence to the south-west Kosovo-Albanian border of Morina.
However, one potential concern that might threaten the exogeneity assumption is that pre-
war local economic conditions might predict local conflict intensity and distance to the Albanian
border. For instance, locations closer to the Albanian border were more likely to have a higher
proportion of Albanians before the war. This is of interest since ethnicity might have determined
individual economic status through ethnic discrimination. Historical evidence suggests that
casualties and bombings in Kosovo were not determined by pre-war economic performance at the
local level since the primary aim of Serb attacks was territorial separation and ethnic cleansing.
6Conflict displacement is often a non-random event. Households are generally forced to leave their homes byrebels or army forces that take possession of their land, expand territorial control, weaken population supportfor opponent groups or increase their own support base and income. Therefore, it is likely that characteristicssuch as wealth or local visibility makes some households more prone to being displaced than others (Verwimpand Munoz-Mora, 2018; Justino, 2011).
7The interaction-based instrumental variables technique has been previously proposed and used in the litera-ture by Nunn and Qian (2014); Esarey (2015); Nizalova and Murtazashvili (2016) among others.
3
Similarly, NATO’s objective was to attack only targets of military nature (i.e. military facilities,
equipment, weapons etc) regardless of the economic performance of the different regions (Grant,
1999; ICTY, 2000). Therefore, since the pattern of conflict in Kosovo was likely driven by geo-
strategic motives rather than economic motives, it is plausible to argue that conflict intensity
interacted with distance to the Albanian border is likely to be orthogonal to unobserved factors
that might affect schooling and labor market outcomes.
Even though historical references suggest that in Kosovo there was no targeting of indi-
viduals and regions based on the local economic differences, in order to address this potential
concern I control for pre-war labor-force participation and pre-war proportion of Albanians at
the municipality level. In addition, I also perform several robustness checks and conduct placebo
tests with different samples in order to asses the validity of the exclusion restriction and also to
reinforce the results obtained from the IV estimation.
The first-stage results indicate that further away from the Albanian border, an increase in
conflict intensity increases the likelihood of being displaced. Indeed, according to the historical
references Kosovar Albanians living in municipalities with more ethnic heterogeneity were more
likely to be displaced by the Serb forces. The second-stage results show that conflict displacement
impacted negatively but also positively the labor market and education outcomes of Kosovars
who were forced to abandon their homes relative to those who stayed.
Firstly, I find that, in the short-run, conflict displacement had a negative impact on labor
market outcomes of Kosovar men and women, particularly in terms of access to employment.
More specifically, these results show that displacement is associated to a significant and large
increase in women’s inactivity and to a decrease in men’s self-employment and their employment
in the agricultural sector. Interestingly, I also find that shortly after the return in Kosovo, conflict
displacement also had a positive impact on labor market outcomes. The medium-term results
indicate that both displaced Kosovar men and women are also more likely to be working off-farm
(i.e. construction and public administration sectors). One possible explanation for these findings
is that loss of assets, land and livestock in an agrarian skill based economy must have made it
very difficult for returned refugees to find employment. Another plausible mechanisms behind
these results is the loss of social networks in an informal labor market, which is fundamental for
the job search in these type of transition economies.
Secondly, the results in terms of education outcomes show that, in the short-run, while
displaced Kosovar girls are significantly more likely to be enrolled in primary school relative to
those who stayed, displacement does not seem to have any effect on Kosovar displaced boys or
teenage girls. One possible channel through which this effect might be operating is the refugee
camp experience. Young female refugees, especially those who were in camps, might have had
better access to basic education and better conditions than the IDPs and the stayer girls after
taking into account the pre-war precarious context of the “parallel” education system in Kosovo.
This paper contributes to the growing literature on the economics of forced displacement at
4
the microeconomic level. To the best of my knowledge, this study is the first to consistently
analyze the casual effect of conflict displacement in the immediate post-conflict period in Kosovo
and to also provide empirical evidence on the potential mechanisms behind the results. It assess
the effect of conflict-induced displacement on labor market and education outcomes accounting
for potential selection issues by using a novel interaction-based instrument involving conflict
intensity and distance. Lastly, Kosovo constitutes an interesting case study for this analysis as
it is one of only a small number of countries for which detailed conflict intensity and conflict
displacement information is available for the immediate period after the conflict.
The rest of the paper is organized as follows: Section 2 provides background information
on the war and conflict displacement in Kosovo, Section 3 describes the databases used in the
analysis and some descriptive evidence, Section 4 presents the instrumental variables empirical
strategy and discusses the identifying assumptions, Section 5 presents the results, Section 6
sheds some light on the plausible channels of each one of the outcomes, while Section 7 briefly
concludes.
2 Background
2.1 Kosovo War (1998-1999)
Kosovo is a partially recognised state in the Balkans with a long history of ethnic diversity and
conflict. Just before the war, in 1998, it’s population was around 2,1 million, of which 83% were
Albanians, 10% were Serbs and 7% belonged to other ethnicities. Ethnic identity has always
been analogous to religious identity, as Albanians are predominantly Muslims, while Serbs are
Orthodox Christians (Brunborg, 2002).
From 1989 (when Kosovo’s autonomous status within Serbia was partially revoked) till 1998,
the majority of Kosovo Albanians lived in a situation similar to an apartheid, in which they
were denied access to jobs and services, and were unable to exercise basic rights. As a result,
the Kosovo Albanians established parallel systems of institutions for almost every aspect of
daily life, including employment, education and health. Also, the continued discrimination and
repression by the Serbs led to the emergence of an armed insurgency group of Albanians which
was called the Kosovo Liberation Army (KLA). During the ’90s, the KLA launched several
attacks targeting Serbian law enforcement in Kosovo.8
Given this situation, in March 1998, Serb forces engaged in an indiscriminate military cam-
paign of “ethnic cleansing” against KLA and Albanian civilians. Their aim was to expel all the
Albanians from Kosovo in order to create an ethnically homogenous territory. After one year of
continued ethnic tensions and violent confrontations between the Albanians and Serbs and after
several failed attempts at a diplomatic solution, NATO intervened on March 24th 1999 with
8Between 1989 and the beginning of 1998, an estimated 350,000 Kosovo Albanians left the province at onestage or another, most of them going to countries in Western Europe.
5
a bombing campaign against the Republic of Serbia, including attacks on targets in Kosovo.
The NATO air campaign was justified in order to stop the actual and potential killings and
expulsions of Kosovo Albanians by Serbian forces (Cutts, 2000).
Finally, after a 78-day air campaign, on June 9th 1999, the Republic of Serbia accepted a
peace plan that required the withdrawal of all Serb forces from Kosovo, the safe and free return
of all refugees and displaced people, and the establishment of a UN mission.
2.2 Forced Displacement from Kosovo
As a consequence of the ethnic cleansing and the NATO bombing campaign, Kosovo suffered
one of the largest population displacements in Europe since WWII. On the one hand, reports
by the Humanitarian Law Centre (HLC) in Belgrade and Kosovo estimate that approximately
13,535 civilians and soldiers were killed or missing. On the other hand, the United Nations High
Commissioner for Refugees (UNHCR) estimates that around 1.4 million people were displaced
from their homes, of which around 850,000 sought refugee protection out of Kosovo and around
600,000 were internally displaced persons.9 Figure A-1 shows a map of the distribution of the
displaced populations from Kosovo in neighbouring countries/territories and Figure A-2 shows
the cumulative refugee population over time and by country of destination from March till June
1999.10
However, after the end of the war in June 1999, the refugees started returning immediately.
Within three weeks, 500,000 people had returned, and by the end of 1999, more than 800,000
had returned to their homes (including people who had left before the NATO air campaign).
In particular, out of approximately 850,000 Kosovo refugees during the war, by October 1999
around 65,500 individuals remained displaced and by May 2000 the number had dropped to
around 40,000 (Cutts, 2000). Figure A-3 shows the cumulative returned refugee population
since the end of the Kosovo war.
It is important to note that the data used in this analysis is limited to displaced persons
who by 1999-2000 returned to Kosovo, but clearly it does not include individuals that preferred
not to come back before the collection of the household surveys. Returning home from conflict
displacement is also a non-random event. In general, households that are poorly integrated
in the host economy or with more assets at their original home may be more likely to return
(Arias, Ibanez and Querubin, 2014). According to the Kosovo Agency of Statistics (2014) the
number of Kosovo residents that reported to have migrated during the 1998-1999 Kosovo war
and decided not to come back was around 50,000 individuals by 2011. This number of non-
returned individuals represents 5-6% of the total displaced refugee population, which is quite
9Kosovo Crisis Update, June 11, 1999. Geneva, Switzerland: United Nations High Commissioner for Refugees10Of those that were expelled from Kosovo after the start of the air campaign, some 450,000 went to Albania,
some 242,000 to the former Yugoslav Republic of Macedonia (FYR Macedonia), some 70,000 to Montenegro andsome 96,000 participated of the Humanitarian Evacuation Programme (HEP) which allowed them to go to othercountries such as Germany, USA, Turkey, France, Italy etc (Cutts, 2000).
6
small in order to generate a problem of selected sample of the displaced individuals.
In order to better understand the nature of this selection, I also use the 1999 Kosovo DSHS,
2000 Kosovo LSMS and the 2012 Kosovo Remittances Survey to compare the educational at-
tainment of the displaced who returned to Kosovo to that of emigrants from Kosovo to other
countries who left the country due to the 1998-1999 war and never came back. I find that the
proportion of individuals having achieved higher education is similar across groups, while the
proportion of individuals having low (primary education) and medium education (secondary)
differs across groups: around 40% of the displaced who returned have low education, compared
to 31% of the emigrants from Kosovo to other countries; and around 38% of the displaced who
returned have medium education, compared to 46% of the emigrants that never returned to
Kosovo.
3 The Data
This study uses four data sources: two household-individual level surveys and two conflict
intensity databases. Firstly, the individual level surveys are: the 1999 Kosovo Demographic,
Social and Health Survey (DSHS) and the 2000 Kosovo Living Standard Measurement Survey
(LSMS). Secondly, the conflict intensity datasets are municipality level data on war casualties
from the 1998-2000 Kosovo Memory Book (KMBD), and municipality level data on reported
bombing days from the Human Rights Data Analysis Group (HRDAG) database on NATO
airstrikes.
The 1999 Kosovo DSHS was carried out by United Nations Population Fund (UNFPA),
the International Organization for Migrations (IOM), and the Statistical Office of Kosovo from
November 1999 to February 2000, which is just after the conflict. While, the 2000 Kosovo LSMS
was conducted by the World Bank from September to December 2000, which is over a year after
the end of the NATO air campaign that terminated the conflict in Kosovo. These surveys are
both representative on the national as well as on the regional level. The sampling procedure
was stratified by region (7 regions in the DSHS and 5 regions or areas of responsibility in the
LSMS) and by sector (rural and urban). The 1999 DSHS covered 27 out of 29 municipalities
and interviewed a total of 7,343 randomly selected households and 40,918 individuals. The 2000
LSMS covered 29 out of 30 municipalities and was administered to a total of 2,880 randomly
selected households and 17,917 individuals.11 Both household surveys contain a rich set of
information on demographics, education, labor activities, health, conflict displacement and other
characteristics.
The Kosovo Memory Book Database (KMBD) is a joint project between the Humanitar-
ian Law Centre (HLC) in Belgrade and the HLC in Kosovo. This project collected detailed
11Note that until 1999, Kosovo had 29 municipalities. The municipality of Malisevo was part of four othermunicipalities (Klina, Orahovac, Suva Reka and Glogovac) and did not exist until July 2000, when it was re-established by the United Nations Mission in Kosovo (UNMIK).
7
information on casualties between 1998 and 2000 in connection to the war in Kosovo, which
are document based on death records, statements by surviving family members and witnesses.
This database contains the victims’s vital information at the time of death, including name,
age, ethnicity, location of the incident, date of the incident, type of casualty (civilian or military
status) etc. Overall, the Kosovo Memory Book indicates that 13,140 individuals were killed or
missing in Kosovo, with an average of 437 casualties per municipality. From the total number
of victims, around 76% are civilians, while 24% are armed forces. Based on several analysis and
findings, including a comparison with ten other databases in which no new death records were
found, the KMBD was found to have more records than any other database in every period
and for each municipality (Kruger and Ball, 2014). I use the KMBD municipality level data on
war casualties and the 1991 population census to compute the war casualty rate- as the total
number of casualties per 1,000 inhabitants at the municipality level.12 This variable offers a
measure of conflict incidence at the local level. A municipal map of Kosovo which shows the
spatial variation in war casualties per 1,000 Kosovo inhabitants is presented in Figure 2.
The NATO airstrikes database of the HRDAG records the number of reported bombing
attacks occurring in each municipality per day during the NATO air campaign (March-June
1999). These bombing records are derived from a report published by the Human Rights Watch
(HRW) in February 2000, which contains daily information on bombings based mostly on dif-
ferent Serbian government sources and Serbian newspapers, but they are also based on NATO’s
reports in the Operation Allied Force Update. No effort was made to quantify the severity of
each airstrike, but reports of different airstrikes were counted separately. From this database, I
compute bombing intensity as the total number of days a municipality was attacked with bombs
and missiles during the NATO Air Campaign (78 days). Figure 3 shows the spatial variation in
bombing intensity from March-June 1999 across municipalities.
These measures of local conflict incidence - i.e. war casualty rate and bombings at the
municipality level - are used to instrument for displacement in the subsequent regression analysis.
3.1 Measuring Conflict Displacement
The 1999 Kosovo DSHS and the 2000 Kosovo LSMS have several attractive features which
make them convenient for measuring forced displacement. Firstly, they both contain several
self-reported outcomes which are used to explicitly identify each individual that was displaced
during the 1998-1999 Kosovo war. In particular, forced migrants are identified using the following
questions: “How many times did you change residence since the beginning of the conflict (March
1998)?”, “What was the main reason for this displacement?”; to which the five answers are:
12It is important to note that the 1991 Kosovo population census was boycotted by the Kosovar Albanianpopulation. To compensate for this the FRY statistical office (FSO) in Belgrade estimated the size of the Albanianpopulation on the basis of the 1981 census results taking into account population changes during the intercensalperiod 1981-1991. The 1991 population census data at the municipality level that is used in this study is takenfrom Brunborg (2002).
8
security, house inhabitable, work, study, other. Given this, I exclude from the analysis all
individuals who declared having moved for a job, for studies and those that moved for other
reasons, using the forcibly displaced as the treated group and the non-movers or stayers as the
control group.13
Secondly, both household surveys record the place of residence pre, during and post-conflict
for the forcibly displaced and the non-displaced. Specifically, this information is identified
through the following question:“Where did you live immediately before the conflict (March
1998)?”, with the following categories: here (site of survey), other municipality, Former Yu-
goslavia, Albania, Serbia, Western Europe, other and not yet born. As the municipality of
residence before the war is recorded for all individuals, this allows me to geo-match the mea-
sures of conflict intensity at the municipality level to each individual regardless of displacement
status. These measures of local conflict intensity are used to instrument for displacement in the
subsequent regression analysis.
Conversely to other studies, both surveys are successful in differentiating between refugees
(displaced persons who went into exile during the time of the conflict) and internally displaced
persons (IDPs) (individuals who resettled in camps or in other locations within Kosovo during
the conflict). The individuals that declared being forcibly displaced were also asked “Where
were you living during most of this absence?”; to which the answers are: other locality but
same municipality, other municipality, Former Yugoslavia, Albania, Serbia, Wester Europe and
other. The 1999 Kosovo DSHS, in particular, also records whether an individual went to a
refugee camp. Given this information, I only include individuals who resided in Kosovo pre-war,
excluding individuals that lived in other parts of former Yugoslavia or some other country before
March 1998.
Thirdly, both surveys were collected post-war, which coincides with the return of the majority
of the refugees and IDPs to their homes. The 1999 Kosovo DSHS was implemented five months
after the end of the war (November 1999), while the 2000 Kosovo LSMS was implemented
almost one year and a half after the end of the war (September 2000). Figure 1 shows a
timeline of the cumulative refugee flows (displaced refugees and returned refugees) during the
war and the implementation of the household surveys in 1999 and 2000, which indicates that
the vast majority of the refugees had returned in Kosovo before the start of the collection of
both household surveys. Moreover, Figure A-4 shows the patterns of daily returned refugees
as recorded by UNHCR and Figure A-5 shows the patterns of first and last displacement as
recorded in the 1999 Kosovo DSHS. Both of them clearly indicate that most of the refugees had
returned in Kosovo by the end of September 1999.
13In the 1999 Kosovo DSHS 97.33% declared being forcibly displaced while only 2.67% declared being willinglydisplaced. In the 2000 Kosovo LSMS 98% declared being displaced due to security reasons, 0.42% due to houseinhabitalbe, 0.17% due to work, 0.03% due to study and 0.48% due to other reasons. Therefore, the sampleexcluded is clearly very small and negligible. Even if I do not exclude these few observations from the analysisand I put them in the treatment group as displaced individuals, the main results remain unaltered. (Results uponrequest).
9
3.2 Descriptive Statistics
For the labor market outcomes analysis I restrict the sample to men and women aged 20-65
years old and for the education outcomes analysis, I restrict the sample to boys and girls aged
6-19 years old. Table 1 shows descriptive statistics of forced displacement by gender and age
group for each database. In general, 60-70% of the individuals in each sample were forcibly
displaced, which is very similar to the UNHCR estimates of 1.4 million displaced individuals
from a population of 2.1 million (approx. 67%). Women and children were more likely to be
displaced compared to men, indicating that a proportion of the men stayed in the province to
fight in the war. In particular, 40-45% chose to move out of Kosovo (refugees), while 20-25%
were displaced persons inside Kosovo (IDPs). Also, around 19% decided to go to a refugee
centre, which means that around 2/3 of the displaced population went to host families. The
return pattern of the displaced population indicates that 87-96% had the same municipality
of residence as before the start of the war (March 1998). Due to the fact that several homes
remained inhabitable after the war, some returnees remained displaced and could not return to
their previous residence.
Table 2 presents descriptive statistics of the displacement status by ethnic group. More
than 95% of the displaced population are ethnic Albanians, which clearly gives some evidence of
the “ethnic cleansing” campaign of the Serbs against the Albanians. However, among the non-
displaced population, Albanians also constitute the majority (70%), followed by Serbs (20%) and
other ethnic groups (10%). Figure A-6 and A-7 show the spatial variation in the proportion of
displaced individuals across municipalities for each household survey. While, Figure A-8 shows
the spatial ethnic distribution in 1991 across municipalities. The north-western, north-eastern
and central regions have the highest proportions of displacement, which also coincides with the
more ethnically heterogeneous municipalities.
Figure A-9 shows labor market status by gender and age group for the 1999 DSHS and 2000
LSMS, respectively. The labor market variables are measured slightly different in each database.
For instance, in the 1999 DSHS activity status is measured through categories: employed, self-
employed, contributing family worker, unemployed (seeking work) and inactive (housewife, re-
tired and other). Duration in each activity status is not specified in this survey. While, in the
2000 LSMS, employed is defined as having done any work (i.e. off-farm. on-farm, self-employed)
during the last week. Unemployment is defined as having looked for a job during the last week.
The inactive are individuals neither in work, unemployed, nor attending school. The 2000 LSMS
also reports usual weekly hours, which is used to measure hours of work.
In 1999, 88% of men aged 20-65 are economically active, but half (42%) are unemployed.
In 2000, the proportion of economically active men lowers to 75%, of which 64% are employed
and only 11% are unemployed. Only 32% of women in the same age group are economically
active in 1999 and 36% in 2000, but their unemployment rate is a lower than the rate for men.
Unemployment rates are very high among young adults aged 20-25, but these rates decrease
10
with age. After age 40, unemployment rates are less than 40% for men and women alike. The
inactive population is considerable at all ages for women (around 65%) and is composed mostly
by housewives, while for men is much lower but increases substantially after the age of 50.
Women work 34 hours per week, while men work 44 hours per week on average.
Some descriptive statistics on children’s enrolment rates by gender are shown in Figure A-10.
Enrolment is measured as a dummy variable indicating whether a child is registered in primary,
secondary or university during the 1999-2000 and 2000-2001 academic year, respectively. Both
graphs indicate that around 78% of children aged 6-19 years old are enrolled in school. Primary
or compulsory school age boys and girls (aged 6-14) are virtually all enrolled in school (more
than 90%), with equality between genders. However, girl’s seem to drop-out in the last years of
primary school. Enrolment rates for secondary school children aged 15-19 drop to approximately
58% and the gender gap within this group is quite dramatic, with only 50-55% for girls versus 60-
65% for boys. Approximately 20% of young people aged 19-25 are enrolled in higher education,
with near-equality between genders. In this analysis, I focus only on primary and secondary
enrolment.
4 Empirical Strategy
In order to measure the effect of conflict-displacement on labor market and education outcomes,
the basic regression model can be represented by the following equation:
Yim = β1Di + βX′im + εim (1)
where Yim represents the outcome of interest (e.g. work off-farm, work on-farm, self-
employed, child enrolled in school etc) for individual i residing in municipality m after the
war. Di is a dummy variable that indicates whether a person i was displaced due to the Kosovo
war, X′im is a vector of individual controls and εim is the unobserved individual heterogeneity.
Even though displacement is to a great extent a forced action, it is partly a result of a
decision, and therefore it is an endogenous variable. This endogeneity issue can be clearly
observed through the patterns of conflict displacement at the municipality level. Firstly, even
in the most war-affected municipalities, the western part of Kosovo (see Figures 2 and 3), we
do not observe the displacement of the entire population. For instance, only half of Djakovica
municipality’s population (50-56%) was displaced, even though this municipality is one that
suffered the most from the war, either through casualties or bombing attacks. Secondly, in
both surveys there are individuals who declared being displaced even if they resided in less
war-affected municipalities, such as those in the north of Kosovo.
This patterns of conflict displacement suggest that it is possible for individuals to “self-
select” into or out of displacement. As a result, those who leave could be different from those
who stay in terms of unobservable characteristics that may also make them more (or less)
11
successful in terms of post-war outcomes. In other words, there might be unobserved omitted
variables, such as individual heterogeneity in preferences, ability etc, that might affect both
displacement and outcomes. Also, pre-war socio-economic conditions might play an important
role at the moment of displacement, resulting in reserve causality. Kondylis (2010), Czaika
and Kis-Katos (2009) and Ibanez and Velez (2008) show that pre-war economic conditions are
important determinants of the displacement decision, even when facing conflict and war violence.
For example, if well-endowed households who are better able to cope with war have lower
propensity of displacement, then the proportion of well-endowed individuals will be greater in
high conflict intensity municipalities. Conversely, the opposite could also be true if well-endowed
individuals have better outside opportunities (in employment or schooling) and are thus more
likely to move. Failing to account for such endogeneity issues means that estimating the impact
of displacement on outcomes by a simple OLS estimation might give biased and inconsistent
estimates of β1. The following sub-section describes the identification strategy used in this study
to disentangle the effect of displacement from the effect of conflict or war.
4.1 Identification: Instrumental Variables Approach
One way to address the potential endogeneity in the displacement decision is to use a re-
cent methodological innovation based on interaction-based instrumental variables (Esarey, 2015;
Nunn and Qian, 2014). This empirical strategy exploits the interaction of the spatial variation in
conflict intensity and distance to the Albanian border as a source of exogenous variation in the
conflict displacement decision. In order to identify the local average treatment effect (LATE),
the instrument must satisfy two basic conditions: (1) to be correlated to displacement; (2) to
satisfy the exclusion restriction, which means that it must not be correlated to factors directly
affecting labor market and education outcomes.
The first obvious candidate to serve as an instrument is the severity of the conflict in the
location of origin. Empirically, conflict intensity is measured through war casualties and bomb-
ings at the municipality level.14 In order to motivate the relevance condition, Figure A-11 shows
the estimated total refugee migration and casualties over time, while Figure A-12 shows the
estimated total refugee migration and bombing reports over time (March-June 1999). Figure
A-11 suggests that the observed pattern of casualties closely resembles the pattern of refugee
flow during the whole period of the conflict, while Figure A-12 indicates that NATO’s activity
coincides with the refugee flow only for the first part of the conflict (till the end of April). Bomb-
ing intensity increases substantially after the largest number of casualties and highest levels of
refugee flow. Given that bombing intensity is consistent with the patterns of refugee flow only
for the first period of the conflict, I will exploit this fact in order to disentangle the effect of
14Kondylis (2010) also uses conflict incidence as an instrument for conflict displacement in the context of thepost-war in Bosnia and Herzegovina. She uses the municipality level population losses data (which reports theICTY casualties estimates) and the 1991 census in order to compute the proportion of the pre-war populationthat went missing in each municipality during the conflict.
12
displacement from the effect of conflict by using the bombing intensity measure only for this
first period.15
The second candidate to serve as an instrument is distance to the Albanian border, since
forced displacement was more intense further away from Albania and especially in municipal-
ities with ethnic heterogeneity.16 Distance to the Albanian border is measured as the driving
distance (in kilometers) from the village of residence to the south-west Kosovo-Albanian border
of Morina. In general, distance has been assumed in the literature to discourage migration by
raising transaction costs. However, in this context distance is used to capture mainly ethnic
diversity. Basically, areas with higher ethnic heterogeneity were also more likely to suffer forced
displacement. Indeed, according to a report from OSCE (1999) most of forced expulsions in
1999 were carried out by the Serb forces in large towns across the north-eastern region of the
province, more precisely from Kosovska Mitrovica to Pec and from Pec to Pristina, which also
corresponds with the most ethnically heterogeneous municipalities in terms of Albanian and Serb
populations. In addition, even though there were several borders from where refugees could have
left the province, in most of the cases the Serb forces closed the northern borders and diverted
the convoys mainly south-west in order for the refugees to have no other choice but to go to
Albania.17
A remaining econometric concern with these instruments is that using them separately might
violate the exclusion restriction, in the sense that each instrumental variable might have an inde-
pendent impact on post-war outcomes beyond any effects working through conflict displacement.
For instance, pre-war local economic performance might predict local conflict incidence. Simi-
larly, proximity (remoteness) to the Albanian border is likely to be associated to lower (higher)
incomes during the pre-war period. However, given that changes in the level of violence had a
larger effect on forced displacement for individuals residing in areas with higher ethnic hetero-
geneity and located further away from Albania, I argue that this concern can be addressed if
the level of violence is interacted with distance to the Albanian border.
Basically, the idea behind this identification strategy is that the relationship between the
severity of the conflict and the decision to be displaced is conditional on the distance to the
Albanian border, but the relationship between the severity of the conflict and the outcomes of
15Ball et al. (2002) also studies the statistical patterns of refugee flow and killings in Kosovo during the periodMarch-June 1999 using only data from the Albanian border guard registries of people entering Albania throughthe village of Morina. The authors find that the killings and the exodus of refugees occurred in the same places atroughly the same times, implying that the common cause of both phenomena was a systematic military campaignby Serbian forces aiming to expel Kosovar Albanians from their homes. This study was used as evidence at theInternational Criminal Tribunal for the Former Yugoslavia (ICTY) in the case against Slobodan Milosevic.
16See Figures A-6, A-7 and A-8.17This type of displacement was particularly true for those refugees from the north of the province. For instance,
many refugees from Kosovska Mitrovica and the surrounding area were not sent north to Leposavic, west towardsRozaje (Montenegro) or southwards down the main route to the Former Yugoslav Republic of Macedonia. Insteadthey were compelled to take very roundabout routes south-west along minor roads, eventually reaching Prizrenand then Albania (OSCE, 1999).
13
interest does not depend on the distance to the Albanian border. In other words, being located
further away from the Albanian border strengthens the relationship between the severity of
the conflict and displacement because those Albanian Kosovars that were living closer to the
Serbian border were more likely to be expelled and displaced from their homes compared to those
that were living closer to the Albanian border. Thus, even if there was endogeneity between
conflict intensity and the outcome of interest, the exclusion restriction would only be violated
if the unobserved variables driving this endogeneity were also correlated with distance to the
Albanian border (for more econometric details see Nizalova and Murtazashvili (2016); Esarey
(2015)).
At the same time, there is little reason to believe that the impact of conflict intensity on
the outcomes of interest is conditional on the distance to the Albanian border. Therefore,
the interaction term (conflict intensity * distance to Albanian border) is a reasonable candidate
instrument since it is likely to accurately predict displacement and at the same time is likely to be
orthogonal to unobserved factors that might affect schooling and labor market outcomes. Casual
inference using the interaction-based instrument relies on the assumption that, conditional on
the controls, the interaction between conflict intensity and distance to the Albanian border only
affects labor market and education outcomes through forced displacement. Since the validity of
the instrument is central to this identification strategy, in the following sub-sections I provide
some historical evidence and I also perform some robustness checks in order to assess its validity.
4.1.1 First-Stage Estimation
In order to account for the potential endogeneity in the displacement status, I use the interaction
of conflict intensity and distance to the Albanian border as instrument for conflict displacement
as follows:
Yim = β1Di + βX′im + νim (2)
Di = α1(WCRmo ∗DAvo) + α2WCRmo + α3DAvo + αX′im + εim (3)
Di = δ1(Bmo ∗DAvo)io + δ2Bmo + δ3DAvo + δX′im + εim (4)
Equation 2 is the second stage of the 2SLS system and equations 3 and 4 are first stage specifi-
cations using the two different measures of conflict intensity. In each first-stage model, I regress
the dummy for displacement status Di of individual i on the interaction term between conflict
intensity - measured as war casualty rate or bombings- and distance to the Albanian border.
WCRmo denotes the number of casualties per 1,000 inhabitants at the municipality of origin mo
and Bmo denotes the number of days the municipality of origin mo of individual i was attacked
by NATO airstrikes. DAvo denotes distance from village of residence of individual i to the
south-west Albanian border of Morina.
For the education outcomes analysis, controls include: age, ethnicity dummy (Albanian),
14
dummies for parental educational attainment (medium and high), number of male and female
adults in a household aged 20 to 65, number of siblings, distance to school, and dummy for rural
location. Similarly, for the labor market outcomes, controls include: age, dummies for marital
status, ethnicity (Albanian), dummies for educational attainment (medium and high), number
of male and female adults in a household aged 20 to 65, number of dependent members by age
group, and dummy for rural location. I also control for pre-war socio-economic conditions by
including labor-force participation and proportion of Albanians in 1991 at the municipality level.
Tables 3 and 4 present the regression coefficients of the first-stage estimation for the children’s
sample and adult’s sample, respectively. The results are shown separately for each database and
the reported standard errors are clustered at the village level and municipality level. A more
conservative inference requires to cluster the standard errors at the municipality level. However,
in this analysis this may not be sufficient since I rely on less than 30 clusters (municipalities
in Kosovo). In case of few clusters, clustered-robust standard errors may be under-estimated.
Hence, I correct the inference with wild bootstrap methods as suggested by Cameron, Gelbach
and Miller (2008) and Cameron and Miller (2015). This procedure allows to account for the
correlation in the error terms of individuals born in the same municipality with few clusters. In
the Appendix, I provide the P-values resulting from wild bootstrap for the second-stage results.18
Using the 1999 Kosovo DSHS database, it seems that the instrument (WCRmo ∗DAvo) is a
good predictor for displacement status, while (Bmo ∗DAvo) does not seem to be a valid instru-
ment. While, for the 2000 Kosovo LSMS database, both instruments seem to be good predictors
for displacement.19 Even though these instruments are based on only 27/29 municipalities or
pre-war residence, they are highly significant for both females and males. The F-statistics of the
excluded instruments are always above 10 when the standard errors are clustered at the village
level for both children and adults samples, but they decrease slightly when the standard errors
are clustered at the municipality level.
In general, these results indicate that near the Albanian border, an increase in conflict
intensity (as measured by casualties or bombing) decreases the likelihood of being displaced;
while far from the Albanian border, an increase in conflict intensity increases the likelihood
of being displaced. This finding is in line with the historical fact that when the war started
Kosovar Albanians living further way from Albania were more likely to be expelled from their
homes because towns located in the north-eastern part of the province were more likely to be
targeted by the Serb forces due to their ethnic heterogeneity. Overall, these results show that
conflict intensity interacted with distance to the Albanian border is a good predictor of forced
displacement in the context of the 1999 Kosovo war.
The instrumental variables approach estimates the impact of displacement for those indi-
18Wild bootstrap P-values are obtained with the post-estimation command boottest by Roodman (2017), usingRedmacher weights, assuming the null hypothesis and setting replications to 1,000.
19This difference in first-stage results is plausibly due to the different samplings in both databases. For instance,the municipalities of Zvecan and Malisevo are not included in the 1999 Kosovo DSHS database.
15
viduals that were induced by the conflict and the residential characteristics, such as ethnic
heterogeneity, to be forcibly displaced from their homes i.e. local average treatment effect. In
other words, in this setting compliers are those individuals that were more likely to be forcibly
displaced because their municipalities of residence suffered more from war casualties/bombings
and also because these municipalities were more ethnically heterogeneous in terms of Albanian
and Serb populations (i.e. located further away from the Albanian border). While it is not
possible to observe whether individuals in a given municipality decided to move in response to
an increase in conflict intensity and distance to the Albanian border, Tables A-1 and A-2 shed
light on which municipalities were influenced by the interaction-based instrument by examining
the size of the first-stage for different sub-populations.20
Column 1 reports the baseline first-stage relationship from the pooled sample of women and
men for comparison purposes. Columns 2 and 3 divide the sample by whether the municipality
had a higher labor force participation in 1991 than the median municipality. The correlation
between the interaction-based instrument (conflict intensity * distance to the Albanian border)
and conflict displacement is statistically significant in both samples but it is slightly larger in
municipalities with more labor supply. Next, columns 4 and 5 divide the sample by whether
the municipality had a higher percentage of its population working in agriculture in 1991 than
the median municipality. In this case, the interaction-based instrument has more power in mu-
nicipalities with a higher proportion of the population working in agriculture. Lastly, columns
6 and 7 divide the sample by whether the municipality had a higher percentage of the popula-
tion speaking Albanian in 1991 than in the median municipality. The correlation between the
instrument and conflict displacement is statistically significant in both samples, but it is larger
in municipalities with less Albanian speakers in 1991.
Overall, these results document that the interaction-based instrument -conflict intensity and
distance to the Albanian border- has more power in municipalities with less Albanian population
in 1991 but with more labor-force participation in 1991, especially in the agricultural sector.
These characteristics coincide with the north-eastern region of the province which, before the
war, was characterized for being more prosperous economically and also for having a population
with more ethnic diversity.
4.1.2 Isolating Plausibly Exogenous Variation
In order to argue the exogeneity of the instrument, the exclusion restriction requires that the
instrument has no correlation with other factors directly affecting labor market and education
outcomes other than through its impact on displacement. In other words, the instrument needs
to resemble as close as possible a random assignment across municipalities. The main concern
that might threaten the exogeneity assumption is that pre-war local economic conditions might
20This technique has been already used in Dell (2012) in order to better understand the characteristics of thecompliers.
16
predict local conflict intensity and distance to the Albanian border. For instance, locations closer
to the Albanian border were more likely to have a higher proportion of Albanians before the war
(see Figure A-8). This is of interest since ethnicity might have determined individual economic
status through ethnic discrimination. While the exclusion restriction relies on the instrument
being uncorrelated with unobserved determinants of the outcomes and hence is untestable, I
shed light on its plausibility by providing some historical and empirical evidence.
Historical evidence on the 1998-1999 Kosovo war suggests that targeting of individuals (ca-
sualties) was not determined by the economic performance at the local level, as the primary
aim of Serb attacks was an ethnically homogeneous and contiguous Serb territory (Ball et al.,
2002; OSCE, 1999). Iacopino et al. (2001) study the patterns of forced displacement and human
rights abuses using a household survey of 1180 ethnic Albanians living in 31 refugee camps in
Macedonia and Albania during the war. They find that the majority (68%) of participants
reported that their families were directly expelled from their homes by Serb Forces. In addition,
a report from the Organization for Security and Co-operation in Europe on patterns of human
rights and humanitarian law violations in Kosovo confirms this idea (OSCE, 1999):
“After the start of the NATO bombing on the FRY on 24 March, Serbian police and/or VJ (Yugoslav
Army), often accompanied by paramilitaries, went from village to village and, in the towns, from
area to area threatening and expelling the Kosovo Albanian population. Others who were not directly
forcibly expelled fled as a result of the climate of terror created by the systematic beatings, harassment,
arrests, killings, shelling and looting carried out across the province. Kosovo Albanians were clearly
targeted for expulsion because of their ethnicity. [...] Large numbers of civilians were also deliberately
targeted and killed because of their ethnicity. No-one, it seems, was immune, as people of all ages,
including women and children, were killed in large numbers.”
Similarly, the bombing attacks were not based on local economic disparities between regions,
as NATO’s objective was to attack strongly Serbian targets of military nature (i.e. Serbian air
defence sites, communication relays, military facilities and police force headquarters, ammunition
dumps and supply routes, such as roads, bridges etc) in order to limit the ethnic cleansing
(Grant, 1999; ICTY, 2000). Also, in the final report by the International Criminal Tribunal for
former Yugoslavia (ICTY) on NATO’s bombing campaign, it is stated that in several occasions
the bombing airstrikes resulted in collateral damage, where locations were mistakenly hit due
to failures in target precision. This claim gives certain randomness to the bombing intensity
measure.
4.1.3 Robustness Checks
One way to check whether the proposed instrument is as good as random across municipali-
ties/villages is to examine whether individuals differ in pre-war economic performance by the
severity of the conflict and the distance to the Albanian border. The idea is that if there is no
correlation between the instrument and pre-war baseline characteristics, then there should be
17
no systematic differences in pre-war demographic and economic characteristics across the mu-
nicipalities/villages in Kosovo. In other words, in the absence of differences in conflict intensity
and distance to the Albanian border, municipalities that suffered more from the war and were
located further away from the Albanian border would not have been different on average from
the rest of the municipalities in Kosovo.
In order to assess the validity of the IV estimates, I undertake three falsification tests on
the first-stage to check if the instrument (conflict intensity * distance to the Albanian border)
captures the effect of economic differences across municipalities on conflict displacement. First,
I test whether the instrument can predict pre-war migration patterns, which were most likely
driven by economic motives. Second, I examine whether the interaction of conflict intensity
and distance to the Albanian border is correlated to labor-force participation in 1991 and also
to different measures of local economic activity in 1991. Lastly, I also test whether pre-war
ethnicity explains any variation in conflict intensity and distance to the Albanian border.
As a first check, I use the municipality of birth and pre-war municipality for all individuals in
order to test whether the interaction term can predict pre-1999 migration patterns. Due to lack
of pre-war migration data, I consider that all individuals who lived in a different municipality at
birth and just before the war are pre-war migrants.21 In this analysis, the municipality of origin
is the municipality of birth and the municipality of destination is the pre-war municipality. The
control group is formed, in this case, by those individuals that had never migrated before the
war, regardless of their displacement status.
The results of this falsification test are reported in Table 5 and the specifications are identical
to those reported in Table 4. The effect of the instrument (conflict intensity * distance to the
Albanian border) on pre-war migration is close to zero and highly insignificant in all regressions
and in both databases. Overall, these results suggest that conflict intensity in the municipality of
birth interacted with distance to the Albanian border does not predict pre-war migrations, which
were more likely to be driven by economic reasons. This falsification exercise sheds more light
on the idea that conflict intensity was not motivated by the local pre-war economic performance
of the municipalities.
As a second check, I use labor force participation (LFP) in 1991 and different measures
of the local economic activity 1991 as proxies for pre-war economic performance. Labor force
participation in 1991 is constructed by exploiting the Labor Module of the 2000 Kosovo LSMS,
which asks individuals whether they were working in 1991 and in which type of activity they
were involved (e.g. professional, administrative, clerical, services and agricultural). For this
measure, I use only individuals whose residence at birth is the same as their residence previous
to the war (i.e. those that have never migrated from their municipality- 85% of the individuals
in the 2000 Kosovo LSMS) in order to avoid any measurement error due to migration.
21Pre-war migrants represent 28.4% of the whole sample of adults aged 20-65 in the 1999 Kosovo DSHS, and17.1% of the entire sample of adults in the 2000 Kosovo LSMS.
18
To shed light on the plausibility of the identification assumption, Tables 6 and 7 regress
a variety of baseline characteristics for economic performance in 1991 on the interaction of
conflict intensity and distance to the Albanian border for females and males, respectively. The
sample sizes are slightly smaller compared the main specification since this variable is measured
only for individuals older than 20 years old in 1991. The dependent variable in column 1 is
a dummy indicating whether the individual was working in 1991. The dependent variables in
columns 2 to 6 are also dummies indicating whether the individual had a professional occupation,
an administrative occupation, a clerical occupation, a service occupation or an agricultural
occupation.
On the one hand, the correlation between labor-force participation in 1991 and the interaction
of war casualty rate with distance to the Albanian border is negative and statistically significant
for both women and men, indicating that before the war economic prosperity was lower in
municipalities that were located further away from Albania and that suffered more from war
casualties. This result seems to be driven mostly by agricultural occupations, which accounted
for 60% of employment in 1991. Similarly, female labor-force participation before the war is
also lower in municipalities that received more bombings and were also located further away
from Albania. On the other hand, the correlation between male labor-force participation in
1991 and the interaction of bombings with distance to the Albanian border is also negative but
statistically insignificant. Overall, these results seem to suggest that the war in Kosovo was
more intense in the less prosperous regions of the province.
As a third check, I test whether pre-war ethnicity is correlated to the interaction of conflict
intensity and distance to the Albanian border. Tables 8 and 9 regress a dummy for being
Albanian, Serbian or other ethnic group in 1991 on the interaction of conflict intensity and
distance to the Albanian border for females and males, respectively. The results from these
tables indicate that municipalities with higher conflict intensity and located further away from
Albania were more likely to have a higher proportion of Albanians before the war. In other
words, municipalities with a higher proportion of Serbs before the war were less likely to suffer
from war casualties and bombings. These findings corroborate the historical evidence mentioned
earlier in this Section.
Even though historical references suggest that in Kosovo there was no targeting of individuals
and regions based on the local economic differences, as a result of these tests, I will report IV
estimates after controlling for labor-force participation in 1991 and proportion of Albanians
in 1991 at the municipality level. Even though, I control for these additional variables it is
important to acknowledge that the exclusion restriction might still be violated on a number of
19
other dimensions.22
5 Results
The results presented in this section are divided between the initial impacts of conflict displace-
ment in 1999 when individuals had just returned to their homes (i.e. short-run impacts) and
the post-displacement impacts in 2000 after individuals had already returned home for approx-
imately one year (i.e. medium-run impacts). All the results are estimated separately for female
and male due to substantial gender differences in education and the labor market in Kosovo.
The instrumental variables approach will estimate the impact of displacement on various out-
comes for those individuals that were induced by the conflict and their residence to be forcibly
displaced from their homes. The first sub-section presents the impact of displacement on labor
market outcomes for women and men aged 20 to 65 years old. While, the second sub-section
presents the impact of displacement on schooling enrolment rates for boys and girls aged 6 to
19 years old.
5.1 Conflict Displacement and Labor Market Outcomes
Labor market outcomes are measured as dummy variables indicating whether an adult aged 20
to 65 years old is employed, unemployed or inactive. For cases when the individual declared
being employed, I also measure employment with dummy variables indicating: work-off-farm,
work-on-farm, work for somebody else, work for family and self-employed. Only for the 2000
Kosovo LSMS, weekly hours are used as an additional labor market outcome.
Table 10 and Table 11 present the OLS and IV results of the effect of displacement on female’s
and male’s labor market outcomes, respectively. The OLS estimates in Table 10 indicate that the
effect of displacement on employment for Kosovar women is negative and statistically significant
in 1999, implying a fall in the probability to work by 1.8 percentage points relative to stayers.
This result seems to be driven by those women who are employed by a non-family member.
The effect of displacement on female employment is still negative in 2000 but not statistically
significant. Displacement does not seem to have an effect on female unemployment nor inactivity.
The OLS estimates in Table 11 indicate that displacement increases Kosovar men’s inactivity
by 2.4 percentage points in 1999. Additionally, displacement is associated with a negative effect
on employment and a positive effect on unemployment in both years, but these effects are not
statistically significant. Although these OLS estimates seem to imply adverse consequences on
22Unfortunately, I cannot perform similar tests for the school enrollment outcomes due to data availability.Basically, it is practically impossible to have pre-war data on education for children who were in primary or evenin secondary school just after the 1998/99 Kosovo war. In spite of this, I do not find any reason hard to believethat educational outcomes, such as enrollment rates or schooling performance, might have had any implicationon conflict intensity in Kosovo.
20
labor market outcomes for women and men, they should be taken with caution because they
could well be biased.
Therefore, I turn next on second-stage estimates that rely on the interaction between conflict
intensity and distance to the Albanian border as exogenous variation in displacement status.
After correcting for the potential selection bias, I find that displacement increases the likelihood
of a Kosovar woman to be inactive in 1999 by 24 percentage points. However, I also find that
in medium-term Kosovar women are on average 7.5 percentage points more likely to be working
off-farm compared to stayers (Table 10). In addition, the IV estimates for women do not indicate
an effect on female unemployment and hours worked just after the conflict and neither one year
later.
The IV estimates on the effect of displacement on Kosovar men’s labor market outcomes
(Table 11), which use as instrument (WCR ∗ DA) seem to be the most robust across years.
Displacement is associated to a large fall in Kosovar Albanian men’s ability to be self-employed
just after the war. More specifically, displaced Kosovar men are 17 percentage points less likely
to work on their own account compared to those that did not move due to the war. There is
also suggestive evidence of a negative impact on general employment just after the conflict and
also one year later. The magnitude of the effect on employment in both years indicates that
the negative effect is decreasing overtime. This negative effect of displacement is quite large
and seems to be driven mostly by men who work in the agricultural sector. All these results
are robust to using wild bootstrap standard errors.23 In particular, displacement decreases the
likelihood of Kosovar men to be working on-farm by 14 percentage points in 2000.24 Using
(WCR ∗DA) as instrument, I find no effect on unemployment and inactivity.
However, the IV estimates that use (B ∗DA) as instrument suggest that Kosovar displaced
men are also more likely to work off-farm one year after the conflict. In particular, the effect
of displacement on men’s work-off-farm is large and positive, associated to an increase of 23
percentage points. When analyzing this result by type of occupation, I find that the positive
effect is mostly driven by Kosovar men working in the construction and public administration
sectors.25 The IV estimates for Kosovar men in 2000 also imply a statistically significant increase
in inactivity by 22 percentage points, with no effect on unemployment and hours worked.
23Tables A-3, A-4 and A-5 in the Appendix are a copy of Tables 12, 10 and 11, respectively, but report Quasi-Ftest statistics and the P-values computed using the wild bootstrap standard errors proposed by Cameron, Gelbachand Miller (2008) and Cameron and Miller (2015). In general, the statistical inference is not affected by the fewclusters issue.
24See Table A-6 in Appendix for an estimation of the effect of displacement on employment by type of occu-pation. The IV estimates by type of occupation indicate that the negative effect on employment is driven mostlyby Kosovar men employed in the agricultural sector.
25See Table A-7 in Appendix for an estimation of the effect of displacement on work-off-farm by type ofoccupation.
21
5.2 Conflict Displacement and School Enrollment Outcomes
Armed conflict is generally expected to adversely affect school enrollment and educational at-
tainment. Basically, the ability of children to attend school may be negatively affected by direct
youth enrollment in the military, limited mobility or school destruction among other reasons.
In particular, recent research suggests that exposure to civil conflict has adverse effects on the
enrollment and completion of schooling (e.g. Swee, 2015; Chamarbagwala and Moran, 2011;
Shemyakina, 2011; Leon, 2012; Akresh and De Walque, 2008; Akbulut-Yuksel, 2014; Merrouche,
2011; Valente, 2013). Moreover, the schooling of girls is often affected more to worsening eco-
nomic conditions than that of boys. However, the expected result that school enrollment is
disrupted in conflict areas may not be well founded in the particular case of Kosovo especially
due to the presence of post-war aid through refugee camps.
In this section, I analyze the impact of conflict displacement on post-war school enrollment
outcomes.26 Table 12 presents the OLS and IV estimates of the impact of displacement on
enrolment rates. Enrolment is measured as a dummy variable that takes the value of one if the
child is enrolled in school and zero otherwise. The OLS estimates suggest that there is no effect
of conflict displacement on children’s enrolment neither in 1999 nor in 2000.
After correcting for the potential selection bias in the displacement decision, the IV estimates
indicate that the effect of displacement on female enrolment in 1999 is positive, quite large and
statistically significant. More specifically, displacement increases enrolment of Kosovar girls in
1999 by 18 percentage points, on average. This positive effect is mostly driven by young girls
enrolled in primary school (although this effect is lower in magnitude -12.9 percentage points-),
as the effect of displacement on secondary school girls is not statistically significant. However,
the positive effect on female enrolment seems to disappear one year later, as none of the IV
estimates is statistically significant in 2000, both for primary and secondary school girls. Also,
I find no effect of displacement on enrolment for Kosovar boys, in general.
Overall, after controlling for endogeneity, young Kosovar girl’s enrollment rates respond
stronger to forced displacement and high-conflict activity than boys during the post-war period.
In Section 6, I examine some plausible channels through which household’s schooling decisions
may have been influenced as a consequence of the forced displacement.
26Two alternative identification strategies are used in this paper to increase confidence in the reliability ofthe education estimates: the first relies on the interaction-based intrument (conflict intensity x distance to theAlbanian border) as an exogenous source of variation in the displacement decision, and the second relies on adifference-in-difference estimation which uses variation in conflict displacement exposure across birth cohorts andgeographic areas (municipalities). The difference-in-difference estimation can be found in the Section A of theAppendix.
22
6 Mechanisms
6.1 Channels on Labor Outcomes
First, focusing on labor market outcomes, the regression analysis implies that displacement is
associated to a significant and large decrease in men’s employment in the agricultural sector
and men’s self-employment (which is in general also related to work in the farm). Women are
also more likely to drop out of the labor-force. However, the results also indicate that, one year
after the end of the war, displaced Kosovar men are also more likely to be working off-farm (i.e.
construction and public administration sectors). There are two plausible channels behind these
results: first, loss of assets, land and livestock in an agrarian skill-based economy and second,
loss of social networks in an informal labor market.
In the immediate aftermath of the conflict, the population of Kosovo faced a complex situ-
ation where their livelihoods were radically altered: infrastructure and housing were damaged
or destroyed; crops had failed and large amounts of agricultural land were left under-utilised
or abandoned (Douarin, Litchfield and Sabates-Wheeler, 2012). Westley and Mikhalev (2002)
describe how the war and conflict displacement created constraints across the economy where
many households were unable to cultivate land on a commercial basis due to loss of equipment
and livestock, damage to irrigation systems as well as limited access to their land due to security
reasons, including the presence of landmines and cluster bombs. Therefore, displacement might
have made very difficult post-war employment in the agriculture sector for those individuals that
had to abandon their lands and livestock.27 However, despite the lack of work opportunities in
the agriculture sector, displaced Albanian Kosovar men might have turned to wage labour as a
post-displacement measure, especially in the construction and public administration sectors as
the demand for labor in these two sectors increased significantly after the war. Indeed, Douarin,
Litchfield and Sabates-Wheeler (2012) find that one of the most successful post-war livelihood
strategies of Kosovar Albanians was associated with access to non-farm income sources such as
non-farm businesses and remittances.
In order to test this plausible channel, Panel A of Table 13 presents the effect of household
displacement on assets, measured as land ownership, land size, livestock and number of livestock.
First, in line with previous studies I find suggestive evidence that returnees have fewer assets
after the end of the war than those who stayed during the conflict, especially in terms of both
land and livestock ownership. Moreover, using the 2000 Kosovo LSMS database, I find that
in the medium-term conflict displacement has a negative and statistically significant effect on
the number of livestock, which reinforces the first proposed mechanism behind the labor market
outcomes.
Moreover, another plausible mechanism behind these results might be the loss of informal
27Bozzoli, Brueck and Muhumuza (2016) and Deininger (2003) have also found that the probability to startnon-farm activities in substancially reduced for households affected by war using data from the 20-year civilconflict in Northern Uganda.
23
networks, such as separation from family members, relatives, friends and communities (Kondylis,
2010). Several studies in the literature on migration suggests that networks are a key entry point
to informal labor markets in an informal economy. For instance, Edin, Fredriksson and Aslund
(2003) finds that living in an enclave enhances the access to informal ethnic networks and im-
proves immigrants access to employment by increasing the performance of refugee immigrants
job-search. In addition, this channel may be linked to the literature that studies the role of
social networks as adverse coping mechanisms in the management of violent shocks. Most of the
conflicts take place in poor countries, where -in the absence of formal insurance mechanisms-
social networks provide support such as informal loans and transfers to mitigate various neg-
ative shocks (Foster and Rosenzweig, 2001; Fafchamps and Lund, 2003). Therefore, conflict
displacement might have decreased access to informal networks for Kosovar Albanians since not
everybody might have returned to the same pre-war residence. Also, taking into account the
informal nature of the agriculture sector in Kosovo, the poorer access to informal networks might
have further decreased the likelihood of displaced Kosovar men to find employment relative to
stayers.
In order to test this channel, I exploit the Networks Module of the 2000 Kosovo LSMS to de-
fine access to informal networks. This section contains information on who would the individuals
turn to in case of economic loss (i.e bad harvest, loss of employment), with the following cate-
gories: humanitarian group, relatives, neighbours, friends, community leaders, religious leaders,
others etc. Using Pistaferri (1999), I define informal networks when the individual seeks employ-
ment through relatives, neighbours or friends. Panel B in Table 13 shows the IV estimates of the
effect of household displacement on informal social networks. I find that displaced households
are less likely to have access to informal networks compared to stayers. This channel might be
closely linked with the increase in women’s inactivity.
6.2 Channels on Education Outcomes
Second, focusing on education outcomes, the results found in this paper indicate that displace-
ment in Kosovo had positive short-run effects on female’s school enrolment, especially for those
in primary level. One possible channel through which this effect might be operating is the refugee
camp experience. It is interesting to note that the likelihood of children accessing education as
refugees could either increase or decrease depending on the context. For instance, in conflict-
affected countries, where virtually many children are out of school, refugee children, especially
if they reside in refugee camps, are much more likely to increase their access to education com-
pared to those who still stay in the the conflict-affected areas. However, for children leaving
countries with fairly good access to schooling, it is likely that their ability to access education
will decrease as a refugee (Ferris and Winthrop, 2010).
Between 1991 and the late 1990s the Albanian Kosovar population received education services
in an informal system parallel to the official one. As schools and faculties in Albanian language
24
where closed, most Kosovar Albanian students received classes outside school facilities and often
in private homes. During this period, the availability of educational inputs declined significantly,
and teachers were unable to update their teaching skills and methodologies (Alva, Murrugarra
and Paci, 2002; Cutts, 2000). Given this precarious pre-war situation, being displaced in a
refugee centre might have increased access to education for Kosovar Albanian girls. Young
female refugees, especially those who were in camps, might have had better access to basic
education and better conditions than the IDPs and the stayer girls. The 1999 UNHCR Global
Report seems to confirm this idea:
“The Ministry of Education in Albania and Macedonia organised summer schools for refugee children
to make up for the schooling lost in the winter and spring 1998/99. UNHCR and UNICEF assisted
by contributing to the cost of printing school books for 150,000 refugee children of primary school
age. Many also received new furniture and supplies”
In order to test this, Table 14 presents the effect of displacement in a refugee camp on
enrollment outcomes in 1999 for Kosovar females using the instrumental variables technique.
The IV estimates indicate that displaced Kosovar girls residing in a refugee camp are more likely
to be enrolled in school after returning in Kosovo compared to those that stayed in Kosovo and
also to those that were internally displaced or residing in host families. This effect is driven
mostly by girls enrolled in primary level, as the effect of being displaced in a refugee camp
for girls enrolled in secondary school is not statistically significant. These results suggest that
since primary schooling is considered to have higher priority in refugee centres compared to
secondary schooling, the refugee camp’s conditions might have been more beneficial for younger
girls compared to older ones (teenagers).
7 Conclusion
This paper contributes to the literature on the impacts of conflict displacement in developing
countries. More specifically, this study analyzes the impact of forced displacement on children’s
schooling and adult’s labor market outcomes in the context of the post-war Kosovo. During the
Kosovo war and especially during the NATO air campaign, more than a million of individuals
of all ethnicities were displaced, which represented around 70% of Kosovo’s pre-war population.
Using a combination of household survey data and municipality level data on conflict in-
tensity, I exploit the interaction between spatial variation in conflict intensity and distance to
the Albanian border as a source of exogenous variation in the displacement decision. As the
targeting of individuals and regions in Kosovo was not based on pre-war economic differences, it
is possible to argue that the severity of the conflict, measured through war casualties and NATO
bombing days per municipality, is not related to unobserved characteristics that may also affect
post-war economic outcomes.
25
The regression analysis implies some positive but also negative impacts of displacement
on labor market and education outcomes. In particular, in terms of education outcomes, the
results found in this paper indicate that displacement in Kosovo had positive short-run effects
on female’s school enrolment, especially for those in primary level. However, there is no evidence
of changes in school enrollment for Kosovar displaced boys. One possible channel behind these
results could be the experience of refugee camps, in the sense that conditions in the refugee
camps might have provided better conditions and access to education to young Kosovar girls
compared to the pre-war access which was characterized by the “parallel” education system.
In addition, in terms of labor market outcomes, the regression analysis implies that displace-
ment is associated to a significant and large decrease in men’s employment in the agricultural
sector and their capacity to work on their own account. I also find that displaced Kosovar women
are more likely to drop out of the labor force. In addition, households that were displaced have
significantly fewer assets, land and livestock ownership in an agrarian skill-based economy and
also experienced loss of social networks in an informal labor market compared to not displaced
households. However, shortly after the return home, the results also indicate that displaced
Kosovar men and women are more likely to be working off-farm, especially in the construction
and public administration sectors, which indicates a relatively quick recovery.
It is clear that by 2000 Kosovar displaced people were unable to completely recover from the
conflict. Even though I find some suggestive evidence of a post-conflict reconstruction effort,
the results found in this paper imply that there is still a role for the international community
and the local government to develop and support these livelihood activities in a post-conflict
context through early interventions.
References
Abdel-Rahim, Asha, Dany Jaimovich, and Aleksi Ylonen. 2015. “Forced displacementand behavioral change: an empirical study of returnee households in the Nuba Mountains.”Defence and Peace economics, 1–31.
Akbulut-Yuksel, Mevlude. 2014. “Children of War The Long-Run Effects of Large-ScalePhysical Destruction and Warfare on Children.” Journal of Human Resources, 49(3): 634–662.
Akresh, Richard, and Damien De Walque. 2008. “Armed conflict and schooling: Evidencefrom the 1994 Rwandan genocide.” World Bank Publications, 3516.
Alva, Soumya, Edmundo Murrugarra, and Pierella Paci. 2002. “The hidden costs ofethnic conflict: decomposing trends in educational outcomes of young Kosovars.” World BankPolicy Research Working Paper, No. 2880.
Arias, Marıa Alejandra, Ana Marıa Ibanez, and Pablo Querubin. 2014. “The desireto return during civil war: Evidence for internally displaced populations in Colombia.” PeaceEconomics, Peace Science and Public Policy, 20(1): 209–233.
26
Ball, Patrick, Wendy Betts, Fritz Scheuren, Jana Dudukovich, and Jana Asher.2002. “Killings and Refugee Flow in Kosovo March-June 1999.” Report to the Intl CriminalTribunal for the former Yugoslavia.
Bauer, Thomas K, Sebastian Braun, and Michael Kvasnicka. 2013. “The EconomicIntegration of Forced Migrants: Evidence for Post-War Germany.” The Economic Journal,123(571): 998–1024.
Bellows, John, and Edward Miguel. 2009. “War and local collective action in Sierra Leone.”Journal of Public Economics, 93(11): 1144–1157.
Blattman, Christopher, and Jeannie Annan. 2010. “The consequences of child soldiering.”The Review of Economics and Statistics, 92(4): 882–898.
Bozzoli, Carlos, Tilman Brueck, and Tony Muhumuza. 2016. “Activity Choices of In-ternally Displaced Persons And Returnees: Quantitative Survey Evidence from Post-WarNorthern Uganda.” Bulletin of Economic Research, 68(4): 329–247.
Brakman, Steven, Harry Garretsen, and Marc Schramm. 2004. “The strategic bombingof German cities during World War II and its impact on city growth.” Journal of EconomicGeography, 4(2): 201–218.
Brunborg, Helge. 2002. “Report on the Size and Ethnic Composition of the Population ofKosovo.” Case of Slodovan Milosevic (IT-02-54), ICTY, La Haye.
Cameron, A Colin, and Douglas L Miller. 2015. “A practitioner’s guide to cluster-robustinference.” Journal of Human Resources, 50(2): 317–372.
Cameron, A Colin, Jonah B Gelbach, and Douglas L Miller. 2008. “Bootstrap-basedimprovements for inference with clustered errors.” The Review of Economics and Statistics,90(3): 414–427.
Chamarbagwala, Rubiana, and Hilcıas E Moran. 2011. “The human capital consequencesof civil war: Evidence from Guatemala.” Journal of Development Economics, 94(1): 41–61.
Chen, Siyan, Norman V Loayza, and Marta Reynal-Querol. 2008. “The aftermath ofcivil war.” The World Bank Economic Review, 22(1): 63–85.
Cortes, Kalena E. 2004. “Are refugees different from economic immigrants? Some empiricalevidence on the heterogeneity of immigrant groups in the United States.” The Review ofEconomics and Statistics, 86(2): 465–480.
Crawford, Nicholas, John Cosgrave, Simone Haysom, and Nadine Walicki. 2015.“Protracted Displacement: Uncertain paths to self-reliance in exile.” London: Overseas De-velopment Institute.
Cutts, Mark. 2000. The state of the world’s refugees, 2000: Fifty years of humanitarian action.Geneva: UNHCR, Oxford University Press.
Czaika, Mathias, and Krisztina Kis-Katos. 2009. “Civil conflict and displacement: village-level determinants of forced migration in Aceh.” Journal of Peace Research, 46(3): 399–418.
27
Davis, Donald, and David Weinstein. 2002. “Bones, bombs and break points: The geogra-phy of economic activity.” The American Economic Review, 95(2): 1269–1289.
Deininger, Klaus. 2003. “Causes and consequences of civil strife: micro-level evidence fromUganda.” Oxford Economic Papers, 55(4): 579–606.
Dell, Melissa. 2012. “Path dependence in development: Evidence from the Mexican Revolu-tion.” Harvard University, mimeograph.
Douarin, Elodie, Julie Litchfield, and Rachel Sabates-Wheeler. 2012. “War legacies,welfare and livelihoods in rural areas: the case of Kosovo.” Journal of Agricultural Economics,63(1): 201–222.
Duflo, Esther. 2001. “Schooling and labor market consequences of school construction inIndonesia: Evidence from an unusual policy experiment.” American Economic Review,91(4): 795–813.
Duflo, Esther. 2003. “Grandmothers and granddaughters: old-age pensions and intrahouseholdallocation in South Africa.” The World Bank Economic Review, 17(1): 1–25.
Eder, Christoph. 2014. “Displacement and education of the next generation: evidence fromBosnia and Herzegovina.” IZA Journal of Labor & Development, 3(1): 12.
Edin, Per-Anders, Peter Fredriksson, and Olof Aslund. 2003. “Ethnic enclaves andthe economic success of immigrants—Evidence from a natural experiment.” The QuarterlyJournal of Economics, 118(1): 329–357.
Engel, Stefanie, and Ana Marıa Ibanez. 2007. “Displacement due to violence in Colombia:A household-level analysis.” Economic Development and Cultural Change, 55(2): 335–365.
Esarey, Justin. 2015. “Using Interaction Terms as Instrumental Variables for Causal Identifi-cation: Does Corruption Harm Economic Development?” Working Paper. Rice University.
Fafchamps, Marcel, and Susan Lund. 2003. “Risk-sharing networks in rural Philippines.”Journal of Development Economics, 71(2): 261–287.
Ferris, Elizabeth, and Rebecca Winthrop. 2010. “Education and displacement: Assessingconditions for refugees and internally displaced persons affected by conflict.” Backgroundpaper for the EFA Global Monitoring Report 2011. The hidden crisis: Armed conflict andeducation.
Fiala, Nathan. 2015. “Economic consequences of forced displacement.” The Journal of Devel-opment Studies, 51(10): 1275–1293.
Foster, Andrew D, and Mark R Rosenzweig. 2001. “Imperfect commitment, altruism,and the family: Evidence from transfer behavior in low-income rural areas.” The Review ofEconomics and Statistics, 83(3): 389–407.
Grant, Rebecca. 1999. The Kosovo campaign: aerospace power made it work. Air Force As-sociation.
28
Iacopino, Vincent, Martina W Frank, Heidi M Bauer, Allen S Keller, Sheri LFink, Doug Ford, Daniel J Pallin, and Ronald Waldman. 2001. “A population-basedassessment of human rights abuses committed against ethnic Albanian refugees from Kosovo.”American Journal of Public Health, 91(12): 2013–2018.
Ibanez, Ana Marıa, and Carlos Eduardo Velez. 2008. “Civil conflict and forced migration:The micro determinants and welfare losses of displacement in Colombia.” World Development,36(4): 659–676.
ICTY, The International Criminal Tribunal for the former Yugoslavia. 2000. “Fi-nal Report to the Prosecutor by the Committee Etablished to Review the NATO BombingCampaign Against the Federal Republic of Yugoslavia.”
IMDC. 2016. “Global Report on Internal Displacement.” Geneva: Internal Displacement Mon-itoring Center.
Justino, Patricia. 2011. “The impact of armed civil conflict on household welfare and pol-icy responses.” Securing Peace: State-Building and Economic Development in Post-ConflictCountries, 19.
Kondylis, Florence. 2008. “Agricultural outputs and conflict displacement: Evidence from apolicy intervention in Rwanda.” Economic Development and Cultural Change, 57(1): 31–66.
Kondylis, Florence. 2010. “Conflict displacement and labor market outcomes in post-warBosnia and Herzegovina.” Journal of Development Economics, 93(2): 235–248.
Kruger, Jule, and Patrick Ball. 2014. “Evaluation of the database of the kosovo memorybook.” Last accessed December 2017. https://www.hrdag.org/wp-content/uploads/2015/04/Evaluation_of_the_Database_KMB-2014.pdf.
Leon, Gianmarco. 2012. “Civil conflict and human capital accumulation the long-term effectsof political violence in peru.” Journal of Human Resources, 47(4): 991–1022.
Martin, Susan F. 2016. “Rethinking Protection of Those Displaced by Humanitarian Crises.”American Economic Review: Papers & Proceedings, 106(5): 446–450.
Merrouche, Ouarda. 2011. “The long term educational cost of war: evidence from landminecontamination in Cambodia.” The Journal of Development Studies, 47(3): 399–416.
Miguel, Edward, and Gerard Roland. 2011. “The long-run impact of bombing Vietnam.”Journal of Development Economics, 96(1): 1–15.
Nizalova, Olena Y, and Irina Murtazashvili. 2016. “Exogenous treatment and endogenousfactors: Vanishing of omitted variable bias on the interaction term.” Journal of EconometricMethods, 5(1): 71–77.
Nunn, Nathan, and Nancy Qian. 2014. “US food aid and civil conflict.” American EconomicReview, 104(6): 1630–1666.
OSCE, Kosovo Verification Mission. 1999. “KOSOVO/KOSOVA: As Seen, As Told. Ananalysis of the human rights findings of the OSCE Kosovo Verification Mission, October 1998to June 1999.” Volume I and II.
29
Pistaferri, Luigi. 1999. “Informal networks in the Italian labor market.” Giornale deglieconomisti e annali di economia, 353–375.
Pivovarova, Margarita, and Eik Leong Swee. 2015. “Quantifying the microeconomic effectsof war using panel data: Evidence from Nepal.” World Development, 66(308-321).
Roodman, David. 2017. “BOOTTEST: Stata module to provide fast execution of the wildbootstrap with null imposed.” Statistical Software Components.
Ruiz, Isabel, and Carlos Vargas-Silva. 2013. “The Economics of Forced Migration.” TheJournal of Development Studies, 49(6): 772–784.
Sarvimaki, Matti, Roope Uusitalo, and Markus Jantti. 2009. “Long-term effects of forcedmigration.”
Shemyakina, Olga. 2011. “The effect of armed conflict on accumulation of schooling: Resultsfrom Tajikistan.” Journal of Development Economics, 95(2): 186–200.
SOK, Statistical Office of Kosovo. 2001. “Statistics on Education in Kosovo.” StatisticalOffice of Kosovo.
Stark, Oded. 2004. “On the economics of refugee flows.” Review of Development Economics,8(2): 325–329.
Swee, Eik Leong. 2015. “On war intensity and schooling attainment: The case of Bosnia andHerzegovina.” European Journal of Political Economy, 40: 158–172.
UNHCR, The UN Refugee Agency. 2017. “Global Trends: Forced Displacement in 2016.”UNHCR official webpage. Last accessed January 2018 http://www.unhcr.org/5943e8a34.
pdf.
Valente, Christine. 2013. “Education and civil conflict in Nepal.” The World Bank EconomicReview, 28(2): 354–383.
Verwimp, Philip, and Juan Carlos Munoz-Mora. 2018. “Returning Home after Civil War:Food Security and Nutrition among Burundian Households.” The Journal of DevelopmentStudies, 6(1019-1040).
Westley, Karen, and Vladimir Mikhalev. 2002. The use of participatory methods for liveli-hood assessment in situations of political instability: A case study from Kosovo. OverseasDevelopment Institute London.
30
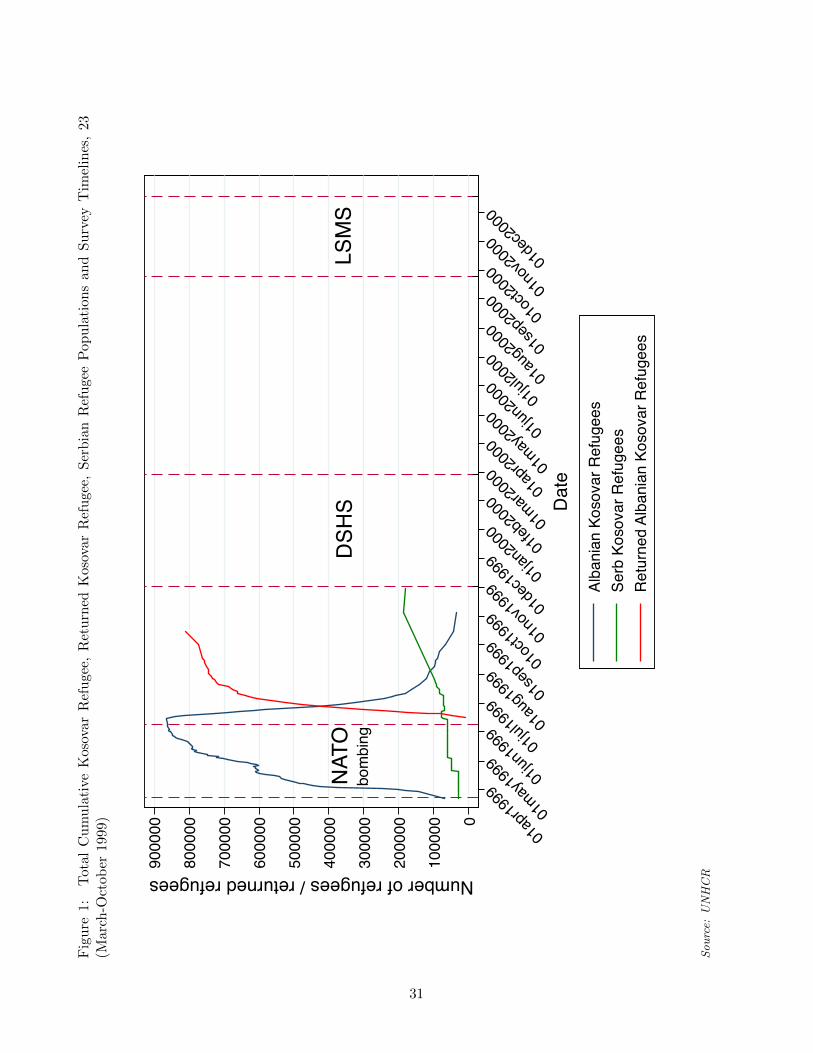
Fig
ure
1:T
otal
Cu
mu
lati
veK
osov
arR
efu
gee,
Ret
urn
edK
osov
arR
efu
gee,
Ser
bia
nR
efu
gee
Pop
ula
tion
san
dS
urv
eyT
imel
ines
,23
(Mar
ch-O
ctob
er19
99)
NATO
bom
bing
DSHS
LSM
S
0
1000
00
2000
00
3000
00
4000
00
5000
00
6000
00
7000
00
8000
00
9000
00Number of refugees / returned refugees
01ap
r1999
01may
1999 01
jun19
99 01jul1
999
01au
g199
901
sep1
999
01oc
t1999
01no
v199
901
dec1
999
01jan
2000 01
feb20
0001
mar200
001
apr20
0001
may20
00 01jun
2000 01
jul200
001
aug2
000
01se
p200
001
oct20
0001
nov2
000
01de
c200
0
Date
Alba
nian
Kos
ovar
Ref
ugee
sSe
rb K
osov
ar R
efug
ees
Retu
rned
Alb
ania
n Ko
sova
r Ref
ugee
s
So
urc
e:U
NH
CR
31
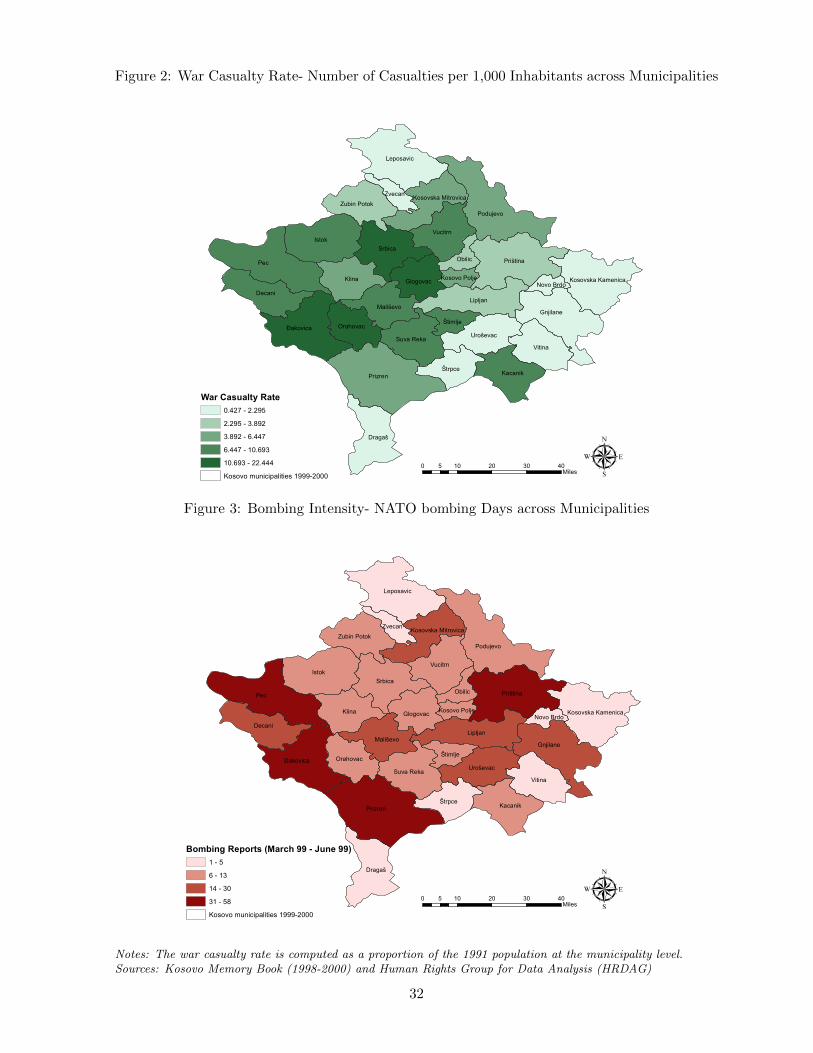
Figure 2: War Casualty Rate- Number of Casualties per 1,000 Inhabitants across Municipalities
Pec
Prizren
Is tok
Priština
Pod ujevo
Lipljan
Klina
Gnjilane
Srbica
Vitina
Ðakovica
Leposavic
Vucitrn
Dragaš
Decani
KacanikŠtrpce
Uroševac
Mališevo
Suva Reka
Glogovac
Orahovac
Zubin Potok
Kosovska Kamenica
Štimlje
Obilic
Kosovska MitrovicaZvecan
Novo Brd oKosovo Polje
µ0 10 20 30 405Miles
War Casualty Rate0.427 - 2.2952.295 - 3.8923.892 - 6.4476.447 - 10.69310.693 - 22.444Kosovo municipalities 1999-2000
Figure 3: Bombing Intensity- NATO bombing Days across Municipalities
Pec
Prizren
Istok
Priština
Podujevo
Lipljan
Klina
Gnjilane
Srbica
Vitina
Ðakovica
Leposavic
Vucitrn
Drag aš
Decani
KacanikŠtrpce
Uroševac
Mališevo
Su va Reka
Glog ovac
Orahovac
Zubin Potok
Kosovska Kamenica
Štimlje
Obilic
Kosovska MitrovicaZvecan
Novo BrdoKosovo Polje
µ0 10 20 30 405Miles
Bombing Reports (March 99 - June 99)1 - 56 - 1314 - 3031 - 58Kosovo municipalities 1999-2000
Notes: The war casualty rate is computed as a proportion of the 1991 population at the municipality level.Sources: Kosovo Memory Book (1998-2000) and Human Rights Group for Data Analysis (HRDAG)
32
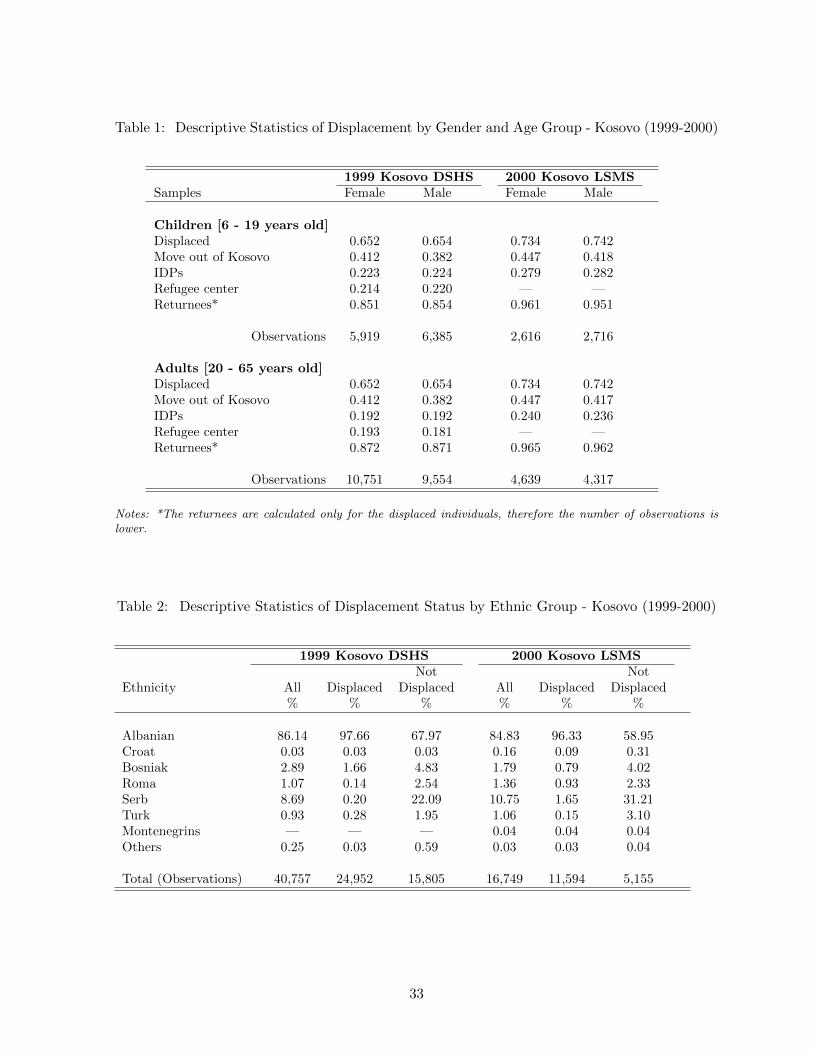
Table 1: Descriptive Statistics of Displacement by Gender and Age Group - Kosovo (1999-2000)
1999 Kosovo DSHS 2000 Kosovo LSMSSamples Female Male Female Male
Children [6 - 19 years old]Displaced 0.652 0.654 0.734 0.742Move out of Kosovo 0.412 0.382 0.447 0.418IDPs 0.223 0.224 0.279 0.282Refugee center 0.214 0.220 — —Returnees* 0.851 0.854 0.961 0.951
Observations 5,919 6,385 2,616 2,716
Adults [20 - 65 years old]Displaced 0.652 0.654 0.734 0.742Move out of Kosovo 0.412 0.382 0.447 0.417IDPs 0.192 0.192 0.240 0.236Refugee center 0.193 0.181 — —Returnees* 0.872 0.871 0.965 0.962
Observations 10,751 9,554 4,639 4,317
Notes: *The returnees are calculated only for the displaced individuals, therefore the number of observations islower.
Table 2: Descriptive Statistics of Displacement Status by Ethnic Group - Kosovo (1999-2000)
1999 Kosovo DSHS 2000 Kosovo LSMSNot Not
Ethnicity All Displaced Displaced All Displaced Displaced% % % % % %
Albanian 86.14 97.66 67.97 84.83 96.33 58.95Croat 0.03 0.03 0.03 0.16 0.09 0.31Bosniak 2.89 1.66 4.83 1.79 0.79 4.02Roma 1.07 0.14 2.54 1.36 0.93 2.33Serb 8.69 0.20 22.09 10.75 1.65 31.21Turk 0.93 0.28 1.95 1.06 0.15 3.10Montenegrins — — — 0.04 0.04 0.04Others 0.25 0.03 0.59 0.03 0.03 0.04
Total (Observations) 40,757 24,952 15,805 16,749 11,594 5,155
33
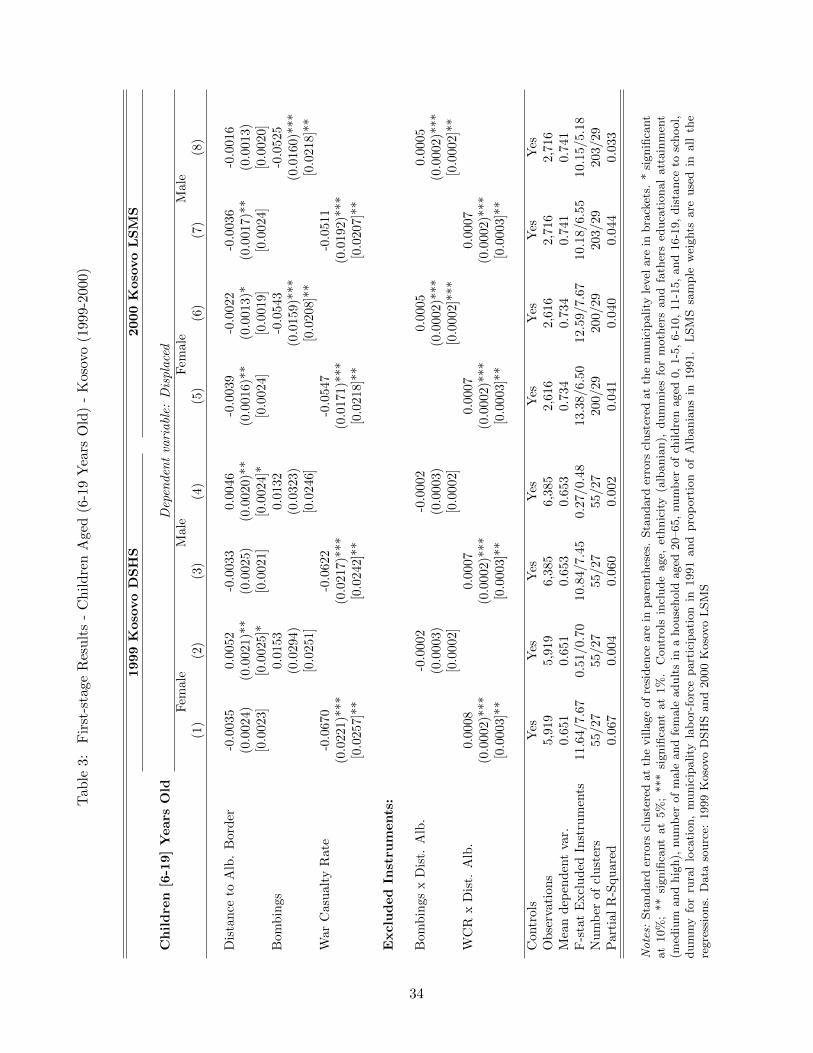
Tab
le3:
Fir
st-s
tage
Res
ult
s-
Ch
ild
ren
Age
d(6
-19
Yea
rsO
ld)
-K
osov
o(1
999-2
000)
1999
Koso
vo
DS
HS
2000
Koso
vo
LS
MS
Ch
ild
ren
[6-1
9]
Years
Old
Dep
enden
tva
riabl
e:D
ispla
ced
Fem
ale
Male
Fem
ale
Male
(1)
(2)
(3)
(4)
(5)
(6)
(7)
(8)
Dis
tan
ceto
Alb
.B
ord
er-0
.003
50.0
052
-0.0
033
0.0
046
-0.0
039
-0.0
022
-0.0
036
-0.0
016
(0.0
024)
(0.0
021)*
*(0
.0025)
(0.0
020)*
*(0
.0016)*
*(0
.001
3)*
(0.0
017)*
*(0
.0013)
[0.0
023]
[0.0
025]*
[0.0
021]
[0.0
024]*
[0.0
024]
[0.0
019]
[0.0
024]
[0.0
020]
Bom
bin
gs0.0
153
0.0
132
-0.0
543
-0.0
525
(0.0
294)
(0.0
323)
(0.0
159)*
**
(0.0
160)*
**
[0.0
251]
[0.0
246]
[0.0
208]*
*[0
.0218]*
*W
arC
asu
alty
Rat
e-0
.067
0-0
.0622
-0.0
547
-0.0
511
(0.0
221)
***
(0.0
217)*
**
(0.0
171)*
**
(0.0
192)*
**
[0.0
257]
**[0
.0242]*
*[0
.0218]*
*[0
.0207]*
*
Exclu
ded
Inst
rum
ents
:
Bom
bin
gsx
Dis
t.A
lb.
-0.0
002
-0.0
002
0.0
005
0.0
005
(0.0
003)
(0.0
003)
(0.0
002)*
**
(0.0
002)*
**
[0.0
002]
[0.0
002]
[0.0
002
]***
[0.0
002]*
*W
CR
xD
ist.
Alb
.0.
0008
0.0
007
0.0
007
0.0
007
(0.0
002)
***
(0.0
002)*
**
(0.0
002)*
**
(0.0
002)*
**
[0.0
003]
**[0
.0003]*
*[0
.0003]*
*[0
.0003]*
*
Con
trol
sY
esY
esY
esY
esY
esY
esY
esY
esO
bse
rvat
ion
s5,
919
5,9
19
6,3
85
6,3
85
2,6
16
2,6
16
2,7
16
2,7
16
Mea
nd
epen
den
tva
r.0.
651
0.6
51
0.6
53
0.6
53
0.7
34
0.7
34
0.7
41
0.7
41
F-s
tat
Excl
ud
edIn
stru
men
ts11
.64/
7.67
0.5
1/0.7
010.8
4/7.4
50.2
7/0.4
813.3
8/6.5
012.5
9/7.6
710.1
8/6.5
510.1
5/5.1
8N
um
ber
ofcl
ust
ers
55/2
755/27
55/27
55/27
200/29
200/29
203/29
203/29
Par
tial
R-S
qu
ared
0.06
70.0
04
0.0
60
0.0
02
0.0
41
0.0
40
0.0
44
0.0
33
No
tes:
Sta
ndard
erro
rscl
ust
ered
at
the
villa
ge
of
resi
den
ceare
inpare
nth
eses
.Sta
ndard
erro
rscl
ust
ered
at
the
munic
ipality
level
are
inbra
cket
s.*
signifi
cant
at
10%
;**
signifi
cant
at
5%
;***
signifi
cant
at
1%
.C
ontr
ols
incl
ude
age,
ethnic
ity
(alb
ania
n),
dum
mie
sfo
rm
oth
ers
and
fath
ers
educa
tional
att
ain
men
t(m
ediu
mand
hig
h),
num
ber
of
male
and
fem
ale
adult
sin
ahouse
hold
aged
20–65,
num
ber
of
childre
naged
0,
1-5
,6-1
0,
11-1
5,
and
16-1
9,
dis
tance
tosc
hool,
dum
my
for
rura
llo
cati
on,
munic
ipality
lab
or-
forc
epart
icip
ati
on
in1991
and
pro
port
ion
of
Alb
ania
ns
in1991.
LSM
Ssa
mple
wei
ghts
are
use
din
all
the
regre
ssio
ns.
Data
sourc
e:1999
Koso
vo
DSH
Sand
2000
Koso
vo
LSM
S
34
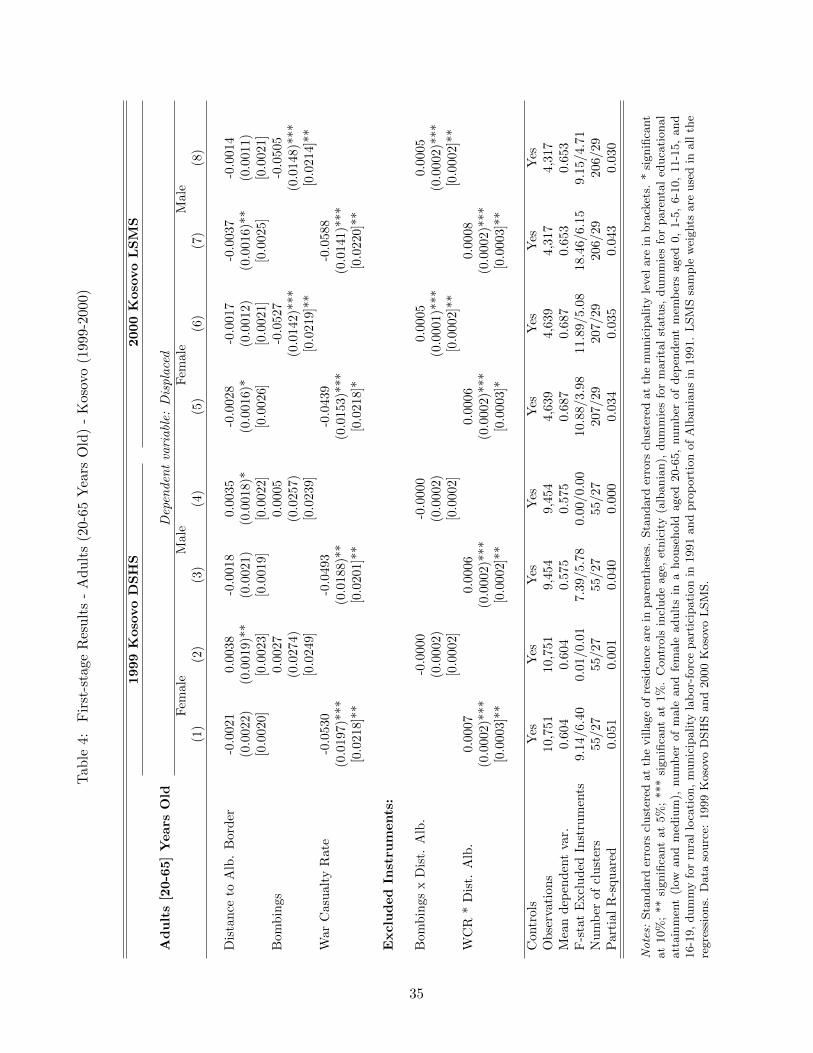
Tab
le4:
Fir
st-s
tage
Res
ult
s-
Ad
ult
s(2
0-65
Yea
rsO
ld)
-K
osov
o(1
999-
2000)
1999
Koso
vo
DS
HS
2000
Koso
vo
LS
MS
Ad
ult
s[2
0-6
5]
Years
Old
Dep
enden
tva
riabl
e:D
ispla
ced
Fem
ale
Male
Fem
ale
Male
(1)
(2)
(3)
(4)
(5)
(6)
(7)
(8)
Dis
tan
ceto
Alb
.B
ord
er-0
.002
10.0
038
-0.0
018
0.0
035
-0.0
028
-0.0
017
-0.0
037
-0.0
014
(0.0
022)
(0.0
019)*
*(0
.0021)
(0.0
018)*
(0.0
016)*
(0.0
012)
(0.0
016)*
*(0
.0011)
[0.0
020]
[0.0
023]
[0.0
019]
[0.0
022]
[0.0
026]
[0.0
021
][0
.0025]
[0.0
021]
Bom
bin
gs0.0
027
0.0
005
-0.0
527
-0.0
505
(0.0
274)
(0.0
257)
(0.0
142)*
**
(0.0
148)*
**
[0.0
249]
[0.0
239]
[0.0
219]*
*[0
.0214]*
*W
arC
asu
alty
Rat
e-0
.053
0-0
.0493
-0.0
439
-0.0
588
(0.0
197)
***
(0.0
188)*
*(0
.0153)*
**
(0.0
141)*
**
[0.0
218]
**[0
.0201]*
*[0
.0218]*
[0.0
220]*
*
Exclu
ded
Inst
rum
ents
:
Bom
bin
gsx
Dis
t.A
lb.
-0.0
000
-0.0
000
0.0
005
0.0
005
(0.0
002)
(0.0
002)
(0.0
001)*
**
(0.0
002)*
**
[0.0
002]
[0.0
002]
[0.0
002]*
*[0
.0002]*
*W
CR
*D
ist.
Alb
.0.
0007
0.0
006
0.0
006
0.0
008
(0.0
002)
***
(0.0
002)*
**
(0.0
002)*
**
(0.0
002)*
**
[0.0
003]
**[0
.0002]*
*[0
.0003]*
[0.0
003]*
*
Con
trol
sY
esY
esY
esY
esY
esY
esY
esY
esO
bse
rvat
ion
s10
,751
10,7
51
9,4
54
9,4
54
4,6
39
4,6
39
4,3
17
4,3
17
Mea
nd
epen
den
tva
r.0.
604
0.6
04
0.5
75
0.5
75
0.6
87
0.6
87
0.6
53
0.6
53
F-s
tat
Excl
ud
edIn
stru
men
ts9.
14/6
.40
0.0
1/0.0
17.3
9/5.7
80.0
0/0.0
010.8
8/3.9
811.8
9/5.0
818.4
6/6.1
59.1
5/4.7
1N
um
ber
ofcl
ust
ers
55/2
755/27
55/27
55/27
207/29
207/29
206/29
206/29
Par
tial
R-s
qu
ared
0.05
10.0
01
0.0
40
0.0
00
0.0
34
0.0
35
0.0
43
0.0
30
No
tes:
Sta
ndard
erro
rscl
ust
ered
at
the
villa
ge
of
resi
den
ceare
inpare
nth
eses
.Sta
ndard
erro
rscl
ust
ered
at
the
munic
ipality
level
are
inbra
cket
s.*
signifi
cant
at
10%
;**
signifi
cant
at
5%
;***
signifi
cant
at
1%
.C
ontr
ols
incl
ude
age,
etnic
ity
(alb
ania
n),
dum
mie
sfo
rm
ari
tal
statu
s,dum
mie
sfo
rpare
nta
led
uca
tional
att
ain
men
t(l
owand
med
ium
),num
ber
of
male
and
fem
ale
adult
sin
ahouse
hold
aged
20-6
5,
num
ber
of
dep
enden
tm
emb
ers
aged
0,
1-5
,6-1
0,
11-1
5,
and
16-1
9,
dum
my
for
rura
llo
cati
on,
munic
ipality
lab
or-
forc
epart
icip
ati
on
in1991
and
pro
port
ion
of
Alb
ania
ns
in1991.
LSM
Ssa
mple
wei
ghts
are
use
din
all
the
regre
ssio
ns.
Data
sourc
e:1999
Koso
vo
DSH
Sand
2000
Koso
vo
LSM
S.
35
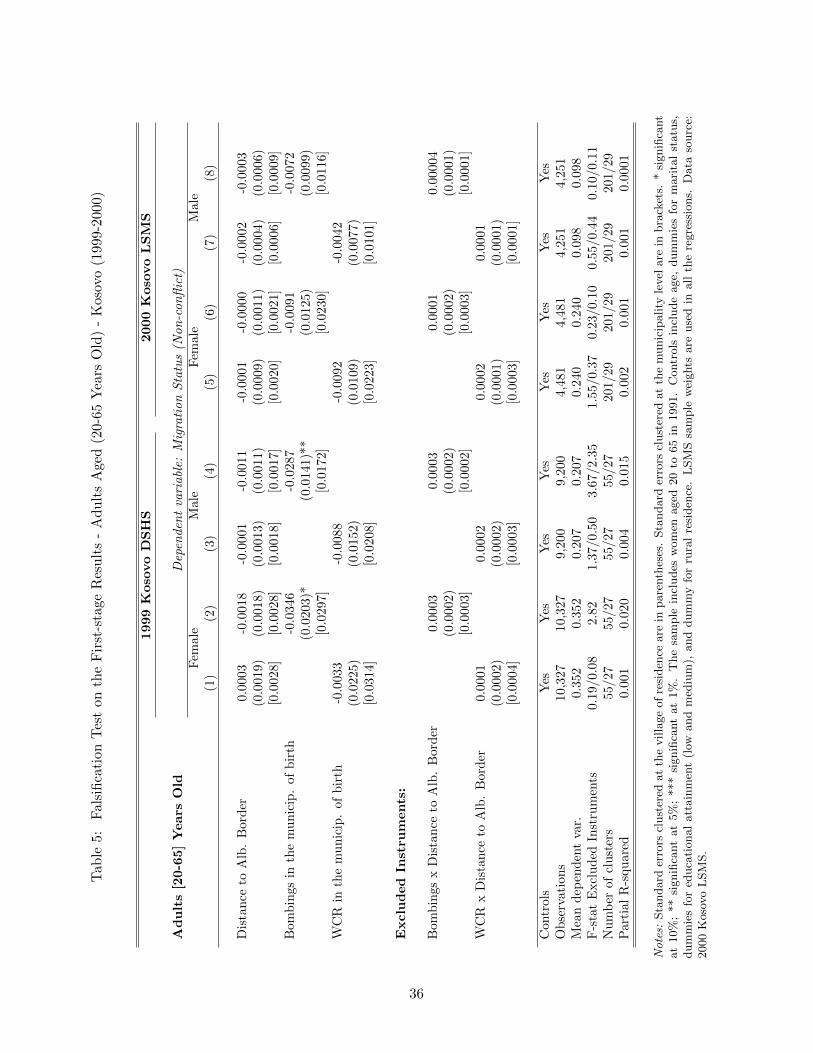
Tab
le5:
Fal
sifi
cati
onT
est
onth
eF
irst
-sta
geR
esu
lts
-A
du
lts
Age
d(2
0-65
Yea
rsO
ld)
-K
oso
vo
(1999-2
000)
1999
Koso
vo
DS
HS
2000
Koso
vo
LS
MS
Ad
ult
s[2
0-6
5]
Years
Old
Dep
enden
tva
riabl
e:M
igra
tion
Sta
tus
(Non
-con
flic
t)F
emale
Male
Fem
ale
Male
(1)
(2)
(3)
(4)
(5)
(6)
(7)
(8)
Dis
tan
ceto
Alb
.B
ord
er0.
0003
-0.0
018
-0.0
001
-0.0
011
-0.0
001
-0.0
000
-0.0
002
-0.0
003
(0.0
019)
(0.0
018)
(0.0
013)
(0.0
011)
(0.0
009)
(0.0
011)
(0.0
004)
(0.0
006)
[0.0
028]
[0.0
028]
[0.0
018]
[0.0
017]
[0.0
020]
[0.0
021]
[0.0
006]
[0.0
009]
Bom
bin
gsin
the
mu
nic
ip.
ofb
irth
-0.0
346
-0.0
287
-0.0
091
-0.0
072
(0.0
203)*
(0.0
141)*
*(0
.0125)
(0.0
099)
[0.0
297]
[0.0
172]
[0.0
230]
[0.0
116]
WC
Rin
the
mu
nic
ip.
ofb
irth
-0.0
033
-0.0
088
-0.0
092
-0.0
042
(0.0
225)
(0.0
152)
(0.0
109)
(0.0
077)
[0.0
314]
[0.0
208]
[0.0
223]
[0.0
101]
Exclu
ded
Inst
rum
ents
:
Bom
bin
gsx
Dis
tan
ceto
Alb
.B
ord
er0.0
003
0.0
003
0.0
001
0.0
0004
(0.0
002)
(0.0
002)
(0.0
002)
(0.0
001)
[0.0
003]
[0.0
002]
[0.0
003]
[0.0
001]
WC
Rx
Dis
tan
ceto
Alb
.B
ord
er0.
0001
0.0
002
0.0
002
0.0
001
(0.0
002)
(0.0
002)
(0.0
001)
(0.0
001)
[0.0
004]
[0.0
003]
[0.0
003]
[0.0
001]
Con
trol
sY
esY
esY
esY
esY
esY
esY
esY
esO
bse
rvat
ion
s10
,327
10,3
27
9,2
00
9,2
00
4,4
81
4,4
81
4,2
51
4,2
51
Mea
nd
epen
den
tva
r.0.
352
0.3
52
0.2
07
0.2
07
0.2
40
0.2
40
0.0
98
0.0
98
F-s
tat
Excl
ud
edIn
stru
men
ts0.
19/0.0
82.8
21.3
7/0.5
03.6
7/2.3
51.5
5/0.3
70.2
3/0.1
00.5
5/0.4
40.1
0/0.1
1N
um
ber
ofcl
ust
ers
55/27
55/27
55/27
55/27
201/29
201/29
201/29
201/29
Par
tial
R-s
qu
ared
0.00
10.0
20
0.0
04
0.0
15
0.0
02
0.0
01
0.0
01
0.0
001
No
tes:
Sta
ndard
erro
rscl
ust
ered
at
the
villa
ge
of
resi
den
ceare
inpare
nth
eses
.Sta
ndard
erro
rscl
ust
ered
at
the
munic
ipality
level
are
inbra
cket
s.*
signifi
cant
at
10%
;**
signifi
cant
at
5%
;***
signifi
cant
at
1%
.T
he
sam
ple
incl
udes
wom
enaged
20
to65
in1991.
Contr
ols
incl
ude
age,
dum
mie
sfo
rm
ari
tal
statu
s,dum
mie
sfo
red
uca
tional
att
ain
men
t(l
owand
med
ium
),and
dum
my
for
rura
lre
siden
ce.
LSM
Ssa
mple
wei
ghts
are
use
din
all
the
regre
ssio
ns.
Data
sourc
e:2000
Koso
vo
LSM
S.
36
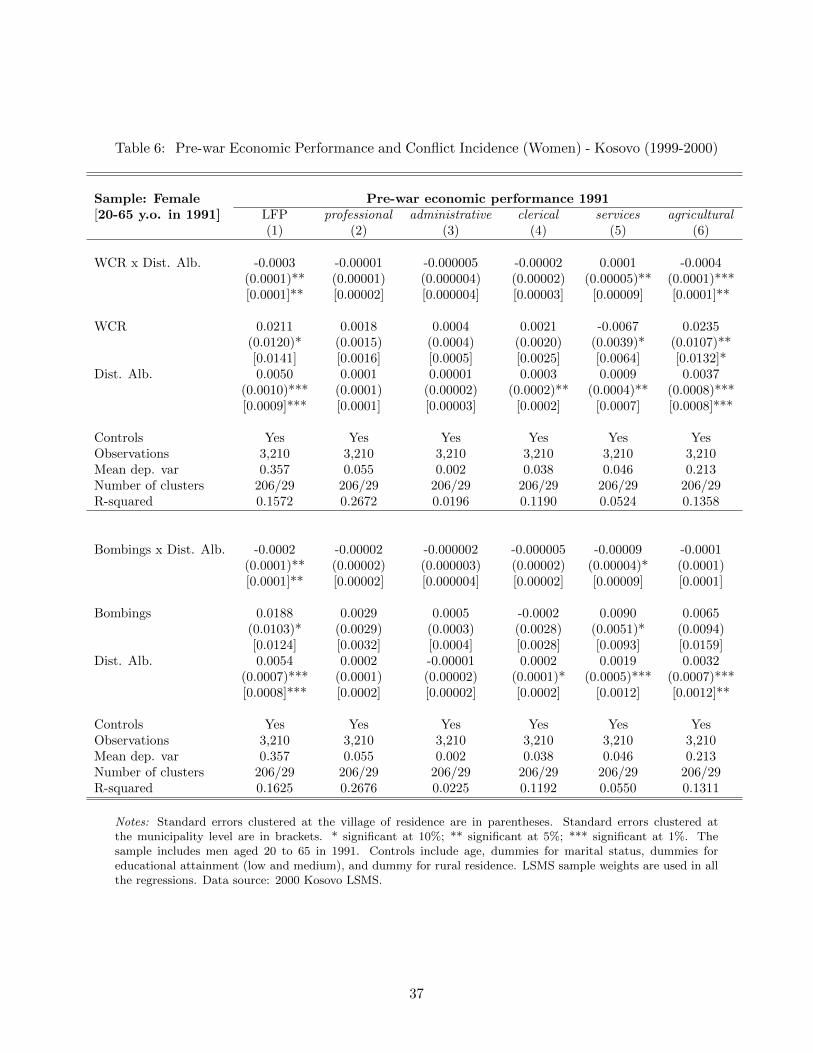
Table 6: Pre-war Economic Performance and Conflict Incidence (Women) - Kosovo (1999-2000)
Sample: Female Pre-war economic performance 1991[20-65 y.o. in 1991] LFP professional administrative clerical services agricultural
(1) (2) (3) (4) (5) (6)
WCR x Dist. Alb. -0.0003 -0.00001 -0.000005 -0.00002 0.0001 -0.0004(0.0001)** (0.00001) (0.000004) (0.00002) (0.00005)** (0.0001)***[0.0001]** [0.00002] [0.000004] [0.00003] [0.00009] [0.0001]**
WCR 0.0211 0.0018 0.0004 0.0021 -0.0067 0.0235(0.0120)* (0.0015) (0.0004) (0.0020) (0.0039)* (0.0107)**[0.0141] [0.0016] [0.0005] [0.0025] [0.0064] [0.0132]*
Dist. Alb. 0.0050 0.0001 0.00001 0.0003 0.0009 0.0037(0.0010)*** (0.0001) (0.00002) (0.0002)** (0.0004)** (0.0008)***[0.0009]*** [0.0001] [0.00003] [0.0002] [0.0007] [0.0008]***
Controls Yes Yes Yes Yes Yes YesObservations 3,210 3,210 3,210 3,210 3,210 3,210Mean dep. var 0.357 0.055 0.002 0.038 0.046 0.213Number of clusters 206/29 206/29 206/29 206/29 206/29 206/29R-squared 0.1572 0.2672 0.0196 0.1190 0.0524 0.1358
Bombings x Dist. Alb. -0.0002 -0.00002 -0.000002 -0.000005 -0.00009 -0.0001(0.0001)** (0.00002) (0.000003) (0.00002) (0.00004)* (0.0001)[0.0001]** [0.00002] [0.000004] [0.00002] [0.00009] [0.0001]
Bombings 0.0188 0.0029 0.0005 -0.0002 0.0090 0.0065(0.0103)* (0.0029) (0.0003) (0.0028) (0.0051)* (0.0094)[0.0124] [0.0032] [0.0004] [0.0028] [0.0093] [0.0159]
Dist. Alb. 0.0054 0.0002 -0.00001 0.0002 0.0019 0.0032(0.0007)*** (0.0001) (0.00002) (0.0001)* (0.0005)*** (0.0007)***[0.0008]*** [0.0002] [0.00002] [0.0002] [0.0012] [0.0012]**
Controls Yes Yes Yes Yes Yes YesObservations 3,210 3,210 3,210 3,210 3,210 3,210Mean dep. var 0.357 0.055 0.002 0.038 0.046 0.213Number of clusters 206/29 206/29 206/29 206/29 206/29 206/29R-squared 0.1625 0.2676 0.0225 0.1192 0.0550 0.1311
Notes: Standard errors clustered at the village of residence are in parentheses. Standard errors clustered atthe municipality level are in brackets. * significant at 10%; ** significant at 5%; *** significant at 1%. Thesample includes men aged 20 to 65 in 1991. Controls include age, dummies for marital status, dummies foreducational attainment (low and medium), and dummy for rural residence. LSMS sample weights are used in allthe regressions. Data source: 2000 Kosovo LSMS.
37
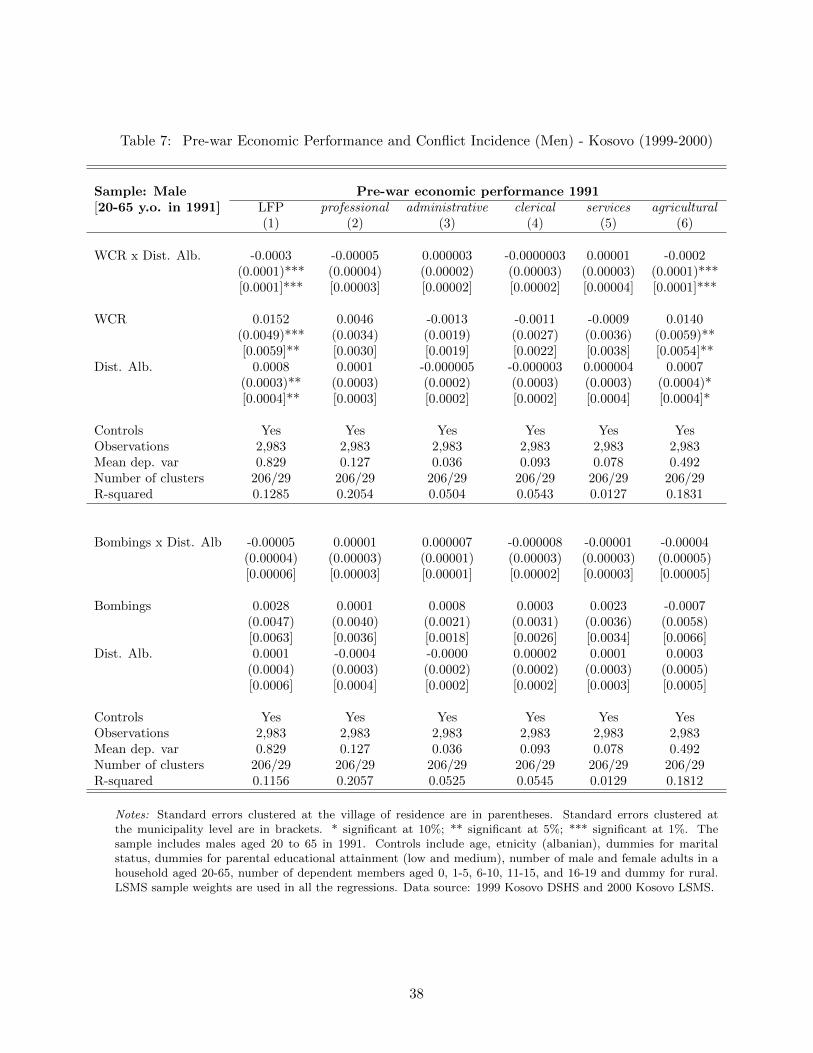
Table 7: Pre-war Economic Performance and Conflict Incidence (Men) - Kosovo (1999-2000)
Sample: Male Pre-war economic performance 1991[20-65 y.o. in 1991] LFP professional administrative clerical services agricultural
(1) (2) (3) (4) (5) (6)
WCR x Dist. Alb. -0.0003 -0.00005 0.000003 -0.0000003 0.00001 -0.0002(0.0001)*** (0.00004) (0.00002) (0.00003) (0.00003) (0.0001)***[0.0001]*** [0.00003] [0.00002] [0.00002] [0.00004] [0.0001]***
WCR 0.0152 0.0046 -0.0013 -0.0011 -0.0009 0.0140(0.0049)*** (0.0034) (0.0019) (0.0027) (0.0036) (0.0059)**[0.0059]** [0.0030] [0.0019] [0.0022] [0.0038] [0.0054]**
Dist. Alb. 0.0008 0.0001 -0.000005 -0.000003 0.000004 0.0007(0.0003)** (0.0003) (0.0002) (0.0003) (0.0003) (0.0004)*[0.0004]** [0.0003] [0.0002] [0.0002] [0.0004] [0.0004]*
Controls Yes Yes Yes Yes Yes YesObservations 2,983 2,983 2,983 2,983 2,983 2,983Mean dep. var 0.829 0.127 0.036 0.093 0.078 0.492Number of clusters 206/29 206/29 206/29 206/29 206/29 206/29R-squared 0.1285 0.2054 0.0504 0.0543 0.0127 0.1831
Bombings x Dist. Alb -0.00005 0.00001 0.000007 -0.000008 -0.00001 -0.00004(0.00004) (0.00003) (0.00001) (0.00003) (0.00003) (0.00005)[0.00006] [0.00003] [0.00001] [0.00002] [0.00003] [0.00005]
Bombings 0.0028 0.0001 0.0008 0.0003 0.0023 -0.0007(0.0047) (0.0040) (0.0021) (0.0031) (0.0036) (0.0058)[0.0063] [0.0036] [0.0018] [0.0026] [0.0034] [0.0066]
Dist. Alb. 0.0001 -0.0004 -0.0000 0.00002 0.0001 0.0003(0.0004) (0.0003) (0.0002) (0.0002) (0.0003) (0.0005)[0.0006] [0.0004] [0.0002] [0.0002] [0.0003] [0.0005]
Controls Yes Yes Yes Yes Yes YesObservations 2,983 2,983 2,983 2,983 2,983 2,983Mean dep. var 0.829 0.127 0.036 0.093 0.078 0.492Number of clusters 206/29 206/29 206/29 206/29 206/29 206/29R-squared 0.1156 0.2057 0.0525 0.0545 0.0129 0.1812
Notes: Standard errors clustered at the village of residence are in parentheses. Standard errors clustered atthe municipality level are in brackets. * significant at 10%; ** significant at 5%; *** significant at 1%. Thesample includes males aged 20 to 65 in 1991. Controls include age, etnicity (albanian), dummies for maritalstatus, dummies for parental educational attainment (low and medium), number of male and female adults in ahousehold aged 20-65, number of dependent members aged 0, 1-5, 6-10, 11-15, and 16-19 and dummy for rural.LSMS sample weights are used in all the regressions. Data source: 1999 Kosovo DSHS and 2000 Kosovo LSMS.
38
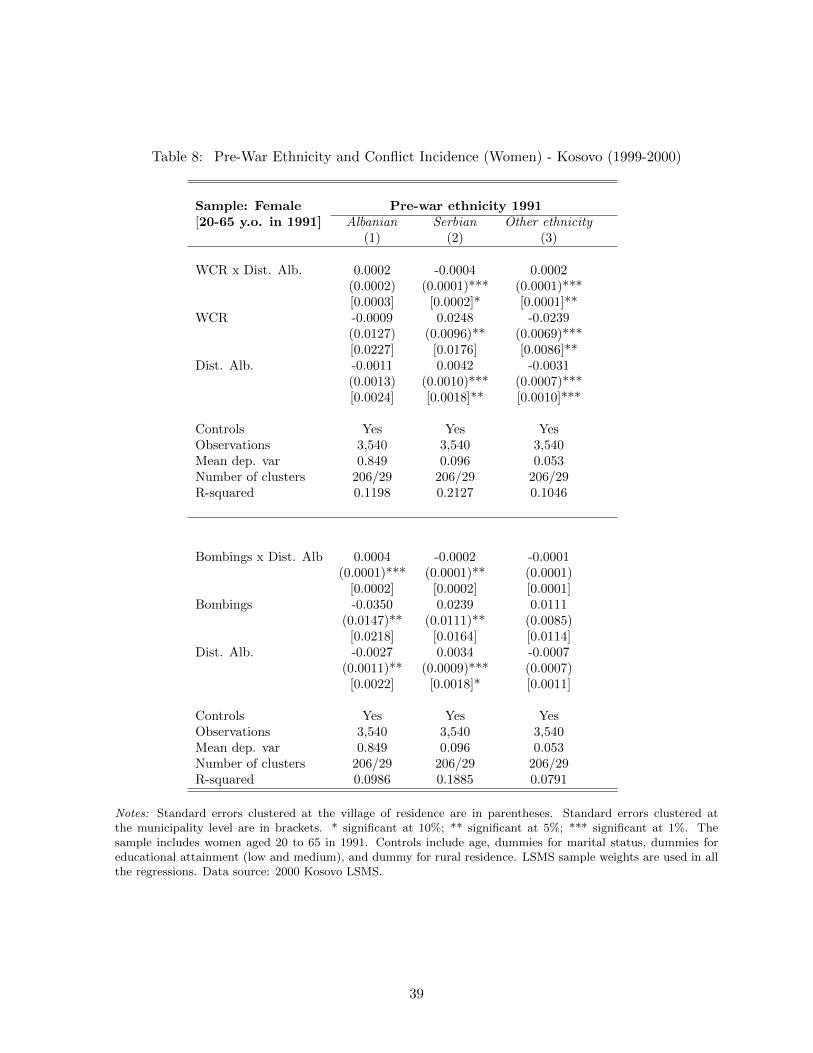
Table 8: Pre-War Ethnicity and Conflict Incidence (Women) - Kosovo (1999-2000)
Sample: Female Pre-war ethnicity 1991[20-65 y.o. in 1991] Albanian Serbian Other ethnicity
(1) (2) (3)
WCR x Dist. Alb. 0.0002 -0.0004 0.0002(0.0002) (0.0001)*** (0.0001)***[0.0003] [0.0002]* [0.0001]**
WCR -0.0009 0.0248 -0.0239(0.0127) (0.0096)** (0.0069)***[0.0227] [0.0176] [0.0086]**
Dist. Alb. -0.0011 0.0042 -0.0031(0.0013) (0.0010)*** (0.0007)***[0.0024] [0.0018]** [0.0010]***
Controls Yes Yes YesObservations 3,540 3,540 3,540Mean dep. var 0.849 0.096 0.053Number of clusters 206/29 206/29 206/29R-squared 0.1198 0.2127 0.1046
Bombings x Dist. Alb 0.0004 -0.0002 -0.0001(0.0001)*** (0.0001)** (0.0001)
[0.0002] [0.0002] [0.0001]Bombings -0.0350 0.0239 0.0111
(0.0147)** (0.0111)** (0.0085)[0.0218] [0.0164] [0.0114]
Dist. Alb. -0.0027 0.0034 -0.0007(0.0011)** (0.0009)*** (0.0007)
[0.0022] [0.0018]* [0.0011]
Controls Yes Yes YesObservations 3,540 3,540 3,540Mean dep. var 0.849 0.096 0.053Number of clusters 206/29 206/29 206/29R-squared 0.0986 0.1885 0.0791
Notes: Standard errors clustered at the village of residence are in parentheses. Standard errors clustered atthe municipality level are in brackets. * significant at 10%; ** significant at 5%; *** significant at 1%. Thesample includes women aged 20 to 65 in 1991. Controls include age, dummies for marital status, dummies foreducational attainment (low and medium), and dummy for rural residence. LSMS sample weights are used in allthe regressions. Data source: 2000 Kosovo LSMS.
39
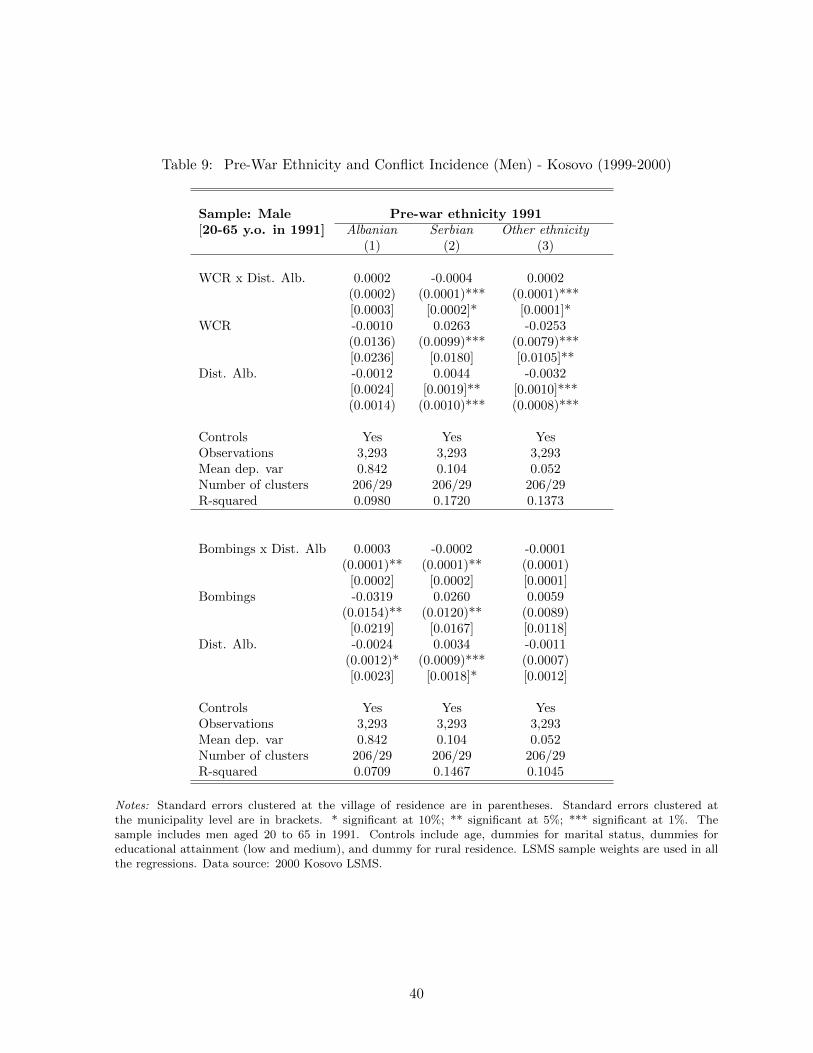
Table 9: Pre-War Ethnicity and Conflict Incidence (Men) - Kosovo (1999-2000)
Sample: Male Pre-war ethnicity 1991[20-65 y.o. in 1991] Albanian Serbian Other ethnicity
(1) (2) (3)
WCR x Dist. Alb. 0.0002 -0.0004 0.0002(0.0002) (0.0001)*** (0.0001)***[0.0003] [0.0002]* [0.0001]*
WCR -0.0010 0.0263 -0.0253(0.0136) (0.0099)*** (0.0079)***[0.0236] [0.0180] [0.0105]**
Dist. Alb. -0.0012 0.0044 -0.0032[0.0024] [0.0019]** [0.0010]***(0.0014) (0.0010)*** (0.0008)***
Controls Yes Yes YesObservations 3,293 3,293 3,293Mean dep. var 0.842 0.104 0.052Number of clusters 206/29 206/29 206/29R-squared 0.0980 0.1720 0.1373
Bombings x Dist. Alb 0.0003 -0.0002 -0.0001(0.0001)** (0.0001)** (0.0001)
[0.0002] [0.0002] [0.0001]Bombings -0.0319 0.0260 0.0059
(0.0154)** (0.0120)** (0.0089)[0.0219] [0.0167] [0.0118]
Dist. Alb. -0.0024 0.0034 -0.0011(0.0012)* (0.0009)*** (0.0007)[0.0023] [0.0018]* [0.0012]
Controls Yes Yes YesObservations 3,293 3,293 3,293Mean dep. var 0.842 0.104 0.052Number of clusters 206/29 206/29 206/29R-squared 0.0709 0.1467 0.1045
Notes: Standard errors clustered at the village of residence are in parentheses. Standard errors clustered atthe municipality level are in brackets. * significant at 10%; ** significant at 5%; *** significant at 1%. Thesample includes men aged 20 to 65 in 1991. Controls include age, dummies for marital status, dummies foreducational attainment (low and medium), and dummy for rural residence. LSMS sample weights are used in allthe regressions. Data source: 2000 Kosovo LSMS.
40
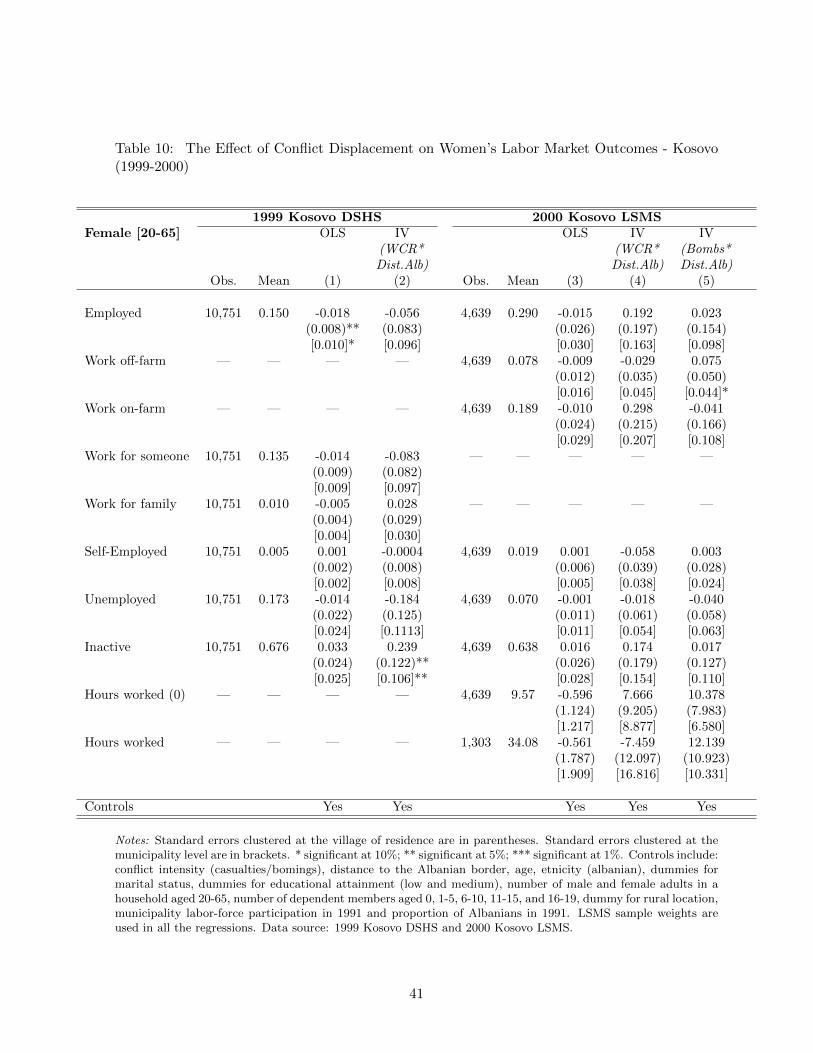
Table 10: The Effect of Conflict Displacement on Women’s Labor Market Outcomes - Kosovo(1999-2000)
1999 Kosovo DSHS 2000 Kosovo LSMSFemale [20-65] OLS IV OLS IV IV
(WCR* (WCR* (Bombs*Dist.Alb) Dist.Alb) Dist.Alb)
Obs. Mean (1) (2) Obs. Mean (3) (4) (5)
Employed 10,751 0.150 -0.018 -0.056 4,639 0.290 -0.015 0.192 0.023(0.008)** (0.083) (0.026) (0.197) (0.154)[0.010]* [0.096] [0.030] [0.163] [0.098]
Work off-farm — — — — 4,639 0.078 -0.009 -0.029 0.075(0.012) (0.035) (0.050)[0.016] [0.045] [0.044]*
Work on-farm — — — — 4,639 0.189 -0.010 0.298 -0.041(0.024) (0.215) (0.166)[0.029] [0.207] [0.108]
Work for someone 10,751 0.135 -0.014 -0.083 — — — — —(0.009) (0.082)[0.009] [0.097]
Work for family 10,751 0.010 -0.005 0.028 — — — — —(0.004) (0.029)[0.004] [0.030]
Self-Employed 10,751 0.005 0.001 -0.0004 4,639 0.019 0.001 -0.058 0.003(0.002) (0.008) (0.006) (0.039) (0.028)[0.002] [0.008] [0.005] [0.038] [0.024]
Unemployed 10,751 0.173 -0.014 -0.184 4,639 0.070 -0.001 -0.018 -0.040(0.022) (0.125) (0.011) (0.061) (0.058)[0.024] [0.1113] [0.011] [0.054] [0.063]
Inactive 10,751 0.676 0.033 0.239 4,639 0.638 0.016 0.174 0.017(0.024) (0.122)** (0.026) (0.179) (0.127)[0.025] [0.106]** [0.028] [0.154] [0.110]
Hours worked (0) — — — — 4,639 9.57 -0.596 7.666 10.378(1.124) (9.205) (7.983)[1.217] [8.877] [6.580]
Hours worked — — — — 1,303 34.08 -0.561 -7.459 12.139(1.787) (12.097) (10.923)[1.909] [16.816] [10.331]
Controls Yes Yes Yes Yes Yes
Notes: Standard errors clustered at the village of residence are in parentheses. Standard errors clustered at themunicipality level are in brackets. * significant at 10%; ** significant at 5%; *** significant at 1%. Controls include:conflict intensity (casualties/bomings), distance to the Albanian border, age, etnicity (albanian), dummies formarital status, dummies for educational attainment (low and medium), number of male and female adults in ahousehold aged 20-65, number of dependent members aged 0, 1-5, 6-10, 11-15, and 16-19, dummy for rural location,municipality labor-force participation in 1991 and proportion of Albanians in 1991. LSMS sample weights areused in all the regressions. Data source: 1999 Kosovo DSHS and 2000 Kosovo LSMS.
41
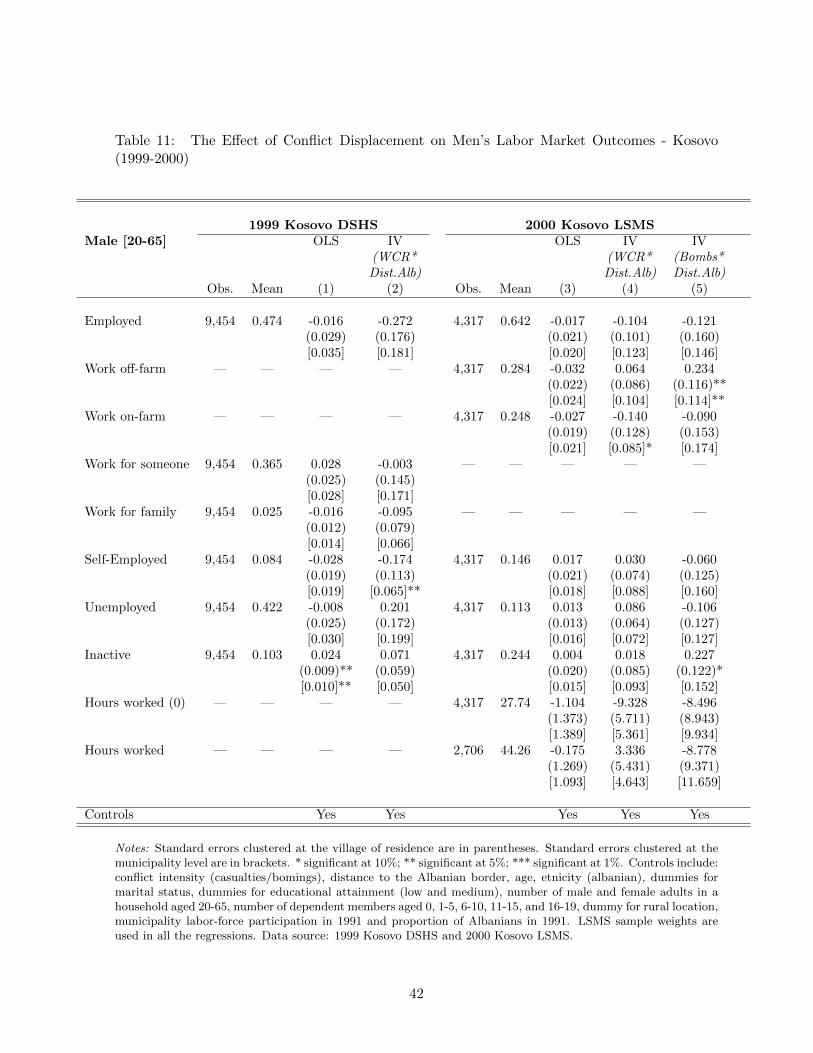
Table 11: The Effect of Conflict Displacement on Men’s Labor Market Outcomes - Kosovo(1999-2000)
1999 Kosovo DSHS 2000 Kosovo LSMSMale [20-65] OLS IV OLS IV IV
(WCR* (WCR* (Bombs*Dist.Alb) Dist.Alb) Dist.Alb)
Obs. Mean (1) (2) Obs. Mean (3) (4) (5)
Employed 9,454 0.474 -0.016 -0.272 4,317 0.642 -0.017 -0.104 -0.121(0.029) (0.176) (0.021) (0.101) (0.160)[0.035] [0.181] [0.020] [0.123] [0.146]
Work off-farm — — — — 4,317 0.284 -0.032 0.064 0.234(0.022) (0.086) (0.116)**[0.024] [0.104] [0.114]**
Work on-farm — — — — 4,317 0.248 -0.027 -0.140 -0.090(0.019) (0.128) (0.153)[0.021] [0.085]* [0.174]
Work for someone 9,454 0.365 0.028 -0.003 — — — — —(0.025) (0.145)[0.028] [0.171]
Work for family 9,454 0.025 -0.016 -0.095 — — — — —(0.012) (0.079)[0.014] [0.066]
Self-Employed 9,454 0.084 -0.028 -0.174 4,317 0.146 0.017 0.030 -0.060(0.019) (0.113) (0.021) (0.074) (0.125)[0.019] [0.065]** [0.018] [0.088] [0.160]
Unemployed 9,454 0.422 -0.008 0.201 4,317 0.113 0.013 0.086 -0.106(0.025) (0.172) (0.013) (0.064) (0.127)[0.030] [0.199] [0.016] [0.072] [0.127]
Inactive 9,454 0.103 0.024 0.071 4,317 0.244 0.004 0.018 0.227(0.009)** (0.059) (0.020) (0.085) (0.122)*[0.010]** [0.050] [0.015] [0.093] [0.152]
Hours worked (0) — — — — 4,317 27.74 -1.104 -9.328 -8.496(1.373) (5.711) (8.943)[1.389] [5.361] [9.934]
Hours worked — — — — 2,706 44.26 -0.175 3.336 -8.778(1.269) (5.431) (9.371)[1.093] [4.643] [11.659]
Controls Yes Yes Yes Yes Yes
Notes: Standard errors clustered at the village of residence are in parentheses. Standard errors clustered at themunicipality level are in brackets. * significant at 10%; ** significant at 5%; *** significant at 1%. Controls include:conflict intensity (casualties/bomings), distance to the Albanian border, age, etnicity (albanian), dummies formarital status, dummies for educational attainment (low and medium), number of male and female adults in ahousehold aged 20-65, number of dependent members aged 0, 1-5, 6-10, 11-15, and 16-19, dummy for rural location,municipality labor-force participation in 1991 and proportion of Albanians in 1991. LSMS sample weights areused in all the regressions. Data source: 1999 Kosovo DSHS and 2000 Kosovo LSMS.
42
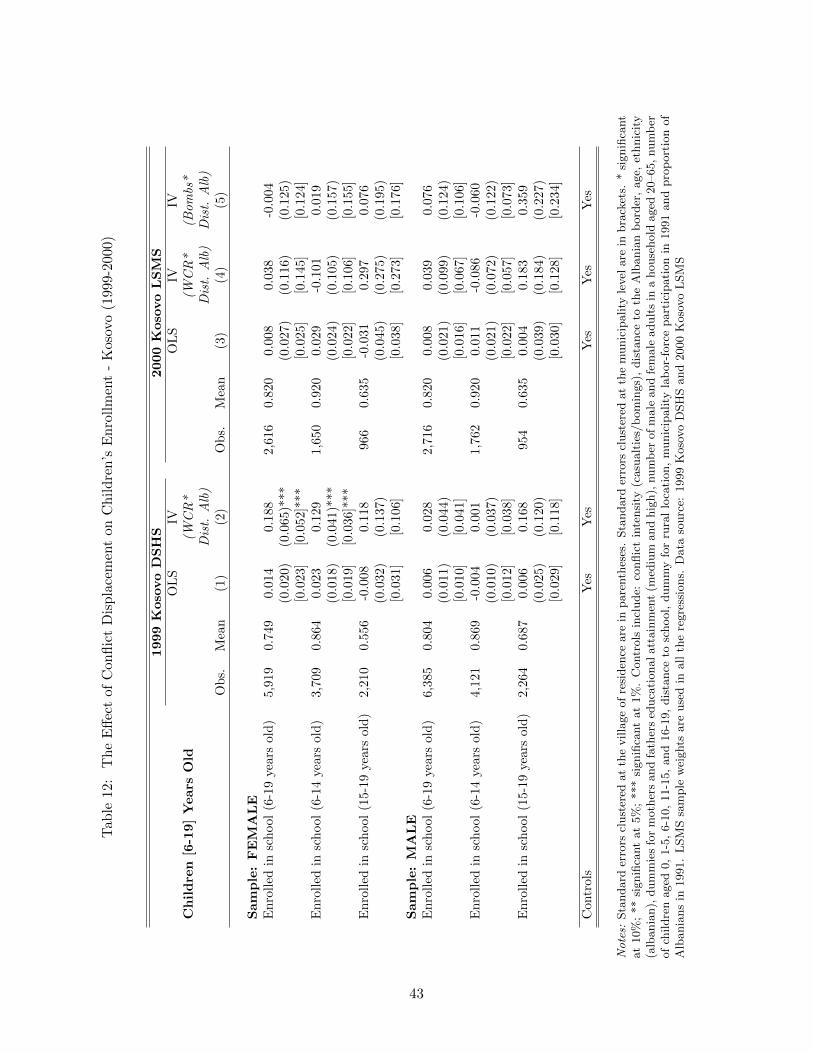
Tab
le12
:T
he
Eff
ect
ofC
onfl
ict
Dis
pla
cem
ent
onC
hil
dre
n’s
En
roll
men
t-
Kos
ovo
(1999-2
000)
1999
Koso
vo
DS
HS
2000
Koso
vo
LS
MS
OL
SIV
OL
SIV
IVC
hil
dre
n[6
-19]
Years
Old
(WC
R*
(WC
R*
(Bom
bs*
Dis
t.A
lb)
Dis
t.A
lb)
Dis
t.A
lb)
Ob
s.M
ean
(1)
(2)
Ob
s.M
ean
(3)
(4)
(5)
Sam
ple
:F
EM
AL
EE
nro
lled
insc
hool
(6-1
9ye
ars
old
)5,
919
0.7
49
0.0
14
0.1
88
2,6
16
0.8
20
0.0
08
0.0
38
-0.0
04
(0.0
20)
(0.0
65)*
**
(0.0
27)
(0.1
16)
(0.1
25)
[0.0
23]
[0.0
52]*
**
[0.0
25]
[0.1
45]
[0.1
24]
En
roll
edin
sch
ool
(6-1
4ye
ars
old
)3,
709
0.8
64
0.0
23
0.1
29
1,6
50
0.9
20
0.0
29
-0.1
01
0.0
19
(0.0
18)
(0.0
41)*
**
(0.0
24)
(0.1
05)
(0.1
57)
[0.0
19]
[0.0
36]*
**
[0.0
22]
[0.1
06]
[0.1
55]
En
roll
edin
sch
ool
(15-
19ye
ars
old
)2,
210
0.5
56
-0.0
08
0.1
18
966
0.6
35
-0.0
31
0.2
97
0.0
76
(0.0
32)
(0.1
37)
(0.0
45)
(0.2
75)
(0.1
95)
[0.0
31]
[0.1
06]
[0.0
38]
[0.2
73]
[0.1
76]
Sam
ple
:M
AL
EE
nro
lled
insc
hool
(6-1
9ye
ars
old
)6,
385
0.8
04
0.0
06
0.0
28
2,7
16
0.8
20
0.0
08
0.0
39
0.0
76
(0.0
11)
(0.0
44)
(0.0
21)
(0.0
99)
(0.1
24)
[0.0
10]
[0.0
41]
[0.0
16]
[0.0
67]
[0.1
06]
En
roll
edin
sch
ool
(6-1
4ye
ars
old
)4,
121
0.8
69
-0.0
04
0.0
01
1,7
62
0.9
20
0.0
11
-0.0
86
-0.0
60
(0.0
10)
(0.0
37)
(0.0
21)
(0.0
72)
(0.1
22)
[0.0
12]
[0.0
38]
[0.0
22]
[0.0
57]
[0.0
73]
En
roll
edin
sch
ool
(15-
19ye
ars
old
)2,
264
0.6
87
0.0
06
0.1
68
954
0.6
35
0.0
04
0.1
83
0.3
59
(0.0
25)
(0.1
20)
(0.0
39)
(0.1
84)
(0.2
27)
[0.0
29]
[0.1
18]
[0.0
30]
[0.1
28]
[0.2
34]
Con
trol
sY
esY
esY
esY
esY
es
No
tes:
Sta
ndard
erro
rscl
ust
ered
at
the
villa
ge
of
resi
den
ceare
inpare
nth
eses
.Sta
ndard
erro
rscl
ust
ered
at
the
munic
ipality
level
are
inbra
cket
s.*
signifi
cant
at
10%
;**
signifi
cant
at
5%
;***
signifi
cant
at
1%
.C
ontr
ols
incl
ude:
conflic
tin
tensi
ty(c
asu
alt
ies/
bom
ings)
,dis
tance
toth
eA
lbania
nb
ord
er,
age,
ethnic
ity
(alb
ania
n),
dum
mie
sfo
rm
oth
ers
and
fath
ers
educa
tionalatt
ain
men
t(m
ediu
mand
hig
h),
num
ber
of
male
and
fem
ale
adult
sin
ahouse
hold
aged
20–65,
num
ber
of
childre
naged
0,
1-5
,6-1
0,
11-1
5,
and
16-1
9,
dis
tance
tosc
hool,
dum
my
for
rura
llo
cati
on,
munic
ipality
lab
or-
forc
epart
icip
ati
on
in1991
and
pro
port
ion
of
Alb
ania
ns
in1991.
LSM
Ssa
mple
wei
ghts
are
use
din
all
the
regre
ssio
ns.
Data
sourc
e:1999
Koso
vo
DSH
Sand
2000
Koso
vo
LSM
S
43
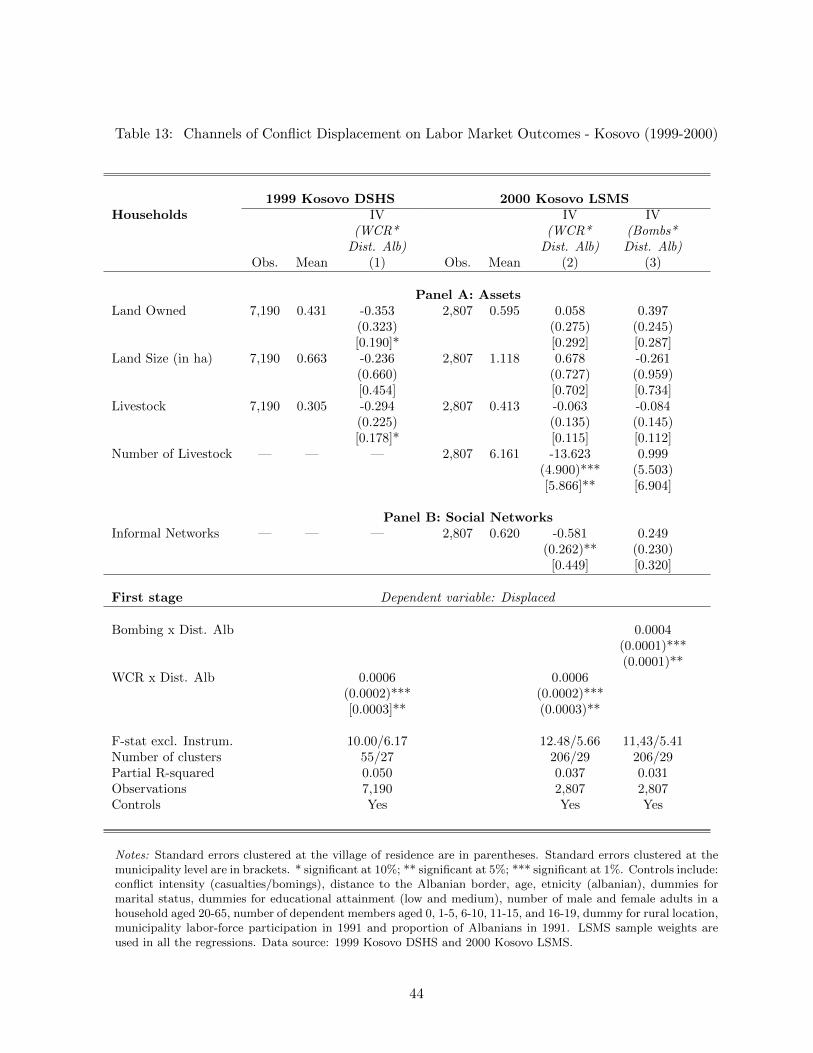
Table 13: Channels of Conflict Displacement on Labor Market Outcomes - Kosovo (1999-2000)
1999 Kosovo DSHS 2000 Kosovo LSMSHouseholds IV IV IV
(WCR* (WCR* (Bombs*Dist. Alb) Dist. Alb) Dist. Alb)
Obs. Mean (1) Obs. Mean (2) (3)
Panel A: AssetsLand Owned 7,190 0.431 -0.353 2,807 0.595 0.058 0.397
(0.323) (0.275) (0.245)[0.190]* [0.292] [0.287]
Land Size (in ha) 7,190 0.663 -0.236 2,807 1.118 0.678 -0.261(0.660) (0.727) (0.959)[0.454] [0.702] [0.734]
Livestock 7,190 0.305 -0.294 2,807 0.413 -0.063 -0.084(0.225) (0.135) (0.145)[0.178]* [0.115] [0.112]
Number of Livestock — — — 2,807 6.161 -13.623 0.999(4.900)*** (5.503)[5.866]** [6.904]
Panel B: Social NetworksInformal Networks — — — 2,807 0.620 -0.581 0.249
(0.262)** (0.230)[0.449] [0.320]
First stage Dependent variable: Displaced
Bombing x Dist. Alb 0.0004(0.0001)***(0.0001)**
WCR x Dist. Alb 0.0006 0.0006(0.0002)*** (0.0002)***[0.0003]** (0.0003)**
F-stat excl. Instrum. 10.00/6.17 12.48/5.66 11,43/5.41Number of clusters 55/27 206/29 206/29Partial R-squared 0.050 0.037 0.031Observations 7,190 2,807 2,807Controls Yes Yes Yes
Notes: Standard errors clustered at the village of residence are in parentheses. Standard errors clustered at themunicipality level are in brackets. * significant at 10%; ** significant at 5%; *** significant at 1%. Controls include:conflict intensity (casualties/bomings), distance to the Albanian border, age, etnicity (albanian), dummies formarital status, dummies for educational attainment (low and medium), number of male and female adults in ahousehold aged 20-65, number of dependent members aged 0, 1-5, 6-10, 11-15, and 16-19, dummy for rural location,municipality labor-force participation in 1991 and proportion of Albanians in 1991. LSMS sample weights areused in all the regressions. Data source: 1999 Kosovo DSHS and 2000 Kosovo LSMS.
44
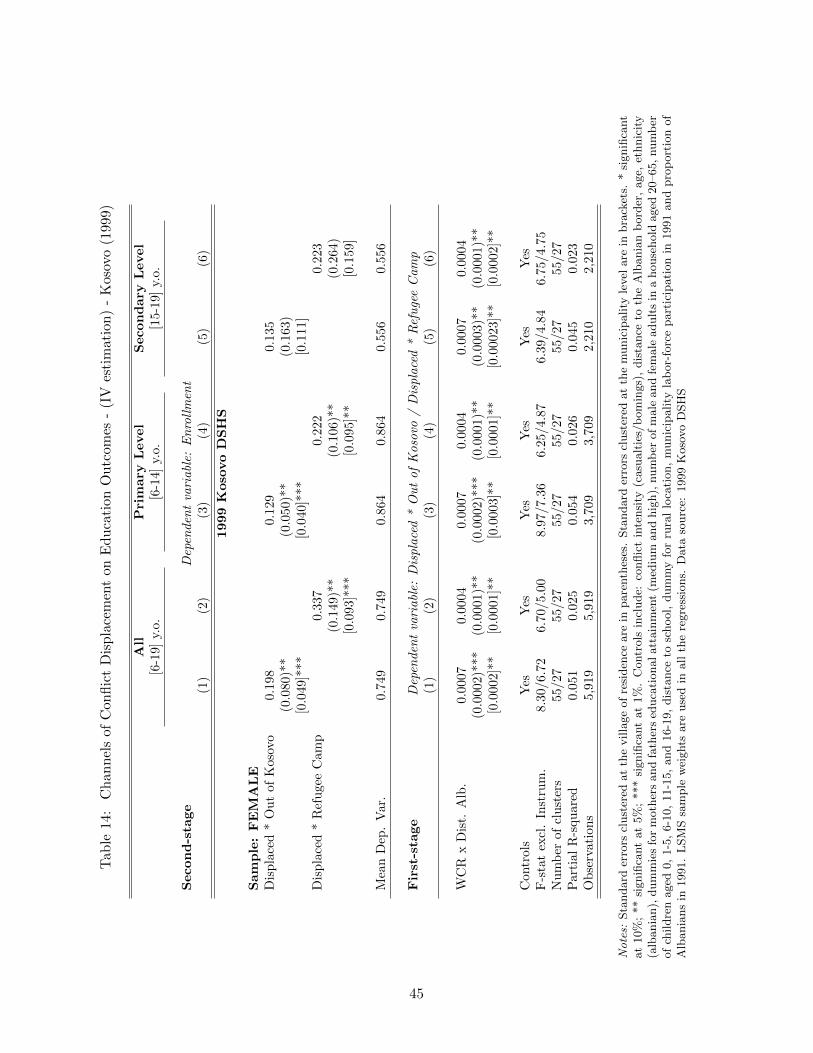
Tab
le14
:C
han
nel
sof
Con
flic
tD
isp
lace
men
ton
Edu
cati
onO
utc
omes
-(I
Ves
tim
atio
n)
-K
oso
vo(1
999)
All
Pri
mary
Level
Secon
dary
Level
[6-1
9]
y.o.
[6-1
4]
y.o.
[15-1
9]
y.o.
Secon
d-s
tage
Dep
enden
tva
riabl
e:E
nro
llm
ent
(1)
(2)
(3)
(4)
(5)
(6)
1999
Koso
vo
DS
HS
Sam
ple
:F
EM
AL
ED
isp
lace
d*
Ou
tof
Kos
ovo
0.19
80.1
29
0.1
35
(0.0
80)*
*(0
.050)*
*(0
.163)
[0.0
49]*
**
[0.0
40]*
**
[0.1
11]
Dis
pla
ced
*R
efu
gee
Cam
p0.3
37
0.2
22
0.2
23
(0.1
49)*
*(0
.106)*
*(0
.264)
[0.0
93]*
**
[0.0
95]*
*[0
.159]
Mea
nD
ep.
Var
.0.
749
0.7
49
0.8
64
0.8
64
0.5
56
0.5
56
Fir
st-s
tage
Dep
enden
tva
riabl
e:D
ispla
ced
*O
ut
of
Koso
vo/
Dis
pla
ced
*R
efu
gee
Cam
p(1
)(2
)(3
)(4
)(5
)(6
)
WC
Rx
Dis
t.A
lb.
0.00
07
0.0
004
0.0
007
0.0
004
0.0
007
0.0
004
(0.0
002)*
**
(0.0
001)*
*(0
.0002)*
**
(0.0
001)*
*(0
.0003)*
*(0
.0001)*
*[0
.000
2]*
*[0
.0001]*
*[0
.0003]*
*[0
.0001]*
*[0
.00023]*
*[0
.0002]*
*
Con
trol
sY
esY
esY
esY
esY
esY
esF
-sta
tex
cl.
Inst
rum
.8.
30/6
.72
6.7
0/5.0
08.9
7/7.3
66.2
5/4.8
76.3
9/4.8
46.7
5/4.7
5N
um
ber
ofcl
ust
ers
55/2
755/27
55/27
55/27
55/27
55/27
Par
tial
R-s
quar
ed0.
051
0.0
25
0.0
54
0.0
26
0.0
45
0.0
23
Ob
serv
atio
ns
5,91
95,9
19
3,7
09
3,7
09
2,2
10
2,2
10
No
tes:
Sta
ndard
erro
rscl
ust
ered
at
the
villa
ge
of
resi
den
ceare
inpare
nth
eses
.Sta
ndard
erro
rscl
ust
ered
at
the
munic
ipality
level
are
inbra
cket
s.*
signifi
cant
at
10%
;**
signifi
cant
at
5%
;***
signifi
cant
at
1%
.C
ontr
ols
incl
ude:
conflic
tin
tensi
ty(c
asu
alt
ies/
bom
ings)
,dis
tance
toth
eA
lbania
nb
ord
er,
age,
ethnic
ity
(alb
ania
n),
dum
mie
sfo
rm
oth
ers
and
fath
ers
educa
tionalatt
ain
men
t(m
ediu
mand
hig
h),
num
ber
of
male
and
fem
ale
adult
sin
ahouse
hold
aged
20–65,
num
ber
of
childre
naged
0,
1-5
,6-1
0,
11-1
5,
and
16-1
9,
dis
tance
tosc
hool,
dum
my
for
rura
llo
cati
on,
munic
ipality
lab
or-
forc
epart
icip
ati
on
in1991
and
pro
port
ion
of
Alb
ania
ns
in1991.
LSM
Ssa
mple
wei
ghts
are
use
din
all
the
regre
ssio
ns.
Data
sourc
e:1999
Koso
vo
DSH
S
45

APPENDIX
46
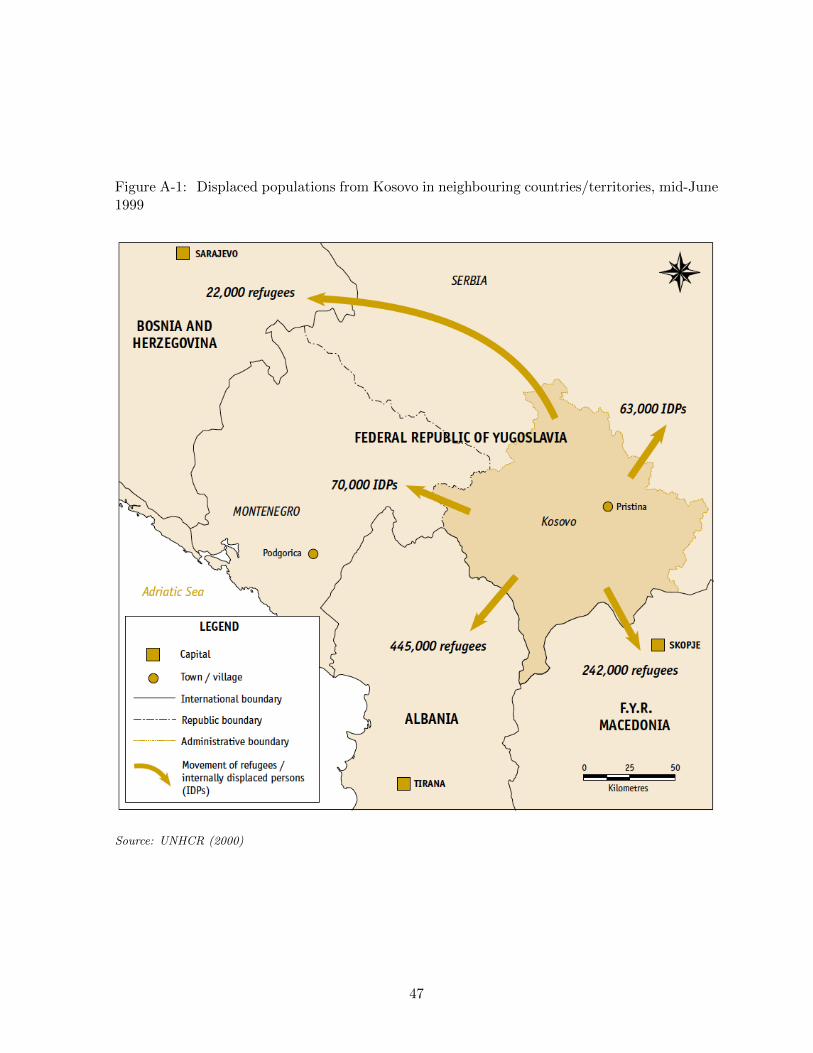
Figure A-1: Displaced populations from Kosovo in neighbouring countries/territories, mid-June1999
Source: UNHCR (2000)
47
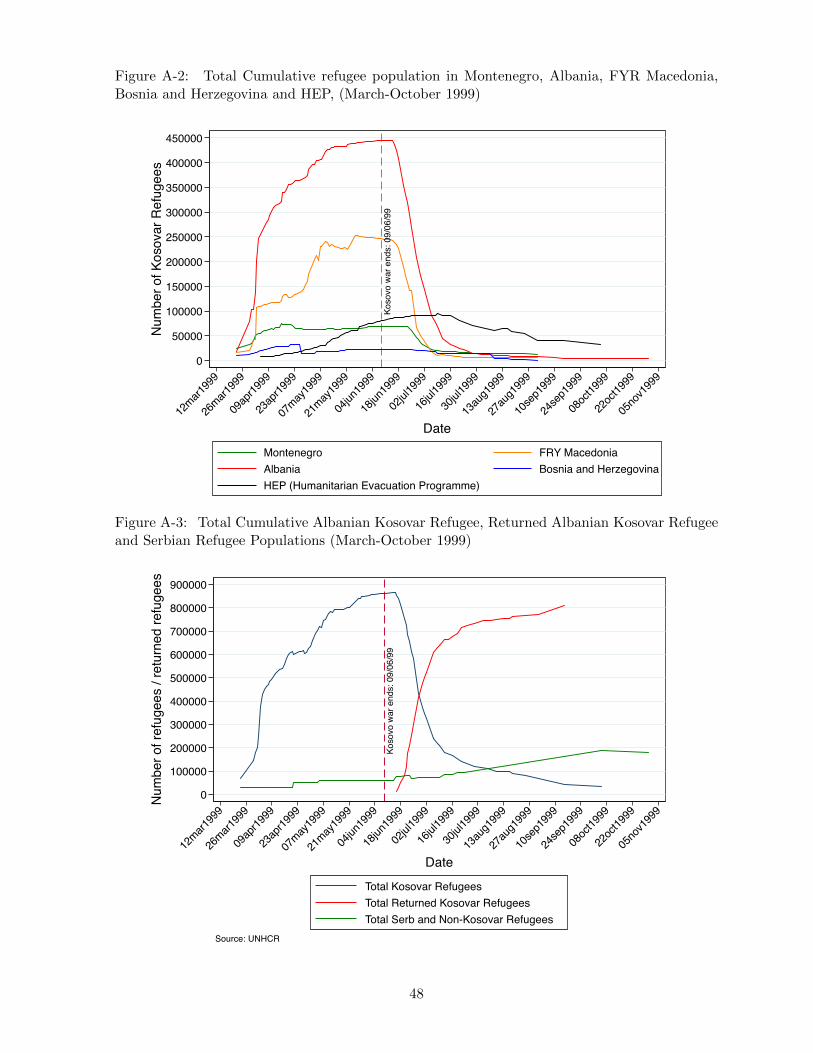
Figure A-2: Total Cumulative refugee population in Montenegro, Albania, FYR Macedonia,Bosnia and Herzegovina and HEP, (March-October 1999)
Koso
vo w
ar e
nds:
09/
06/9
9
0
50000
100000
150000
200000
250000
300000
350000
400000
450000N
umbe
r of K
osov
ar R
efug
ees
12mar1
999
26mar1
999
09ap
r1999
23ap
r1999
07may
1999
21may
1999
04jun
1999
18jun
1999
02jul1
999
16jul1
999
30jul1
999
13au
g199
9
27au
g199
9
10se
p199
9
24se
p199
9
08oc
t1999
22oc
t1999
05no
v199
9
DateMontenegro FRY MacedoniaAlbania Bosnia and HerzegovinaHEP (Humanitarian Evacuation Programme)
Figure A-3: Total Cumulative Albanian Kosovar Refugee, Returned Albanian Kosovar Refugeeand Serbian Refugee Populations (March-October 1999)
Koso
vo w
ar e
nds:
09/
06/9
9
0
100000
200000
300000
400000
500000
600000
700000
800000
900000
Num
ber o
f ref
ugee
s / r
etur
ned
refu
gees
12mar1
999
26mar1
999
09ap
r1999
23ap
r1999
07may
1999
21may
1999
04jun
1999
18jun
1999
02jul1
999
16jul1
999
30jul1
999
13au
g199
9
27au
g199
9
10se
p199
9
24se
p199
9
08oc
t1999
22oc
t1999
05no
v199
9
DateTotal Kosovar RefugeesTotal Returned Kosovar RefugeesTotal Serb and Non-Kosovar Refugees
Source: UNHCR
48
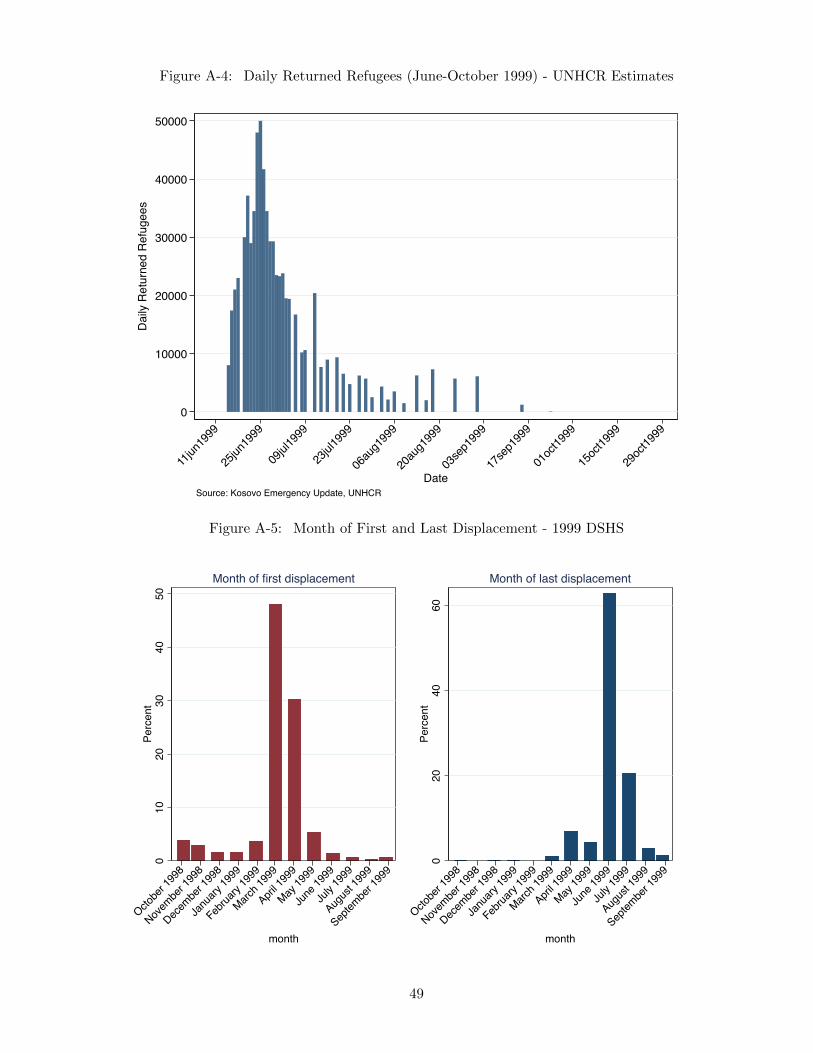
Figure A-4: Daily Returned Refugees (June-October 1999) - UNHCR Estimates
0
10000
20000
30000
40000
50000D
aily
Ret
urne
d R
efug
ees
11jun
1999
25jun
1999
09jul1
999
23jul1
999
06au
g199
9
20au
g199
9
03se
p199
9
17se
p199
9
01oc
t1999
15oc
t1999
29oc
t1999
DateSource: Kosovo Emergency Update, UNHCR
Figure A-5: Month of First and Last Displacement - 1999 DSHS
010
2030
4050
Perc
ent
Octobe
r 199
8
Novem
ber 1
998
Decem
ber 1
998
Janu
ary 19
99
Februa
ry 19
99
March 1
999
April 1
999
May 19
99
June
1999
July 1
999
Augus
t 199
9
Septem
ber 1
999
month
Month of first displacement
020
4060
Perc
ent
Octobe
r 199
8
Novem
ber 1
998
Decem
ber 1
998
Janu
ary 19
99
Februa
ry 19
99
March 1
999
April 1
999
May 19
99
June
1999
July 1
999
Augus
t 199
9
Septem
ber 1
999
month
Month of last displacement
49
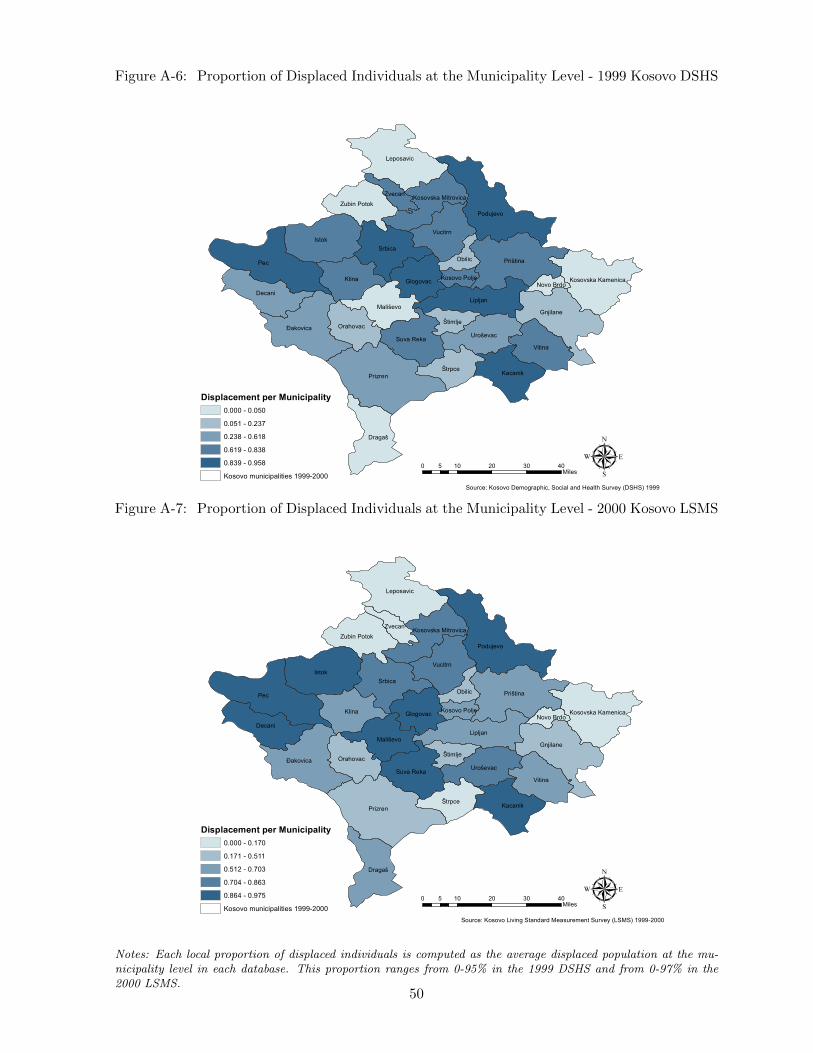
Figure A-6: Proportion of Displaced Individuals at the Municipality Level - 1999 Kosovo DSHS
Pec
Prizren
Istok
Priš tin a
Podujevo
Lipljan
Klin a
Gn jilan e
Srbica
V itin a
Ðakovica
Leposavic
V ucitrn
Dragaš
Decan i
Kacan ikŠtrpce
Uroševac
Mališ evo
Suva Reka
Glogovac
Orahovac
Zubin Potok
Kosovska Kam en ica
Štim lje
Obilic
Kosovska MitrovicaZvecan
Novo BrdoKosovo Polje
µ0 10 20 30 405Miles
Displacement per Municipality0.000 - 0.0500.051 - 0.2370.238 - 0.6180.619 - 0.8380.839 - 0.958Kosovo m un icipalities 1999-2000
Source: Kosovo Dem ograph ic, Social an d Health Survey (DSHS) 1999
Figure A-7: Proportion of Displaced Individuals at the Municipality Level - 2000 Kosovo LSMS
Pec
Prizren
Isto k
Priština
Po dujevo
Lip lja n
Klina
Gnjila ne
Srbica
Vitina
Ð a k o vica
Lep o sa vic
Vucitrn
Dra ga š
Deca ni
Ka ca nikŠtrp ce
Uro ševa c
Ma liševo
Suva Rek a
Glogo va c
Ora ho va c
Zubin Po to k
Ko so vsk a Ka menica
Štimlje
Obilic
Ko so vsk a Mitro vicaZveca n
No vo BrdoKo so vo Polje
µ0 10 20 30 405Miles
Displacement per Municipality0.000 - 0.1700.171 - 0.5110.512 - 0.7030.704 - 0.8630.864 - 0.975Ko so vo municip a lities 1999-2000
So urce: Ko so vo Living Sta nda rd Mea surement Survey (LSMS) 1999-2000
Notes: Each local proportion of displaced individuals is computed as the average displaced population at the mu-nicipality level in each database. This proportion ranges from 0-95% in the 1999 DSHS and from 0-97% in the2000 LSMS.
50
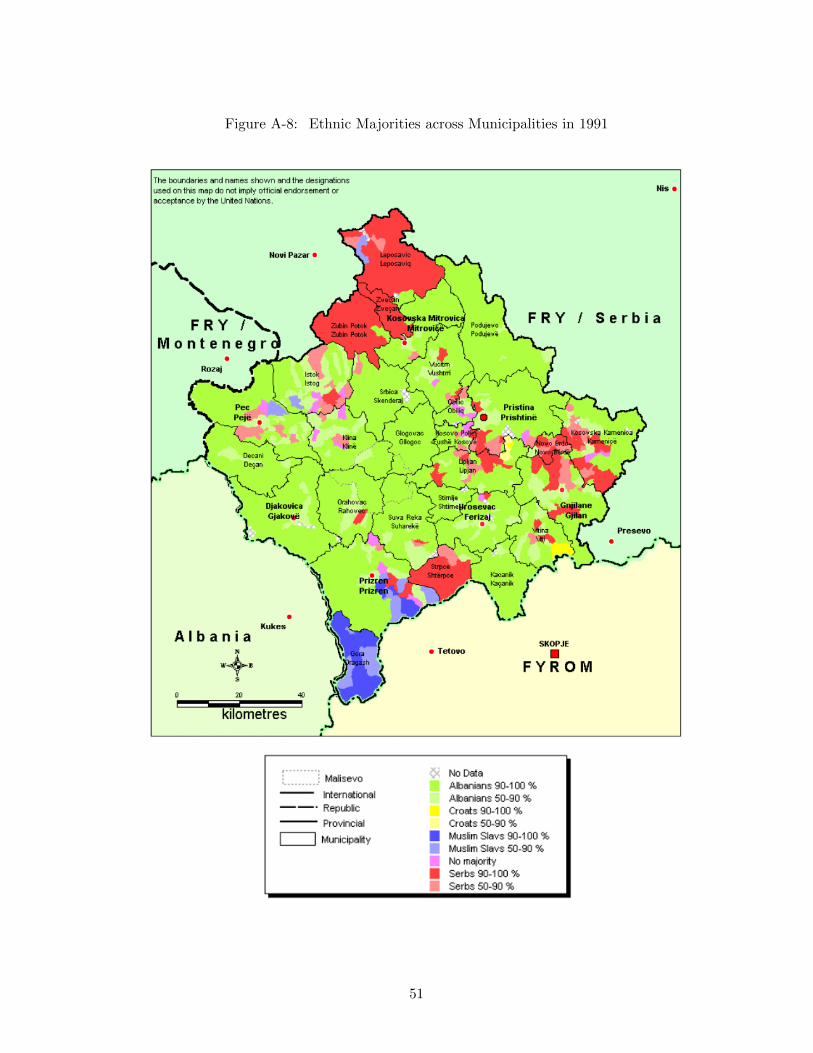
Figure A-8: Ethnic Majorities across Municipalities in 1991
51
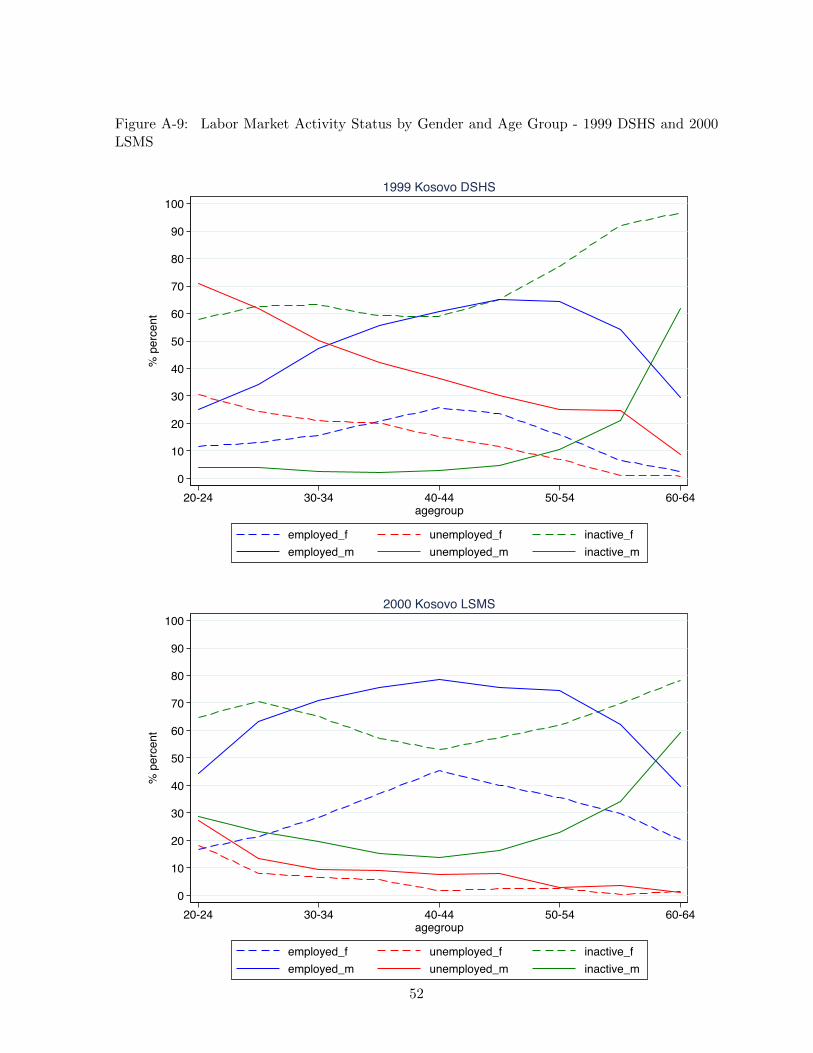
Figure A-9: Labor Market Activity Status by Gender and Age Group - 1999 DSHS and 2000LSMS
0
10
20
30
40
50
60
70
80
90
100
% p
erce
nt
20-24 30-34 40-44 50-54 60-64agegroup
employed_f unemployed_f inactive_femployed_m unemployed_m inactive_m
1999 Kosovo DSHS
0
10
20
30
40
50
60
70
80
90
100
% p
erce
nt
20-24 30-34 40-44 50-54 60-64agegroup
employed_f unemployed_f inactive_femployed_m unemployed_m inactive_m
2000 Kosovo LSMS
52
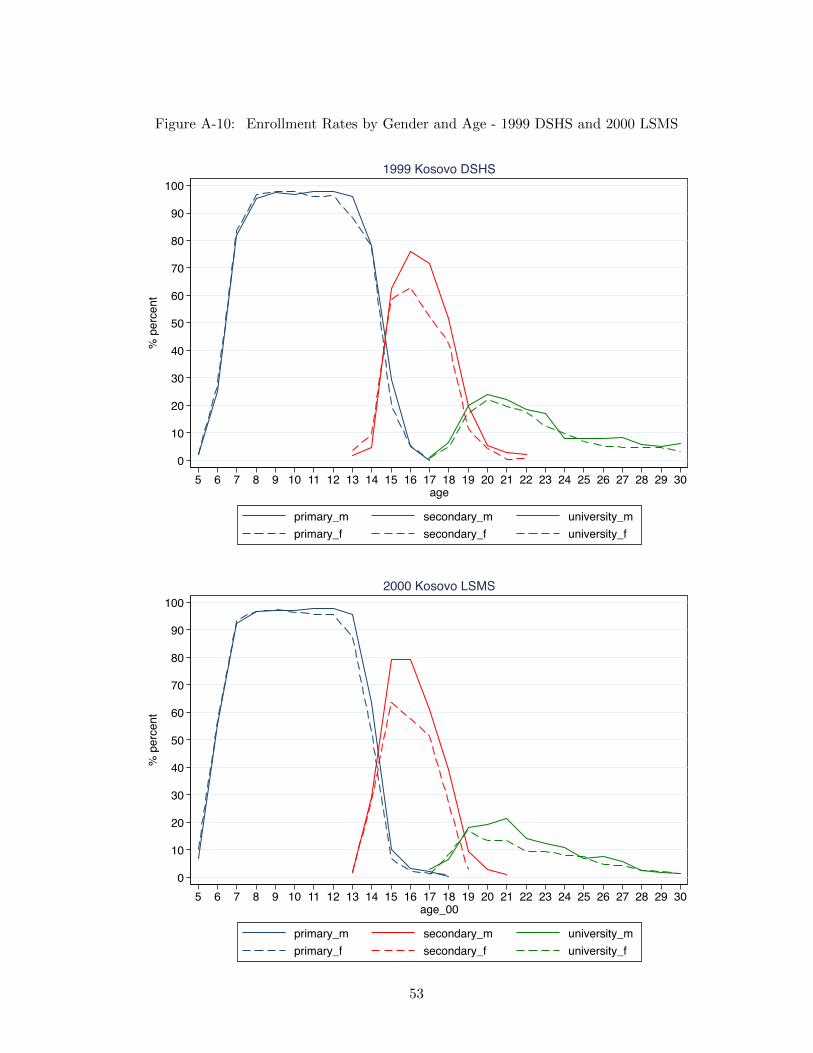
Figure A-10: Enrollment Rates by Gender and Age - 1999 DSHS and 2000 LSMS
0
10
20
30
40
50
60
70
80
90
100
% p
erce
nt
5 6 7 8 9 10 11 12 13 14 15 16 17 18 19 20 21 22 23 24 25 26 27 28 29 30age
primary_m secondary_m university_mprimary_f secondary_f university_f
1999 Kosovo DSHS
0
10
20
30
40
50
60
70
80
90
100
% p
erce
nt
5 6 7 8 9 10 11 12 13 14 15 16 17 18 19 20 21 22 23 24 25 26 27 28 29 30age_00
primary_m secondary_m university_mprimary_f secondary_f university_f
2000 Kosovo LSMS
53
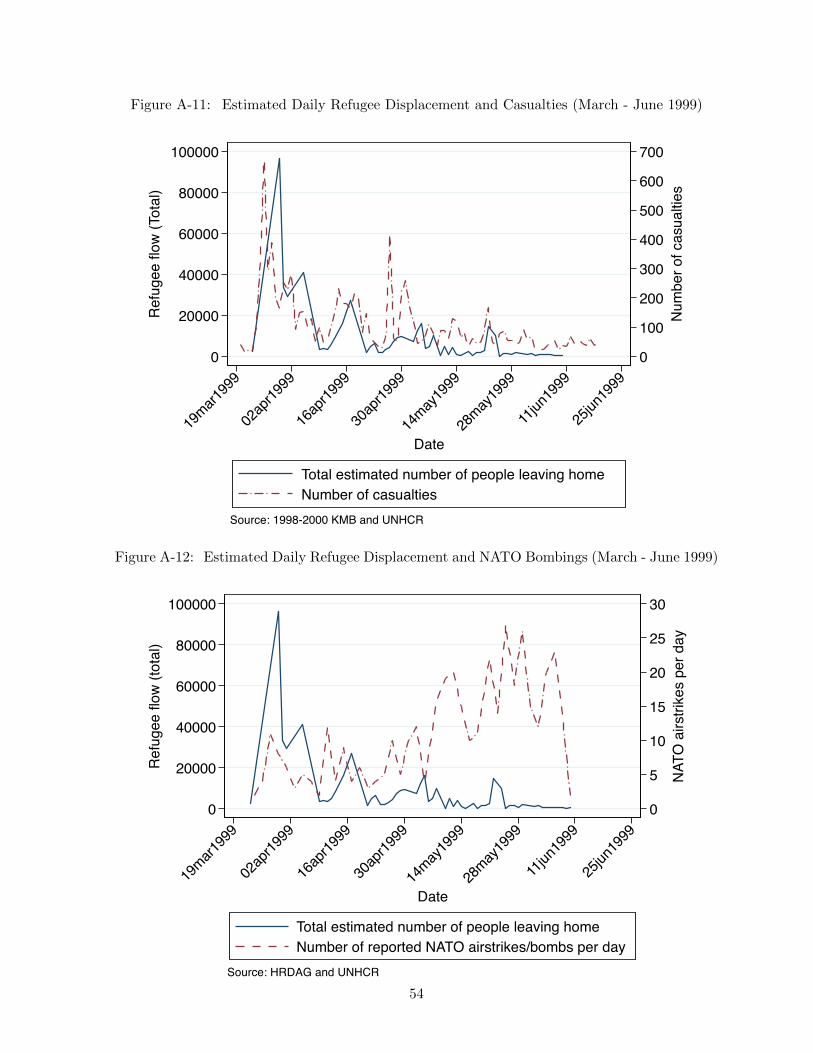
Figure A-11: Estimated Daily Refugee Displacement and Casualties (March - June 1999)
0
100
200
300
400
500
600
700
Num
ber o
f cas
ualti
es
0
20000
40000
60000
80000
100000R
efug
ee fl
ow (T
otal
)
19mar1
999
02ap
r1999
16ap
r1999
30ap
r1999
14may
1999
28may
1999
11jun
1999
25jun
1999
Date
Total estimated number of people leaving homeNumber of casualties
Source: 1998-2000 KMB and UNHCR
Figure A-12: Estimated Daily Refugee Displacement and NATO Bombings (March - June 1999)
0
5
10
15
20
25
30
NATO
airs
trike
s pe
r day
0
20000
40000
60000
80000
100000
Refu
gee
flow
(tota
l)
19mar1
999
02ap
r1999
16ap
r1999
30ap
r1999
14may
1999
28may
1999
11jun
1999
25jun
1999
Date
Total estimated number of people leaving homeNumber of reported NATO airstrikes/bombs per day
Source: HRDAG and UNHCR
54
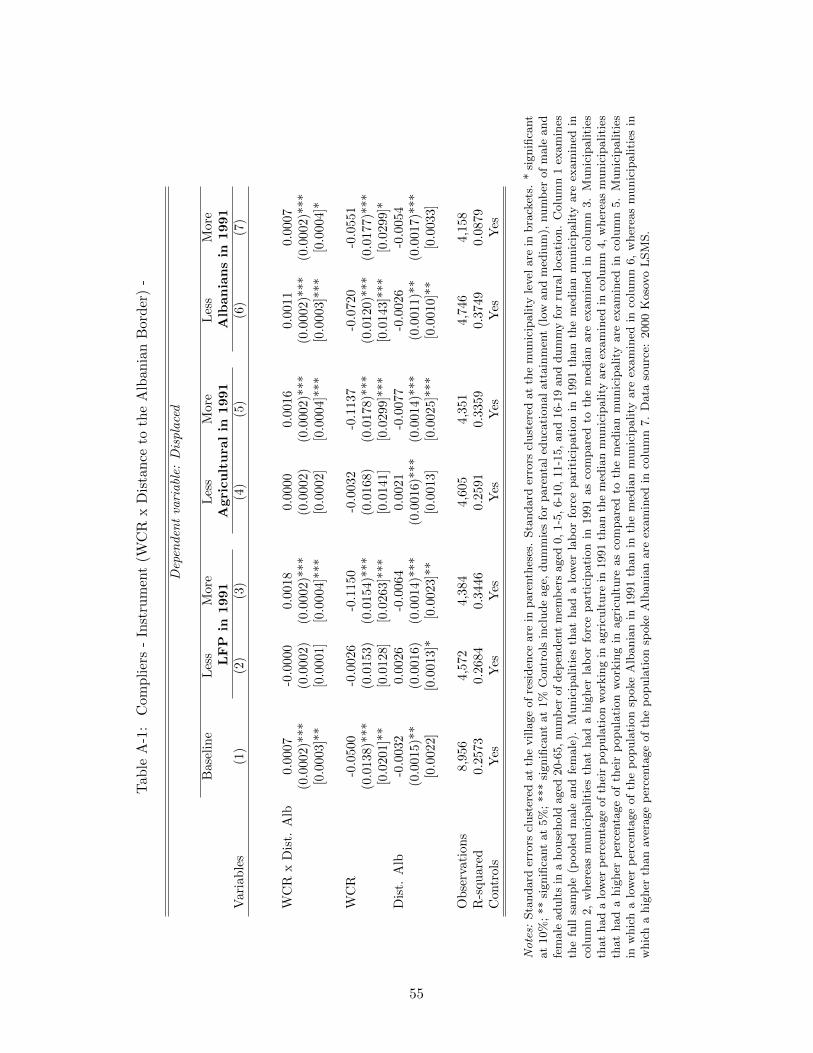
Tab
leA
-1:
Com
pli
ers
-In
stru
men
t(W
CR
xD
ista
nce
toth
eA
lban
ian
Bor
der
)-
Dep
enden
tva
riabl
e:D
ispla
ced
Bas
elin
eL
ess
More
Les
sM
ore
Les
sM
ore
LF
Pin
1991
Agri
cu
ltu
ral
in1991
Alb
an
ian
sin
1991
Var
iab
les
(1)
(2)
(3)
(4)
(5)
(6)
(7)
WC
Rx
Dis
t.A
lb0.
0007
-0.0
000
0.0
018
0.0
000
0.0
016
0.0
011
0.0
007
(0.0
002)
***
(0.0
002)
(0.0
002)*
**
(0.0
002)
(0.0
002)*
**
(0.0
002)*
**
(0.0
002)*
**
[0.0
003]
**[0
.0001]
[0.0
004]*
**
[0.0
002]
[0.0
004]*
**
[0.0
003
]***
[0.0
004]*
WC
R-0
.050
0-0
.0026
-0.1
150
-0.0
032
-0.1
137
-0.0
720
-0.0
551
(0.0
138)
***
(0.0
153)
(0.0
154)*
**
(0.0
168)
(0.0
178)*
**
(0.0
120)*
**
(0.0
177)*
**
[0.0
201]
**[0
.0128]
[0.0
263]*
**
[0.0
141]
[0.0
299]*
**
[0.0
143
]***
[0.0
299]*
Dis
t.A
lb-0
.003
20.0
026
-0.0
064
0.0
021
-0.0
077
-0.0
026
-0.0
054
(0.0
015)
**(0
.0016)
(0.0
014)*
**
(0.0
016)*
**
(0.0
014)*
**
(0.0
011)*
*(0
.0017)*
**
[0.0
022]
[0.0
013]*
[0.0
023]*
*[0
.0013]
[0.0
025]*
**
[0.0
010]*
*[0
.0033]
Ob
serv
atio
ns
8,95
64,5
72
4,3
84
4,6
05
4,3
51
4,7
46
4,1
58
R-s
qu
ared
0.25
730.2
684
0.3
446
0.2
591
0.3
359
0.3
749
0.0
879
Con
trol
sY
esY
esY
esY
esY
esY
esY
es
No
tes:
Sta
ndard
erro
rscl
ust
ered
at
the
villa
ge
of
resi
den
ceare
inpare
nth
eses
.Sta
ndard
erro
rscl
ust
ered
at
the
munic
ipality
level
are
inbra
cket
s.*
signifi
cant
at
10%
;**
signifi
cant
at
5%
;***
signifi
cant
at
1%
Contr
ols
incl
ude
age,
dum
mie
sfo
rpare
nta
led
uca
tional
att
ain
men
t(l
owand
med
ium
),num
ber
of
male
and
fem
ale
adult
sin
ahouse
hold
aged
20-6
5,
num
ber
of
dep
enden
tm
emb
ers
aged
0,
1-5
,6-1
0,
11-1
5,
and
16-1
9and
dum
my
for
rura
llo
cati
on.
Colu
mn
1ex
am
ines
the
full
sam
ple
(poole
dm
ale
and
fem
ale
).M
unic
ipaliti
esth
at
had
alo
wer
lab
or
forc
epari
tici
pati
on
in1991
than
the
med
ian
munic
ipality
are
exam
ined
inco
lum
n2,
wher
eas
munic
ipaliti
esth
at
had
ahig
her
lab
or
forc
epart
icip
ati
on
in1991
as
com
pare
dto
the
med
ian
are
exam
ined
inco
lum
n3.
Munic
ipaliti
esth
at
had
alo
wer
per
centa
ge
of
thei
rp
opula
tion
work
ing
inagri
cult
ure
in1991
than
the
med
ian
munic
ipality
are
exam
ined
inco
lum
n4,
wher
eas
munic
ipaliti
esth
at
had
ahig
her
per
centa
ge
of
thei
rp
opula
tion
work
ing
inagri
cult
ure
as
com
pare
dto
the
med
ian
munic
ipality
are
exam
ined
inco
lum
n5.
Munic
ipaliti
esin
whic
ha
low
erp
erce
nta
ge
of
the
popula
tion
spoke
Alb
ania
nin
1991
than
inth
em
edia
nm
unic
ipality
are
exam
ined
inco
lum
n6,
wher
eas
munic
ipaliti
esin
whic
ha
hig
her
than
aver
age
per
centa
ge
of
the
popula
tion
spoke
Alb
ania
nare
exam
ined
inco
lum
n7.
Data
sourc
e:2000
Koso
vo
LSM
S.
55
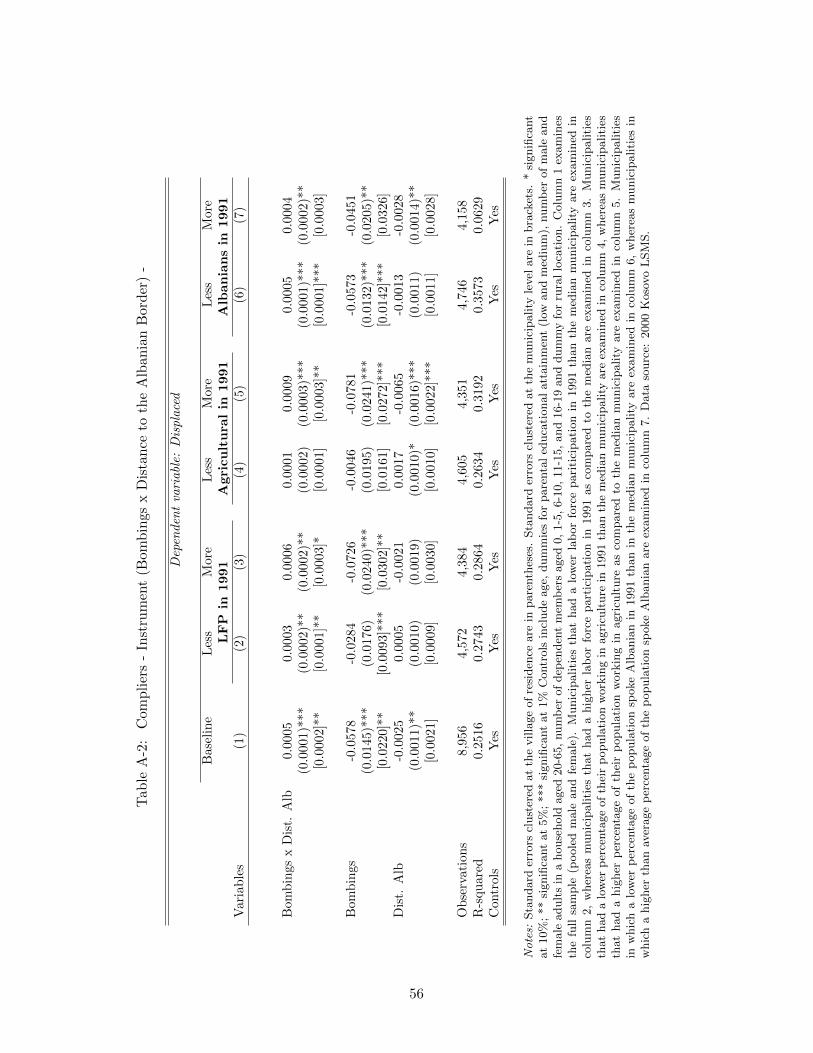
Tab
leA
-2:
Com
pli
ers
-In
stru
men
t(B
omb
ings
xD
ista
nce
toth
eA
lban
ian
Bor
der
)-
Dep
enden
tva
riabl
e:D
ispla
ced
Bas
elin
eL
ess
More
Les
sM
ore
Les
sM
ore
LF
Pin
1991
Agri
cu
ltu
ral
in1991
Alb
an
ian
sin
1991
Var
iab
les
(1)
(2)
(3)
(4)
(5)
(6)
(7)
Bom
bin
gsx
Dis
t.A
lb0.
0005
0.0
003
0.0
006
0.0
001
0.0
009
0.0
005
0.0
004
(0.0
001)
***
(0.0
002)*
*(0
.0002)*
*(0
.0002)
(0.0
003)*
**
(0.0
001)*
**
(0.0
002)*
*[0
.000
2]**
[0.0
001]*
*[0
.0003]*
[0.0
001]
[0.0
003]*
*[0
.0001]*
**
[0.0
003]
Bom
bin
gs-0
.0578
-0.0
284
-0.0
726
-0.0
046
-0.0
781
-0.0
573
-0.0
451
(0.0
145)
***
(0.0
176)
(0.0
240)*
**
(0.0
195)
(0.0
241)*
**
(0.0
132)*
**
(0.0
205)*
*[0
.022
0]**
[0.0
093]*
**
[0.0
302]*
*[0
.0161]
[0.0
272]*
**
[0.0
142]*
**
[0.0
326]
Dis
t.A
lb-0
.002
50.0
005
-0.0
021
0.0
017
-0.0
065
-0.0
013
-0.0
028
(0.0
011)
**(0
.0010)
(0.0
019)
(0.0
010)*
(0.0
016)*
**
(0.0
011)
(0.0
014)*
*[0
.002
1][0
.0009]
[0.0
030]
[0.0
010]
[0.0
022]*
**
[0.0
011]
[0.0
028]
Ob
serv
atio
ns
8,95
64,5
72
4,3
84
4,6
05
4,3
51
4,7
46
4,1
58
R-s
qu
ared
0.25
160.2
743
0.2
864
0.2
634
0.3
192
0.3
573
0.0
629
Con
trol
sY
esY
esY
esY
esY
esY
esY
es
No
tes:
Sta
ndard
erro
rscl
ust
ered
at
the
villa
ge
of
resi
den
ceare
inpare
nth
eses
.Sta
ndard
erro
rscl
ust
ered
at
the
munic
ipality
level
are
inbra
cket
s.*
signifi
cant
at
10%
;**
signifi
cant
at
5%
;***
signifi
cant
at
1%
Contr
ols
incl
ude
age,
dum
mie
sfo
rpare
nta
led
uca
tional
att
ain
men
t(l
owand
med
ium
),num
ber
of
male
and
fem
ale
adult
sin
ahouse
hold
aged
20-6
5,
num
ber
of
dep
enden
tm
emb
ers
aged
0,
1-5
,6-1
0,
11-1
5,
and
16-1
9and
dum
my
for
rura
llo
cati
on.
Colu
mn
1ex
am
ines
the
full
sam
ple
(poole
dm
ale
and
fem
ale
).M
unic
ipaliti
esth
at
had
alo
wer
lab
or
forc
epari
tici
pati
on
in1991
than
the
med
ian
munic
ipality
are
exam
ined
inco
lum
n2,
wher
eas
munic
ipaliti
esth
at
had
ahig
her
lab
or
forc
epart
icip
ati
on
in1991
as
com
pare
dto
the
med
ian
are
exam
ined
inco
lum
n3.
Munic
ipaliti
esth
at
had
alo
wer
per
centa
ge
of
thei
rp
opula
tion
work
ing
inagri
cult
ure
in1991
than
the
med
ian
munic
ipality
are
exam
ined
inco
lum
n4,
wher
eas
munic
ipaliti
esth
at
had
ahig
her
per
centa
ge
of
thei
rp
opula
tion
work
ing
inagri
cult
ure
as
com
pare
dto
the
med
ian
munic
ipality
are
exam
ined
inco
lum
n5.
Munic
ipaliti
esin
whic
ha
low
erp
erce
nta
ge
of
the
popula
tion
spoke
Alb
ania
nin
1991
than
inth
em
edia
nm
unic
ipality
are
exam
ined
inco
lum
n6,
wher
eas
munic
ipaliti
esin
whic
ha
hig
her
than
aver
age
per
centa
ge
of
the
popula
tion
spoke
Alb
ania
nare
exam
ined
inco
lum
n7.
Data
sourc
e:2000
Koso
vo
LSM
S.
56
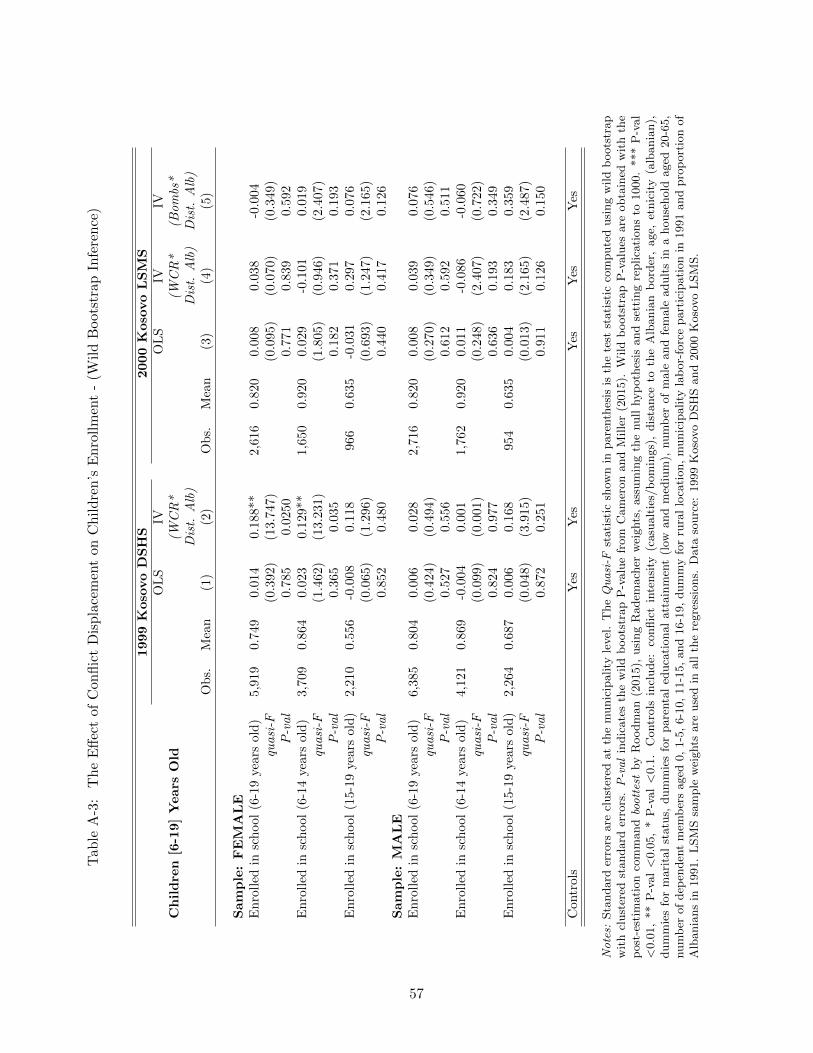
Tab
leA
-3:
Th
eE
ffec
tof
Con
flic
tD
isp
lace
men
ton
Ch
ild
ren
’sE
nro
llm
ent
-(W
ild
Boot
stra
pIn
fere
nce
)
1999
Koso
vo
DS
HS
2000
Koso
vo
LS
MS
OL
SIV
OL
SIV
IVC
hil
dre
n[6
-19]
Years
Old
(WC
R*
(WC
R*
(Bom
bs*
Dis
t.A
lb)
Dis
t.A
lb)
Dis
t.A
lb)
Ob
s.M
ean
(1)
(2)
Ob
s.M
ean
(3)
(4)
(5)
Sam
ple
:F
EM
AL
EE
nro
lled
insc
hool
(6-1
9ye
ars
old
)5,
919
0.7
49
0.0
14
0.1
88**
2,6
16
0.8
20
0.0
08
0.0
38
-0.0
04
quasi
-F(0
.392)
(13.7
47)
(0.0
95)
(0.0
70)
(0.3
49)
P-v
al
0.7
85
0.0
250
0.7
71
0.8
39
0.5
92
En
roll
edin
sch
ool
(6-1
4ye
ars
old
)3,
709
0.8
64
0.0
23
0.1
29**
1,6
50
0.9
20
0.0
29
-0.1
01
0.0
19
quasi
-F(1
.462)
(13.2
31)
(1.8
05)
(0.9
46)
(2.4
07)
P-v
al
0.3
65
0.0
35
0.1
82
0.3
71
0.1
93
En
roll
edin
sch
ool
(15-
19ye
ars
old
)2,
210
0.5
56
-0.0
08
0.1
18
966
0.6
35
-0.0
31
0.2
97
0.0
76
quasi
-F(0
.065)
(1.2
96)
(0.6
93)
(1.2
47)
(2.1
65)
P-v
al
0.8
52
0.4
80
0.4
40
0.4
17
0.1
26
Sam
ple
:M
AL
EE
nro
lled
insc
hool
(6-1
9ye
ars
old
)6,
385
0.8
04
0.0
06
0.0
28
2,7
16
0.8
20
0.0
08
0.0
39
0.0
76
quasi
-F(0
.424)
(0.4
94)
(0.2
70)
(0.3
49)
(0.5
46)
P-v
al
0.5
27
0.5
56
0.6
12
0.5
92
0.5
11
En
roll
edin
sch
ool
(6-1
4ye
ars
old
)4,
121
0.8
69
-0.0
04
0.0
01
1,7
62
0.9
20
0.0
11
-0.0
86
-0.0
60
quasi
-F(0
.099)
(0.0
01)
(0.2
48)
(2.4
07)
(0.7
22)
P-v
al
0.8
24
0.9
77
0.6
36
0.1
93
0.3
49
En
roll
edin
sch
ool
(15-
19ye
ars
old
)2,
264
0.6
87
0.0
06
0.1
68
954
0.6
35
0.0
04
0.1
83
0.3
59
quasi
-F(0
.048)
(3.9
15)
(0.0
13)
(2.1
65)
(2.4
87)
P-v
al
0.8
72
0.2
51
0.9
11
0.1
26
0.1
50
Con
trol
sY
esY
esY
esY
esY
es
No
tes:
Sta
ndard
erro
rsare
clust
ered
at
the
munic
ipality
level
.T
he
Qu
asi
-Fst
ati
stic
show
nin
pare
nth
esis
isth
ete
stst
ati
stic
com
pute
dusi
ng
wild
boots
trap
wit
hcl
ust
ered
standard
erro
rs.
P-v
al
indic
ate
sth
ew
ild
boots
trap
P-v
alu
efr
om
Cam
eron
and
Mille
r(2
015).
Wild
boots
trap
P-v
alu
esare
obta
ined
wit
hth
ep
ost
-est
imati
on
com
mand
boo
ttes
tby
Roodm
an
(2015),
usi
ng
Radem
ach
erw
eights
,ass
um
ing
the
null
hyp
oth
esis
and
sett
ing
replica
tions
to1000.
***
P-v
al
<0.0
1,
**
P-v
al<
0.0
5,
*P
-val<
0.1
.C
ontr
ols
incl
ude:
conflic
tin
tensi
ty(c
asu
alt
ies/
bom
ings)
,dis
tance
toth
eA
lbania
nb
ord
er,
age,
etnic
ity
(alb
ania
n),
dum
mie
sfo
rm
ari
tal
statu
s,dum
mie
sfo
rpare
nta
led
uca
tional
att
ain
men
t(l
owand
med
ium
),num
ber
of
male
and
fem
ale
adult
sin
ahouse
hold
aged
20-6
5,
num
ber
of
dep
enden
tm
emb
ers
aged
0,
1-5
,6-1
0,
11-1
5,
and
16-1
9,
dum
my
for
rura
llo
cati
on,
munic
ipality
lab
or-
forc
epart
icip
ati
on
in1991
and
pro
port
ion
of
Alb
ania
ns
in1991.
LSM
Ssa
mple
wei
ghts
are
use
din
all
the
regre
ssio
ns.
Data
sourc
e:1999
Koso
vo
DSH
Sand
2000
Koso
vo
LSM
S.
57
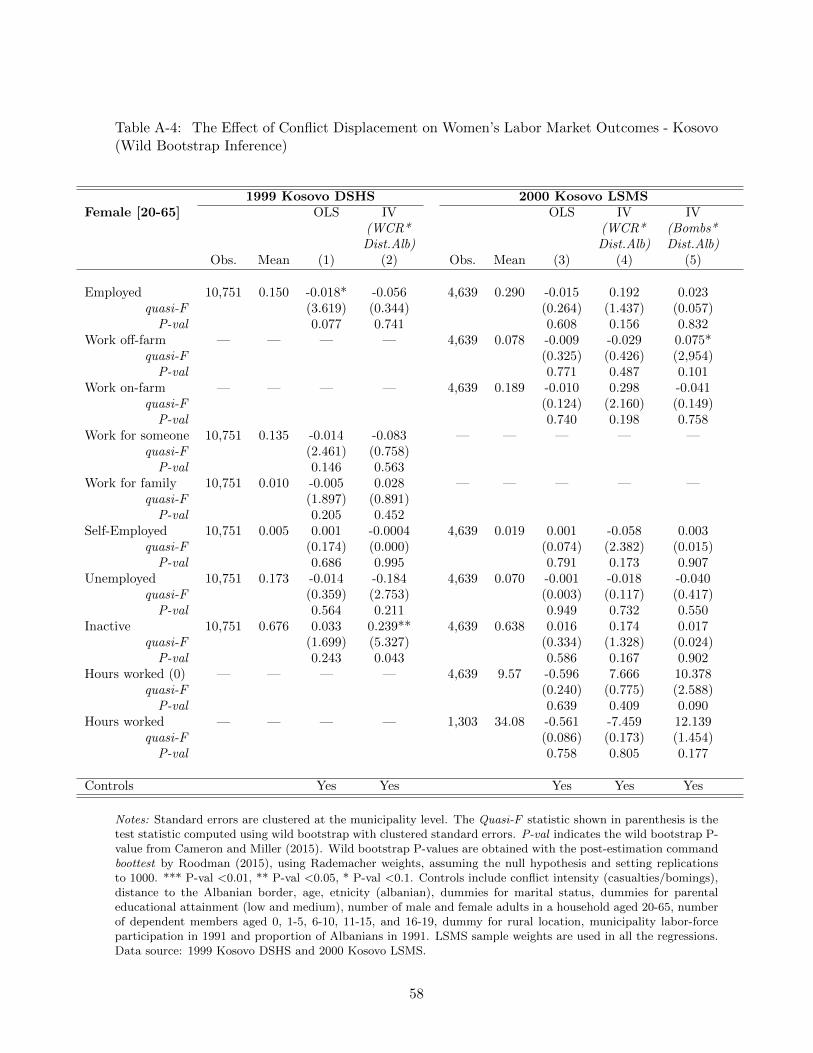
Table A-4: The Effect of Conflict Displacement on Women’s Labor Market Outcomes - Kosovo(Wild Bootstrap Inference)
1999 Kosovo DSHS 2000 Kosovo LSMSFemale [20-65] OLS IV OLS IV IV
(WCR* (WCR* (Bombs*Dist.Alb) Dist.Alb) Dist.Alb)
Obs. Mean (1) (2) Obs. Mean (3) (4) (5)
Employed 10,751 0.150 -0.018* -0.056 4,639 0.290 -0.015 0.192 0.023quasi-F (3.619) (0.344) (0.264) (1.437) (0.057)
P-val 0.077 0.741 0.608 0.156 0.832Work off-farm — — — — 4,639 0.078 -0.009 -0.029 0.075*
quasi-F (0.325) (0.426) (2,954)P-val 0.771 0.487 0.101
Work on-farm — — — — 4,639 0.189 -0.010 0.298 -0.041quasi-F (0.124) (2.160) (0.149)
P-val 0.740 0.198 0.758Work for someone 10,751 0.135 -0.014 -0.083 — — — — —
quasi-F (2.461) (0.758)P-val 0.146 0.563
Work for family 10,751 0.010 -0.005 0.028 — — — — —quasi-F (1.897) (0.891)
P-val 0.205 0.452Self-Employed 10,751 0.005 0.001 -0.0004 4,639 0.019 0.001 -0.058 0.003
quasi-F (0.174) (0.000) (0.074) (2.382) (0.015)P-val 0.686 0.995 0.791 0.173 0.907
Unemployed 10,751 0.173 -0.014 -0.184 4,639 0.070 -0.001 -0.018 -0.040quasi-F (0.359) (2.753) (0.003) (0.117) (0.417)
P-val 0.564 0.211 0.949 0.732 0.550Inactive 10,751 0.676 0.033 0.239** 4,639 0.638 0.016 0.174 0.017
quasi-F (1.699) (5.327) (0.334) (1.328) (0.024)P-val 0.243 0.043 0.586 0.167 0.902
Hours worked (0) — — — — 4,639 9.57 -0.596 7.666 10.378quasi-F (0.240) (0.775) (2.588)
P-val 0.639 0.409 0.090Hours worked — — — — 1,303 34.08 -0.561 -7.459 12.139
quasi-F (0.086) (0.173) (1.454)P-val 0.758 0.805 0.177
Controls Yes Yes Yes Yes Yes
Notes: Standard errors are clustered at the municipality level. The Quasi-F statistic shown in parenthesis is thetest statistic computed using wild bootstrap with clustered standard errors. P-val indicates the wild bootstrap P-value from Cameron and Miller (2015). Wild bootstrap P-values are obtained with the post-estimation commandboottest by Roodman (2015), using Rademacher weights, assuming the null hypothesis and setting replicationsto 1000. *** P-val <0.01, ** P-val <0.05, * P-val <0.1. Controls include conflict intensity (casualties/bomings),distance to the Albanian border, age, etnicity (albanian), dummies for marital status, dummies for parentaleducational attainment (low and medium), number of male and female adults in a household aged 20-65, numberof dependent members aged 0, 1-5, 6-10, 11-15, and 16-19, dummy for rural location, municipality labor-forceparticipation in 1991 and proportion of Albanians in 1991. LSMS sample weights are used in all the regressions.Data source: 1999 Kosovo DSHS and 2000 Kosovo LSMS.
58
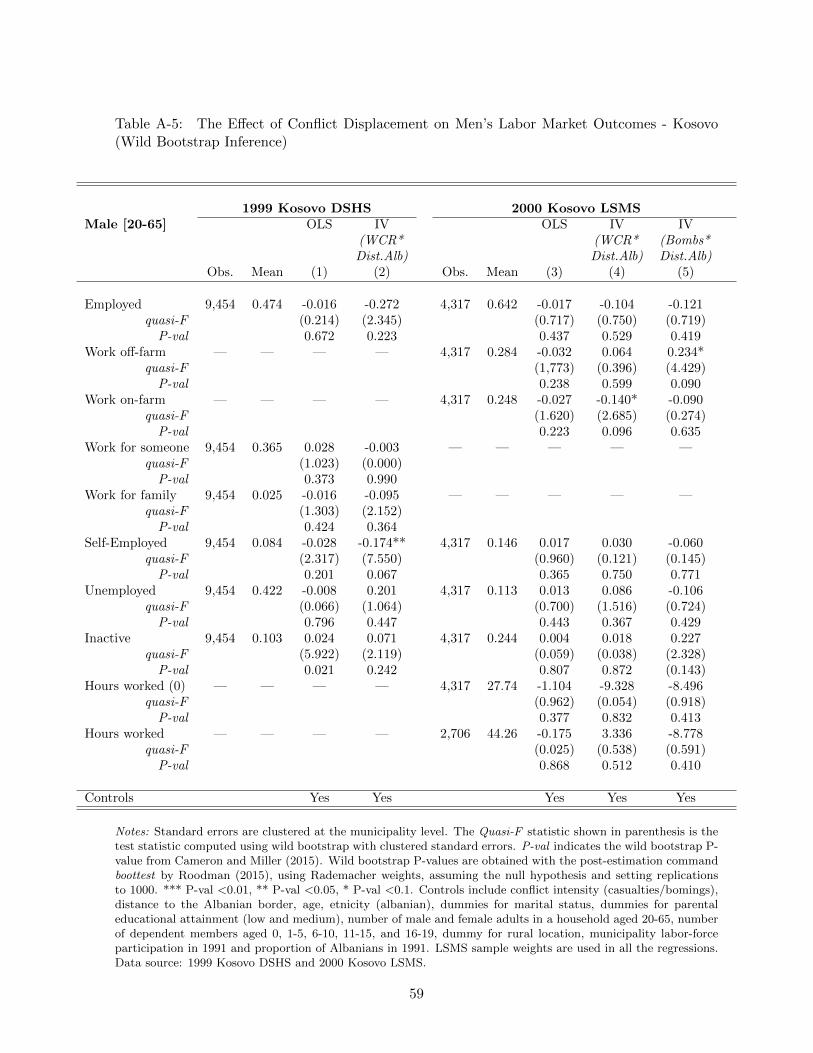
Table A-5: The Effect of Conflict Displacement on Men’s Labor Market Outcomes - Kosovo(Wild Bootstrap Inference)
1999 Kosovo DSHS 2000 Kosovo LSMSMale [20-65] OLS IV OLS IV IV
(WCR* (WCR* (Bombs*Dist.Alb) Dist.Alb) Dist.Alb)
Obs. Mean (1) (2) Obs. Mean (3) (4) (5)
Employed 9,454 0.474 -0.016 -0.272 4,317 0.642 -0.017 -0.104 -0.121quasi-F (0.214) (2.345) (0.717) (0.750) (0.719)
P-val 0.672 0.223 0.437 0.529 0.419Work off-farm — — — — 4,317 0.284 -0.032 0.064 0.234*
quasi-F (1,773) (0.396) (4.429)P-val 0.238 0.599 0.090
Work on-farm — — — — 4,317 0.248 -0.027 -0.140* -0.090quasi-F (1.620) (2.685) (0.274)
P-val 0.223 0.096 0.635Work for someone 9,454 0.365 0.028 -0.003 — — — — —
quasi-F (1.023) (0.000)P-val 0.373 0.990
Work for family 9,454 0.025 -0.016 -0.095 — — — — —quasi-F (1.303) (2.152)
P-val 0.424 0.364Self-Employed 9,454 0.084 -0.028 -0.174** 4,317 0.146 0.017 0.030 -0.060
quasi-F (2.317) (7.550) (0.960) (0.121) (0.145)P-val 0.201 0.067 0.365 0.750 0.771
Unemployed 9,454 0.422 -0.008 0.201 4,317 0.113 0.013 0.086 -0.106quasi-F (0.066) (1.064) (0.700) (1.516) (0.724)
P-val 0.796 0.447 0.443 0.367 0.429Inactive 9,454 0.103 0.024 0.071 4,317 0.244 0.004 0.018 0.227
quasi-F (5.922) (2.119) (0.059) (0.038) (2.328)P-val 0.021 0.242 0.807 0.872 (0.143)
Hours worked (0) — — — — 4,317 27.74 -1.104 -9.328 -8.496quasi-F (0.962) (0.054) (0.918)
P-val 0.377 0.832 0.413Hours worked — — — — 2,706 44.26 -0.175 3.336 -8.778
quasi-F (0.025) (0.538) (0.591)P-val 0.868 0.512 0.410
Controls Yes Yes Yes Yes Yes
Notes: Standard errors are clustered at the municipality level. The Quasi-F statistic shown in parenthesis is thetest statistic computed using wild bootstrap with clustered standard errors. P-val indicates the wild bootstrap P-value from Cameron and Miller (2015). Wild bootstrap P-values are obtained with the post-estimation commandboottest by Roodman (2015), using Rademacher weights, assuming the null hypothesis and setting replicationsto 1000. *** P-val <0.01, ** P-val <0.05, * P-val <0.1. Controls include conflict intensity (casualties/bomings),distance to the Albanian border, age, etnicity (albanian), dummies for marital status, dummies for parentaleducational attainment (low and medium), number of male and female adults in a household aged 20-65, numberof dependent members aged 0, 1-5, 6-10, 11-15, and 16-19, dummy for rural location, municipality labor-forceparticipation in 1991 and proportion of Albanians in 1991. LSMS sample weights are used in all the regressions.Data source: 1999 Kosovo DSHS and 2000 Kosovo LSMS.
59
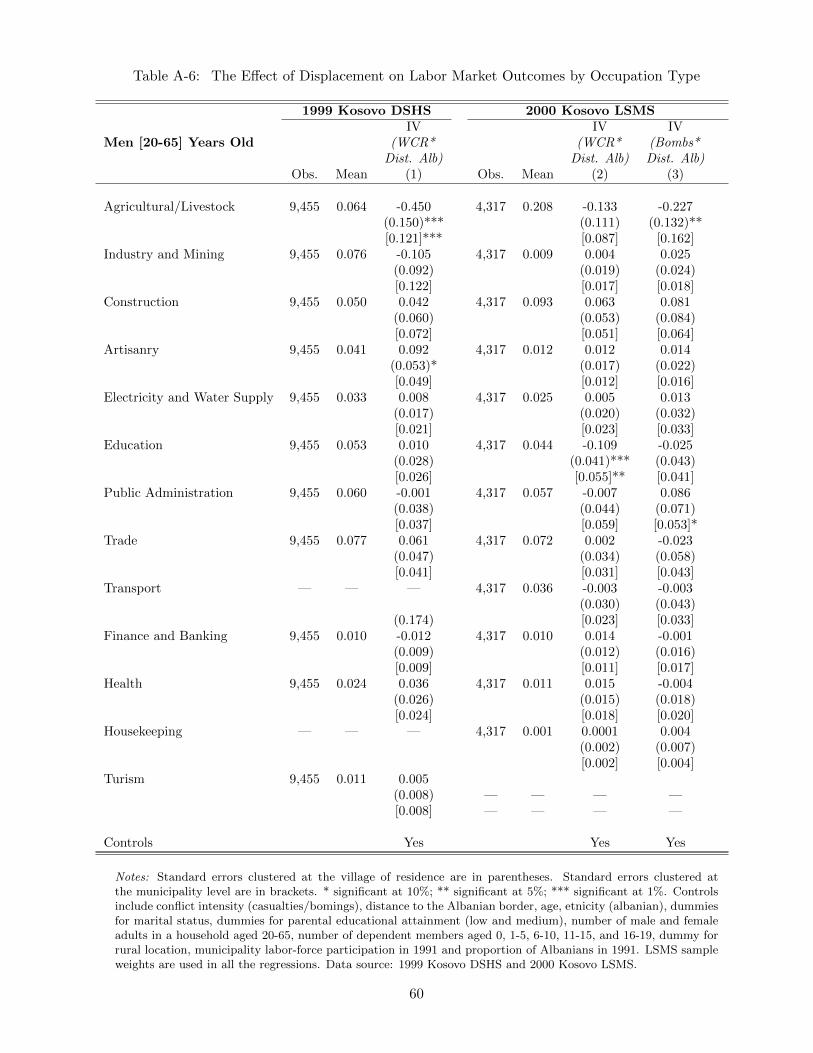
Table A-6: The Effect of Displacement on Labor Market Outcomes by Occupation Type
1999 Kosovo DSHS 2000 Kosovo LSMSIV IV IV
Men [20-65] Years Old (WCR* (WCR* (Bombs*Dist. Alb) Dist. Alb) Dist. Alb)
Obs. Mean (1) Obs. Mean (2) (3)
Agricultural/Livestock 9,455 0.064 -0.450 4,317 0.208 -0.133 -0.227(0.150)*** (0.111) (0.132)**[0.121]*** [0.087] [0.162]
Industry and Mining 9,455 0.076 -0.105 4,317 0.009 0.004 0.025(0.092) (0.019) (0.024)[0.122] [0.017] [0.018]
Construction 9,455 0.050 0.042 4,317 0.093 0.063 0.081(0.060) (0.053) (0.084)[0.072] [0.051] [0.064]
Artisanry 9,455 0.041 0.092 4,317 0.012 0.012 0.014(0.053)* (0.017) (0.022)[0.049] [0.012] [0.016]
Electricity and Water Supply 9,455 0.033 0.008 4,317 0.025 0.005 0.013(0.017) (0.020) (0.032)[0.021] [0.023] [0.033]
Education 9,455 0.053 0.010 4,317 0.044 -0.109 -0.025(0.028) (0.041)*** (0.043)[0.026] [0.055]** [0.041]
Public Administration 9,455 0.060 -0.001 4,317 0.057 -0.007 0.086(0.038) (0.044) (0.071)[0.037] [0.059] [0.053]*
Trade 9,455 0.077 0.061 4,317 0.072 0.002 -0.023(0.047) (0.034) (0.058)[0.041] [0.031] [0.043]
Transport — — — 4,317 0.036 -0.003 -0.003(0.030) (0.043)
(0.174) [0.023] [0.033]Finance and Banking 9,455 0.010 -0.012 4,317 0.010 0.014 -0.001
(0.009) (0.012) (0.016)[0.009] [0.011] [0.017]
Health 9,455 0.024 0.036 4,317 0.011 0.015 -0.004(0.026) (0.015) (0.018)[0.024] [0.018] [0.020]
Housekeeping — — — 4,317 0.001 0.0001 0.004(0.002) (0.007)[0.002] [0.004]
Turism 9,455 0.011 0.005(0.008) — — — —[0.008] — — — —
Controls Yes Yes Yes
Notes: Standard errors clustered at the village of residence are in parentheses. Standard errors clustered atthe municipality level are in brackets. * significant at 10%; ** significant at 5%; *** significant at 1%. Controlsinclude conflict intensity (casualties/bomings), distance to the Albanian border, age, etnicity (albanian), dummiesfor marital status, dummies for parental educational attainment (low and medium), number of male and femaleadults in a household aged 20-65, number of dependent members aged 0, 1-5, 6-10, 11-15, and 16-19, dummy forrural location, municipality labor-force participation in 1991 and proportion of Albanians in 1991. LSMS sampleweights are used in all the regressions. Data source: 1999 Kosovo DSHS and 2000 Kosovo LSMS.
60
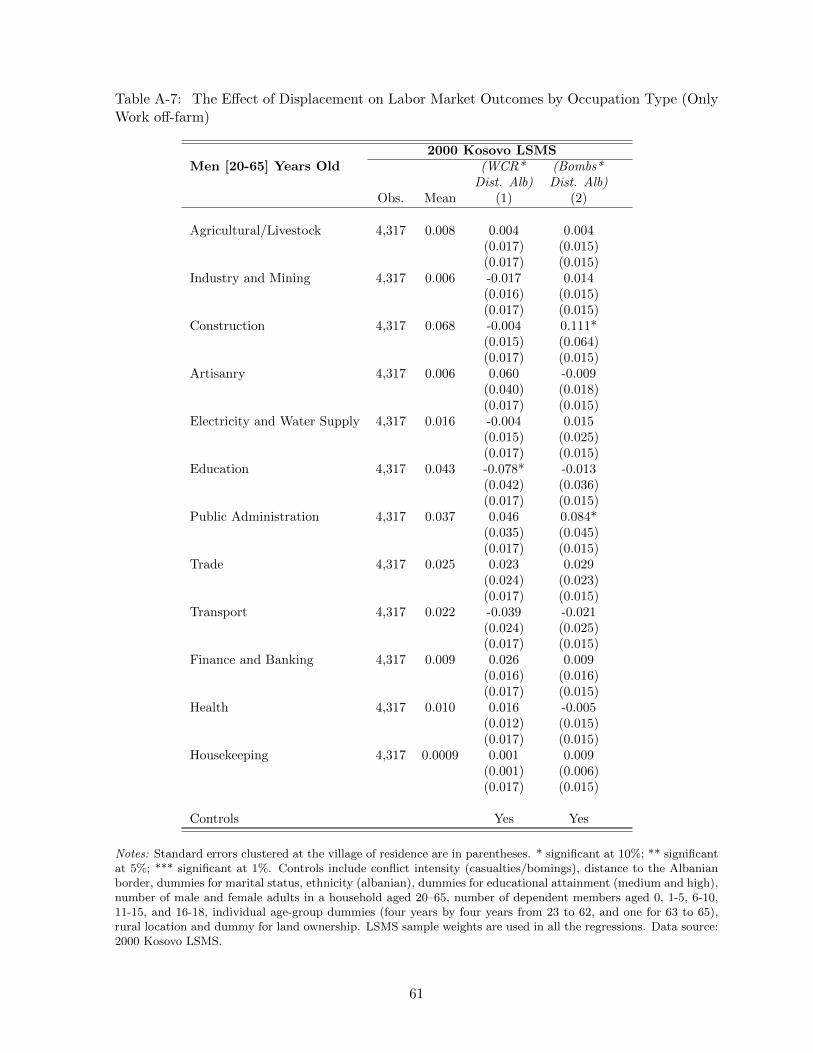
Table A-7: The Effect of Displacement on Labor Market Outcomes by Occupation Type (OnlyWork off-farm)
2000 Kosovo LSMSMen [20-65] Years Old (WCR* (Bombs*
Dist. Alb) Dist. Alb)Obs. Mean (1) (2)
Agricultural/Livestock 4,317 0.008 0.004 0.004(0.017) (0.015)(0.017) (0.015)
Industry and Mining 4,317 0.006 -0.017 0.014(0.016) (0.015)(0.017) (0.015)
Construction 4,317 0.068 -0.004 0.111*(0.015) (0.064)(0.017) (0.015)
Artisanry 4,317 0.006 0.060 -0.009(0.040) (0.018)(0.017) (0.015)
Electricity and Water Supply 4,317 0.016 -0.004 0.015(0.015) (0.025)(0.017) (0.015)
Education 4,317 0.043 -0.078* -0.013(0.042) (0.036)(0.017) (0.015)
Public Administration 4,317 0.037 0.046 0.084*(0.035) (0.045)(0.017) (0.015)
Trade 4,317 0.025 0.023 0.029(0.024) (0.023)(0.017) (0.015)
Transport 4,317 0.022 -0.039 -0.021(0.024) (0.025)(0.017) (0.015)
Finance and Banking 4,317 0.009 0.026 0.009(0.016) (0.016)(0.017) (0.015)
Health 4,317 0.010 0.016 -0.005(0.012) (0.015)(0.017) (0.015)
Housekeeping 4,317 0.0009 0.001 0.009(0.001) (0.006)(0.017) (0.015)
Controls Yes Yes
Notes: Standard errors clustered at the village of residence are in parentheses. * significant at 10%; ** significantat 5%; *** significant at 1%. Controls include conflict intensity (casualties/bomings), distance to the Albanianborder, dummies for marital status, ethnicity (albanian), dummies for educational attainment (medium and high),number of male and female adults in a household aged 20–65, number of dependent members aged 0, 1-5, 6-10,11-15, and 16-18, individual age-group dummies (four years by four years from 23 to 62, and one for 63 to 65),rural location and dummy for land ownership. LSMS sample weights are used in all the regressions. Data source:2000 Kosovo LSMS.
61
A Alternative Identification Strategy
A-1 Identification: Difference-in-Difference (DID) Strategy
Additionally, I also use a difference-in-difference (DID) empirical strategy. This strategy exploits
two sources of variation in order to isolate the effect of forced displacement on schooling comple-
tion: the spatial variation in municipality displacement and the birth cohorts of children - which
determines whether they were in primary or secondary school during the forced displacement
from Kosovo. Using the cross-sectional data of the 1999 Kosovo DSHS and 2000 Kosovo LSMS,
I compare primary and secondary schooling completion outcomes across birth cohorts.
This identification strategy uses the characteristics of the education system of Kosovo till
the year 2000 which regulated 8 years of mandatory or primary level schooling between the ages
6-14, and 4 years of secondary schooling between the ages 15-18 (SOK, 2001).28 Therefore, for
each education level, I define as pre-displacement or unaffected cohorts those that completed
primary/secondary schooling before the conflict displacement, that is, before September 1998.
While, displacement or affected cohorts are those that should have completed the last year of
primary/secondary schooling during or after the conflict displacement, that is, after June 1999.
Table A-8 presents the composition of the samples used to identify cohort effects on schooling
completion outcomes. The samples are restricted to observations of boys and girls, whose
cohort characteristics of schooling completion are observed before or after the 1999 Kosovo
displacement. Sample A concentrates on primary schooling completion. The unaffected cohort
contains children born between 1979-1983, which ensures that the child is at least 15 years old
before the start of the conflict displacement and has already finished primary school. In contrast,
the affected cohort contains children born between 1984-1986, which ensures that the child is
younger than 15 years old in 1999. This means that her primary schooling was interrupted by the
conflict displacement. Similarly, Sample B presents the unaffected and affected cohorts for the
secondary school completion. Children born between 1975-1979 belong to the pre-displacement
cohorts, as they finished secondary school in peacetime. While, all children born between 1980-
1982 have experienced conflict displacement during their schooling.
Here, the identification of conflict displacement relies on the assumption that differences
in schooling completion between affected and unaffected cohorts would have been equal across
municipalities in the absence of forced displacement. For the DID estimation, the regression
28From 2002 school year, compulsory education in Kosovo was extended to 9 years and divided into 5 years ofprimary education and 4 years of lower secondary education.
62
model is specified as follows:29
Schoolingijkt = α(MDispj ∗At) + λX′ijkt + γj + δk + ct + εijkt (A-1)
where Schoolingijkt: is the schooling outcome variable for child i of birth cohort t residing
in municipality j before displacement (and in k after displacement), MDispj is proportion
of the population that was displaced in municipality j, At is a dummy indicating whether
child born in cohort t was affected by the 1999 displacement, X′ijkt is set of control variables
(ethnicity, parental schooling completion, household demographics and rural dummy), γj are
pre-displacement municipality fixed-effects; δk are post-displacement municipality fixed-effects;
ct are birth cohort fixed-effects and εijkt is the error term. The two sets of municipality fixed
effects capture municipal heterogeneity in schooling conditions. The parameter of interest which
estimates the effect of conflict displacement on schooling outcomes is thus α. Standard errors
are clustered at the village and municipality level.
A-2 Endogeneity in Municipality Displacement
Even though the municipality fixed effects take care of endogeneity arising from unobserved
pre- and post-war municipal conditions, the identification assumption could still be violated by
self-selection due to unobserved individual heterogeneity such as ability, social networks, risk
aversion etc.30 In order to control for this, I use conflict intensity -as measured by casualties and
bombings at the municipality level- interacted with distance to Albanian border as an instrument
for municipality displacement. The identifying assumption underlying this alternative estimation
strategy is that the change in schooling outcomes over cohorts are similar across municipalities
that suffered different conflict intensities and were located near of far from the Albanian border,
in the absence of forced displacement.
The first-stage specifications are thus described by the following equations:
ˆ(MDispj ∗At) = β1(WCRj ∗Dv ∗At) + β2(WCRj ∗Dv) + λ1X′ijkt + γj + δk + ct + εijkt (A-2)
ˆ(MDispj ∗At) = β1(Bj ∗Dv ∗At) + β2(Bj ∗Dv) + + λ1X′ijkt + γj + δk + ct + εijkt (A-3)
29Similar difference-in-difference regression models have been used earlier in the literature to assess the effectof armed conflict on child schooling (e.g. Swee, 2015; Chamarbagwala and Moran, 2011; Shemyakina, 2011; Leon,2012; Akresh and De Walque, 2008; Akbulut-Yuksel, 2014; Merrouche, 2011; Valente, 2013; Pivovarova and Swee,2015). All these models have been influeced by earlier applications of cross-sectional difference-in-difference modelsby Esther Duflo in different research settings (see Duflo (2001, 2003).)
30This endogeneity issue can potentially be overcome by accounting for individual fixed-effect using panel dataand assuming that the unobserved atttribute is time-invariant. However, this is clearly infeasible since in thiscase the data are cross-sectional.
63
More precisely, I predict the interaction of municipality displacement and affected cohort
(MDispj∗At) with interactions of municipality conflict intensity -measured as casualties (WCRj)
and bombings (Bj)- with distance to the Albanian border (Dv) and affected cohort (At). On
the one hand, conflict intensity and distance to the Albanian border are good predictors for
displacement. On the other hand, the interaction of these variables (WCRj ∗Dv) with affected
cohort (At) should be uncorrelated with unobserved individual characteristics in the schooling
equation.
Tables A-9 and A-10 show the regression coefficients of the first-stage estimation for the
primary and secondary school children, respectively. In the same line as the findings with the
IV strategy, these results indicate that further away from the Albanian border, an increase
in conflict intensity leads to higher municipality displacement for the affected cohorts. Both
specifications are statistically significant at conventional levels. In particular, the interaction
between war casualty rate and distance to the Albanian border seems to be a stronger predictor
for municipality displacement in both databases. In other words, affected children located further
away from the Albanian border and in municipalities with more casualties are more likely to
experience forced displacement.
Similarly, the second specification which uses the interaction between bombing intensity and
distance to the Albanian border as instrument also shows that further way from the Albanian
border, an increase in bombing intensity leads to higher municipality displacement. However,
the F-statistic of the excluded instruments is below 10 in most of the cases, which makes this
instrument less strong and subject to bias.
A-3 Displacement and Schooling Completion Outcomes
This Section presents the estimation results following the difference-in-difference strategy out-
lined previously. I estimate the impact of conflict displacement on schooling outcomes of Kosovar
children after the 1999 Kosovo war. I first present the impact of conflict displacement on female
schooling completion in Table A-11 and then, in Table A-12, I present the effect of conflict
displacement on male schooling completion. The primary (secondary) level sample comprises
children aged 13-20 (17-24) in 1999. The average primary schooling completion is quite equal
across genders, for boys around 87% and for girls 85%. The average secondary schooling com-
pletion for boys drops to around 60-65%, while for girls the drop is much more pronounced being
around 45-50%, suggesting clear inequality in secondary school attainment across genders.
For each schooling outcome, I run three sets of difference-in-difference regressions - first, OLS;
second, IV using (WCR ∗DistAlb) as instrument and third, IV using (Bombings ∗DistAlb) as
instrument-. Each cell in Tables A-11 and A-12 presents the coefficients of interest, the inter-
action of belonging to the affected cohort and living in a municipality with high displacement.
Since statistical inference when using difference-in-difference models is vulnerable to serial cor-
relation that possibly produces a downward bias, I apply standard errors clustered at the village
64
and municipality level.
By and large, I find no evidence of municipality displacement effects on neither primary nor
secondary schooling completion for boys and girls in general. These results suggest that there
are no significant patterns of cohort-specific displacement intensity effects. In particular, only
the specification that uses (Bombings∗DistAlb) as instrument shows a negative and statistically
significant effect of displacement on children’s secondary schooling completion in 1999. However,
this result is subject to bias due to the weakness of this instrument in the first-stage.
65
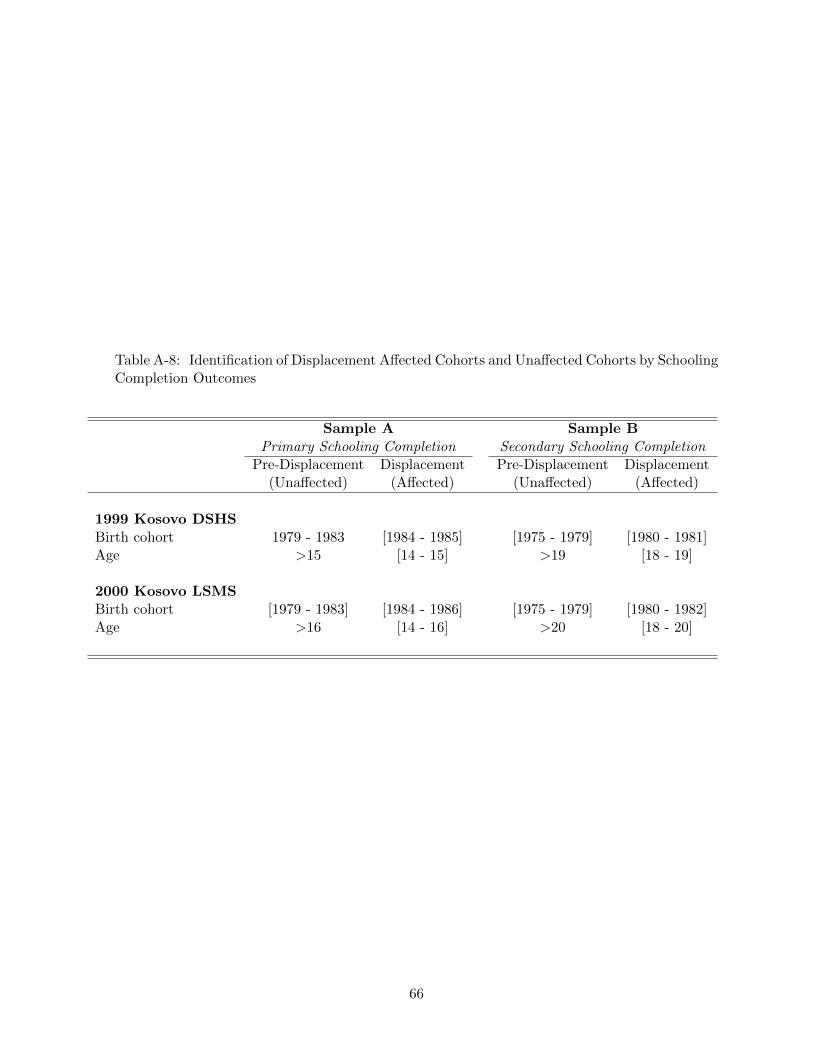
Table A-8: Identification of Displacement Affected Cohorts and Unaffected Cohorts by SchoolingCompletion Outcomes
Sample A Sample BPrimary Schooling Completion Secondary Schooling Completion
Pre-Displacement Displacement Pre-Displacement Displacement(Unaffected) (Affected) (Unaffected) (Affected)
1999 Kosovo DSHSBirth cohort 1979 - 1983 [1984 - 1985] [1975 - 1979] [1980 - 1981]Age >15 [14 - 15] >19 [18 - 19]
2000 Kosovo LSMSBirth cohort [1979 - 1983] [1984 - 1986] [1975 - 1979] [1980 - 1982]Age >16 [14 - 16] >20 [18 - 20]
66
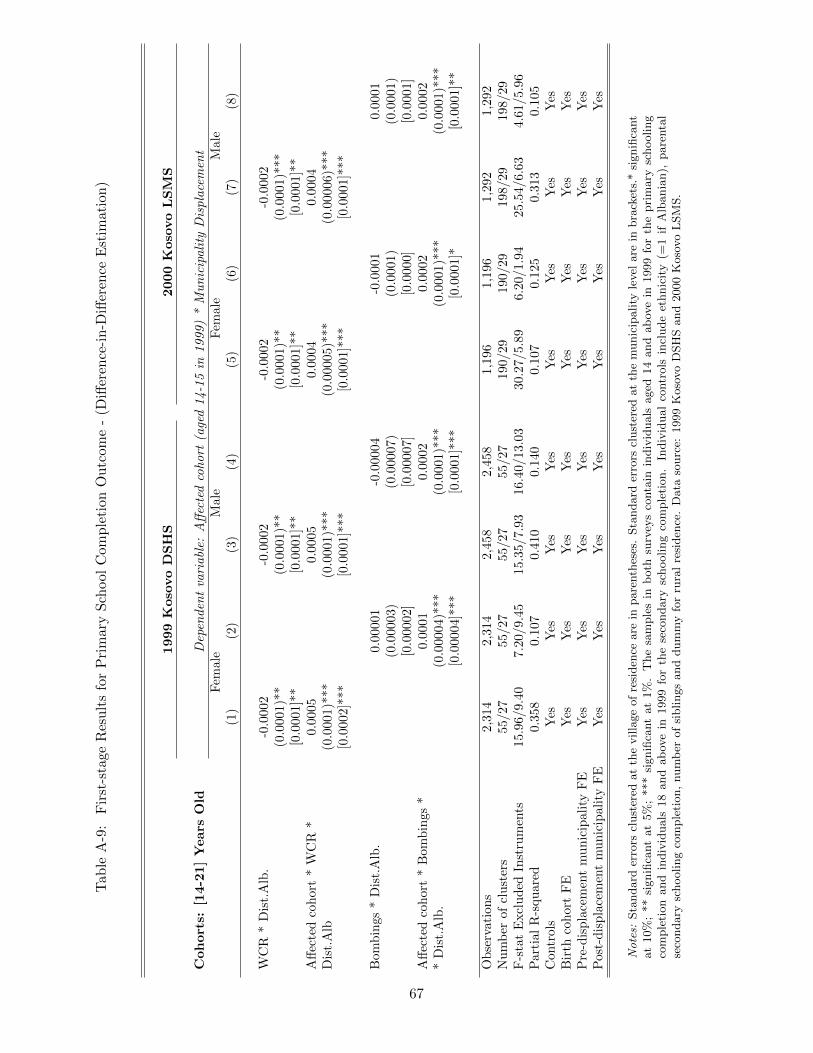
Tab
leA
-9:
Fir
st-s
tage
Res
ult
sfo
rP
rim
ary
Sch
ool
Com
ple
tion
Ou
tcom
e-
(Diff
eren
ce-i
n-D
iffer
ence
Est
imati
on
)
1999
Koso
vo
DS
HS
2000
Koso
vo
LS
MS
Coh
ort
s:[1
4-2
1]
Years
Old
Dep
enden
tva
riabl
e:A
ffec
ted
cohort
(age
d14-1
5in
1999)
*M
un
icip
ali
tyD
ispla
cem
ent
Fem
ale
Male
Fem
ale
Male
(1)
(2)
(3)
(4)
(5)
(6)
(7)
(8)
WC
R*
Dis
t.A
lb.
-0.0
002
-0.0
002
-0.0
002
-0.0
002
(0.0
001)
**(0
.0001)*
*(0
.0001)*
*(0
.0001)*
**
[0.0
001]
**[0
.0001]*
*[0
.0001]*
*[0
.0001]*
*A
ffec
ted
coh
ort
*W
CR
*0.
0005
0.0
005
0.0
004
0.0
004
Dis
t.A
lb(0
.000
1)**
*(0
.0001)*
**
(0.0
0005)*
**
(0.0
0006)*
**
[0.0
002]
***
[0.0
001]*
**
[0.0
001]*
**
[0.0
001]*
**
Bom
bin
gs*
Dis
t.A
lb.
0.0
0001
-0.0
0004
-0.0
001
0.0
001
(0.0
0003)
(0.0
0007)
(0.0
001)
(0.0
001)
[0.0
0002]
[0.0
0007]
[0.0
000]
[0.0
001]
Aff
ecte
dco
hor
t*
Bom
bin
gs*
0.0
001
0.0
002
0.0
002
0.0
002
*D
ist.
Alb
.(0
.00004)*
**
(0.0
001)*
**
(0.0
001)*
**
(0.0
001)*
**
[0.0
0004]*
**
[0.0
001]*
**
[0.0
001]*
[0.0
001]*
*
Ob
serv
atio
ns
2,31
42,3
14
2,4
58
2,4
58
1,1
96
1,1
96
1,2
92
1,2
92
Nu
mb
erof
clu
ster
s55
/27
55/27
55/27
55/27
190/29
190/29
198/29
198/29
F-s
tat
Excl
ud
edIn
stru
men
ts15
.96/
9.40
7.2
0/9.4
515.3
5/7.9
316.4
0/13.0
330.2
7/5.8
96.2
0/1.9
425.5
4/6.6
34.6
1/5.9
6P
arti
alR
-squ
ared
0.35
80.1
07
0.4
10
0.1
40
0.1
07
0.1
25
0.3
13
0.1
05
Con
trol
sY
esY
esY
esY
esY
esY
esY
esY
esB
irth
coh
ort
FE
Yes
Yes
Yes
Yes
Yes
Yes
Yes
Yes
Pre
-dis
pla
cem
ent
mu
nic
ipal
ity
FE
Yes
Yes
Yes
Yes
Yes
Yes
Yes
Yes
Pos
t-d
isp
lace
men
tm
un
icip
alit
yF
EY
esY
esY
esY
esY
esY
esY
esY
es
No
tes:
Sta
ndard
erro
rscl
ust
ered
at
the
villa
ge
of
resi
den
ceare
inpare
nth
eses
.Sta
ndard
erro
rscl
ust
ered
at
the
munic
ipality
level
are
inbra
cket
s.*
signifi
cant
at
10%
;**
signifi
cant
at
5%
;***
signifi
cant
at
1%
.T
he
sam
ple
sin
both
surv
eys
conta
inin
div
iduals
aged
14
and
ab
ove
in1999
for
the
pri
mary
schooling
com
ple
tion
and
indiv
iduals
18
and
ab
ove
in1999
for
the
seco
ndary
schooling
com
ple
tion.
Indiv
idual
contr
ols
incl
ude
ethnic
ity
(=1
ifA
lbania
n),
pare
nta
lse
condary
schooling
com
ple
tion,
num
ber
of
siblings
and
dum
my
for
rura
lre
siden
ce.
Data
sourc
e:1999
Koso
vo
DSH
Sand
2000
Koso
vo
LSM
S.
67
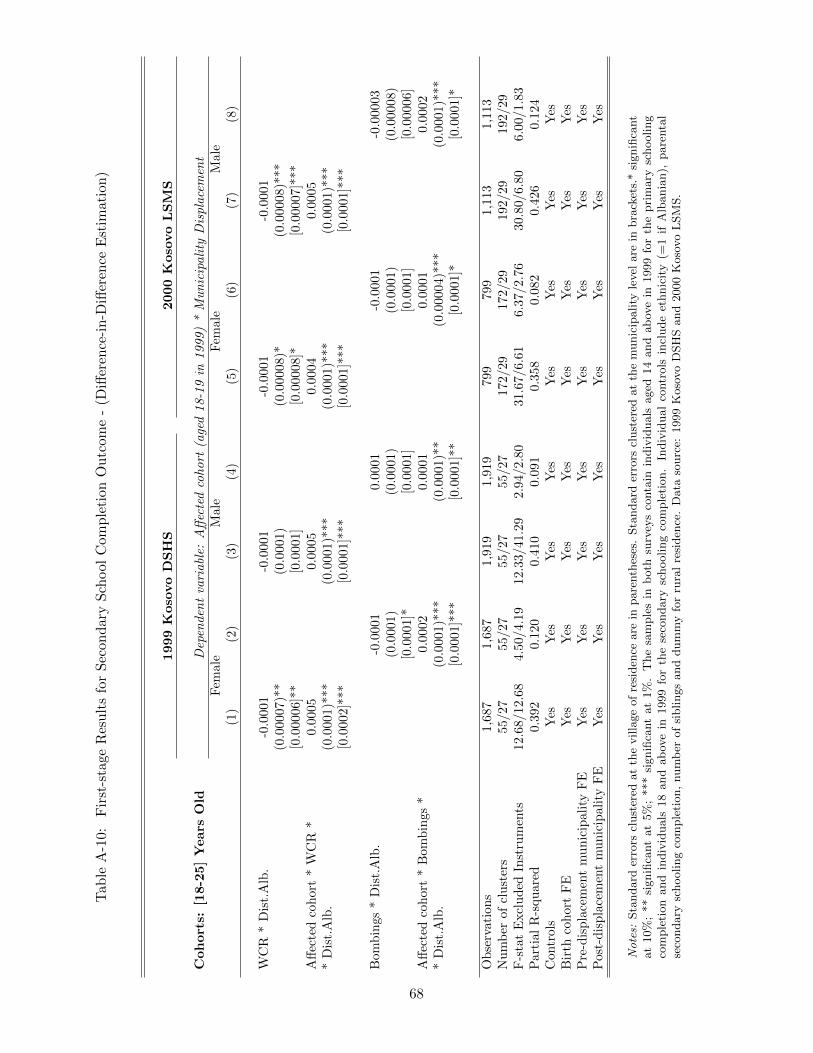
Tab
leA
-10:
Fir
st-s
tage
Res
ult
sfo
rS
econ
dar
yS
chool
Com
ple
tion
Ou
tcom
e-
(Diff
eren
ce-i
n-D
iffer
ence
Est
imati
on
)
1999
Koso
vo
DS
HS
2000
Koso
vo
LS
MS
Coh
ort
s:[1
8-2
5]
Years
Old
Dep
enden
tva
riabl
e:A
ffec
ted
cohort
(age
d18-1
9in
1999)
*M
un
icip
ali
tyD
ispla
cem
ent
Fem
ale
Male
Fem
ale
Male
(1)
(2)
(3)
(4)
(5)
(6)
(7)
(8)
WC
R*
Dis
t.A
lb.
-0.0
001
-0.0
001
-0.0
001
-0.0
001
(0.0
0007
)**
(0.0
001)
(0.0
0008)*
(0.0
0008)*
**
[0.0
0006
]**
[0.0
001]
[0.0
0008]*
[0.0
0007]*
**
Aff
ecte
dco
hor
t*
WC
R*
0.00
050.0
005
0.0
004
0.0
005
*D
ist.
Alb
.(0
.000
1)**
*(0
.0001)*
**
(0.0
001)*
**
(0.0
001)*
**
[0.0
002]
***
[0.0
001]*
**
[0.0
001]*
**
[0.0
001]*
**
Bom
bin
gs*
Dis
t.A
lb.
-0.0
001
0.0
001
-0.0
001
-0.0
0003
(0.0
001)
(0.0
001)
(0.0
001)
(0.0
0008)
[0.0
001]*
[0.0
001]
[0.0
001]
[0.0
0006]
Aff
ecte
dco
hor
t*
Bom
bin
gs*
0.0
002
0.0
001
0.0
001
0.0
002
*D
ist.
Alb
.(0
.0001)*
**
(0.0
001)*
*(0
.00004)*
**
(0.0
001)*
**
[0.0
001]*
**
[0.0
001]*
*[0
.0001]*
[0.0
001]*
Ob
serv
atio
ns
1,68
71,6
87
1,9
19
1,9
19
799
799
1,1
13
1,1
13
Nu
mb
erof
clu
ster
s55
/27
55/27
55/27
55/27
172/29
172/29
192/29
192/29
F-s
tat
Excl
ud
edIn
stru
men
ts12
.68/
12.6
84.5
0/4.1
912.3
3/41.2
92.9
4/2.8
031.6
7/6.6
16.
37/2.7
630.8
0/6.8
06.0
0/1.8
3P
arti
alR
-squ
ared
0.39
20.1
20
0.4
10
0.0
91
0.3
58
0.0
82
0.4
26
0.1
24
Con
trol
sY
esY
esY
esY
esY
esY
esY
esY
esB
irth
coh
ort
FE
Yes
Yes
Yes
Yes
Yes
Yes
Yes
Yes
Pre
-dis
pla
cem
ent
mu
nic
ipal
ity
FE
Yes
Yes
Yes
Yes
Yes
Yes
Yes
Yes
Pos
t-d
isp
lace
men
tm
un
icip
alit
yF
EY
esY
esY
esY
esY
esY
esY
esY
es
No
tes:
Sta
ndard
erro
rscl
ust
ered
at
the
villa
ge
of
resi
den
ceare
inpare
nth
eses
.Sta
ndard
erro
rscl
ust
ered
at
the
munic
ipality
level
are
inbra
cket
s.*
signifi
cant
at
10%
;**
signifi
cant
at
5%
;***
signifi
cant
at
1%
.T
he
sam
ple
sin
both
surv
eys
conta
inin
div
iduals
aged
14
and
ab
ove
in1999
for
the
pri
mary
schooling
com
ple
tion
and
indiv
iduals
18
and
ab
ove
in1999
for
the
seco
ndary
schooling
com
ple
tion.
Indiv
idual
contr
ols
incl
ude
ethnic
ity
(=1
ifA
lbania
n),
pare
nta
lse
condary
schooling
com
ple
tion,
num
ber
of
siblings
and
dum
my
for
rura
lre
siden
ce.
Data
sourc
e:1999
Koso
vo
DSH
Sand
2000
Koso
vo
LSM
S.
68
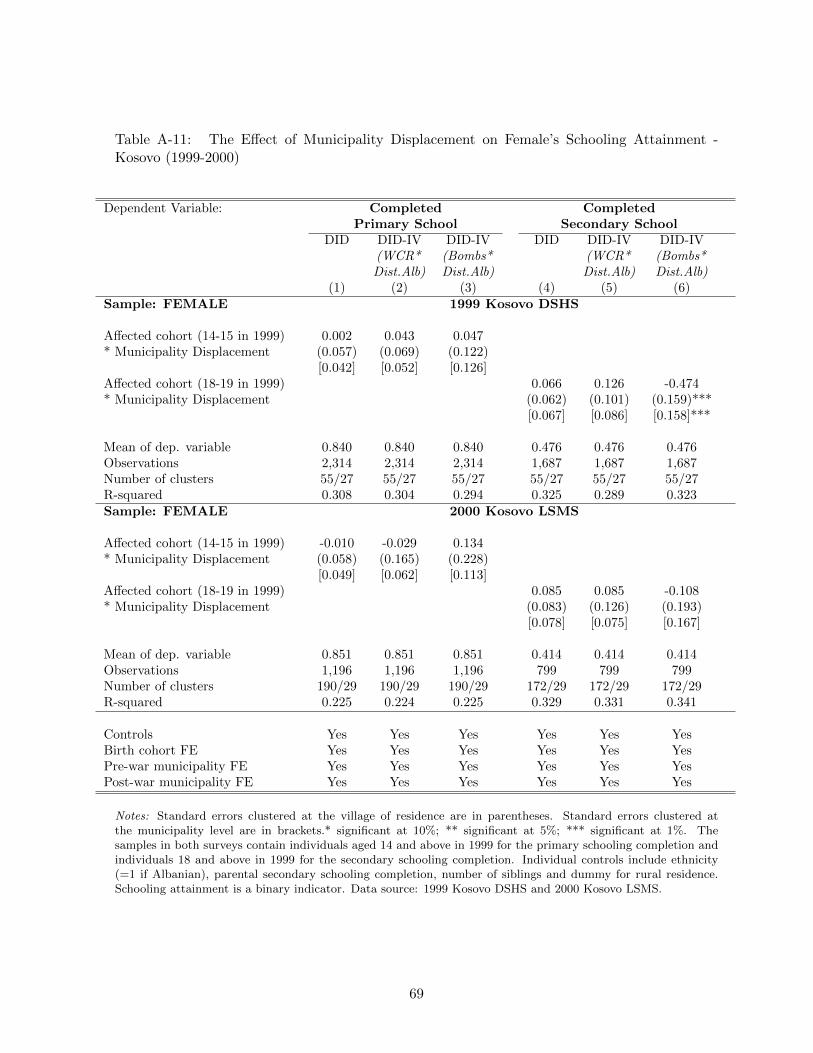
Table A-11: The Effect of Municipality Displacement on Female’s Schooling Attainment -Kosovo (1999-2000)
Dependent Variable: Completed CompletedPrimary School Secondary School
DID DID-IV DID-IV DID DID-IV DID-IV(WCR* (Bombs* (WCR* (Bombs*Dist.Alb) Dist.Alb) Dist.Alb) Dist.Alb)
(1) (2) (3) (4) (5) (6)Sample: FEMALE 1999 Kosovo DSHS
Affected cohort (14-15 in 1999) 0.002 0.043 0.047* Municipality Displacement (0.057) (0.069) (0.122)
[0.042] [0.052] [0.126]Affected cohort (18-19 in 1999) 0.066 0.126 -0.474* Municipality Displacement (0.062) (0.101) (0.159)***
[0.067] [0.086] [0.158]***
Mean of dep. variable 0.840 0.840 0.840 0.476 0.476 0.476Observations 2,314 2,314 2,314 1,687 1,687 1,687Number of clusters 55/27 55/27 55/27 55/27 55/27 55/27R-squared 0.308 0.304 0.294 0.325 0.289 0.323Sample: FEMALE 2000 Kosovo LSMS
Affected cohort (14-15 in 1999) -0.010 -0.029 0.134* Municipality Displacement (0.058) (0.165) (0.228)
[0.049] [0.062] [0.113]Affected cohort (18-19 in 1999) 0.085 0.085 -0.108* Municipality Displacement (0.083) (0.126) (0.193)
[0.078] [0.075] [0.167]
Mean of dep. variable 0.851 0.851 0.851 0.414 0.414 0.414Observations 1,196 1,196 1,196 799 799 799Number of clusters 190/29 190/29 190/29 172/29 172/29 172/29R-squared 0.225 0.224 0.225 0.329 0.331 0.341
Controls Yes Yes Yes Yes Yes YesBirth cohort FE Yes Yes Yes Yes Yes YesPre-war municipality FE Yes Yes Yes Yes Yes YesPost-war municipality FE Yes Yes Yes Yes Yes Yes
Notes: Standard errors clustered at the village of residence are in parentheses. Standard errors clustered atthe municipality level are in brackets.* significant at 10%; ** significant at 5%; *** significant at 1%. Thesamples in both surveys contain individuals aged 14 and above in 1999 for the primary schooling completion andindividuals 18 and above in 1999 for the secondary schooling completion. Individual controls include ethnicity(=1 if Albanian), parental secondary schooling completion, number of siblings and dummy for rural residence.Schooling attainment is a binary indicator. Data source: 1999 Kosovo DSHS and 2000 Kosovo LSMS.
69
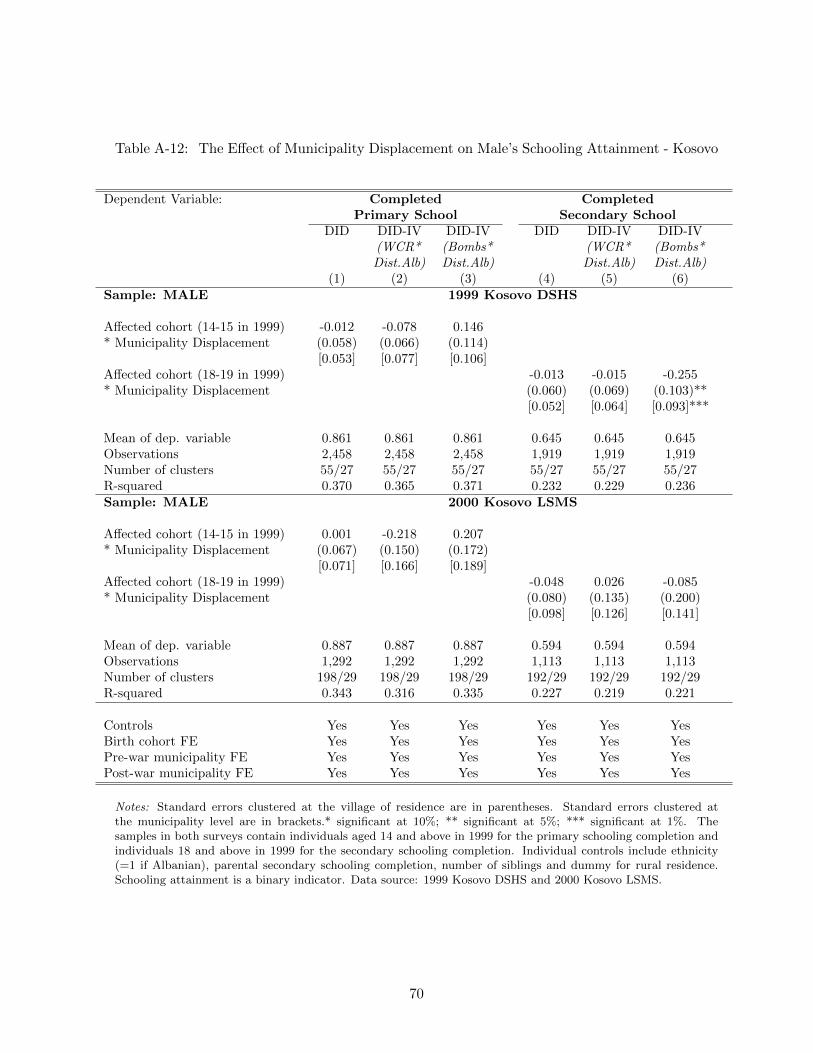
Table A-12: The Effect of Municipality Displacement on Male’s Schooling Attainment - Kosovo
Dependent Variable: Completed CompletedPrimary School Secondary School
DID DID-IV DID-IV DID DID-IV DID-IV(WCR* (Bombs* (WCR* (Bombs*Dist.Alb) Dist.Alb) Dist.Alb) Dist.Alb)
(1) (2) (3) (4) (5) (6)Sample: MALE 1999 Kosovo DSHS
Affected cohort (14-15 in 1999) -0.012 -0.078 0.146* Municipality Displacement (0.058) (0.066) (0.114)
[0.053] [0.077] [0.106]Affected cohort (18-19 in 1999) -0.013 -0.015 -0.255* Municipality Displacement (0.060) (0.069) (0.103)**
[0.052] [0.064] [0.093]***
Mean of dep. variable 0.861 0.861 0.861 0.645 0.645 0.645Observations 2,458 2,458 2,458 1,919 1,919 1,919Number of clusters 55/27 55/27 55/27 55/27 55/27 55/27R-squared 0.370 0.365 0.371 0.232 0.229 0.236Sample: MALE 2000 Kosovo LSMS
Affected cohort (14-15 in 1999) 0.001 -0.218 0.207* Municipality Displacement (0.067) (0.150) (0.172)
[0.071] [0.166] [0.189]Affected cohort (18-19 in 1999) -0.048 0.026 -0.085* Municipality Displacement (0.080) (0.135) (0.200)
[0.098] [0.126] [0.141]
Mean of dep. variable 0.887 0.887 0.887 0.594 0.594 0.594Observations 1,292 1,292 1,292 1,113 1,113 1,113Number of clusters 198/29 198/29 198/29 192/29 192/29 192/29R-squared 0.343 0.316 0.335 0.227 0.219 0.221
Controls Yes Yes Yes Yes Yes YesBirth cohort FE Yes Yes Yes Yes Yes YesPre-war municipality FE Yes Yes Yes Yes Yes YesPost-war municipality FE Yes Yes Yes Yes Yes Yes
Notes: Standard errors clustered at the village of residence are in parentheses. Standard errors clustered atthe municipality level are in brackets.* significant at 10%; ** significant at 5%; *** significant at 1%. Thesamples in both surveys contain individuals aged 14 and above in 1999 for the primary schooling completion andindividuals 18 and above in 1999 for the secondary schooling completion. Individual controls include ethnicity(=1 if Albanian), parental secondary schooling completion, number of siblings and dummy for rural residence.Schooling attainment is a binary indicator. Data source: 1999 Kosovo DSHS and 2000 Kosovo LSMS.
70