Return on Investment for VISIT FLORIDA -...
26
OFFICE OF ECONOMIC & DEMOGRAPHIC RESEARCH Return on Investment for VISIT FLORIDA 1/1/2015
Transcript of Return on Investment for VISIT FLORIDA -...

OFFICE OF ECONOMIC & DEMOGRAPHIC RESEARCH
Return on Investment for VISIT FLORIDA
1/1/2015

Table of Contents
EXECUTIVE SUMMARY AND COMPARATIVE ANALYSIS ................................................................................. 1
OVERVIEW OF VISIT FLORIDA AND ROI ......................................................................................................... 3
INDUCING LOCATION DECISIONS BY VISITORS ............................................................................................. 7
DESCRIPTION OF THE DATA ........................................................................................................................ 10
METHODOLOGY .......................................................................................................................................... 12
KEY ASSUMPTIONS ...................................................................................................................................... 14
SPECIAL NOTE TO KEY ASSUMPTIONS......................................................................................................... 15
PROGRAM FINDINGS ................................................................................................................................... 20
APPENDIX ONE ............................................................................................................................................ 23

1
EXECUTIVE SUMMARY AND COMPARATIVE ANALYSIS Background and Purpose... Legislation enacted in 2013 directs the Office of Economic and Demographic Research (EDR) and the Office of Program Policy Analysis and Government Accountability (OPPAGA) to analyze and evaluate 18 state economic development incentive programs on a recurring three-year schedule.1 EDR is required to evaluate the economic benefits of each program, using project data from the most recent three-year period, and to provide an explanation of the model used in its analysis and the model’s key assumptions. Economic benefit is defined as “the direct, indirect, and induced gains in state revenues as a percentage of the state’s investment” – which includes “state grants, tax exemptions, tax refunds, tax credits, and other state incentives.”2 EDR’s evaluation also requires identification of jobs created, the increase or decrease in personal income, and the impact on state Gross Domestic Product (GDP) for each program. The review period covers Fiscal Years 2010-11, 2011-12, and 2012-13. In this report, the program VISIT FLORIDA is under review. Explanation of Return on Investment... For the purpose of this report, the term return on investment (ROI) is synonymous with economic benefit, and is used in lieu of the statutory term. This measure does not address issues of overall effectiveness or societal benefit; instead, it focuses on tangible financial gains or losses to state revenues and is ultimately conditioned by the state’s tax policy. The ROI is developed by summing state revenues generated by a program less state expenditures invested in the program, and dividing that calculation by the state’s investment. It is most often used when a project is to be evaluated strictly on a monetary basis, and externalities and social costs and benefits—to the extent they exist—are excluded from the evaluation. The basic formula is:
(Increase in State Revenue – State Investment) State Investment Since EDR’s Statewide Model3 is used to develop these computations and to model the induced and indirect effects, EDR is able to simultaneously generate State Revenue and State Investment from the model so all feedback effects mirror reality. The result (a net number) is used in the final ROI calculation. As used by EDR for this analysis, the returns can be categorized as follows:
Greater Than One (>1.0)…the program more than breaks even; the return to the state produces more revenues than the total cost of the incentives.
Equal To One (=1.0)…the program breaks even; the return to the state in additional revenues equals the total cost of the incentives.
Less Than One, But Positive (+, <1)…the program does not break even; however, the state generates enough revenues to recover a portion of its cost for the incentives.
1 Section 288.0001, F.S., as created by s. 1, ch. 2013-39, Laws of Florida & s. 1, ch. 2013-42, Laws of Florida.
2 Section 288.005(1), F.S.
3 See section on Methodology for more details.

2
Less Than Zero (-, <0)…the program does not recover any portion of the incentive cost, and state revenues are less than they would have been in the absence of the program because taxable activity is shifted to non-taxable activity.
The numerical ROI can be interpreted as return in tax revenues for each dollar spent by the state. For example, a ROI of 2.5 would mean that $2.50 in tax revenues is received back from each dollar spent by the state. The basic formula for return on investment is always calculated in the same manner, but the inputs used in the calculation can differ depending on the needs of the investor. Florida law requires the return to be measured from the state’s perspective as the investor, in the form of state tax revenues. In this regard, the ROI is ultimately shaped by the state’s tax code. All of the issues contained in this report shape EDR’s calculation of ROI. Some of them are further addressed in the assumptions and findings. Overall Results and Conclusions... This analysis develops a return on investment for VISIT FLORIDA and evaluates the key factors that affected this return. VISIT FLORIDA’s public marketing spend generated a positive ROI of 3.2. The ROI was estimated by calculating tax revenues which resulted from the share of visitor spending induced by the state’s advertising dollars. A return of greater than 1 means that the tax revenue generated by tourists to the state of Florida more than covers the costs of the state appropriation for VISIT FLORIDA. Factors that affect this positive return on investment are:
Tourists purchase many products that are taxable.
Money generated from the purchase of tourism-related products is generally kept within the local economy.
The investment in VISIT FLORIDA is relatively low compared to the amount of economic activity generated by tourists.
This ROI is a best case scenario given that it is impossible to determine the total amount of advertising dollars spent to promote tourism in a given year. Inclusion of any further funding sources would only serve to reduce the ROI. However, there is at least one factor that is not fully included in the ROI calculated by this report. While EDR believes that VISIT FLORIDA fulfills an important role in shaping and coordinating the state’s advertising message and brand awareness throughout the state, that function is not easily quantifiable in financial terms. It can be better thought of as a societal benefit. However, since the analysis does assume that all advertising is equally effective, a portion of this role is addressed indirectly.

3
OVERVIEW OF VISIT FLORIDA AND ROI Background and Purpose... The Florida Tourism Industry Marketing Corporation, which operates under the name VISIT FLORIDA, is a statutorily created direct-service organization (DSO) of Enterprise Florida, Inc. (EFI).4 It is responsible for executing tourism promotion and marketing services, functions, and programs for the state. 5 VISIT FLORIDA has been the state’s official marketing corporation since 1996. Prior to that, the Legislature created the Florida Commission on Tourism in 1992 to oversee the promotion of the tourism industry for the state. The Legislature declared:
“It is the intent of the Legislature to establish a public-private partnership to provide policy direction to and technical expertise in the promotion and marketing of the state’s tourism attributes…By creating this public-private partnership, it is the intent of the Legislature to coordinate existing private and public-funded tourism promotional activities in a cost-effective manner to avoid waste and duplication in the activities while achieving the maximum public benefit from all expenditures that directly and indirectly support Florida tourism.” 6
After VISIT FLORIDA’s creation, the commission contracted with it to carry out the programs and activities identified in the commission’s four-year marketing plan. In 2011, the Legislature consolidated Florida’s existing public-private economic development partnerships. Among the changes made by the Legislature, it abolished the Florida Commission on Tourism and created the Division of Tourism Marketing (division) within EFI. The law also directed EFI to contract with VISIT FLORIDA to execute tourism promotion and marketing services for the state.7 EFI is directed to appoint thirty-one tourism-industry-related members representing all geographic areas of the state to the DSO’s Board of Directors. Functioning as division staff, VISIT FLORIDA must develop a four-year marketing plan, which is annually reviewed and approved by the EFI board of directors.8 VISIT FLORIDA promotes tourism through industry relations, marketing, branding, new product development, promotions, public relations, sales, and visitor services, both domestically and internationally. Among its activities, VISIT FLORIDA:
Conducts research on tourism and travel trends;
Creates and implements domestic and international advertising campaigns;
Creates and implements marketing programs to connect visitors with nature-based, heritage, cultural, and rural tourism experiences;
Operates the five Official Florida Welcome Centers;
4 See s. 288.1226, F.S. Direct-Service Organizations are statutorily created entities, usually required to be non-profit
corporations, that are authorized to carry out specific tasks in support of public entities or public causes. 5 Section 288.923, F.S.
6 See ss. 288.1221 - 1224, F.S. (2010); Sections 1 -7, ch. 92-299; and s. 49, ch. 96-320, L.O.F.
7 See ss. 30 and 31, ch. 2011-142, L.O.F., and ss. 288.92 and 288.923, F.S. See also s. 485, ch. 201-142, L.O.F., which repealed the
statutory authority for the Florida Commission on Tourism in ss. 288.1221-1224, F.S. 8 Section 288.923, F.S.
4
Maintains international representation in the United Kingdom, Europe, Canada, Latin America, and Japan;
Represents Florida at consumer shows and sales missions; and
Administers several reimbursement grant programs.
VISIT FLORIDA works to partner with businesses, destinations, and local convention visitor bureaus known as Destination Marketing Organizations (DMOs) throughout the state.9 Altogether, VISIT FLORIDA has approximately 11,000 tourism industry partners, and its board is comprised of major tourism industry associations. VISIT FLORIDA engages in cooperative advertising and promotional activities to enhance brand awareness and leverage funds for marketing efforts. In order to participate in cooperative advertising and promotions, partners must make contributions. These matching funds are combined with VISIT FLORIDA’s annual appropriation from the state to maximize VISIT FLORIDA’s advertising budget.10 For the years in the review period, VISIT FLORIDA reports they received:
For FY 2010/11, $26.6m (State) and $57.1m (private);
For FY 2011/12, $34.9m (State) and $94.3m (private); and
For FY 2012/13, $54.0m (State) and $108.6m (private).
VISIT FLORIDA Return on Investment… VISIT FLORIDA has established several in-house grant programs, such as the Airline Grant Program, but statutorily is only required to administer the Advertising Matching Grant Program and the Minority Convention Grant Program. Both of these grant programs have an annual appropriation of $40,000 per
9 http://www.oppaga.state.fl.us/profiles/6112/05/ & http://www.visitflorida.org; http://www.visitflorida.org/grants
10http://www.visitflorida.org/about-us/
Public Private Public Private Public Private
Marketing Expenses 25,088,195 50,230,570 32,131,450 88,587,072 47,264,539 101,611,222
Marketing 2,505,420 266,804 2,680,981 275,192 3,115,867 278,802
Advertising/Internet/Direct Marketing/Brand 17,075,825 15,677,585 23,062,001 20,982,993 36,117,969 24,715,106
Research 576,065 6,052 630,051 6,088 840,551 55,692
Promotions 725,411 33,181,718 1,081,465 66,919,031 1,595,377 76,235,247
Public Relations 607,408 7,500 692,710 2,752 633,615 1,865
New Product Development 277,002 607,402
Meeting & Events 3,321,064 483,509 3,984,242 401,016 4,961,160 324,510
Visitor Services (Welcome Centers) 2,927,085 97,852 2,914,512 82,875 3,043,997 88,460
Industry Relations & Sale Expenses 0 874,636 0 852,233 0 1,037,822
General & Administrative Expenses 3,055,112 528,080 3,318,683 551,182 3,792,699 563,430
Total Expenses 31,070,392 51,731,138 38,364,645 90,073,362 54,101,235 103,300,934
State Funding 26,647,961 0 34,899,209 0 54,000,000 0
Private Funding 0 57,095,398 0 94,283,508 0 108,643,632
Funding over Expenses (funding less expenses) (4,422,431) 5,364,260 (3,465,436) 4,210,146 (101,235) 5,342,698
Capital Outlay (141,253) 0 (399,219) 0 (2,700,625) (900,000)
Over/Short (Funding) (4,563,714) 5,364,259 (3,864,655) 4,210,144 (2,801,858) 4,442,698
FY 2010-11 FY 2011-12 FY 2012-13
VISIT FLORIDA Actual Spending by Category and Funding Source

5
program. The Advertising Matching Grant is a matching grant program with awards of up to $2,500, while the Minority Convention Grant awards may vary by applicant. VISIT FLORIDA also operates the state’s five official Welcome Centers. Four of the Welcome Centers are located along the main interstates leading into the state, and the fifth Welcome Center is located in the state capitol building. The Department of Transportation owns the buildings that house the four highway Welcome Centers, but the centers are staffed and managed by VISIT FLORIDA. The Welcome Centers do not sell a product, but rather provide incoming visitors with information on travel, highways, cities, attractions and the like. In determining the calculation of VISIT FLORIDA’s return on investment, EDR chose to include the spending associated with the two statutorily required grant programs and the Florida Welcome Centers with VISIT FLORIDA’s overall spending. Given the size of Florida’s economy and the relative size of the appropriations for these programs, an individual ROI for each program was not feasible. Tourism as an Industry... Tourism, while often described as an industry, is not an industry as defined by the U.S. Census Bureau’s North American Industry Classification System (NAICS). NAICS defines an industry as a group of businesses that produce a like product or provide a service. They are classified in accordance with the goods and services they produce. In contrast, tourists purchase goods and services across all industries rather than in one specific industry. To list just a few of the more common areas, tourists purchase from the transportation, accommodation, food and beverage, and retail industries. Tourism economic-related activity is defined by the consumer based on his or her personal characteristics as opposed to the final good or service being sold. For example, The Florida Department of Revenue collects sales tax returns from Florida’s retail establishments and each business is classified by the “kind” of business that business operates. The “Tourism and Recreation” category contains the taxable sales of businesses such as hotels and motels, bars and restaurants, liquor stores, photo and art stores, gift shops, admissions, sporting goods, and jewelry stores. In the capture of sales tax data, there is no way to differentiate the sales associated with tourists from that of Florida’s residents purchasing the same goods and services. Thus, a major challenge in calculating the economic impact of tourists on the state’s economy is the lack of a distinct tourism industry. This analysis estimated the additional economic activity (indirect and induced effects) generated by the direct economic activity of tourists visiting the state. For example, tourists staying overnight at a hotel generate income for the hotel (direct). The hotel will then purchase supplies and/or services such as food to feed hotel guests or laundry services to clean the guests’ linens. Both of these activities are indirect effects. In addition, hotel employees will spend their paychecks in the economy buying groceries and visiting dining and entertainment establishments. These are induced effects. By including indirect and induced activity, the impact analysis becomes more comprehensive than typical financial impacts developed by state governments. For the most part, purchases made by tourists are products such as hotel accommodations and entertainment whose inputs to production are sourced locally. Thus, much of the money generated from the purchase of tourism-related products remains in the local economy. Furthermore, many of the products are taxable.

6
State Revenues in Context…
In an unrelated study, the Office of Economic and Demographic Research performed an empirical analysis of the source of the state’s sales tax collections. In Fiscal Year 2013-14, sales tax collections provided $19.7 billion dollars or 75 percent of Florida’s total General Revenue collections. Of this amount, an estimated 12.5 percent (nearly $2.5 billion) is attributable to purchases made by tourists.
Assuming the same shares applied to Fiscal Years 2010-11 through 2012-13 sales tax collections, slightly less than $6.54 billion of sales tax collections over the period would be attributable to tourists. Of this total for tourism, the ROI analysis shows $245.3 million is attributable to VISIT FLORIDA. Over the period, this is equivalent to 3.7 percent of the tourism-related dollars or one-half of one percent of all state sales tax collections in total. The rest of the sales tax attributed to tourism would be credited to other sources. Substitution Effect on Resident Spending…
Spending associated with in-state resident tourism is not included in the return on investment analysis. The tangible economic benefits of tourism on the economy are primarily the result of an influx of new spending by out of state visitors. In-state residents do not generate new spending, rather, in-state resident tourism leads to reduced spending in other sectors of the economy. In other words, residents will substitute limited disposable income of one purchase for another: a day at an amusement park versus a day at a local sporting event.
Households $12,015.47 60.97%
Tourists $2,457.43 12.47%
Business $5,234.80 26.56%
Total $19,707.70
FY 2013-14 Estimated GR Collections from Sales Tax

7
INDUCING LOCATION DECISIONS BY VISITORS VISIT FLORIDA’s mission is to promote and drive visitation to and within the state of Florida. It strives to establish Florida as the number one travel destination in the world. To accomplish this goal, marketing the state and increasing awareness of the state’s brand are integral to VISIT FLORIDA’s mission. Marketing requires strategic planning and implementation to bring together buyers and sellers for the mutually advantageous exchange or transfer of products or services. A key component of marketing is advertising. Advertising is the paid public announcement of a persuasive message, presentation, or promotion by a firm of its products and services to its existing and potential customers. It is the part of marketing that involves getting the word out concerning the business, product, or services offered. Advertising includes the placement of an ad in such mediums as newspapers, magazines, direct mail, billboards, television, film, radio, and the Internet. For tourism, advertising is designed to provide consumers with the necessary information to differentiate between potential destinations and influence the consumers’ overall destination choice(s). Tourism advertising may influence not only a potential visitor’s initial choice but also timing and length of stay. Furthermore, tourism is usually a product consumers cannot sample prior to purchase; tourism advertising seeks to assure risk adverse consumers that the destination is a reputable, quality location choice. Lastly, tourism advertising seeks to entice visitors to repeat their destination choices time and time again. Consumers have many destination choices, and what sets one location apart from others is a strong and clearly defined image or brand. Preferences for particular tourism destinations are largely dependent on the positive perceptions of those destinations. According to Larry Dwyer:
“The infrastructure in which a country’s tourism industry relies, such as its roads, railways, airports and terminals, accommodation facilities, shopping, entertainment, restaurants, currency exchange facilities, telecommunications and so on are major determinants of its overall destination competitiveness including destination ‘experience’.”11
Advertising is one of the most efficient means of conveying the positive images of a destination and ensuring that the brand remains positive in consumers’ minds. The American Marketing Association defines a brand as the "name, term, design, symbol, or any other feature that identifies one seller's goods or service as distinct from those of other sellers." Additionally, "A brand is a customer experience represented by a collection of images and ideas.”12 What is Florida’s brand? What makes Florida unique? Undeniably, one part of the Florida brand is sunshine. The state’s nickname is the Sunshine State. It is also Florida’s historic cities such as St.
11 Dwyer, Larry, Peter Forsyth and Wayne Dwyer, Tourism Economic and Policy. (Buffalo, NY: Channel View Publications, 2010),
21. 12
https://www.ama.org/resources/Pages/Dictionary.aspx
8
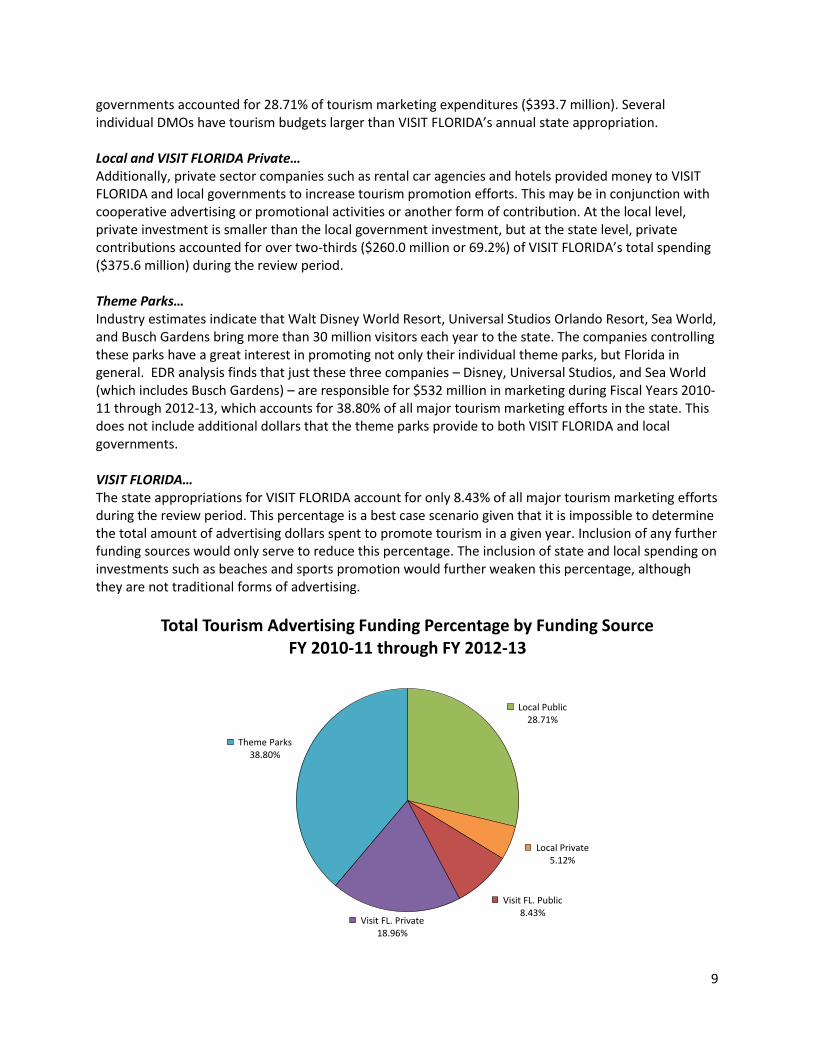
Augustine, the many professional and amateur sporting events from baseball to golf, the state and national parks such as the Everglades, and water sports from boating to bass fishing. With Orlando known as the theme park capital of the world, the Florida brand is also captured in images of Walt Disney World and Florida’s other theme parks. Lastly, Florida is known worldwide for its miles and miles of beaches. Negative perception of any one of these components acts to diminish Florida’s brand. The Florida brand is marketed and advertised by many stakeholders which include the state, local governments, private businesses, and theme parks. Additionally, it is marketed from a social media perspective where location reviews, ratings, and word-of-mouth advertising influence the consumers’ choices. From the consumer’s perspective, it may be that this total combination of tourism promotion is necessary to his or her destination decision. For the purposes of this analysis, EDR identified those groups whose major marketing efforts have been significant and sustained over time. While many groups and individual businesses help to market the state as a tourist destination, the major contributors discussed below are the most significant in terms of advertising dollars spent. The ROI is based on the state’s investment in advertising and the statutory definition of economic benefit. The result reflects the best case scenario for the state’s investment given that the major advertising sources referenced do not comprise an exhaustive list. Local and Private Investments... Tourism promotion funded by state appropriations may also receive funding from other sources such as local governments, private companies, and Florida’s theme parks. VISIT FLORIDA and these other entities, either through contribution to VISIT FLORIDA or through their own promotional activities, spent an estimated $1.37 billion during Fiscal Years 2010-11 through 2012-13 to attract tourists to the state. See chart below.
*Not adjusted for beaches Local Public… Fifty-three counties levy the Tourist Development Tax authorized in s. 125.0104(3), Florida Statutes. Whether on their own or through their designated Destination Marketing Organization (DMO), these local governments promote travel destinations, attractions, and events in their areas. Of the estimated $1.37 billion spent on tourism promotion during Fiscal Years 2010-11 through 2012-13, local
Local Public Local Private Visit FL. Public Visit FL. Private Theme Parks Total
115,563,384$ 22,168,077$ 26,647,961$ 57,095,398$ 171,024,141$ 392,498,962$
29.44% 5.65% 6.79% 14.55% 43.57% 100.00%
Local Public Local Private Visit FL. Public Visit FL. Private Theme Parks Total
138,726,621$ 22,929,229$ 34,899,209$ 94,283,508$ 176,959,120$ 467,797,687$
29.66% 4.90% 7.46% 20.15% 37.83% 100.00%
Local Public Local Private Visit FL. Public Visit FL. Private Theme Parks Total
139,393,315$ 25,058,354$ 54,000,000$ 108,643,632$ 184,080,826$ 511,176,127$
27.27% 4.90% 10.56% 21.25% 36.01% 100.00%
Local Public Local Private Visit FL. Public Visit FL. Private Theme Parks Total
393,683,320$ 70,155,660$ 115,547,170$ 260,022,538$ 532,064,087$ 1,371,472,776$
28.71% 5.12% 8.43% 18.96% 38.80%
2012-2013
Direct Tourism Advertising Funding by Funding Source by Fiscal Year *
Total for all
three years
2010-2011
2011-2012
9
governments accounted for 28.71% of tourism marketing expenditures ($393.7 million). Several individual DMOs have tourism budgets larger than VISIT FLORIDA’s annual state appropriation. Local and VISIT FLORIDA Private… Additionally, private sector companies such as rental car agencies and hotels provided money to VISIT FLORIDA and local governments to increase tourism promotion efforts. This may be in conjunction with cooperative advertising or promotional activities or another form of contribution. At the local level, private investment is smaller than the local government investment, but at the state level, private contributions accounted for over two-thirds ($260.0 million or 69.2%) of VISIT FLORIDA’s total spending ($375.6 million) during the review period. Theme Parks… Industry estimates indicate that Walt Disney World Resort, Universal Studios Orlando Resort, Sea World, and Busch Gardens bring more than 30 million visitors each year to the state. The companies controlling these parks have a great interest in promoting not only their individual theme parks, but Florida in general. EDR analysis finds that just these three companies – Disney, Universal Studios, and Sea World (which includes Busch Gardens) – are responsible for $532 million in marketing during Fiscal Years 2010-11 through 2012-13, which accounts for 38.80% of all major tourism marketing efforts in the state. This does not include additional dollars that the theme parks provide to both VISIT FLORIDA and local governments. VISIT FLORIDA… The state appropriations for VISIT FLORIDA account for only 8.43% of all major tourism marketing efforts during the review period. This percentage is a best case scenario given that it is impossible to determine the total amount of advertising dollars spent to promote tourism in a given year. Inclusion of any further funding sources would only serve to reduce this percentage. The inclusion of state and local spending on investments such as beaches and sports promotion would further weaken this percentage, although they are not traditional forms of advertising.
Local Public28.71%
Local Private5.12%
Visit FL. Public8.43%
Visit FL. Private18.96%
Theme Parks38.80%
Total Tourism Advertising Funding Percentage by Funding Source FY 2010-11 through FY 2012-13

10
DESCRIPTION OF THE DATA Data Source and Development of the Universe... The law requires EDR and OPPAGA to analyze and evaluate VISIT FLORIDA’s performance over the previous three years.13 The report for the first three-year period is scheduled for release January 1, 2015, and includes Fiscal Years 2010-11, 2011-12, and 2012-13. In this regard, VISIT FLORIDA was instructed to provide EDR with visitor data for the three-year review period. International data for calendar year 2013 is based on preliminary estimates. When available, submitted information includes the number of domestic and international visitors to the state, the amount of visitor spending, and the dollars spent on tourism promotion. Only data related to the three-year review period is considered in the evaluation. VISIT FLORIDA Data… VISIT FLORIDA produces two annual publications: the Florida Visitor Study and the Return on Investment Influencer Study. These publications are the primary source for data related to Florida visitor counts and expenditures and are obtained through survey methodology. “The Florida Visitor Study” evaluates data on the travel patterns of Florida residents and domestic and overseas visitors. VISIT FLORIDA obtains domestic travel data from D.K. Shifflet & Associates,14 while international travel data is primarily obtained from the U.S. Department of Commerce’s International Trade Administration. VISIT FLORIDA also uses data provided by VisaVue Travel and other independent research sources. “The Return on Investment Influencer Study,” conducted annually online by Toluna USA, Inc., surveys 500 domestic visitors who had visited Florida in the past year. The survey asks respondents what items influenced their decision to choose Florida as a travel destination. The 2013 survey, comprised of 19 influencing items, gauged the respondents’ considerations when choosing Florida as a destination. Each item was ranked on a scale of 1 – 5, with 5 representing a “very important” factor in the decision-making process. Six of the 19 items are directly attributable to VISIT FLORIDA’s advertising efforts. Other items in the survey include outside influencers, such as brochures at trade shows, advertising by individual Florida locations, and information found on other websites. Non-marketing items such as having family and friends to visit were also considered. Respondents are allowed to choose multiple influencing items. Local Government Expenditures… Data on local government expenditures for tourism promotion were obtained through a survey conducted by EDR. EDR surveyed the 53 counties that levy the Tourist Development Tax authorized in s. 125.0104(3), Florida Statutes, and requested expenditure data for the three fiscal years under review. Respondents were asked to separate public from private funding to determine the amount of funds from public appropriations. Respondents were also given a list of 10 potential reasons why tourists visit the respondent’s county and asked to rank them in order of importance, with 1 being highest.
13
Section 288.0001, F.S., as created by s. 1, ch. 2013-39, Laws of Florida and s. 1, ch. 2013-42, Laws of Florida. 14
D.K. Shifflet Survey Methodology

11
Responses were received from representatives of 28 DMOs, including those representing Florida’s most popular tourist destinations. Theme Park Expenditures… EDR estimated the advertising expenditures of Florida’s major theme parks by utilizing financial records from the companies’ SEC filings, visitor data provided by the Global Attractions Attendance Report produced by the Themed Entertainment Association and the AECOM Economics Practice, and media reports on advertising contracts held by the theme parks. Characteristics of the Universe... VISIT FLORIDA provided visitor data for four calendar years and budget data for the three fiscal years under review. The state of Florida hosted 354,697,000 visitors during calendar years 2010-2013. As shown in the chart below, domestic visitors accounted for 85.74% of all visitors in that timeframe. Domestic visitors are defined as U.S. visitors not residing in the state of Florida.
Number of Visitors by Calendar Year
The visitor spending for the four calendar years is estimated at $275.4 billion. In 2011, while visitors increased overall, domestic leisure visitor spending decreased 20% as a result of shorter stays and a decrease in spending across the board, mainly related to transportation.
Estimated Spending for Leisure Visitors by Calendar Year
*Source: VISIT FLORIDA Visitor Study. International data for 2013 is based on preliminary estimates. Spending for domestic visitors is calculated by EDR using the number of visitors x average expenditure per day x average nights per stay for all domestic leisure visitors.
2010 2011 2012 2013
Number of Visitors 82,315,000 87,308,000 91,411,000 93,663,000
Domestic Visitors 71,181,000 74,666,000 77,596,000 78,767,000
International Visitors 11,134,000 12,642,000 13,815,000 14,896,000
2010 2011 2012 2013*
Total Expenditures 66,795,289,114$ 58,795,239,520$ 72,454,230,000$ 77,284,704,200$
Domestic Visitors 56,145,415,200$ 44,792,496,320$ 57,588,930,000$ 61,199,404,200$
International Visitors 10,649,873,914$ 14,002,743,200$ 14,865,300,000$ 16,085,300,000$

12
METHODOLOGY Broad Approach... EDR used the Statewide Model to estimate the return on investment for VISIT FLORIDA. The Statewide Model is a dynamic computable general equilibrium (CGE) model that simulates Florida’s economy and government finances.15 Among other things, it captures the indirect and induced economic activity resulting from the direct program effects. This is accomplished by using large amounts of data specific to the Florida economy and fiscal structure. Mathematical equations16 are used to account for the relationships (linkages and interactions) between the various economic agents, as well as likely responses by businesses and households to changes in the economy.17 The model also has the ability to estimate the impact of economic changes on state revenue collections and state expenditures in order to maintain a balanced budget by fiscal year. When using the Statewide Model to evaluate economic programs, the model is shocked18 using static analysis to develop the initial or direct effects attributable to the programs funded by the state. In this analysis, the annual direct effects (shocks) of the program took the form of a counter-factual:
Removal of the program funding from the state budget.
Removal of expenditures attributable to visitors. The model was then used to estimate the additional—indirect and induced—economic effects generated by the program. This includes the supply-side responses to tourism activity, where the supply-side responses are changes in investment and labor supply arising from that activity. Indirect effects are the changes in employment, income, and output by local supplier industries that provide goods and services to support the direct economic activity. Induced effects are the changes in spending by households whose income is affected by the direct and indirect activity. All of these effects can be measured by changes (relative to the baseline) in the following outcomes:
State government revenues and expenditures
Jobs
Personal income
Florida Gross Domestic Product
Gross output
Household consumption
Investment
15
The statewide economic model was developed using GEMPACK software with the assistance of the Centre of Policy Studies (CoPS) at Monash University (Melbourne, Australia). 16
These equations represent the behavioral responses to economic stimuli – to changes in economic variables. 17
The business reactions simulate the supply-side responses to the new activity (e.g., changes in investment and labor demand). 18
In economics, a shock typically refers to an unexpected or unpredictable event that affects the economy, either positive or negative. In this regard, a shock refers to some action that affects the current equilibrium or baseline path of the economy. It can be something that affects demand, such as a shift in the export demand equation; or, it could be something that affects the price of a commodity or factor of production, such as a change in tax rates. In the current analyses, a shock is imposed to simulate the effect of tourist-related spending in the economy.

13
Population
EDR’s calculation of the return on investment used the model’s estimate of net state revenues and expenditures. Other required measures for this report include the number of jobs created, the increase or decrease in personal income, and the impact on gross state product, all of which are included in the model results. Treatment of Statutorily Required Private Matches … Required matching funds from private entities were excluded from the state payments used in the Statewide Model. In the analysis, visitors were allocated as shares of total advertising dollars. The state share was then used to derive visitor expenditures. Since matching funds were included in total payments but excluded from state payments, visitors that would have been attributable to these dollars, and thus the corresponding expenditures, have been excluded from the analysis of the state’s investment.

14
KEY ASSUMPTIONS The following key assumptions are used in the Statewide Model to determine the outcomes of the programs under review. Some of the assumptions are used to resolve ambiguities in the literature, while others conform to the protocols and procedures adopted for the Statewide Model.
1. The analysis assumes all data provided by VISIT FLORIDA and other local and private entities was
complete and accurate. The data was not independently audited or verified by EDR.
2. The analysis assumes that given the time span under review, applying discount rates would not prove material to the outcome.
3. The analysis assumes that any state expenditure made for tourism promotion is a redirection from the general market basket of goods and services purchased by the state. Similarly, any revenue gains from increased business activities are fully spent by the state.
4. The analysis assumes the relevant geographic region is the whole state, not individual counties or regions. The model accounts and makes adjustments for the fact that industries within the state cannot supply all of the goods, services, capital, and labor needed to produce the state’s output.
5. This analysis assumes that VISIT FLORIDA’s grant program and Welcome Center promotions are not individually measurable by Return on investment. These dollars have been included as expenditures in the overall analysis of VISIT FLORIDA.
6. This analysis assumes that any unique value attributed to the cohesiveness of the state’s brand (likely a positive adjustment to incorporate) is offset by assuming all commercials and promotional activities are equally effective (would entail a negative adjustment to relax).
7. This analysis assumes that not all visitors to the state of Florida come as a result of marketing or
advertising efforts and that other factors influence visitors’ destination decisions.
8. This analysis assumes that while some visitors to the state come as a result of marketing efforts, not all visitors to the state of Florida are attributable to VISIT FLORIDA’s marketing efforts.
9. This analysis assumes that beach restoration and maintenance is essential to maintaining Florida’s brand. While other state investments may serve a similar purpose, they have not been separately addressed in this report since they fulfill multiple functions for residents and tourists. Those expenditures would be needed for residents, regardless of tourists.

15
SPECIAL NOTE TO KEY ASSUMPTIONS This analysis assumed that not all visitors to the state of Florida came as a result of marketing efforts. While marketing plays a large and instrumental role in attracting tourists to the state of Florida, it is not the only reason visitors choose to come to Florida. Among the many other reasons, people travel to visit friends and family, compete in sporting events, or to attend business meetings. These reasons may have nothing to do with advertising. Moreover, as most tourists are risk adverse, a primary motivator for selecting a travel destination may be returning to a destination that is known. VISIT FLORIDA acknowledges this fact in their annual Return on Investment Influencer Study which indicates that more than 95 percent of respondents had previously visited the state. The study asks survey respondents what items influenced their decision to choose Florida as a travel destination. Respondents were given a choice of 19 influencing items, seven of which were determined by EDR to be primarily non-marketing related. Non-marketing related items are highlighted in blue.
VISIT FLORIDA Influencer Study Results 2010-2013
While the Return on Investment Influencer Study has limitations, EDR used the survey results as a proxy to determine the annual number of visitors who were influenced by marketing efforts to visit the state of Florida. Since VISIT FLORIDA’s survey methodology allows respondents to choose more than one influencer item, the responses were normalized to allow for only one response per respondent. The results indicated that marketing-related influencers accounted for approximately 54.5 percent of visitor
Direct VISIT FLORIDA Influencers 2010 2011 2012 2013
VISIT FLORIDA Website 4.8% 5.1% 5.1% 4.5%
A Stop at an Official Florida Welcome Center on a previous trip to Florida 3.9% 4.7% 4.6% 4.7%
A VISIT FLORIDA publication 3.9% 4.1% 3.7% 4.2%
VISIT FLORIDA social media n/a n/a 3.7% 3.8%
VISIT FLORIDA radio, TV, online, magazine/newspaper ad, not destination specific n/a 4.6% 3.5% 4.1%
VISIT FLORIDA TV advertising, not for a specific destination 3.5% n/a n/a n/a
VISIT FLORIDA magazine/newspaper advertising, not for a specific destination 3.4% n/a n/a n/a
VISIT FLORIDA radio advertising, not for a specific destination 2.1% n/a n/a n/a
A sweepstakes/contest by VISIT FLORIDA heard or seen on radio, TV, or online 2.0% 3.0% 2.9% 2.9%
Other Influencers 2010 2011 2012 2013
A previous trip to Florida 13.5% 13.3% 14.4% 12.9%
Have family or friends to visit 11.6% 10.8% 10.7% 10.2%
Any advertising for a specific FL theme park 8.0% 6.7% 6.5% 6.7%
Information from the Internet other than VISIT FLORIDA 7.7% 6.8% 6.4% 6.1%
A hobby, pastime, or passion followed (golf, nature, small towns, spring training) 6.0% 5.8% 5.9% 6.4%
Information about special events or festivals in FL 5.4% 5.5% 5.6% 5.0%
Any advertising for a specific FL location , excluding theme parks 6.4% 5.4% 5.3% 5.3%
A travel article in a newspaper or magazine about a FL vacation experience 4.6% 5.0% 4.6% 4.3%
Any information from social media n/a 4.5% 4.0% 4.8%
The vacation in Florida was in connection with a cruise using FL port 3.8% 4.1% 4.0% 4.3%
The recommendation of a travel agent 3.7% 3.5% 3.1% 3.5%
Brochures obtained at consumer trade shows 2.9% 3.5% 3.0% 3.3%
Went on a business trip that was extended into a vacation 2.5% 3.4% 2.9% 2.8%
Marketing Related Influencers 54.1% 54.0% 54.4% 55.5%
Non-Marketing Related Influencers 45.9% 46.0% 45.6% 44.5%

16
responses and non-marketing related influencers accounted for approximately 45.5 percent of visitor responses in 2010-2013. The percentages of marketing and non-marketing related influencers were applied against the total visitor count (see chart on page 11) reported for the state for each year.
Visitor Breakout by Influencer Type
The breakout of visitors is shown in the chart above with marketing-related visitors shown in red. The non-marketing related visitors were removed from the Return on investment analysis as it was deemed that these visitors would have come to the state regardless of marketing, and advertising was not the primary factor in the visitors’ destination decision. This includes visitors who primarily visit Florida to attend sporting events, like those associated with the Florida Sports Foundations’ efforts. Overall, marketing efforts accounted for 55 percent of visitors to Florida during the review period, but this analysis further assumed that not all marketing-related visitors to the state are attributable to VISIT FLORIDA’s marketing efforts. There are many other entities that engage in the similar promotion of Florida as a tourism destination. Since it is likely that the total combination of advertising efforts ultimately cause some consumers to take action, the economic activity associated with tourism promotion cannot be attributed to any single entity. To obtain the appropriate number of visitors to credit to VISIT FLORIDA’s marketing efforts, EDR used the percentage of advertising dollars provided by VISIT FLORIDA’s public appropriation relative to all other advertising funding sources (See chart on page 8).
Marketing Related Visitors
55%
Non-Marketing Related Visitors
45%
2010-2013
3.03 3.52 5.25 5.54
41.5543.63
44.48 46.44
-
10
20
30
40
50
60
2010 2011 2012 2013
Mill
ion
s
Marketing Related Visitors
VISIT FLORIDA - Public Funding All Other Marketing
44.57 47.15 49.73 51.97
37.7440.16
41.68 41.69
0
10
20
30
40
50
60
70
80
90
100
2010 2011 2012 2013
Mill
ion
s
Number of Marketing Related Visitors Number of Non-Marketing Related Visitors

17
As a share of total tourism advertising spending, VISIT FLORIDA is responsible for approximately 3.03, 3.52, 5.25, and 5.54 million visitors during calendar years 2010, 2011, 2012, and 2013 respectively. The remaining 38 million plus marketing related visitors are credited with being attributable to all other marketing efforts conducted by local governments, theme parks, and private entities. Visitors who were deemed attributable to VISIT FLORIDA’s marketing efforts were divided into international and domestic travelers. Expenditures were calculated separately to accommodate the difference in spending patterns between domestic and international travelers.
Visitors and Spending Attributable to VISIT FLORIDA’s Public Marketing Spend
In addition to developing the return on investment for VISIT FLORIDA, EDR has been tasked with identifying the strength of the relationship between Florida’s beaches and the state’s attractiveness as a tourism destination, including the impact on the state’s brand. As stated on page 7, there are many aspects to the state’s brand. From beaches and state parks to theme parks and sporting events, Florida provides tourists with a variety of enticing attractions. These features naturally have varying degrees of attractiveness to visitors. In order to evaluate the relationship between Florida’s beaches and the state’s attractiveness as a tourism destination and the impact on the state’s brand, EDR surveyed the various local governments that levy the Tourist Development Tax authorized in s. 125.0104(3), Florida Statutes, or their respective DMO. Respondents were given a list of 10 potential reasons why tourists visit the respondent’s county and asked to rank them in order of importance, with 1 being highest. Responses were received from representatives of 28 DMOs, including those representing Florida’s most popular tourist destinations. Due to limited responses and limited activities in certain counties, only the top three activities were considered. The rankings were then quantified by giving 3 points to each primary feature, 2 points to each secondary feature and 1 point to each tertiary feature. This accounts for the attractiveness of activities within each area, but does not consider that each geographic area draws in a different number of tourists. Tourist counts were unavailable for the exact areas of the respondents. The count of motel and hotel rooms in each county, however, is available from the Department of Business and Professional Regulation (DBPR) and serves as a reasonable proxy to the number of visitors. Weighting the previously quantified rankings by the number of accommodations in each area provides a measure with which each feature can be ranked over all geographic areas. Taking each measure as a percent of the total provides a strong concept of the state’s brand and each feature’s contribution to it. The results are shown in the table on the following page.
2010 2011 2012 2013
Total Visitors 3,026,223 3,517,526 5,253,559 5,535,254
Domestic Visitors 2,616,893 3,008,196 4,459,586 4,654,936
International Visitors 409,330 509,330 793,974 880,317
Total Spending 2,173,112,344$ 2,110,621,364$ 3,663,875,345$ 3,992,137,253$
Domestic Spending 1,784,930,636$ 1,543,325,126$ 2,809,539,035$ 3,041,535,485$
International Spending 388,181,709$ 567,296,238$ 854,336,310$ 950,601,768$

18
Features of Florida that Attract Tourists
Feature
Portion of State Brand
Beaches 25.5%
Theme Park 24.3%
Retail/Dining/Nightlife 21.8%
Outdoor Recreation 7.1%
Access to International Ports or Airports 6.7%
Sports 6.0%
Festivals 4.3%
Parks/Natural Site 2.7%
Historical Significance 1.6%
Film Induced Tourism 0.0%
Source: EDR analysis of self-conducted survey results
The results indicate that beaches are the most important feature of Florida’s brand, and it is the strongest in terms of attracting tourists. The beaches are followed closely by theme parks and retail, dining and nightlife, after which there is a significant drop to the remaining six features. Most visitors do not engage in only one feature, however, and it is a combination of features, or the state’s brand as a whole, that draws tourists to Florida. This analysis assumes that beach restoration is essential to maintaining Florida’s brand. As such, the expenditures associated with beach visitors must be evaluated separately. While other state investments may serve a similar purpose, they have not been separately addressed in this report since they fulfill multiple functions for residents and tourists. Those expenditures would be needed for residents, regardless of tourists. VISIT FLORIDA’s Florida Visitor Study includes information regarding activities visitors undertook while visiting the state. EDR used this activity data to establish an estimate of the number of visitors who come to Florida for beach related activities and the corresponding expenditures associated with their existence. During calendar years 2010-2013, it is estimated that roughly 20 percent of all domestic visitor tourism spending was attributable to the existence of beaches. That is not to say that the spending occurred in and around Florida’s beaches, but that a portion of the overall trip was induced by the beaches. To gauge the number of visitors who visit Florida’s beaches as a result of marketing efforts, EDR applied the percentage of beach spending (roughly 20 percent in each year) to the number of marketing and non-marketing related visitors.

19
During the review period EDR estimated that 39.1 million visitors visited Florida’s beaches as a result of some form of marketing (state, local, private, etc). Given that EDR’s survey results indicate that Florida’s beaches are the most important feature of the state’s brand and the strongest in terms of attracting tourists, EDR assumed that the beach brand itself was responsible for attracting visitors to the state. As such, spending associated with those visitors could not be attributable directly to VISIT FLORIDA’s marketing efforts. In order to calculate the spending of beach visitors attributable to Florida’s beach branding, EDR used the state’s investment in beach restoration as a proxy of the state’s value of the beach as a brand. This value was estimated to be between 5.34-8.70 percent of total marketing-related expenditures, depending on the year during the review period.19 The dollars produced by this percentage were proportionally subtracted from total visitor spending attributable to VISIT FLORIDA’s public marketing spend. The result is the total tourism spending that EDR attributed to VISIT FLORIDA’s public marketing efforts during the review period. This spending was then used the in the Statewide Model to determine the ROI for VISIT FLORIDA.
Total Tourism Spending Attributable to VISIT FLORIDA’s Public Marketing Spend by Year
19
This percentage was calculated by using beach restoration dollars as a share of total marketing funds, treating state, local, and federal beach investment separately. The result was applied to the total number of marketing related beach visitors to calculate the expenditures associated with those visitors.
2010 2011 2012 2013 Total
Number of Marketing Related Visitors 44,573,368 47,149,798 49,731,373 51,974,211 193,428,751
Number of Non-Marketing Related Visitors 37,741,632 40,158,202 41,679,627 41,688,789 161,268,249
Domestic Beach Spending Activity % 20.53% 20.16% 19.60% 20.66%
Number of Marketing Related Beach Visitors 9,149,700 9,505,143 9,746,133 10,740,016 39,140,992
Number of Non-Marketing Related Beach Visitors 7,747,331 8,095,675 8,168,187 8,614,623 32,625,816
Total Beach Visitors 16,897,031 17,600,817 17,914,320 19,354,639 71,766,808
2010 2011 2012 2013
Total Visitors 3,026,223 3,517,526 5,253,559 5,535,254
Domestic Visitors 2,616,893 3,008,196 4,459,586 4,654,936
International Visitors 409,330 509,330 793,974 880,317
Total Spending 2,173,112,344$ 2,110,621,364$ 3,663,875,345$ 3,992,137,253$
Domestic Spending 1,784,930,636$ 1,543,325,126$ 2,809,539,035$ 3,041,535,485$
International Spending 388,181,709$ 567,296,238$ 854,336,310$ 950,601,768$
Less Beach Spending Attributable to Beach Restoration 188,993,133$ 175,109,352$ 187,321,597$ 213,285,303$
Total Spending Attributable to VISIT FLORIDA Public Marketing Spend 1,984,119,212$ 1,935,512,012$ 3,476,553,749$ 3,778,851,951$

20
PROGRAM FINDINGS In the pages that follow, diagnostic tables describing the composition and statistics of the VISIT FLORIDA analysis precedes the discussion. Key terms used in the tables are described below: State Payments Used in Analysis – Represents the amount of state payments made to program by fiscal year. Personal Income (Nominal $(M)) – Income received by persons from all sources. It includes income received from participation in production as well as from government and business transfer payments. It is the sum of compensation of employees (received), supplements to wages and salaries, proprietors' income with inventory valuation adjustment (IVA) and capital consumption adjustment (CCAdj), rental income of persons with CCAdj, personal income receipts on assets, and personal current transfer receipts, less contributions for government social insurance. Real Disposable Personal Income (Fixed 2009 $(M)) – Total after-tax income received by persons; it is the income available to persons for spending or saving. Real Gross Domestic Product (Fixed 2009 $(M)) – A measurement of the state's output; it is the sum of value added from all industries in the state. GDP by state is the state counterpart to the Nation's gross domestic product. Consumption by Households and Government (Fixed 2009 $(M)) –The goods and services purchased by persons plus expenditures by governments consisting of compensation of general government employees, consumption of fixed capital (CFC), and intermediate purchases of goods and services less sales to other sectors and own-account production of structures and software. It excludes current transactions of government enterprises, interest paid or received by government, and subsidies. Real Output (Fixed 2009 $(M)) – Consists of sales, or receipts, and other operating income, plus commodity taxes and changes in inventories. Total Employment (Jobs) – This comprises estimates of the number of jobs, full time plus part time, by place of work. Full time and part time jobs are counted at equal weight. Employees, sole proprietors, and active partners are included, but unpaid family workers and volunteers are not included. Population (Persons) – Reflects first of year estimates of people, includes survivors from the previous year, births, special populations, and three types of migrants (economic, international, and retired).

21
Analysis and Findings… During the years that comprise the review period, VISIT FLORIDA is primarily responsible for bringing 17,332,562 visitors to the state of Florida. These visitors accounted for $11.2 billion in total spending while in the state. The return on investment for VISIT FLORIDA’s marketing and promotion services is 3.2. The economic activity associated with the new spending and jobs generated an increase in state revenues of $373.4 million over the period. In addition to the new revenues to the state, Florida’s economy also benefited. Jobs resulting from the tourism expenditures generated an average of $3.3 billion a year in inflation-adjusted disposable personal income or 0.0414 percent of the state’s total and nearly $3.8 billion a year in real gross domestic product or 0.0476 percent of the state’s total. Conclusion… Several factors contribute to the overall ROI for the program. Tourists primarily purchase products that are taxable at the state level. These products include purchases of lodging in hotels or other accommodations, meals in restaurants, and gifts at souvenir shops. Further, tourists rent cars, shop at local retail establishments, and visit local bars and nightclubs. Tourists also spend money to entertain themselves at Florida’s theme parks, movie theaters, and sporting events. Expenditures at establishments such as hotels, restaurants, and theme parks are subject to sales and use tax. Tourists who rent automobiles while in the state are subject to the rental car surcharge and the fuel tax. Of the increase in total state revenues of $373.4 million, sales and use tax accounted for $245.3 million or nearly two-thirds of the increase. Not only are the products generally taxable, but most of the production for these products is sourced locally. This means that money spent in the Florida economy generally stays in the economy. There is little lost from the state’s economy to cover the costs of intermediate inputs which need to be purchased from outside of the region.
Statewide Economic Model Impact of VISIT FLORIDA
2010 - 11 2011 - 12 2012 - 13 Total
26.6 34.9 54.0 115.5
86.8 120.5 166.1 373.4
3.3 3.5 3.1
Return-on-Investment for the 3 year period 3.2
2010 - 11 2011 - 12 2012 - 13 Total
Average
per Year
Personal Income Nominal $ (M) 2,711.3 3,827.2 5,178.1 11,716.6 3,905.5
Real Disposable Personal Income Fixed 2009 $ (M) 2,321.4 3,194.1 4,265.2 9,780.8 3,260.3
Real Gross Domestic Product Fixed 2009 $ (M) 2,745.0 3,699.4 4,878.4 11,322.7 3,774.2
Consumption by Households and Government Fixed 2009 $ (M) 2,260.6 3,195.1 4,273.8 9,729.5 3,243.2
Real Output Fixed 2009 $ (M) 3,472.9 4,582.2 6,034.1 14,089.2 4,696.4
2010 - 11 2011 - 12 2012 - 13 Minimum Maximum
Average
per Year
Total Employment Jobs 19,772 25,473 31,589 19,772 31,589 25,611.3
Population Persons 1,824 5,680 11,328 1,824 11,328 6,277.3
State Payments in the Window $ (M)
Total Net State Revenues $ (M)
Return-on-Investment by Year
22
Lastly, the state’s investment in VISIT FLORIDA is relatively low compared to the amount of economic activity generated by the tourists. The projected ROI reflects the best case scenario for VISIT FLORIDA given that the major advertising sources (local governments, private businesses, and theme parks) are not the only sources of tourism advertising for the state. It is impossible to determine the total amount of advertising dollars spent to promote tourism in a given year and inclusion of any further funding sources would only serve to reduce VISIT FLORIDA’s ROI. If the state were to reduce or eliminate funding for VISIT FLORIDA, the result would not necessarily be an immediate reduction in tourism by VISIT FLORIDA’s share of funding. Rather, any reduced tourism would like occur over time. It is unknown whether and to what extent the other major advertising sources might increase advertising spending to keep the overall level of funding the same. In summary, the state invested $115.5 million dollars in VISIT FLORIDA during the review period resulting in an increase in GDP of $11.3 billion which then increased overall collection in state revenues by $373.4 million.

23
APPENDIX ONE
D.K. Shifflet & Associates Ltd. Research Methodology D.K.Shifflet & Associates’ (DKSA) TRAVEL PERFORMANCE/MonitorSM is a comprehensive study measuring the travel behavior of US residents. DKSA contacts 50,000 distinct U.S. households monthly and has so since 1991. DKSA is able to provide current behavior and long term trended analyses on a wide range of travel. DKSA data are collected using an online methodology employing KnowledgePanel®, an address based sample panel offered by Knowledge Networks. The sample is drawn as a national probability sample and returns are balanced to ensure representation of the U.S. population according to the most recent U.S. Census. Key factors used for balancing are Origin State, Age, Income, Education, Gender, Ethnicity/Race and Return Rates. The Knowledge Networks sample is used to create benchmark weights which are applied to surveys returned from other managed panels used by DKSA. Both traveling and non-traveling households are surveyed each month enabling DKSA to generate the best estimate of travel incidence (volume) within the total U.S. population. Among those who have traveled (overnight in the past three months, and daytrips in the past month) details of their trip(s) are recorded for each month. This overlapping, repeating monthly approach boosts the observed number of trips for each travel month and controls for seasonality and telescoping biases. "Travel" is defined as either an overnight trip defined as going someplace, staying overnight and then returning home or as a day trip defined as a place away from home and back in the same day. Respondents report travel behavior for each stay of each trip; an approach that enhances reporting for specific travel events, activities and spending. A wide variety of general travel information is collected including travel to destinations at a city level, hotel stayed in, purpose of stay and activities, expenditures, mode of transportation, party composition, length of stay, travel agent and group tour usage, satisfaction and value ratings, and demographics, including origin markets. Several questions are asked as open-ends to ensure that the responses are not influenced by a pre-listed set of response categories. Each respondent identifies the actual destination visited with an open-end response. This is particularly significant for obtaining accurate data for smaller cities and counties and representing total travel. This increases time and expense to accurately capture these responses, but quality requires it. Extensive coding lists are updated regularly to ensure that all data is recorded accurately. DKSA’s Quality control committee conducts bimonthly meetings to review survey results and examine methods to maintain and improve quality control. About DKSA D.K. Shifflet & Associates Ltd. is the leading U.S. consumer travel research firm. DKSA is located in McLean, VA and has, for the last 27 years, provided the Industry’s most complete consumer based travel

24
data on U.S. residents and their travel worldwide. Their clients include destination marketing organizations, theme parks, credit cards, auto clubs, hotel chains and more.