Retrospective mortality, nutrition an d measles ... · PDF file3 Summary Background On August...
32
Emmanuel Grellety Gregoire Falq Epicentre December 2017 WHO Collaborating Centre for Epidemiology Research and Response to Emerging Diseases TELEPHONE : 00 33 (0)1 40 21 28 48 FAX : 00 33 (0)1 40 21 28 03 E-MAIL : EPIMAIL@EPICENTRE.MSF.ORG WEB : HTTP://WWW.EPICENTRE.MSF.ORG ASSOCIATION LOI 1901. Retrospective mortality, nutrition and measles vaccination coverage survey in Balukhali 2 & Tasnimarkhola camps Cox’s Bazar, Bangladesh November 2017 Report
Transcript of Retrospective mortality, nutrition an d measles ... · PDF file3 Summary Background On August...
Emmanuel Grellety
Gregoire Falq
Epicentre
December 2017
WHO Collaborating Centre for Epidemiology Research
and Response to Emerging Diseases
TELEPHONE : 00 33 (0)1 40 21 28 48 FAX : 00 33 (0)1 40 21 28 03 E-MAIL : [email protected] WEB : HTTP://WWW.EPICENTRE.MSF.ORG ASSOCIATION LOI 1901.
Retrospective mortality, nutrition and measles vaccination coverage survey in Balukhali 2 & Tasnimarkhola camps
Cox’s Bazar, Bangladesh
November 2017
Report
2
Acknowledgments
We are grateful to Prof. Abul Kalam Azad, Director General, the Directorate
General of Health Service Ministry of Health and Family Welfare (MoHFW) in
Bangladesh and Dr. Md. Abdus Salam Civil Surgeon, Cox's Bazar Civil Surgeon
Office, Ministry of Health and Family Welfare, for the permission to conduct this
survey.
We thank the population of Balukhali 2 (formerly Mainnerghona camp) and
Tasnimarkhola (formerly Burmapara camp) for their participation, assistance and
cooperation during this survey.
3
Summary
Background On August 25, 2017, a counter-insurgency military operation in Rakhine State, Myanmar, led to the massive displacement of Rohingya civilians into Bangladesh. Fleeing violence, approximately 626,000 Rohingya crossed into Bangladesh in under three months. To inform humanitarian assistance and understand the needs of those displaced, Médecins Sans Frontières (MSF), with the support of Epicentre, performed a survey to estimate retrospective mortality, nutritional status and measles vaccination coverage among the population of Balukhali 2 and Tasnimarkhola settlements, in Cox’s Bazar District, Bangladesh. Methods In November 2017, MSF/Epicentre conducted a retrospective survey with systematic sampling among a population of 135,980 Rohingya (including 1,529 families) who had recently arrived in the two survey-targeted settlements in Bangladesh. The recall period for mortality extended from May 27- November 12, 2017, spanning roughly equal periods before and after August 25, 2017. Heads of family described the family structure, and provided the date, location and cause of death for family members who died during the recall period. Surveyors assessed the nutritional status of children aged 6 to 59 months by mid-upper arm circumference (MUAC) and evaluation for nutritional oedema. Heads of family verbally reported measles vaccination status, which surveyors confirmed by health card or vaccination record where available. Results Before the crisis (May 27-August 24, 2017), mortality rates (expressed as deaths/10,000/day), were 0.6 [95% CI: 0.4-0.8] for the total population, and 0.5 [0.2-1.1] for children under five years old. Following the crisis (August 25-November 12, 2017), mortality rates were 4.6 [4.1-5.2] and 3.8 [2.8-5.2] for children under five years old. During this period, 3.5% [95% CI: 3.1-3.9] of the total population, and 2.9% [2.1-3.9] of the under-five population, died. Violence caused respectively 77.4% and 57.5% of these deaths. Moreover, through the entire recall period (May 27-November 12, 2017), 96.6% of all deaths occurred in Myanmar. Seventy-five percent of the deaths were reported in the first month of the crisis; the majority of people were killed by shooting (70.3%), and others by beating (18.4%), landmines (3.8%) and sexual violence (3.2%). Results of the malnutrition survey indicate a critical humanitarian situation, with global acute malnutrition (GAM) prevalence at 12.0% [95% CI: 10.2-13.9] and severe acute malnutrition (SAM) at 4.5% [3.4-5.8]. Measles vaccination coverage was low, with less than a quarter (22.4% [95% IC: 20.2-24.9]) of children aged between 6 to 59 months having verbal or written documentation of measles vaccination. Conclusion This survey provides epidemiological evidence of high rates of mortality due to violence among the displaced Rohingya in Myanmar and reinforces the need for a targeted and rapid humanitarian response to resolve the critical levels of acute malnutrition and under-coverage of measles vaccination in the settlements.
4
Abbreviations
95% CI 95% Confidence Interval ACF Action Contre la Faim CDC Centers for Disease Control and Prevention CMR Crude Mortality Rate GAM Global Acute Malnutrition GIS Geographic Information System HP Health Post IOM International Organisation for Migration IPD In-patient Department ISCG Inter-Sector Coordination Group MAM Moderate Acute Malnutrition MoHFW Ministry of Health and Family Welfare MSF Médecins Sans Frontières MUAC Mid-Upper-Arm Circumference PHC Primary Healthcare SAM Severe Acute Malnutrition U5MR Under-Five Mortality Rate UNICEF United Nations Children's Fund WHO World Health Organization WHZ Weight-for-Height Z-score
5
Contents
SUMMARY ..........................................................................................................................3 ABBREVIATIONS .................................................................................................................4 CONTENTS ..........................................................................................................................5 LIST OF TABLES ..................................................................................................................6 LIST OF FIGURES ................................................................................................................6 INTRODUCTION ..................................................................................................................7
1.1 Context ................................................................................................................7 1.2 Médecins Sans Frontières activities .....................................................................8 1.3 Humanitarian situation and justification .............................................................9 1.4 Objectives ...........................................................................................................9
2 METHODS ................................................................................................................. 10 2.1 Target population .............................................................................................. 10 2.2 Survey design and sampling procedures ............................................................ 10 2.3 Data collection and definition ........................................................................... 11 2.4 Data entry and analysis ..................................................................................... 12 2.5 Ethical issues .................................................................................................... 13
3 RESULTS ................................................................................................................... 14 3.1 Survey sample description and demographic information .................................. 14 3.2 Retrospective mortality ...................................................................................... 16 3.3 Reported causes and locations of death for the period 1 & 2 ............................. 18 3.4 Reported causes of death during the first month of the crisis ............................. 20 3.5 Prevalence of acute malnutrition ....................................................................... 21 3.6 Measles vaccination coverage ........................................................................... 22
4 DISCUSSION .............................................................................................................. 23 4.1 Major findings ................................................................................................... 23 4.2 Demography...................................................................................................... 23 4.3 Retrospective mortality ...................................................................................... 24 4.4 Acute malnutrition ............................................................................................. 24 4.5 Measles vaccination .......................................................................................... 25 4.6 Limitation on use of results................................................................................ 25
5 CONCLUSION ............................................................................................................ 26 6 APPENDIXES ............................................................................................................. 27

6
List of tables
Table 1. Hypotheses for sample size calculation, retrospective survey in Balukhali 2 & Tasnimarkhola camps, November 2017 ...........................................................................10
Table 2. Survey sample and camp population estimation, November 2017 ....................................14 Table 3. Age distribution of the survey population in Balukhali 2 & Tasnimarkhola camps,
November 2017 ...............................................................................................................14 Table 4. Mortality rates for period 1 & 2, retrospective survey in Balukhali 2 & Tasnimarkhola
camps, November 2017 ..................................................................................................16 Table 5. Mortality rates for the first month of the crisis, retrospective survey in Balukhali 2 &
Tasnimarkhola camps, November 2017 ...........................................................................18 Table 6. Causes of death by sex and age group occurring in period 1, retrospective survey in
Balukhali 2 & Tasnimarkhola camps. ...............................................................................18 Table 7. Causes of death by sex and age group occurring in period 2, retrospective survey in
Balukhali 2 & Tasnimarkhola camps, November 2017 .....................................................19 Table 8. Type of violence for violent deaths by sex and age group during recall period 2,
retrospective survey in Balukhali 2 & Tasnimarkhola camps, November 2017 ..................19 Table 9. Location of death by sex and age group during recall period 2, retrospective survey in
Balukhali 2 & Tasnimarkhola camps, November 2017 .....................................................20 Table 10. Location of death by cause of death, during recall periods 1 & 2, retrospective survey
in Balukhali 2 & Tasnimarkhola camps, November 2017 ..................................................20 Table 11. Causes of death by sex and age group occurring during the first month of the crisis,
retrospective survey in Balukhali 2 & Tasnimarkhola camps, November 2017 ..................21 Table 12. Type of violence for violent deaths, first month of the crisis, by sex and age group,
retrospective survey in Balukhali 2 & Tasnimarkhola camps, November 2017 ..................21 Table 13. Prevalence of acute malnutrition based on MUAC and/or oedema by location for
children between 6 and 59 months in Balukhali 2 & Tasnimarkhola camps, November 2017................................................................................................................................22
Table 14. Prevalence of acute malnutrition by age based on MUAC and/or oedema for children between 6 and 59 months in Balukhali 2 & Tasnimarkhola camps, November 2017 .........22
Table 15. Measles vaccination coverage for children between 6 and 59 months in Balukhali 2 & Tasnimarkhola camps, November 2017 ...........................................................................22
List of figures
Figure 1. Cumulative Rohingya population including pre-influx population in Bangladesh, Inter Sector Coordination Group (ISCG) hosted by IOM ............................................................ 7
Figure 2. MSF presence in Cox’s Bazar district, Bangladesh, November 2017................................. 8 Figure 3. Age pyramid for the surveyed population in Balukhali 2 & Tasnimarkhola camps,
November 2017 ...............................................................................................................15 Figure 4. Number of people by sex and dates-by-week of arrival in the camp, retrospective
survey in Balukhali 2 & Tasnimarkhola camps, November 2017 .......................................15 Figure 5. Number of deaths by week and gender, retrospective survey in Balukhali 2 &
Tasnimarkhola camps, November 2017 ...........................................................................17 Figure 6. Number of death by week and age group, retrospective survey in Balukhali 2 &
Tasnimarkhola camps, November 2017 ...........................................................................17

7
Introduction
1.1 Context On August 25, 2017, a counter-insurgency military operation in Rakhine State, Myanmar, led to the massive displacement of Rohingya civilians into Bangladesh. This counter-insurgency operation was launched in response to attacks on more than 20 police posts by Rohingya militants1. Fleeing the violence in Rakhine state, Myanmar, approximately 626,000 Rohingya crossed into Bangladesh in less than three months. Combined with previous waves of displacement, this increased the total number of Rohingya in Bangladesh to over 800,000 (see Figure 1).
Figure 1. Cumulative Rohingya population including pre-influx population in Bangladesh, Inter Sector Coordination Group (ISCG) hosted by IOM, Situation Report: Rohingya Refugee Crisis, December 3, 2017 2 As of the writing of this report, displaced persons continue to arrive daily to the settlements; the number of Rohingya still in Myanmar attempting, or intending, to flee remains unknown. The majority of those who have already arrived now reside in Cox’s Bazar district, distributed in new settlements formed as additions to pre-existing settlements, living in spontaneous settlements (newly-formed with little formal support), and in dispersed locations amongst the host community. Since August 2017, an estimated 354,593 refugees reportedly arrived in Kutupalong and Balukhali Makeshift settlements3. The rapid population influx led to massive extensions of the pre-existing Makeshift Settlements. These extensions have expanded so rapidly and significantly that the settled area has now effectively merged with Balukhali 2 (formerly Mannerghona Makeshift settlement) and Tasnimarkhola (formerly Burma Para Sponteneous Settlement).
1 BBC News, September 2th 2017: http://www.bbc.com/news/world-asia-41135727 2 Figures are sourced from site assessment Needs and Population Monitoring, using triangulated estimates based on the observation of key informants: the new arrivals have not been verified at the household level. 3 Inter Sector Coordination Group. Situation Report: Rohingya Refugee Crisis, 3 December 2017. Available at https://reliefweb.int/sites/reliefweb.int/files/resources/171203_weekly_iscg_sitrep_final.doc.pdf
8
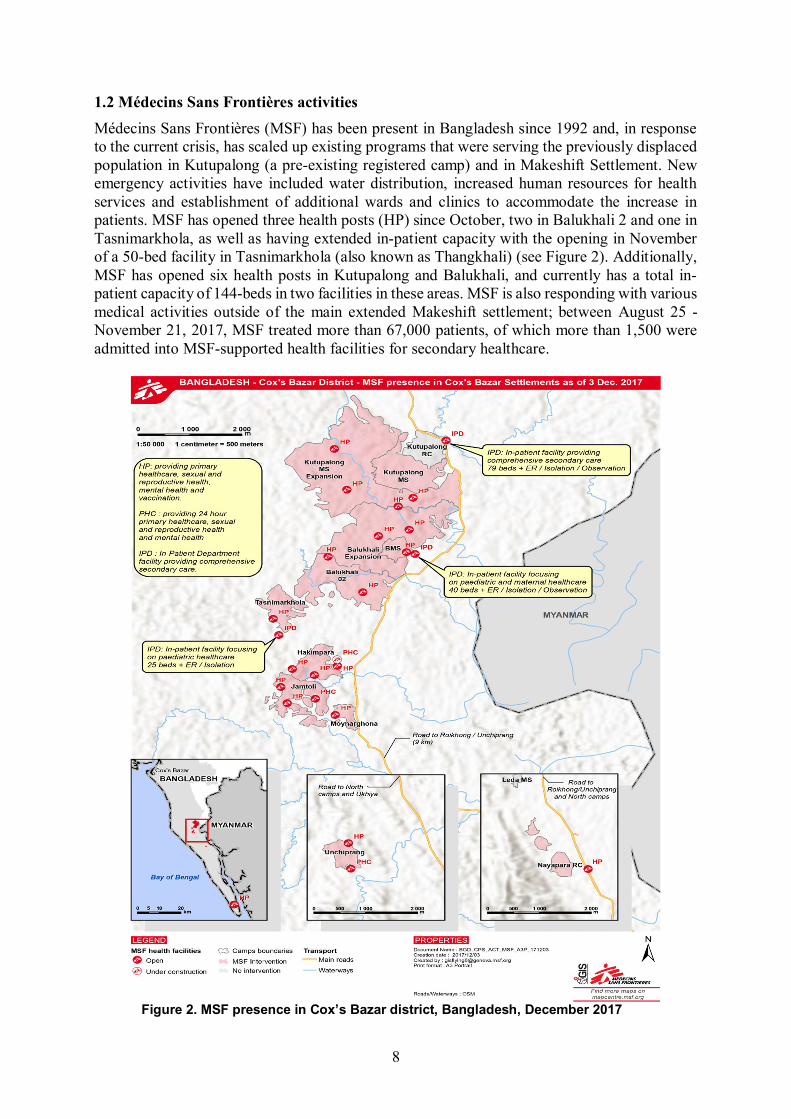
1.2 Médecins Sans Frontières activities Médecins Sans Frontières (MSF) has been present in Bangladesh since 1992 and, in response to the current crisis, has scaled up existing programs that were serving the previously displaced population in Kutupalong (a pre-existing registered camp) and in Makeshift Settlement. New emergency activities have included water distribution, increased human resources for health services and establishment of additional wards and clinics to accommodate the increase in patients. MSF has opened three health posts (HP) since October, two in Balukhali 2 and one in Tasnimarkhola, as well as having extended in-patient capacity with the opening in November of a 50-bed facility in Tasnimarkhola (also known as Thangkhali) (see Figure 2). Additionally, MSF has opened six health posts in Kutupalong and Balukhali, and currently has a total in-patient capacity of 144-beds in two facilities in these areas. MSF is also responding with various medical activities outside of the main extended Makeshift settlement; between August 25 - November 21, 2017, MSF treated more than 67,000 patients, of which more than 1,500 were admitted into MSF-supported health facilities for secondary healthcare.
Figure 2. MSF presence in Cox’s Bazar district, Bangladesh, December 2017
9
1.3 Humanitarian situation and justification Though the settlement areas are known, the scale and severity of the emergency makes assessment difficult, in no small part due to challenging, hilly terrain and the dynamic nature of the emergency. MSF proposed a retrospective mortality and health survey to understand the needs of the population and appropriately align the medical response in Kutupalong and Balukhali Makeshift settlements. As the settlements continued to extend towards, and eventually merge with, Balukhali 2 and Tasnimarkhola, MSF chose to repeat the survey to capture these two additional areas. In addition to providing data on current, and acute needs of the population, this survey also serves as a baseline assessment to monitor changes in the population in these areas over time.
1.4 Objectives The general objective of the survey was to estimate the scale of the emergency by assessing the crude mortality rate (CMR) and the under-five mortality rate (U5MR) in Balukhali 2 & Tasnimarkhola camps. The specific objectives were to:
Describe the population in terms of age, sex and household composition; Estimate the CMR and U5MR in the period before and after the displacement into
Bangladesh; Identify major causes and places of death, by sex and age group;
Assess the prevalence of severe, moderate and global acute malnutrition based on mid-upper-arm circumference (MUAC) & bilateral oedema in children from 6 to 59 months old, by sex and age group;
Determine measles vaccination coverage in children aged 6 to 59 months old, by sex and age group;
10
2 Methods
2.1 Target population The survey targeted those living in Balukhali 2 & Tasnimarkhola camps (newly-settled spontaneous sites), which are part of Palong Khali Union in Cox’s Bazar district. These camps are divided into blocks and include an estimated population of 31,061 families4 (representing around 168,449 people, according to the family size information given by community leaders and military authorities). The total targeted population in each location was estimated to be: 17,236 families (around 86,180 people) in the camp of Balukhali 2 13,825 families (around 82,269 people) in the camp of Tasnimarkhola
2.2 Survey design and sampling procedures Each block is divided into a sub-block of approximately 100 families (80 to 200), with each sub-block under the authority of a Mazhi (community leader). The two epidemiologists responsible for the survey distributed the sub-blocks into sectors. Each sector was around 600 families (around 6 sub-blocks); the area of each sector was clearly delimited by the community leader. Teams of two volunteers apiece were assigned two sectors (around 1,200 families) in which to conduct the survey data collection. To cover all sectors, 25 teams (15 teams in Balukhali 2 & 10 teams in Tasnimarkhola camp) administered standardized, pre-piloted electronic questionnaires. Systematic random sampling with a sampling interval of 20 families was used to reach the desired sample size of 1,440 families (around 7,200 people) within five days. We estimated that CMR would have reached two deaths per 10,000/day (twice the standard emergency threshold of 1 death/10,000/day) in the period after the beginning of the crisis in Rakhine (starting August 25th, 2017). The sample size was calculated using “ENA for SMART 2011" software5 based on the assumptions given in Table 1 below. Table 1. Hypotheses for sample size calculation, retrospective survey in Balukhali 2 & Tasnimarkhola camps, November 2017
Sample size parameters Retrospective mortality CMR (death/10,000/day) 2 ± desired precision (10,000/day) 0.4 Design effect 1 Recall period (days) 75 Average family size 5 Non response (%) 10 Minimum population to be included 6403 Minimum families to be included 1423
4 This estimation was based on a census/mapping exercise of each sub-block of Balukhali 2 & Thangkali camps carried out by MSF/Epicentre surveyor teams from October 28th to November 1st 2017. 5 Erhardt J, Seaman J, Golden M. Software for Emergency Nutrition Assessment (ENA for SMART). SMART 2011. Available at http://smartmethodology.org/survey-planning-tools/smart-emergency-nutrition-assessment
11
We divided the recall period into two parts, with dates representing significant events for the Rohingya population for easier and more reliable recall. Period 1 (91 days) was from May 27th 2017 (beginning of Ramadan) to August 24th 2017. Period 2 (79 days) was from August 25th 2017 (beginning of the conflict in Rakhine State) to November 12th 2017 (end of the survey). The purpose of dividing the recall period into two parts was to include the period before and after the beginning of the crisis to understand the impact of the crisis on the health of the population.
2.3 Data collection and definition The survey epidemiologists trained the volunteer teams intensively for three days prior to the start of data collection, covering survey objectives, theory and methodology of data collection and surveying. The initial two days focused on the objectives and the methodology of the survey, including theoretical and practical training on confidentiality, interview techniques and how to collect data avoiding selection, information and measurement biases. The second day included techniques and practical exercises for assessing acute malnutrition by MUAC and identification of bilateral oedema. The third day was spent on the field with the volunteers in order to test study instruments and verify data collection skills. This final day of training was held to assess the teams practical ability and to identify difficulties met during data collection and adjust procedures accordingly. The questionnaire was designed and written in English (Appendix 1) but was administered in the local language. The following information was collected from each family after obtaining oral informed consent: 1) Demography & mortality Family size at the time of the study Family size at beginning of the recall period Age of each family member (past members and present members) Sex of each family member (past members and present members) Date of arrival of the family in the camp Arrivals into the family between camp arrival and study time (births and new arrivals),
along with the date of birth/arrival Departures from the family during the recall period, along with the date of
departure/disappearance Deaths among family members during the recall period, along with the date and place
of death The location and cause of death as reported by the respondent was collected using open-
ended questioning and then classified by the survey teams using pre-established lists Where respondents could provide precise dates of events, these dates were recorded
directly by survey staff. When a respondent did not know the specific date of a given event, the survey team estimated the date using a calendar of local events that listed a series of important events and their corresponding calendar dates.
2) Nutritional status for children from 6 to 59 months of age MUAC was measured with a non-stretchable tape with a precision of 1 mm Grade of bilateral oedema was tested and recorded if present
3) Measles vaccination for children from 6 to 59 months of age assessed by: Oral report of vaccination
12
Confirmed status of vaccination by card
Surveyors used the following definitions: A family was defined as a group of people who eat together and had slept under the
same roof the previous night. Information on the whole family was included, no matter the age of the family member or their relationship to the other household members.
The head of family was defined as follows: - Adult household member aged ≥18 years, and - Could give accurate information on all demographic and mortality issues in his/her
household (could describe with reasonable accuracy the events that occurred during the recall period), and
- Present at the time of the survey
A family was excluded from the study if none of the household members fulfilled all of these criteria.
2.4 Data entry and analysis Data were entered and collected using smartphones/electronic tablets and exported to a private Kobo platform6. Electronic files were stored and password-protected by Epicentre. All names were removed from the database after the survey to protect the identity of participants. The electronic database will be stored for five years after survey completion. Access to the “anonymized” electronic version of the survey will be restricted to the study investigators and the Ministry of Health and Family Welfare in Bangladesh, per request. The epidemiologists performed data quality checks at multiple stages of the survey to look for inconsistencies in data entry and responses, and react appropriately. During the survey, the study investigator joined survey teams to ensure that consent and interviews were being conducted correctly and to supervise data collection. Electronic forms collected by each team were checked by the study investigator at the end of each day. Entered data were cleaned prior to analysis, which was conducted using Excel and R version 3.4.2 (R Development Core Team, 2014). Key indicators were calculated as proportions with 95% confidence intervals (95% CIs) and mortality rates per 10,000 per day used person-time estimates for the denominator. When appropriate, proportion differences between groups were compared using Pearson χ2 test, with p-values (p) assessed. CMR and U5MR emergency thresholds were defined according to the Centers for Disease Control and Prevention (CDC) and MSF; the emergency threshold for CMR was 1 death/10,000/day; the emergency threshold for U5MR was 2 deaths/10,000/day. Global acute malnutrition (GAM) was defined as MUAC <125mm and/or bilateral oedema; moderate acute malnutrition (MAM) as a MUAC ≥115mm and <125mm; and severe acute malnutrition (SAM) as a MUAC <115mm and/or bilateral oedema.
6 KoBoToolbox, was developed by the Harvard Humanitarian Initiative, and is an open-source suite of tools for data collection and analysis in humanitarian emergencies and other challenging environments. Available at: http://www.kobotoolbox.org/
13
2.5 Ethical issues The study was conducted in accordance with the Council for International Organisations of Medical Sciences (CIOMS) International Ethical Guidelines, 2016 and the World Medical Assembly (WMA) Declaration of Helsinki - Ethical Principles for Medical Research Involving Human Subjects, 2013. The survey protocol was approved by the Ministry of Health and Family Welfare in Bangladesh. Informed verbal consent, as recorded by survey teams, was obtained from all participants in the study. Surveyors explained the survey and consent to all participants in a language with which they were familiar. Each household was offered the opportunity to decline participation in the study at any time without penalty. Participation was voluntary and it was made clear that no incentives or inducements would be provided to respondents. Participant privacy was respected during the interviewing process and all data remained anonymous throughout the analysis process. All identifiable data was removed after survey completion and will not appear in any report or publication. The survey did not cause any physical harm to participants. The epidemiologists in charge of the survey provided guidance to the surveyor teams on appropriate referral practices for sick people (with separate protocols clarified for life-threatening cases and non-emergency cases). Participant privacy was respected during the interviewing process and staff were trained to ensure appropriate conditions to maintain confidentiality during the interview process, including choosing the optimal location when a setting makes privacy difficult (e.g. single room dwelling). MSF commits to sharing study results with everybody who has participated in the study.

14
3 Results
3.1 Survey sample description and demographic information From November 8-12, 2017, surveyors interviewed 1,529 families (comprising 6,799 persons) in Balukhali 2 & Tasnimarkhola camps7. The mean family size was 4.4 members (range = 1-11 members). There were no refusals to participate in the survey and only one selected family was absent. The total population for both camps was estimated prior to the survey at 30,580 families, corresponding to 135,580 persons (Table 2). Table 2. Survey sample and camp population estimation, November 2017
Survey Camp estimation Family size Families % Population % Families Population
Balukhali 2 camp 890 58.2 4060 59.7 17800 81200 4.6
Tasnimarkhola camp 639 41.8 2739 40.3 12780 54780 4.3
Total 1529 100 6799 100 30580 135980 4.4 Overall male/female sex ratio was 0.92 (3261/3538), with no significant difference observed between camps. There are however differences between age groups, with the male/female sex ratio low in the 15-29 (0.78) and 30-44 (0.82) age groups. There were more males than females over 60 years of age, with a sex ratio of 1.21 (Table 3). Table 3. Age distribution of the survey population in Balukhali 2 & Tasnimarkhola camps, November 2017
Age group (years) Males Females Total % M/F ratio
< 5 640 679 1319 19.4 0.94 5 – 14 1038 975 2013 29.6 1.06 15 – 29 800 1032 1832 26.9 0.78 30 – 44 393 477 870 12.8 0.82 45 – 59 245 255 500 7.4 0.96 60+ 145 120 265 3.9 1.21
Total population 3261 3538 6799 100 0.92 The reported age range of the sampled population was 1 day to 100 years old, with a mean of 19.6 years and a median of 15.0 years. Children under 5 years of age totalled 1,319 people (19.4% of those surveyed). Children aged <15 years comprised nearly half the sample population (49.0%). Of note is the pyramid indent at the 20-24 year old age group in the population pyramid, a finding that was consistent for both genders. The male and female populations had similar age distributions, with 61.5% of males under 20 years compared with 58.6% of females: the mean age in males was 19.5 years and in females 19.6 years (Figure 3).
7 The survey coverage is mapped in Appendix 2.

15
Figure 3. Age pyramid for the surveyed population in Balukhali 2 & Tasnimarkhola camps, November 2017 Those displaced since the start of the current crisis in Rakhine accounted for 98.7% (6712/6799) of the total sampled population8 that is 99.2% (4031/4060) in Balukhali 2 and 97.8% (2681/2739) in Tasnimarkhola (Figure 4).
Figure 4. Number of people by sex and dates-by-week of arrival in the camp, retrospective survey in Balukhali 2 & Tasnimarkhola camps, November 2017
8 This excludes people who left or died during the recall period.
16
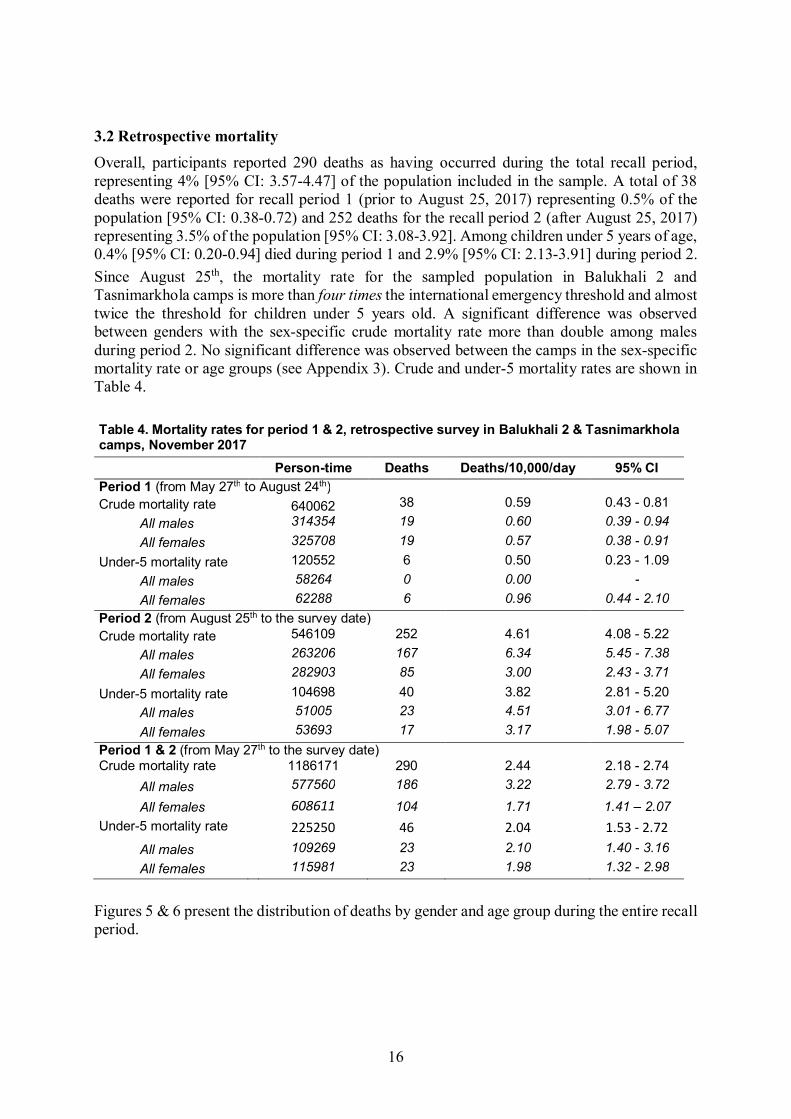
3.2 Retrospective mortality Overall, participants reported 290 deaths as having occurred during the total recall period, representing 4% [95% CI: 3.57-4.47] of the population included in the sample. A total of 38 deaths were reported for recall period 1 (prior to August 25, 2017) representing 0.5% of the population [95% CI: 0.38-0.72) and 252 deaths for the recall period 2 (after August 25, 2017) representing 3.5% of the population [95% CI: 3.08-3.92]. Among children under 5 years of age, 0.4% [95% CI: 0.20-0.94] died during period 1 and 2.9% [95% CI: 2.13-3.91] during period 2. Since August 25th, the mortality rate for the sampled population in Balukhali 2 and Tasnimarkhola camps is more than four times the international emergency threshold and almost twice the threshold for children under 5 years old. A significant difference was observed between genders with the sex-specific crude mortality rate more than double among males during period 2. No significant difference was observed between the camps in the sex-specific mortality rate or age groups (see Appendix 3). Crude and under-5 mortality rates are shown in Table 4. Table 4. Mortality rates for period 1 & 2, retrospective survey in Balukhali 2 & Tasnimarkhola camps, November 2017
Person-time Deaths Deaths/10,000/day 95% CI Period 1 (from May 27th to August 24th) Crude mortality rate 640062 38 0.59 0.43 - 0.81 All males 314354 19 0.60 0.39 - 0.94 All females 325708 19 0.57 0.38 - 0.91 Under-5 mortality rate 120552 6 0.50 0.23 - 1.09 All males 58264 0 0.00 - All females 62288 6 0.96 0.44 - 2.10 Period 2 (from August 25th to the survey date) Crude mortality rate 546109 252 4.61 4.08 - 5.22 All males 263206 167 6.34 5.45 - 7.38 All females 282903 85 3.00 2.43 - 3.71 Under-5 mortality rate 104698 40 3.82 2.81 - 5.20 All males 51005 23 4.51 3.01 - 6.77 All females 53693 17 3.17 1.98 - 5.07 Period 1 & 2 (from May 27th to the survey date) Crude mortality rate 1186171 290 2.44 2.18 - 2.74 All males 577560 186 3.22 2.79 - 3.72
All females 608611 104 1.71 1.41 – 2.07 Under-5 mortality rate 225250 46 2.04 1.53 - 2.72 All males 109269 23 2.10 1.40 - 3.16 All females 115981 23 1.98 1.32 - 2.98
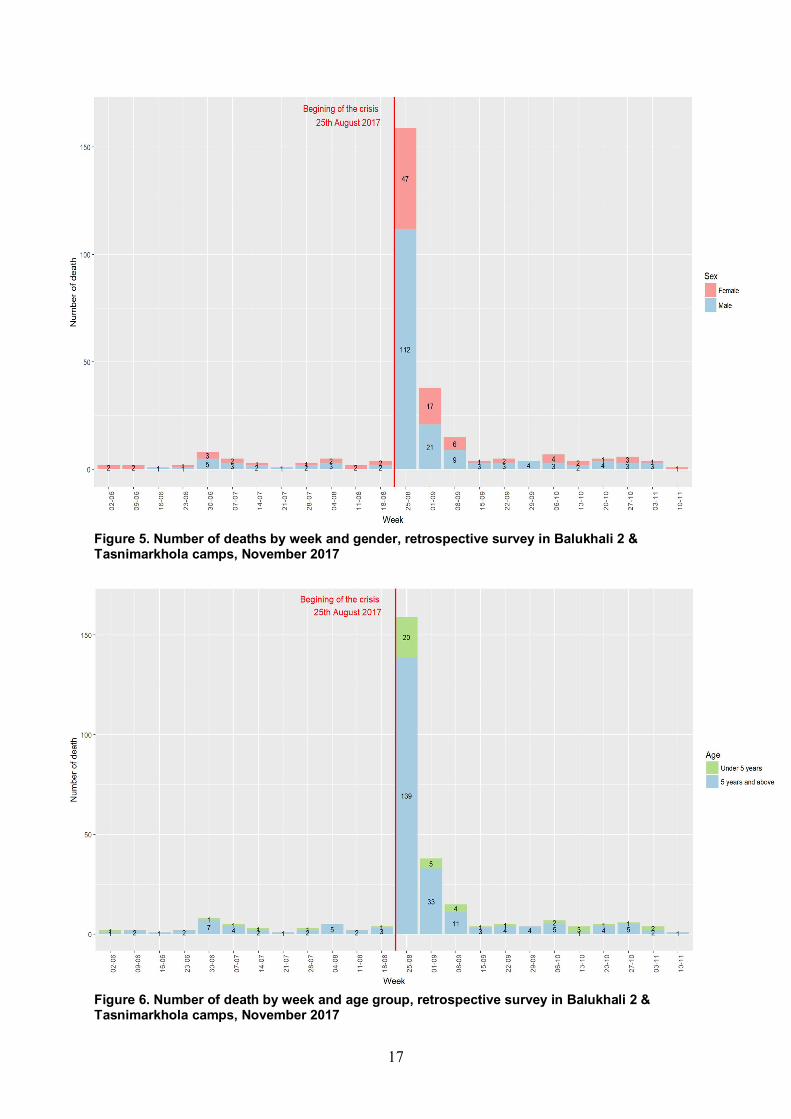
Figures 5 & 6 present the distribution of deaths by gender and age group during the entire recall period.
17
Figure 5. Number of deaths by week and gender, retrospective survey in Balukhali 2 & Tasnimarkhola camps, November 2017
Figure 6. Number of death by week and age group, retrospective survey in Balukhali 2 & Tasnimarkhola camps, November 2017
18
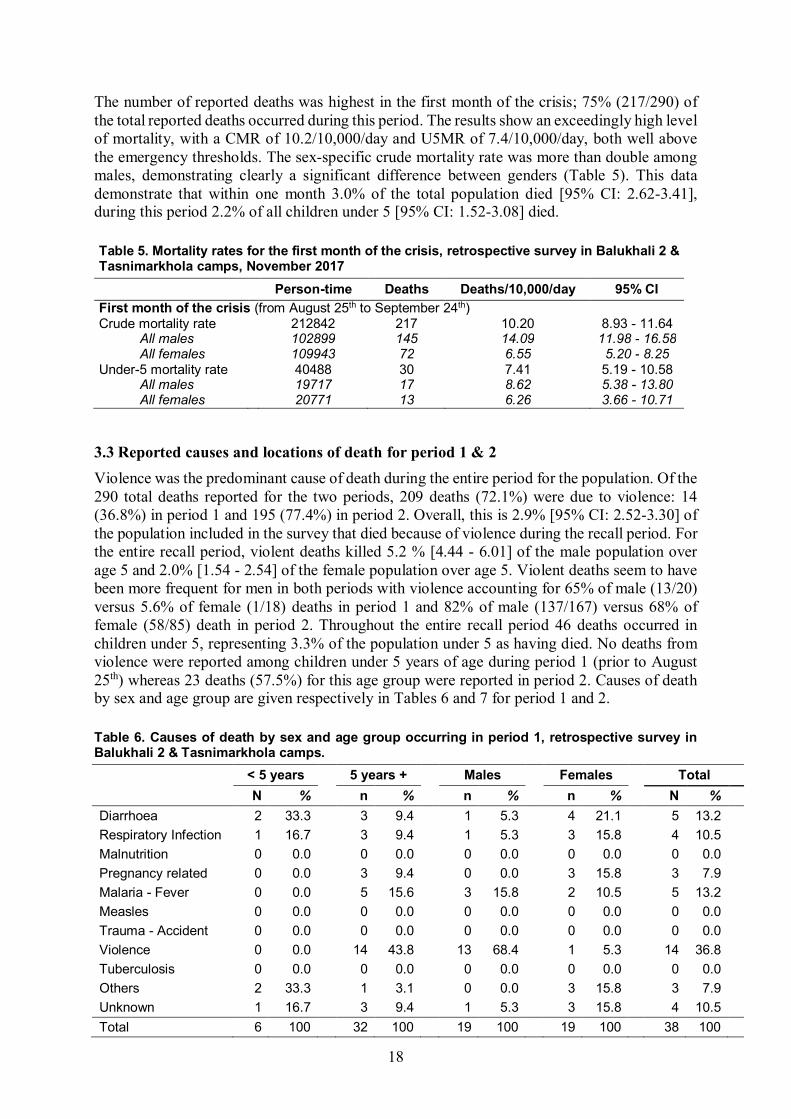
The number of reported deaths was highest in the first month of the crisis; 75% (217/290) of the total reported deaths occurred during this period. The results show an exceedingly high level of mortality, with a CMR of 10.2/10,000/day and U5MR of 7.4/10,000/day, both well above the emergency thresholds. The sex-specific crude mortality rate was more than double among males, demonstrating clearly a significant difference between genders (Table 5). This data demonstrate that within one month 3.0% of the total population died [95% CI: 2.62-3.41], during this period 2.2% of all children under 5 [95% CI: 1.52-3.08] died. Table 5. Mortality rates for the first month of the crisis, retrospective survey in Balukhali 2 & Tasnimarkhola camps, November 2017
Person-time Deaths Deaths/10,000/day 95% CI First month of the crisis (from August 25th to September 24th) Crude mortality rate 212842 217 10.20 8.93 - 11.64 All males 102899 145 14.09 11.98 - 16.58 All females 109943 72 6.55 5.20 - 8.25 Under-5 mortality rate 40488 30 7.41 5.19 - 10.58 All males 19717 17 8.62 5.38 - 13.80 All females 20771 13 6.26 3.66 - 10.71
3.3 Reported causes and locations of death for period 1 & 2 Violence was the predominant cause of death during the entire period for the population. Of the 290 total deaths reported for the two periods, 209 deaths (72.1%) were due to violence: 14 (36.8%) in period 1 and 195 (77.4%) in period 2. Overall, this is 2.9% [95% CI: 2.52-3.30] of the population included in the survey that died because of violence during the recall period. For the entire recall period, violent deaths killed 5.2 % [4.44 - 6.01] of the male population over age 5 and 2.0% [1.54 - 2.54] of the female population over age 5. Violent deaths seem to have been more frequent for men in both periods with violence accounting for 65% of male (13/20) versus 5.6% of female (1/18) deaths in period 1 and 82% of male (137/167) versus 68% of female (58/85) death in period 2. Throughout the entire recall period 46 deaths occurred in children under 5, representing 3.3% of the population under 5 as having died. No deaths from violence were reported among children under 5 years of age during period 1 (prior to August 25th) whereas 23 deaths (57.5%) for this age group were reported in period 2. Causes of death by sex and age group are given respectively in Tables 6 and 7 for period 1 and 2. Table 6. Causes of death by sex and age group occurring in period 1, retrospective survey in Balukhali 2 & Tasnimarkhola camps. < 5 years 5 years + Males Females Total N % n % n % n % N % Diarrhoea 2 33.3 3 9.4 1 5.3 4 21.1 5 13.2
Respiratory Infection 1 16.7 3 9.4 1 5.3 3 15.8 4 10.5
Malnutrition 0 0.0 0 0.0 0 0.0 0 0.0 0 0.0
Pregnancy related 0 0.0 3 9.4 0 0.0 3 15.8 3 7.9
Malaria - Fever 0 0.0 5 15.6 3 15.8 2 10.5 5 13.2
Measles 0 0.0 0 0.0 0 0.0 0 0.0 0 0.0
Trauma - Accident 0 0.0 0 0.0 0 0.0 0 0.0 0 0.0
Violence 0 0.0 14 43.8 13 68.4 1 5.3 14 36.8
Tuberculosis 0 0.0 0 0.0 0 0.0 0 0.0 0 0.0
Others 2 33.3 1 3.1 0 0.0 3 15.8 3 7.9
Unknown 1 16.7 3 9.4 1 5.3 3 15.8 4 10.5
Total 6 100 32 100 19 100 19 100 38 100

19
Table 7. Causes of death by sex and age group occurring in period 2, retrospective survey in Balukhali 2 & Tasnimarkhola camps, November 2017 < 5 years 5 years + Males Females Total N % n % n % n % N % Diarrhoea 3 7.5 5 2.4 6 3.6 2 2.4 8 3.2
Respiratory Infection 1 2.5 10 4.7 5 3.0 6 7.1 11 4.4
Malnutrition 1 2.5 1 0.5 0 0.0 2 2.4 2 0.8
Pregnancy related 0 0.0 0 0.0 0 0.0 0 0.0 0 0.0
Malaria - Fever 3 7.5 7 3.3 6 3.6 4 4.7 10 4.0
Measles 3 7.5 0 0.0 1 0.6 2 2.4 3 1.2
Trauma - Accident 2 5.0 0 0.0 1 0.6 1 1.2 2 0.8
Violence 23 57.5 172 81.1 137 82.0 58 68.2 195 77.4
Tuberculosis 0 0.0 3 1.4 1 0.6 2 2.4 3 1.2
Others 2 5.0 4 1.9 2 1.2 4 4.7 6 2.4
Unknown 2 5.0 10 4.7 8 4.8 4 4.7 12 4.8
Total 40 100 212 100 167 100 85 100 252 100 Table 8 shows violent deaths, by cause, sex and age groups during recall period 2. The primary cause was shooting (n=134, 68.7%), followed by beating (n=38, 19.5%), death by landmine (n=7, 3.6%) and sexual violence (n=6, 3.1%). Table 8. Type of violence for violent deaths by sex and age group during recall period 2, retrospective survey in Balukhali 2 & Tasnimarkhola camps, November 2017
< 5 years 5 years + Males Females Total N % n % n % n % N %
Beaten 6 26.1 32 18.6 25 18.2 13 22.4 38 19.5
Following sexual violence 0 0.0 6 3.5 0 0.0 6 10.3 6 3.1
Shot 13 56.5 121 70.3 101 73.7 33 56.9 134 68.7
Landmine 2 8.7 5 2.9 4 2.9 3 5.2 7 3.6
Detained - kidnapped 0 0.0 2 1.2 1 0.7 1 1.7 2 1.0
Cut the throat 0 0.0 3 1.7 3 2.2 0 0.0 3 1.5
Unknown 2 8.7 1 0.6 3 2.2 0 0.0 3 1.5
Others 0 0.0 2 1.2 0 0.0 2 3.4 2 1.0
Total 23 100 172 100 137 100 58 100 195 100 For all reported deaths, the vast majority of respondents reported the place of death as their home village in Myanmar (n=180, 71.4%). The remaining deaths occurred during their displacement from their village to the camp in Bangladesh (n=42, 16.7%), and in the camp (n=28, 11.1%), as described in Table 9.

20
Table 9. Place of death by sex and age group during recall period 2, retrospective survey in Balukhali 2 & Tasnimarkhola camps, November 2017
< 5 years 5 years + Males Females Total n % n % n % n % N %
In village in Myanmar 23 57.5 157 74.1 126 75.4 54 63.5 180 71.4 During the exodus in Myanmar 3 7.5 24 11.3 16 9.6 11 12.9 27 10.7 During the exodus in Bangladesh 5 12.5 10 4.7 9 5.4 6 7.1 15 6.0 In the camp 9 22.5 20 9.4 15 9.0 14 16.5 29 11.5 Unknown 0 0.0 1 0.5 1 0.6 0 0.0 1 0.4 Total 40 100 212 100 167 100 85 100 252 100
Table 10 compares the place of death disaggregated by cause over the entire recall period from May 27th to 12th November. Of all deaths due to violence, 97% (202/209) occurred in Myanmar versus 2.8% (6/209) in Bangladesh. For all violent deaths, 85.1% (178/209) were reported as having occurred in the respondent’s village of origin, and 13.4% (28/209) during their displacement from their village to the camp. Table 10. Location of death by cause of death, during recall periods 1 & 2, retrospective survey in Balukhali 2 & Tasnimarkhola camps, November 2017
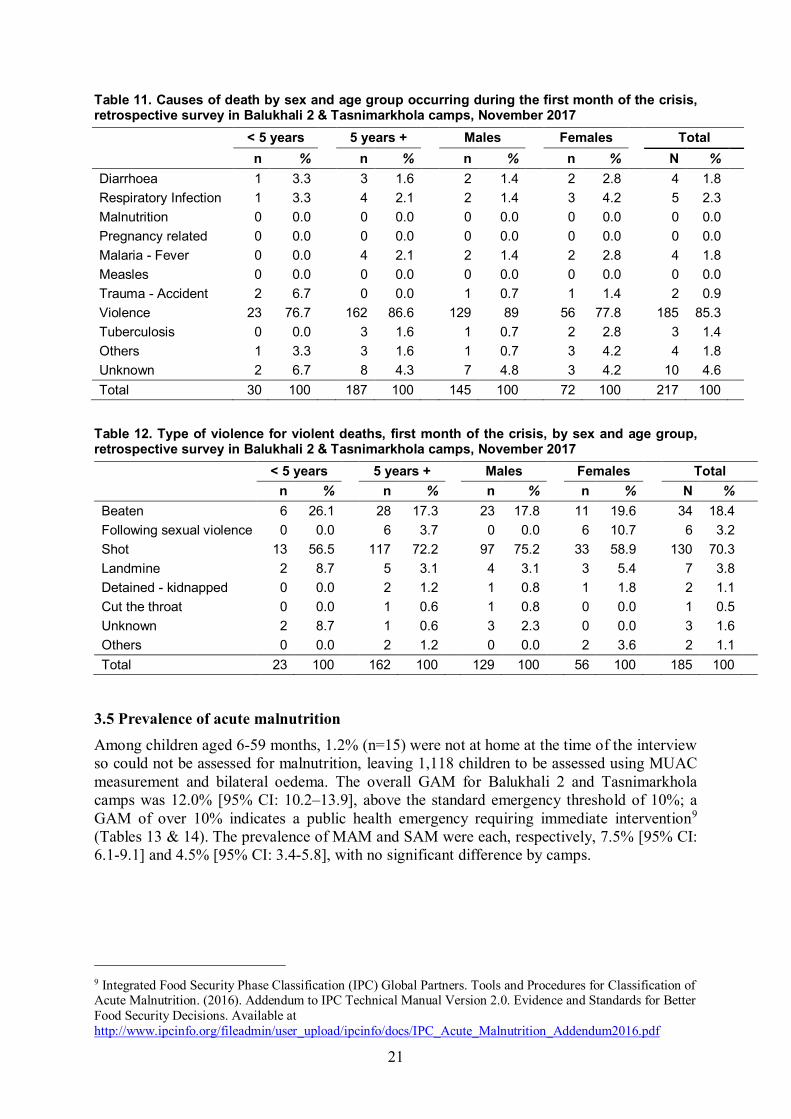
3.4 Reported causes of death during the first month of the crisis Tables 11 & 12 show the causes of death during the first month of the crisis from August 25 – September 24, 2017. A total of 217 deaths occurred during this period. Among these deaths, 185 (85.3%) were caused by direct violence, with 70% of deaths (129/185) among males and 88% (162/185) among the population over 5 years old. According to these data, during the first month of the crisis, 3.0% [95% CI: 2.62-3.40] of the population died, with 2.54% [95% CI: 2.21-2.93] of the population dying as a direct result of violence. The primary and secondary causes of death specific to violence were, respectively, by firearm or gunshot (70%) and by beating (18%).
In village in Myanmar
During the exodus in Myanmar
During the exodus in
Bangladesh In the
camp Unknown Total
n % n % n % n % n % n %Diarrheoa 6 2.8 1 3.6 0 0.0 6 21.4 0 0.0 13 4.5 Respiratory Infection 7 3.2 0 0.0 3 18.8 5 17.9 0 0.0 15 5.2 Malnutrition 0 0.0 0 0.0 0 0.0 2 7.1 0 0.0 2 0.7 Pregnancy related 3 1.4 0 0.0 0 0.0 0 0.0 0 0.0 3 1.0 Malaria - Fever 8 3.7 0 0.0 2 12.5 5 17.9 0 0.0 15 5.2 Measles 0 0.0 0 0.0 1 6.3 2 7.1 0 0.0 3 1.0 Tuberculosis 2 0.9 0 0.0 0 0.0 1 3.6 0 0.0 3 1.0 Trauma - Accident 0 0.0 1 3.6 1 6.3 0 0.0 0 0.0 2 0.7 Violence 178 82.4 24 85.7 4 25.0 2 7.1 1 100 209 72.1 Others 3 1.4 0 0.0 2 12.5 4 10.7 0 0.0 9 3.1 Unknown 9 4.2 2 7.1 3 18.8 2 7.1 0 0.0 16 5.5 Total 216 100 28 100 16 100 29 100 1 100 290 100
21
Table 11. Causes of death by sex and age group occurring during the first month of the crisis, retrospective survey in Balukhali 2 & Tasnimarkhola camps, November 2017 < 5 years 5 years + Males Females Total n % n % n % n % N % Diarrhoea 1 3.3 3 1.6 2 1.4 2 2.8 4 1.8
Respiratory Infection 1 3.3 4 2.1 2 1.4 3 4.2 5 2.3
Malnutrition 0 0.0 0 0.0 0 0.0 0 0.0 0 0.0
Pregnancy related 0 0.0 0 0.0 0 0.0 0 0.0 0 0.0
Malaria - Fever 0 0.0 4 2.1 2 1.4 2 2.8 4 1.8
Measles 0 0.0 0 0.0 0 0.0 0 0.0 0 0.0
Trauma - Accident 2 6.7 0 0.0 1 0.7 1 1.4 2 0.9
Violence 23 76.7 162 86.6 129 89 56 77.8 185 85.3
Tuberculosis 0 0.0 3 1.6 1 0.7 2 2.8 3 1.4
Others 1 3.3 3 1.6 1 0.7 3 4.2 4 1.8
Unknown 2 6.7 8 4.3 7 4.8 3 4.2 10 4.6
Total 30 100 187 100 145 100 72 100 217 100
Table 12. Type of violence for violent deaths, first month of the crisis, by sex and age group, retrospective survey in Balukhali 2 & Tasnimarkhola camps, November 2017
< 5 years 5 years + Males Females Total n % n % n % n % N %
Beaten 6 26.1 28 17.3 23 17.8 11 19.6 34 18.4
Following sexual violence 0 0.0 6 3.7 0 0.0 6 10.7 6 3.2
Shot 13 56.5 117 72.2 97 75.2 33 58.9 130 70.3
Landmine 2 8.7 5 3.1 4 3.1 3 5.4 7 3.8
Detained - kidnapped 0 0.0 2 1.2 1 0.8 1 1.8 2 1.1
Cut the throat 0 0.0 1 0.6 1 0.8 0 0.0 1 0.5
Unknown 2 8.7 1 0.6 3 2.3 0 0.0 3 1.6
Others 0 0.0 2 1.2 0 0.0 2 3.6 2 1.1
Total 23 100 162 100 129 100 56 100 185 100
3.5 Prevalence of acute malnutrition Among children aged 6-59 months, 1.2% (n=15) were not at home at the time of the interview so could not be assessed for malnutrition, leaving 1,118 children to be assessed using MUAC measurement and bilateral oedema. The overall GAM for Balukhali 2 and Tasnimarkhola camps was 12.0% [95% CI: 10.2–13.9], above the standard emergency threshold of 10%; a GAM of over 10% indicates a public health emergency requiring immediate intervention9 (Tables 13 & 14). The prevalence of MAM and SAM were each, respectively, 7.5% [95% CI: 6.1-9.1] and 4.5% [95% CI: 3.4-5.8], with no significant difference by camps.
9 Integrated Food Security Phase Classification (IPC) Global Partners. Tools and Procedures for Classification of Acute Malnutrition. (2016). Addendum to IPC Technical Manual Version 2.0. Evidence and Standards for Better Food Security Decisions. Available at http://www.ipcinfo.org/fileadmin/user_upload/ipcinfo/docs/IPC_Acute_Malnutrition_Addendum2016.pdf

22
Table 13. Prevalence of acute malnutrition by location based on MUAC and/or oedema for children between 6 and 59 months in Balukhali 2 & Tasnimarkhola camps, November 2017 Balukhali 2 camp Tasnimarkhola camp All
GAM (77) 11.0 % (8.9 - 13.5 95% C.I.)
(65) 13.4 % (10.6 - 16.7 95% C.I.)
(142) 12.0 % (10.2 - 13.9 95% C.I.)
MAM (46) 6.6 % (4.9 - 8.6 95% C.I.)
(43) 8.8 % (6.6 – 11.7 95% C.I.)
(89) 7.5 % (6.1 - 9.1 95% C.I.)
SAM (31) 4.4 % (3.1 – 6.2 95% C.I.)
(22) 4.5 % (3.0 - 6.8 95% C.I.)
(53) 4.5 % (3.4 - 5.8 95% C.I.)
Table 14. Prevalence of acute malnutrition by age based on MUAC and/or oedema for children between 6 and 59 months in Balukhali 2 & Tasnimarkhola camps, November 2017 SAM MAM Normal Oedema Age (mo) n % n % n % n %
6 to 11 21 18.3 21 18.3 73 63.5 0 0.0 12 to 17 10 8.1 25 20.2 89 71.8 3 2.4 18 to 23 4 3.3 20 16.5 97 80.2 1 0.8 24 to 29 4 2.4 10 5.9 156 91.8 2 1.2 30 to 35 2 2.1 1 1.1 92 96.8 1 1.1 36 to 41 3 1.5 9 4.4 192 94.1 1 0.5 42 to 47 0 0.0 2 2.1 94 97.9 0 0.0 48 to 53 2 1.0 0 0.0 194 99.0 0 0.0 54 to 59 1 1.5 1 1.5 65 97.0 0 0.0 Total 47 4.0 89 7.5 1052 88.6 8 0.7
3.6 Measles vaccination coverage The measles vaccination coverage was calculated for 1,264 children between 6 and 59 months old. Overall, the vaccination coverage was 22.4% [95% CI: 20.2–24.9], of which 2.8% [95% CI: 2.0–3.9] of respondents had proof of vaccination by health card and 19.6% [95% CI: 17.5–22.0] by oral confirmation (Table 15). Table 15. Measles vaccination coverage for children between 6 and 59 months in Balukhali 2 & Tasnimarkhola camps, November 2017
Vacci. Card Vacci. caregiver Vacci. card or caregiver n(%) IC95% n(%) IC95% n(%) IC95% Age (mo) 6 to 23 13 (3.6) 2.1 - 6.0 52 (14.3) 11.1 - 18.3 65 (17.9) 14.3 - 22.1 24 to 59 21 (2.5) 1.6 - 3.8 184 (21.9) 19.3 - 24.9 205 (24.4) 21.6 - 27.5 Site Balukhali 2 camp 7 (1.0) 0.5 - 2.0 175 (24.7) 21.7 - 28.0 182 (25.7) 22.6 - 29.0 Tasnimarkhola camp 27 (5.5) 3.8 - 7.8 61 (12.3) 9.7 - 15.5 88 (17.8) 14.7 - 21.4 Total 34 (2.8) 2.0 - 3.9 236 (19.6) 17.5 - 22.0 270 (22.4) 20.2 - 24.9
23
4 Discussion
4.1 Major findings This survey is representative of 135,980 Rohingya living in Balukhali 2 and Tasnimarkhola camps who recently arrived in Bangladesh following a mass displacement crisis beginning August 25, 2017 in Rakhine, Myanmar. This number represents 22% of the total estimated population of 626,000 new arrivals in Bangladesh. These data substantiate the nature and scale of violence-related mortality for this population and quantify the effects of the crisis on the displaced Rohingya by assessing the periods before and after their displacement. A large majority of the population we surveyed fled into Bangladesh in the period following the events of August 25th. Mortality was extremely high during this period, and was overwhelmingly due to violence. For the entire recall period this survey describes 290 deaths, which represent deaths of 4.0% [95% CI: 3.57-4.47] (290/7257) of the sampled population who died between May 27th and November 12th 2017. The cause of death was due to direct violence for 209 (72.1%) of these deaths, with direct violence also responsible for the death of 2.9% [95% CI: 2.52-3.29%] of the population. In the first month of the crisis, the vast majority of Rohingya who died were killed by shooting (70.3%), beating (18.4%), landmines (3.8%) and as a consequence of sexual violence (3.2%). Although men were at higher risk of being killed, women and children were also targeted. Of all reported deaths, 96.6% (202/209) occurred in Myanmar versus 2.8% (6/209) in Bangladesh. Among these, 85.1% (178/209) occurred in the respondent’s village of origin and 13.4% (28/209) occurred during the population’s displacement from their home village to the camp. The number of reported deaths reached a peak in the first month of the crisis (August 25th to September 24th, 2017), comprising 74.8% (217/290) of all reported deaths and 65.2% (30/46) of children under five years old. Among these children, more than three-quarters (23/30 or 76.6%) died because of direct violence, which was responsible for the death of 1.66% [95% CI: 1.11-2.48] of the total population of children under five.
4.2 Demography As represented by the survey sample, the population of Balukhali 2 & Tasnimarkhola camps is comprised of 19.4% children under 5 years of age, and 49.0% aged <15 years, with a mean age of 19.6 years. This is younger than the population of Rakhine State as a whole, by report of official data from 2014 from the Government of Myanmar, where 8.5% of the population were under 5 years and 31.1% under 15 years.10 The age pyramid broadly fits the expected shape of a growing population, with many more people in the younger age groups (0-14), however there is also a gap in the age pyramid in the 20-24 age group. Whether this reflects historical events in Myanmar or more recent events is difficult to assess. In the 15-29 (0.78) and 30-44 (0.82) age groups, the sex ratios (male to female) were 0.78 and 0.82, respectively, lower than the total population (0.92), suggesting that men are under-represented in these age groups. Additional qualitative research, and comparison with testimonies from the displaced population, may assist with further explanations for this demographic deficit. Understanding whether these men are missing, and why, or if this
10 Myanmar Department of Population, Ministry of Immigration and Population. The 2014 Myanmar Population and Housing Census, Census Report Volume 2. Available at http://myanmar.unfpa.org/sites/default/files/pub-pdf/MyanmarCensusAtlas_lowres.pdf
24
conforms to the population distribution prior to the recent crisis, would add valuable contextual knowledge.
4.3 Retrospective mortality The high retrospective mortality rate (CMR of 4.6 deaths/10,000/day) in the total population of Balukhali 2 & Tasnimarkhola camps since August 25th is more than four times the international emergency threshold. Expressed as a percentage of the population, this number represented the death of 252/7257 people in the survey sample, or 3.5% of the population [95% CI: 3.08-3.92]. For children under five years old (U5MR of 3.9 deaths/10,000/day) mortality rate was almost two times the emergency threshold, and represented the death of 40/1383 in the survey sample, or 2.9% [95% CI: 2.13-3.91] of the population under age 5. If we consider the first month of the crisis alone, the survey shows an exceedingly high level of mortality, at more than 10 times the emergency threshold, with a CMR of 10.2 deaths/10,000/day, and an U5MR of 7.4 deaths/10,000/day, at almost 4 times the emergency threshold. In the period following August 25, 2017, 217/7257 people died, which is 3.0% of the population [95% CI: 2.62-3.41]. Although the mortality rate was higher for males with 14.1 deaths/10,000/day, the death rate for women during this time also significantly exceeded emergency thresholds at 6.5 deaths/10,000/day. For children less than 5 years of age, 2.2% [95% CI: 1.52-3.08] of the population died in the first month of the crisis, with most of those deaths resulting directly from violence (23/30 or 76% of deaths of children under 5 in the first month of the crisis). These results strongly suggest that the Rohingya population faced mass killings prior to their arrival in Bangladesh. This exceptionally high mortality due to violence is likely to contribute to significant trauma for survivors and witnesses.
4.4 Acute malnutrition The prevalence of global acute malnutrition (GAM) based on MUAC & oedema for children aged 6 to 59 months was 12.0% [95% CI: 10.2-13.9]. According to the Integrated Food Security Phase Classification (IPC) Global Partners, when GAM measured by MUAC is 11% or more, the severity of the malnutrition situation is considered to be critical (Phase 4 out of 5) and requires a significant scale-up of response. The prevalence of moderate acute malnutrition (MAM) was 7.5% [95% CI: 6.1-9.1] and that of severe acute malnutrition (SAM) was 4.5% [95% CI: 3.4-5.8]. There was no significant difference between Balukhali 2 & Tasnimarkhola camps in the prevalence of acute malnutrition estimated by MUAC. However, great variation in the diagnosis of acute malnutrition using weight-for-height Z-score (WHZ) or MUAC has been observed in this population. Previous results of the Emergency Nutrition and Health survey carried out by Action Contre la Faim (ACF) and the Centers for Disease Control (CDC) in the registered Kutupalong refugee camp from October 22-28, 2017 found a very large discrepancy between prevalence of acute malnutrition whether assessed using WHZ or MUAC, with 24.3% [CI 95%: 19.5-29.7] (WHZ<-2 and or oedema) vs 5.9% [CI 95%: 3.7-9.4] (MUAC<125mm and oedema) for GAM and 7.5% [CI 95%: 4.9-11.2] (WHZ<-3 and/or oedema) vs 0.7% [CI 95%: 0.2-2.7] (MUAC<115mm and/or oedema) for SAM. As different children are diagnosed with acute malnutrition using the two WHO recommended criteria, reporting the WHZ-only or MUAC-only prevalence might underestimate the problem with acute malnutrition in the Rohingya population that was surveyed.
25
However, the prevalence of SAM and GAM as measured by MUAC in this survey are already alarming, and the problem may be even more severe if in this camp the ratios of the WHZ score and MUAC prevalence are similar to the results found in Kutupalong camp. A recent increase in suspected measles cases in the settlements should also provide important context to understand malnutrition levels, which are commonly elevated following measles outbreaks11.
4.5 Measles vaccination According to WHO, on September 16, 2017, a mass measles vaccination campaign was carried out in Cox’s Bazar for 14 days. Although the campaign targeted 122,580 children from 6 months to 15 years old in the 2 upazilas of Cox’s Bazar (Tekaf, Ukhia) and Naikhongchhari upazila in Bandarban district, the total number of children under 15 years vaccinated against measles was 135,519. However, the line list of measles suspected cases in Balukhali 2 and Tasnimarkhola camps was already substantial with 114 cases in children reported from October 18 - November 12, 2017. This trend is not surprising given the findings from this survey that measles vaccination coverage for 1,264 children aged 6 - 59 months old was 22.4% [95% CI: 20.2-24.9] (2.8% [95% CI: 2.0-3.9] with vaccination card proof and 19.6% [95% CI: 17.5-22.0] by oral confirmation. This very low vaccination coverage represents a substantial public health risk for the population. To this end, the Ministry of Health and the United Nations Children's Fund (UNICEF), with support from MSF, began a mass measles vaccination campaign on November 18, 2017, targeting all settlements and all children aged 6 months to 15 years.
4.6 Limitation on use of results Information collected in this survey was based on interviews with a selection of the population present on the day of the interview in Balukhali 2 & Tasnimarkhola camps. Therefore, the results cannot be extrapolated to the Rohingya population that remains in Myanmar. Additionally, surveys such as this one have important and well-described limitations12. When mortality rates are high, an entire family may disappear (either because all the members died, or because the lone survivors, such as orphans, joined a different household) and their experience is thus not reflected in the sampled population, leading to an underestimation of mortality rates (this is known as “survival bias”). Recall bias is difficult to measure, but when retrospective periods are short, as in the case of our survey, it is more likely that fewer deaths are under-reported (due to death memory or recall bias); in the case of this survey, the short recall period is likely to have reduced the bias related to cause, place and time of death. Causes of death should also be interpreted with caution because they were reported by family members based on symptoms and observation, with no autopsy or clinical diagnosis to verify the clinical cause of death.
11 Bhaskaram, P. (1995). Measles & malnutrition. The Indian journal of medical research. 102. 195-9. Available at https://www.ncbi.nlm.nih.gov/pubmed/8675238 12 Checchi F, Roberts L. (2005). Interpreting and using mortality data in humanitarian emergencies. Humanitarian Practice Network, 52. Available at https://odihpn.org/wp-content/uploads/2005/09/networkpaper052.pdf

26
5 Conclusion
This survey provides epidemiological evidence of high rates of mortality among the Rohingya due to violence, and suggest that the Rohingya population faced mass killings prior to their arrival in Bangladesh. The mortality rate in the first month of the crisis (August 25th to September 24th) exceeded 10 times the emergency threshold for the surveyed population, and four times the emergency threshold for children under five years old. For the total population and children under five, these mortality rates were, respectively, more than 17 and 14 times the mortality rates before the crisis. Described in percentages, our results from the entire recall period show that from August 25 – November 12, 2017, 3.5% [95% CI: 3.08-3.92] of the whole population and 2.9% [95% CI: 2.13-3.91] of children under five years old died. For adults and children combined, this mortality rate is more than seven times the mortality rates before the crisis began. Moreover, it is likely that this mortality is underestimated as the survey does not capture mortality among families who died in their entirety or who have been as yet unable to flee Myanmar. This exceptionally high mortality due to violence is likely to contribute to significant trauma for survivors and witnesses. Prevalence of acute malnutrition based on MUAC and oedema was above the standard emergency threshold, at 12.0% [95% CI: 10.2-13.9] GAM and 4.5% [95% CI: 3.4-5.8] SAM. A burgeoning measles outbreak is likely to increase these levels of malnutrition. However these results should be put into perspective with other surveys from other organisations, as it seems to be a great variation between WHZ and MUAC in this population. Future anthropometric surveys should include measurements of both MUAC and WHZ to explore further the pattern of malnutrition in this population. The measles vaccination rate for children between 6 to 59 months was very low at 22.4% [95% IC: 20.2-24.9]). The current measles outbreak remains a major public health concern. MSF should continue to prepare for an increasing caseload and to support the ongoing vaccination campaign.

27
6 Appendixes
Appendix 1. Framework of the electronic survey questionnaire form....................................28
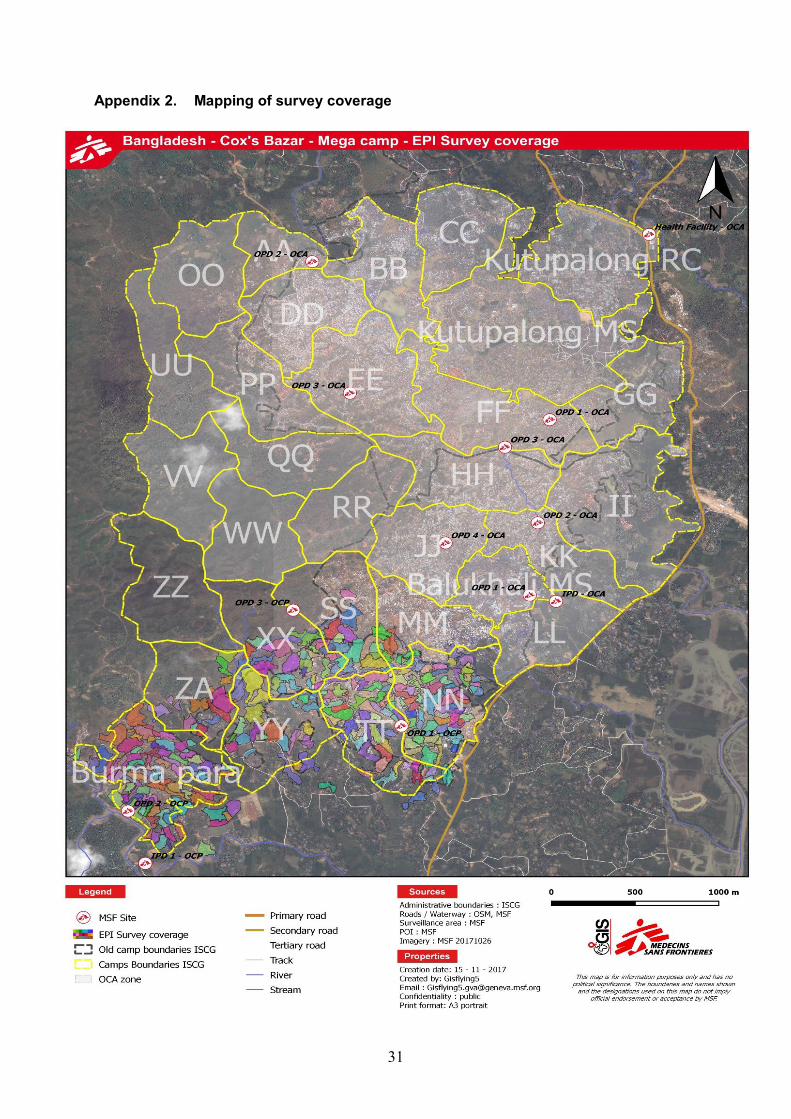
Appendix 2. Mapping of survey coverage ............................................................................31
Appendix 3. Retrospective mortality rates of Balukhali 2 & Tasnimarkhola camps for the period 1 & 2, November 2017...........................................................................32

28
Appendix 1. Framework of the electronic survey questionnaire form
Label Hint [A1] Team 's Number What is the number of the team? [A2] Camp name [A3] Date of interview [A4] Block number What is the block number? [A5] Shelter number What is the shelter number? [A6] Family number What is the family number?
[A7] Does the family representative have given his oral consent?
“Hello, my name is ……., we work for Médecins sans frontières (MSF), a non-governmental organization that is supporting health services in the camp. We are approaching you with the authorization of Ministry of Health. We are monitoring demographic and nutritional situation as well as vaccination against measles for children between 6 to 59 month old in the camp. I would like, if you allow it, to talk to you and ask you a few questions about this subject. All information that we will gather will remain confidential. There is no harm or benefit for your family in taking part in this data collection. You should feel free to decline taking part, and nothing will happen to you as a result of not participating. This data collection is not linked to any food distribution or other registration effort. Participation will benefit the community as a whole, as it will improve the quality of information that we collect. Also, please ask us any questions that you feel would be important for you to decide whether to participate.”
Questionnaire
[B1] What is the situation of your family?
[B2] When did your family arrive in the camp? (For every date, if the person does not remember, use the calendar of events)
[C1] How many people live in your family currently
A family is defined as a group of people who eat together and slept under the same roof the previous night. Information on the whole family should be included, no matter the age of the family member or the relation with the other members.
Instruction We will now ask you questions about every person that is part of your family currently. We will start by the youngest.
Person [C2] What is the first name of the person N° ${Rang Present}?
[C3] How old is ${First name}?

29
[C4] Unit of age Please precise the unit of age
[C5] Is ${First name} male or female?
[C6] Is ${First name} born after May 27th, 2017 (start of Ramadan)?
[C7] What was the date of birth of ${First name}?
[C8] Did ${First name} join your family since May 27th, 2017 (start of Ramadan)?
[C9] What was the date of arrival of ${First name}?
[C10] Middle Upper-Arm-Circumference (MUAC)
[C11] What is ${First name} middle upper arm circumference (MUAC)? (Write 999 if child is away)
[C12] Unit of MUAC (mm or cm)
[C13] Does ${First name} have oedema?
[C14] Measles vaccination
[C15] Did ${First name} get a vaccination card for measles?
Verify whether the eligible child from 6 to 59 month old has a vaccination card for measles.
[C16] Did ${First name} receive the measles vaccine?
[D1] How many people who were part of your family on May 27th, 2017 (start of Ramadan) have left or died since this date?
[D2] Instruction
We will now ask you questions about every person that have left or died since May 27th, 2017 (start of Ramadan). We will start by the youngest.
[D3] Person who is left or died
[D4] What is the first name of the person N° ${Rang left or died}?
[D5] How old was ${First name}?
[D6] Unit of Age Please precise the unit of age
[D7] Is ${First name} male or female?
[D8] Is ${First name} born after May 27th, 2017 (start of Ramadan)?
[D9] What was the date of birth of ${First name}?
[D10] Is ${First name} left the family after May 27th, 2017 (start of Ramadan) or is ${First name} died after May 27th, 2017 (start of Ramadan)?
[D11] What was the date of departure of ${First name}?
[D12] Death
[D13] Please accept my condolences
[D14] What was the date of death of ${First name}?
[D15] What was the cause of death of ${First name}

30
[D16] Please precise the type of violence
[D17] Please precise the cause of violence
[D18] Please precise the cause of death of ${First name}
[D19] Where did ${First name} die?
[D20] Please precise the other place of death of ${First name}
Comments
List name Label Status Resident Displaced Mixed (resident and displaced) Cause of death Diarrhoea Respiratory Infection Malnutrition Pregnancy-related Malaria/fever Measles Trauma / Accident Violence Other (specify) Does not know Type of violence Beaten Sexual Shot Landmine Detained/ kidnapped Unknown Other (specify) Place of death On this site In his/her location/village in Myanmar During the exodus in Myanmar During the exodus in Bangladesh Other Does not know Type of oedema No Bilateral oedema (+) on both feet
Bilateral oedema (++) on both feet lower legs and upper arms
Bilateral oedema (+++) generalised both feet legs hands face
Not checked Vaccination status Measles received with confirmation by card Measles received without confirmation by card Measles not received Does not know
31
Appendix 2. Mapping of survey coverage
32
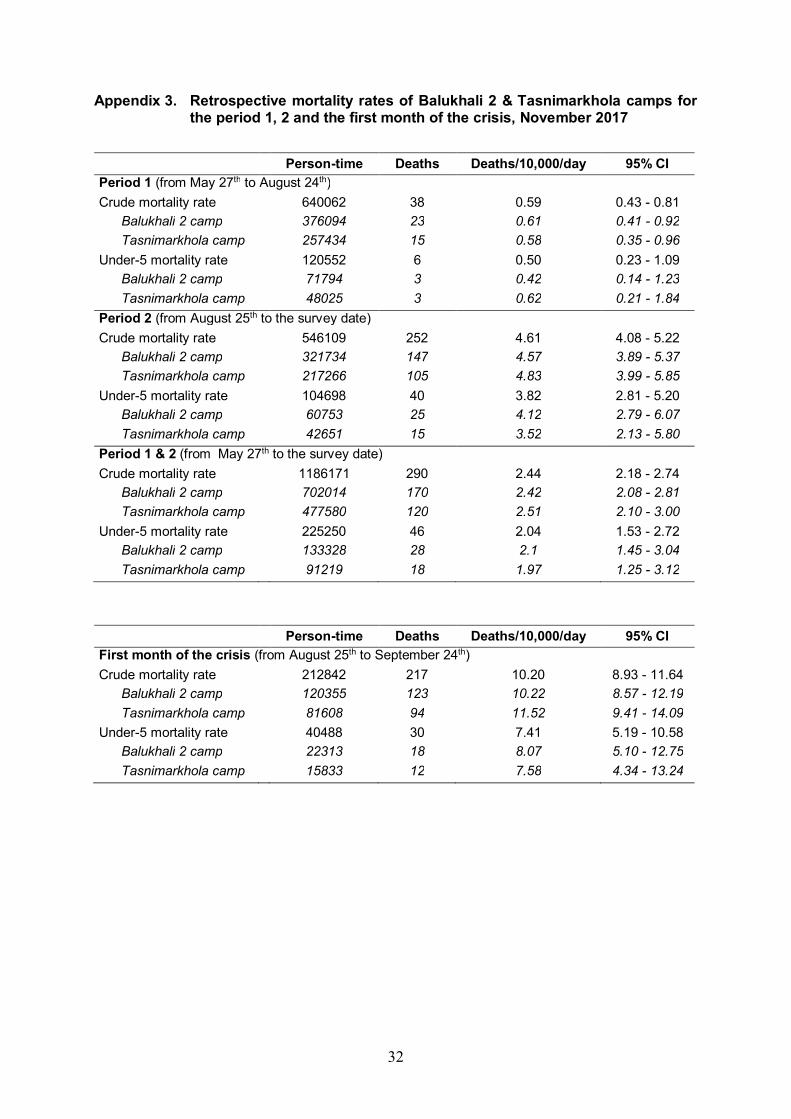
Appendix 3. Retrospective mortality rates of Balukhali 2 & Tasnimarkhola camps for the period 1, 2 and the first month of the crisis, November 2017
Person-time Deaths Deaths/10,000/day 95% CI
Period 1 (from May 27th to August 24th) Crude mortality rate 640062 38 0.59 0.43 - 0.81 Balukhali 2 camp 376094 23 0.61 0.41 - 0.92 Tasnimarkhola camp 257434 15 0.58 0.35 - 0.96 Under-5 mortality rate 120552 6 0.50 0.23 - 1.09 Balukhali 2 camp 71794 3 0.42 0.14 - 1.23 Tasnimarkhola camp 48025 3 0.62 0.21 - 1.84 Period 2 (from August 25th to the survey date) Crude mortality rate 546109 252 4.61 4.08 - 5.22 Balukhali 2 camp 321734 147 4.57 3.89 - 5.37 Tasnimarkhola camp 217266 105 4.83 3.99 - 5.85 Under-5 mortality rate 104698 40 3.82 2.81 - 5.20 Balukhali 2 camp 60753 25 4.12 2.79 - 6.07 Tasnimarkhola camp 42651 15 3.52 2.13 - 5.80 Period 1 & 2 (from May 27th to the survey date) Crude mortality rate 1186171 290 2.44 2.18 - 2.74 Balukhali 2 camp 702014 170 2.42 2.08 - 2.81 Tasnimarkhola camp 477580 120 2.51 2.10 - 3.00 Under-5 mortality rate 225250 46 2.04 1.53 - 2.72 Balukhali 2 camp 133328 28 2.1 1.45 - 3.04 Tasnimarkhola camp 91219 18 1.97 1.25 - 3.12
Person-time Deaths Deaths/10,000/day 95% CI First month of the crisis (from August 25th to September 24th) Crude mortality rate 212842 217 10.20 8.93 - 11.64 Balukhali 2 camp 120355 123 10.22 8.57 - 12.19 Tasnimarkhola camp 81608 94 11.52 9.41 - 14.09 Under-5 mortality rate 40488 30 7.41 5.19 - 10.58 Balukhali 2 camp 22313 18 8.07 5.10 - 12.75 Tasnimarkhola camp 15833 12 7.58 4.34 - 13.24