Retrospective dosimetry based on niobium …3 SerØn, Tom & Kekki, Tommi. Retrospective dosimetry...
40
ESPOO 2003 VTT RESEARCH NOTES 2203 Tom Serén & Tommi Kekki Retrospective dosimetry based on niobium extraction and counting - VTT's contribution to the RETROSPEC project Channel 0 200 400 600 800 1000 Counts per channel 0 50 100 150 200 250 LSC spectrum (Nb + Ta) 93m Nb 182 Ta + 94 Nb
Transcript of Retrospective dosimetry based on niobium …3 SerØn, Tom & Kekki, Tommi. Retrospective dosimetry...

VTT RESEA
RCH N
OTES 2203Retrospective dosim
etry based on niobium extraction and counting - V
TT's contribution to the RETROSPEC project
Tätä julkaisua myy Denna publikation säljs av This publication is available from
VTT TIETOPALVELU VTT INFORMATIONSTJÄNST VTT INFORMATION SERVICEPL 2000 PB 2000 P.O.Box 2000
02044 VTT 02044 VTT FIN�02044 VTT, FinlandPuh. (09) 456 4404 Tel. (09) 456 4404 Phone internat. + 358 9 456 4404Faksi (09) 456 4374 Fax (09) 456 4374 Fax + 358 9 456 4374
ISBN 951–38–6179–1 (soft back ed.) ISBN 951–38–6180–5 (URL: http://www.vtt.fi/inf/pdf/)ISSN 1235–0605 (soft back ed.) ISSN 1455–0865 (URL: http://www.vtt.fi/inf/pdf/)
ESPOO 2003 VTT RESEARCH NOTES 2203
Tom Serén & Tommi Kekki
Retrospective dosimetry based onniobium extraction and counting -VTT's contribution to the RETROSPECproject
VTT TIEDOTTEITA – RESEARCH NOTES
VTT PROSESSIT – VTT PROSESSER –VTT PROCESSES
2139 Lohiniva, Elina, Sipilä, Kai, Mäkinen, Tuula & Hietanen, Lassi. Jätteiden energiakäytönvaikutukset kasvihuonekaasupäästöihin. 2002. 119 s.
2141 Laine-Ylijoki, Jutta, Wahlström, Margareta, Peltola, Kari, Pihlajaniemi, Miina & Mäkelä,Esa. Seospolton tuhkien koostumus ja ympäristölaadunvarmistusjärjestelmä. 2002. 51 s.+ liitt. 59 s.
2142 Tuhkanen, Sami. Jätehuollon merkitys Suomen kasvihuonekaasupäästöjenvähentämisessä. Kaatopaikkojen metaanipäästöt ja niiden talteenotto. 2002. 46 s.
2143 Meinander, Harriet & Varheenmaa, Minna. Clothing and textiles for disabled and elderlypeople. 2002. 58 p. + app. 4 p.
2145 Helynen, Satu, Flyktman, Martti, Mäkinen, Tuula, Sipilä, Kai & Vesterinen, Pirkko.Bioenergian mahdollisuudet kasvihuonekaasupäästöjen vähentämisessä. 2002. 110 s. +liitt. 2 s.
2153 Hänninen, Seppo & Lehtonen, Matti. Earth fault distance computation with fundamentalfrequency signals based on measurements in substation supply bay. 2002. 40 p.
2155 Hepola, Jouko & Kurkela, Esa. Energiantuotannon tehostaminen fossiilisiin ja uusiutuviinpolttoaineisiin perustuvassa energiantuotannossa. 2002. 65 s.
2163 Miettinen, Jaakko & Hämäläinen, Anitta. GENFLO - A general thermal hydraulic solutionfor accident simulation. Espoo 2002. VTT Tiedotteita – Research Notes 2163. 75 p. + app.4. p.
2164 FINNUS, The Finnish Research Programme on Nuclear Power Plant Safety 1999-2002.Final Report. Ed by Riitta Kyrki-Rajamäki & Eija Karita Puska. 267 p. + app. 68 p.
2165 FINNUS, The Finnish Research Programme on Nuclear Power Plant Safety 1999–2002.Executive Summary. Ed. by Riitta Kyrki-Rajamäki. 2002. 26 p. + app. 18 p.
2177 Mäkelä, Kari, Laurikko, Juhani & Kanner, Heikki. Suomen tieliikenteen pakokaasupäästöt.LIISA 2001.1 -laskentajärjestelmä. 2002. 63 s. + liitt. 42 s.
2186 Syri, Sanna & Lehtilä, Antti. Kasvihuonekaasujen päästöjen vähentämisen vaikutusmuihin ilmansaasteisiin. 2003. 69 s.
2187 Siltanen, Satu. Teknisiä ja taloudellisia näkökohtia käytetyn ydinpolttoaineenloppusijoituksen palautettavuudesta. Kirjallisuusselvitys. 2003. 72 s.
2196 Lehtilä, Antti & Syri, Sanna. Suomen energiajärjestelmän ja päästöjen kehitysarvioita.Climtech-ohjelman skenaariotarkastelu. 2003. 62 s.
2199 Alanen, Raili, Koljonen, Tiina, Hukari, Sirpa & Saari, Pekka. Energian varastoinninnykytila. 2003. 169 s. + liitt. 60 s.
2003 Serén, Tom & Kekki, Tommi. Retrospective dosimetry based on niobium extraction andcounting – VTT’s contribution to the RETROSPEC project. 2003. 36 p.
2209 Monni, Suvi & Syri, Sanna. Uncertainties in the Finnish 2001 Greenhouse Gas EmissionInventory. 2003. 101 p. + app. 27 p.
2212 Hepola, Jouko. Elohopeapäästöt fossiilisiin polttoaineisiin ja jätteisiin perustuvassaenergiantuotannossa. 2003. 37 s.
Channel
0 200 400 600 800 1000
Cou
nts
per c
hann
el
0
50
100
150
200
250
LSC spectrum (Nb + Ta)
93mNb
182Ta + 94Nb


VTT TIEDOTTEITA – RESEARCH NOTES 2203
Retrospective dosimetry basedon niobium extraction and
counting – VTT’s contributionto the RETROSPEC project
Tom Serén & Tommi KekkiVTT Processes

ISBN 951�38�6179�1 (soft back ed.)ISSN 1235�0605 (soft back ed.)ISBN 951�38�6180�5 (URL: http://www.vtt.fi/inf/pdf/)ISSN 1455�0865 (URL: http://www.vtt.fi/inf/pdf/)Copyright © VTT 2003
JULKAISIJA � UTGIVARE � PUBLISHER
VTT, Vuorimiehentie 5, PL 2000, 02044 VTTpuh. vaihde (09) 4561, faksi (09) 456 4374
VTT, Bergsmansvägen 5, PB 2000, 02044 VTTtel. växel (09) 4561, fax (09) 456 4374
VTT Technical Research Centre of Finland, Vuorimiehentie 5, P.O.Box 2000, FIN�02044 VTT, Finlandphone internat. + 358 9 4561, fax + 358 9 456 4374
VTT Prosessit, Otakaari 3 A, PL 1608, 02044 VTTpuh. vaihde (09) 4561, faksi (09) 456 6390
VTT Processer, Otsvängen 3 A, PB 1608, 02044 VTTtel. växel (09) 4561, fax (09) 456 6390
VTT Processes, Otakaari 3 A, P.O.Box 1608, FIN�02044 VTT, Finlandphone internat. + 358 9 4561, fax + 358 9 456 6390
Technical editing Marja Kettunen
Otamedia Oy, Espoo 2003

3
Serén, Tom & Kekki, Tommi. Retrospective dosimetry based on niobium extraction and counting VTT´scontribution to the RETROSPEC project. Espoo 2003. VTT Tiedotteita � Research Notes 2203. 36 p.
Keywords nuclear reactors, reactor dosimetry, RETROSPEC, reactor materials, niobium, extraction,counting, retrospective dosimetry, pressure vessels, embrittlement
AbstractWithin the European Commission 5th Framework RETROSPEC project severalirradiated VVER-440 pressure vessel materials have been investigated in order todetermine the feasibility of �retrospective� neutron dosimetry based on the analysis of93mNb induced in structural reactor materials containing small amounts of niobium(about 50 ppm to 1 %). Methods for chemical separation of niobium and activitymeasurements, previously developed at VTT, were tested and refined and foundaccurate and reliable for typical cladding materials. For base material containingniobium only as an impurity the methods were not successful. The measured specific93mNb activities were in good agreement with both calculated activities and otherinduced activities in the same materials and in dedicated dosimetry materials irradiatedtogether with the investigated materials.
The results of the three participants (NRG Petten, VTT and SCK�CEN) will becompared and summarised in a final report published by NRG Petten. The feasibility ofdifferent chemical separation and activity determination methods will be evaluated in aCode of Practice.

4
Preface
This report constitutes part of the final documentation for the European Commission 5th
Framework RETROSPEC project (contract FIKS-CT-2000-00091) with NRG Petten,The Netherlands, as co-ordinator and VTT Processes and SCK●CEN, Mol, Belgium, asparticipating partners. �koda JS a.s., Plzeň, Czech Republic, also supplied material forthe exercise.
The project was discussed for the first time at the 10th International Symposium onReactor Dosimetry in Osaka, Japan, in September 1999. At that time a batch of claddingmaterial irradiated in Dukovany, Czech Republic, had been distributed to differentlaboratories by �koda (J. Hógel). However, the financial resources to participate in the�koda Round Robin exercise were lacking. Thus it was proposed to enlarge the scope ofthe exercise and establish a 5th Framework project financed partly by the EuropeanCommission.
The kick-off meeting was held on 23 November 2000 at the SCK�CEN headquarters inBrussels. At this meeting a work plan and time table were drawn up and the materialselection was discussed.
The aim of the project is to establish a Code of Practice for �retrospective� dosimetrybased on extraction and counting of niobium present in different structural materials inpower reactors, mainly the pressure vessel. In order to be useful the methods involvedshould be applicable at normally equipped radiochemical laboratories.
For this purpose four steel materials with different irradiation and decay histories, threecladding materials and one base material, have been distributed among the participantsfor processing and analysis.

5
Contents
Abstract..............................................................................................................................3
Preface ...............................................................................................................................4
1. Introduction..................................................................................................................7
2. Materials and methods .................................................................................................92.1 Distributed materials ..........................................................................................9
2.1.1 Dukovany material .................................................................................92.1.2 Loviisa �old� ........................................................................................102.1.3 Loviisa �new�.......................................................................................122.1.4 LYRA-02 samples................................................................................13
2.2 Methods for the typical cladding material........................................................152.2.1 Chemical separation and purification of Nb ........................................152.2.2 Nb activity measurements ....................................................................17
2.3 Methods for pure Nb wires...............................................................................212.3.1 Dissolution of Nb .................................................................................222.3.2 Nb activity measurements ....................................................................22
3. Results and discussion ...............................................................................................233.1 Material �Dukovany� .......................................................................................23
Reaction Rate....................................................................................................233.2 Material �Loviisa old�......................................................................................27
3.2.1 Comparison with calculations and other measurements ......................283.3 Material �Loviisa new� ....................................................................................29
3.3.1 Comparison with calculations and other measurements ......................303.4 Material �LYRA-02�........................................................................................323.5 Estimated uncertainties.....................................................................................32
4. Conclusions and recommendations............................................................................34
References .......................................................................................................................35


7
1. Introduction
�Retrospective� dosimetry refers to the use of structural materials in reactors, notoriginally intended for dosimetric purposes, as neutron dosimeters in long-termirradiations. The most important reactor component in this context is the reactorpressure vessel (RPV). The method can be applied to both operating (�biopsy�) andshut-down facilities (�autopsy�). To our knowledge the term was coined by Banham etal. in 1990 [1] and elaborated further by the same authors [2].
From the viewpoint of material damage the fast-neutron fluence is of main interest.Several elements with reactions sensitive to fast neutrons may be constituents ofstructural materials, Fe and the reaction 54Fe(n,p)54Mn being the most obvious.However, although 54Mn is easily measurable, the reaction is not ideal for long-termirradiations because of the fairly short half-life (312 d) and limited response region >2.5MeV. The best reaction for retrospective dosimetry is 93Nb(n,n�)93mNb (16.1 y).
The cross sections for the reactions 93Nb(n,n�) and 93Nb(n,γ) are shown in Figs 1 and 2.The former reaction is especially useful because of its attractive response characteristics(low threshold energy) and suitable half-life of the reaction product. The latter reactionis also useful because of its unusually large response in the upper epithermal region andvery long half-life (20000 y).
Neutron energy (MeV)
0 5 10 15 20
Cro
ss s
ectio
n (b
arns
)
10-6
10-5
10-4
10-3
10-2
10-1
100
93Nb(n,n')93mNb (RRDF-98)
Figure 1. Cross section as a function of energy for the reaction 93Nb(n,n’)93mNb (fromRRDF-98).

8
Neutron energy (MeV)
10-10 10-9 10-8 10-7 10-6 10-5 10-4 10-3 10-2 10-1 100 101 102
Cro
ss s
ectio
n (b
arns
)
10-4
10-3
10-2
10-1
100
101
102
93Nb(n,γ)94Nb (IRDF-90 v. 2)
Figure 2. Cross section as a function of energy for the reaction 93Nb(n,γ)94Nb (fromIRDF-90 v. 2).
However, Nb is not present in all structural materials, except as an impurity. Some RPVcladding materials, notably those used in VVER-440 reactors, contain of the order 1 %Nb as a stabilising agent. In the decay of 93mNb only conversion electrons and X-raysare emitted. Thus conventional gamma spectrometry cannot be applied for activitydetermination. Also, fairly complex radiochemical methods are required to extract theniobium in a form suitable for activity measurements. Guidelines for Nb processing andcounting are given in ASTM standard E 1297-96 [3], however, only for pure dosimetricNb material.
Starting in the mid-80�s a large effort, mainly by Dr. Bruno Bärs, was devoted by VTTto the utilisation of Nb for dosimetric purposes [4] � [8]. The present work is animportant step in reviving and maintaining these capabilities.

9
2. Materials and methods
2.1 Distributed materials
Four different materials were distributed in this exercise: cladding material irradiated insurveillance capsules in Dukovany, unit 4, simulated cladding material irradiated in theLoviisa reactors in two different irradiations and VVER-440 pressure vessel basematerial (15KhMFA) irradiated in the Petten High-Flux Reactor (HFR) in the LYRA-02experiment.
2.1.1 Dukovany material
A description of the material and irradiation is given by J. Hógel in Ref. [9]. Charpy-size specimens containing different layers (two different layers of cladding material andbase material from the Heat-Affected Zone) were irradiated in Dukovany, unit 4, duringcycle 7. The irradiation started 10 Nov. 1993 and ended 14 Sept. 1994 (309 days). Theeffective irradiation time at reference power (1375 MWth) was 291.5 days. Theirradiation history is shown in Fig. 3.
Day from start
0 50 100 150 200 250 300
Ther
mal
pow
er (M
W)
0
200
400
600
800
1000
1200
1400
Day from startDay from startDukovany-4, cycle 7BOI: 10 Nov. 1993EOI: 14 Sep. 1994
Figure 3. Irradiation history of Dukovany samples.

10
With this irradiation history the following saturation factors (activity at EOI/saturationactivity for reference power) are obtained: 3.369E-02 (93mNb), 2.725E-05 (94Nb),4.689E-01 (54Mn) and 9.935E-02 (60Co). Using these saturation factors the measuredspecific activities can be converted into reaction rates (see Table 3 on page 22).
One of the cladding layers contains nominally 1 % Nb. From the specimens containingthis material 2 mm thick samples were cut and distributed among several laboratories.For comparison pure Nb wires were placed in notches between the specimens. Todetermine flux gradients the 54Mn and 60Co activities of the samples were measured at�koda and gamma scanning performed on the specimens.
VTT received samples labelled A3, A11 and B5 plus one inactive sample for analysis.The inactive sample was analysed at VTT Manufacturing Technology with a ScanningElectron Microscope (SEM) coupled to an energy dispersive X-ray analyser (ResearchReport VAL24-012967, 15 Oct. 2001). The sample was found to contain 69 % Fe, 18.2% Cr, 10.3 % Ni, 1.3 % Mn, 0.6 % Si, 0.7 % Nb and <0.3 % Mo. Unfortunately theanalysis method is not very accurate for low-content elements, so these values are onlysemi-quantitative. Molybdenum is important because 93mNb is formed in the decay of93Mo, which in turn is formed by thermal-neutron capture in 92Mo. However, thisproduction path is important only in very long irradiations with Mo/Nb ratios >1 [8] andcan be neglected in these irradiations.
2.1.2 Loviisa “old”
A simulated VVER-440 cladding plate on base material backing was manufactured in1980 by Uddcomb, Sweden, for the IVO utility (now Fortum) operating the Loviisareactors. In 1986 32 sub-size Charpy specimens (55x10x7.5 mm) labelled 6K177 �6K208 were cut out from the plate. Of these 16 (6K177-192) were irradiated in thesurveillance chain 6K (Loviisa 1, cycles 10 � 13, EOI 28 July 1990) and the remaining16 were used as reference. The irradiation history is shown in Fig. 4.
For this exercise one half of the broken specimen 6K184, irradiated in capsule 86 about41.5 cm from the bottom of the active core, was recovered. 1.5 mm thick plates were cutfrom two sides according to Fig. 5. The cladding consists of two layers, of which onecontains of the order 1 % Nb (�red� side). The �blue� side is probably a fairlyinhomogeneous mixture of the two layers, containing much less Nb. Plates 1 were sentto NRG Petten and plates 3 to SCK�CEN, while plates 2 remained at VTT.

11
Days from start
0 200 400 600 800 1000 1200 1400
Ther
mal
pow
er (M
W)
0
200
400
600
800
1000
1200
1400
1600
Cycle 10 Cycle 11 Cycle 12 Cycle 13
Lo 1, cycles 10 - 13, teff = 1340.1 d
Figure 4. Power history for surveillance chain 6K (Loviisa 1, cycles 10–13, EOI 28July 1990).
1 2 3
A
AA
B
BB
Broken surface
"Red side"
"Blue side"
14
7.510
1.5
Figure 5. Plate samples cut from specimen 6K184.

12
The material was analysed at VTT Industrial Systems by Optical EmissionSpectrometer, Spectrolab S (Certificate of Analyses MTUO75-031203, 16 May 2003).One half of specimen 6K199 (the other half was irradiated in Loviisa 2, see nextSection) was cut in half between the �red� and �blue� surfaces, which made foursurfaces available for analysis. The results for some elements are given in Table 1.
Table 1. Composition of cladding material (main constituents), mass per cent. The errorlimits are standard deviations from two or three measurements.
Surface Fe Cr Ni Nb Mo
�Red� 69.14 ± 0.18 18.29 ± 0.21 9.39 ± 0.00 0.861 ± 0.002 0.0720 ± 0.001
Mid-1 69.33 ± 0.13 17.89 ± 0.12 9.49 ± 0.02 0.841 ± 0.015 0.0745 ± 0.001
Mid-2 69.10 ± 0.02 18.07 ± 0.06 9.56 ± 0.02 0.833 ± 0.018 0.078 ± 0.005
�Blue� 70.57 ± 0.50 17.38 ± 0.41 9.62 ± 0.19 0.008 ± 0.004 0.227 ± 0.004
For the �blue� material the Mo/Nb ratio is high enough to have some influence on the93mNb activity. However, in a 4-year irradiation it would constitute only about 1.2 %and about 0.3 % in a 1-year irradiation (Ref. [8], Table 3).
2.1.3 Loviisa “new”
A KLST specimen (27x4x3 mm) was cut from one half of the tested specimen 6K199from the �red� side (i.e. material containing about 0.85 % Nb). The specimen wasirradiated in container capsule 0 in surveillance chain 14K1 (Loviisa 2, cycle 21) atabout 196 cm above the active core bottom. The irradiation ended on 1 Sept. 2001 after340.9 days of effective irradiation time at reference power 1500 MWth (the nominalpower has been raised from 1375 MWth). The power history is shown in Fig. 6.
After the irradiation the specimen was cut into three parts, of which the end parts weresent to NRG Petten and SCK�CEN, respectively and the middle part was kept by VTT.Results from conventional neutron dosimetry were available both for this and the �old�specimen.

13
Days from start
0 100 200 300
Ther
mal
pow
er (M
W)
0
200
400
600
800
1000
1200
1400
1600
Lo 2, cycle 21, teff = 340.9 d (at 1500 MWth)EOI Sept. 1, 2001
Figure 6. Power history of surveillance chain 14K1.
2.1.4 LYRA-02 samples
The specimens irradiated in the LYRA-02 experiment at the Petten High-Flux Reactor(HFR) consisted of typical VVER-440 base material. The composition is given in Table2. Note that the Nb fraction is probably more or less an �educated guess�.
The irradiation started on 9 February 1998 at 11:10 and ended on 1 June 1998 at 15:10.The reactor power was constant (45 MW) during the irradiation periods, but the locationof the specimens relative to the core varied. The relative irradiation history, taking intoaccount the different locations, is shown in Fig. 7.
The sample cutting scheme is shown in Fig. 8. Samples 2 and 5 from three specimens(L125, L127 and L129) were sent to VTT.

14
Table 2. Composition of 15Kh2MFA LYRA-02 material
Element wt.% Element wt.%
C 0.13-0.18 Ni 0.40
Mn 0,30-0,60 V 0.25-0.35
P 0.02 (max) Cu 0.1
S 0.020 (max) Nb 50 ppm
Si 0.17 Co 0.01
Cr 2.50-3.00 As 0.005
Mo 0.60-0.80 Fe remainder
P o w e r h is to ry L Y R A -0 2
0 .0 0
0 .1 0
0 .2 0
0 .3 0
0 .4 0
0 .5 0
0 .6 0
0 .7 0
0 .8 0
0 .9 0
1 .0 0
2 5 -0 1 -9 8 1 4 -0 2 -9 8 0 6 -0 3 -9 8 2 6 -0 3 -9 8 1 5 -0 4 -9 8 0 5 -0 5 -9 8 2 5 -0 5 -9 8 1 4 -0 6 -9 8
D a te
Rel
. pow
er (E
xp)
Figure 7. Relative irradiation history for LYRA-02 specimens.

15
Figure 8. Cutting scheme for LYRA-02 specimens. Samples 2 and 5 from threespecimens were sent to VTT.
2.2 Methods for the typical cladding material
A method has previously been developed and applied to separate and purify Nb inreactor pressure vessel (RVP) cladding material with about 1 % Nb [4]. The method hasnow been repeated for the same type of steel several times, to get a measure for thereproducibility of the procedure, and also repeated for 2 other materials.
The niobium impurities in the samples have been chemically separated and purified byliquid ion exchange chromatography. The 93mNb activity was measured by liquidscintillation counting (LSC). LSC is very sensitive (about 100%) but the low energyresolution requires highly purified Nb samples. The 94Nb activity was measured bygamma spectroscopy. The corresponding Nb masses in the purified solutions weremeasured with an inductively coupled plasma mass spectrometer (ICP-MS).
2.2.1 Chemical separation and purification of Nb
The sample (about 90-390 mg) was placed in a Teflon dish and dissolved in a mixtureof hydrochloric acid (HCl) 7.5 ml, hydrofluoric acid (HF) 2.5 ml and nitric acid (HNO3)2.5 ml. On the next day 7.5 ml HF and 5 ml H2O were added. The aliquot wasevaporated on a sand bath until it was clear green liquid (the volume about 15 ml, halfof the original). The wares used for dissolution were of Teflon and the rest of the
16
equipment including the bottles for storing the niobium fractions were of polythene.Glassware, where used, is mentioned.
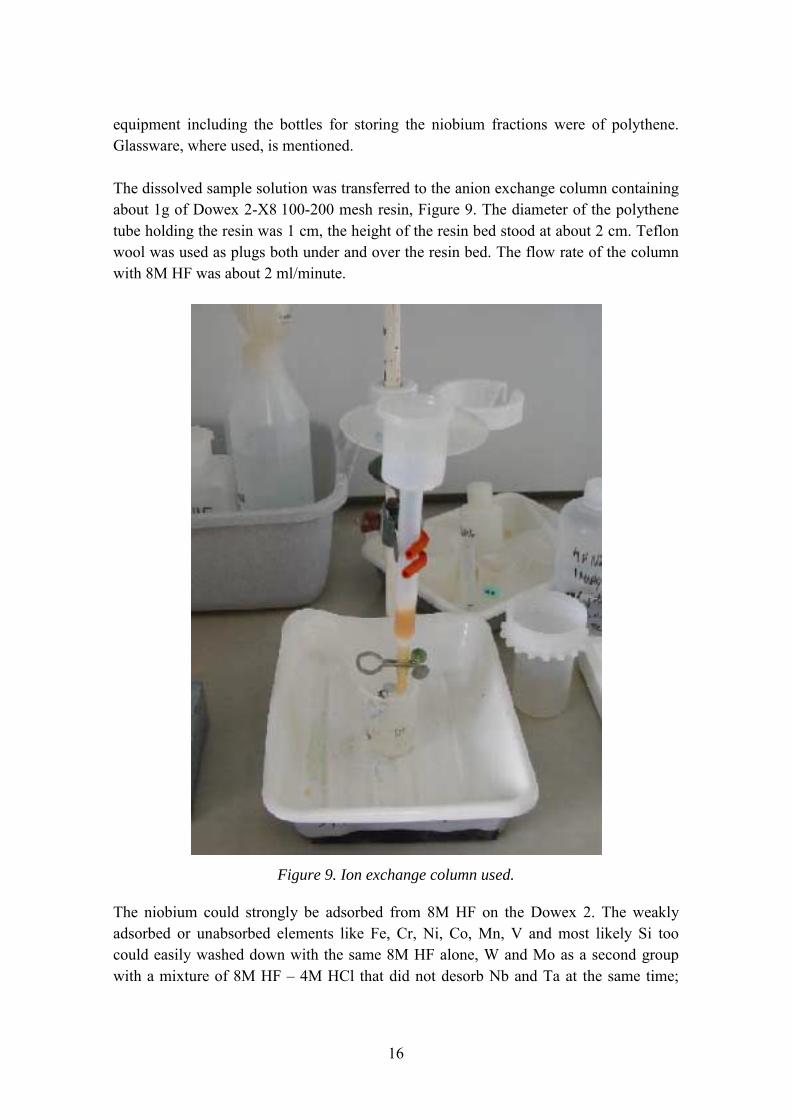
The dissolved sample solution was transferred to the anion exchange column containingabout 1g of Dowex 2-X8 100-200 mesh resin, Figure 9. The diameter of the polythenetube holding the resin was 1 cm, the height of the resin bed stood at about 2 cm. Teflonwool was used as plugs both under and over the resin bed. The flow rate of the columnwith 8M HF was about 2 ml/minute.
Figure 9. Ion exchange column used.
The niobium could strongly be adsorbed from 8M HF on the Dowex 2. The weaklyadsorbed or unabsorbed elements like Fe, Cr, Ni, Co, Mn, V and most likely Si toocould easily washed down with the same 8M HF alone, W and Mo as a second groupwith a mixture of 8M HF � 4M HCl that did not desorb Nb and Ta at the same time;

17
stable and radioactive Nb with 3M HCl � 0.1M HF and finally Ta with 4M NH4Cl � 1MNH4F mixture. Elutions were done in 5 ml portions. Ion exchange separation indifferent elution steps can be seen in Figure 10.
1. Elution: 8M HF (25 ml)
2. Elution: 8M HF-4M HCl (25 ml)
3. Elution: 3M HCl -0.1M HF (30 ml)
4. Elution: 4M NH4Cl -1M NH4F (30 ml)
Fe, Ni, Cr, Mn, V, Co, Sieluted
Mo, Weluted
Nbeluted
Taeluted
Taretained
Nb, Taretained
Nb, Mo, W, Taretained
PV/SC Samplesin 8M HF
Figure 10. Separation scheme.
After fractionation, all the equipment and vessels were kept in 10 % DECONEX overnight and then washed with distilled water. After that they were kept in 2 N HCl overnight and then washed with distilled water before the next experiment. The resin waschanged to a new one before next sample.
2.2.2 Nb activity measurements
The steel samples were measured as such with a calibrated gamma spectrometer beforethe chemical treatment as well as the purified base solution after the treatment. Themeasurement scheme for the dissolved samples is shown in Fig. 11. Examples ofmeasured gamma spectra are shown in Figs. 12 and 13. As can be seen from Figure 12the 94Nb activity (702.6 and 871.1 keV) is not visible in the untreated steel sample dueto the dominating 60Co, 58Co and 54Mn activities. However, 182Ta (114.4 d) from the Taimpurity which always accompanies Nb is clearly visible. After the purification process94Nb is visible, but not 182Ta (Fig. 13). All the visible peaks except 94Nb come from theenvironmental background. The 93mNb measurements were done from the purified basesolution of the Nb fraction.

18
1. Distilled water
2. 1% suprapure HNO3with internal standardIn-115
Gamma measurement (5 ml) Nb-94
Scintillation measurement (1ml) Nb-93m
ICP-MS measurement Nb-stable1/100 dilution
1/10 dilution
Nb fractionin
3M HCl -0.1M HF (30 ml)
Figure 11. Measurement scheme.
Energy (keV)0 500 1000 1500 2000
Cou
nts
per c
hann
el
100
101
102
103
104
105
106
Lo 2 14K1, sample 6K199 B1
60Co58Co
54Mn
182Ta
182Ta
Figure 12. Gamma spectrum of an untreated cladding sample.

19
Energy (keV)
0 500 1000 1500 2000
Cou
nts
per c
hann
el
102
103
104
105
Lo 2 14K1, sample 6K199 B1purified solution (whole spectrum)
Energy (keV)
650 700 750 800 850 900
Cou
nts
per c
hann
el
103
104
Lo 2 14K1, sample 6K199 B1purified solution (limited range)
94Nb, 702.6 keV94Nb, 871.1 keV
94Nb, 702.6 keV94Nb, 871.1 keV
Figure 13. Gamma spectrum of the same sample after purification.

20
The low 94Nb activity from the thermal neutron induced reaction was measurable with agamma spectrometer, consisting of an HPGe detector with associated electronics, in thepurified solutions (volume 5 ml). The detector was calibrated using a 5 ml liquidstandard (Product QCY.44 from Amersham International plc, No. R5/40/17, totalactivity of 200kBq on 1 February 1995). The standard solution is a mixture of 109Cd,57Co, 139Ce, 113Sn, 203Hg, 85Sr, 137Cs, 60Co and 88Y in 4 M hydrochloric acid. Theaccuracy of the 94Nb activity measurements is estimated to ±4.5 %, mainly arising fromcalibration uncertainties.
The liquid scintillation counting (LSC) samples for 93mNb activity measurementscontained 1 ml samples from the 1/10 dilution of the base solutions and 10 ml HiSafe3scintillation liquid in 20 ml glass bottles. A Wallac 1415 LSC, Advanced lowbackground system 1400, with α/β separation possibilities and with a Digital SpectrumAnalyser (DSA) employing the Digital Overlay Technique [10], was used for activitymeasurements. The calibration and fine-tuning of LSC 1415 are based on standard LSCsamples prepared from a 93mNb reference solution (No. 8902, vial 55, 574.56 kBq/g,1087.6 kBq ±0.5 % on 13 November 1991, 00:00, with 0.3 % transpiration losses permonth, but without loss of Nb, 94Nb impurity 0.32 %) from AEA Fuel Services,Harwell, England, and on a secondary 182Ta (prepared 1-2.2.1993) standard. Thesecondary 182Ta standards were prepared from Ta samples irradiated (EOI 1.2.1993) inthe (250 kW) FiR 1 reactor in Finland. Before dissolution and LSC sample preparationthe absolute 182Ta activities of the irradiated Ta samples were measured with acalibrated gamma spectrometer. The accuracy of the LSC based 93mNb activitymeasurements is estimated to ±2.5 %, mainly arising from calibration uncertainties. Atypical LSC spectrum is shown in Fig. 14. As can be seen, the upper �tail� arising from182Ta and 94Nb is insignificant.
The calibrations were, in fact, carried out for a different scintillation cocktail (LumaGel)than the one currently used (HiSafe3). However, measurements of identical samplesusing both scintillation liquids have previously not shown significant differences in theresults.

21
Channel
0 200 400 600 800 1000
Cou
nts
per c
hann
el
0
50
100
150
200
250
Loviisa 2, chain 14K1Cladding sample 6K199 ALSC spectrum (Nb + Ta)
93mNb
182Ta + 94Nb
Figure 14. Typical LSC spectrum after purification.
The stable Nb concentration in the purified solutions was measured with a highlysensitive ICP-MS (type VG PlasmaQuad). Due to its sensitivity the samples werediluted 1/1000 and spiked with internal standard 115In. The ICP-MS system wascalibrated for Nb concentrations in the range from 1 to 50 ng/g. The total uncertaintiesof the measured concentrations are about ±5 % for absolute values.
2.3 Methods for pure Nb wires
The pure niobium wires were dissolved and 93mNb activity was measured by liquidscintillation counting (LSC). The 94Nb activity was measured by gamma spectroscopybefore dissolution. Nb mass determination at the later stages is not needed since simpleweighing of the original sample can be performed. However, if feasible a mass check ofthe final solution with ICP-MS could be useful (but was not done here).

22
2.3.1 Dissolution of Nb
The sample (mass about 10 mg) was placed in a Teflon dish and added 1 ml HF (40%)and 3-5 drops of concentrated HNO3. After a few hours some drops of concentratedHNO3 was added if dissolution was not complete. After dissolution, the volume of thesample was adjusted to about 10 ml (weighed exact mass) with distilled water andtransferred to a polythene bottle.
2.3.2 Nb activity measurements
The sample was diluted 1/100 with distilled water. The liquid scintillation counting(LSC) samples for 93mNb activity measurements contained 1 ml samples from the 1/100dilution of the base solutions and 10 ml HiSafe3 scintillation liquid in 20 ml glassbottles. The low 94Nb activity from the thermal neutron induced reaction wasmeasurable with gamma spectroscopy in the original wire, before dissolution.

23
3. Results and discussion
The niobium has been separated chemically from the rest of the samples. The procedurehas been treated the same type of steel several times, to get a measure for thereproducibility of the procedure. The yield of Nb in the purification procedure wasabout 70%.
3.1 Material “Dukovany”
The samples (A3, mass 136.1 mg, A11, mass 117.7 mg and B5, mass 106.4 mg) ofradioactive reactor pressure vessel material of the NPP Dukovany 4th unit were analysed(see Section 2.1.1). The results from Nb activity measurements are listed in Table 3.
Table 3. Results from activity measurements (Bq per target atom, decay corrected toend of cycle 14.9.1994). The reaction rates are for 93Nb(n,n’) at 1375 MWth.
Sample 93mNb Reaction Rate 94Nb
A3 4.52E-15 1.91E-13 6.74E-17
A11 3.38E-15 1.43E-13 6.17E-17
B5 9.85E-15 4.16E-13 1.59E-16
Replicate samples were taken for analysis, in order to obtain statistical data on theprecision on the analysis and provide more reliable results. Also, by measuring aftersome time possible adsorption to storage vessels wall can be seen. The precision of theLSC determination was tested with the Nb fraction of sample A11. Three 1 ml sampleswere taken to measurements from a 1/10 dilution of the purified base solution. One 1 mlsample was taken after 44 days. Also one new 1/10 dilution was done from the purifiedbase solution after 44 days and a 1 ml sample from that was measured. Themeasurement results can be seen in Table 4. The standard deviation for the first fourresults is ±0.16 Bq93mNb/g. The standard deviation s of a finite set of experimental datais given by
)1()( 2_
−−= � Nxxs i

24
Table 4. Results from activity measurements of 93mNb from the 1/10 base solution.
Sample Bq93mNb/g
A11/1 61.65
A11/2 61.86
A11/3 61.49
A11/4 (after 44 days) 61.57
A11/5 (new 1/10 dilution after 44 days) 62.48
The accuracy of the gamma spectroscopy was tested in the Nb fraction of sample A11.One 5 ml sample was taken to measurement from the purified base solution and another5 ml sample was taken after 55 days from the same solution. The measurement resultsare given in Table 5. The standard deviation for the results is ±0.03 Bq94Nb/g
Table 5. Results from activity measurements of 94Nb from the base solution.
Sample Bq94Nb/g
A11/6 11.83
A11/7 (after 55 days) 11.87
The accuracy of the ICP-MS determination was also tested in the Nb fraction of sampleA11. The samples were diluted 1/1000 and spiked with internal standard 115In. Thesolutions were measured again after 44 days, see Table 6. The ICP-MS system wascalibrated for Nb concentrations in the range from 1 to 100 ng/g. The background was0.004 ngNb/g. It can be seen that the adsorption of Nb on the storage vessel walls issmall.
25
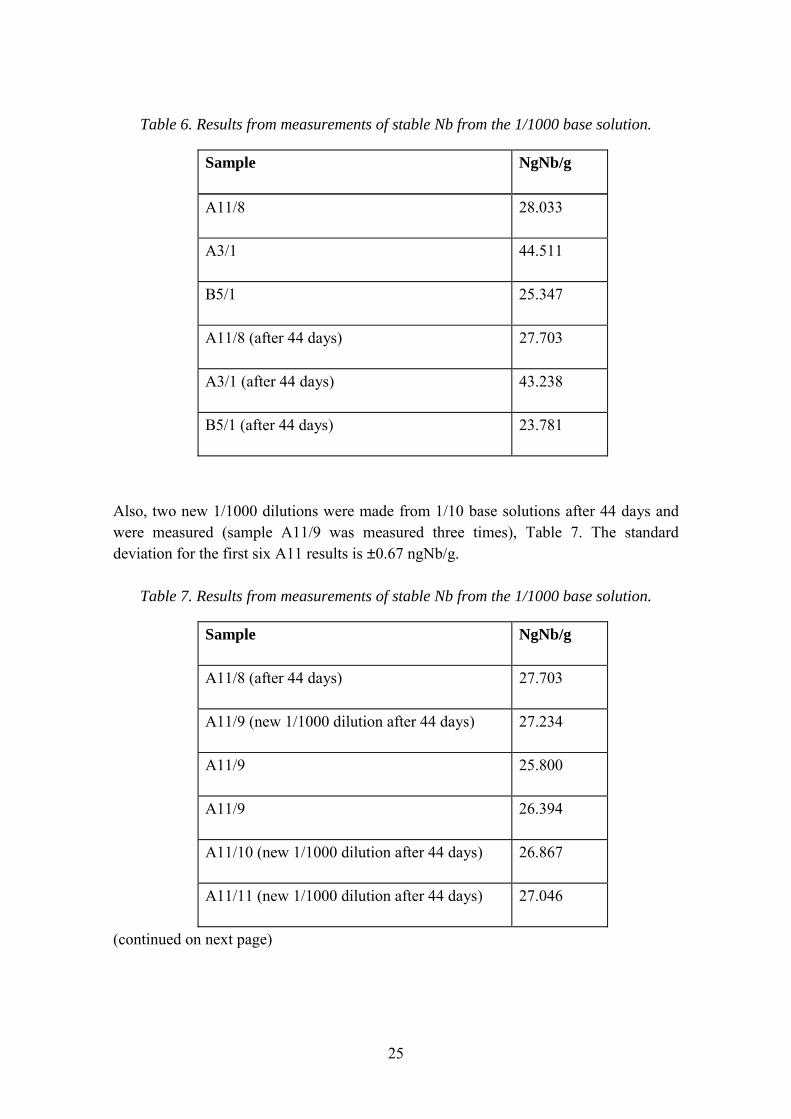
Table 6. Results from measurements of stable Nb from the 1/1000 base solution.
Sample NgNb/g
A11/8 28.033
A3/1 44.511
B5/1 25.347
A11/8 (after 44 days) 27.703
A3/1 (after 44 days) 43.238
B5/1 (after 44 days) 23.781
Also, two new 1/1000 dilutions were made from 1/10 base solutions after 44 days andwere measured (sample A11/9 was measured three times), Table 7. The standarddeviation for the first six A11 results is ±0.67 ngNb/g.
Table 7. Results from measurements of stable Nb from the 1/1000 base solution.
Sample NgNb/g
A11/8 (after 44 days) 27.703
A11/9 (new 1/1000 dilution after 44 days) 27.234
A11/9 25.800
A11/9 26.394
A11/10 (new 1/1000 dilution after 44 days) 26.867
A11/11 (new 1/1000 dilution after 44 days) 27.046
(continued on next page)

26
Sample NgNb/g
A3/1 (after 44 days) 43.238
A3/2 (new 1/1000 dilution after 44 days) 43.374
B5/1 (after 44 days) 23.781
B5/2 (new 1/1000 dilution after 44 days) 23.465
The two Nb-wires, 23I-2a (mass 8.89 mg, between A3 and A11) and 38I-2a (mass 10.28mg, next to B5) irradiated in the same capsules as earlier measured samples, weredissolved. The results from the Nb activity measurements are listed in Table 8.
Table 8. Results from activity measurements (Decay corrected to end of cycle 14.9.1994).
Sample Spec. Bq93mNb/target(Nb-at) Spec. Bq94Nb/target(Nb-at)
23I-2a 3.93E-15 6.16E-17
38I-2a 9.50E-15 1.44E-16
Comparing the results from the cladding material with the wire results we find verygood agreement for 93mNb. The average of A3 and A11 is 3.95E-15 compared to themeasured value 3.93E-15 from the wire, i.e. almost perfect agreement. Taking intoaccount the gradients obtained from 54Mn gamma scanning [9] the extrapolated activityat the wire position in capsule 38 should be about 9.65E-15 as compared to themeasured value 9.50E-15. For 94Nb the agreement is only reasonable. The untreatedwires were measured directly with very good accuracy (about 1 %), while the claddingsamples were counted with poorer statistics in a less accurately calibrated geometryfrom the base solution. Also, for capsule 38 the extrapolation is not valid in that casesince the gradient of the thermal flux is opposite to that of the fast flux.

27
3.2 Material “Loviisa old”
The samples (Red 2B, mass 119.32 mg and Blue 2, mass 372.7 mg) of radioactivereactor pressure vessel material of the NPP Loviisa 1st unit were analysed (see Section2.1.2). The results from Nb activity measurements are listed in Table 9.
Table 9. Results from activity measurements (Decay corrected to end of cycle 28.7.1990).
Sample Spec. Bq93mNb/target(Nb-at) Spec. Bq94Nb/target(Nb-at)
Red 2B 5.06E-15 1.32E-16
Blue 2 5.28E-15 1.30E-16
The agreement between the samples is very good considering the vastly different Nbconcentrations in the materials.
One 1 ml sample was taken to measurements from a 1/10 dilution of the purified basesolution. The counting time was 600 s. The measurement results are given in Table 10.
Table 10. Results from activity measurements of 93mNb from the 1/10 base solution.
Sample Bq93mNb/g
Red 2B 94.50
Blue 2 10.09
The sample was diluted 1/1000 and spiked with internal standard 115In. The results aregiven in Table 11.

28
Table 11. Results from measurements of stable Nb from the 1/1000 base solution.
Sample ngNb/g
Red 2B 34.61
Blue 2 3.55
3.2.1 Comparison with calculations and other measurements
Fluence and activity calculations using the kernel-based PREVIEW program [11] wereperformed for the chain 6K. An adjustment library was applied in the calculations [12].Conventional dosimetry results were also available (based on 54Mn measurements of Feplates irradiated together with the specimens). All these are compared in Table 12. Thecalculated values are for the capsule mid-axis, i.e. complete agreement is not to beexpected.
Table 12. Comparison of calculated (PREVIEW) and measured activities at EOI(Bq/target atom) for sample 6K184 (“Loviisa old”).
Calculated Measured C/E
54Mn 1.073E-14 1.042E-14 1.030
93mNb ("Red") 5.814E-15 5.060E-15 1.149
93mNb ("Blue") 5.280E-15 1.101
The agreement between the 54Mn and 93mNb results is quite good. The 54Mn result is forthe specimen midpoint. Thus it is reassuring to find that the C/E for the �blue� sample(closer to the specimen centre) falls between that of 54Mn and the �red� sample.

29
3.3 Material “Loviisa new”
The samples, labelled �A� (mass 86.6 mg), �B� (mass 86.8 mg) and �C� (mass 86.0 mg)of radioactive reactor pressure vessel material of the NPP Loviisa 2nd unit were analysed(see Section 2.1.3). The results from Nb activity measurements are listed in Table 13.The 94Nb activity of sample C is clearly discrepant and should be discarded. The 93mNbresults for the three samples are remarkably consistent.
Table 13. Results from activity measurements (Decay corrected to end of cycle1.9.2001).
Sample Spec. Bq93mNb/target(Nb-at) Spec. Bq94Nb/target(Nb-at)
A 2.71E-15 5.03E-17
B 2.72E-15 4.98E-17
C 2.72E-15 6.74E-17
The accuracy of the LSC determination was tested in the Nb fraction of the samples. Two1 ml samples were taken to measurements from 1/10 dilution of the purified basesolutions. The counting time was 600 s. The measurement results are shown in Table 14.
Table 14. Results from activity measurements of 93mNb from the 1/10 base solution.
Sample Bq93mNb/g Sample Bq93mNb/g
A1 48.82 B2 50.49
A2 49.07 C1 42.73
B1 50.24 C2 42.25
The accuracy of the gamma spectroscopy was tested in the Nb fraction of the samples.One 5 ml sample was taken to measurement from the purified base solutions. Thecounting time was 10800 s. The measurement results can be seen in Table 15.

30
Table 15. Results from activity measurements of 94Nb from the base solution.
Sample Bq94Nb/g
A 6.84
B 6.93
C 8.07
The accuracy of the ICP-MS determination was tested in the Nb fraction of the samples.The samples were diluted 1/1000 and spiked with internal standard 115In. The ICP-MSsystem was calibrated for Nb concentrations in the range of 1,10, 20 and 50 ng/g. Thebackground level of Nb was 0.004 ngNb/g. The results are shown in Table 16.
Table 16. Results from measurements of stable Nb from the 1/1000 base solution.
Sample ngNb/g Sample ngNb/g
A1 20.807 B2 21.357
A2 20.794 C1 17.732
B1 21.529 C2 17.651
3.3.1 Comparison with calculations and other measurements
For this sample calculated and other measured results were also available. These arecompared in Table 17. 54Mn was measured both from a dosimetric Fe plate and thespecimen itself. The other values are averages of samples A, B and C taken from thespecimen.

31
Table 17. Comparison of measured and calculated (PREVIEW) specific activities atEOI (Bq per target atom) for specimen 6K199 irradiated in Loviisa 2 in surveillancechain 14K1 (cycle 21).
Meas. Calc. C/E
54Mn (specimen) 1.012E-14 8.401E-15 0.830
54Mn (plate) 1.010E-14 8.401E-15 0.832
58Co 2.512E-14 2.118E-14 0.843
59Fe 4.528E-13 5.512E-13 1.217
93mNb 2.720E-15 2.142E-15 0.787
94Nb 5.000E-17 4.472E-17 0.894
The calculated values are for the capsule mid-axis. Thus one cannot expect the C/Evalues to be close to 1 (significant radial flux gradient). The agreement between the C/Eratios for 54Mn, 58Co and 93mNb is very good. However, between 59Fe and 94Nb(thermal-neutron reactions) there is a clear discrepancy, which may partly be due topoor counting statistics, partly to different response characteristics in the epithermalregion.
The measured and calculated (PREVIEW) 54Mn activity distribution is shown in Fig.15. The effect of the radial flux gradient and the random orientation is clearly seen. Theoverall agreement between calculations and measurements is excellent.

32
Distance from core bottom (cm)
60 80 100 120 140 160 180 200 220
Activ
ity a
t EO
I (Bq
/targ
et a
tom
)
0.0
2.0e-15
4.0e-15
6.0e-15
8.0e-15
1.0e-14
1.2e-14
Lo 2, 14K1, 54Mn
Cladding sample
Figure 15. Measured and calculated (solid line) 54Mn activity distribution alongsurveillance chain 14K1.
3.4 Material “LYRA-02”
The sample L125/2 (mass 387.2 mg) of base material 15Kh2MFA was analysed (seeSection 2.1.4). After dissolution the solution was not clear. Small amount of solid blackmaterial were seen on the bottom of the vessel. After separation nothing was found inthe Nb fraction with LSC and ICP-MS measurements. The dissolving process may bemore complex than for typical cladding steels and the low amount of niobium could bea problem in the separation phase. The presence of carbon may also influence thechemical behaviour. Extra effort is needed to resolve these problems.
3.5 Estimated uncertainties
From knowledge of the uncertainties in each component, it is possible to estimate theactual uncertainty in the final quantity. The errors in individual numbers will propagatethroughout a series of calculations, in either a relative or an absolute fashion, dependingon whether the operation is multiplication or division or whether it is an addition or a

33
subtraction. A rigorous uncertainty analysis is not performed here since some of theindividual estimates are based on subjective judgement. Also, the total uncertaintiescontain both systematic and statistical components so that a rigorous treatment is ratherdifficult.
The standard deviations of 93mNb and 94Nb measurements are approximately 1 %,including errors of measurements and weighings. The errors of chemical separation andpurification need not be taken into account because the activity measurements are doneon the pure Nb fraction whose mass is determined by ICP-MS. The systematic errors ofthe detectors, mainly arising from the calibration, are estimated to be 2.5 %, 2.5 % and 2% for gamma measurements, LSC measurements and ICP-MS measurements,respectively. The total estimated uncertainties in the experimental specific 93mNb and94Nb activities are then approximately 5 % in both cases.
For pure wires of Nb the uncertainties are somewhat lower because ICP-MSmeasurements are not needed. On the other hand, in this case we have to includesystematic error of dissolution of the sample, which is estimated to be about 5 %. Thusthe uncertainty is about the same regardless of the original material. A mass check ofthe final solution with ICP-MS could be useful, but was not performed here.

34
4. Conclusions and recommendations
The samples of VVER-440 Reactor Pressure Vessel materials distributed in theRETROSPEC inter-laboratory exercise have been processed and their specific activitieshave been determined.
The chemical methods for niobium separation and purification described in Section 2.2work well on typical cladding material, including material with less niobium (about 80ppm). The 93mNb activity determination by Liquid Scintillation Counting also workswell and is quite simple and quick compared to X-ray counting, but requires extensiveand tedious calibration procedures (fine-tuning) for niobium. Extensive checks andrepeated measurements were carried out to ensure the reliability of the methods.
Good agreement was found both with calculated activities and other measured activities,mainly 54Mn (consistent C/E ratios). This confirms the accuracy and usefulness of themethods. The estimated uncertainty in the specific activities is about 5 %.
A comparison with the results from the other participants will be carried out in the finalreport, which will be published by NRG Petten [13]. Preliminary comparisons indicategood agreement. The final report will also contain an evaluation of different chemicalseparation and activity determination methods in the form of a Code of Practice thatshould be useful for normally equipped radiochemical laboratories.

35
References
1. M. F. Banham, A. J. Fudge, J. A. Tibbles, B. E. Sheldon, R. Fleck and R. A. Holt.The Application of Niobium for Retrospective Dose Determination in CANDUReactors. Proceedings of the 7th ASTM-EURATOM Symposium on ReactorDosimetry, Strasbourg, France, 27�31 August 1990. EUR 14356 EN. KluwerAcademic Publishers 1992. Pp. 749�756.
2. M. F. Banham, A. J. Fudge and J. A. Tibbles. Retrospective Neutron Dosimetry: AReview of Possible Applications for Some Nuclear Reactor Materials. AEATechnology Fuel Services, Harwell. Report AEA-FS-0080 (H), Febr. 1992.
3. Standard Test Method for Measuring Fast-Neutron Reaction Rates by Radio-activation of Niobium, ASTM E 1297�96. 1998 Annual Book of ASTM Standards,Volume 12.02. West Conshohocken, Pennsylvania.
4. H. Karnani. Chemical Methods for the Use of Niobium from Pressure VesselCladding as a Fast Neutron Dosimeter. VTT Research Notes 605, Espoo, 1986. 40 p.
5. B. Bärs and H. Karnani. Fast Neutron Dose Measurements at the Pressure Vessel ofa WWER-440 Pressurized Water Reactor by the Use of 93Nb(n,n�)93mNb.Kernenergie 29(1986)10, pp. 369�376.
6. B. Bärs and K. Uusheimo. Experiences with Nb Dosimeters for Neutron FluxMeasurements. Proceedings of the 7th ASTM-EURATOM Symposium on ReactorDosimetry, Strasbourg, France, 27-31 August 1990. EUR 14356 EN. KluwerAcademic Publishers 1992. Pp. 331�338.
7. B. Bärs and E. Häsänen. Experimental Estimation of Neutron Fluxes from NiobiumImpurities in the Pressure Vessel Steel of Nuclear Power Reactors. NuclearInstruments and Methods A317(1992), pp. 577�580.
8. B. Bärs and E. Häsänen. Neutron Flux Estimations based on Niobium Impurities inReactor Pressure Vessel Steel. Proceedings of the 8th ASTM-EURATOMSymposium on Reactor Dosimetry, Aug. 29 � Sept. 3, 1993, Vail, Colorado. ASTMSTP 1228, Philadelphia 1994. Pp. 205�214.
9. J. Hógel. Inter-Comparison of 93mNb Measurement in VVER-440 RPV CladdingMaterial (Opening Project). WGRD-VVER workshop, Ře�, Czech Republic,November 1998.

36
10. K. Rundt. Digital Overlay Technique in Liquid-Scintillation Counting � A Review.Radioactivity and Radiochemistry 3(1992) No 1, pp. 14�25.
11. F. Wasastjerna. PREVIEW, a Program for Calculation of Pressure VesselIrradiations in the Loviisa Reactors. VTT Research Report YDI110/91. Espoo,March 1991.
12. T. Serén, An Optimised Adjustment Library for the Kernel-Based PREVIEWProgram. Licentiate�s Thesis, Helsinki University of Technology, Department ofEngineering Physics and Mathematics. Espoo, November 2001.
13. W.P. Voorbraak, T. Kekki, T. Serén, M. Van Bocxstaele, J.Wagemans and J.R.W.Woittiez. Retrospective dosimetry of fast neutrons focussed on the reaction93Nb(n,n')93Nbm. Report 20576/03.53641 MMI/WPV/, NRG Petten, July 2003.

Published bySeries title, number andreport code of publication
VTT Research Notes 2203VTT�TIED�2203
Author(s)Serén, Tom & Kekki, TommiTitleRetrospective dosimetry based on niobium extraction andcounting – VTT’s contribution to the RETROSPEC projectAbstractWithin the European Commission 5th Framework RETROSPEC project several irradiatedVVER-440 pressure vessel materials have been investigated in order to determine thefeasibility of �retrospective� neutron dosimetry based on the analysis of 93mNb induced instructural reactor materials containing small amounts of niobium (about 50 ppm to 1 %).Methods for chemical separation of niobium and activity measurements, previously developedat VTT, were tested and refined and found accurate and reliable for typical cladding materials.For base material containing niobium only as an impurity the methods were not successful.The measured specific 93mNb activities were in good agreement with both calculated activitiesand other induced activities in the same materials and in dedicated dosimetry materialsirradiated together with the investigated materials.The results of the three participants (NRG Petten, VTT and SCK�CEN) will be compared andsummarised in a final report published by NRG Petten. The feasibility of different chemicalseparation and activity determination methods will be evaluated in a Code of Practice.
Keywordsnuclear reactors, reactor dosimetry, RETROSPEC, reactor materials, niobium, extraction, counting, retrospectivedosimetry, pressure vessels, embrittlement
Activity unitVTT Processes, Otakaari 3 A, P.O.Box 1608, FIN�02044 VTT, Finland
ISBN Project number951�38�6179�1 (soft back ed.)951�38�6180�5 (URL: http://www.vtt.fi/inf/pdf/)
D0SU00518
Date Language Pages PriceSeptember 2003 English 36 p. A
Name of project Commissioned byEuropean Commission 5th Framework RETROSPEC project(contract FIKS-CT-2000-00091)
European Commission
Series title and ISSN Sold byVTT Tiedotteita � Research Notes1235�0605 (soft back edition)1455�0865 (URL: http://www.vtt.fi/inf/pdf/)
VTT Information ServiceP.O.Box 2000, FIN�02044 VTT, FinlandPhone internat. +358 9 456 4404Fax +358 9 456 4374
VTT RESEA
RCH N
OTES 2203Retrospective dosim
etry based on niobium extraction and counting - V
TT's contribution to the RETROSPEC project
Tätä julkaisua myy Denna publikation säljs av This publication is available from
VTT TIETOPALVELU VTT INFORMATIONSTJÄNST VTT INFORMATION SERVICEPL 2000 PB 2000 P.O.Box 2000
02044 VTT 02044 VTT FIN�02044 VTT, FinlandPuh. (09) 456 4404 Tel. (09) 456 4404 Phone internat. + 358 9 456 4404Faksi (09) 456 4374 Fax (09) 456 4374 Fax + 358 9 456 4374
ISBN 951–38–6179–1 (soft back ed.) ISBN 951–38–6180–5 (URL: http://www.vtt.fi/inf/pdf/)ISSN 1235–0605 (soft back ed.) ISSN 1455–0865 (URL: http://www.vtt.fi/inf/pdf/)
ESPOO 2003 VTT RESEARCH NOTES 2203
Tom Serén & Tommi Kekki
Retrospective dosimetry based onniobium extraction and counting -VTT's contribution to the RETROSPECproject
VTT TIEDOTTEITA – RESEARCH NOTES
VTT PROSESSIT – VTT PROSESSER –VTT PROCESSES
2139 Lohiniva, Elina, Sipilä, Kai, Mäkinen, Tuula & Hietanen, Lassi. Jätteiden energiakäytönvaikutukset kasvihuonekaasupäästöihin. 2002. 119 s.
2141 Laine-Ylijoki, Jutta, Wahlström, Margareta, Peltola, Kari, Pihlajaniemi, Miina & Mäkelä,Esa. Seospolton tuhkien koostumus ja ympäristölaadunvarmistusjärjestelmä. 2002. 51 s.+ liitt. 59 s.
2142 Tuhkanen, Sami. Jätehuollon merkitys Suomen kasvihuonekaasupäästöjenvähentämisessä. Kaatopaikkojen metaanipäästöt ja niiden talteenotto. 2002. 46 s.
2143 Meinander, Harriet & Varheenmaa, Minna. Clothing and textiles for disabled and elderlypeople. 2002. 58 p. + app. 4 p.
2145 Helynen, Satu, Flyktman, Martti, Mäkinen, Tuula, Sipilä, Kai & Vesterinen, Pirkko.Bioenergian mahdollisuudet kasvihuonekaasupäästöjen vähentämisessä. 2002. 110 s. +liitt. 2 s.
2153 Hänninen, Seppo & Lehtonen, Matti. Earth fault distance computation with fundamentalfrequency signals based on measurements in substation supply bay. 2002. 40 p.
2155 Hepola, Jouko & Kurkela, Esa. Energiantuotannon tehostaminen fossiilisiin ja uusiutuviinpolttoaineisiin perustuvassa energiantuotannossa. 2002. 65 s.
2163 Miettinen, Jaakko & Hämäläinen, Anitta. GENFLO - A general thermal hydraulic solutionfor accident simulation. Espoo 2002. VTT Tiedotteita – Research Notes 2163. 75 p. + app.4. p.
2164 FINNUS, The Finnish Research Programme on Nuclear Power Plant Safety 1999-2002.Final Report. Ed by Riitta Kyrki-Rajamäki & Eija Karita Puska. 267 p. + app. 68 p.
2165 FINNUS, The Finnish Research Programme on Nuclear Power Plant Safety 1999–2002.Executive Summary. Ed. by Riitta Kyrki-Rajamäki. 2002. 26 p. + app. 18 p.
2177 Mäkelä, Kari, Laurikko, Juhani & Kanner, Heikki. Suomen tieliikenteen pakokaasupäästöt.LIISA 2001.1 -laskentajärjestelmä. 2002. 63 s. + liitt. 42 s.
2186 Syri, Sanna & Lehtilä, Antti. Kasvihuonekaasujen päästöjen vähentämisen vaikutusmuihin ilmansaasteisiin. 2003. 69 s.
2187 Siltanen, Satu. Teknisiä ja taloudellisia näkökohtia käytetyn ydinpolttoaineenloppusijoituksen palautettavuudesta. Kirjallisuusselvitys. 2003. 72 s.
2196 Lehtilä, Antti & Syri, Sanna. Suomen energiajärjestelmän ja päästöjen kehitysarvioita.Climtech-ohjelman skenaariotarkastelu. 2003. 62 s.
2199 Alanen, Raili, Koljonen, Tiina, Hukari, Sirpa & Saari, Pekka. Energian varastoinninnykytila. 2003. 169 s. + liitt. 60 s.
2003 Serén, Tom & Kekki, Tommi. Retrospective dosimetry based on niobium extraction andcounting – VTT’s contribution to the RETROSPEC project. 2003. 36 p.
2209 Monni, Suvi & Syri, Sanna. Uncertainties in the Finnish 2001 Greenhouse Gas EmissionInventory. 2003. 101 p. + app. 27 p.
2212 Hepola, Jouko. Elohopeapäästöt fossiilisiin polttoaineisiin ja jätteisiin perustuvassaenergiantuotannossa. 2003. 37 s.
Channel
0 200 400 600 800 1000
Cou
nts
per c
hann
el
0
50
100
150
200
250
LSC spectrum (Nb + Ta)
93mNb
182Ta + 94Nb