RETROFIT DESIGN OF A SUSTAINABLE ECO … of Mechanical Engineering RETROFIT DESIGN OF A SUSTAINABLE...
142
Department of Mechanical Engineering RETROFIT DESIGN OF A SUSTAINABLE ECO-OFFICE FROM AN EXISTING BUILDING Author: Sibel Gultekin Supervisor: Dr. Paul Strachan A thesis submitted in partial fulfilment for the requirement of degree in Master of Science in Energy Systems and the Environment 2009
Transcript of RETROFIT DESIGN OF A SUSTAINABLE ECO … of Mechanical Engineering RETROFIT DESIGN OF A SUSTAINABLE...

Department of Mechanical Engineering
RETROFIT DESIGN OF A
SUSTAINABLE ECO-OFFICE FROM
AN EXISTING BUILDING
Author: Sibel Gultekin
Supervisor: Dr. Paul Strachan
A thesis submitted in partial fulfilment for the requirement of degree in
Master of Science in Energy Systems and the Environment
2009

Copyright Declaration
This thesis is the result of the author’s original research. It has been composed by
the author and has not been previously submitted for examination which has led to
the award of a degree.
The Copyright of this thesis belongs to the author under the terms of the United
Kingdom Copyright Acts as qualified by University of Strathclyde Regulation 3.50.
Due acknowledgement must always be made of the use of any material contained in,
or derived from, this thesis.
Signed: Date: 18 September 2009

Abstract
The objective of this work is to investigate the retrofit design of a sustainable ECO-
Office but the methodology developed could also be applied to other building types.
The study also demonstrates the role of modelling in the design of energy efficient,
cost effective, and environmental friendly offices with low or zero carbon
technologies.
Building Regulations and ECO-Office Accreditations/Recognition all combine to
determine the minimum design requirements within offices. It is suggested that
within the framework set out by the regulations and relevant standards there is an
opportunity for innovative environmental strategies that can reduce energy
consumption beyond conventional practice.
A list of key elements required in the design of an ECO-Office building has been
collated. Four major elements are considered: ensuring good indoor environmental
quality, high levels of energy efficiency & low environmental impact, sustainable
materials and the use of green tariffs.
The methodology used throughout the study identifies the key factors as well as the
special requirements associated with the successful achievement of the retrofit design
process of a sustainable ECO-Office. This methodology has been developed in the
form of a step-by-step process to guide the design, with the main stages given in a
flow chart. It enables the best selection of available low and zero carbon technologies
(LZCT) in the design of an ECO–Office in terms of technology and planning
considerations as well as the special requirements. Lighting, appliances and building
envelopes are all considered with respect to energy efficiency.
Finally, an energy analysis case study was carried out to evaluate selected energy
efficiency measures whilst utilising LZCT for an office building, in order to
demonstrate the application of the methodology and computer modelling as a useful
evaluation tool.
For the case study, it was possible to reduce annual energy consumption by 33 % and
thus £200 saving in electricity bills by improving the building envelope.
Consequently, the base case heating fuel consumption, 6070 kWh, was reduced to
4080 kWh by improvements in the building envelope for the best case.
i

As a result of PV application case studies, savings can be considerable – between 1.1
– 2.1 tCO2 and 30.4% to 52.3% reduction of electricity bills.
With the aid of solar panel heater areas, annual electricity consumption for heating
can be reduced by 80%. Similarly, GHG (Greenhouse Gases) emissions reduction
was achieved of 2.1 tCO2 which is 80% of overall GHG emissions.
Using an air source heat pump reduces the electrical usage by between 149 and
307%, if there is no energy efficiency improvement applied. Similarly, using a
ground source heat pump reduces electrical usage by between 148.8% and 302.1%.
However if energy efficiency improvements are performed then electrical usage
reduces to 224.7% and 462.5% by air source heat pump and 224.7%-455.9% by
ground source heat pump.
The economics of LZCT technologies is still a major challenge since the
technologies are still very expensive. Grant support is needed to reduce costs of
LZCT purchase, installation and maintenance.
ii

Acknowledgements
I dedicate this thesis to people who helped me to learn about the greatness and value
of Energy Systems and the Environment.
I am happy that I belong to a community of people who are concerned about the
future of the planet and I hope that this study will enable others to expand the
potential of green thinking in the future.
I would sincerely like to thank anyone who contributed to the completion of this
study. Firstly I would like to acknowledge my supervisor, Dr Paul Strachan. His
support exceeded by far what a student can expect from a supervisor. He has helped
me through difficult times of my research. I owe a huge debt of gratitude, for his
guidance and patience upon the delivery of this project.
Among the people that helped me within the department of ESRU were Prof. Joe
Clarke, Dr Andy Grant, Dr Nick Kelly, Dr. Michael Kummert, Dr. Mc Kenzie, Mr.
R. Craig and McLean to whom I express my deepest gratitude.
I would also like to thank Neil Philips for his helpful insights and guidance on the
technical knowledge and for sharing his experience on energy modelling of buildings
since a valuable part of the project would not have been completed without his
elucidations and effort.
My personal efforts were reinforced by the constant concern of a number of people;
my family, colleagues and fellow students.
Finally I would also like to thank all the people of East Renfrewshire Council
especially Andrew Tweedie, Derek Jarvie for their hospitality upon my visit there for
the preliminary inspection of the Overlee House & Lodge where the ECO-Office is
going to be situated.
iii

Table of Contents
Abstract……………………………………………................................................. i
Acknowledgements………………………………………….................................. iii
Table of Contents……………………………………………................................. iv
List of Figures……………………………………………………………………... vii
List of Tables…………………………………………………………….……… viii
CHAPTER1: INTRODUCTION ….................................................... 1
CHAPTER 2: LITERATURE OF REVIEW ............................................... 3
2.1 What is a Sustainable ECO-Office? ….................................................... 3
2.2 Reasons to Implement an Sustainable ECO – Office ................................... 4
2.3 Regulation and Standards in Sustainable Building ………………….….. 6
2.3.1 Energy Policy and Legislation ...…………………………..…. 6
2.3.2 Energy Performance of Buildings Directive 2002/91/EU ........... 6
2.3.3 Building (Scotland) Regulations 2004 ...…………..……….…... 7
2.3.4 ECO-Office Accreditations/Recognition ................................... 8
2.3.4.1 BRE Certification ...…...…………………………………... 9
2.3.4.2 BREEAM ..................…...………………………… 9
2.3.4.3 Institute of Environmental Management & Assessment
(IEMA) ...…...…………………………….…….. 12
2.3.4.4 National Energy Efficiency Awards ……..……………..... 13
2.3.4.5 Summary ………...……….……………………..... 13
2.4 Key Elements of Environmental Performance for Designing an ECO –
Office ………...….…………………………..... 14
2.4.1 Ensuring Good Indoor Environmental Quality …………....... 14
2.4.1.1 Indoor Air Quality ………...……………….……...…...…... 14
2.4.1.2 Thermal Comfort …………...……………...…………..…. 15
2.4.1.3 Visual Comfort ……..................………………..……..... 17
2.4.1.4 Acoustic Comfort ……………………........................……. 17
2.4.1.5 Summary …………...………...…………………... 18
iv

2.4.2 Energy Efficiency and Environmental Impact ….…...…..…. 19
2.4.2.1 Building Envelope ……………………......………….…….. 19
2.4.2.2 Ventilation …………………......…………………... 22
2.4.2.3 Lighting …………...……...……………………... 24
2.4.2.4 Office Appliances ………………………..…...…………… 26
2.4.2.5 Smart Meters …………...……...……………………... 29
2.4.3 Materials ……………...……..…………………… 30
2.4.3.1 Environmental Building Materials ……………………......... 30
2.4.3.2 Office Furniture ………...…………..…….……………... 31
2.4.4 Green Tariff .…………...……………………………. 32
2.5 Low or Zero Carbon Technologies ………...…………………..…………… 33
2.5.1 Wind ..................……………………………... 34
2.5.2 Solar ...……………...………………………... 36
2.5.2.1 Solar Hot Water ..................…………..…………………. 36
2.5.2.2 Photovoltaic ………………...…......………………… 38
2.5.3 Small Scale Hydro Power …..………………..……………… 41
2.5.4 Biomass ………...………….……………………. 43
2.5.5 Heat Pumps …………...……………….………...….. 45
2.5.5.1 Ground Source Heat Pumps ...……………………..………. 45
2.5.5.2 Air Source Heat Pumps …………………..…..……….. 49
2.5.6 Combined Heat and Power (CHP) …..………………………..... 51
2.6 Selection of Modelling Tool(s) …..……………………….…...………... 54
CHAPTER 3: PREVIOUS CASE STUDIES …………………….……..…... 57
3.1 Design Constraints …..……….…….………………………. 57
3.2 Minimising Energy Demand ……..…………………...……………… 57
3.3 Renewable Energy Strategy …………...…………..………………… 59
3.4 Energy Targets and Initial Performance ……………………………... 60
CHAPTER 4: PROJECT OBJECTIVES ………..……………………… 61
CHAPTER 5: METHODOLOGY ............................................….. 62
v
CHAPTER 6: CASE STUDY-Overlee House & Lodge ……………………... 69
6.1 Location and Characteristics …………….…………………………… 69
6.2 Heat & Energy Demand ….……………………………………… 72
6.3 Pre-Selection of Low or Zero Carbon Technology Applications ……... 73
6.4 Results and Discussion …………………………..……………... 79
6.4.1 Energy Efficiency Analysis ……………………..………………. 79
6.4.1.1 Lighting …………………………………………. 80
6.4.1.2 Appliances ……………………..…………………... 83
6.4.1.3 Building Envelope ……………………………………...….. 87
6.4.1.4 RETScreen Energy Efficiency Measures Analysis
Summary ……………...………………………….. 96
6.4.2 Low and Zero Carbon Technology Applications ......…………. 97
6.4.2.1 Power …………..……………………….…...... 97
6.4.2.2 Heating .................................................................102
6.5 Result and Discussion Summary ….....………………..……………..........111
CHAPTER 7: CONCLUSIONS ...………………..…………....…………113
7.1 Future Works …..…….………………………..............115
REFERENCES ….………………………………………117
Appendix A - Building (Scotland) Regulations 2004 Section 3 ‘Environment’
and in section 6 ‘Energy ………….………………………............122
Appendix B – Issues for LZCT in the Building Standards ……………............125
vi

List of Figures
Figure 1 Primary Factors of Thermal Comfort ……………………………..… 16
Figure 2 Methodology of Retrofit Design of a Sustainable ECO-Office …..…. 63
Figure 3 Energy Efficiency Measurement Structure …………………………. 65
Figure 4 Power Project by RETScreen ………………….………………………….. 66
Figure 5 Heating Projects by RETScreen…..……...……………………....….…... 67
Figure 6 Overlee House & Lodge …...…………………………………….. 70
Figure 7 Overlee House & Lodge Map …………………………..……………... 71
Figure 8 RETScreen Energy Performance Analyses of Windows ………..... 89
Figure 9 RETScreen Energy Performance Analyses of External Walls ……….… 92
Figure 10 Components of PV Systems ………...……………………………….. 99
Figure 11 Battery characteristics in RETScreen display for solar
power analysis ……………………………………….....100
Figure 12 Solar panel characteristics in RETScreen ...……………………105
vii

List of Tables
Table 1 Summary of BREEAM Offices 2008 (BES5054) –
Existing Building-Fit out Categories and Main Issues ………….……………… 11
Table 2 Recommended Comfort Criteria for an Office ……………………...….. 18
Table 3 Comparing lamps for office use ……………………………………….… 25
Table 4 Possible Environmental Effects of Office Equipments …………. 26
Table 5 Power Consumption of Typical Office Equipments …………. 27
Table 6: Power Consumption of Kitchen and Other Appliances …..……... 29
Table 7 Technology and Planning Considerations for Wind Turbine System…….. 35
Table 8 Special Requirements for Wind Turbine System …...…….. 36
Table 9 Technology and Planning Considerations for Solar Hot Water System….. 37
Table 10 Special Requirements for Solar Thermal Hot Water System …………. 38
Table 11 Technology and Planning Considerations for PV System ……….…….. 39
Table 12 Special Requirements for PV System ……………………...….. 40
Table 13 Technology and Planning Considerations for
Small Scale Hydro System …………………………………………. 42
Table 14 Special Requirements for Small Scale Hydro System ………… 43
Table 15 Technology and Planning Considerations for Biomass System ……... 44
Table 16 Special Requirements for Biomass System ………… 45
Table 17 Technology and Planning Considerations for GSHP System ………… 47
Table 18 Special Requirements for GSHP System ………….……………… 48
Table 19 Technology and Planning Considerations for ASHP System …………. 49
Table 20 Special Requirements for ASHP System ……………………..…... 50
Table 21 Technology and Planning Considerations for CHP System …………. 52
Table 22 Special Requirements for CHP System …………………………. 54
Table 23 Renewable Energy Technologies Used in Beaufort Court Case Study…. 59
Table 24 Monthly Heats and Power Consumption of Overlee House & Lodge…...73
Table 25 Pre-selecting of LZCT for Overlee House & Lodge……………………..75
viii

Table 26 Typical Values for Lighting ……………………….………………… 80
Table 27 Overlee House & Lodge Main Office Lighting Base Case Pattern……... 81
Table 28 Overlee House & Lodge Rare Room and/or Interview
Room Lighting Proposed Lighting Patterns ……………………………………... 81
Table 29 Overlee House & Lodge Main Office Proposed Case T5
Lamps Lighting Patterns ………………………………………… 82
Table 30 Overlee House & Lodge Base Case Appliances Patterns ..………... 84
Table 31 Overlee House & Lodge Base Case Printers Patterns …………. 85
Table 32 Overlee House & Lodge Proposed Case-Printers Patterns …………. 85
Table 33 RETScreen Analysis of Non-ENERGY STAR products
and Base Case Products Comparison ……………….………………………… 86
Table 34 RETScreen Analysis of Overlee House & Lodge Base
Cases and Proposed Case Comparison ………………………...……………….. 87
Table 35 RETScreen Analysis-Energy Performance of Different
Window Options of Overlee House & Lodge .…………………………………….. 90
Table 36 RETScreen Analysis-Energy Performance of Different
Door Options of Overlee House and Lodge …...………………………………… 91
Table 37 RETScreen Analysis-Energy Performance of Various Wall
Insulation Options of Overlee House & Lodge ………………………………...…. 92
Table 38 RETScreen Analysis-Energy Performance of Various
Wall Insulation Options of Overlee House & Lodge ……………….…………….. 94
Table 39 RETScreen Analysis-Energy performance of various
floor insulation options of Overlee House & Lodge ………………………...…… 95
Table 40 Building Envelope RETScreen Energy Efficiency
Measure Analysis of Overlee House & Lodge …………………………..…. 96
Table 41 Various Power Capacities and Characteristics of PV
Panels with Their RETScreen Analysis ……..……………………..…………….101
Table 42 Energy Performance of Solar Air Heating Panels …………...…….…105
Table 43 RETScreen Analysis of Heat Pumps without
Energy Efficiency Improvements in Overlee House & Lodge ……………………108
Table 44 RETScreen Analysis of Heat Pumps with Energy Efficiency
Improvements in Overlee House & Lodge .……………………………..109
ix

Table 45 RETScreen Cost & GHG Emission Saving Result Analysis of
Selling Oversupply Heat Pumps Energy …..……………………………………...110
Table 46 Result and Discussion Summary ……………………………...111
x

1
CHAPTER 1: INTRODUCTION
Our planet is experiencing a significant climate change. We have to build, fast, on that
progress and momentum if to make the radical changes that are now urgently required.
This is a priority that is shared across the UK and the international community.
Scientists seem to be in general agreement that it is human activity influencing this
change and that if human behaviour is not altered the planet will suffer [1]. There are
many ways to reduce our personal impact on climate change. Some alterations in the
way we live and use are easy and quick to implement [1].
Most people spend their life in office buildings. The operation of such buildings
accounts for up to 40% of energy consumption in OECD countries. Not a typical to-do
list for another day at the office, but every workday each of us makes hundreds of
decisions that affect all of these issues. The design, therefore, construction and
maintenance of the built environment provide significant opportunities to contribute
towards a more sustainable future. Energy used for heating, providing hot water, cooling
and lighting are major factors in our global environmental impact. Making office
buildings more environmentally friendly in itself is a commitment towards preserving
the environment. At the same time, buildings are designed to respond to social and/or
business needs and they inevitably have social, economic [2].
The current standard of office building is highly variable and most pays little tribute to
sustainable development objectives. There is a need to identify and embrace those
elements and available guidance that can enable better offices to be delivered and to
ensure the benefits and opportunities are widely disseminated.
Sustainable development and environmental targets may be achieved by considering
green options not only for new buildings but also reuse of existing buildings. It is
important to set standards that, no matter the new building or refurbishment of the
buildings, will limit resource and energy demands for the life time of buildings.
This dissertation reviews of the retrofit design of a sustainable ECO-Office. As the
demand for “sustainable” or “green” design solutions continues to increase in office

2
building construction, the need for a better understanding of how cost effective,
environmental energy and resource efficient low or zero carbon technologies are
designed and constructed.
Chapter 1 provides an introduction and explains why designing an existing ECO-Office
building. There is a literature review in Chapter 2 covers areas of typical key elements of
an environmental performance for designing an ECO-Office with overview of regulation
and standards in sustainable buildings. Besides, there is an overview of low and zero
carbon technology options in terms of technology and planning considerations as well as
the special requirements of these technologies. Chapter 2 also includes an approach of
modelling tool selection section since reliable feasibility studies depend on selection of
correct modelling tool. Chapter 3 presents a previous case study as an example of an
ECO-Office design. Chapter 4 and Chapter 5 identify objectives and a methodology of
project respectively. Chapter 6 presents Overlee House and Lodge case study by detailed
analysis and discussions. Finally Chapter 7 provides conclusions and high-lights broader
and long-term works the thesis may be pursued to move toward sustainability.

3
CHAPTER 2: LITERATURE REVIEW
This chapter defines the concept of an ECO-Office, sets out previous work that has been
done in this area and describes the legislative context. To date there is still no clear
definition of an ECO-Office which is often also known as a Sustainable or Green Office.
This chapter provides the reasons of implementing a Sustainable ECO-Office. It also
reviews energy efficient measures and appropriate low or zero carbon technologies.
2.1 What is a Sustainable ECO-Office?
The definition of sustainability as applied to buildings is not fixed, but ‘green’ or
sustainable ECO-Office design is sensitive to building an office to the highest quality
and functional standard, with maximum environmental and social benefits and with cost
assessments that reflect the whole office interior life cycle such that investment can be
properly maintained [3].
For retrofit designing of a sustainable ECO-Office from an existing building it is
necessary to determine what is involved with refurbishing or fitting-out a building; this
could mean:
• using resources efficiently – getting more from less
• minimising waste
• focusing on energy and water use
• choosing products carefully to ensure they are not harmful to the environment or
to occupants’ health [4].
To achieve sustainability it is necessary to:
• Enhance biodiversity – not use materials from threatened species or environments and
improve natural habitats where possible through appropriate planting and water use.
• Support communities – identify and meet the real needs, requirements and aspirations
of communities and stakeholders and involve them in key decisions.

4
• Use resources effectively – not consume a disproportionate amount of resources,
including money and land during material sourcing, construction, use or disposal; not
cause unnecessary waste of energy, water or materials due to short life, poor design,
inefficiency, or less than ideal construction and manufacturing procedures. Buildings
have to be affordable, manageable and maintainable in use.
• Minimise pollution – create minimum dependence on polluting products and
materials, management practices, energy, power and forms of transport.
• Create healthy environments – enhance living, leisure and work environments; and
not endanger the health of the builders or occupants, or any other parties, through
exposure to pollutants, the use of toxic materials or providing host environments to
harmful organisms.
• Manage the process – stewardship of projects is a vital and overarching aspect in
delivering sustainable projects, both in the first instance and also in ensuring their
performance over time. Too many aspirations are undermined by failure to manage the
design process, particularly at crucial handover points where responsibilities change.
This requires us to identify appropriate targets, tools and benchmarks, and manage their
delivery [5].
It is important to put these sustainability issues at the centre of aspirations for offices to
ensure that they provide ongoing benefit into the future rather than the unwelcome
burden.
2.2 Reasons to Implement a Sustainable ECO – Office
Designing a sustainable ECO-Office yields are economical, environmental, and social
benefits [6].
Firstly from a financial point of view; when the amounts of supplies are reduced,
operating costs go down. Buying and using energy-efficient equipments saves money
and electricity usage. It can also cut air-conditioning bills because the amount of heat
that equipments generate needed to be cooled down. Paper costs can be almost halved

5
simply by printing double-sided. In terms of the amount of waste reduction, there is also
saving on waste disposal costs [7].
The environmental point of view; thinking green does not only protect financial
solvency of the office; it also protects our planet’s natural resources. There seems to be
an endless supply of Copy paper, envelopes and boxes at the office superstore. In reality,
however, there are limited supplies of raw materials to create these products. Globally,
reduce and reuse must be used more often to maintain a sustainable supply of resources
for offices [6]. The environmental benefits of using energy-efficient equipment are
considerable. By reducing the electricity which is used the air and water pollution would
be reduced from power stations and saving tonnes of greenhouse gas for each 1,000
kilowatt-hour of electricity save [7]. Three R policies (reduce, reusing and recycling the
materials usage) reduce the amount of waste and pollution which is generated. In
addition, making equipment from recycled metals, plastics and other materials saves at
least two kilograms of greenhouse gas per kilogram of product [7]. Using recycled paper
saves trees. Every 100 reams of recycled office paper that is printed double-sided saves
two trees, more than a tonne of greenhouse gas and almost a cubic metre of landfill
space compared to 100 reams of paper that is not recycled or printed double-sided [7].
Making an office to a “green” one requires office staff involvement in doing something
for the environment. Knowing that their actions can really make a difference will
enhance a natural motivation to act in an environmentally responsible way. Since
motivated staff means productive staff, an increase can be expected in productivity [7].
From health and safety point of view, the health of the occupants is not endangered by
green office through exposure to pollutants, the use of toxic materials or providing host
environments to harmful organisms. Outdoor activities are facilitated by improving the
work environments through healthy and comfortable internal and external environments
including accurate levels of natural lights and ventilation [3].
Early exponents of green buildings have tended to view them primarily as a technical
innovation challenge [8], while the mainstream needs to be understood the impact on
financial viability and the greater value which these buildings add to communities and
lives [9].

6
2.3 Regulation and Standards in Sustainable Building
Legislation, standards and the ECO-Office Standard requirements which are related to
Sustainable Building in Scotland and Europe are reviewed in this section. The following
aims to highlight the key policy drivers for creating of more-sustainable construction
and the legislative requirements.
2.3.1 Energy Policy and Legislation
The Scottish Government has set a target of reducing carbon emissions by 80% by 2050
and supports the EU target of 20% of Europe’s energy requirements being met from
renewable resources by 2020. For electricity, the aim is that 50% of Scottish demand for
electricity should be met from renewable sources by 2020, with a milestone of 31% by
2011 [10].
The Scottish Government is using building standards and the planning system to help
achieve low carbon buildings. It is also expected that a consultation will be issued on the
implementation of the Energy Performance of Buildings Directive 2002/91/EU [11].
2.3.2 Energy Performance of Buildings Directive 2002/91/EU
The Directive 2002/91/EC (EPBD, 2003) of the European Parliament and Council on
energy efficiency of buildings ("Energy Performance of Buildings Directive", EPBD) is
adopted on 16th December 2002 and came into force on 4th January 2003. The purpose
of the Directive is to increase awareness of energy use in buildings and force building
owners to invest in energy efficiency measures [12]. Europe is committed globally to
reducing carbon emissions under the Kyoto Protocol and this measure is intended to
contribute towards the proposed reduction.
A standard UK method of calculating integrated energy performance of buildings is to
be used to compare against minimum energy targets for new and existing buildings. The

7
method takes into account to promote the improvement of energy performance of
buildings within the community, in terms of outdoor climatic and local conditions, as
well as indoor climate requirements and cost-effectiveness.
Alternative systems for heating including; combined heat and power (CHP), district
heating systems, heat pumps and renewable technologies based on technical,
environmental and financial feasibility must be considered in Article 5 as part of the
legislation.
The implications of the Directive are currently being released within the UK as the
general framework for a methodology of calculation of the integrated energy
performance of buildings, the application of minimum requirements on the energy,
performance of large existing buildings that are subject to major renovation, energy
certification of buildings; and regular inspection of boilers and of air-conditioning
systems in buildings and in addition an assessment of the heating installation in which
the boilers are more than 15-year old. The eventual outcome of the Directive will be
reducing energy consumption within the building sector and greater awareness of energy
reducing strategies with environmental benefits [13].
2.3.3 Building (Scotland) Regulations 2004
The object of this section is to ensure that buildings do not pose a threat to the
environment and people in or around buildings.
Technical Handbooks one for domestic construction and one for non-domestic have
been published in order to provide practical guidance for regulations. In this chapter,
Technical Hand Book for non-domestic buildings is considered. The summary of the
proposed Scottish 2007 regulations [14] which are key to sustainability are reviewed
below.
The minimum standards for new buildings are established through the Building
Regulations on the 4 January 2009. This edition is unchanged from the 2008 edition of
the Technical Handbooks, other than amendment to The May 2009 edition of the non-

8
domestic Technical Handbooks applies from 1 May 2009. This edition introduces
further amendment to Section 0, Section 2, Section 3, Section 4 & Section 6.
In the Building (Scotland) Regulations 2004, six sections set out the requirements for
building construction in the standards.
• Section 1 Structure
• Section 2 Fire
• Section 3 Environment
• Section 4 Safety
• Section 5 Noise
• Section 6 Energy
Appendix A provides an initial appraisal, indicating Section 3 ‘Environment’ and in
Section 6 ‘Energy’ contain the relevant regulation standards for which the guidance
could beneficially be reviewed.
2.3.4 ECO-Office Accreditations/Recognition
Many commercial buildings have a pledge to receive high ratings under the scheme as a
commitment to sustainability.
There is a requirement for the provision of a signed Design Certificate that provides a
proof of non-domestic building energy design that complies with current building
regulations. The Scheme [13] was approved under Section 7(2) by the Scottish Ministers
on 11 July 2007.
Beside the compulsory certification scheme there is multiple voluntary ‘green design’
rating systems currently in use. The most universally used rating system in the U.K is
BREEAM (Building Research Establishment Environmental Assessment Method).
Furthermore, IEMA (Institute of Environmental Management & Assessment) and
National Energy Efficiency Awards are introduced in this section.

9
2.3.4.1 BRE Certification
The Scheme [15] covers all standards within Section 6 Energy (Standards 6.1 to 6.10).
The Scheme (Section 6 – Energy) for non-domestic Buildings is the certification of the
calculation of energy rating and carbon index using approved SBEM compliant software
that is approved by the BSD. Such information is essential to comply with the current
building regulations.
The certification system is based upon the principle that qualified and experienced
building professionals/tradesmen can take responsibility for ensuring compliance with
the Regulations, provided they are employed by reputable companies which operate a
system of careful checking. BRE Global is a Scheme Provider for the Energy
Certification of (Commercial) non-domestic Buildings for Section 6 - Energy (non-
domestic) - its Scheme was fully approved in August 2007 [15].
It is suggested that within the framework set out by the regulations and relevant
standards there is opportunity for innovative environmental strategies that can reduce
energy consumption beyond conventional practice.
2.3.4.2 BREEAM
BREEAM (Building Research Establishment’s Environmental Assessment Method) is
an environmental assessment method for buildings. The operation of BREEAM is
overseen by an independent Sustainability Board, representing a wide cross-section of
construction industry stakeholders. Building owners and / or developers are awarded
based on the performance. Best environmental practise and lower running costs can be
achieved by greater energy, water efficiency and occupant satisfaction. Productivity can
be improved by greater health and comfort. Building labelling is proven by rising
owners, occupants, designers and operators’ awareness. Market recognition can be
provided to low environmental impact building. It also allows organizations to
demonstrate progress towards corporate environmental objectives [16].

10
Within the existing basic structure the BREEAM assessment can be tailored for
application to different office types. BREEAM Office assessments can be carried out on
both new and existing office buildings that are none occupied or occupied, as follows:
• New build or refurbishment: design and procurement
• Existing office (occupied): management and operation
There are eight categories within the BREEAM, which represent a variety of sustainable
building concerns.
The categories and environmental weightings applied are listed below. Within each
category is a range of environmental criteria and each is allocated a specific number of
credits. The credits awarded for each category are summed and the category weighting
applied. The weighted score is then summed to give a single environmental rating
expressed on a scale of Pass (25%) to Excellent (>70%).
• Management (15%)
• Health and Well Being (15%)
• Energy and Transport (25%)
• Water (5%)
• Materials (10%)
• Land Use & Ecology (15%)
• Pollution (15%)
The Energy category aims to reduce operational energy consumption through low
energy lights and equipment, increased performance of the building fabric, renewable
energy technologies, metering, controls, and heat recovery. All of which are applicable
to office buildings.

11
Table 1 Summary of BREEAM Offices 2008 (BES5054) – Existing Building-Fit out Categories
and Main Issues Management • Commissioning • Construction • Construction Site Impacts • Construction Site Impacts-Fit out only • Building User Guide • Security
Materials • Materials Specification – Fit Out Elements • Responsible Sourcing of Materials – Fit Out Only • Insulation • Designing for Robustness
Health and Wellbeing • Day Light • View Out • Glare Control • High Frequency Lighting • Internal and External Lighting Levels • Lighting Zones & Control • Potential for Natural Ventilation • Indoor air and water quality • Volatile Organic Compounds • Thermal Comfort • Thermal Zoning • Microbial Contamination • Acoustics Performance
Waste • Construction Site Waste Management • Recyclable Waste Storage
Energy • Reduction of CO2 emissions • Sub-metering of Substantial Energy Uses • Sub-metering of high energy load Areas and Tenancy • External Lighting • Low Zero Carbon Technologies • Energy efficient building systems • Lifts • Escalators & Travelling Walkways
Land Use and Ecology Do not apply for an assessment of an existing building fit-out
Transport • Provision of Public Transport • Proximity to Amenities • Cyclist Facilities • Pedestrian and Cyclist facilities • Travel Plan • Maximum Car Parking Capacity
Pollution • Refrigerant GWP – Building Service • Prevent Refrigerant Leaks • NOx Emissions From Heating Source • Minimising Watercourse Pollution • Reduction of Night Time Light Pollution • Noise Attenuation
Water • Water Consumption • Water Meter • Major Leak Detection • Sanitary Supply Shut Off
Innovation • Man 2Considerate Constructors • Hea1 Day Lighting • Ene1 Reduction of CO2 Emissions • Ene5 Low or Zero Carbon Technologies • Wat2 Water Meter • Mat5 Responsible Sourcing of Materials • BREEAM Accredited Professionals

12
2.3.4.3 Institute of Environmental Management & Assessment (IEMA)
The major aim of the IEMA assessment is that of environmental performance
improvements and participation of organizations demonstration to reduction of the
environmental impacts of their activities, products and services.
The scheme provides a framework of EMS (Environmental Management Systems) and
requires an ongoing environmental performance evaluation. The principal bodies
involved in the scheme are:
• The Institute of Environmental Management and Assessment (IEMA)
• The United Kingdom Accreditation Service (UKAS)
• Acorn Inspection Bodies
• Participating Organizations
Organizations are accredited by UKAS to provide an Acorn certificate. In addition, they
shall also comply with the following IEMA Acorn scheme [17] requirements.
Organizations progressing beyond Phase 5 seek accredited certification to ISO 14001
and/or registration to EMAS [17].Acorn Inspection Bodies undertake inspections for
phases 1-5 of British Standard BS 8555:2003. BS 8555 is a new British Standard that
has been designed with small to medium-sized businesses specifically in mind. This
scheme implements the guidance of the phased implementation of an environmental
management system including the use of environmental performance indicators’. The
scheme involves the assessment and recognition of each phase of the implementation of
an EMS as laid down in BS 8555.
The six phases of BS 8555 STEMS are:
1. Commitment and establishing the baseline
2. Identifying and ensuring compliance with legal and other requirements
3. Developing objectives, targets and programmes
4. Implementation and operation of the EMS
5. Checking, auditing and review
6. EMS acknowledgement:

13
• Option 1 – ISO 14001 certification
• Option 2 – EMAS verification
2.3.4.4 National Energy Efficiency Awards
The National Energy Efficiency Awards celebrate the achievements of individuals and
their organizations in reducing energy use and thereby helping to combat climate change
by the UK Center for Economic and Environmental Development (UK CEED). This
organization was established in 1984 to support, co-ordinate and monitor
implementation of the Conservation and Development Program for the UK. In
particular, UK CEED is to play an influential role both in demonstrating how
environmental protection and economic development priorities could be reconciled and
also in promoting the central role of the business sector in environmental improvement.
Applicants are rewarded through the successful implementation of effective energy
efficiency measurement, cost and innovations across a range of categories.
Here are the categories for the 2009 National Energy Efficiency Awards [18] applicable
for Offices.
• Construction & Renovation
• Energy Efficient Products
• Energy Efficient Services
• Energy Management in Buildings
• Large Business
2.3.4.5 Summary
Current legislation and industry practice combine to make office buildings a safe
workplace for users and reduce energy consumption within reasonable limits. It is the
duty of the building designers to ensure the minimum levels of energy efficiency set by
legislation are achieved while maintaining environmental requirements and reaching

14
minimum costs. Best practice can be exceeded when building owners, stakeholders and
design teams are focused and committed to achieving. In this context, ‘green rating’
voluntary schemes BREEAM, IEMA or National Awards lead to achieve sustainable
ECO-Office. Since the ‘green rating’ approach is voluntary, which scheme will be
chosen is very much depends on the owners, stakeholders and design teams. There is
typically an increased capital cost incurred in such projects through premiums for:
equipment, plant, consulting fees and analysis fees, to prove design solutions. Energy
savings through increased efficiency however can justify the capital expenditure through
attractive paybacks.
2.4 Key Elements of Environmental Performance for Designing an Sustainable
ECO–Office
This section compiles a list of key activities required in the design of an ECO-Office
building. A few major elements are; ensuring good indoor environmental quality, energy
efficiency and environmental impact, materials and green tariff are considered. Design
indicators then create other titles such as creating a green team, training office workers,
purchasing, waste management, recycling, transportation, water management, catering
and event planning, basic environmental management systems applications.
Investigations of other titles are not included in this thesis due to inadequate time.
2.4.1 Ensuring Good Indoor Environmental Quality
This section discusses human comfort in offices. The environmental factors include the
indoor air quality, the thermal, visual and acoustic conditions.
2.4.1.1 Indoor Air Quality
Indoor air quality relates to the air quality within and around buildings and structures,
and how it significantly affects the health and comfort of building occupants.

15
Good indoor air quality management includes attention to: managing sources of
pollutants; ventilation system design, outside air quality, indoor air quality, space
planning, equipment maintenance and operation of building ventilation systems;
moisture and humidity; and occupant perceptions and susceptibilities [19]. To date here
is no yet complete agreement on how much fresh air is required in buildings.
There are three major strategies in order to control indoor air quality [20]. The first is the
removal of sources of pollutants from the building or isolating through physical barriers,
air pressure or controlling of their use. Second is removing pollutants by the building’s
ventilation. Third is cleaning the air by using filtration.
Poor indoor air quality is a main concern since it influences the health, comfort, and well
being of building occupants. Poor air quality causes headaches, eye irritation, and
fatigue, shortness of breath, sinus congestion, sneezing, dizziness, skin irritation, nausea
and coughs. Sick building syndrome occurs when the occupants of a building are
exposed to symptoms associated with acute discomfort. Besides, poor air quality could
also lead to losses in productivity as a result of comfort problems, which in turn would
cause poor health and an increase in absenteeism.
Potential health and comfort problems have become more familiar with people in recent
years. This may be due to the move to more tightly sealed buildings, conclusion of
implementation of energy conservation programs, and the increase of use of office
equipments.
2.4.1.2 Thermal Comfort
The definition of thermal comfort is body functions well in a core temperature of around
37 °C and skin temperature of 32-33 °C [21]. The primary factors affecting thermal
comfort are shown in Figure 1 [12].

16
Figure 1 Primary Factors of Thermal Comfort
Standards concerned with thermal comfort are produced by ISO/TC 159 SC5 WG1. The
main thermal comfort standard is ISO 7730 based upon the Predicted Mean Vote (PMV)
and Predicted Percentage of Dissatisfied (PPD) [22]. The PMV predicts the mean value
of the votes of a large group of people on the ISO thermal sensation scale (+3 = hot; +2
= warm; +1 = slightly warm; 0 = neutral; -1 = slightly cool; -2 = cool; -3 = cold) [23].
It also provides methods for the assessment of local discomfort caused by draughts,
asymmetric radiation and temperature gradients. Other thermal comfort standards
include a technical specification, thermal comfort for people with special requirements
(ISO TS 14415), responses on contact with surfaces at moderate temperature (ISO
13732, Part 2). Standards that support thermal comfort assessment include ISO 7726
(measuring instruments), ISO 8996 (estimate of metabolic heat production), ISO 9920
(estimation of clothing properties), and ISO 10551 (subjective assessment methods)
[23].
In the UK climate, space heating and cooling thermal comfort plays a major role
considering the future demand. There are interactions between climate, behaviour,
building design and heating, cooling and insulation technologies. An acceptable zone of
thermal comfort for most people in the UK lies roughly between 13 °C and 30 °C. The
Regulations do not specify a minimum or maximum indoor workplace temperature.
However, the ACOP (Approved Code of Practice) recommends the minimum

17
temperatures for workrooms of at least 16 °C, or 20 °C [24]. Usually the relative
humidity in an office space varies between 30 % and 60 % [22].
Clothing insulation values for typical clothing ensembles are given in CIBSE Guide A
January 2006 (7th Edition) Page 1-5. Thermal insulation values for typical garments and
corresponding reduction in acceptable operative temperature for sedentary occupants are
also indicated in CIBSE Guide A January 2006 (7th Edition) Page 1-6.
2.4.1.3 Visual Comfort
Visual comforts considers following purposes
1. To enable the occupant to work and move about in safety
2. To enable tasks to be performed correctly and at an appropriate pace
3. To create a pleasing appearance [25].
Visual comfort depends on view out and brightness patterns. Daylight attitudes are
varied with geographical latitude and historical period.
Many affects of light on health exist through skin absorption and through the eye.
Vitamin D is formatted to calcium by light and in particular daylight. Low calcium
levels leads to rickets in bones, hardening of the arteries. Also a lack of daylight can
cause skin diseases such as psoriasis, acne and vitiligo. Light plays a crucial role in
controlling the circadian rhythm of the body [26].
2.4.1.4 Acoustic Comfort
To identify the degree of acoustic comfort in an office depends on combined effects of
unwanted ambient noise and a desired level of speech privacy. Speech privacy is related
to the levels of intruding speech sounds, from adjacent work spaces, relative to general
ambient noise levels [27].
Three facts which are people, the room and types of activities are essential for a room
and its correct acoustic conditions. Additionally, there are a number of factors which are
required in order to plan an acoustic open-plan area, such as location of work stations,

18
choice of absorbent ceilings, design of furnishings (furniture, screens, and wall), silent
work areas, floor surface, work methodology and technical aids, background noise.
Indoor ambient noise levels in unoccupied staff/office areas comply with the following:
a. ≤ 40dB LAeq, T in single occupancy offices
b. 40-50dB LAeq, T in multiple occupancy offices
c. 40 dB LAeq, T general spaces (staffrooms, restrooms)
d. 35 dB LAeq, T in spaces designed for speech e.g. seminar/lecture rooms
e. ≤ 50 dB LAeq, T in informal café/canteen areas [16]
Exorbitant indoor acoustic is one of the major problems in the community. Undesirable
acoustic is causes stress and negative affects in human wellbeing as well as inefficient
productivity in the workplace.
2.4.1.5 Summary
Recommended comfort criteria according to the CIBSE January 2006 (7th Edition) for
office applications in the UK as follows Building/Room Type is given in Table 2.
Table 2 Recommended Comfort Criteria for an Office Winter operative temp. range for stated activity
and clothing levels
Summer operative temp. range for stated activity
and clothing levels Building /Room Type Temp
/ oC Activity
/met Clothing
/ clo Temp / oC
Activity /met
Clothing / clo
Suggested Air
Supply Rate / (L
s-1 per person) unless stated
otherwise
Filtration Grade
Maintained illuminance
/ lux
Noise ratings (NR)
executive 21-23 1.2 0.85 22-24 1.2 0.7 10 F7 300-500 30
general 21-23 1.2 0.85 22-24 1.2 0.7 10 F6-F7 300-500 35
open-plan 21-23 1.2 0.85 22-24 1.2 0.7 10 F6-F7 300-500 35

19
2.4.2 Energy Efficiency and Environmental Impact
Issues concerning environmental design in offices, in the context of this work, are for
the use of less energy to provide the same level of energy service while satisfying
functional requirements with minimum energy demand and utilizing energy from low
impact sources.
There are both small and large changes that can make office environment energy
efficient. Sometimes these alterations are easy to implement and cost-effective, whereas
others require the installation of new equipment that may be expensive in the short
period of time. However, renewal will save money, energy and the environment in the
long term.
2.4.2.1 Building Envelope
The energy performance of a building envelope is influenced by a number of factors. For
example, these may include design elements such as the physical orientation of the
building and the amount of sunlight that penetrates into the interior work spaces. Other
factors may also include the heat transfer characteristics (both losses & gains) and the
location of the building envelope components, including walls, windows, doors, floors
and the roof. The energy performance of a building may also be influenced by any
natural air infiltration through the building envelope.
Retrofitting thermal insulation and draught-stripping to existing building is the single
most cost-effective way to save energy for heating and reduce emissions in the UK. The
proportion of heat loss through different elements of the building envelope is:
Walls 35 %, roof 25 %, floors 15 %, draughts 15 %, and windows 10 % [28].
The aim should be to insulate the entire building envelope as part of an integrated
insulation package. Working this way - rather than insulating isolated elements - is more
cost effective, and reduces thermal bridges.
20
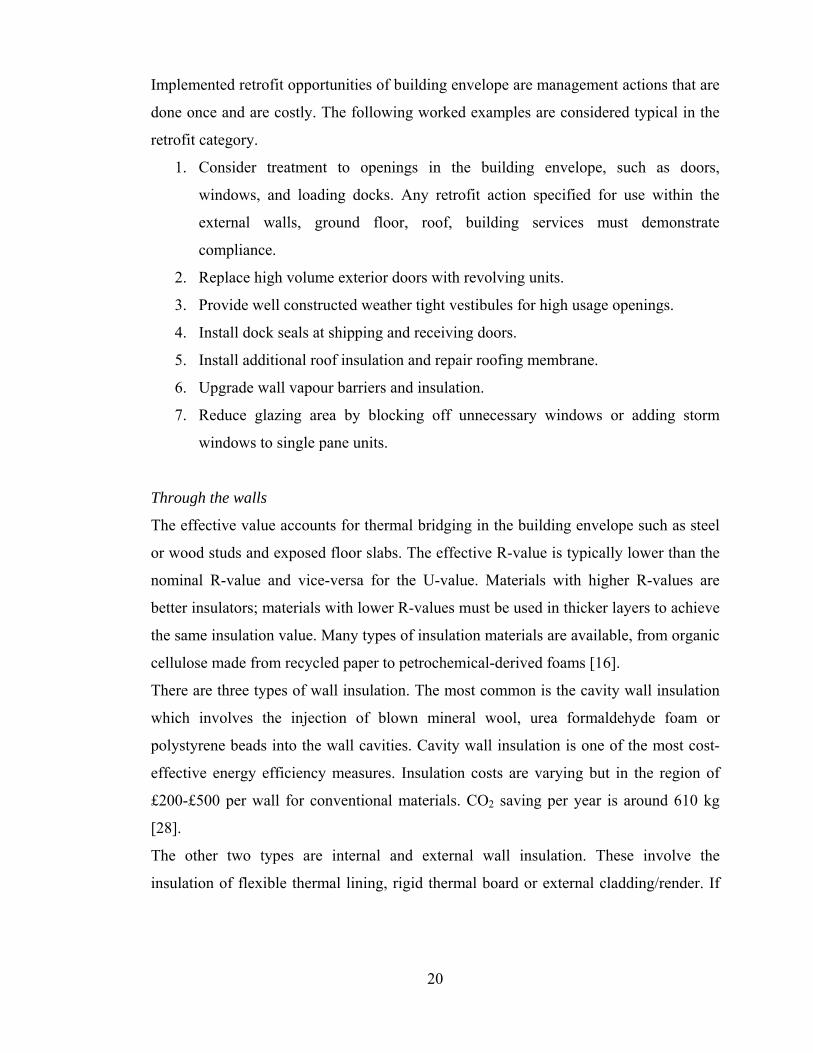
Implemented retrofit opportunities of building envelope are management actions that are
done once and are costly. The following worked examples are considered typical in the
retrofit category.
1. Consider treatment to openings in the building envelope, such as doors,
windows, and loading docks. Any retrofit action specified for use within the
external walls, ground floor, roof, building services must demonstrate
compliance.
2. Replace high volume exterior doors with revolving units.
3. Provide well constructed weather tight vestibules for high usage openings.
4. Install dock seals at shipping and receiving doors.
5. Install additional roof insulation and repair roofing membrane.
6. Upgrade wall vapour barriers and insulation.
7. Reduce glazing area by blocking off unnecessary windows or adding storm
windows to single pane units.
Through the walls
The effective value accounts for thermal bridging in the building envelope such as steel
or wood studs and exposed floor slabs. The effective R-value is typically lower than the
nominal R-value and vice-versa for the U-value. Materials with higher R-values are
better insulators; materials with lower R-values must be used in thicker layers to achieve
the same insulation value. Many types of insulation materials are available, from organic
cellulose made from recycled paper to petrochemical-derived foams [16].
There are three types of wall insulation. The most common is the cavity wall insulation
which involves the injection of blown mineral wool, urea formaldehyde foam or
polystyrene beads into the wall cavities. Cavity wall insulation is one of the most cost-
effective energy efficiency measures. Insulation costs are varying but in the region of
£200-£500 per wall for conventional materials. CO2 saving per year is around 610 kg
[28].
The other two types are internal and external wall insulation. These involve the
insulation of flexible thermal lining, rigid thermal board or external cladding/render. If

21
the walls are solid, internal insulation is highly effective. Costs are in the range of £500
to £5000 per wall [28].
Through the ground floor
The EST (Energy Saving Trust) estimates that lose as much as 10 % of heat through un-
insulated floors. Exposed floors are those that are directly connected to the exterior
ambient temperatures. The effective value accounts for thermal bridging in the floor
such as steel or wood studs and exposed shear wall. The effective R-value is typically
lower than the nominal R-value and vice-versa for the U-value.
There are numbers of ways to insulate flooring. The quickest and simplest ways to
reduce draughts through floorboards is to fill gaps with a tube sealant or blankets under
suspended floors and laying boards over concrete floors. Other methods for timber floors
include the insulation of insulation boards with environmental friendly materials such as
wool, quilts and plant-fibre board. All timber flooring insulation requires a ventilation
gap and should not block air bricks, to prevent rotting [29].
For solid floors, options include polystyrene or foamed glass below floor slabs, or
polystyrene or mineral wool above floor slabs, laid in conjunction with new flooring.
Rubber-based materials and cork may offer more environmentally sound alternatives.
Through the roof insulation
Up to 1/3 of all heat lost in the building can be through poor insulation in roof spaces,
according to EST. For flat roofs, and insulated vaulted roofs, the area of the roof should
be entered itself [30].
The effective value accounts for thermal bridging in the roof such as steel or wood studs
and exposed shear wall. Roof insulation prices change between
Lofts should be insulated to a minimum depth of 150 mm - preferably 270 mm [31].
Mineral wool such as Rockwool or Rocksil, fibreglass and recycled paper products all
work well. Insulation costs for Loft Insulation are around £500 [28].
Through the windows
The effective value accounts for thermal bridging in the window frame. For a more
detailed analysis, care should be taken when using window manufacturer data as often
the only value published is the centre-of-glass R-value or U-value. To account for the

22
higher heat loss value that typically occurs in the window frame, an even more detailed
analysis is required.
1. Solar heat gain coefficient
The effective solar heat gain coefficient (SHGC) of the window should be
considered. The SHGC is a dimensionless quantity representing the fraction of the solar
energy incident on the window that ends up as heat inside the building. The "effective"
value takes into account the opaqueness of the window frame. To account for physical
blocking of solar energy by the window frame, an even more detailed analysis is
required.
2. Solar shading - season of use
The estimated external shading of the window for the six coldest months when the sun is
lowest in the sky should be considered. A shading factor represents the fraction of a
window surface area that is shaded from direct sunlight by an obstruction such as an
adjacent building, vegetation, or a shading device like an awning. Hence the shading
factor is the reduction in solar gains due to shading and is not associated with the
shading coefficient of the window. For calculation purposes, the window area is reduced
by the proportion given by the shading factor when computing the solar heat gains.
The shading factor is not constant; rather it varies with sun position and time of year.
Typical Shading Factors average values should be taken into account for winter and
summer.
2.4.2.2 Ventilation
Ventilation is the intentional movement of air from outside a building to the inside as
defined in ASHRAE Standard 62.1 [32] and the ASHRAE Handbook, [33] is that air
used for providing acceptable indoor air quality.
The energy performance of a ventilation system is influenced by a number of factors.
For instance, these may include design elements such as the air flow rate, the amount of
fresh air introduced in the system, the presence of a reheat coil and a heat recovery
device, the type of fan and ventilation control, and the leakiness of the intake air damper.

23
The design of ventilation systems depends on the type of application. For example, it
may include applications such as controlling the injection of fresh air, controlling air
redistribution, room diffusion and stratification, maintaining comfort standards,
maintaining air quality within acceptable limits of carbon dioxide, oxygen and odour
content, removing airborne contaminants produced by processes and occupants and
maintaining special environment for specific equipment or processes.
CIBSE January 2006 (7th Edition) for office applications in the UK states that
appropriate ventilation guidelines are 10 L/s per person in an office building.
Types of ventilation are; natural ventilation, mechanical or forced ventilation, and
infiltration. In natural ventilation (NV) systems the driving forces are normally less than
50 Pa [5]. An advantage of low pressure gradients, low airflow and absence of fans is
that NV has the potential to be more efficient and quieter than mechanical systems. It is
also important to minimise resistances to airflow. There is a limited cooling capacity
which makes it vital to minimise thermal and pollutant loads, and so building form,
fabric and fit-out must play a part. Natural ventilation strategies are opening windows,
night cooling, passive stack, atria, wind scoops and ducted or under floor. Mechanical
ventilation (MV) involves forced air movements, with pressure differences typically
100–1000 Pa [5]. Care must be taken to design strategies so that they can work to assist
the preferred flow of air and do not undermine each other or the overall efficiency.
Heat Recovery
Heat recovery is a method of salvaging a portion of the energy wasted by inefficient
Heating, Venting, and Air Conditioning (HVAC) systems [34]. Air conditioning units
are designed to remove heat from interior spaces and reject it to the ambient air. HVAC
systems have a limited efficiency due to the laws of thermodynamics and inherent
inefficiencies with real applications. From an energy conservation point of view, it
would be desirable to reclaim this heat in a usable form.
The energy performance of a heat recovery system is influenced by a number of factors.
These typically include the (energy-to-energy, steam-to-steam, steam-to-water, water-to-
water, or other fluid-to-other fluid) flow rate, temperature, pressure, density and/or heat
24
capacity. Other factors will also include the heat recovery efficiency and the number of
hours that the heat recovery system is operating.
Commercial buildings use large quantities of fuel and electricity that ultimately produce
heat, much of which is wasted either to the atmosphere or to water. Many types of
equipment have been developed to re-use some of this waste heat. This may save on the
annual fuel bill and, in some instances, reduce pollution emissions and plant
maintenance.
Before deciding to heat recovery, it is useful to know how much recoverable heat is
available. At first glance, it might be tempted to say that the heat available for recovery
is the heat that is removed from the room or space. The second step in estimating the
heat available for recovery is to take into account that, on the average, the unit will only
operate at 70-80 % of its full-rated capacity. Typical values of heat recovery efficiency
range from 10 % to 60 % [35].
2.4.2.3 Lighting
Lighting is a major factor in determining the way in which people experience the
internal environment in the office. Acceptable illumination level in the UK for offices is
300–500 lux [13]. Energy Effective Lighting accomplishes the objectives of being
efficient when meeting the needs of the space occupants. Lighting accounts for about
20-45 % of total electricity used in Commercial Buildings [36]. It depends on the
interplay of an extensive number of effects [5]. These include availability of usable
natural light; how a building is used and managed; the lamp and fixture type selected
and the illumination level required for the type of space being lit, the luminous
efficiency and electricity load for each lamp, the total number of fixtures installed,
maintenance and cleaning regimes of lamps, luminaires and surfaces; heat gains and
losses through glazed areas, the extent of personal and overriding control, particularly
glare management, and finally, the operating hours of the lamps.
Common daylight should be the superior form of lighting in most types of building. It
contributes significantly to distinctive and attractive architecture, and to occupants’

25
sense of well-being. It also offsets the energy consumption associated with artificial
lighting. This is often a very significant proportion of the overall energy consumption of
buildings.
Inappropriate natural lighting rises to thermal discomfort, and increase the need for
compensatory heating or cooling. To ensure how the office is going to be used and then
allocate areas by general lighting to illuminate the office [4]. Last but not least, good
control is absolutely essential if cost benefits are to be achieved. Therefore, control
strategies play a major role in order to increase effectiveness. These strategies are
summarised such as maximise the use of daylight to reduce the need for electric lighting.
The careful use of presence detectors in cellular rooms and in shared areas e.g. corridors,
toilets, circulation routes, meeting rooms, can achieve worthwhile savings of up to 20 %
in those areas. Its also recommend that that one should paint these surfaces with matt
colours of high reflectance to maximise the effectiveness of the light output.
Lamps & Luminaires
Type of Lighting Systems; incandescent lamps, tungsten halogen lamps, fluorescent
lamps, HID lamps (High pressure sodium lamps, Low pressure sodium lamps, Mercury
vapour, Metal halide), blended and LED lamps are well known examples.
Table 3 Comparing lamps for office use [3]
Type of Lamp Lumminaries / Watt Typical Application
Incandescent 9 Homes, Restaurants, General lighting, Emergency Lighting
Compact Fluorescent (CFL) 9-20 Homes, Offices and Public Buildings
Tubular Fluorescent (MCF) 20-125 Offices and Shops
Compact Fluorescent Lamps (CFL) used in place of tungsten filament lamps achieves an
energy reduction of 75% and an 8-10 fold increase in lamp life.
Light Emitting Diodes (LEDs) are a fast evolving, high technology light source. The
primary benefits of LED based lighting are energy efficiency, long life, minimal
maintenance and pure, saturated colours [36].

26
2.4.2.4 Office Appliances
Variety of office equipments in a typical office such as personal computers, monitors,
laptops, printers & scanners, MFDs (Multifunction devices), servers, photocopiers, fax
machines and kitchen appliances are integral parts of every office and with their
emissions, energy consumption and increasingly short life cycle, they have an important
effect on the environment. It is possible to make quick savings, both financially and
environmentally with smart product selection by purchasing and changing existing
office equipments (Table 4).
Table 4 Possible Environmental Effects of Office Equipments [2] Personal Computers Printers and Scanners Photocopiers Fax machines
Large quantity of "electronic" waste Effects on health (radiation and body posture) Problem substances in the equipment (anti-inflammable substances, PVC, heavy metals) Energy consumption
Emission of ozone Sound emissions (matrix printers) Problem substances in the equipment (anti-inflammable substances) Problems with the use of recycled paper Energy consumption Treatment of photo semi-conductive waste from toners, ink ribbons and cartridges
Ozone emissions Dust emissions Sound emissions Problems with the use of recycled paper Energy consumption Problem substances in the equipment Waste treatment: photoconductors, toner, disposable Material
Consumption of thermal
paper
The energy performance of appliances and other electrical equipment are influenced by
a number of factors. These typically include the number of hours that the equipment is
operating, the electricity load of the equipment itself and the duty cycle (on/off cycling)
for each appliance or other electrical equipment.
ENERGY STAR® program was begun by the United States Environment Protection
Agency (USEPA) in 1992 [7]. According to the program, manufacturers have a right to
decline ENERGY STAR logo on their equipments as long as they meet all the energy
efficiency standard rules. The program is applied for personal computers and monitors,
photocopiers, printers, fax machines, scanners and multifunction devices.

27
Although, ENERGY STAR equipments reduce electricity consumption by half
compared to equipment that is not power-managed they still uses energy while in sleep
mode [37]. ENERGY STAR office equipment therefore involves ability to power down
or sleep when they are not being used (Table 5).
Office Equipments
Table 5 Power Consumption of Typical Office Equipments
Description Electricity load – typical W
ENERGY STAR on Active Power
(idle)(W)
ENERGY STAR on Sleep Power
(W)
ENERGY STAR on Off Mode
(W)
Computers 200 - 300 [38] 33.9 - 39.16 [39] 2.25 - 2.44 [39] 1.33 - 1.72 [39]
Laptops 50 [38] 10 - 13 [40] 0.9 - 1.5 [40] 0.48 - 1.28 [40]
Monitor (15’’) 75 [41] 14.10 - 60.10 [42] 0.44 - 1.45 [42] 0.01 – 1.00 [42]
Printers 600-1000 [38] 335 [07] 1.02 – 14.60 [43] N/A
Scanners 19 6 - 12 [44] 3.3 – 11 [44] N/A
MFDs 1400 - 2200 [44] 250 [44] 6.3 – 105 [07] N/A
Photocopiers 100 – 300 [38] 82 – 174 [7] 5 – 9 [43] 5 – 20 [7]
Fax Machines 60 – 185 [7] 10 - 75 [7] N/A N/A
Routers 20 - 70 [45] N/A N/A N/A
There is an alternative of ENERGY STAR on equipment is an energy-saving software
product called Energy Management Option, EMO. This software can switch off the
computer when it is not being used and shut it down at night and thereby increase energy
savings for the approximately one-third of all computers. Additionally, it provides
calculations on energy, cost and greenhouse gas emissions savings [7].
Computers
There are some general principles for purchasing environmentally friendly computers
which will ensure that to achieve the full economic and environmental benefits.
• Check ENERGY STAR requirements of equipments. To ensure that supplier
delivers all products with the ENERGY STAR feature enabled.
• To look power ratings in operating, low power, and sleep and off modes [46].

28
• Consider the fact that a laptop is much more energy and materials efficient than a
desktop computer and monitor [47].
• A dedicated Copier/printer room that is separately vented from the buildings
main ventilation system in order to reduce exposure to toxins heat and noise [4].
Printers and Scanners
There are various printer types such as laser and ink jet and several control options;
standby mode and manual switching and wide range of scanner options to consider.
ENERGY STAR® laser printers do not need to be switched off manually. When no
print commands have been received for a preset time period, these printers automatically
switch to a low-power standby mode. While in standby, printers produce less heat, and
also reduce air-conditioning costs. Ink jet printers use much less energy [48].
Commonly, high resolution ENERGY STAR scanners use more energy in sleep mode
than lower quality ones. Since in most offices scanners are only used occasionally they
can therefore be switched off for most of the time [7].
Multifunction Devices (MFDs)
Multifunction devices (MFDs) are machines which print and fax as well as Copy. The
advantages of MFDs include systems integration is to create significant savings in
embodied energy, materials and environmental impacts.
Photocopiers
Copiers use energy all day likewise printers. ENERGY STAR® labelled Copiers are
able to automatically turn off after a period of inactivity. This can cut electricity use by
over 60% [48]. In addition, the right Copier saves paper and double-sided Copies cut
paper costs.
Fax Machines
When selecting fax machines it is best to follow the general principles for buying green
office equipment.
Choose an inkjet machine rather than a laser or LED machine if it does not reusing
function. Ensure there is a toner or ink-saving modes such as draft or “econosave”.
Kitchens & Other Equipments

29
Although, there are no kitchen appliances with an Environmental Choice Eco-label at
present, the Energy Star labelling system has recently been introduced. In addition, the
Energy Efficiency and Conservation Authority (ECCA) operate an Energy Rating Label
scheme in order to guide an energy-wise choice when buying new appliances such as
fridges and freezers, and dishwashers (Table 6).
Table 6: Power Consumption of Kitchen and Other Appliances [38]
Kitchen Description Electricity load – typical (W) Built-in oven 3,000 Coffee maker 900 - 1200 Dishwasher 1200 - 2400
Microwave oven 1000- 1200 Refrigerator 300 - 725
Other Description Electricity load – typical W
Central vacuum system 1,600 Clock radio 5 - 10 DVD player 14
Radio 20 - 400 Vacuum cleaner 800 - 1440
VCR 25 - 50 Washing Machine 2500 - 3500
2.4.2.5 Smart Meters
A smart metering system has two key features: time based measurement and two way
communication. Smart Meters bring about the end of estimated bills and meter readings
which would deliver savings in carbon emissions and on bills, and provide its owners
and/or energy suppliers with accurate information on the amount of electricity and gas
being used. Smart meters would only help to lower the average energy bill by five per
cent which equates to a saving of 1.2 billion pounds worth of energy and a reduction in
carbon dioxide emissions by 7.4 million tonnes [49]. Second, electricity use is reduced
during peak periods benefit through further reductions in their electricity costs by taking
advantage of lower off peak prices. Smart meters can be read remotely with information

30
sent automatically to the supplier, thus doing away with associated paper wastage. A
smart metering system allows frequent data exchange between the meter and the utility
by timely to track energy usage over set periods of time (for example, a day, a week, or a
month) and easily accessible instant and historical information. Not only that, because
energy suppliers would also be able to see this information in order to offer bespoke
energy saving solutions [50].
Energy Saving Trust strongly supports the installation of smart metering in new
dwellings and during major refurbishments, as well as a program for full-scale rollout
which would be completed within five to ten years. The initial estimates put the
installation cost of a smart meter at between £100 -200 [49].
2.4.3 Materials
This section aims to give an opinion and grasp of the issues and priorities affecting
materials such as building materials and office furniture selection in the design of retrofit
ECO-Office and a realistic perspective on the range of issues which will affect decision
making.
2.4.3.1 Environmental Building Materials
Selecting sustainable building materials are designed and manufactured with
environmental considerations. Materials selection for retrofit needs to be approached in
an interdisciplinary manner, in order to integrate the design of structure, services and
landscape. Planning permission sometimes requires an early decision on materials
selection.
Energy efficiency is an important feature in making a building material environmentally
sustainable. The main aim is to reduce the amount of artificially generated power.
Depending on type, the energy efficiency of building materials can be measured with
factors such as R-value, shading coefficient, luminous efficiency, or fuel efficiency [51].

31
Natural materials which require less processing and are less damaging to the
environment are generally lower in embodied energy and toxicity.
Non- or less-toxic materials are less hazardous to construction workers and building
occupants. Many materials affect indoor air quality to occupants’ health. Formaldehyde,
benzene, ammonia, and other hazardous or cancer-causing chemicals are present in
many building materials, furnishings, and cleaning solutions. Even “sick building
syndrome” occurs when chemicals are emitted by certain building materials such as
plywood, particleboard, and the chemicals used in foam insulation [52]. Adhesives emit
dangerous fumes for only a short time during and after installation; others can contribute
to air quality problems throughout a building’s life.
2.4.3.2 Office Furniture
Office furniture for instance chairs and other types of seating, desks, tables, filing and
storage cabinets and their associated components and accessories are generally made
from a wide variety of materials such as metal, wood and wood-based products, plastic
and fabric.
Some of the associated with the raw materials, manufacture, transport and use of the
furniture and consider its life cycle and environmental issues associated with office
furniture include: using wood from a non-sustainable harvest possible emissions from
formaldehyde, adhesives, binding agents, paints or finishes used in the product hydro
chlorofluorocarbons used as blowing agents for polyurethane foam metal plating process
for furniture that can contain toxic chemicals and human carcinogens such as hexavalent
chromium and nickel [4].
Choosing greener furnishings for retrofit can significantly reduce environmental impacts
[53].
Before disposing of furniture reconditioned and reused or recycled opportunities should
be considered as well.
32
2.4.4 Green Tariff
A green energy tariff means the energy that a property uses is supplied from renewable
sources [54]. These schemes offer three ways to use energy from renewable sources
supplied by the national grid. The first, with most electricity suppliers it is to convert to
a ‘green tariff’. Using this method every unit of electricity is matched by the generation
of energy from renewable sources. Second is to buy electricity using a ‘green fund’ [55].
Changing supplier or converting to a green tariff will not affect the way that electricity is
supplied or the way that it is billed. The Green Electricity marketplace provides a useful
guide to green tariffs and green funds in the United Kingdom [1]. In addition, Ofgem
(Office of the Gas and Electricity Markets) and Friend of The Earth facilitate public for
choosing best selection. Ofgem is a government funded independent regulator for
Britain’s gas and electricity services, which is tasked with promoting choice and value
for all customers. The online action calls on Ofgem to implement, as a priority, a robust
accreditation scheme for green electricity tariffs [56]. Friends of the Earth which is the
UK’s national Environmental campaigning Organization have in the past compiled
several green electricity league tables to encourage and inform people about what green
electricity tariffs are available and which the best products are.
Suppliers have set up schemes that offer ‘green tariffs’ or ‘green funds’ to their
customers in order to meet government’s target by 2010. In 2002 the Renewable
Obligation was introduced. This Obligation sets a target 4.9% in 2005, rising to 10% by
2010 for renewable energy that companies have to reach, otherwise pay a fine [56].
Green tariffs within the UK will need to demonstrate that Renewable Energy Guarantees
of Origin certificates (REGOs) are held, and that Levy Exemption Certificates (LECs)
and Renewable Obligation Certificates (ROCs) have been retired for the electricity
supplied. According to Green Electric Market prices are based on a typical annual
consumption of 3300 kWh and the range takes place of approximately £109 to £130 [57].

33
2.5 Low or Zero Carbon Technologies (LZCT)
There is a broad range of current and also future technical processes and methods to
exploit low and zero carbon energy technology (LZCT) options. The possibilities and
boundaries to convert low or zero carbon energies into end or useful energy largely
depend on the respective physical and technical conditions.
There are two important drivers to the adoption of LZCTs in Scotland:
a) Building regulations
The building standards and Section 6 Energy of the Technical Handbooks adopt a whole
building approach, with target reductions in CO2 emissions. Insulation levels, lighting,
control systems, boiler efficiency and the air infiltration rates of the building all
contribute to energy and CO2 savings. LZCTs are not mandatory under the 2007 Scottish
building regulations. However, while not requiring LZCT, the standards are sufficiently
demanding as to encourage the use of such technologies.
b) Planning policy
Scottish Planning Policy 6 Renewable Energy (SPP6) states that development plans
should set out the expectation that applications for developments of 500 m2 or more
“should incorporate on-site zero and low carbon equipment contributing at least an extra
15% reduction in CO2 emissions beyond the 2007 building regulations carbon dioxide
emissions standard.”
There are several types of LZCT sources of energy available. Some of these will be
more suitable and viable than others, and the choice depends on location, the natural
resources available and financial situation. In this thesis, issues are amplified in
Appendix B [58] for the primary Low and Zero Carbon Technologies; solar thermal
systems, photovoltaic, CHP, ground-source heat pumps, wind power and biomass in
Building (Scotland) Regulations 2004 listed. Energy generation items on the list have
advantages as they are cheaper and more developed. Also their payback periods are
more attractive with regards of other technologies such as fuel cells, tidal currents,
geothermal, biogas, and municipal.

34
This section instructs on how to make best selection of available technologies in the
design of an ECO–Office in terms of technology and planning considerations as well as
the special requirements of these technologies.
2.5.1 Wind
Wind turbines convert part of the energy content of moving air into electricity. There are
two basic systems available for using wind turbines to generate electricity - stand-alone
or grid-connected and two basic kinds of turbine, horizontal axis and vertical axis. There
are variations within these broad classifications.
Small scale wind turbines known as "micro wind" turbines vary in size with a range of
models available, from less than 100 W up to 50 kW. Smaller, less than 100 W, micro
turbines are often used to charge 12 V or 24 V batteries, for use on stand-alone systems.
Turbines ranging from 0.6 kW to 50 kW can be used to provide electricity generation for
non-domestic buildings, with rooftop models varying from 0.5 kW to 2.5 kW in size
[59]. Roof mounted ducted wind turbines are available which can be incorporated into
roofs of a high-rise buildings. These units have the advantage of capturing the high wind
speeds of typically more than 6 m/s available on rooftops of urban buildings (Table 7).
Small systems produce enough electricity for the lights and electrical appliances in an
office. 40% of all the wind energy in Europe blows over the UK, making it an ideal
country for micro wind turbines [59].
The Scottish National Planning Policy Guideline NPPG6 (Renewable Energy
Developments) [60] provides statements of Scottish Executive policy on nationally
important land use and other planning matters.

35
Table 7 Technology and Planning Considerations for Wind Turbine System
Factor Comment
Carbon Savings
Annual outputs depend on systems and local factors and cover a wide range of values.
Typically have peak outputs of up to 10 to 20 kW, generating 10,000 to 40,000 kWh per
annum. This is equivalent to approximately 5% to 20% of the electricity consumption of
a typical 4,000 m2 open plan office [59]. Local Impact
• Noticeable noise & vibration
• Negative Visual Impact [59].
Other Benefits
• It is possible to connect to the National Grid thereby store excess electricity in batteries
and use it when there is no wind.
• Abundant energy that will be available for future generations
• Wind turbines take up less space than the average power station.
Other Disadvantages
• The wind is unpredictable. The strength of the wind therefore is not constant and it varies
from zero to storm force.
• Initial costs of construction may be very expensive and some wind turbines are
expensive to buy or install.
• Connecting to the National Electricity Grid can also be difficult and expensive and must
be restructured to properly transport and distribute renewable energy
• Ongoing maintenance and regular checking are required.
Cost Depends on the type of system is chosen, and may range from £1,500 to £18,000 [1].
Grant Funding
Grant funding is presently available from the Energy Saving Trust via the Scottish
Community [28].
Planning permission
Require permission from local authority [61]. Once some issues have been resolved, it is
expected that roof mounted and free standing wind turbines will be permitted at detached
properties that are not in conservation areas. Further legislation is expected later this year
[62]. Under Planning Policy Statement 22 (PPS22) [63] regional and Local Planning
Authorities should recognise the full range of renewable energy sources, their differing
characteristics, locational requirements and the potential for exploiting them subject to
appropriate environmental safeguards. National Planning Policy Guidelines on
renewable energy (NPPG6) [60] is also required the special rules for wind.
For a retrofit installation a chartered engineer or other appropriately qualified person
should assess the building to advice on any provision necessary to take account of
changes in loading on the building, including guidance on strapping, chimney structure,
spreading loadings within the roof structure, use of secondary steel frames.

36
Table 8 Special Requirements for Wind Turbine System
Factor Preference
Location
Rural or exposed locations. Turbines are suitable in all locations although higher
outputs will be achieved in rural or exposed locations. Minimum wind speeds of 5 m/s
are required [58]. In contrast, outputs tend to be lower in sheltered locations, or where
air flow is altered by obstructions such as buildings.
Building occupation Suitable for all patterns of occupancy
2.5.2 Solar
There are two main forms of technologies that use of the energy from the sun to harness
solar power. The first group is known as solar thermal technology and the second group
is known as photovoltaic (PV) cell or solar electric panel, most commonly through the
use of solar cells which converts solar radiation directly into electricity.
2.5.2.1 Solar Hot Water
Solar panels absorb the energy from the sun and transfer it to heat water. There are three
types of solar water heating collectors: flat plate, evacuated and unglazed plastic
collectors tubes [28]. In the United Kingdom solar heating systems are used to work
alongside conventional water heating systems, which cover the winter months when
there is not enough heat from the sun (Table 9).

37
Table 9 Technology and Planning Considerations for Solar Hot Water System
Factor Comment
Carbon Savings
A solar thermal system providing domestic hot water can save 490 kg CO2 of fossil fuel
energy needed to supply hot water demand in a dwelling [28]. Local Impact
• A solar thermal system is completely silent in operation.
• Solar thermal systems are visible, although often not unattractive.
Other Benefits
• Once the initial investment has been recovered, the energy from the sun is practically
free.
• Any fuel is not required for solar energy.
• Although the power of the sun is not utilized at night or on stormy, cloudy days, the sun
is counted on being there the next day.
• It actively contributes to the decrease of harmful green house gas emissions.
• It system operates entirely independent, not requiring a connection to a power or gas
grid. Systems can therefore be installed in remote locations.
Other Disadvantages
[28]
• The cost of solar energy is also high compared to non-renewable utility-supplied
electricity.
• The production of solar energy is influenced by the presence of clouds or pollution in
the air.
Cost • The cost of installation may range from £3,500 to £7,000 depending on the size of the
system and the type of technology [1].
• Solar Energy systems are virtually maintenance free and will last for decades.
Grant Funding
Available for some sizes of community projects and building types via the Scottish
Community [28].
Planning permission
Planning permission [62] for solar thermal (roof mounted):
Permitted unless;
• Panels when installed protrude more then 200 mm.
• In Scotland only: installed on any part of the external walls of the building if the
building contains a flat
• In Scotland only: panels when installed on a flat roof are situated within 1 m from the
edge of the roof or protrude more than 1 m above the plane of the roof
For a retrofit installation, chartered engineer, or other appropriately qualified person
should assess the building. Additional hot water storage may be required and it is
important that the roof must also be strong enough to hold the weight of the solar
collector, especially if the collector is going to be placed on top of an existing structure.
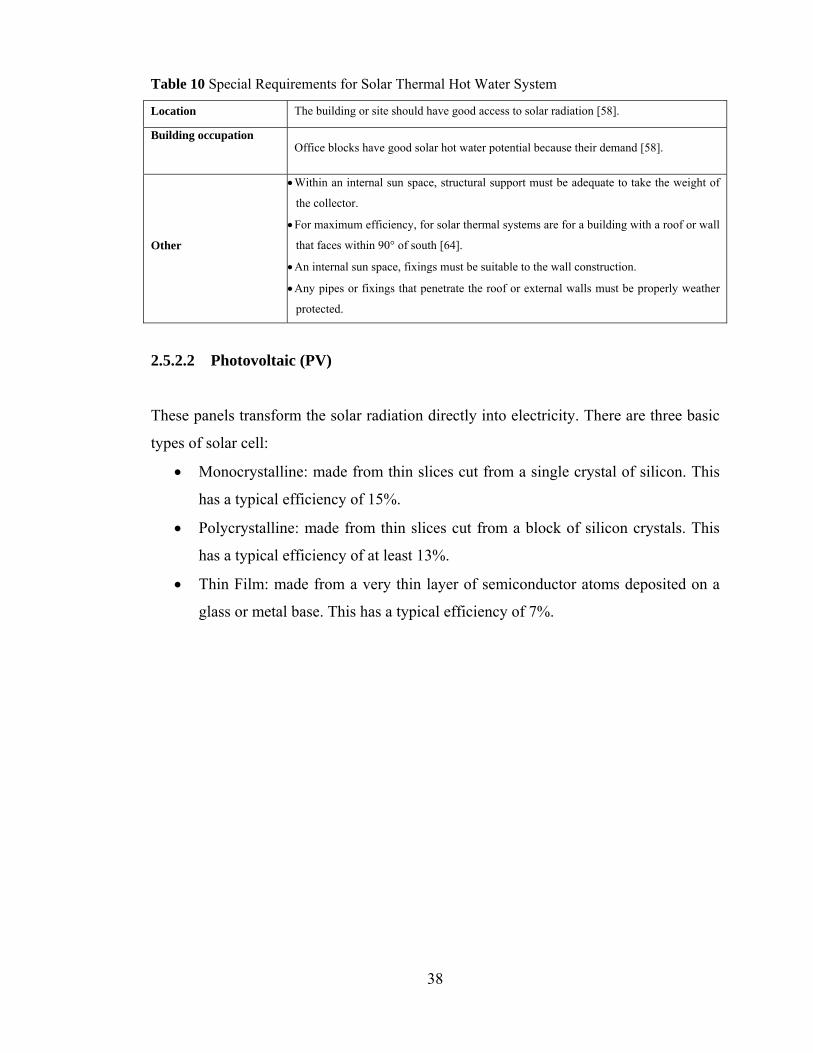
38
Table 10 Special Requirements for Solar Thermal Hot Water System
Location The building or site should have good access to solar radiation [58].
Building occupation
Office blocks have good solar hot water potential because their demand [58].
Other
• Within an internal sun space, structural support must be adequate to take the weight of
the collector.
• For maximum efficiency, for solar thermal systems are for a building with a roof or wall
that faces within 90° of south [64].
• An internal sun space, fixings must be suitable to the wall construction.
• Any pipes or fixings that penetrate the roof or external walls must be properly weather
protected.
2.5.2.2 Photovoltaic (PV)
These panels transform the solar radiation directly into electricity. There are three basic
types of solar cell:
• Monocrystalline: made from thin slices cut from a single crystal of silicon. This
has a typical efficiency of 15%.
• Polycrystalline: made from thin slices cut from a block of silicon crystals. This
has a typical efficiency of at least 13%.
• Thin Film: made from a very thin layer of semiconductor atoms deposited on a
glass or metal base. This has a typical efficiency of 7%.

39
Table 11 Technology and Planning Considerations for PV System
Factor Comment Carbon Savings
In terms of carbon dioxide, 1 kWp of solar cells displaces about 1190 kg of CO2 [28].
Local Impact
• A PV system is completely silent in operation.
• PV systems are visible, although often not unattractive.
• The PV system should be checked for electrical safety.
Offset Costs
The cost of the PV wall or roof can be offset against the cost of the building element it
replaces.
Other Benefits
• Although solar panels are expensive, once the initial investment has been recovered, the
energy from the sun is practically free.
• Photovoltaic offers to generate clean electricity, quiet and renewable way.
• In remote areas where grid connection is expensive, PV can be the most cost effective
power source [64].
• Solar panel efficiency averages values are still only 20%. According to the recent
researches the highest efficiency level that can be achieved with the standard silicon
materials in most solar cells is 40% [65].
Other Disadvantages
(172)
• There is some environmental concern over the lead acid batteries used in some systems
for storage purposes.
• Heavy metals such as cadmium are used in PV cells and cadmium sulphide is used in
PV panels, replacing the more expensive silicone. Cadmium can be difficult to recycle.
The production of silicone has an insignificant environmental impact, although some
fossil fuels are used in the manufacture of PV cells.
• Solar panels require quite a large area for installation to achieve a good level of
efficiency.
• The efficiency of the system also relies on the location of the sun, although this problem
can be overcome with the installation of certain components.
Cost The cost of installation may range from £8,000 - £15,000, depending on the wattage
required [28].
Grant Funding
Available for some projects through DTI funded grant programmes, e.g. major PV
demonstration programme.
Government grants [28] are available to help install systems. More information is
available on the website www.solarpvgrants.co.uk
Planning permission
Planning permission [62] for Solar PV (roof mounted) is the same with Solar Thermal
Water Systems can be seen above.
Planning permission [62] for Solar PV (stand alone) is the same requirements with solar
thermal systems can be seen above.

40
For a retrofit installation before making an investment, it is useful to seek expert advice
to find out whether the property is suitable and whether there is enough sunlight
available. A chartered engineer or other appropriately qualified person should assess the
building to ensure that account is made of any changes in loading to the building of the
roof or wall.
Table 12 Special Requirements for PV System
Factor Preference
Location
The building or site should have good access to solar radiation.
Building type and
occupation
Office blocks have good PV potential because their electricity demand is significant all
year round and because demand is highest between 9 am and 5 pm. Thus, the match
between demand and PV supply is good [58].
Other
• Any fixings that penetrate the roof or external walls must be properly weather protected
to prevent the ingress of rainwater.
• Care must be taken to avoid disruption of insulation, excessive thermal bridging, or
reduction of air tightness.
• The inverter must be installed in a suitable ventilated space with adequate access and
light for future inspection, testing or maintenance purposes, clear of insulation, other
materials and non-electrical services which may affect its operation and suitable
information including diagrams, schematics and labelling should be provided.
• Suitable precautions to prevent electric shock require to be implemented when working
on PV systems to reduce the risk of electrocution. PV cells must be covered when
working on the system and particularly on the cables installed between the PV cells and
the isolation switches. Anyone intending to clean the PV arrays should carry out a
suitable risk assessment to reduce the likely hazards of working at height.
PV installation may be suitable for properties with a roof or a wall that faces within 90
degrees of south, as long as there is not significant shadow from trees or other buildings
[66]. Pollution will have literally no effect on the units as they are maintenance free and
the rain will help to keep the surface clean.

41
2.5.3 Small Scale Hydro Power
In simple terms, water (hydropower) is based on a simple process which uses the kinetic
energy in flowing water to turn a turbine to generate electricity. According to the IEA
(International Energy Agency) (2000), hydropower projects can be classified as by
purpose (single or multi-purpose); by storage capacity (run-of-river or reservoir
projects); by size ranging from micro (less than 100 kW), mini (100 kW-1MW) and
small (1 MW−10 MW) sizes up to medium- and large-scale projects in a number of
ways offer a wide diversity of scales that can meet many needs and contexts [67]. Power
may be produced from even a small stream, and a micro (small) hydro plant is classified
as one that generates less than 100 kW [68].
In an off-grid hydro system, electricity can be supplied directly to the devices powered
or through a battery. A back-up power system may be needed to compensate for
variations in water flow throughout the year.

42
Table 13 Technology and Planning Considerations for Small Scale Hydro System
Factor Comment
Carbon Savings Very site dependent
Local Impact
• There may be noise and vibrations
• Hydro systems are visible, although often not unattractive.
• Construction of the dams at inappropriate locations can cause human casualties [69].
Any breakage in the dam can cause large scale destruction of the human, plant and
animal lives.
Other Benefits
• Small-scale hydropower is one of the most cost-effective and reliable energy
technologies.
• High efficiency (70 - 90%) [69].
• No fuel is required for producing power.
• Once a dam is constructed, electricity can be produced at a constant rate.
• Electricity does not emit harmful green house gases.
• The operations are automated, thus operating costs of hydroelectric power plants are
low.
• If electricity is not needed, the sluice gates can be shut, stopping electricity generation.
The water can be saved for use another time when electricity demand is high.
• The lake that forms behind the dam can be used for water [67].
Other Disadvantages
• Dams are extremely expensive to build and must be built to a very high standard.
• Each dam is unique in itself so the designs cannot be standardized.
• The construction activity of the dam itself disturbs the environment to a great scale.
• The flooding of large areas of land means that the natural environment is destroyed.
• The hydroelectric power plants cannot be constructed at any locations.
Cost The cost of installing a micro hydro system depends on site and energy demand and may
range from £4,000 to £25,000 [68].
Grant Funding
Tax incentives are available in the form of a reduced VAT on hydro-electric plant. Also,
through the government’s Low Carbon Buildings Programme (LCBP), a maximum of a
£2,500 grant is offered to individuals who choose equipment from an approved list and
use a registered installer [1].
Planning permission All mini-hydro plants in Scotland will need to obtain an extraction licence from the
Scottish Environmental Protection Agency (SEPA) [70].
There are a few pieces of essential information that need to be obtained when a new site
is being considered for hydro generation (Table 14).

43
Table 14 Special Requirements for Small Scale Hydro System
Factor Preference
Location
Ensure an established design that is acceptable in terms of all water courses of any size
in Scotland is controlled by the Environment Agency.
Building type and
occupation A wide range of building types can use Hydro systems.
Other
• There are three licences that can apply to a hydropower scheme: Abstraction Licence,
Impoundment Licence, and Land Drainage Consent [71].
• Check if the water source close to a connection to the national electricity grid.
Alternatively it may be exported via the local distribution network by agreement with
the Distribution Network Operator (DNO) [72].
2.5.4 Biomass
Biomass is an organic non-fossil material which derived from living, or recently living
organisms collectively for all plant and animal materials a number of different forms of
biomass can be burned or digested by animals to produce energy.
Biomass is a very resourceful material to produce heat, electricity and a combination of
heat and power.
There are two ways to use biomass power, either though stand-alone stoves using logs or
pellets, or through boilers using pellets, logs or chips (Table 15).

44
Table 15 Technology and Planning Considerations for Biomass System
Factor Comment
Carbon Savings 4890 kg CO2 (boiler) / 360 kg CO2 (stove) [28].
Local Impact
• There may be noise and vibrations associated with producing and subsequent transport
of wood fuels.
• The visual impact of biomass plant is not a much problem.
• There are no particular health and safety concerns associated with the technology.
• Support an increase in wildlife species, particularly birds and insects.
Other Benefits
[73]
• Biomass is very abundant and available throughout the world.
• Biomass production can often mean the restoration of waste land.
• Using biomass energy does not increase atmospheric levels of carbon dioxide, a
primary greenhouse gas.
• The use of biomass can also decrease the amount of methane, another greenhouse gas,
which is emitted from decaying organic matter.
• It can be converted into several forms of energy.
Other Disadvantages
[73]
• Biomass is expensive to install technology
• On a small scale there is most likely a net loss of energy.
• If directly burned, produces carbon dioxide and other greenhouse gases.
• It also takes up more water from the earth and other fossil fuels to make the fertilizers
and fuels for planting and harvesting.
• Collection and maintaining a supply of the waste product in sufficient quantities to
maintain energy production is difficult. Also, some waste materials may only be
available seasonally.
Cost
Costs vary significantly from site to site, depending on fuel type, heating infrastructure
and the cost of a boiler plant may be in the region of £7,000 - £11,000 (boiler) / £2,000 -
£4,000 (stove) [28].
Grant Funding
Available for households and community projects via the Scottish Community.
The Bio energy Capital Grants Scheme supports the early deployment of proven
biomass-fired heat and power generation projects and more than £4.2 million support
funding is available for biomass-fired heat and small combined heat and power (CHP)
projects under the Scheme. It also supports the development of fuel production and
distribution networks [28].
Planning permission
Safety and building regulations should be complied with and planning permission for the
flue is needed to be obtained [73]. There are a number of regulations relating to the
installation of solid fuel heating systems that apply to biomass systems. These include BS
EN 303 Part 5:1999, Building Regulations, and Clean Air Act [73].

45
A chartered engineer or other appropriately qualified person should assess the building
to ensure that account is made of any changes in loading to the building (Table 16).
Table 16 Special Requirements for Biomass System
Factor Preference
Location
Biogas generation is more suited to sites with good access to manure or food wastes
[58].
Some biomass, especially wood, is not generally suitable in smoke control areas.
Building type and
occupation The technology is appropriate to all building types
Other
• Storage space and sufficient air movement space are important issues.
• Fuel characteristics and supply opportunities should be considered.
• Chimneys must be constructed carefully using suitable materials in accordance with
the building regulations and the manufacturers’ instructions.
• If floor mounted, the boiler must be located on a suitable, non-combustible hearth to
dissipate any high temperatures generated.
• No parts of the installation must be so close to combustible material that it will
constitute a fire risk.
2.5.5 Heat Pumps
A heat pump is a machine or device that removes heat from one location to another by
using mechanical work.
2.5.5.1 Ground Source Heat Pumps
Ground Source Heat Pumps (GSHP), use pipes buried in the garden to ground to extract
heat and circulate a mixture of water and antifreeze around a loop of pipes, taking heat
from the ground in order to convert it into energy, which can be used for space heating
and water heating [74].
Typical entering water temperatures can range from -5 °C to +12 °C for heat pumps
delivering heat with maximum output temperatures, sometimes as high as 30-50 °C [75].
It can also be used to pre-heat water before it goes into a more conventional boiler. In

46
some applications, the pump can be reversed in summer to provide an element of
cooling, but these systems are not currently eligible for UK grants. The length of the
ground loop depends on the size of the site and the amount of heat needed.
A ground loop, the heat pump itself, and a heat distribution system are three basic
elements. The ground loop is a pipe buried underground in either a horizontal trench or a
vertical borehole. Horizontal trenches are dug 1.5-2 m below ground level. Boreholes
are drilled to a depth of between 15-150 m and benefit from higher ground temperatures
than trenches. GSHP require an input of energy, usually electricity, to make use of low
grade heat, but they can be energy efficient, producing up to 4 kW of heat output for
every kW of electrical input [28].

47
Table 17 Technology and Planning Considerations for GSHP System
Factor Comment
Carbon Savings To reduce the quantity of CO2 emissions [76]. 3010 kg CO2 [28].
Local Impact
• Heat pump installations are unobtrusive and noise and pollution free
• Low visual impact and most of the infrastructure can be hidden beneath the ground.
• Controlled substance that needs to be handled by trained personnel.
Other Benefits
• Highly reliable, highly secure, long life expectancy, cost effective
• No need to pay for gas, oil or solid fuels
• In climates with either cold winters or hot summers, they can operate much more
efficiently than other electric heating systems and air-conditioning systems.
• Thermal storage capability, which may benefit the operational coefficient of
performance.
• Tremendous capability for individual zone temperature control.
• Once a ground source heat pump is installed, there are no external fans and no visible
external equipment.
Other Disadvantages
• More expensive to install due to the need for the digging of wells or trenches in which
to place the pipes that carry the heat exchange fluid.
• Large site area required for horizontal pipe installation.
• Manufacturers' claims of COPs of 3-4 are not generally being realised in practice, where
COPs of around 2 are more common [75].
Cost
Exact installation costs depend on the site and the amount of heat output required. Costs
of installing a typical system range from about £7,000 to £13,000. However, this cost may
vary greatly depending on the size, type of property, ground conditions how well
insulated it is [75].
If replacement is done an electric, oil, Liquid Petroleum Gas (LPG) or coal heating
system, a ground source heating system will pay for itself quite quickly [75].
Grant Funding
Available for households and community projects via the Scottish Community. Find a
grant to help with the costs of installing renewable and low carbon technologies a
certified installer and products. It is available through Clear Skies (203) and BERR
funded Low Carbon Buildings Programme [76].
Planning permission
This is funded by the Scottish Government and managed by the Energy Saving Trust.
Planning permission [62] for Ground source heat pumps is permitted. Certification for
products and installers within the low carbon buildings programme is now provided
through the Micro generation Certification Scheme [28].
The performance data should provide the coefficient of performance (COP) - the amount
of heat it produces compared to the amount of electricity needed to run it. A typical COP

48
for a ground source heat pump is around 3.2 without any reductions for the type of
distribution system. GSHP typically have COPs of 3.5-4.0 at the beginning of the
heating season, with lower COPs as heat is drawn from the ground [77]. GSHP is 300-
400% efficient in terms of its use of electricity [28].
Before designing the system, a survey should be carried out to ascertain the location of
any existing wastewater or surface water drainage systems, any gas or water supply pipe
work, any electricity supply cables, or pipe work from on-site fuel stores. A chartered
engineer or other appropriately qualified person should assess the building to ensure that
account is made of any changes in loading to the building (Table 18).
Table 18 Special Requirements for GSHP System
Factor Preference
Location
Locations with:
- land available which is suitable for excavation for a horizontal loop, or
- suitable geology for vertical loop(s)
Building type and
occupation More suitable in high levels of occupancy
Other
• It is essential that building is insulated and draught proofed.
• Excavations to install ground loops must not prejudice the integrity of the building’s
foundations. It must be insulated for a distance of at least 1.5 m where it exits the
building, and at any point where paving may be affected by frost heave.
• In order to achieve the design level of performance, particular care must be taken to
install horizontal ground loops at sufficient depth and with sufficient distance between
the flow and return loops.
• Care must be taken to avoid disruption of insulation, excessive thermal bridging, or
reduction of air tightness.
• Hazardous or dangerous substances from the ground or radon gas, and the installation
must avoid damage to any such treatments.
• An additional heating source should be provided to the water storage cylinder to allow
the water to be regularly raised to at least 60 °C.

49
2.5.5.2 Air source Heat Pumps
An air source heat pump (ASHP) absorbs heat from the outside air as a heat source or
heat sink. A compressor, condenser and refrigerant system is used to absorb heat at one
place and release it at another. Depending on whether the heat pump is in a cooling or
heating mode, the refrigerant moving through the system makes the indoor coils either
hot or cold.
There are two main types air source heat pumps; an air-to-water system uses the heat to
warm water. A typical COP for an air source heat pump is around 2.5 [77].
Table 19 Technology and Planning Considerations for ASHP System
Factor Comment
Carbon Savings
In general 2580 kg CO2 [28].
Fuel Displaced:CO2 saving per year
1. Gas: 830 kg
2. Electricity: 6 tonnes
3. Oil: 1.3 tonnes
4. Solid: 5 tonnes
Local Impact
• The carbon emissions of air source heat pumps are nearly 40% lower than a gas
condensing boiler [78]. External space needs to be found for the outside condenser
unit which can be somewhat noisy and unsightly.
• Very low visual impact
• Controlled substance that needs to be handled by trained personnel.
Other Benefits
[78]
• A popular choice due to their simple ‘plug and play’ installation and competitive
pricing and they are typically competitive with traditional electrical and fuel-based
systems.
• Running costs can be dramatically reduced because 75% of the fuel required to heat
property will come free from the outside air [77].
• Requires no storage space for fuel.
• Main energy source, the air or water, is always available and inexhaustible.
• Relatively mild winter temperatures in the UK mean excellent levels of both
efficiency and performance are achieved throughout the year. The outside air can be
used as the energy source between +35 °C and -25 °C all year round. The same system
may be used for air conditioning in summer, as well as a heating system in winter.

50
Table 19 (cont.) Technology and Planning Considerations for ASHP System
Other Disadvantages
• In climates with extended periods of freezing temperatures, ASHP have large
limitations, compelling users to use electric or gas heaters.
• In colder climates the system needs to be installed with an auxiliary source of heat to
providing heat at low temperatures or if the heat pumps should require repair.
• Secondary or backup heat sources are required in cooler climate.
• Heat pumps lose their efficiency as external temperatures fall.
• Ventilation systems must be installed to duct outside air to each space.
• Each unit requires electricity for operation and plumbing service. This system typically
has higher maintenance costs because of the multiple compressors and fans.
• The COP is vastly reduced when heat pumps are used to reach over 50°C for heating
domestic water or in conventional central heating systems.
• Retrofit is difficult when used with conventional heating systems using radiators or
radiant panels.
Cost
Costs for installing a typical system range from about £7,000 - £10,000 including
installation [28]. Running costs for space heating are likely to be around £440 per year.
This will vary depending on a number of factors [77].
Grant Funding
BERR funded Low Carbon Building Programme [28] helps with the costs of installing
renewable and low carbon technologies and use a certified installer and products.
Planning permission Once the legal technicalities have been resolved, it is expected that air source heat pumps
will be permitted developments.
A chartered engineer or other appropriately qualified person should assess the building
to ensure that account is made of any changes in loading to the building.
Table 20 Special Requirements for ASHP System
Factor Preference
Location
• A place is needed outside the property where a unit can be fitted to a wall or placed on
the ground. Plenty of space is needed around it to get a good flow of air.
Building type and
occupation More suitable in high levels of occupancy.
Other
• It is essential that building is insulated and draught proofed well for the heating system
to be effective.
• Where the gap between the unit and the building at ground level is narrow, provision
must be made to clear debris to avoid bridging the damp proof course.
• Before deciding to use an air source heat pump, consideration should give to potential
noise nuisance to nearby dwellings.

51
2.5.5.3 Combined Heat and Power (CHP)
Cogeneration or combined heat and power (CHP) is the term given to equipment which
provides the simultaneous generation of heat and electricity in a single process.
CHP Technologies are;
• Electric Generation Equipment (Reciprocating Engines, Turbines, Fuel Cells)
• Cooling Equipment (Mechanical Chillers, Absorption Chillers, Desiccant
Dehumidification)
• Heating
Among the CHP Products in the UK [79] EC Power Mini-CHP Statoil Group is the most
convenient one for offices. Its specifications are 4-13 kWe, 17-29 kWth and Internal
Combustion Engine.
Although natural gas and fuel oil are most common, almost any fuel such as waste and
biomass can be used for CHP plant,
The calculation of seasonal, weekly and building energy performance can be analysed
and assessed for existing buildings: through reference to the capacity of existing
building services equipment, operational patterns, historical and current fuel electricity
use and costs.
Small-scale CHP installations in buildings are difficult to track since one of the primary
sources of CHP data does not currently collect data on CHP systems less than 1 MW. It
is generally expected that larger capacity CHPs have equipment output heat to power
ratios of between approximately 1:1 and 1:7.Smaller capacity units may operate between
the ranges of approximately 1:6 to 2:3 [80]. Most small-scale CHP units use
reciprocating internal combustion (IC) gas engines as the prime mover, which can
achieve high levels of reliability, and a heat to power ratio of about 1.5:1. Heat can be
recovered from the engine exhaust at around 400 ºC and from the engine cooling system.
Gas turbines are widely used in large-scale CHP systems, and are now becoming
available for small-scale systems. Alternatively small-scale gas turbines can use a
recuperator to improve the electrical efficiency, but with a lower exhaust temperature.
Heat to power ratios of 1.5:1 up to 3:1 can be expected. Gas turbines offer benefits in

52
certain applications as they require less frequent maintenance than gas engines [38]. The
majority of CHP equipment operating in the built environment within the UK utilizes
internal combustion (IC) engine technology, using natural gas fossil fuel as its energy
source [80].
In an office, a micro CHP unit resembling a gas-fired boiler will provide both heat for
space and water heating, as does a boiler, but also electricity to power domestic lights
and appliances. CHP often produces hot water at temperatures ranging from 80 oC to
90oC [80]. Offices buildings fitted with CHP are usually also connected to the mains
electricity grid, and may also retain back-up boilers, so that they are never short of an
energy supply, during maintenance of the CHP plant. They are typically installed onsite,
supplying customers with heat and power directly at the point of use, therefore helping
avoid the significant losses [81].
Table 21 Technology and Planning Considerations for CHP System
Factor Comment
Carbon Savings
Carbon reductions can be around 30% when compared to existing conventional boilers
and power generation systems [82].
Local Impact
• Noise and vibration are minimal.
• Usually contained within boiler houses and plant rooms.
• There are no specific safety concerns attributable to CHP installations that comply with
legislative requirements. The CHP installation must comply with the Electricity
Companies Distribution Systems Guidelines G59/1 (Recommendations for connection
of Embedded Generation plant to the Electricity Distribution Systems).
Other Benefits
• Generating electricity on or near the point of use also avoids transmission and
distribution losses and defers expansion of the electricity transmission grid.
• High efficiency leads to a reduction in the use of primary energy.
• Advances in technologies such as combustion turbines, steam turbines, reciprocating
engines, fuel cells, and heat- recovery equipment have decreased the cost and improved
the performance of CHP systems.
• CHP can increase the overall efficiency of fuel utilisation to as much as 70 to 90%.

53
Table 21 (cont.) Technology and Planning Considerations for CHP System
Other Disadvantages
• Since the technology is relatively new, so some difficulties in locating installers
capable of doing the work to satisfaction at a reasonable price and in the UK being
thorough enough to provide a valid log.
• There are limited number of units available in a given output range.
• CHP requires high-pressure supply or on-site boosters for gas firing.
• There is poor efficiency at low loading.
• It should be large volumes of hot gas to be handled from the exhaust.
• Electrical output reduces with high ambient air temperature and/or low pressure.
• Condensing boilers can easily go wrong and can be costly to maintain and it is
rumoured that their lifetime can be only half that of traditional boilers.
• The new systems are more sensitive to the method of operation, tuning and state of
repair.
• There is too much emphasis on short-term cash flow, when long-term investments may
generate greater returns.
Cost
Costs depend on which CHP technology is used. E.g. Approximate cost capital
equipment and cost for generation of electricity from biomass are the range from £1200
to £2000 [83] for Biomass CHP. Unit cost of installation is range from £3,000 - £7,000
per dwelling for Natural Gas CHP.
Grant Funding
Enhanced capital allowances can apply and the input fuel for some installations is
exempt from the climate change levy.
Grants to support the installation of CHP are currently available through the Community
Energy programme [28].
Planning permission
Planning permission [62] for Wood burning boilers and stoves, and CHP is permitted
unless flue exceeds 1m above the roof height, installed on the principal elevation and
visible from a road in buildings in Conservation Areas and World Heritage Sites. In
Scotland: flue situated within an Air Quality Management Area (when CHP is wood
fuelled)
It is recommended that CHP should be first considered through completing a viability
assessment, then a full feasibility study. Afterwards the design, operation and
maintenance of a particular scheme can be completed [80]. Determination of the
feasibility of installing a CHP plant in a particular site involves a number of logical
steps. A clear procedure is detailed in The Manager’s Guide to CHP (CHP Club, 2002)
[83], with the basic steps which are determination of the site heat and power demands
(Table 22).

54
Table 22 Special Requirements for CHP System
Factor Preference
Location
Suitable in all geographical locations.
CHP in a building or site relies on suitable demands for heat and electricity local to the
generation equipment. A site that has inconsistent demands for thermal and electrical
energy may not be suitable, or may need to incorporate additional design features to
improve viability of CHP.
Building type and
occupation
More suitable for buildings with a year round demand for heat. Examples include
hospitals, hotels, sports or leisure facilities with heated pools and residential
accommodation.
Also well suited to mixed use developments, where the variety of buildings provides such
a demand for heat [58].
Other
• The accurate calculation of a buildings thermal and electrical energy profile and heat
to power ratio, an appropriate CHP equipment output heat to power ratio, the
integration of CHP with building services and assessment of fuel, electricity tariffs
and costs needed to be taken into account.
• It is essential that building is insulated and draught proofed well for the heating system
to be effective.
• It should always be designed to operate all year, as spring, summer, autumn and
winter technology.
• Further information required includes the occupational hours of the building, internal
winter design temperatures, and mechanical services equipment efficiency data.
2.6 Selection of Modelling Tool(s)
At this stage of the literature review part of the aim is to discuss possible modelling
tool(s) for modelling.
The science of energy analysis for buildings has become more and more complicated.
However, considerable work has been done in the effort to transform this available
science into design, construction and operation practice. Currently, there are many
powerful simulation codes available to help engineers/designers in the energy analysis of
energy structures. Through fast developing computing technologies, these codes can
make more detailed analysis compared to the past, hence becoming one of the most
crucial tools in energy analysis.
Generation of heat and power profiles with respect to building energy modelling tend to

55
be rather complex, and depend strongly on assumed usage patterns. The electrical load is
based on a usage pattern of installed appliances, lighting, and the heating demand in
terms of the building parameters, the desired temperature profile, occupancy pattern,
incidental gains, and the heating control system. Estimated heat and power profiles may
suffer from inaccuracies due to lack of information about the building parameters or
usage. However the main advantage of these analytical approaches is that they allow
analysis of the effect of energy saving measures and change of usage patterns. The full
modelling approach can be complex, and various intermediate methods including both
modelling and measurement are possible. The most obvious and useful method involves
measurement of the annual energy consumption, and then estimating the energy profiles
of target buildings considering meteorological data, or on the measured profiles of
similar buildings.
The principle outputs from energy simulations software can be grouped under
operational data, economic data, and environmental data. Operational data includes
hours run, heat utilisation, displaced electricity, heat supplied, fuel used, electrical, heat,
and total efficiencies. Economic data includes capital cost, electricity savings, additional
fuel cost, maintenance cost, net savings, and payback period. Environmental data
includes primary energy savings, carbon emission savings, and emission of other
pollutants.
Several different modelling tools help to estimate heat & power generation and analyses
match between renewable energy system supply and demand. Among this software three
different modelling program Merit, Homer and RETScreen were considered as a fourth
step of the case study.
Merit which has been developed by Strathclyde University is a dynamic simulations tool
that can give an idea into which scheme might be technically and economically feasible.
Merit analyses the match between renewable energy system supply and demand. It uses
data on the demand, supply and auxiliary profiles – and using several statistical tools can
give greater understanding on each combination.
Another widely used simulation tool “Homer” simplifies the task of evaluating designs
of both off-grid and grid-connected power systems for a variety of applications. Homer’s

56
optimization and sensitivity analysis algorithms make it easier to evaluate the many
possible system configurations such as technology options, component costs, and
resource availability [38]. It also displays simulation results in a wide variety of tables
and graphs that help compare configurations and evaluate them on their economic and
technical virtues.
In this thesis, by considering the user friendly interface and suitability of its tools with
existing project RETScreen (Renewable-energy and Energy-efficient Technologies) was
used. RETScreen is a decision-making tool that reduces the cost of pre-feasibility
studies; disseminating knowledge to help people make better decisions; and by training
people to better analyse the technical and financial viability of possible renewable
energy, cogeneration and energy efficiency projects developed by the CANMET Energy
Diversification Research Laboratory (CEDRL) with the contribution of experts from
industry, government and academia [38].
The core of the tool consists of standardised and integrated renewable energy project
analysis software that can be used world-wide to evaluate the energy production, life-
cycle costs and greenhouse gas emission reductions for various types of renewable
energy technologies. Each RETScreen renewable energy technology model is developed
within an individual Microsoft® Excel spreadsheet "Workbook" files. The Workbook
file is in-turn composed of a series of worksheets. These worksheets have a common
look and follow a standard approach for all RET Screen models. In addition to the
software, the tool includes: product, weather and cost databases; an online manual. It is
useful for both new construction and retrofits [38].

57
CHAPTER 3: PREVIOUS CASE STUDIES
In chapter 3 conducted the Beaufort Court Case study of a major refurbishment ECO-
Office design is considered. The purpose of evaluating this case study is to demonstrate
that an in-depth knowledge of the design process for energy systems would be beneficial
in understanding the project, as well as to outline the approach taken by this facility to
achieve this outcome [21].
The site was built in the 1930s in the Arts and Crafts style. It has been derelict for
several years and timber frame building was in relatively poor condition. The challenge
for the design team was to turn the deteriorating farm buildings into a sustainable office
space complete with visitors’ centre.
3.1 Design Constraints
Since the building was considered historical, the external appearance could not be
substantially changed.
As the development was within the Green Belt, the car park and new ancillary building
housing some of the renewable energy technologies had to be sunk so as to be hidden
from view. Due to the location between the M25 motorway and the West Coast Mainline
railway, noise was an important consideration. The noise level at the perimeter of the
building was measured as 77 dB (A) when Intercity train passed. For this reason, natural
ventilation was felt to be inappropriate. All glazing on the external façade was sealed
against noise. Openable windows and roof lights facing into the courtyard were used as
they were less susceptible.
3.2 Minimising Energy Demand
The buildings are particularly well day-lit, so the need for artificial light is limited. On
the first floor, roof lights have been introduced to bring daylight into the previously
gloomy storage space.
58
Office areas use fluorescent tube fittings with dimmable high frequency gear. A
combined presence of a detector and photocell integrated into each fitting allows the
electric lights to be on only when the room is occupied and when daylight levels are
inadequate. As the internal partitioning of the office spaces is flexible, the lighting
controls are programmable such that luminaries in the same room can be switched
together. The individual photocells allow each luminaire to dim by an appropriate
amount to meet a minimum design level 300 lux.
As a low energy alternative to air conditioning, ground water is used to cool the building
in the summer. To allow the ground water cooling system achieve comfortable internal
temperatures, the cooling load was minimised via solar shading, including fixed external
shades and vegetation. Hornbeam trees are located close to the external perimeter of the
building on the south and south – west sides. In the time, branches of the neighbouring
trees will be trained to grow together to form a high level hedge, blocking the high
summer sun but allowing views out through the trunks below. The use of species, which
loses its leaves in winter, allows the building to benefit from the heat of the low winter
sun.
To minimise energy associated with the construction process, demolition waste was kept
on site and reused. Old concrete was crushed on site and used as hard-core under the
building and in paths; some of the waste timber was retained for use in the biomass
boiler. Reclaimed railway sleepers were used to make external steps.

59
3.3 Renewable Energy Strategy
Renewable energy technologies used on the site are given in Table 23
Table 23 Renewable Energy Technologies Used in Beaufort Court Case Study
Technology Details
Solar Array
• There are 22 solar collectors each of 6.88 m2 giving a total 151.36 m2.
• 7 out of the 22 panel are combined PV and solar thermal panels (PVT). The remaining are
conventional solar thermal panels. The area of integrated PV cells is 40 m2 (net).
• The panels are connected in parallel. The array is south facing, with tilt of 30 degrees.
• The thermal elements are by Zen Solar. The thermal peak power is approximately 100 kW.
The predicted annual output is 40 MWh, of which 16 MWh is expected to be used directly to
heat the building and the remaining 24 MWh is expected to be used via the seasonal heat store.
• The PV elements are by Shell Solar with Sunnyboy investors. The nominal electrical peak
power is 5.2 kW. The predicted annual output is 3.2 MWh.
Wind Turbine
The turbine is rated at 225 kW. It is a second hand Vestas V29 with a hub height of 36 m and
rotor diameter of 29 m. It is expected to deliver 250 MWh a year, compared to the target
building electrical demand of 115 MWh a year.
Biomass
• The area planted is hectares (50,000 m2). The expected yield is about 60 oven dried tonnes per
year.
• Miscanthus has a net calorific value of 17 MJ/kg on a dry basis, equating to 280 MWh a year.
• The 100 kW boilers are made by Talbott. With a boiler efficiency of 80-85%, 220-240 MWh
per year can be delivered to the building, more than meeting the predicted 200 MWh annual
heating demand.
Seasonal heat
store
• The store consists of approximately 1000 m3 of water in the ground. The excavated hole is 6 m
deep, tapering from a 20 m square at the surface to an 8 m square at the base. It is insulated on
top with 500 mm of polystyrene. The sides and base are not insulated. The liner is a Sarnafil
plastic membrane.
• Over a 6 month period approximately 50% of the stored heat is expected to be lost.
• If the temperature of 1000 m3 water is raised by 20 oC, 23 MWh of heat can be stored.
Borehole
• It is 75 m deep and 200 mm diameter. The pump delivers a maximum of 18 m3 per hour, and
has variable speed control via an inverter drive. Water is extracted at 12 oC. With a 5 oC
temperature rise, this can be delivering 105 kW of cooling.
• The borehole is licensed for the extraction of up to 24,300 m3 per year, which can deliver up to
140 MWh of cooling.

60
3.4 Energy Targets and Initial Performance
The building has been occupied by RES since November 2003. Over the first year of
operation, all site electrical loads were met by on-site renewable generation (wind and
PV). Commissioning of the seasonal heat store was completed late summer 2004 and the
biomass boiler was installed at the end of 2004. At the date of publication, the heating
aspect of the carbon neutral target had not yet been tested.
In the first year of the operation, the annual heating consumption was double the
predicted amount. The target was based on the Energy Efficient Office of the Future
guide and was ambitious. The increased heating consumption is due to a number of
factors related to building envelope and they were sorted out. Also, the operating hours
and the internal temperature set points were higher than predicted.
The electrical consumption has exceeded the design target by 65% in the first year. Two
reasons for this are that the operating hours have been longer than anticipated and
equipment is not always turned off at night.
To conclude, achieving a building with low energy consumption requires attention to
detail in both design and construction, and an understanding by the occupants of how the
building works. In this context, careful selection of the most suitable modelling tools and
thus successful feasibility studies is crucial as well as selection of correct LZCT.

61
CHAPTER 4: PROJECT OBJECTIVES
The aims of this project are to critically assess how to take an existing building and
make a retrofit design of a sustainable ECO-Office and provide recommendations for
further development where appropriate. This goal is attained through the minimisation
of adverse social, environmental and economical impacts by being efficient to operate,
effective in their use of resources, and protecting occupant health and the wider
environment during construction, operation, re-use and at the end of their useful life. To
achieve this it is necessary to consider ECO-Office standard(s) and improving energy
efficiency thus reduction of costs and increasing positive environmental effects in the
design process of office buildings while applying low or zero carbon
technology/technologies.
A general procedure for determining the most appropriate energy efficient measures and
low carbon technologies are set out in Chapter 5. Then this methodology is applied in
Chapter 6 to a case study in order to evaluate the procedure.

62
CHAPTER 5: METHODOLOGY
This chapter describes the thesis methodology used throughout the study. It thus far has
endeavoured to identify the key factors as well as the special requirements associated
with the successful achievement of the retrofit design process of a sustainable ECO-
Office. To provide high-level consideration on those key factors methodology has been
developed in the form of a step-by-step process to guide the design. In the proceeding
chapters this is exemplified through the application of the methodology to a case study
example.
The backbone of this study is unambiguously theoretical and practical analysis. The
thesis process that provided the basis for a detailed case study development, including a
step-by-step description of design is presented below.
From the analysis of an ECO-Office case study, research and previous experiences’ key
factors responsible for the success of the implemented energy measures are identified
and main stages are given in the flow chart. The following flow chart outlines the
recommended methodology for achieving retrofit design in sustainable office buildings
and should be applied as a general approach to optimise retrofit design of ECO-Offices.

63
Retrofit Design of a Sustainable ECO-Office
Pre Selection of low or zero carbon technology
Selection of Modelling Tool
Data Collection
Historical Data
Observations Research Measurement
COST GHG Emission
Energy Saving
Energy Efficiency
Building Envelope
Ventilation Lighting Appliances
Selection of Low and Zero Carbon Technologies
Heating Power
Figure 2 Methodology of Retrofit Design of a Sustainable ECO-Office

64
Data Collection
The data analysis includes three major subjects which are energy efficiency, cost
analysis and emission analysis. Data collection plays a crucial role in data analysis for
certain results. After the selection of a modelling tool, data is gathered by using various
methods; historical data usage, observations, measurements and research activities.
Historical data includes documents, archival records. Observations are made at the time
of visit and from the responses made by office stuff interviews. It also consists of expert
advice as well as direct observations. Measurements refer the data gained by doing
measurements. Furthermore, research activities cover online info, library resources and,
previous case studies are identified.
Pre-Selection of Low or Zero Carbon Technology Integration
First step is pre-selection of the most suitable potential low and zero carbon technology /
technologies in order to match different special patterns. For this, various retrofit design
options are evaluated by comparing their technology and planning considerations and
special requirements against to heat & power demand and corresponding capabilities of
existing office.
Selection of Modelling Tools
Several different modelling tools help to estimate heat & power generation and analyses
match between renewable energy system supply and demand. Comparison is the best
method for selecting the most suitable modelling tool in feasibility analysis. In this
context, by considering the user friendly interface and suitability are the main criteria.

65
Energy Efficiency Analysis
The viability of energy efficiency improvements in an office building can be
investigated by various modelling tools. Building envelope, electrical equipments and
lighting analysis which are provide necessary for retrofit design are considered. Whole
facilities and/or sub-systems and rooms are modelled individually.
Structure of the Energy Efficiency Measures is given in Figure 3.
Figure 3 Energy Efficiency Measurement Structure Energy Efficiency Measurement analysis involves five steps. Having understood the use
of energy in the project, we now attempt to make improvements. So for this, the usage of
the end product, the efficiency of devices consuming the fuel is minimised and the
supply of fuel is optimised.

66
Firstly, the types of fuels used in the building as well as the associated fuel rates, or per
unit costs for the fuels are identified. Also, the operating schedules are determined.
Secondly, the facility characteristics are specified. The equipment that converts fuel into
something more useful are identified and characterised.
One of the most important processes is determining and monitoring of the heat & energy
demand profile in order to identify following actions which are energy reduction and
increasing positive environmental impacts while selecting the most appropriate low and
zero carbon technology for ECO-Office. Therefore; thirdly, historical energy bills are
verified.
Fourth, financial parameters entered so that a summary of the financial viability of the
project are provided.
Selection of Low and Zero Carbon Technologies
The most suitable low and zero carbon technologies are selected considering the analysis
results of the energy saving, GHG emission reduction and costs.
Power
A wide range of renewable and conventional fuels, including wind, hydro, solar, landfill
gas, biomass, biogases, biodiesel, biogas, hydrogen, natural gas, oil/diesel, coal,
municipal waste, etc. can be evaluated in various types of Power Projects (Figure 4) in
order to provide power.
Figure 4 Power Projects

67
With the aid of modelling tools a wide variety of projects ranging from large scale multi-
array central power plants, to distributed power systems located on commercial
buildings to remote wind-PV-genset hybrid power supplies, to stand-alone battery
storage systems for lighting can be modelled. Climate databases play vital role in this
analysis.
Heating
Modelling tools can be used to evaluate various types of Heating Projects (Figure 5).
The toll can be used to assess projects incorporating a variety of heating equipment, all
working under various operating conditions (base load, intermediate load and/or peak
load), for any one or combination of the following applications: single buildings or
multiple buildings; industrial processes; communities; district heating; crop drying, etc.
Further, it permits analysis with a wide range of renewable and conventional (fossil)
fuels (which can be used in parallel), including landfill gas, biomass, biodiesel, biogas,
hydrogen, natural gas, oil/diesel, coal, municipal waste, etc.
Figure 5 Heating Projects
Steps of heating projects are;
• Define Loads (Heating, cooling and power) + heating/cooling degree days
for space heating/cooling
• Base case characteristics + costs (heating, cooling)
• Proposed case characteristics + costs (heating, cooling)

68
• Operating Strategy
• Summary (energy)
Cost Analysis
A part of the cost analysis is used to estimate costs associated with the energy efficiency
and selection of low and zero carbon technologies. These costs are addressed from the
initial or investment cost standpoint, as well as from the annual or recurring cost
standpoint. The cost analysis section aims to identify which costs are initial costs, annual
costs, annual savings and periodic costs as estimated by investigation as well as the
applications’ pay-back periods.
GHG Emission Analysis
Emission Analysis contains main five sections Settings, Base Case electricity & heating
system, Base Case system Green House Gas (GHG) summary, Proposed Case electricity
& heating system GHG summary and GHG emission reduction summary. The aim of
the analysis is to estimate the greenhouse gas emission reduction potential of the
proposed project. Results can be calculated as equivalent tonnes of CO2 avoided per
annum.
Energy Saving Analysis
Energy Saving Analysis contains the information for base case and the proposed case
facilities and summarises the energy use for heating, cooling and electricity.
For the base case and the proposed case facilities, the analysis summarises the energy
saved, which is the difference between the base case and the proposed case energy use,
in energy units as well as a percentage of the base case energy use (Energy saved - %),
for heating, cooling and electricity.

69
CHAPTER 6: CASE STUDY-Overlee House & Lodge
In this thesis, Overlee House & Lodge building is selected as a case study through
request of East Renfrewshire Council. Reasons of this selection; data availability, range
of low or zero carbon technology options’ applicability as well as building type and
characteristics of Overlee House & Lodge typify a good non-domestic building example
in a suburban environment.
6.1 Location and Characteristics
The case study is modelled based on a bungalow type of office building Overlee House
& Lodge, shown in Figure 6, The office belongs to East Renfrewshire Council, is
located in Clarkston, Scotland and was built between 1982-1990. The challenge is the
retrofit design of a modern sustainable ECO-Office from an existing building.
The brief includes minimising the energy consumption of the building and associate
with the range of low and zero carbon technologies into the site.

70
Figure 6 Overlee House & Lodge
The site formerly used as a house was converted to an office building. The overall height
of the building is 2.5 m with the total area of 93.6 m2 for three people. The building has
one main office (26.98 m2 areas, 24.35 m perimeter), a kitchen (8.7 m2 areas, 11.9 m
perimeter), entrance (1.75 m2 areas, 0.53 m perimeter), an interview room (12.5 m2
areas, 14 m perimeter), a rear room (11.9 m2 areas, 13.8 m perimeter), toilet & tank room
(4.4 m2 areas, 0.84 m perimeter) and a hall (7.41 m2 areas, 11.2 m perimeter) as seen
Figure 7.

71
Figure 7 Overlee House & Lodge Map
Due to the location of the building, noise is not an important consideration for outside as
well as inside. For this reason, natural ventilation is felt to be appropriate.

72
The building is not well daylit, especially during the cloudy day as measured at 11.00
am. Therefore, artificial lighting is recommended in order to meet minimum design level
of 300-500 lux. Detailed information regarding to lighting will be given in energy
efficient section.
Trees as shown in Figure 4 are located closed to the external perimeter of the building
on the south and south-west sides. Solar panels should be located on neighbouring roof
because trees block the high sun power to Overlee House & Lodge office building.
6.2 Heat & Energy Demand
Electricity is the only fuel for Overlee House & Lodge so electricity bills include heating
consumptions as well. Historical electricity bills show that the building total electricity
load is 13676 kWh / yr; 7500 kWh / yr for power, 6055 kWh / yr for heating and 2%
(122 kWh) of heating used for domestic hot water. Summer electricity bills were
compared to find out approximate heating consumption. Besides, according to the
RETScreen weather forecast historical data, Overlee House Lodge heating consumption
was defined. Monthly heat and electricity consumption can be seen in Table 24 as well
as historical weather forecast data of Glasgow.

73
Table 24 Monthly Heats and Power Consumption of Overlee House & Lodge
Months Air Temperature Power
Consumption (kWh)
Heat Consumption Total Electricity
Consumption (kWh)
January 3.9 625 1075 1760
February 4.3 625 1007 1632
March 5.7 625 804 1429
April 7.5 625 445 1070
May 10.6 625 225 850
June 13.0 625 0 625
July 15.0 625 0 625
August 14.5 625 0 625
September 12.1 625 265 890
October 9.5 625 675 1300
November 6.3 625 704 1329
December 4.4 625 976 1601
It was also assumed that domestic hot water usage for the office is 10% of heating
demand. Therefore, hot water consumption of Overlee House & Lodge is about 618
kWh / yr.
6.3 Pre-selection of Low or Zero Carbon Technology Applications
One of the key driving forces behind determining the suitability of different renewable
generating schemes is matching the supply and demand energy profiles effectively. The
different quantities and qualities of low and zero carbon energy resource at each site
should be fully investigated to discover which combination meets the need as fully as
possible.
In the following, as mentioned in section 2.7 of this thesis pre-selection of primary low
and zero carbon technology (technologies) for Overlee House & Lodge Case is
exemplified. This method may also help to identify the technology (technologies) that
might be suitable to generate heat and/or electricity for any office building which
matches the same data as displayed on Table 25. Furthermore investigation and various
combinations can be done at Energy Saving Trust web page.

74
Office areas use fluorescent tube fittings with dimmable high frequency gear. A
combined presence of a detector and photocell integrated into each fitting allows the
electric lights to be on only when the room is occupied and when daylight levels are
inadequate. As the internal partitioning of the office spaces is flexible, the lighting
controls are programmable such that luminaries in the same room can be switched
together. The individual photocells allow each illuminaire to dim by an appropriate
amount to meet a minimum design level 300 lux.
As a low energy alternative to air conditioning, ground water is used to cool the building
in the summer. To allow the ground water cooling system achieve comfortable internal
temperatures, the cooling load was minimised via solar shading, including fixed external
shades and vegetation. Hornbeam trees are located close to the external perimeter of the
building on the south and south – west sides. In the time, branches of the neighbouring
trees will be trained to grow together to form a high level hedge, blocking the high
summer sun but allowing views out through the trunks below. The use of species, which
loses its leaves in winter, allows the building to benefit from the heat of the low winter
sun.
To minimise energy associated with the construction process, demolition waste was kept
on site and reused. Old concrete was crushed on site and used as hard-core under the
building and in paths; some of the waste timber was retained for use in the biomass
boiler. Reclaimed railway sleepers were used to make external steps.

75
Table 25 Pre-selecting of LZCT for Overlee House & Lodge
General Question Answer
What type of property do you live in? Bungalow
How old is your property? Built between 1982-1990
How many rooms do you have? 2 rooms and one main office room
What is your main heating fuel? Electricity
Inner City / Town
As your property is in an inner city area it is unlikely that a wind turbine will be a suitable technology.
Yes
Suitable
Yes Suitable
What type of location
is your property
in? Suburban
Rural Coastal
Do you own an area of open ground with an unobstructed flow of wind, which could be used to install a mast-mounted wind turbine
No
Do you have an
unobstructed flow of wind
to a high point on
your property,
where you could install a building-mounted
wind turbine?
No
As you do not have an
unobstructed flow of
wind, it is unlikely that
a wind turbine will be a suitable technology
for your property.
Yes As Permission needed contact local council
Wind power
Is planning permission
needed? No Suitable
Less than 5m2
As you have less than 5m2 of unshaded space to site solar
electricity panels, it is unlikely that this technology is suitable
for your property.
5-10 m2 Suitable
10-20 m2 Suitable
What is the area of
the unshaded
space?
20 m2 Suitable
Yes Suitable
Yes
Do you have
room for a hot water
tank? No
As you do not have space for a hot water tank, a solar water heating system is probably not suitable
for your property.
Solar hot water
or Photovoltaic
Do you have an
unshaded flat roof,
or an unshaded pitched
roof facing east to west
through south?
No
Do you have
access to an
What is the area of the
unshaded Less than
5m2 As you have less than 5m2 of unshaded space to site solar electricity panels, it is unlikely

76
that this technology is suitable for your
property. 5-10 m2 Suitable
10-20 m2 Suitable
space?
20 m2 Suitable
Yes Suitable
Yes
Do you have
room for a hot water tank?
No
As you do not have space for a hot water tank, a solar water heating system is
probably not suitable for your property.
unshaded space
around your
property to site
panels?
No As you do not have access to an unshaded space
to install the panels, it is unlikely that solar electricity will be suitable for your property.
Yes As Permission needed contact local council Is planning permission
needed? No Suitable
Yes Suitable
Small scale hydro power
Do you have
access rights to a
nearby stream or
river?
No As you have don't have access rights to a nearby stream or river,
then a hydroelectricity system probably isn't suitable for your property.
Yes Suitable
Yes Suitable
Yes
Do you have enough room to install a wood fuelled boiler,
leaving enough space around it to add the fuel?
No
Do you have
room to install a wood-
burning stove and
store the
fuel?
No
As you do not have sufficient space to install a wood fuelled boiler, this type of system is
probably not suitable for your property.
Yes Suitable
Do you have
enough room to
store your wood fuel between
deliveries?
No
Do you have room to install
a wood-burning stove and store
the fuel? No
As you do not have enough space to install a wood burning boiler/wood burning stove and store the fuel, this system is probably not suitable for your property.
Yes Suitable Is there a suitable
chimney?
No
As you do not have a suitable chimney, this system is probably not suitable for your property.
Yes
As your property in the smokeless zone, this system is probably not suitable
Biomass (wood
burning boiler/wood
burning stove)
Is the
building in a
smokeless zone?
No Suitable

77
Yes As Permission needed contact local council Is
planning permission
needed?
No Suitable
Yes Suitable
Yes Suitable
Yes
Do you have space within your
home to install the
heat pump unit?
No
Do you have space
outside your home to site an air source heat
pump unit?
No
As you do not have space outside your property to site an Air source heat pump unit, this heating system is probably not
suitable for your property.
Yes Suitable
Yes Suitable
Yes
Do you have space within your home
to install
the heat
pump unit?
No
Do you have space
outside your home to site an air source heat
pump unit?
No
As you do not have access to enough space
to install a ground source heat pump or air source heat pump unit, this type of system is
probably not suitable for your property.
Yes Suitable
Do you own an area of open
ground large
enough to dig a
trench for a
horizontal ground loop or slinky coil?
No
Do you own an area of
land where you
could dig boreholes
for vertical ground loops?
No
Do you have space
outside your home to site an air source heat
pump unit?
No
As you do not have access to enough space to install a ground source heat pump unit,
this type of system is probably not suitable for your property.
Yes As Permission needed contact local council
Heat pumps (Ground
source heat pump, Air source heat
pump)
Is planning permission
needed?
No Suitable
Yes
Suitable
Is there a suitable place to put it? No As you do not have access to enough space to install a CHP unit, this
type of system is probably not suitable for your property.
CHP
Is planning
As Permission needed contact local council

78
Yes permission needed?
No Suitable
Potentially suitable technologies are;
1. Ground source heat pump
2. Air source heat pump
3. Solar Electricity Panel
4. Solar Water Heating
5. Wind turbines
6. CHP
Less suitable technologies are;
1. Wood fuelled boiler
2. Wood burning stove
3. Hydroelectricity
The second stage of the pre-selection step is decreasing the number of technologies to
three. In this context, deeply analysis of the first fourth-option of potentially suitable
technologies is very worthy go through.
As the fifth-option in order to find out whether the property may be suitable for a
domestic scale wind turbine The Energy Saving Trust has completed the field trial of
domestic scale wind turbines to date. The aim of the trials is to provide UK home
owners with an indication of whether they would be able to generate electricity from the
wind. The data from these trials has been used as the basis for the Domestic Wind Speed
Prediction tool [28]. Post code should be entered and should be indicated whether the
property is an urban, suburban or rural area and click 'calculate wind speed'. Since
Overlee House & Lodge is in a suburban area predicted wind speed for G76 8NL is 2.75
metres per second. It shows that a domestic small scale wind turbine would not be
suitable for this office building, as the average wind speed in the area is below 5 m per
second.

79
Regarding to the sixth-option Combined Heat and Power (CHP) is only viable if both
the heating demand and the electrical demand of the building can match the output of the
CHP generator. In most cases as well as Overlee House & Lodge Case Study for
existing buildings this balance is not achievable. In winter the heating demand will
almost certainly exceed the electrical demand and in summer the reverse will occur.
Therefore, remaining potentially suitable technologies for the Overlee Case Study are;
1. Ground source heat pump
2. Air source heat pump
3. Solar Electricity Panel
4. Solar Water Heating
6.4 Results and Discussion
RETScreen analysis results of energy efficiency and low and zero carbon technologies
regarding to power and heating supply are presented in this section.
Base Case illustrates the actual data belongings to the case study, an office building, in
this thesis.
Proposed Case suggests alternative and/or better options for Base Case. It is identified
considering the Base Case data as well as options which provide best energy efficiency
measures, power, heating and cooling individually and combined heat and power
simulations of different options for the property by using RETScreen.
As a result of analysis, some of the payback periods are shown as (-). This indicates that
the money never will be paid back.
6.4.1 Energy Efficiency Analysis
Energy efficiency analysis focuses on lighting, office appliance and building envelope in
this thesis.
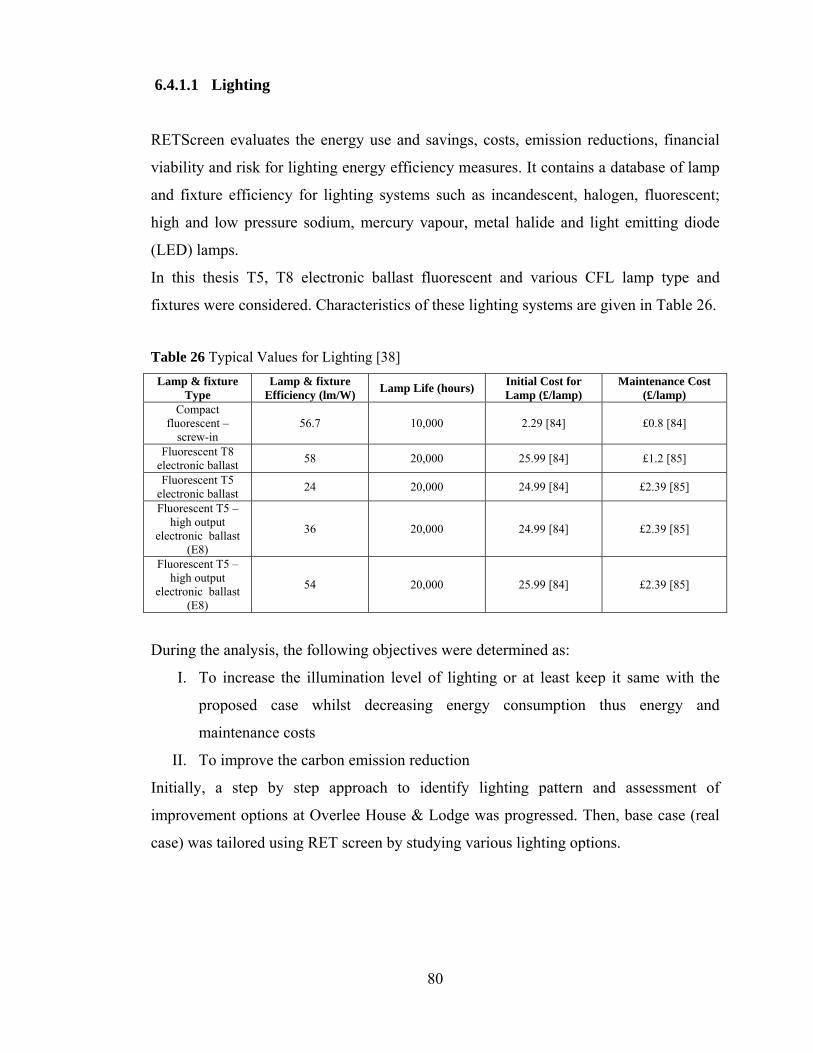
80
6.4.1.1 Lighting
RETScreen evaluates the energy use and savings, costs, emission reductions, financial
viability and risk for lighting energy efficiency measures. It contains a database of lamp
and fixture efficiency for lighting systems such as incandescent, halogen, fluorescent;
high and low pressure sodium, mercury vapour, metal halide and light emitting diode
(LED) lamps.
In this thesis T5, T8 electronic ballast fluorescent and various CFL lamp type and
fixtures were considered. Characteristics of these lighting systems are given in Table 26.
Table 26 Typical Values for Lighting [38] Lamp & fixture
Type Lamp & fixture
Efficiency (lm/W) Lamp Life (hours) Initial Cost for Lamp (£/lamp)
Maintenance Cost (£/lamp)
Compact fluorescent –
screw-in 56.7 10,000 2.29 [84] £0.8 [84]
Fluorescent T8 electronic ballast 58 20,000 25.99 [84] £1.2 [85]
Fluorescent T5 electronic ballast 24 20,000 24.99 [84] £2.39 [85]
Fluorescent T5 – high output
electronic ballast (E8)
36 20,000 24.99 [84] £2.39 [85]
Fluorescent T5 – high output
electronic ballast (E8)
54 20,000 25.99 [84] £2.39 [85]
During the analysis, the following objectives were determined as:
I. To increase the illumination level of lighting or at least keep it same with the
proposed case whilst decreasing energy consumption thus energy and
maintenance costs
II. To improve the carbon emission reduction
Initially, a step by step approach to identify lighting pattern and assessment of
improvement options at Overlee House & Lodge was progressed. Then, base case (real
case) was tailored using RET screen by studying various lighting options.

81
Lighting Base Case Identification
The lighting system elements are used in the office and their operating times are listed: 2
unit 58 W T8 electronic ballast fluorescents are used in the main office. Kitchen,
hallway, rear room and an interview room are lightened by 20 W compact florescence
lambs (front) at working level. 20 h/d for main office and 1 h/d for office rear and
interview room operating hours are identified as operating hours.
With the aid of a lux meter, Hagner EC1-X, illumination levels at main office room,
kitchen, hallway, rear room and the interview room at working level were measured as
main office-200 lux, interview room-150 lux and rare room-70 lux. Illumination levels
were documented as daytime lux values alongside the number of lamps “ON” during
measurement. These values were compared with standards
Overlee House & Lodge Main Office Lighting Base Case data was patterned on
according to these steps as presented in Table 27.
Table 27 Overlee House & Lodge Main Office Lighting Base Case Pattern Lighting
& Fixture Type
Electrical Load (W)
Operating Hours
Fixture Number
Illumination level (Lux)
Energy (GJ/year)
Emission (tCO2)
Fuel Consumption
(MWh)
Fuel Cost (£/year)
T8 magnetic
ballast 58 20 2 200 3 0.4 0.85 85
Base Case- Rare of Overlee House & Lodge lighting data was presented in Table 28.
Interview room has the same pattern with rare room.
Table 28 Overlee House & Lodge Rare Room and/or Interview Room Lighting Proposed
Lighting Patterns
Room
Lighting &
Fixture Type
Electrical Load (W)
Operating Hours
Fixture Number
Illumination level (Lux)
Energy (GJ/year)
Emission (tCO2)
Fuel Consumption
(MWh)
Fuel Cost
(£/year)
Interview CFL 20 3 1 150 <0.5 ∼0.0 0.02 2
Rear CFL 20 3 1 150 <0.5 ∼0.0 0.02 2

82
Lighting improvement options were identified based on assessments and evaluations by
RET Screen as proposed;
Lighting Proposed Case Identification
High-low pressure sodium, halogens, LEDs, mercury vapour and metal halides were
taken out of picture in the RETScreen analysis because of their high initial and
maintenance costs as well as their low efficiency. When these three parameters were
considered, electronic ballast T5 fluoresce posses notable advantages than other lighting
options displayed in Table 29 for Overlee House & Lodge, thus they were evaluated in
the RETscreen. Replacement of T8 electronic ballasts by T5 electronic ballast
florescence was analysed in terms of cost, energy reduction and carbon reduction.
Table 29 Overlee House & Lodge Main Office Proposed Case T5 Lamps Lighting Patterns Lighting & Fixture
Type
Electrical Load (W)
Fixture Number
Illumination Level (lux)
Energy saved (%)
Emission Reduction
(tCO2)
Initial Cost (£)
Maintenance cost/year (£)
reduction
Fuel Cost
(£/year)
* Total Saving (£/year)
T5 Electronic
Ballast 24 8 395 -65.5 -0.3 200 -16.72 140 -72
T5 Electronic
Ballast 36 5 330 -55.2 -0.2 125 -9.55 131 -56
T5 Electronic
Ballast 54 3 320 -50.0 -0.2 75 -4.77 127 -47
T5 Electronic
Ballast 80 2 300 -37.9 -0.2 52 -2.38 117 -34
* Total saving equals to maintenance cost and fuel cost figures differences between base case and proposed case.
Comparison of various possibilities in order to replace 2 unit 58 W T8 electronic ballast
florescence lambs by T5 electronic ballast fluoresces are given in Table 29.
Table 29 shows that there is no better T5 lamp replacement recommendation to Overlee
House & Lodge in this current situation in terms of environmental and financial point of
view. On the other hand, current lighting system of main office is not sufficient with the
level of 200 lux in order to provide required level of illumination level of 300-500 lux

83
for office buildings. In this sense, current level should improve, for instance replacement
of T8 electronic ballast 58 W to T5 electronic ballast 80 W lamps seems the most
convenient option comparing with the others.
Since the nominal operating hours, 3 h/d were identified in kitchen, hallway, rear room
and an interview room lightened by 20 W CFLs, replacements are not profitable
environmental and financial respects. Existing low power CFLs are most suitable lamp
types for this kind of applications. Because CFLs’ maintenance cost are low and
efficiency level relatively higher than incandescent bulbs which are often preferred for
applications of short time usage. However, same situation, inefficient illumination level
(150 lux in interview room, 70 lux in rear room), occurs in these rooms, therefore
improvements are needed.
6.4.1.2 Appliances
In this section, equipment energy efficiency measures are evaluated by RETScreen. The
software is enabled to model replacement of various appliances (e.g. dishwashers,
refrigerators, computers, monitors, printers, scanners and photocopiers, etc.) by energy-
efficient options in Overlee House & Lodge. The model also calculates the cross-effects
of other energy efficiency measures employed in the facility (e.g. heating and cooling
impact of installing energy-efficient computers). Finally, the annual electricity used of
various electricity loads such as computers, using the duty cycle and the operating hours
of the appliance or electrical equipment, can be calculated.
Appliances Base Case Identification
Electrical equipments in the Overlee House & Lodge were binned in the three
categories; (a) Office Equipments, (b) Kitchen and (c) Other. Quantities of the each
equipment, their operating hours and electrical loads were the parameters studied in the
model.

84
The duty cycle (on/off cycling) was another input for analysis. It is defined described as
the percentage of time that the load runs during operating hours for each appliance or
equipment. Typical values are in the range from 30% to 100%. Some of the appliances
can be entered as 100% if the load operates continuously during operating hours. Base
case electrical equipment list and electrical loads are presented in Table 30.
Table 30 Overlee House & Lodge Base Case Appliances Patterns
Description Quantity Operating Hours Electrical load (kW) Duty Cycle (%)
Office Equipments
Computer 3 10 0.4 75
Computer Monitor 3 10 0.2 75
MDF 1 0.25 0.33 100
Printer 1 0.25 0.13 100
Computer Router 1 24 0.02 100
Kitchen
Refrigerator (fridge
freezer) 1 24 0.061 30
Cooker, oven &
grill 1 0.25 7.9 100
Washing Machine 1 0.3 2.2 100
Toaster 1 0.25 1.1 100
Microwave Oven 1 0.25 1 100
Kettle 1 0.25 2 100
Other
Office Radio 1 10 0.012 100
Vacuum Cleaner 1 0.25 1.6 100
Based on careful assessments and evaluations of electrical equipment, improvements
were identified, which could include followings.

85
Appliances Proposed Case Identification
It was identified that the most energy efficient products were selected among ENERGY
STAR products [42], [39], [40], [43], [44], [86], [87], [88], [89] in Overlee House &
Lodge (Table 30). However, in order to look into better options HP 6110 and HP
LaserJet P 1160 (Table 31) were selected and analysed in RETScreen. According to the
ENEGY STAR product lists, the market leader of office equipments producer Hewlett
Packard company’s products [44] were considered for proposed case and related
analysis was carried out. Thus HP CLJ CM1312 MFP and HP LaserJet P 1006 are
proposed respectively (Table 31).
Table 31 Overlee House & Lodge Base Case Printers Patterns
Description
Operating Electrical load (kW)
Sleep Mode
Electrical load (kW)
Off Mode
Electrical load (kW)
Cartridges
Cartridges Duty cycle
pages
Cartridges Price
(£)
Maintenance Cost for Overlee House &
Lodge £
HP 6110 0.06 n/a n/a
Black(HP 56 Black Inkjet
Print Cartridge) Color (HP 57
Tri-color Inkjet Print Cartridge)
Black (450) Color (400) [90]
Black (16) Color (17)
[91]
Black (96) Color (102)
HP LaserJet P 1160 0.34 [92] 0.004
[92] 0.001 [92]
Black OEM: Q5949A 2500 [93] £51 [93] 51
Table 32 Overlee House & Lodge Proposed Case-Printers Patterns
Description
Operating Electrical load (kW)
Sleep Mode
Electrical load (kW)
Off Mode
Electrical load (kW)
Cartridges
Printer Initial Cost
£
Cartridges Duty cycle
pages
Cartridges Price
(£)
Maintenance Cost for Overlee House &
Lodge £
CLJ CM1312
MFP
0.31 [43], [44]
0.0071 [43], [44] n/a
Black (HP CB540A) Color (HP CB543a)
[94]
246 [95]
Black (2200) Color
(1400) [94]
Black (57) Color (54)
[94]
Black (57) Color (108)
HP LaserJet P 1006
0.335 [43], [44] 0.003 0.0006
Black (HP CB435A)
[96]
104 [97]
1500 [96]
49 [96] 98

86
During the investigation operational electrical load, sleep mode and off mode as well as
maintenance costs were considered. It is known that approximately 200 pages are
printed monthly in Overlee House & Lodge prints. Thus, related maintenance costs was
calculated based on cartridge prices and changing cartridge costs as seen Table 31 for
Base Case and Table 32 for Proposed Case.
Table 33 presents the comparison between Non-ENERGY STAR products and Base
Case products are used in the office in terms of electricity, energy, GHG emission and
annual savings and income.
Table 33 RETScreen Analysis of Non-ENERGY STAR products and Base Case Products
Comparison
Description Fuel Consumption kWh
Energy GJ
GHG Emission (tCO2)
Annual Savings and Income
(£) Non-ENERGY STAR Products 9900 36 4.6 993
Base Case 6800 24 3.2 679
The step is analysing the electricity, energy, GHG emission and annual savings results in
terms of operating mode, sleep mode and off mode of proposed products. The
comparison between Base Case and Proposed Case based on RETScreen analysis is
shown Table 34.

87
Table 34 RETScreen Analysis of Overlee House & Lodge Base Cases and Proposed Case Comparison
Description Fuel
Consumption kWh
Energy GJ
Energy Saved (%)
GHG Emission (tCO2)
Total Annual Cost (£)
Pay Back Period (yr)
Operating Mode
Base Case 6800 24 - 3.2 679
Proposed Case 6800 25 -0.3 3.2 695 -21.6
Sleep Mode
Base Case 6800 24 - 3.2 679
Proposed Case 6800 24 - 3.1 689 -33.5
Off Mode
Base Case 6800 24 - 3.1 675
Proposed Case 6800 24 - 3.1 689 -25.4
According to the analysis, appliances in the office were chosen as best options.
Therefore, there is no need to change any equipments environmental and financial point
of view.
6.4.1.3 Building Envelope
RETScreen Software Building Envelope Model can be used worldwide to evaluate the
energy use and savings, costs, emission reductions, financial viability and risk for
building envelope energy efficiency measures. The software models a wide variety of
projects ranging from energy efficient window use in commercial buildings to complete
energy efficient construction practices on the entire building envelope. In addition, the
effective thermal resistance (R-value) or thermal conductance (U-value) of a specific
building envelope assembly can be calculated using an optional Building envelope
properties tool and a detailed Window properties tool is provided to determine the
effective window properties (i.e. area, U-value and solar heat gain coefficient) and
individual window costs.

88
In this part of the thesis, wall-roof and floor insulation, window and door properties
were evaluated in RETScreen and reported. Firstly these parameters were progressed
separately and finally total energy performance numbers were given at the end of this
section.
Door and Window Insulation
The heat from housing is lost through windows and doors. In properties with single
glazing, this proportion is likely to be much higher, even accounting for more heat loss
than the building fabric. A single-glazed window allows twice as much heat to escape as
the same area of un-insulated wall. Even the most energy-efficient windows will allow
six times as much heat loss as a well-insulated wall. Hence, it is very cost effective when
replacing windows to specify the highest performance that can be afforded. This is
because high-performance windows can improve comfort and reduce condensation.
Specifying low e coatings to glass can make a relatively large improvement to
performance for a small increase in cost.
RETScreen analysis use heat transfer coefficient “U” evaluated with window or door
area depending on direction. Screen shoot from RETScreen used in window and door
analysis can be seen in Figure 8. Solar heat gain coefficients were calculated using tools
section of the software.

89
Figure 8 RETScreen Energy Performance Analyses of Windows
Overlee House & Lodge has six newly installed double glazed-wood frame windows
with average U value of 2.8 W/m2 C. Total area of windows is 9.82 m2 (4.81 m2,
0.87 m2, and 4.24 m2 with the orientation of North, East and South respectively).
Single glazed-aluminium frame option with a highest U value 7.2 W / m2 C and triple
glazed low emission-vinyl frame option with lowest U value of 1.24 W/m2 C were
compared with base-present case of office.
Schematic comparison of energy performance of office with three different window
selections is given in Table 35.
Switching the single glazed windows to double or triple glazed options creates
differences in terms of energy performance. Single glazed windows increases energy use
in heating almost by about 50%. It also increases carbon emission significantly.
Another better option for Overlee House & Lodge could be by using triple glazed low
emission vinyl frame windows. On the other hand, 18.4% energy saving, £17 fuel cost
saving, large initial cost and long payback period made this option economically
unbeneficial. It can be easily recommended that keeping current situation of windows in

90
Overlee House & Lodge but with better draft proofing on windows to keep performance
at the highest level.
Table 35 RETScreen Analysis-Energy Performance of Different Window Options of Overlee House & Lodge
Base Case-Double Glazed Wood Frame, U value 2.8
W / m2 C
Case 2-Single Glazed Aluminium Frame, U value
7.1 W / m2 C
Case 3-Triple Glazed Low e, Vinyl Frame, U
value 1.24 W / m2 C Energy used for
Heating/year (GJ) 3 5 2.44
Energy Saving for Heating (%) - −46 18.4
Fuel Consumption/year-
(kWh) 900 1130 700
Fuel Cost / year (£) 90 113 73
Carbon emission (tCO2) 0.4 0.7 0.3
Initial Cost £ - Not considered 1000
Payback years - Not considered 60.4
Outer doors heat transfer U values change between 3.5 and 2.0 depending on window
area and U values of windows on the door as well as door material. Overlee House &
Lodge has two outer wooden doors with a single glazed window. The measurements are
3 m2 window area on the main gate doors and 2.5 m2 window area on kitchen door.
Total U values for doors were calculated as 2.6 W/m2C by RETScreen. Table 36
displays energy performance changes if there is a replacement of a lower U value of 2.0
W/ m2 C door.
Overlee House & Lodge exterior doors fulfil certain standards. Changing them with best
energy performance doors does not create significant variation in the office energy
performance. It is recommended that base case should be kept considering high initial
costs and long payback period.

91
Table 36 RETScreen Analysis-Energy Performance of Different Door Options of Overlee House and Lodge
Base Case- 2 Doors U value 2.8 W / m2 C
Case 2-2 Doors U value 2.0 W / m2 C
Energy used for Heating/year (GJ) 1 0.928
Energy Saving for Heating (%) − 7.2
Fuel Consumption/year- (kWh) 400 370
Fuel Cost / year (£) 40 37
Carbon emission (tCO2) 0.2 0.2
Initial Cost (£) − 800
Payback years − 270
Wall insulation
Main heat transfer is occurres through the walls in the buildings. By installing cavity
wall insulation into double brick wall (often called cavity brick) heat transfer through the
walls can be prevented.
One of the main energy performance disadvantages in Overlee House & Lodge is the
lack of wall insulation. Effects of wall insulation over the energy performance of the
office were analysed by RETScreen. Overlee House & Lodge has 73 m2 external cavity
brick wall with thickness of 350 mm. Since it is the cavity wall, only option for retrofit
design is filling the wall with insulation material. U value of a cavity brick-timber wall
is around 1.50 with a 50 mm cavity wide. By filling the air cavity fully with Ecobead
insulation material, achievement of U value of 0.40 W/m2 C is possible. Additionally, it
is a cheap method because there is no wall reconstruction required.
RETScreen analysis screen shoot and energy performance of Overlee House & Lodge
with various wall insulation options is given in Figure 7 and Table 37 respectively.
Initial cost was taken as £1000 considering Ecobead filling insulation prices.
Insulation of walls creates big differences over the energy performance of the office.
37% energy reduction leads almost by £140 saving per year which is 20% of total heat
cost of the office. In this case, payback is in 7 years. It reduces carbon emission

92
significantly as well. According to RETScreen analysis, results indicate considerable
improvements, thus external insulation of walls is strongly recommended to Overlee
House & Lodge.
Figure 9 RETScreen Energy Performance Analyses of External Walls
Table 37 RETScreen Analysis-Energy Performance of Various Wall Insulation Options of
Overlee House & Lodge
Base Case-Brick Cavity Wall-no
insulation, U value 1.50 W/m2 C
Proposed Case Ecobead Insulation, U value 0.40 W/m2 C
Energy used for Heating/year (GJ) 14 9
Energy Saving for Heating (%) − 36.60
Fuel Consumption/year- (kWh) 3800 2400
Fuel Cost / year (£) 380 240
Carbon emission (tCO2) 1.9 1.2
Initial Cost (£) − 1000
Payback years − 7.2
93
Roof insulation
Insulating the roof could reduce heating costs especially where there is no insulation
already in place. Hence it is one of the first measures that should be considered for better
energy efficiency.
When insulating the roof, the type of materials use can also improve the environmental
performance. Overlee House & Lodge has pitched roof with 125 mm thick insulation
material between and under rafter which gives approximately U value of 0.20 W/m2. It
means that one of the best roof insulation options has been already installed to office’s
roof. It also fulfils the new building regulations which suggest the roof insulation U
value of 0.20 W/m2. Therefore, new insulation is not required for the office. However,
non-insulated roof option analysis was done by RETScreen and compared with base
case in order to see advantages of roof insulation. According to the 1988 building
regulations it can be assumed that pitched roof of office has U value of 1 W/m2 C
without insulation. Roof area was calculated as approximately 80 m2.
Comparison of energy performance of the office with and without insulation roof is
given in Table 38 according to RETScreen calculations. As it can be seen from the table,
insulation of the roof provides significant improvement of energy performance. It
reduces 600 kWh per year in fuel consumption and cuts £60 which is 10% of total
energy bill of the office.

94
Table 38 RETScreen Analysis-Energy Performance of Various Wall Insulation Options of Overlee House & Lodge
Base Case-Insulated Pitch Roof
between and under rafter U value 0.20 W/m2 C
No Insulation Case U value 1 W/m2 C
Energy used fro Heating/year (GJ) 1 3
Energy Saving for Heating (%) − −80
Fuel Consumption/year- (kWh) 200 800
Fuel Cost / year (£) 20 80
Carbon emission (tCO2) 0.1 0.4
Initial Cost (£) − Not considered
Payback years − Not considered
Floor insulation
The greatest heat loss through the floor is around the perimeter. It is particularly
worthwhile to insulate timber floors as energy savings lead to cost-effectiveness.
Overlee House & Lodge perimeter/area ratio is at least 1 for all rooms (Figure X,
schematic of the office). This kind of high perimeter ratio increases the U value up to
1 W/m2 C. The target value 0.24 W/m2 C can be reached by using 100 mm Celotex
insulation board with the initial cost of £13.5/m2 and total £1000 for 74 m2 floor areas.
Energy performance of office with insulated floor and base case comparison is given in
Table 39.
Maximum level of 80% heat transfers can be reduced by floor insulation. This reduced
heating costs about £60, 10% of the total heat cost.

95
Table 39 RETScreen Analysis-Energy performance of various floor insulation options of Overlee House & Lodge
Base Case-Floor-no insulation, U value 1.00 W/m2 C
Proposed Case 100 mm Celotex Insulation,
U value 0.24 W/m2 C Energy used for Heating/year
(G) 3 0.72
Energy Saving for Heating (%) − 76
Fuel Consumption/year- (kWh) 770 180
Fuel Cost / year (£) 77 18
Carbon emission (tCO2) 0.4 0.1
Initial Cost (£) − 1000
Payback years − 17
Building Envelope-Total Heating Energy Performance of Overlee House & Lodge
In this section heating energy performance based on RETScreen is given in a single
table. Base cases represent the current situation of the office and the proposed case
represents the recommended changes in the building envelope based on RETScreen
analysis as mentioned above. Thus current heating energy performance of the office and
recommended case could be compared. Parameters of window, door and roof for
proposed cases are same with the base case because they have already fulfilled the
standard requirements.

96
Table 40 Building Envelope RETScreen Energy Efficiency Measure Analysis of Overlee House & Lodge
Parameter Base Case
Base Case Fuel (Electricity)
Consumption (kWh)
Proposed Case
Proposed Case Fuel
(Electricity) Consumption
(kWh)
Carbon Emission Reduction
(tCO2)
Window Double Glazed Wood Frame, U
value 2.8 W / m2 C 900
Double Glazed Wood Frame, U
value 2.8 W / m2 C 900 0.0
Door 2 Doors U value
2.8 W / m2 C 400
2 Doors U value
2.8 W / m2 C 400 0.0
Walls
Brick Cavity Wall-no insulation,
U value 1.50 W/m2 C
3800 Proposed Case
Ecobead Insulation, U value 0.40 W/m2
2400 0.7
Roof
Insulated Pitch Roof between and
under rafter U value 0.20 W/m2
C
200
Insulated Pitch Roof between and
under rafter U value 0.20 W/m2
C
200 0.0
Floor
Base Case-Floor-no insulation,
U value 1.00 W/m2 C
770
Proposed Case 100 mm Celotex
Insulation, U value 0.24 W/m2
C
180 0.3
TOTAL - 6070
4080 33% reduction in Electricity Consumption
1.0
6.4.1.4 Energy Efficiency Measures Summary
According to RETScreen energy efficiency analysis, there is no any better
recommendation for lighting and appliances used in Overlee House & Lodge since most
convenient options have already been chosen among energy efficient products. As a
result, there is no considerable improvements have been done for decreasing power
consumption 7500 kWh / yr of the office.
Office building envelope which conduce electricity consumption for heating of the
office significant improvements particularly walls and floor insulation can be done. It is
possible to reduce annual energy consumption by 33 % and thus £200 saving in
electricity bills. Consequently, base case heating fuel consumption, 6070 kWh, was
reduced to 4080 kWh by improvements in the building envelope in order to find best
case.

97
6.4.2 Low and Zero Carbon Technology Applications
6.4.2.1 Power
Photovoltaic technologies were considered in this section in order to meet Overlee
House & Lodge power demand.
Photovoltaic
Photovoltaic (PV) modules produce electricity using renewable solar energy. The energy
performance of a photovoltaic system is influenced by a number of factors. For example,
these may include resource and design elements such as the amount of solar radiation
hitting the solar collectors, the collector type, power capacity, area, efficiency, nominal
operating cell temperature and temperature coefficient, as well as the solar tracking
mode (i.e. fixed, one-axis, azimuth or two-axis tracker), the slope and the azimuth
(physical orientation) of the collector. Other factors include the use of an inverter to
transform the DC output to AC for systems that include AC loads or a grid-connection,
and the PV array control method (i.e. maximum power point tracker or clamped) for off-
grid systems. The energy performance of an off-grid system will also be influenced by
the battery days of autonomy, voltage, efficiency, maximum depth of discharge,
temperature and capacity, as well as the charge controller efficiency. Figure 8 refers to
the Components of PV Systems.
In this thesis, RETScreen Software Photovoltaic Power Model was used to evaluate the
energy production and savings, costs, emission reductions, financial viability and risk
for off-grid photovoltaic project. The objective of the analysis was to determine if a
photovoltaic (PV) system is cost-effective alternative to used within Overlee House &
Lodge office.

98
Figure 10 Components of PV Systems
PV Base Case
The site is located in Clarkston and the roof facing to South. It is, however,
overshadowed by large trees on the same site. For this reason, PV panels are aim to be
built into neighbouring roof. 40 m2 areas are dedicated to establishment of PV panels in
order to meet required electricity load.
Typical financial figures for the analysis are provided as project life 20 yr, inflation at
2%. The price of electricity is £0.1 / kWh. The total estimated daily load is assumed to
be constant year-round. Daily and annually electricity consumptions of Overlee House
& Lodge are calculated approximately 20.800 kWh and 7.592 MWh respectively.
Therefore, total electricity cost is found £759. For the analysis, maintenance costs are
not considered, as they are relatively small.
PV Proposed Case
According to Base Case information delivered PV energy calculations were done. In this
context, first step was solar radiation calculation in plane of PV array by using
RETScreen data base. Second step was calculation energy delivered by PV and go
through the next step which was selecting of off-grid model. Consequent actions were
calculating demand met directly by PV array (matched demand) and finally calculating

99
demand met by battery. Other related information and recommendations can be seen
below. Further information for Propose Case follows as;
• Power supplied by photovoltaic array charging a battery
• Ensured that reliable power, a battery with 10 days of autonomy was used
• Battery voltage was 24V
• Battery efficiency was 80%, maximum depth of discharge was 80%
• Charge controller efficiency was 99%
• The battery was located outside and is subject to fluctuations in outdoor (ambient)
temperature
• Battery capacity was 214 Ah
• Battery installation cost of £1784
• Solar tracking mode was fixed and the slope of the PV array was 30º, facing south.
• Photovoltaic type was mono-crystalline silicon
• Photovoltaic capacity was 0.4 kW, efficiency was 14.0%.
• Photovoltaic control method was clamped
• Photovoltaic miscellaneous losses were around 7%
• Maintenance costs were the same as in the base case

100
RETScreen analysis display with battery characteristics can be seen in Figure 11.
Figure 11 Battery characteristics in RETScreen display for solar power analysis
Based on previous case studies with similar projects and because of higher efficiency
more than other basic types of solar cell; poly-crystalline and thin film, mono-crystalline
PV modules were considered. Imported various rate such as 10 W, 40 W, 85 W, 150 W,
160 W and 175 W PV arrays were analysed. Table 41 shows theses various power
capacities and characteristics of PV panels and their RETScreen analysis in terms of
emission and financial point of view.

101
Table 41 Various Power Capacities and Characteristics of PV Panels with Their RETScreen Analysis
Power Capacity per unit
(W) 10 40 85 150 160 175
Per Unit Fee (£) [98] 40 100 250 350 420 470
Frame Area (m2) [38] 0.13 0.41 0.63 1.26 1.26 1.26 Efficiency
(%) [38]
7.8 9.6 13.5 11.9 12.7 13.9
Number of Units 308 98 63 32 32 32
Per Unit Weight
(kg) [99]
1.3 4.1 8.0 13.5 15.5 17
Total Panel Weight
(kg) [99]
400 401 504 432 496 544
Initial Cost (including
labour cost) (£) [98]
13552 10780 17325 12320 14784 16544
Electricity Delivered to
Load (%) 30.4 37.8 50.2 45.4 48.2 52.3
GHG Emission Reduction
(tCO2) 1.1 1.4 1.8 1.7 2.0 2.1
Total Annual Saving
(£) 231 287 381 345 366 397
Payback (yr) 40.4 22.9 34.4 23.5 28.9 31
According to the Table 41 the most appropriate option in order to meet the 7.59 MWh
electricity demand is mono-crystalline PV array (98 BP Solar mono- Si- BP140 40 Watt
modules); battery. The installed cost of the PV system is average £10780 including 10%
labour costs. Thereby, second is less costly as well as the simple payback period with
22.9 year which is less than the others.
Although, second option seems a better option in terms of financial point of view,
generated electricity amount and GHG emission reduction of option sixth is much better
than the second option with delivery load of 52.3% and GHG emission reduction of 2.1
tCO2.

102
As seen on the Table 41, solar panels are not light and the roof must be strong enough to
take their weight, especially, in this case panels are planned to place on top of existing
titles so it is also recommended that an expert or an installer survey of existing roof.
As a result, savings can be considerable – between 1.1 – 2.1 tCO2 and 30.4% to 52.3%
reduction of electricity bills even though expensive technology in terms of initial costs
and thus very long pay back period in any case. On he other hand, maintenance is
generally small as long as keep the panels relatively clean.
If the related grant can be found to help with the costs of installing, PV technologies
would be a good opportunity in order to generate power.
6.4.2.2 Heating
Solar Heaters
In this section, solar air heaters, air sources & ground source heat pumps feasibility
analysis are done I order to meet heating demand in Overlee House & Lodge.
Solar air heating systems use air as the working fluid for absorbing and transferring solar
energy. Solar air collectors (devices to heat air using solar energy) can directly heat
individual rooms or can potentially pre-heat the air passing into a heat recovery
ventilator or through the air coil of an air-source heat pump.
The energy performance of a solar heating system is influenced by a number of factors.
For example, these may include resource and design elements such as the amount of
solar radiation hitting the solar collectors, the collector type (e.g. unglazed, glazed or
transpired-plate), area, absorptivity and/or efficiency and shading, as well as the solar
tracking mode (i.e. fixed, one-axis, azimuth or two-axis tracker), the slope and the
azimuth (physical orientation) of the solar air heater. Other factors include the process
(e.g. crop drying, combustion air) or ventilation air temperature, the roof and/or wall
thermal resistance, the design airflow rate, the number of hours that the solar air heating
system is operating and the design objective (i.e. high temperature rise, standard
operation and high air volume). The energy performance of a solar air heating system for

103
industrial ventilation air will also be influenced by the floor area and the building
temperature stratification.
RETScreen Software Solar Heating Model was used to evaluate the energy production
and savings, costs, emission reductions, financial viability and risk for solar air heating
project. The objective of the analysis is to determine whether a solar air heater system is
cost-effective alternative to used in Overlee House & Lodge office or not.
Solar Heater Base Case
As mentioned before, site is located in Clarkston and the roof facing to South. It is,
however, overshadowed by large trees on the same site. For this reason, solar air heater
panels are aim to be built into neighbouring roof. 40 m2 areas are dedicated to
establishment of solar panels in order to meet required.
Typical financial figures for the analysis are provided, project life 20 yr, inflation at 2%.
The price of electricity is £0.1 / kWh. Annually electricity consumptions of Overlee
House & Lodge for heating are calculated approximately 6070 MWh. Therefore, total
electricity cost for heating is £607. For the analysis, maintenance costs are not
considered, as they are relatively small.
R values of the office walls are calculated as 0.7 m2 C / W.
Solar Heater Proposed Case
The solution proposed in RETScreen consists of a solar collector on the south roof of the
neighbour building and a feeding a rooftop ventilation fan. The fan rate is related to the
energy need to keep office at constant temperature of 21 °C. On very cloudy days, the
photovoltaic power will drop and the ventilation rate is less than recommended. It
should be noted, however, that fan flow rates are related to the cube of the fan power: on
a very cloudy day, with 1 / 8th the solar energy of a sunny day available, airflow will be
roughly halved. Operating hours for heating is 7/24. Percent of month used is entered
based on the values in Table 24.

104
There are three types of solar air heater panels which can be potentially used for Overlee
House & Lodge; unglazed, glazed and transpired plate. According the case studies
reported in RETScreen performance difference was not significant between these three
options so only unglazed solar air heater option was reported here. Solar air panel
characteristics used in RETScreen analysis is displayed in Figure 42. Initial cost of the
proposed system is £100 / m2 plus 15 % labour cost and consumables. Fan power was
considered as 4 W per area of solar collectors.
RETScreen analysis showed that, 54 m2 solar panel areas were required (Table 42) in
order to meet total heat requirements of Overlee House & Lodge. In this case, simple
payback can be 11 years. In addition, 2.8 tCO2 GHG emissions were totally eliminated.
However, our dedicated area for solar panels is around 40 m2 in base situation. With the
aid of 40 m2 solar panel heater areas, annual electricity consumption for heating can be
reduced 80% (Table 42). Similarly, GHG emissions reduction was achieved to 2.1 tCO2
which is 80% of overall GHG emissions. In this case payback can be 10 years.
Final analysis was done according to the best case efficiency improvements which were
mentioned in building envelope section. Best case fuel consumption of 4080 kWh/year
by wall and roof insulation could be met fully by 40 m2 solar panel. Additionally, carbon
emission was fully eliminated as well (Table 42).

105
Figure 12 Solar panel characteristics in RETScreen
Table 42 Energy Performance of Solar Air Heating Panels
Base Case
Electricity Heating R, 0.7 m2 C /W
Proposed Case 1 50 m2 solar heater
Proposed Case 2 40 m2 solar heater
Proposed Case 3 39 m2 solar heater
Fuel Consumption/year-
(kWh) 6070 620 700 408
Fuel Cost / year (£) 607 52 73 38
Carbon emission (tCO2)
2.9 0.1 0.7 0.1
Initial Cost £ - 6000 4500 4500
Payback years - 11 10 11
As a result of RETScreen solar heater analysis, solar heating system is a good option in
order to comply with the green office standards because heating demand is relatively
low in Overlee House & Lodge. With the aid of solar panels, it is also possible to reach
zero carbon emission while generating all heating requirements. Grants availabilities
should be investigated for reducing initial costs.

106
Air Source and Ground Source Heat Pumps
Ground Source Heat Pumps and Air Source Heat Pumps were investigated to analyse for
their ability to meet the Overlee House &Lodges’ all-season heating needs with
efficiency and economy unattainable with any other technology. Cooling ability of heat
pumps were ignored since office’s cooling demands was estimated nominal in the UK
weather conditions even in summer.
RETScreen Software Heat Pump Model evaluated the energy production and savings,
costs, emission reductions, financial viability and risk for heat pump projects, ranging in
size from air-source heat pump (ASHP) networks in Overlee House & Lodge case.
The energy performance of a heat pump system is influenced by a number of factors.
For example, these may include design elements such as the heat pump capacity, the
heating seasonal efficiency and/or the cooling seasonal coefficient of performance
(COP), as well as the source of heat and/or "cold" (i.e. air or ground). In the case of
ground-source heat pumps (GSHP), the energy performance is also influenced by the
ground heat exchanger (GHX) type (i.e. horizontal or vertical ground-coupled closed
loop or groundwater) and length, as well as the site conditions such as the soil type and
the earth temperature. Other factors include the size and the type of the heating/cooling
load (i.e. space and/or process heating/cooling, single or multiple zones, single or
multiple buildings). The energy performance of a district heating/cooling (multiple
buildings) system will also be influenced by the design supply and return temperatures,
and the distribution line pipe sizing. Refer to the following schematics for more
information: Ground-Source Heat Pump - Vertical Closed Loop, Ground-Source Heat
Pump - Horizontal Closed Loop, Ground-Source Heat Pump - Groundwater, and Air-
Source Heat Pump.
Horizontal ground-coupled heat pumps (GCHP) are generally used to heat and/or cool
space and/or processes in institutional buildings and industrial facilities, to combined
heating and cooling using vertical boreholes for residential, commercial and institutional
buildings and industrial facilities, to open loop or standing well groundwater heat pumps

107
(GWHP) for residential systems. In addition, both the size and cost of the ground heat
exchanger can be calculated using a convenient Ground heat exchanger tool.
Heat Pumps Base Case
Overlee House & Lodge is single detached bungalow with a floor area of 94 m2.
According to the 2008-2009 year electricity bills 6176 kWh electricity used for heating.
2% of heating consumption is used for domestic hot water as well. Annual GHG
emission is 2.9 tCO2.
Creda & Dimplex (1000 mm x 600 mm) 3.4 kW storage electric heaters in the main
office, Dimplex (680 mm x 430 mm) 2.0 kW Panels in interview room and rear room,
Dimplex (550 mm x 600 mm) 1.7 kW Dimplex XLN storage heaters in kitchen and
Dimplex (550mm X 600 mm) 1.7 kW Dimplex storage heater in hallway provide space
heating.
The soil at the site is primarily damp clay and the mean earth temperature is reported to
be annual about 8.5 °C with annual amplitude of 13 °C.
It is assumed that debt is not used for the costs. Estimated interest rate is about 2% over
a 20-year term. Fuel cost (electricity) is expected to rise at roughly a half-point above
the inflation. The financial analysis should be performed over 25 years. Currently, the
Overlee House & Lodge pays £0.1/kWh for electricity, without a demand charge for the
facility. This means annual electricity cost total £617.
The heat pumps are estimated to cost about £5000-£9000 [1028] for air source heat
pumps and £7000-£13000 [1028] for ground source heat pumps and their compressors
are expected to last 20 years before needing replacement. Similarly maintenance costs
are estimated as £790 and £650 [1028] for air source heat pumps and ground source heat
pumps respectively. Project costs include circulating pump, circulating fluid, trenching
& backfilling, loop pipe and fittings & valves. Besides, since base case heating is not
provided by the district heating system, boiler is needed and thus corresponding credits
need to be included in the cost analysis.

108
Heat Pumps Proposed Case
According to the heating base case information heating proposed case was determined.
This practice, coupled with a cool climate, suggests that the ground and air-source heat
pump systems would likely be designed to meet the heating load.
After research various alternatives to Overlee House & Lodge’s existing base heating
system design, the Carier air source heat pump and Adisson ground source heat pump
were selected for feasibility analysis. Heat pump characteristics and RETScreen analysis
in terms of heat, environment and financial results are presented in Table 43. This
analysis was done with the 6070 kWh / yr heating consumption regardless of any energy
efficient improvements to Overlee House & Lodge. Table 44 is presented heat pumps
RETScreen analysis results considering with energy efficiency improvements. Heating
demand was reduced to 4080 kWh / yr by improvements as mentioned in building
envelope section.
Table 43 RETScreen Analysis of Heat Pumps without Energy Efficiency Improvements in Overlee House & Lodge
Product Carrier
Air Source Heat Pump
Carrier Air Source Heat Pump
Addison Ground Source
Heat Pump
Addison Ground Source
Heat Pump
Model 38BK01231 40QNH01230
38QR024C31 40QKE03630 DWPG017 HGY030-4A
Seasonal Efficiency (%) [38] 150 150 250 250
Capacity (kW) [38]
3.4 7.0 3.4 6.9
COP Capacity [38] 1.99 2.17 3.1 3.6
Heating Delivered (%) 148.8 306.5 148.8 302.1
GHG Emission Reduction
(tCO2) 1.7 0.8 1.7 1.7
Initial Cost (£) [28] 5000 6000 7000 8000
Maintenance Cost (£) [28] 750 750 650 650
Total Saving (£) -1161 -1161 -897 -897
Payback (yr) -4.3 -5.2 -7.8 -8.9

109
Table 44 RETScreen Analysis of Heat Pumps with Energy Efficiency Improvements in Overlee House & Lodge
Product Carrier
Air Source Heat Pump
Carrier Air Source Heat Pump
Addison Ground Source
Heat Pump
Addison Ground Source
Heat Pump
Model 38BK01231 40QNH01230
38QR024C31 40QKE03630 DWPG017 HGY030-4A
Seasonal Efficiency (%) [38] 150 150 250 250
Capacity (kW) [38]
3.4 7.0 3.4 6.9
COP Capacity [1038] 1.99 2.17 3.1 3.6
Heating Delivered (%) 224.7 462.5 224.7 455.9
GHG Emission Reduction
(tCO2) 0.5 0.5 1.1 1.1
Initial Cost (£) [28] 5000 6000 7000 8000
Maintenance Cost (£) [28] 750 750 650 650
Total Saving (£) -1022 -1022 -813 -813
Payback (yr) -4.9 -5.9 -8.6 -8.6
According to RETScreen analysis in Table 43 both air source and ground source heat
pumps technologies provide great GHG emission reduction in annual. 2.9 tCO2 GHG
emissions were reduced to 0.8 to 1.7 tCO2. According to the Table 44 GHG emission
reduction in annual is 1.9 tCO2 GHG emissions reduced to 0.5 to 1.1 tCO2.
The model calculated using an air source heat pump reduces the electrical usage by
between 149 and 307%, if there is no energy efficiency improvement applied. Similarly,
using a ground source heat pump reduces electrical usage by between 148.8% and
302.1%. However if energy efficiency improvements are performed then electrical usage
reduces to 224.7% and 462.5% by air source heat pump and 224.7%-455.9% by ground
source heat pump. Significant demand savings are typical for GSHP and ASHP systems
as compared to conventional electric resistance heating and represent a benefit for the
utility.
A tax analysis was not included because municipal facilities generally do not pay
income or property taxes.

110
As seen in Table 43 and 44 the costs of this retrofit installation are significantly high
since the technology is still very expensive for these applications. Besides, Overlee
House & Lodge is not a big office with its three numbers of occupancy and thus its
heating demand is not much. Consequently, costs savings are even impossible to achieve
and pay back periods are infinite by heat pumps unless grants are not available.
Alternatively, cost savings are low because it is assumed that the existing technology is
expensive for retrofit design. However, since the heat pumps generates considerable
amount of electricity for heating, it increases the potential for the local utility to sell to
neighbouring utilities or to grid back that might have more cost savings and it also
increases the potential for the local utility to sell its cleaner surplus electricity to
neighbouring utilities that might have more GHG emissions per unit of electricity
production. Table 45 illustrates the situation in terms of GHG emission reduction and
cost saving if the oversupply is sold to neighbouring.
Table 45 RETScreen Cost & GHG Emission Saving Result Analysis of Selling Oversupply Heat Pumps Energy
Product
Carrier Air Source Heat Pump
(38BK01231 40QNH01230)
Carrier Air Source Heat Pump
(38QR024C31 40QKE03630)
Addison Ground Source
Heat Pump (DWPG017)
Addison Ground Source
Heat Pump (HGY030-4A)
Total Saving without energy efficient improvements
(£)
-235 690 29 954
Total Saving with energy efficient improvements
(£)
-108 865 103 1047
Payback without energy efficient
improvements (yr) -21.3 8.7 239.7 8.4
Payback with energy efficient
improvements (yr) -46.1 6.9 68.3 6.7
RETScreen analysis results showed that Carrier Air Source Heat Pump model
38QR024C31 / 40QKE03630 and Addison Ground Source Heat Pump model HGY030-
4A are the most suitable choices in terms their GHG emission reduction and saving
costs. Selection of technology is recommended between these two technologies.

111
Further investigation should be done considering the site availabilities. Although, the
hall and heater storage room provide sufficient place available for the heat pump system
installation, the front of the office is car park / tarmac area and the rear is grassed area
with large trees or out side of the office sufficient square metre land. All these reasons,
air source heat pump application seems to be a better alternative for providing heating
demands in Overlee House & Lodge.
6.5 Result and Discussion Summary
Table 46 summarises the all findings which are investigated and discussed in terms of
energy saving, GHG emission reductions and financial point of view associated with
energy efficiency improvements and LCZT applications in previous sections. Below
table figures only illustrate the overview of the best options of analysis results.
Table 46 Result and Discussion Summary
Energy Saving
(%)
GHG Emission Reduction
(tCO2)
Initial Cost (£)
Pay Back Period (yr)*
1) Lighting
Electronic Ballast T5 -37.9 -0.2 52 -34
2) Appliances
a) Office Equipments
Operating Mode -0.3 0 695 -21.6
Sleep Mode - 0.1 689 -33.5
Off Mode - 0 689 -25.4
b) Kitchen and Other
Base Case** - - - -
3) Building Envelope
Windows (Triple Glazed) 18.4 0.1 1000 60.4
Doors 7.2 0 800 270
Walls 36.6 0.7 1000 7.2
Roof (Base Case)** - - - -
Energy Efficiency
Floor 76 0.3 1000 17
*(-) payback period indicates money never will be back.
** Base case accepted. (There is no change has been done).

112
Table 46 (cont.) Result and Discussion Summary
Energy Saving
(%)
GHG Emission Reduction
(tCO2)
Initial Cost (£)
Pay Back
Period (yr)*
40 W Power Capacity
PV 37.8 1.4 287 22.9
1) Power Photovoltaic 175 W Power Capacity
PV 52.3 2.1 397 31
a) Solar Air Heater
40 m2 solar heater 80 2.2 4500 10
b)ASHP
7 kW Capacity ASHP 306.5 0.8 6000 -5.2
7 kW*** Capacity ASHP 306.5 0.8 6000 8.7
c) GSHP
6.9 kW Capacity GSHP 302.1 1.7 8000 -8.9
Without Energy Efficiency
Improvements
6.9 kW*** Capacity GSHP 302.1 1.7 8000 8.4
a) Solar Air Heater
40 m2 solar heater 0.7 4500 10
b) ASHP
7 kW Capacity ASHP 462.5 0.5 6000 -5.9
7 kW*** Capacity ASHP 462.5 0.5 6000 6.9
c) GSHP
6.9 kW Capacity GSHP 455.9 1.1 8000 -8.6
LZCT
2) Heating
With Energy Efficiency
Improvements
6.9 kW*** Capacity GSHP 455.9 1.1 8000 6.7
**** The case of if the oversupply energy is sold to neighbouring.
GHG Emission reduction was ignored during the oversupply energy selling to neighbouring.

113
CHAPTER 7: CONCLUSIONS
The investigation and case studies provided, demonstrate that there are significant
improvements towards sustainable buildings, concentrating on energy efficiency and
LZCT applications in order to supply electricity and heating.
Understanding of energy use in buildings requires knowing the amounts of energy and
of different fuels consumed for various end uses. These data needs to be evaluated the
potential effects of energy efficiency improvements. Much less detailed information is
available on energy consumption in commercial buildings, which includes different
types of buildings and variations of activity within buildings.
Office buildings require energy for space heating, water heating, lighting, appliances,
ventilation and other services. Generally, space heating and water heating account for a
lower proportion while lighting accounting for a higher proportion of consumption in
commercial buildings. Improvements to the efficiency whilst applying low and zero
carbon technologies could offer considerable opportunities for reducing greenhouse gas
emissions. In the UK, non-domestic buildings offer many opportunities for improving
energy efficiency and low and zero carbon technology applications.
The aim of this work is to provide a framework for retrofit designing of ECO-Offices, to
identify offices as high-energy users and investigate how the energy consumption can be
reduced. The intent is to provide knowledge of principles and strategies that can be
adopted to reduce energy consumption by converting low and zero carbon technologies
in offices. This has been summarised and presented as a general approach methodology
in the form of a flowchart to assist office designers and operators in identifying and
applying energy efficiency features that will increase the energy efficiency and
performance as well as converting low and zero carbon technologies of existing office
facilities.
The methodology aims to encourage the introduction of energy decision making into
existing building projects. Beginning at the retrofit design stage where the building form
and fabric can be manipulated and energy supply technologies can be considered. It
focuses on: correct briefing, building form & fabric and supply technologies. These all

114
combine to attempt to reduce the energy consumption thus energy cost and negative
environmental effects of the facility.
The application of the methodology was demonstrated through application to a particular
case study. The case study, representative of an ECO-Office, was used to demonstrate
the potential energy, cost and greenhouse gas emission savings that can be achieved
through the use of a number of the energy efficiency strategies and suggested low and
zero carbon technologies. The purpose of this study was to demonstrate the effectiveness
of sustainable design but also to explore results and comparatively measured against
each other using modelling tool aided analysis. It has become clear that computer
modelling and analysis is essential in sustainable ECO-Office design for benchmarking
purposes so selection of modelling tools plays an important role.
Computer modelling and simulation also allows design options to be analysed and
compared for potential energy, cost and greenhouse gas emission savings or loss as
demonstrated in the case study. This information can be used to assess payback periods
and give confidence to investors whether capital cost expenditure will be recovered
within acceptable periods or not.
This thesis shows retrofit ECO-Office design is possible as long as careful selection of
the most suitable modelling tools and thus successful feasibility studies are carried out.
Selection of correct LZCT also plays a crucial role.
According to feasibility analysis, there is no any better recommendation for lighting and
appliances used in Overlee House & Lodge since most convenient options have already
been chosen among energy efficient products. As a result, there is no considerable
improvements have been done for decreasing power consumption 7500 kWh / yr of the
office.
Office building envelope which conduce electricity consumption for heating of the
office significant improvements particularly walls and floor insulation can be done. It is
possible to reduce annual energy consumption by 33 % and thus £200 saving in
electricity bills. Consequently, base case heating fuel consumption, 6070 kWh, was
reduced to 4080 kWh by improvements in the building envelope in order to find best
case.

115
As a result of PV application case studies, savings can be considerable – between 1.1 –
2.1 tCO2 and 30.4% to 52.3% reduction of electricity bills even though expensive
technology in terms of initial costs and thus very long pay back period in any case.
With the aid of solar panel heater areas, annual electricity consumption for heating can
be reduced 80%. Similarly, GHG (Green House Gases) emissions reduction was
achieved to 2.1 tCO2 which is 80% of overall GHG emissions. In this case payback can
be 10 years.
Using an air source heat pump reduces the electrical usage by between 149 and 307%, if
there is no energy efficiency improvement applied. Similarly, using a ground source heat
pump reduces electrical usage by between 148.8% and 302.1%. However if energy
efficiency improvements are performed then electrical usage reduces to 224.7% and
462.5% by air source heat pump and 224.7%-455.9% by ground source heat pump.
Significant demand savings are typical for GSHP and ASHP systems as compared to
conventional electric resistance heating and represent a benefit for the utility.
As seen from the feasibility case study, retrofit ECO-Office design is possible. Despite
the improvements; economical situation is still major challenge since the technology is
very expensive to reach these aims as seen from the results money, most of the time, is
impossible to pay back or periods can be reached 17 yr to 270 yr for energy efficiency
improvements. Similarly, LZCT application payback periods changes between 6.7 yr to
22.9 yr. With time the UK building regulations have been improved and grant
opportunities have been increased but still could be much more improvements such as
cheapen LZCTs’ installation and maintenance costs.
7.1 Future Works
This thesis has provided the platform for future work for the further integration of
simulation into the ECO-Office building design process. Although the work documented
in this thesis represents a contribution towards this ultimate aim additional work
remains, some of which is outlined in the following.

116
As mentioned earlier only four major elements; ensuring good indoor environmental
quality, energy efficiency and environmental impact, materials and green tariff of key
design elements of an ECO-Office building are considered in this thesis due to limited
time. Many other titles such as creating a green team, training office stuff, purchasing,
waste minimisation opportunities, recycling, minimising use of paper, sustainable travel
mapping / guidance for employees, water conservation opportunities, catering and event
planning, and basic environmental management systems applications would be
investigated as future work.
Effects of building types, building & insulation materials, office furniture, etc could be
pursued. Further investigation into health and comfort impact of humidity levels and
other environmental properties in airtight doors, windows and under floor area
constructions for different ventilation schemes would be done. Since occupancy comfort
can be reached by controlled ventilation whilst recovering heat from the extracted air.
Since the low and zero carbon technologies’ improvements and their prices changes
frequently various consequences can be explored in the future.
It is essential further work to explore renewable grant or a low carbon buildings
programme grant possibilities as well as green tariff for current energy provision vs.
alternatives.
Accreditation / recognition are another comprehensive subject in order to be ascertained
within an extended period of time if the building and the system comply with the
minimum requirements. In this context, establishment of Energy and the Environment
System would be studied for BREEAM, IEMA / Acorn or National Energy Efficiency
Awards certification.

117
REFERENCES
1. Dawson C. Green property: Buying, developing and investing in eco-friendly property, and becoming more energy efficient. 2nd ed. London: Kogan Page. 2008.
2. Schaefer B. The green of office guide: Environmental education guides. Barcelona: Barcelona City Council Publications. 2008.
3. McMullan R. Environmental science in building. 6th ed. New York: Palgrave Macmillan. 2007.
4. Ministry for the Environment. A guide to sustainable office fit-outs. 2005 [cited 2009 June 06]; Available from: www.mfe.govt.nz.
5. A client's guide to sustainable offices: A draft for development. Edinburgh: Gaia Research. 2004.
6. Halliday S. Sustainable construction.1st ed. Oxford: Butterworth-Heinemann. 2008.
7. Green Office Guide. Nashville: Tennessee department of environment and conservation. 1999.
8. Green office guide: National appliance and equipment energy. Victoria: Efficiency committee (NAEEEC). 2001.
9. Gevorkian P. Sustainable energy systems in architectural design: A blue print for green building. New York: The McGraw-Hill. 2006.
10. Brandon PS, Lombardi PL, Bentivegna V. Evaluation of the built environment for sustainability. London: E & FN SPON. 2005.
11. Energy policy: an overview. Edinburgh: Scottish Government. 2008. 12. Scottish building standards. Building (Scotland) Regulations Certification
Scheme for Certification of Design (Section 6 Energy) for non-domestic Buildings.2009 [cited 2009 July 07]; Available from: http://www.sbsa.gov.uk/tech_handbooks/tbooks2009.htm
13. Butcher K. editor. CIBSE Guide A: Environmental Design. London: CIBSE Publications. 2007
14. Energy solutions for better buildings. 2007 [cited 2009 June 08]; Available from: http://www.buildup.eu/.
15. BRE Certification. 2009 [cited 2009 June 08]; Available from: http://www.bre.co.uk/.
16. BRE Environmental & Sustainability Standard. London: BRE global, 2009. 17. IEMA Acorn Scheme of Accredited Recognition for organisations evaluating
and improving their environmental performance in accordance with BS 8555. Institute of Environmental Management & Assessment Lincoln: The IEMA. 2005.
18. The national energy efficiency awards. UK CEED Eco innovation centre. [cited 2009 June 12]; Available from: http://www.energyawards.co.uk/.
19. National environment agency [online]. 2002 [cited 2009 June 13]; Available from: http://app2.nea.gov.sg/index.aspx
20. Thomas R. Environmental design and introduction for architects and engineers. 3rd ed. London: Taylor & Francis. 2006.
118
21. Myhren JA, Holmberg S. Flow patterns and thermal comfort in a room with panel, floor and wall heating. Energy and Buildings 2008; 40(4): 524-36.
22. Poirazis H. Single skin glazed office buildings: energy use and indoor climate simulations. Lund: Licentiate Thesis-Department of Architecture and Built Environment Lund University. 2005.
23. Rubbert, F. Sun directing glazing: new development in day lighting for deep plan offices. In: Ledbetter S, Harris R, editors. The proceedings of the International Conference Facade design and procurement; 1999. Bath: CWCT; 1999.
24. Thermal comfort in the work place: guidance for employers. Norwich: Health & Safety Executive. 1999.
25. Frost K., Donn M., Amor R. The Application of RADIANCE to Day lighting Simulation in: Proceedings of Building Simulation 93, 1993.
26. Wilson M. Visual comfort and energy saving. London: University of North London. 2007.
27. Heylighen A., Vermeir G., Rychtáriková N. The Sound of Inclusion: A Case Study on Acoustic Comfort for All. In: Langdon P., Clarkson J., Robinson P. editors. Designing Inclusive Futures. London: Springer; 2008. p75-84
28. Energy saving trust. 2009 [cited 2009June 14]; Available from: http://www.energysavingtrust.org.uk.
29. .National insulation association. (undated) [cited 2009 June 15]; Available from: http://www.nationalinsulationassociation.org.uk/
30. Harley B. Insulate and weatherize: expert advice from start to finish. Taunton Press. 2002.
31. Home heating guide. (undated) [cited 2009 June 16]; Available from: http://www.homeheatingguide.co.uk/loft-insulation.html
32. Little fair PJ designing with innovative day lighting BRE report BR 305. London: Construction Research Communications. 1996.
33. NSI/ASHRAE Standard 62.1. Ventilation for acceptable indoor air quality. Atlanta: ASHRAE, inc. 2007.
34. Jong, JK & Rigdon B. Qualities use and examples of sustainable building materials. Michigan: National pollution prevention centre for higher education. 1998.
35. Pacific Gas and Electric Company. Industrial heat: recovery strategies. PG&E energy efficiency information. 1999.
36. Jarnagin RE. Heat recovery from air conditioning units. University of Florida. (undated).
37. A thermie programme action. Energy efficient lighting in offices. Brussel: European Commission Directorate. 1995.
38. RetScreen International. Natural resources Canada. 2009 [cited 2009 June 18]; Available from: http://www.retscreen.net.
39. ENERGY STAR computer - desktops & integrated computers voltage 230 category a system list. July 28, 2009 [cited 2009 June 18]; Available from: http://www.energystar.gov/.

119
40. ENERGY STAR computer – notebooks, category a system list, voltage 230 list Hewlett-Packard Company. July 28, 2009 [cited 2009 June 18]; Available from: http://www.energystar.gov/
41. Aps solutions for business. 2009 [cited 2009 June 18]; Available from: http://www.aps-solutionsforbusiness.com.
42. ENERGY STAR monitors product list for Hewlett-Packard Company. July 16, 2009 [cited 2009 June 18]; Available from: http://www.energystar.gov/
43. ENERGY STAR imaging equipment product list for Hewlett-Packard Company. July 28, 2009 [cited 2009 June 18]; Available from: http://www.energystar.gov/.
44. Hewlett-Packard products. Hewlett-Packard development company, L. P. 2009 [cited 2009 June 18]; Available from: http://www.hp.com.
45. Cisco products. Cisco Systems, Inc. 2009 [cited 2009 June 18]; Available from:https://www.cisco.com
46. The Chicago green office guide: a guide to help you buy and use environmentally friendly office equipment. Chicago: The Chicago green office company.2007
47. LaSalle JL Green office guide. City national bank. 2009. 48. Beckers A. A guide to working green at the University of Connecticut.
Mansfield: University of Connecticut. 2009. 49. Green office guide: a guide to greening your bottom line through a resource
efficient office environment. Portland: City of Portland office of sustainable development.2008.
50. Smart meters. London: Energy saving trust. 2008 51. Smart Meters and Electricity Display. Energy retail association website. 2008
[cited 2007]; Available from: http://www.energy-retail.org.uk/smartmeters.html. 52. Heating, ventilation and air conditioning zone controls: a guide to equipment
eligible for enhanced capital allowance. London: Carbon Trust. 2008. 53. Okba EM. Achieving sustainable tourism development through appropriate
selection of building materials. Egypt: Cairo University. (2000). 54. Green office guide: how to transform your office into one that is kinder to the
environment. Auckland: AEBN. 2002. 55. Green guide for offices. London: London sustainability exchange.2001. 56. Green electricity marketplace. 2009 [cited 2009 June 20]; Available from:
http://www.greenelectricity.org/ 57. Green electricity tariffs. London: Friends of the Earth. 2005. 58. Shearer D. & Anderson B. Low and zero carbon technologies in the Scottish
Building Standards. Glasgow: Scottish Building Standards Agency. 2005. 59. British wind energy association. 2009 [cited 2009 July 21]; Available from:
http://www.bwea.com/. 60. National planning policy guideline: renewable energy developments. Edinburgh:
Scottish executive. 2000. 61. BWEA briefing sheet - PPS22: renewable energy. London: British wind energy
association. 2003. 62. National energy foundation. 2009 [cited 2009 July 22]; Available from:
http://www.nef.org.uk/renewableenergy/solar.htm

120
63. Twidell J. & Weir T. Renewable energy resources. 2nd ed. London: Taylor & Francis. 2006.
64. Sandia National Laboratories. 2009 [cited 2009 July 23]; Available from: http://www.sandia.gov/
65. Role of hydro power in sustainable development. Parana: The international hydropower association. 2003.
66. Low and zero carbon energy resources: strategic guide. London: Office of the deputy prime minister. 2006.
67. Discover renewable energy using water to make your own electricity. London: Energy saving trust. 2008
68. Small scale hydro power. London: The watt committee on Energy Ltd. 1985. 69. Scottish environment protection agency. (undated) [cited 2009 August 01];
Available from: http://www.sepa.org.uk/ 70. A Guide to UK Mini-Hydro Developments. London: The British Hydropower
Association. 2005. 71. British hydro power association. (undated) [cited 2009 August03]; Available
from http://www.british-hydro.org/ 72. Biomass energy centre. 2008 [cited 2009 August 05]; Available from:
http://www.biomassenergycentre.org.uk/ 73. Turner W. C. & DOTY S. Energy management handbook. 6th ed. Lilburn: the
Fairmont press. 2006. 74. Energy efficiency best practice in housing-Domestic ground source heat pumps:
design and installation of closed-loop systems. London: Energy Saving Trust. 2004.
75. Ground source heat pumps – an introduction. Milton Keynes: GSHP association. 2002
76. Low carbon buildings programme. (undated) [cited 2009 August 07]; Available from: http://www.lowcarbonbuildings.org.uk/
77. Green spec. 2009[accessed 2009 August 09]; Available from: http://www.greenspec.co.uk/
78. Small scale CHP cogeneration of heat and electricity. Nottingham: Energy partnership. 2008.
79. Hargreaves L. Current thinking on combined heat and power for the built environment. InsideENERGY the continuing professional development programme. 2004.
80. Combined heat and power association. 2009 [cited 2009 August 10]; Available from: http://www.chpa.co.uk
81. Provision of heating and electricity through low and zero carbon technologies, Oxford: University of Oxford, School of Geography and the Environment, 2007
82. Gallagher GJ. Development of small-scale biomass CHP system. DTI / Pub URN 02 / 681. 2002.
83. Halliday J. & Ruddell A. & Powell J. & Peters M. Fuel cells: providing CHP in the urban environment. Tyndall Centre for climate change research. 2005.
84. Lite craft commercial. Fluorescent lighting. 2009 [cited 2009 August 15]; Available from: http://www.litecraftcommercial.co.uk/

121
85. Lyco leading UK lighting. 2008 [cited 2009 August 15]; Available from: http://www.lyco.co.uk/Light-Bulbs/Fluorescent-Tubes/Fluorescent-Tubes/T5-Tubes/sc1323/p214.aspx
86. Commercial convection ovens qualified product list. July 1, 2009 [cited 2009 August 15]; Available from http://www.energystar.gov/
87. ENERGY STAR qualified refrigerators & freezers. 2009 [cited 2009 August 15]; Available from: http://www.energystar.gov/
88. Beko. 2007 [cited 2009 August 15]; Available from: www.beko.co.uk/ 89. ENERGY STAR qualified dishwashers. 2009 [cited 2009 August 15]; Available
from: http://www.energystar.gov/ 90. HP office-jet 6100 series model. 2009 [cited 2009 August 15]; Available from:
http://h10025.www1.hp.com/ewfrf/wc/document?docname=bpu04509&lc=en&dlc=en&cc=us&lang=en&product=79477
91. Price runner impartial comparison. 2009 [cited 2009 August 15]; Available from: http://www.pricerunner.co.uk/f/187/Ink-and-toners?search=hp+6110&other_hits=%3B1774%3B11563%3B&q=hp+6110+toner&ref=redirect
92. HP laser-jet 1160 series printer - product specifications. 2009 [cited 2009 August 15]; Available from: http://h20000.www2.hp.com/bizsupport/TechSupport/Document.jsp?lang=en&cc=us&objectID=c00230358&jumpid=reg_R1002_USEN#A1
93. Office basics HP laser-jet 1160 toner black. 2009 [cited 2009 August 15]; Available from http://www.amazon.co.uk/Office-Basics-Laserjet-Toner-Black/dp/B0013DEG0I/ref=sr_1_3?ie=UTF8&qid=1249035581&sr=8-3
94. Ink xpress. HP CB540a toner cartridges. 2009 [cited 2009 August 15]; Available from: http://www.inkxpressdirect.com/catalog/inkjet-cartridges-for/hp-toner-cb540a?gclid=CLSo6qLOjZwCFZ0U4wodfxY5ZA
95. Price runner impartial comparison. 2009 [cited 2009 August 15]; Multifunctional printers. Available from: http://www.pricerunner.co.uk/cl/116/Multifunctional-Printers?search=cm+1312&other_hits=187%3Acm+1312%7C483%3Acm+1312%3B%3B%3B&q=cm+1312&ref=redirect
96. Amazon.co.uk. HP original CB435A [35A] black toner cartridge. 2009 [cited 2009 August 15]; Available from: http://www.amazon.co.uk/Original-CB435A-Black-Toner-Cartridge/dp/B001965NM4/ref=pd_cp_ce_2
97. Amazon.co.uk. HP laser-jet P1006 printer. 2009 [cited 2009 August 15]; Available from: http://www.amazon.co.uk/Hewlett-Packard-CB411A-ABU-Laserjet/dp/B001263GT8/ref=sr_1_2?ie=UTF8&qid=1249033149&sr=8-2
98. ebay.co.uk. 2009 [cited 2009 August 15]; Available from: http://electronics.shop.ebay.co.uk/
99. Orion air energy efficient products. (undated) [cited 2009 August 15]; Available from: http://www.orionairsales.co.uk/schuco-photovoltaic-solar-module-175-watt-sp-4-2-panels-1287-p.asp
100. BRE digest. Continuous mechanical ventilation in dwellings: design install and operation. Cardiff: Department of the Environment Welsh office; 2000.

122
Appendix A - Building (Scotland) Regulations 2004 Section 3 ‘Environment’ and in
section 6 ‘Energy’
Environment
In ‘Heating’ (section 3.13) states that heated and maintain heat at temperature levels that
will not be a threat to the health of the occupants.
Section 3.14 outlines the requirements to satisfy regulations with regard to ventilation.
The building must have provision for ventilation by natural means, mechanical means or
a combination of both i.e. mixed modes. The air provision relates to requirements for
human respiration and is in addition to air supply needed for smoke control purposes or
operation of combustion appliances.
Acceptable mechanical ventilation systems are given as Ventilation of Rooms
containing pop-up windows in accordance with BRE Digest 398 [100].
Table 1 Ventilation of Rooms containing pop-up windows (i.e. located on an external wall)
Room Rapid Ventilation
(opening windows) Background Ventilation Extract Ventilation fan
Rates
Occupiable Room 1/20th of floor area
For floor areas: up to 10 m2
- 400 mm2 greater than 10
m2 – at the rate of 400/m2
of floor area
300 litres/second adjacent
to hob, or 60 litres/second
elsewhere
Kitchen Opening window 400 mm2 15 litres/second per
bath/shower
Bathrooms
(Including shower rooms) Opening window 400 mm2 per bath/shower
Sanitary Accommodation
(and/or washing facilities)
1/20th of floor area, or
mechanical ventilation at 6
litres/second per WC or 3
air changes per hour
400 mm2 per AC
In Section 3.14.2 ‘Natural ventilation recommendations for any other building, by
following the guidance in: Section 3 of BS 5925: 1991 (1995); or CIBSE Guide A:
1999, Design data, section A4, Air infiltration and natural ventilation; or CIBSE AM10:

123
Natural Ventilation in non-domestic Buildings (2005) Applications Manual AM10:
2005’.
In ‘Condensation’ (section 3.15) the guideline is that ‘Every Building must be designed
and constructed so there is no threat to the occupants health or building fabric as a result
of surface or interstitial condensation’ Reference is made to BS 5250: 2002 ‘British
Standard Code of Practice for the control of condensation in buildings’ for correct
construction techniques. BS 5250 states that to avoid condensation 0.5 to 1.5 ach
recommended.
In ‘Natural Lighting’ (section 3.16) is stated that every building must be designed and
constructed in such a way that natural lighting is provided to ensure that the health of the
occupants is not threatened.
Latest changes
Minor alterations and corrections have also been made. A full list of changes to the May
2009 edition of the non-domestic Technical Handbooks is available on the Building
Standards website.
Energy
Section 6 of the Technical Handbook for non-domestic buildings outlines the energy
efficiency requirements to satisfy regulations with regard to energy conservation. The
energy standards apply to conversions and also work on existing buildings, such as;
extensions, alterations and replacements. These can be summarised as follows:
In ‘Carbon dioxide Emissions’ (section 6.1) is stated that ‘every building must be
designed and constructed in such a way that: (a) the energy performance is calculated in
accordance with a methodology which is asset based, conforms with the European
Directive on the Energy Performance of Buildings 2002/91/EC and uses UK climate
data; and (b) the energy performance of the building is capable of reducing carbon
dioxide emissions.
In ‘Building Insulation Envelope’ (section 6.2) the insulation envelope resists thermal
transfer. This translates to a minimum prescribed thermal performance for the envelope

124
that can be demonstrated via three methods available; the elemental, heat loss or carbon
emissions calculation.
In ‘Heating System’ (section 6.3) the heating, hot water service systems boilers, warm
air heaters, radiant heaters, heat pumps, and domestic hot water systems achieve
optimum energy efficiency. Maximum carbon intensity limits must be adhered to.
In ‘Insulation of pipes, ducts and vessels’ (section 6.4) is stated that temperature
loss/gain from vessels, piped and ducted services and temperature gain to cooled pipes
and ducts is resisted. Insulation and lagging must applied as nominated in BS 5422:
2001.
In ‘Artificial and display lighting’ (section 6.5) displays the artificial lighting systems
achieve optimum energy efficiency. Minimum efficacy limits must be adhered to and is
capable of being controlled to achieve optimum energy efficiency.
In ‘Mechanical Ventilation and Air Conditioning (MVAC)’ (section 6.6), the form and
fabric minimises the use of mechanical ventilating or cooling systems, however those
systems installed must achieve optimum energy efficiency. Total specific fan power to
be not greater than 1.5 W/litres/second and in non-domestic buildings, the ventilating
and cooling systems installed are energy efficient and are capable of being controlled to
achieve optimum energy efficiency.
In ‘Commissioning Building Services’ (section 6.7), buildings must be designed and
constructed and energy supply systems and building services are commissioned to
achieve optimum energy efficiency.
In ‘Written Information’ (section 6.8) states that the owner must provide written
information to occupiers of a building.
In ‘Energy Performance Certificates’ (section 6.9) is stated that every building must be
designed and constructed in order to an energy performance certificate for the building is
affixed to the building; and the energy performance certificate is displayed in a
prominent place within the building.
In ‘Metering’ (section 6.10) states that each part of a building designed for different
occupation is fitted with fuel consumption meters in every building.

125
Latest changes
The following is a summary of the changes which have been introduced into this section
between 1 May 2007 and 30 April 2009. Standard 6.9 (energy performance certificates)
- amended standard and accompanying guidance (4 January 2009) standard 6.1 (carbon
dioxide emissions) - Correction to thermal bridging table - value for lintels (1 May
2009)
Relevant legislation
Reference should be made to UK legal requirements enforcing article 13 of the Energy
End-Use Efficiency and Energy Services Directive 2006/32/EC. When building work is
carried to an existing building with a floor area of more than 1000 m2 or a new building
is constructed, the energy supply companies providing services to such buildings should
be notified.
Appendix B – Issues for LZCT in the Building Standards
Section LZCT
Standard
Comment on effect of
LZCT on standards
1 Structure
Solar thermal
systems
1.1
The roof must be strong
enough to hold the weight
of the solar collector.
Photovoltaic
1.1
The roof must be strong
enough to hold the weight
of the solar panel.
Combined Heat
and Power
1.1
The same consideration as
a conventional gas boiler
room.
Ground-source
Heat Pumps
1.1
When excavating the
ground the impact on the
stability of building has to
be considered

126
Wind Power
1.1
The roof or gable end of a
building must be strong
enough to hold the weight
of a wind turbine unit.
Biomass
1.1
The same consideration as
a conventional boiler
room.
The boiler room could
only be located on the
ground floor with
sufficient storage space for
biomass fuel.
2 Fire
Solar thermal
systems
2.7
External exposures to fire
for roof cladding and roof
coverings have to be
considered.
Photovoltaics
2.7
External exposures to fire
for roof cladding and roof
coverings have to be
considered.
Combined Heat
and Power
2.1
The same consideration as
a conventional gas boiler
room.
Ground-source
No effect.
Heat Pumps
Wind Power
No effect.
Biomass
2.6
Storing of biomass fuel
must be taken into account.
The storage installation

127
must be designed to inhibit
fire from spreading beyond
its boundary
3 Environment
Solar thermal
systems
No effect.
Photovoltaic
No effect.
Combined Heat
and Power
3.1,
3.17 to
3.22
The same consideration as
a conventional gas boiler
room.
Ground-source
Heat Pumps
No effect.
Wind Power
No effect.
Biomass
3.1,
3.17 to
3.22
The same consideration as
a conventional gas boiler
room.
4 Safety
Solar thermal
systems
No effect.
Photovoltaic
4.5
The electrical cabling and
switch gear has to be
safely designed and
installed to the appropriate
electrical standard.
Combined Heat
and Power
4.5, 4.9
The electrical cabling and
switch gear has to be
safely designed and
installed to the appropriate
electrical standard. In
addition it has to conform
to G59/1 connecting to the
Regional Electricity
Companies Distribution

128
System.
Ground-source
Heat Pumps
4.5
The electrical cabling and
switch gear has to be
safely designed and
installed to the appropriate
electrical standard.
Wind Power
4.5
The electrical cabling and
switch gear has to be
safely designed and
installed to the appropriate
electrical
standard
Biomass
4.5, 4.9
No effect - to the same
standard as a conventional
boiler system
5 Noise
Solar thermal
systems
No effect.
Photovoltaic
No effect.
District Heating
5.1
No effect - to the same
standard of acoustic
separation as a
conventional boiler room.
Combined Heat
and Power
5.1
Installations generate some
noise but this can be
reduced by acoustic
enclosures. The building
plant room must be
designed to take care of
any excess noise
generated.
Ground-source
Heat Pumps
5.1
No effect - to the same
standard of acoustic

129
separation as a
conventional boiler room.
Wind Power
5.1
The vibration impact of
turbines fitted to buildings
is largely unknown and
would require detailed
evaluation during the
development of any
building design.
Biomass
5.1
No effect - to the same
standard of acoustic
separation as a
conventional boiler room.
6 Energy
Solar thermal
systems
6.7, 6.8
The solar system has to be
commissioned.
Information on the
operation and maintenance
of the system must be
provided.
Photovoltaic
6.7 & 6.8.
The PV system has to be
commissioned.
Information on the
operation and maintenance
of the system must be
provided.
Combined Heat
and Power
6.3, 6.4,
6.7, 6.8
The same consideration as
a conventional gas boiler
room. The heating services
must be designed and
commissioned to achieve
optimum energy
efficiency.
All space heating pipes,
ducts and vessels must be

130
thermally insulated.
Information on the
operation and maintenance
of the system must be
provided
Ground-source
Heat Pumps
6.7, 6.8
The heat pump has to be
commissioned.
Information on the
operation and maintenance
of the system services
must be provided.
Wind Power
6.7, 6.8
The turbine has to be
commissioned.
Information on the
operation and maintenance
of the system must be
provided.
Biomass
6.3, 6.4,
6.7, 6.8
The same consideration as
a conventional gas boiler
room. The heating services
must be designed and
commissioned to achieve
optimum energy
efficiency.
All space heating pipes,
ducts and vessels must be
thermally insulated.
Information on the
operation and maintenance
of the system must be
provided.