
Retrieving Leaf Chlorophyll Content by Incorporating ... · remote sensing Article Retrieving Leaf...
24
remote sensing Article Retrieving Leaf Chlorophyll Content by Incorporating Variable Leaf Surface Reflectance in the PROSPECT Model Feng Qiu 1 , Jing M. Chen 1,2 , Holly Croft 2 , Jing Li 1 , Qian Zhang 1 , Yongqin Zhang 3 and Weimin Ju 1, * 1 International Institute for Earth System Science, Nanjing University, Nanjing 210023, China 2 Department of Geography and Planning, University of Toronto, Toronto, ON M5S 3G3, Canada 3 Department of Biological Sciences, Delta State University, Cleveland, MS 38733, USA * Correspondence: [email protected] Received: 3 June 2019; Accepted: 1 July 2019; Published: 2 July 2019 Abstract: Leaf chlorophyll content plays a vital role in plant photosynthesis. The PROSPECT model has been widely used for retrieving leaf chlorophyll content from remote sensing data over various plant species. However, despite wide variations in leaf surface reflectance across different plant species and environmental conditions, leaf surface reflectance is assumed to be the same for different leaves in the PROSPECT model. This work extends the PROSPECT model by taking into account the variation of leaf surface reflection. In the modified model named PROSPECT-Rsurf, an additional surface layer with a variable refractive index is bounded on the N elementary layers. Leaf surface reflectance (Rs) is characterized by the difference between the refractive indices of leaf surface and interior layers. The specific absorption coefficients of the leaf total chlorophyll and carotenoids were recalibrated using a cross-calibration method and the refractive indices of leaf surface and interior layers were obtained during model inversion. Chlorophyll content (C ab ) retrieval and spectral reconstruction in the visible spectral region (VIS, 400–750 nm) were greatly improved using PROSPECT-Rsurf, especially for leaves covered by heavy wax or hard cuticles that lead to high surface reflectance. The root mean square error (RMSE) of chlorophyll estimates decreased from 11.1 μg/cm 2 to 8.9 μg/cm 2 and the Pearson’s correlation coefficient (r) increased from 0.81 to 0.88 (p < 0.01) for broadleaf samples in validation, compared to PROSPECT-5. For needle leaves, r increased from 0.71 to 0.89 (p < 0.01), but systematic overestimation of C ab was found due to the edge effects of needles. After incorporating the edge effects in PROSPECT-Rsurf, the overestimation of C ab was alleviated and its estimation was improved for needle leaves. This study explores the influence of leaf surface reflectance on C ab estimation at the leaf level. By coupling PROSPECT-Rsurf with canopy models, the influence of leaf surface reflectance on canopy reflectance and therefore canopy chlorophyll content retrieval can be investigated across different spatial and temporal scales. Keywords: leaf chlorophyll content; leaf surface reflectance; leaf radiative transfer model; PROSPECT; hyperspectral remote sensing 1. Introduction Leaf chlorophyll plays a critical role in plant photosynthesis and the conversion of CO 2 into stored carbohydrate. Accurate measurements of leaf chlorophyll content over different spatial and temporal extents using remote sensing techniques are needed for monitoring vegetation stress and productivity, and for forest management and precision agriculture applications. As light directly reflected from leaf epidermis does not interact with interior materials, it contains little information Remote Sens. 2019, 11, 1572; doi:10.3390/rs11131572 www.mdpi.com/journal/remotesensing
Transcript of Retrieving Leaf Chlorophyll Content by Incorporating ... · remote sensing Article Retrieving Leaf...
remote sensing
Article
Retrieving Leaf Chlorophyll Content byIncorporating Variable Leaf Surface Reflectance in thePROSPECT Model
Feng Qiu 1 , Jing M. Chen 1,2, Holly Croft 2 , Jing Li 1, Qian Zhang 1, Yongqin Zhang 3 andWeimin Ju 1,*
1 International Institute for Earth System Science, Nanjing University, Nanjing 210023, China2 Department of Geography and Planning, University of Toronto, Toronto, ON M5S 3G3, Canada3 Department of Biological Sciences, Delta State University, Cleveland, MS 38733, USA* Correspondence: [email protected]
Received: 3 June 2019; Accepted: 1 July 2019; Published: 2 July 2019�����������������
Abstract: Leaf chlorophyll content plays a vital role in plant photosynthesis. The PROSPECT modelhas been widely used for retrieving leaf chlorophyll content from remote sensing data over variousplant species. However, despite wide variations in leaf surface reflectance across different plant speciesand environmental conditions, leaf surface reflectance is assumed to be the same for different leaves inthe PROSPECT model. This work extends the PROSPECT model by taking into account the variationof leaf surface reflection. In the modified model named PROSPECT-Rsurf, an additional surface layerwith a variable refractive index is bounded on the N elementary layers. Leaf surface reflectance (Rs)is characterized by the difference between the refractive indices of leaf surface and interior layers.The specific absorption coefficients of the leaf total chlorophyll and carotenoids were recalibratedusing a cross-calibration method and the refractive indices of leaf surface and interior layers wereobtained during model inversion. Chlorophyll content (Cab) retrieval and spectral reconstructionin the visible spectral region (VIS, 400–750 nm) were greatly improved using PROSPECT-Rsurf,especially for leaves covered by heavy wax or hard cuticles that lead to high surface reflectance.The root mean square error (RMSE) of chlorophyll estimates decreased from 11.1 µg/cm2 to 8.9 µg/cm2
and the Pearson’s correlation coefficient (r) increased from 0.81 to 0.88 (p < 0.01) for broadleaf samplesin validation, compared to PROSPECT-5. For needle leaves, r increased from 0.71 to 0.89 (p < 0.01),but systematic overestimation of Cab was found due to the edge effects of needles. After incorporatingthe edge effects in PROSPECT-Rsurf, the overestimation of Cab was alleviated and its estimationwas improved for needle leaves. This study explores the influence of leaf surface reflectance on Cabestimation at the leaf level. By coupling PROSPECT-Rsurf with canopy models, the influence of leafsurface reflectance on canopy reflectance and therefore canopy chlorophyll content retrieval can beinvestigated across different spatial and temporal scales.
Keywords: leaf chlorophyll content; leaf surface reflectance; leaf radiative transfer model; PROSPECT;hyperspectral remote sensing
1. Introduction
Leaf chlorophyll plays a critical role in plant photosynthesis and the conversion of CO2 intostored carbohydrate. Accurate measurements of leaf chlorophyll content over different spatial andtemporal extents using remote sensing techniques are needed for monitoring vegetation stress andproductivity, and for forest management and precision agriculture applications. As light directlyreflected from leaf epidermis does not interact with interior materials, it contains little information
Remote Sens. 2019, 11, 1572; doi:10.3390/rs11131572 www.mdpi.com/journal/remotesensing
Remote Sens. 2019, 11, 1572 2 of 24
on the leaf biochemistry and therefore should be excluded from the remotely sensed leaf reflectance.In the visible spectrum (VIS, 400–750 nm), about 3% to 10% (or higher for some species) of the lightstriking a leaf surface is directly reflected [1,2], accounting for up to 75% of the total reflected signalin the blue and red bands where light is strongly absorbed by pigments, and up to 25% of the totalreflectance in the near infrared spectral region (NIR, 750–1300 nm) [3]. As a result, variations in leafsurface reflectance will introduce uncertainty to the deviation of leaf pigments from reflectance dataacross a wide range of species and plant functional types [4,5].
Leaf surface reflectance varies greatly with plant species, leaf development and environmentalconditions [6–8]. It is controlled by epidermal characteristics such as the morphology and density ofepicuticular waxes or trichomes [4,9], which can greatly enhance the leaf reflectance in the VIS [10,11].Waxes also greatly increase the leaf reflectance in the NIR, whilst the effect of trichomes on NIRreflectance can be variable [4]. The magnitude and angular distribution of surface reflectance aredependent on the leaf surface biophysical properties. The highly absorbing visible wavelengths show astrong specular reflection compared to the more diffuse transmitted light [12]. Leaf specular reflectancefrom a surface is usually considered as wavelength-independent [13], as the leaf cuticle usually containsno pigments [7].
Polarization measurements are classically used to separate leaf surface specular reflectance(polarized) from interior diffuse reflectance (non-polarized) and obtain the optical properties of theleaf epidermis [14]. Leaf bidirectional reflectance measurements are also widely used to differentiatespecular and diffuse components and to non-destructively estimate the roughness or refractive indexof the epidermis [1,2]. However, these methods are complex and usually need specialized instrumentsthat is not commonly used, precluding widespread measurement for model validation, and are hard toapply at the canopy scale.
Alternatively, efforts have been made to diminish leaf surface reflectance effects on the leafchlorophyll content retrieval from remote sensing data. Leaf chlorophyll content estimation methodscan be categorized into (1) parametric regression, (2) non-parametric regression, (3) physically based,and (4) hybrid methods (reviewed in [15]). Spectral indices, one of the most widely used parametricregression methods, have been modified to use reflectance in the blue wavelengths (~450 nm) to reducethe effects of surface reflectance on leaf pigment retrieval across different species [5]. Derivative spectrahave also been found to be relatively insensitive to variations of leaf surface reflectance, especiallyusing red-edge wavelengths [4,16]. However, regression methods suffer in terms of their transferabilityacross temporal and spatial scales [17].
In comparison with regression methods, physically based models are underpinned by scientifictheory and therefore have the ability to produce accurate and robust prediction of pigment content acrossdifferent species and spatial scales. Bousquet et al. [2] proposed a three-parameter model differentiatingsurface reflectance from bidirectional measurements and retrieved values of cuticle refractive indexand roughness parameter for the studied three species, but the model is over-parameterized andimpractical for the commonly used leaf directional-hemispherical spectra. The PROSPECT model [18]is the most popular leaf radiative transfer model, due to its widespread validation and ease ofinversion [19–21]. In PROSPECT, leaf surface reflectance is calculated from the refractive index of theleaf and the maximum incident angle, both of which are fixed values [18]. However, high surfacereflectance due to heavy waxes on eucalypts leaves has shown to be a key source of uncertainty inpigment estimation from PROSPECT [22–24]. Jay et al. [13] proposed a physical model coupled withPROSPECT (PROCOSINE) to account for leaf surface reflectance and leaf orientation effects on leafbidirectional reflectance factor (BRF), and successfully applied the model to close range hyperspectralimages for retrieving foliar biochemistry. Li et al. [25] optimized the inversion strategies of PROSPECTfor alleviating leaf surface reflectance effect, by introducing wavelet coefficient spectra generatedafter continuous wavelet transform (CWT) in the cost function, and improved the performance forfoliar pigments retrieval using BRF spectra. Gerber et al. [26] used an additional layer in PROSPECTto compensate for the surface effects with a refractive index that is different from that of the leaf
Remote Sens. 2019, 11, 1572 3 of 24
interior. Nevertheless, it is assumed that the surface layer reflectance does not vary with differentleaf samples, despite observations of large variations in leaf surface reflectance across species, growthstages, and environmental conditions [7,27].
In this study, we aim at extending PROSPECT-5 to consider variable leaf surface reflectanceand alleviate its effect on leaf chlorophyll content estimation from hyperspectral leaf reflectancedata. The objectives of this study are to: (1) introduce an additional surface layer bounded on the Nelementary layers in PROSPECT-5, characterized by variable surface refractive index; (2) determineleaf surface and interior refractive indices for each samples and recalibrate the specific absorptioncoefficients for leaf total chlorophyll and carotenoids; and (3) evaluate the performance and sensitivityof chlorophyll content retrieval and leaf spectra reconstruction.
2. Data
2.1. Datasets
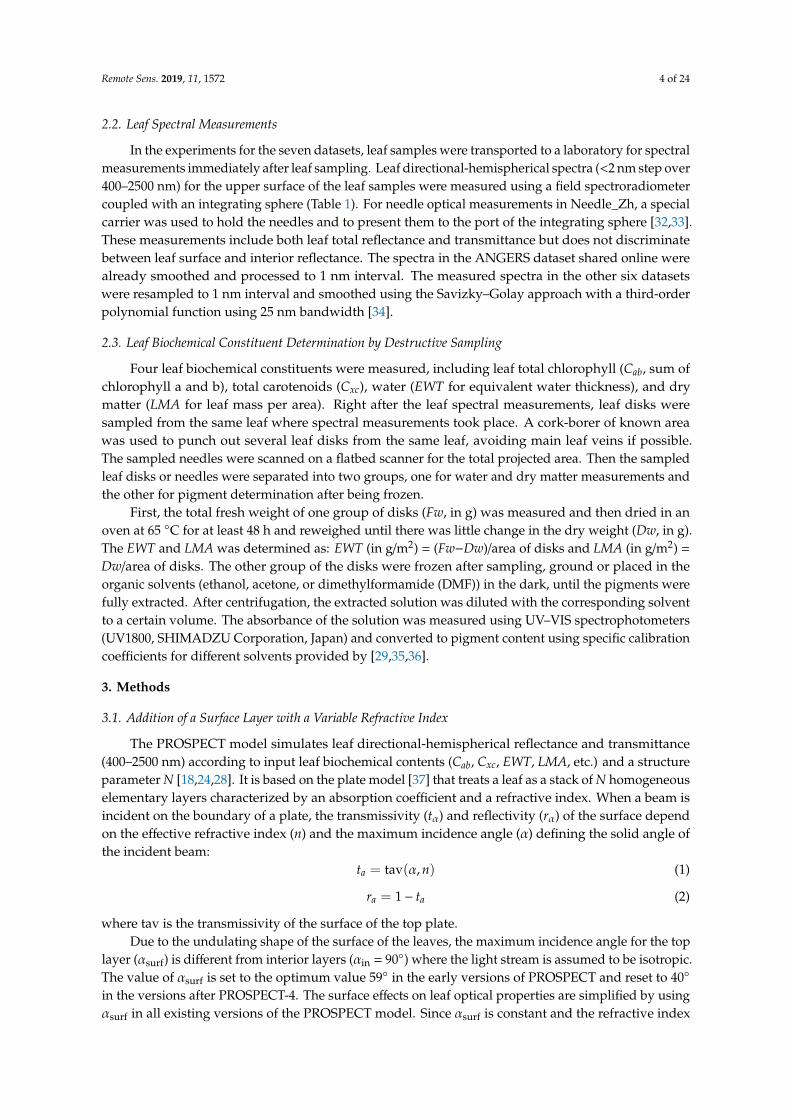
Seven independent datasets are used in this study. The datasets are fresh leaf samples collectedand measured by different research groups (Table 1). The ANGERS dataset is downloaded online,shared by its authors. The other six datasets are from our field experiments in China (XS, BM, JTL,and NX) and Canada (Crop_UT and Needle_Zh). There are 922 fresh leaf samples from 56 speciesin total, including broadleaf and needle, dicotyledon and monocotyledon, trees and herbaceous,and annual and perennial plants, encompassing a wide range of physiological statuses. ANGERShas been widely used for model calibration, as it contains a large number of leaves from differentspecies and a wide range of pigment contents [28]. ANGERS and one-fifth of the leaves in XS, BM, JTL,and NX datasets comprise the calibration dataset, and the rest samples are used as validation data.
Table 1. Main characteristics of the seven datasets used in this study.
ANGERS XS BM JTL NX Crop_UT Needle_Zh
Year 2003 2014 2015 2015 2014 2013 2003–2004Number of samples 276 175 54 35 140 152 90Number of species 43 2 (a) 8 (b) 1 (c) 1 (d) 2 (e) 1 (f)
Spectral measurementdevices
ASD FieldSpecIntegratingsphere (IS)
ASD FieldSpec 3ASD RTS-3ZC IS
ASD FieldSpecPro FR
Li-COR 1800 IS
ASD FieldSpecPro FR
Li-COR 1800 IS
Spectral sampling 1.4 nm (400–1000 nm), 2 nm (1000–2500 nm)Solvent for pigments Ethanol 95% Acetone 100% DMF * DMFMethod for pigments [29] [29] [30] [31]
Chlorophyll (µg/cm2)Max 106.7 93.8 80.8 83.9 71.7 92.5 62.6Min 0.8 16.8 1.4 30.1 20.1 0.4 12.0
Mean 33.9 50.9 40.1 56.1 44.0 43.6 29.3SD ** 21.7 15.5 15.5 15.9 11.2 20.3 9.1
Carotenoids (µg/cm2)Max 25.3 17.2 16.7 15.2 12.8 \ 10.3Min 0.0 3.8 4.4 6.8 3.9 \ 3.2
Mean 8.7 9.9 9.9 10.7 8.0 \ 6.3SD 5.1 2.9 2.7 2.3 1.9 \ 1.6
Water (g/m2) \
Max 340.0 144.8 206.1 312.0 168.8 \ \
Min 43.9 59.0 65.0 143.8 84.4 \ \
Mean 116.2 102.9 115.3 213.6 117.2 \ \
SD 48.6 15.9 29.1 47.0 16.1 \ \
Dry matter (g/m2) \
Max 331.0 166.2 145.6 185.9 56.1 \ \
Min 16.6 55.4 49.0 67.0 8.7 \ \
Mean 52.4 100.9 81.8 122.6 33.2 \ \
SD 36.7 24.7 21.8 26.9 6.0 \ \
(a) Species including Liquidambar formosana L. and Quercus acutissima L.; (b) Species including Koelreuteria paniculata L.,Sapium sebiferum L., Malus spectabilis L., Lagerstroemia indica L., Cerasus serrulata L., Liquidambar formosana L., Populusnigra L., and Cyclocarya paliurus L.; (c) Ligustrum lucidum L.; (d) Zea mays L.; (e) Zea mays L. and Triticum aestivum L.;(f) Picea mariana (Mill.). * Dimethylformamide. ** Standard Deviation
Remote Sens. 2019, 11, 1572 4 of 24
2.2. Leaf Spectral Measurements
In the experiments for the seven datasets, leaf samples were transported to a laboratory for spectralmeasurements immediately after leaf sampling. Leaf directional-hemispherical spectra (<2 nm step over400–2500 nm) for the upper surface of the leaf samples were measured using a field spectroradiometercoupled with an integrating sphere (Table 1). For needle optical measurements in Needle_Zh, a specialcarrier was used to hold the needles and to present them to the port of the integrating sphere [32,33].These measurements include both leaf total reflectance and transmittance but does not discriminatebetween leaf surface and interior reflectance. The spectra in the ANGERS dataset shared online werealready smoothed and processed to 1 nm interval. The measured spectra in the other six datasetswere resampled to 1 nm interval and smoothed using the Savizky–Golay approach with a third-orderpolynomial function using 25 nm bandwidth [34].
2.3. Leaf Biochemical Constituent Determination by Destructive Sampling
Four leaf biochemical constituents were measured, including leaf total chlorophyll (Cab, sum ofchlorophyll a and b), total carotenoids (Cxc), water (EWT for equivalent water thickness), and drymatter (LMA for leaf mass per area). Right after the leaf spectral measurements, leaf disks weresampled from the same leaf where spectral measurements took place. A cork-borer of known areawas used to punch out several leaf disks from the same leaf, avoiding main leaf veins if possible.The sampled needles were scanned on a flatbed scanner for the total projected area. Then the sampledleaf disks or needles were separated into two groups, one for water and dry matter measurements andthe other for pigment determination after being frozen.
First, the total fresh weight of one group of disks (Fw, in g) was measured and then dried in anoven at 65 ◦C for at least 48 h and reweighed until there was little change in the dry weight (Dw, in g).The EWT and LMA was determined as: EWT (in g/m2) = (Fw−Dw)/area of disks and LMA (in g/m2) =
Dw/area of disks. The other group of the disks were frozen after sampling, ground or placed in theorganic solvents (ethanol, acetone, or dimethylformamide (DMF)) in the dark, until the pigments werefully extracted. After centrifugation, the extracted solution was diluted with the corresponding solventto a certain volume. The absorbance of the solution was measured using UV–VIS spectrophotometers(UV1800, SHIMADZU Corporation, Japan) and converted to pigment content using specific calibrationcoefficients for different solvents provided by [29,35,36].
3. Methods
3.1. Addition of a Surface Layer with a Variable Refractive Index
The PROSPECT model simulates leaf directional-hemispherical reflectance and transmittance(400–2500 nm) according to input leaf biochemical contents (Cab, Cxc, EWT, LMA, etc.) and a structureparameter N [18,24,28]. It is based on the plate model [37] that treats a leaf as a stack of N homogeneouselementary layers characterized by an absorption coefficient and a refractive index. When a beam isincident on the boundary of a plate, the transmissivity (tα) and reflectivity (rα) of the surface dependon the effective refractive index (n) and the maximum incidence angle (α) defining the solid angle ofthe incident beam:
ta = tav(α, n) (1)
ra = 1− ta (2)
where tav is the transmissivity of the surface of the top plate.Due to the undulating shape of the surface of the leaves, the maximum incidence angle for the top
layer (αsurf) is different from interior layers (αin = 90◦) where the light stream is assumed to be isotropic.The value of αsurf is set to the optimum value 59◦ in the early versions of PROSPECT and reset to 40◦
in the versions after PROSPECT-4. The surface effects on leaf optical properties are simplified by usingαsurf in all existing versions of the PROSPECT model. Since αsurf is constant and the refractive index
Remote Sens. 2019, 11, 1572 5 of 24
(n) is a unique spectrum for all leaves and is identical for the N layers, the surface effects in PROSPECTdoes not change with leaf samples. The mean reflectance of the upper boundary layer from 400–800 nm(ra) is 0.037. However, leaf surface reflectance could vary greatly with plant species, leaf development,and environmental conditions [6–8]. Gerber et al. [26] added an additional non-absorbing surface layeron top of the N elementary layers in PROSPECT to compensate for the surface effects. The refractiveindex of the surface layer (nsurf (λ)) is different from that of the interior elementary layers (nin (λ)),and their difference determines the surface reflectance as Fresnel coefficients depend on the effectiverefractive index of the interface. Nevertheless, since nsurf (λ) and nin (λ) in their study were fixedspectra, the surface reflectance did not change with the leaf samples.
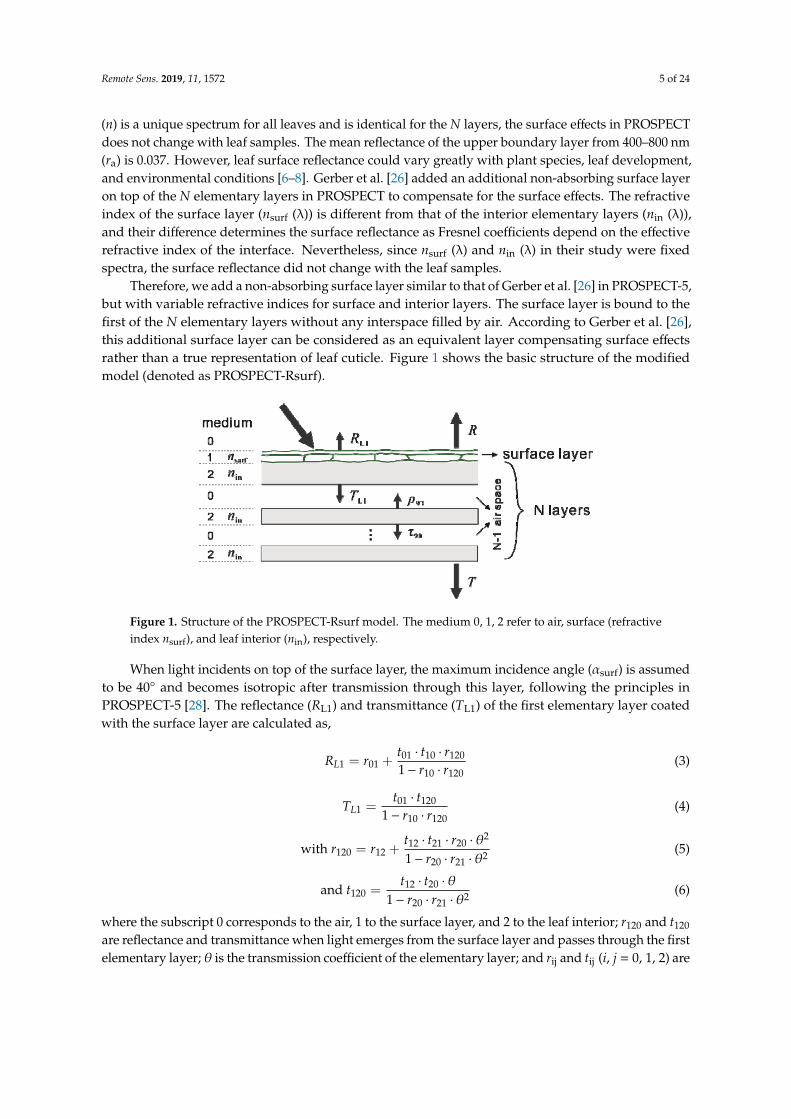
Therefore, we add a non-absorbing surface layer similar to that of Gerber et al. [26] in PROSPECT-5,but with variable refractive indices for surface and interior layers. The surface layer is bound to thefirst of the N elementary layers without any interspace filled by air. According to Gerber et al. [26],this additional surface layer can be considered as an equivalent layer compensating surface effectsrather than a true representation of leaf cuticle. Figure 1 shows the basic structure of the modifiedmodel (denoted as PROSPECT-Rsurf).
Remote Sens. 2019, 11, 1572 5 of 24
The PROSPECT model simulates leaf directional-hemispherical reflectance and transmittance (400–2500 nm) according to input leaf biochemical contents (Cab, Cxc, EWT, LMA, etc.) and a structure parameter N [18,24,28]. It is based on the plate model [37] that treats a leaf as a stack of N homoge-neous elementary layers characterized by an absorption coefficient and a refractive index. When a beam is incident on the boundary of a plate, the transmissivity (tα) and reflectivity (rα) of the surface depend on the effective refractive index (n) and the maximum incidence angle (α) defining the solid angle of the incident beam:
( )tav ,at nα= (1)
1a ar t= − (2)
where tav is the transmissivity of the surface of the top plate. Due to the undulating shape of the surface of the leaves, the maximum incidence angle for the
top layer (αsurf) is different from interior layers (αin = 90°) where the light stream is assumed to be isotropic. The value of αsurf is set to the optimum value 59° in the early versions of PROSPECT and reset to 40° in the versions after PROSPECT-4. The surface effects on leaf optical properties are sim-plified by using αsurf in all existing versions of the PROSPECT model. Since αsurf is constant and the refractive index (n) is a unique spectrum for all leaves and is identical for the N layers, the surface effects in PROSPECT does not change with leaf samples. The mean reflectance of the upper bound-ary layer from 400–800 nm (ra) is 0.037. However, leaf surface reflectance could vary greatly with plant species, leaf development, and environmental conditions [6–8]. Gerber et al. [26] added an additional non-absorbing surface layer on top of the N elementary layers in PROSPECT to com-pensate for the surface effects. The refractive index of the surface layer (nsurf (λ)) is different from that of the interior elementary layers (nin (λ)), and their difference determines the surface reflectance as Fresnel coefficients depend on the effective refractive index of the interface. Nevertheless, since nsurf
(λ) and nin (λ) in their study were fixed spectra, the surface reflectance did not change with the leaf samples.
Therefore, we add a non-absorbing surface layer similar to that of Gerber et al. [26] in PRO-SPECT-5, but with variable refractive indices for surface and interior layers. The surface layer is bound to the first of the N elementary layers without any interspace filled by air. According to Gerber et al. [26], this additional surface layer can be considered as an equivalent layer compensat-ing surface effects rather than a true representation of leaf cuticle. Figure 1 shows the basic structure of the modified model (denoted as PROSPECT-Rsurf).
Figure 1. Structure of the PROSPECT-Rsurf model. The medium 0, 1, 2 refer to air, surface (refractive index nsurf), and leaf interior (nin), respectively.
When light incidents on top of the surface layer, the maximum incidence angle (αsurf) is as-sumed to be 40° and becomes isotropic after transmission through this layer, following the princi-ples in PROSPECT-5 [28]. The reflectance (RL1) and transmittance (TL1) of the first elementary layer coated with the surface layer are calculated as,
Figure 1. Structure of the PROSPECT-Rsurf model. The medium 0, 1, 2 refer to air, surface (refractiveindex nsurf), and leaf interior (nin), respectively.
When light incidents on top of the surface layer, the maximum incidence angle (αsurf) is assumedto be 40◦ and becomes isotropic after transmission through this layer, following the principles inPROSPECT-5 [28]. The reflectance (RL1) and transmittance (TL1) of the first elementary layer coatedwith the surface layer are calculated as,
RL1 = r01 +t01 · t10 · r120
1− r10 · r120(3)
TL1 =t01 · t120
1− r10 · r120(4)
with r120 = r12 +t12 · t21 · r20 · θ2
1− r20 · r21 · θ2 (5)
and t120 =t12 · t20 · θ
1− r20 · r21 · θ2 (6)
where the subscript 0 corresponds to the air, 1 to the surface layer, and 2 to the leaf interior; r120 and t120
are reflectance and transmittance when light emerges from the surface layer and passes through the firstelementary layer; θ is the transmission coefficient of the elementary layer; and rij and tij (i, j = 0, 1, 2) are
Remote Sens. 2019, 11, 1572 6 of 24
the reflectivity and transmissivity at the interface when light emerges from medium i into j, respectively,defined by the maximum incident angle (α) and effective refractive index (n′) as:
tij = tav(α, n′) (7)
rij = 1− tij (8)
where n′ = n j/ni. The reflectance ρ90 and transmittance τ90 of the other N-1 elementary layer followEquations (1) to (6) in [18]. The total reflectance (R) and transmittance (T) of a leaf is calculated bystacking the first layer group (a plate coated with surface layer) and the N-1 layers according to [18].
Leaf surface reflectance is specified by the multiple scattering between the surface layer and thefirst elementary layer, characterized by the two refractive indices nsurf (λ) and nin (λ). Reflectance ofthe additional surface layer (Rs) is defined based on the calculation of the reflectance of the first grouplayer (RL1) using Equations (3) to (8), by assuming the transmittance of the first elementary layer (θ) tobe 0:
Rs = r01 +t01 · t10 · r12
1− r10 · r12(9)
The transmittance of the surface layer is:
Ts = 1−Rs (10)
Based on the definition, the surface layer reflectance in PROSPECT-Rsurf is the surfacedirectional-hemispherical reflectance, consistent with leaf reflectance and transmittance simulated inthe model. It is the integration of leaf surface reflectance over the hemisphere from the leaf uppersurface which includes the leaf specular reflectance as well as multiple scattering between the surfaceand interior layers.
The surface refractive index nsurf(λ) changes with different epidermal materials with variousmorphology and density, while nin(λ) is determined by the internal structure and the organization andcomposition of internal leaf tissues and air spaces. According to Kramers–Kronig (K–K) relations [38],the real (refractive index) and imaginary (absorption coefficient) part of the complex refractive indexare physically linked. Chen and Weng [39] used the K–K relations to derive the effective refractiveindex with promising results and demonstrated variations of the leaf refractive index for different leafsamples. They found that the leaf refractive index decreases almost monotonically with the wavelength(400–2500 nm), confirming the refractive index spectrum used in PROSPECT-3 (nP3(λ)). However,since the K–K relations require complete electromagnetic spectrum of the biochemical absorptioncoefficient which are difficult to obtain so far, it is impracticable for most of the commonly used leafspectral databases covering a limited range of the spectrum [24]. In the latest version PROSPECT-D,nP3(λ) is adopted instead of the one used in PROSPECT-5 in order to avoid artifacts resulting fromnumerical optimization [24]. Since direct measurements of the leaf surface and internal refractiveindices are difficult and the variation of the leaf tissue refractive index with wavelengths remainsunclear, the following two assumptions are made in this study, (1) the spectral variation patterns ofnsurf(λ) and nin(λ) follow the pattern of nP3(λ); and (2) nsurf(λ) is higher than nin(λ). The two refractiveindices nsurf (λ) and nin(λ) are defined by
nsurf(λ) = fsurf · nP3(λ) (11)
nin(λ) = fin · nP3(λ) (12)
where f surf and f in are fractions of the surface and interior refractive indices, respectively, which areindependent of wavelengths but vary with leaf samples. In this way, we can focus on the variations ofthe surface and interior refractive indices between different leaves using only two parameters for each
Remote Sens. 2019, 11, 1572 7 of 24
sample, while the spectral variation characteristics of the two refractive indices are unaltered. In orderto keep nsurf (λ) higher than nin(λ) in the model, nsurf (λ) is expressed as
nsurf(λ) = f ′surf · nin(λ) (13)
with f ′surf higher than 1. The factor f ′surf is the relative refractive index between the leaf surface andthe interior. Therefore, we have two variables f′surf and f in in addition to the structure parameter Nand biochemical contents (Cab, Cxc, EWT, and LMA) in PROSPECT-Rsurf. The main symbols used inthis study and their meanings are listed in Table A1. Considering that leaf pigments absorb light in theVIS domain and effects of the leaf surface reflectance on leaf spectra are significant in the VIS, we makethe above modifications in PROSPECT-Rsurf in the range from 400 to 800 nm in this study.
3.2. Model Calibration
After adding the new surface layer and the two refractive indices in PROSPECT-Rsurf, the specificabsorption coefficient (SAC) of leaf constituents can be recalibrated from wavelength to wavelength.Since absorption by leaf dry matter and water is low in the VIS, only the SAC of total chlorophyll(kCab(λ)) and carotenoids (kCxc(λ)) are recalibrated. The structure parameter N and the refractive indexfractions f′surf and f in change from leaf to leaf and are assumed to be wavelength independent. Since N,f′surf, and f in cannot be directly measured, they are determined in the recalibration process. In orderto avoid unfeasibly large computation introduced by concurrently optimizing all the parameters (N,f′surf, f in, kCab(λ), and kCxc(λ) at each wavelength λ from 400–800 nm), the recalibration process is splitinto two steps. First, the wavelength-independent N, f′surf, and f in are determined, and then kCab(λ)and kCxc(λ) are determined wavelength by wavelength. Due to the possible interaction between thetwo steps, we performed a cross calibration iteratively until the optimized values of these parametersremain almost unchanged. Detailed descriptions are as follows.
3.2.1. Determination of N, f ′surf and f in
The variables N, f′surf, and f in are estimated for each leaf individually from the measured spectra(400–800 nm) with measured Cab, Cxc, EWT, and LMA as input through a numerical optimizationprocess, by finding the best combination of variables that minimizes the merit function:
J(N, f ′sur f , fin
)=
800∑λ=400
[(Rmeas,λ −Rmod,λ
(N, Cab, Cxc, EWT, LMA, f ′sur f , fin
))2
+(Tmeas,λ − Tmod,λ
(N, Cab, Cxc, EWT, LMA, f ′sur f , fin
))2] (14)
where Rmeas,λ and Tmeas,λ are the measured leaf total reflectance and transmittance at wavelengthλ, respectively, and Rmod,λ and Tmod,λ are simulated by PROSPECT-Rsurf. The bound-constrainedoptimization package FMINSEARCHBND.M [40] in the Matlab software is used. The initial values ofN, f′surf, and f in are 1.5 (1–5), 1.1 (1.0001–3), and 1 (0.7–3), respectively, with constrained values givenin brackets. The ranges of f′surf and f in are set according to the measurements and simulation of theleaf refractive index in previous studies in [1,2,26,39,41].
3.2.2. Adjustment of the Specific Absorption Coefficients
After determining N, f′surf, and f in, the SAC of total chlorophyll and carotenoids are adjustedthrough optimization using all leaves comprising the calibration dataset. Similar to the processdescribed in [28], the SAC values of chlorophyll (kCab,λ) and carotenoids (kCxc,λ) at each wavelengthare obtained by minimizing the merit function:
J(kCab,λ, kCxc,λ
)=
m∑i=1
(Ri
meas,λ −Rimod,λ
(kiλ
))2+
(Ti
meas,λ − Timod,λ
(kiλ
))2(15)
Remote Sens. 2019, 11, 1572 8 of 24
where m is the total sample number, kiλ
is the total absorption coefficient of the elementary layer atwavelength λ for sample i, which is calculated from the structure parameter N and the biochemicalcontents as follows:
kiλ =
kCab,λ ·Ciab + kCxc,λ ·Ci
xc + kEWT,λ · EWTi + kLMA,λ · LMAi
Ni(16)
where kEWT,λ and kLMA,λ are SAC of EWT and LMA in PROSPECT-5 at λ, respectively, Ni is the structureparameter of sample i; and Ci
ab, Cixc, EWTi, and LMAi are the measured four biochemical contents of
sample i. The initial values of kCab,λ and kCxc,λ are 0.05 and 0.2, respectively. During the inversion,their values were limited in the range of 0–0.1 and 0–0.5, respectively.
3.2.3. Cross Calibration
After step (2), the adjusted SACs are used for recalculating the values of N, f ′surf, and f in (step (1)).Then the SAC values of Cab and Cxc are re-adjusted (step (2)) and new sets of N, f ′surf, and f in can besubsequently determined (step (1)). We repeat steps (1) and (2) in this way for several times until theoptimized N, f ′surf, and f in values for each sample and the kCab,λ and kCxc,λ spectra from 400 nm to800 nm remain nearly unchanged (changes less 0.1%).
3.3. Model Validation: Criteria for the Comparison of Model Performance
We performed model inversions on the validation datasets separated into broadleaf and needle leafsamples with PROSPECT-5 and PROSPECT-Rsurf. The performances of the two models are comparedin terms of Cab estimation and leaf spectral fit. PROSPECT-Rsurf is inverted on the validation datasetsusing the following merit function:
J(N, Cab, Car, EWT, LMA, f ′sur f , fin
)=
800∑λ=400
[(Rmeas,λ −Rmod,λ
(N, Cab, Car, EWT, LMA, f ′sur f , fin
))2
+(Tmeas,λ − Tmod,λ
(N, Cab, Car, EWT, LMA, f ′sur f , fin
))2] (17)
where Rmeas,λ and Tmeas,λ are the measured leaf total reflectance and transmittance at wavelength λ,respectively, Rmod,λ and Tmod,λ are the ones simulated by PROSPECT-Rsurf.
Standard deviation (σ) and coefficient of variability (CV) are calculated to characterize thedistribution of variables. Pearson’s correlation coefficient (r), root mean square error (RMSE), and bias(BIAS) between the retrieved and measured variables are calculated to evaluate the differences betweenthe measured and estimated variables (such as pigment content, leaf reflectance, or transmittance):
CV(%) =σ
y j× 100 (18)
RMSE =
√√∑nj=1
(y′ j − y j
)2
n(19)
BIAS =
∑nj=1
(y′ j − y j
)n
(20)
where yj is the measurements, yj their mean, y′j the modeled values, and n the sample numbers.
3.4. Model Sensitivity
Since there are no direct measurements of leaf surface and interior refractive indices in this study,the uncertainty in determining f ′surf and f in (corresponding to nsurf and nin) from model inversionusing the experimental data and the effect of such uncertainty on the quality of the calibration should beevaluated. We perform several steps of sensitivity analysis to understand the influence of noise in the
Remote Sens. 2019, 11, 1572 9 of 24
measured spectral data on surface and interior refractive indices determination, and their uncertaintyon the adjustment of SACs and on the overall model performances.
3.4.1. Global Sensitivity Analysis
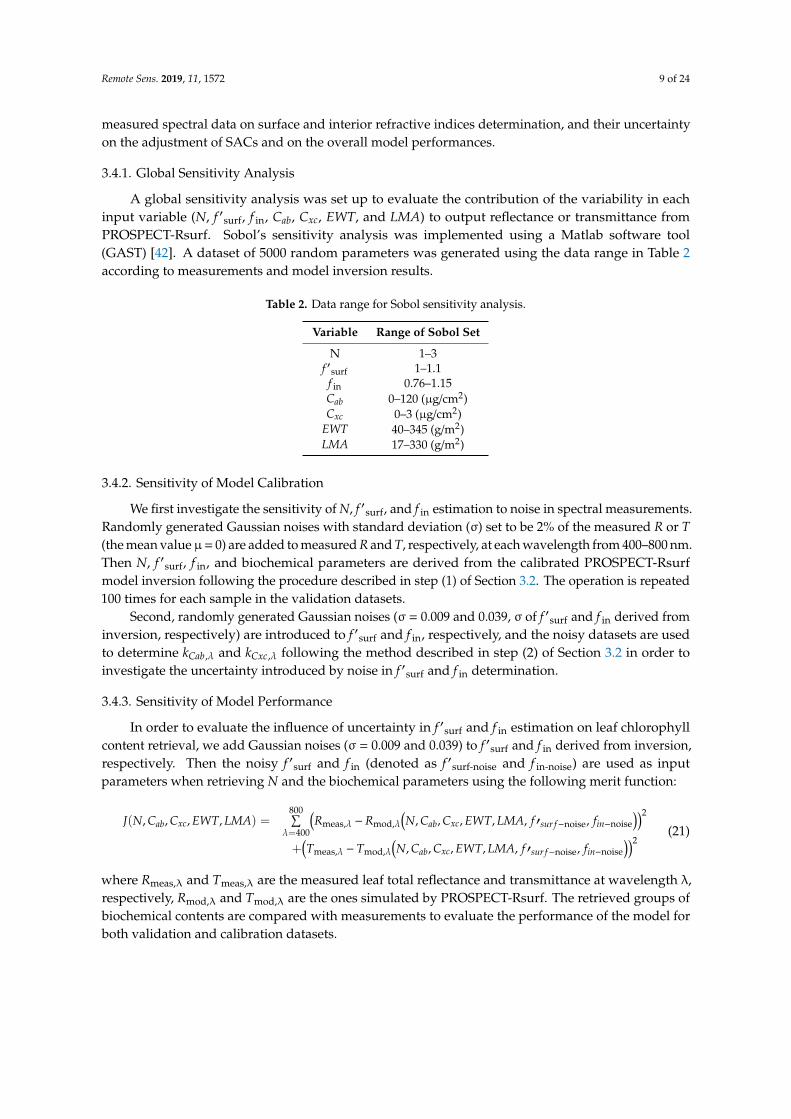
A global sensitivity analysis was set up to evaluate the contribution of the variability in eachinput variable (N, f ′surf, f in, Cab, Cxc, EWT, and LMA) to output reflectance or transmittance fromPROSPECT-Rsurf. Sobol’s sensitivity analysis was implemented using a Matlab software tool(GAST) [42]. A dataset of 5000 random parameters was generated using the data range in Table 2according to measurements and model inversion results.
Table 2. Data range for Sobol sensitivity analysis.
Variable Range of Sobol Set
N 1–3f ′surf 1–1.1
f in 0.76–1.15Cab 0–120 (µg/cm2)Cxc 0–3 (µg/cm2)
EWT 40–345 (g/m2)LMA 17–330 (g/m2)
3.4.2. Sensitivity of Model Calibration
We first investigate the sensitivity of N, f ′surf, and f in estimation to noise in spectral measurements.Randomly generated Gaussian noises with standard deviation (σ) set to be 2% of the measured R or T(the mean valueµ= 0) are added to measured R and T, respectively, at each wavelength from 400–800 nm.Then N, f ′surf, f in, and biochemical parameters are derived from the calibrated PROSPECT-Rsurfmodel inversion following the procedure described in step (1) of Section 3.2. The operation is repeated100 times for each sample in the validation datasets.
Second, randomly generated Gaussian noises (σ = 0.009 and 0.039, σ of f ′surf and f in derived frominversion, respectively) are introduced to f ′surf and f in, respectively, and the noisy datasets are usedto determine kCab,λ and kCxc,λ following the method described in step (2) of Section 3.2 in order toinvestigate the uncertainty introduced by noise in f ′surf and f in determination.
3.4.3. Sensitivity of Model Performance
In order to evaluate the influence of uncertainty in f ′surf and f in estimation on leaf chlorophyllcontent retrieval, we add Gaussian noises (σ = 0.009 and 0.039) to f ′surf and f in derived from inversion,respectively. Then the noisy f ′surf and f in (denoted as f ′surf-noise and f in-noise) are used as inputparameters when retrieving N and the biochemical parameters using the following merit function:
J(N, Cab, Cxc, EWT, LMA) =800∑λ=400
(Rmeas,λ −Rmod,λ
(N, Cab, Cxc, EWT, LMA, f ′sur f−noise, fin−noise
))2
+(Tmeas,λ − Tmod,λ
(N, Cab, Cxc, EWT, LMA, f ′sur f−noise, fin−noise
))2(21)
where Rmeas,λ and Tmeas,λ are the measured leaf total reflectance and transmittance at wavelength λ,respectively, Rmod,λ and Tmod,λ are the ones simulated by PROSPECT-Rsurf. The retrieved groups ofbiochemical contents are compared with measurements to evaluate the performance of the model forboth validation and calibration datasets.
Remote Sens. 2019, 11, 1572 10 of 24
4. Results
4.1. Validation of Model Performances
4.1.1. Recalibrated Specific Absorption Coefficients
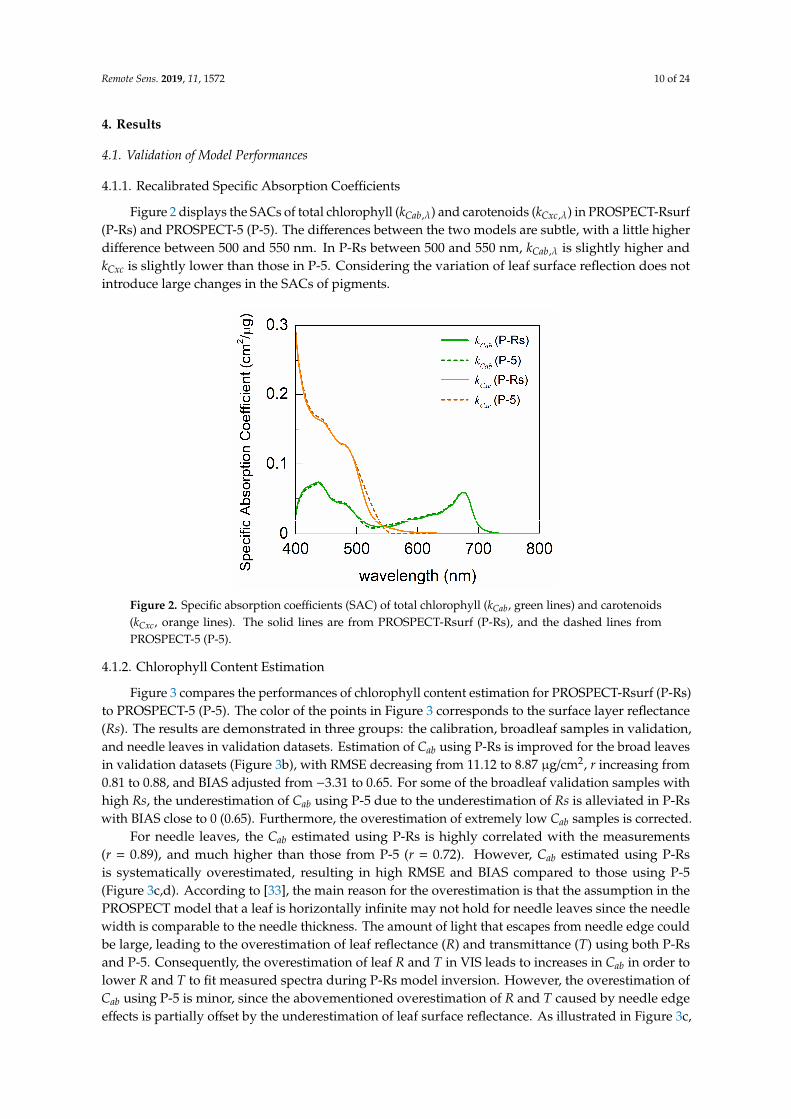
Figure 2 displays the SACs of total chlorophyll (kCab,λ) and carotenoids (kCxc,λ) in PROSPECT-Rsurf(P-Rs) and PROSPECT-5 (P-5). The differences between the two models are subtle, with a little higherdifference between 500 and 550 nm. In P-Rs between 500 and 550 nm, kCab,λ is slightly higher andkCxc is slightly lower than those in P-5. Considering the variation of leaf surface reflection does notintroduce large changes in the SACs of pigments.
Remote Sens. 2019, 11, 1572 10 of 24
respectively. Then the noisy f′surf and fin (denoted as f′surf-noise and fin-noise) are used as input parameters when retrieving N and the biochemical parameters using the following merit function:
( ) ( )( )( )( )
800 2
meas, mod,400
2
me
-noise -
as, mod
noise
-noise -n i e, o s
, , , , , , , , , ,
, , , , , ,
surf in
s
a
urf in
b xc ab xc
ab xc
J N C C EWT LMA R R N C C EWT LMA
T T N C C E
f f
fW A fT LM
λ λλ
λ λ
=
= −
+ −
′
′
(21)
where Rmeas,λ and Tmeas,λ are the measured leaf total reflectance and transmittance at wavelength λ, respectively, Rmod,λ and Tmod,λ are the ones simulated by PROSPECT-Rsurf. The retrieved groups of biochemical contents are compared with measurements to evaluate the performance of the model for both validation and calibration datasets.
4. Results
4.1. Validation of Model Performances
4.1.1. Recalibrated Specific Absorption Coefficients
Figure 2 displays the SACs of total chlorophyll (kCab,λ) and carotenoids (kCxc,λ) in PRO-SPECT-Rsurf (P-Rs) and PROSPECT-5 (P-5). The differences between the two models are subtle, with a little higher difference between 500 and 550 nm. In P-Rs between 500 and 550 nm, kCab,λ is slightly higher and kCxc is slightly lower than those in P-5. Considering the variation of leaf surface reflection does not introduce large changes in the SACs of pigments.
Figure 2. Specific absorption coefficients (SAC) of total chlorophyll (kCab, green lines) and carotenoids (kCxc, orange lines). The solid lines are from PROSPECT-Rsurf (P-Rs), and the dashed lines from PROSPECT-5 (P-5).
4.1.2. Chlorophyll Content Estimation
Figure 3 compares the performances of chlorophyll content estimation for PROSPECT-Rsurf (P-Rs) to PROSPECT-5 (P-5). The color of the points in Figure 3 corresponds to the surface layer re-flectance (Rs). The results are demonstrated in three groups: the calibration, broadleaf samples in validation, and needle leaves in validation datasets. Estimation of Cab using P-Rs is improved for the broad leaves in validation datasets (Figure 3b), with RMSE decreasing from 11.12 to 8.87 µg/cm2, r increasing from 0.81 to 0.88, and BIAS adjusted from −3.31 to 0.65. For some of the broadleaf valida-tion samples with high Rs, the underestimation of Cab using P-5 due to the underestimation of Rs is
Figure 2. Specific absorption coefficients (SAC) of total chlorophyll (kCab, green lines) and carotenoids(kCxc, orange lines). The solid lines are from PROSPECT-Rsurf (P-Rs), and the dashed lines fromPROSPECT-5 (P-5).
4.1.2. Chlorophyll Content Estimation
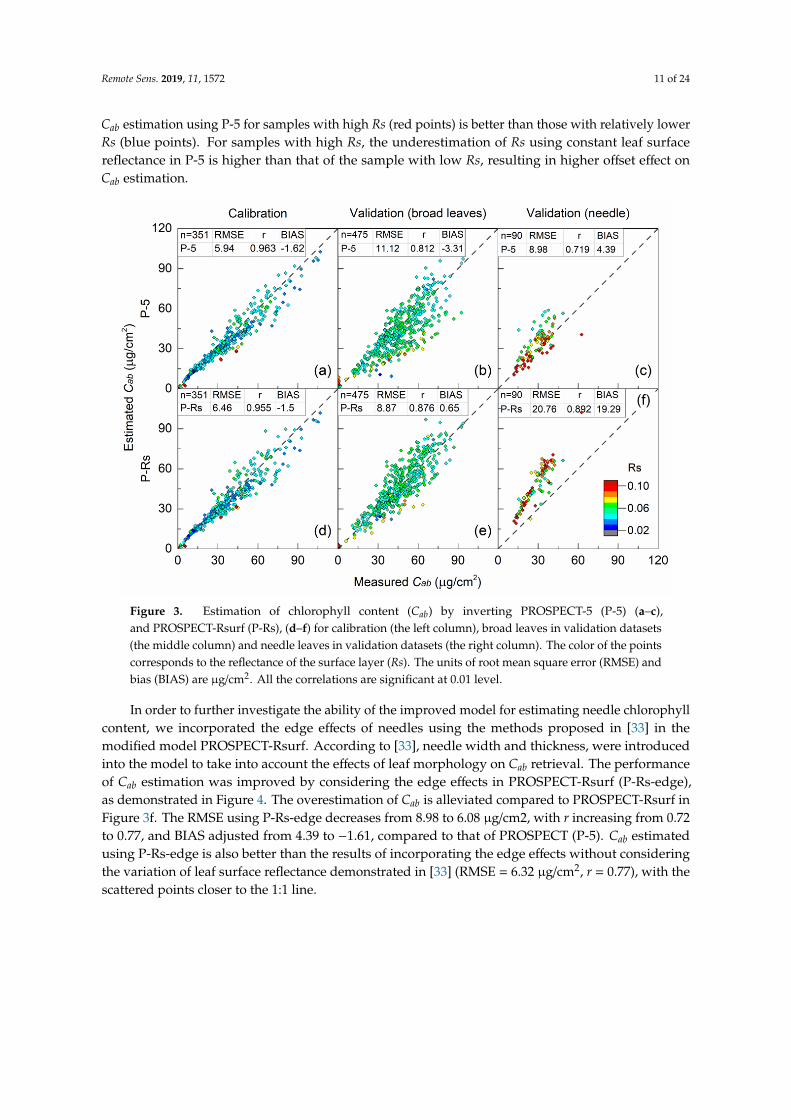
Figure 3 compares the performances of chlorophyll content estimation for PROSPECT-Rsurf (P-Rs)to PROSPECT-5 (P-5). The color of the points in Figure 3 corresponds to the surface layer reflectance(Rs). The results are demonstrated in three groups: the calibration, broadleaf samples in validation,and needle leaves in validation datasets. Estimation of Cab using P-Rs is improved for the broad leavesin validation datasets (Figure 3b), with RMSE decreasing from 11.12 to 8.87 µg/cm2, r increasing from0.81 to 0.88, and BIAS adjusted from −3.31 to 0.65. For some of the broadleaf validation samples withhigh Rs, the underestimation of Cab using P-5 due to the underestimation of Rs is alleviated in P-Rswith BIAS close to 0 (0.65). Furthermore, the overestimation of extremely low Cab samples is corrected.
For needle leaves, the Cab estimated using P-Rs is highly correlated with the measurements(r = 0.89), and much higher than those from P-5 (r = 0.72). However, Cab estimated using P-Rsis systematically overestimated, resulting in high RMSE and BIAS compared to those using P-5(Figure 3c,d). According to [33], the main reason for the overestimation is that the assumption in thePROSPECT model that a leaf is horizontally infinite may not hold for needle leaves since the needlewidth is comparable to the needle thickness. The amount of light that escapes from needle edge couldbe large, leading to the overestimation of leaf reflectance (R) and transmittance (T) using both P-Rsand P-5. Consequently, the overestimation of leaf R and T in VIS leads to increases in Cab in order tolower R and T to fit measured spectra during P-Rs model inversion. However, the overestimation ofCab using P-5 is minor, since the abovementioned overestimation of R and T caused by needle edgeeffects is partially offset by the underestimation of leaf surface reflectance. As illustrated in Figure 3c,
Remote Sens. 2019, 11, 1572 11 of 24
Cab estimation using P-5 for samples with high Rs (red points) is better than those with relatively lowerRs (blue points). For samples with high Rs, the underestimation of Rs using constant leaf surfacereflectance in P-5 is higher than that of the sample with low Rs, resulting in higher offset effect onCab estimation.
Remote Sens. 2019, 11, 1572 11 of 24
alleviated in P-Rs with BIAS close to 0 (0.65). Furthermore, the overestimation of extremely low Cab samples is corrected.
Figure 3. Estimation of chlorophyll content (Cab) by inverting PROSPECT-5 (P-5) (a–c), and PRO-SPECT-Rsurf (P-Rs), (d–f) for calibration (the left column), broad leaves in validation datasets (the middle column) and needle leaves in validation datasets (the right column). The color of the points corresponds to the reflectance of the surface layer (Rs). The units of root mean square error (RMSE) and bias (BIAS) are µg/cm2. All the correlations are significant at 0.01 level.
For needle leaves, the Cab estimated using P-Rs is highly correlated with the measurements (r = 0.89), and much higher than those from P-5 (r = 0.72). However, Cab estimated using P-Rs is system-atically overestimated, resulting in high RMSE and BIAS compared to those using P-5 (Figure 3c,d). According to [33], the main reason for the overestimation is that the assumption in the PROSPECT model that a leaf is horizontally infinite may not hold for needle leaves since the needle width is comparable to the needle thickness. The amount of light that escapes from needle edge could be large, leading to the overestimation of leaf reflectance (R) and transmittance (T) using both P-Rs and P-5. Consequently, the overestimation of leaf R and T in VIS leads to increases in Cab in order to lower R and T to fit measured spectra during P-Rs model inversion. However, the overestimation of Cab using P-5 is minor, since the abovementioned overestimation of R and T caused by needle edge effects is partially offset by the underestimation of leaf surface reflectance. As illustrated in Figure 3c, Cab estimation using P-5 for samples with high Rs (red points) is better than those with relatively lower Rs (blue points). For samples with high Rs, the underestimation of Rs using constant leaf surface reflectance in P-5 is higher than that of the sample with low Rs, resulting in higher offset effect on Cab estimation.
In order to further investigate the ability of the improved model for estimating needle chloro-phyll content, we incorporated the edge effects of needles using the methods proposed in [33] in the modified model PROSPECT-Rsurf. According to [33], needle width and thickness, were introduced into the model to take into account the effects of leaf morphology on Cab retrieval. The performance of Cab estimation was improved by considering the edge effects in PROSPECT-Rsurf (P-Rs-edge), as demonstrated in Figure 4. The overestimation of Cab is alleviated compared to PROSPECT-Rsurf in
Figure 3. Estimation of chlorophyll content (Cab) by inverting PROSPECT-5 (P-5) (a–c),and PROSPECT-Rsurf (P-Rs), (d–f) for calibration (the left column), broad leaves in validation datasets(the middle column) and needle leaves in validation datasets (the right column). The color of the pointscorresponds to the reflectance of the surface layer (Rs). The units of root mean square error (RMSE) andbias (BIAS) are µg/cm2. All the correlations are significant at 0.01 level.
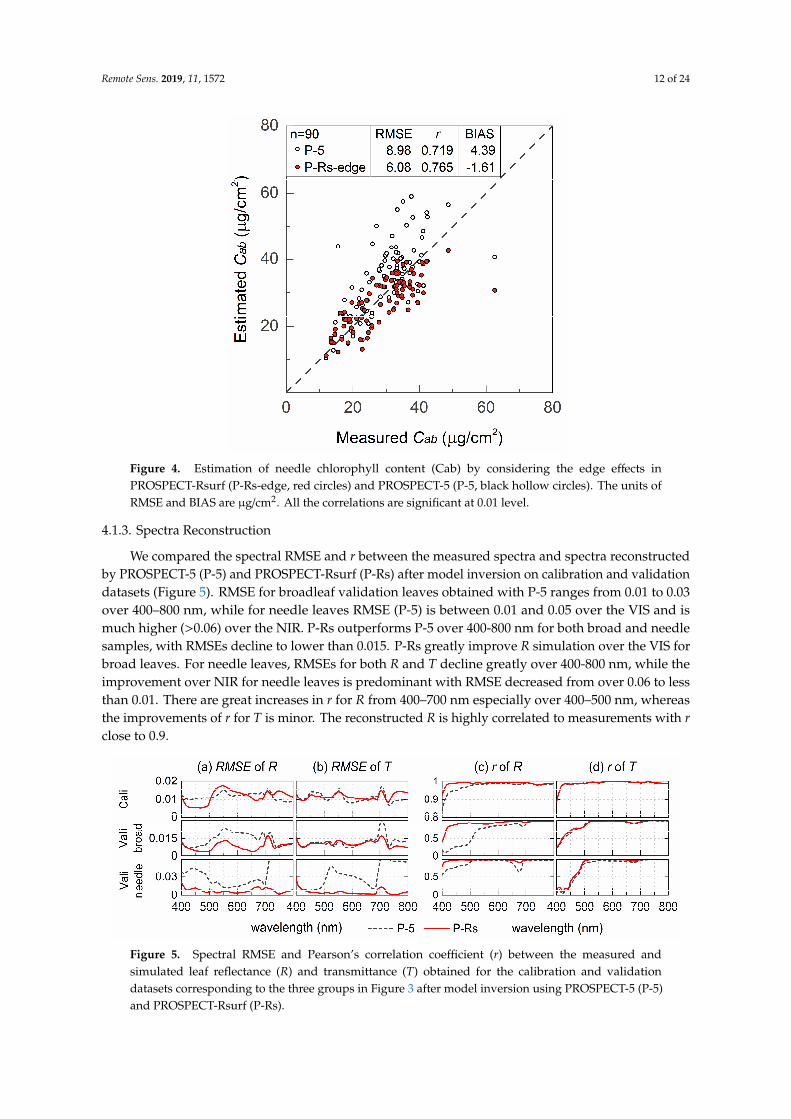
In order to further investigate the ability of the improved model for estimating needle chlorophyllcontent, we incorporated the edge effects of needles using the methods proposed in [33] in themodified model PROSPECT-Rsurf. According to [33], needle width and thickness, were introducedinto the model to take into account the effects of leaf morphology on Cab retrieval. The performanceof Cab estimation was improved by considering the edge effects in PROSPECT-Rsurf (P-Rs-edge),as demonstrated in Figure 4. The overestimation of Cab is alleviated compared to PROSPECT-Rsurf inFigure 3f. The RMSE using P-Rs-edge decreases from 8.98 to 6.08 µg/cm2, with r increasing from 0.72to 0.77, and BIAS adjusted from 4.39 to −1.61, compared to that of PROSPECT (P-5). Cab estimatedusing P-Rs-edge is also better than the results of incorporating the edge effects without consideringthe variation of leaf surface reflectance demonstrated in [33] (RMSE = 6.32 µg/cm2, r = 0.77), with thescattered points closer to the 1:1 line.
Remote Sens. 2019, 11, 1572 12 of 24
Remote Sens. 2019, 11, 1572 12 of 24
Figure 3f. The RMSE using P-Rs-edge decreases from 8.98 to 6.08 µg/cm2, with r increasing from 0.72 to 0.77, and BIAS adjusted from 4.39 to −1.61, compared to that of PROSPECT (P-5). Cab estimated using P-Rs-edge is also better than the results of incorporating the edge effects without considering the variation of leaf surface reflectance demonstrated in [33] (RMSE = 6.32 µg/cm2, r=0.77), with the scattered points closer to the 1:1 line.
Figure 4. Estimation of needle chlorophyll content (Cab) by considering the edge effects in PRO-SPECT-Rsurf (P-Rs-edge, red circles) and PROSPECT-5 (P-5, black hollow circles). The units of RMSE and BIAS are µg/cm2. All the correlations are significant at 0.01 level.
4.1.3. Spectra Reconstruction
We compared the spectral RMSE and r between the measured spectra and spectra reconstructed by PROSPECT-5 (P-5) and PROSPECT-Rsurf (P-Rs) after model inversion on calibration and valida-tion datasets (Figure 5). RMSE for broadleaf validation leaves obtained with P-5 ranges from 0.01 to 0.03 over 400–800 nm, while for needle leaves RMSE (P-5) is between 0.01 and 0.05 over the VIS and is much higher (>0.06) over the NIR. P-Rs outperforms P-5 over 400-800 nm for both broad and needle samples, with RMSEs decline to lower than 0.015. P-Rs greatly improve R simulation over the VIS for broad leaves. For needle leaves, RMSEs for both R and T decline greatly over 400-800 nm, while the improvement over NIR for needle leaves is predominant with RMSE decreased from over 0.06 to less than 0.01. There are great increases in r for R from 400–700 nm especially over 400–500 nm, whereas the improvements of r for T is minor. The reconstructed R is highly correlated to measurements with r close to 0.9.
Figure 4. Estimation of needle chlorophyll content (Cab) by considering the edge effects inPROSPECT-Rsurf (P-Rs-edge, red circles) and PROSPECT-5 (P-5, black hollow circles). The units ofRMSE and BIAS are µg/cm2. All the correlations are significant at 0.01 level.
4.1.3. Spectra Reconstruction
We compared the spectral RMSE and r between the measured spectra and spectra reconstructedby PROSPECT-5 (P-5) and PROSPECT-Rsurf (P-Rs) after model inversion on calibration and validationdatasets (Figure 5). RMSE for broadleaf validation leaves obtained with P-5 ranges from 0.01 to 0.03over 400–800 nm, while for needle leaves RMSE (P-5) is between 0.01 and 0.05 over the VIS and ismuch higher (>0.06) over the NIR. P-Rs outperforms P-5 over 400-800 nm for both broad and needlesamples, with RMSEs decline to lower than 0.015. P-Rs greatly improve R simulation over the VIS forbroad leaves. For needle leaves, RMSEs for both R and T decline greatly over 400-800 nm, while theimprovement over NIR for needle leaves is predominant with RMSE decreased from over 0.06 to lessthan 0.01. There are great increases in r for R from 400–700 nm especially over 400–500 nm, whereasthe improvements of r for T is minor. The reconstructed R is highly correlated to measurements with rclose to 0.9.
Remote Sens. 2019, 11, 1572 12 of 24
Figure 3f. The RMSE using P-Rs-edge decreases from 8.98 to 6.08 µg/cm2, with r increasing from 0.72 to 0.77, and BIAS adjusted from 4.39 to −1.61, compared to that of PROSPECT (P-5). Cab estimated using P-Rs-edge is also better than the results of incorporating the edge effects without considering the variation of leaf surface reflectance demonstrated in [33] (RMSE = 6.32 µg/cm2, r=0.77), with the scattered points closer to the 1:1 line.
Figure 4. Estimation of needle chlorophyll content (Cab) by considering the edge effects in PRO-SPECT-Rsurf (P-Rs-edge, red circles) and PROSPECT-5 (P-5, black hollow circles). The units of RMSE and BIAS are µg/cm2. All the correlations are significant at 0.01 level.
4.1.3. Spectra Reconstruction
We compared the spectral RMSE and r between the measured spectra and spectra reconstructed by PROSPECT-5 (P-5) and PROSPECT-Rsurf (P-Rs) after model inversion on calibration and valida-tion datasets (Figure 5). RMSE for broadleaf validation leaves obtained with P-5 ranges from 0.01 to 0.03 over 400–800 nm, while for needle leaves RMSE (P-5) is between 0.01 and 0.05 over the VIS and is much higher (>0.06) over the NIR. P-Rs outperforms P-5 over 400-800 nm for both broad and needle samples, with RMSEs decline to lower than 0.015. P-Rs greatly improve R simulation over the VIS for broad leaves. For needle leaves, RMSEs for both R and T decline greatly over 400-800 nm, while the improvement over NIR for needle leaves is predominant with RMSE decreased from over 0.06 to less than 0.01. There are great increases in r for R from 400–700 nm especially over 400–500 nm, whereas the improvements of r for T is minor. The reconstructed R is highly correlated to measurements with r close to 0.9.
Figure 5. Spectral RMSE and Pearson’s correlation coefficient (r) between the measured andsimulated leaf reflectance (R) and transmittance (T) obtained for the calibration and validationdatasets corresponding to the three groups in Figure 3 after model inversion using PROSPECT-5 (P-5)and PROSPECT-Rsurf (P-Rs).
Remote Sens. 2019, 11, 1572 13 of 24
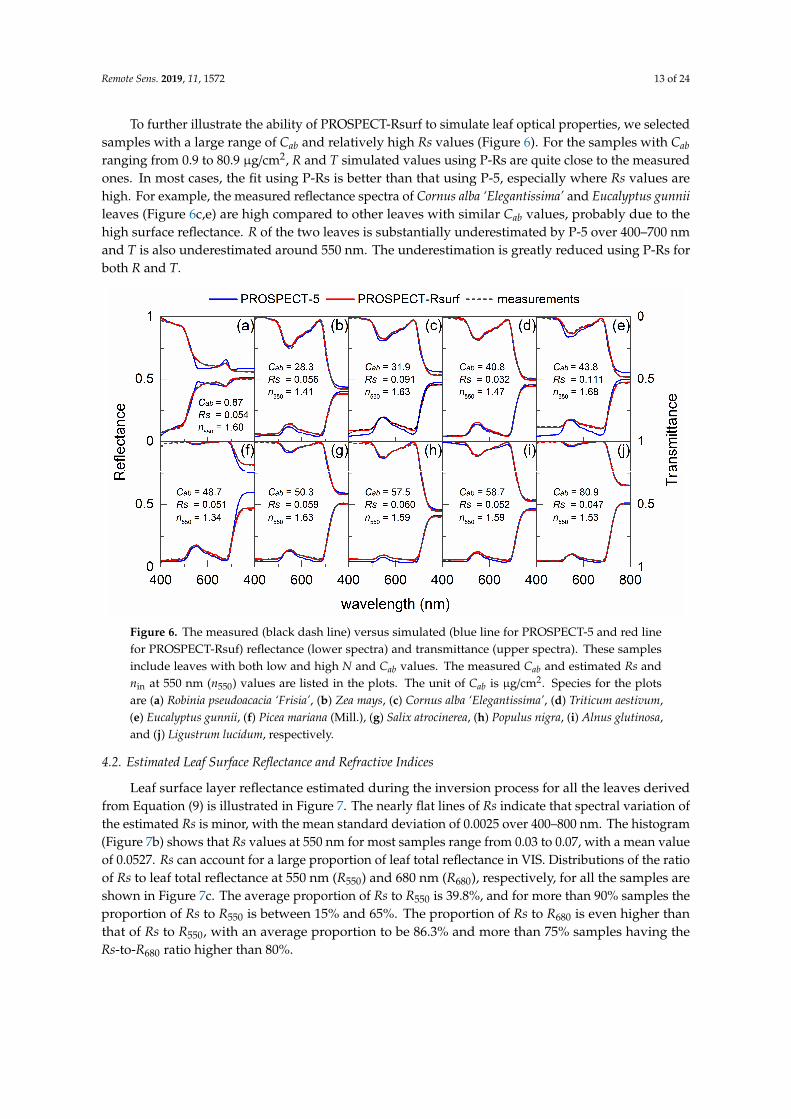
To further illustrate the ability of PROSPECT-Rsurf to simulate leaf optical properties, we selectedsamples with a large range of Cab and relatively high Rs values (Figure 6). For the samples with Cabranging from 0.9 to 80.9 µg/cm2, R and T simulated values using P-Rs are quite close to the measuredones. In most cases, the fit using P-Rs is better than that using P-5, especially where Rs values arehigh. For example, the measured reflectance spectra of Cornus alba ‘Elegantissima’ and Eucalyptus gunniileaves (Figure 6c,e) are high compared to other leaves with similar Cab values, probably due to thehigh surface reflectance. R of the two leaves is substantially underestimated by P-5 over 400–700 nmand T is also underestimated around 550 nm. The underestimation is greatly reduced using P-Rs forboth R and T.
Remote Sens. 2019, 11, 1572 13 of 24
Figure 5. Spectral RMSE and Pearson’s correlation coefficient (r) between the measured and simu-lated leaf reflectance (R) and transmittance (T) obtained for the calibration and validation datasets corresponding to the three groups in Figure 3 after model inversion using PROSPECT-5 (P-5) and PROSPECT-Rsurf (P-Rs).
To further illustrate the ability of PROSPECT-Rsurf to simulate leaf optical properties, we se-lected samples with a large range of Cab and relatively high Rs values (Figure 6). For the samples with Cab ranging from 0.9 to 80.9 µg/cm2, R and T simulated values using P-Rs are quite close to the measured ones. In most cases, the fit using P-Rs is better than that using P-5, especially where Rs values are high. For example, the measured reflectance spectra of Cornus alba ‘Elegantissima’ and Eucalyptus gunnii leaves (Figure 6c,e) are high compared to other leaves with similar Cab values, probably due to the high surface reflectance. R of the two leaves is substantially underestimated by P-5 over 400–700 nm and T is also underestimated around 550 nm. The underestimation is greatly reduced using P-Rs for both R and T.
Figure 6. The measured (black dash line) versus simulated (blue line for PROSPECT-5 and red line for PROSPECT-Rsuf) reflectance (lower spectra) and transmittance (upper spectra). These samples include leaves with both low and high N and Cab values. The measured Cab and estimated Rs and nin at 550 nm (n550) values are listed in the plots. The unit of Cab is µg/cm2. Species for the plots are (a) Robinia pseudoacacia ‘Frisia’, (b) Zea mays, (c) Cornus alba ‘Elegantissima’, (d) Triticum aestivum, (e) Eucalyptus gunnii, (f) Picea mariana (Mill.), (g) Salix atrocinerea, (h) Populus nigra, (i) Alnus glutinosa, and (j) Ligustrum lucidum, respectively.
4.2. Estimated Leaf Surface Reflectance and Refractive Indices
Leaf surface layer reflectance estimated during the inversion process for all the leaves derived from Equation (9) is illustrated in Figure 7. The nearly flat lines of Rs indicate that spectral variation of the estimated Rs is minor, with the mean standard deviation of 0.0025 over 400–800 nm. The his-togram (Figure 7b) shows that Rs values at 550 nm for most samples range from 0.03 to 0.07, with a mean value of 0.0527. Rs can account for a large proportion of leaf total reflectance in VIS. Distribu-tions of the ratio of Rs to leaf total reflectance at 550 nm (R550) and 680 nm (R680), respectively, for all the samples are shown in Figure 7c. The average proportion of Rs to R550 is 39.8%, and for more than 90% samples the proportion of Rs to R550 is between 15% and 65%. The proportion of Rs to R680 is even higher than that of Rs to R550, with an average proportion to be 86.3% and more than 75% samples having the Rs-to-R680 ratio higher than 80%.
Figure 6. The measured (black dash line) versus simulated (blue line for PROSPECT-5 and red linefor PROSPECT-Rsuf) reflectance (lower spectra) and transmittance (upper spectra). These samplesinclude leaves with both low and high N and Cab values. The measured Cab and estimated Rs andnin at 550 nm (n550) values are listed in the plots. The unit of Cab is µg/cm2. Species for the plotsare (a) Robinia pseudoacacia ‘Frisia’, (b) Zea mays, (c) Cornus alba ‘Elegantissima’, (d) Triticum aestivum,(e) Eucalyptus gunnii, (f) Picea mariana (Mill.), (g) Salix atrocinerea, (h) Populus nigra, (i) Alnus glutinosa,and (j) Ligustrum lucidum, respectively.
4.2. Estimated Leaf Surface Reflectance and Refractive Indices
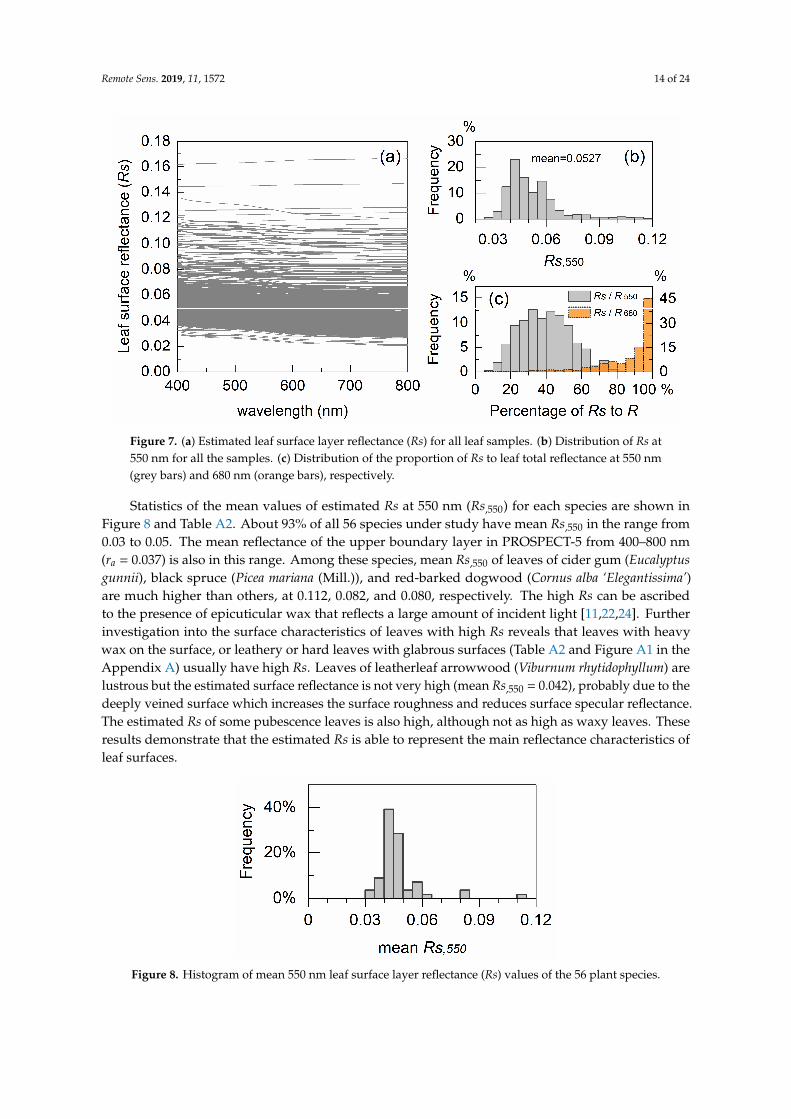
Leaf surface layer reflectance estimated during the inversion process for all the leaves derivedfrom Equation (9) is illustrated in Figure 7. The nearly flat lines of Rs indicate that spectral variation ofthe estimated Rs is minor, with the mean standard deviation of 0.0025 over 400–800 nm. The histogram(Figure 7b) shows that Rs values at 550 nm for most samples range from 0.03 to 0.07, with a mean valueof 0.0527. Rs can account for a large proportion of leaf total reflectance in VIS. Distributions of the ratioof Rs to leaf total reflectance at 550 nm (R550) and 680 nm (R680), respectively, for all the samples areshown in Figure 7c. The average proportion of Rs to R550 is 39.8%, and for more than 90% samples theproportion of Rs to R550 is between 15% and 65%. The proportion of Rs to R680 is even higher thanthat of Rs to R550, with an average proportion to be 86.3% and more than 75% samples having theRs-to-R680 ratio higher than 80%.
Remote Sens. 2019, 11, 1572 14 of 24Remote Sens. 2019, 11, 1572 14 of 24
Figure 7. (a) Estimated leaf surface layer reflectance (Rs) for all leaf samples. (b) Distribution of Rs at 550 nm for all the samples. (c) Distribution of the proportion of Rs to leaf total reflectance at 550 nm (grey bars) and 680 nm (orange bars), respectively.
Statistics of the mean values of estimated Rs at 550 nm (Rs,550) for each species are shown in Figure 8 and Table A2. About 93% of all 56 species under study have mean Rs,550 in the range from 0.03 to 0.05. The mean reflectance of the upper boundary layer in PROSPECT-5 from 400–800 nm (ra=0.037) is also in this range. Among these species, mean Rs,550 of leaves of cider gum (Eucalyptus gunnii), black spruce (Picea mariana (Mill.)), and red-barked dogwood (Cornus alba ‘Elegantissi-ma’) are much higher than others, at 0.112, 0.082, and 0.080, respectively. The high Rs can be as-cribed to the presence of epicuticular wax that reflects a large amount of incident light [11,22,24]. Further investigation into the surface characteristics of leaves with high Rs reveals that leaves with heavy wax on the surface, or leathery or hard leaves with glabrous surfaces (Table A2 and Figure A1 in the appendix) usually have high Rs. Leaves of leatherleaf arrowwood (Viburnum rhytidophyllum) are lustrous but the estimated surface reflectance is not very high (mean Rs,550 = 0.042), probably due to the deeply veined surface which increases the surface roughness and reduces surface specular reflectance. The estimated Rs of some pubescence leaves is also high, although not as high as waxy leaves. These results demonstrate that the estimated Rs is able to represent the main reflectance characteristics of leaf surfaces.
Figure 8. Histogram of mean 550 nm leaf surface layer reflectance (Rs) values of the 56 plant species.
Figure 7. (a) Estimated leaf surface layer reflectance (Rs) for all leaf samples. (b) Distribution of Rs at550 nm for all the samples. (c) Distribution of the proportion of Rs to leaf total reflectance at 550 nm(grey bars) and 680 nm (orange bars), respectively.
Statistics of the mean values of estimated Rs at 550 nm (Rs,550) for each species are shown inFigure 8 and Table A2. About 93% of all 56 species under study have mean Rs,550 in the range from0.03 to 0.05. The mean reflectance of the upper boundary layer in PROSPECT-5 from 400–800 nm(ra = 0.037) is also in this range. Among these species, mean Rs,550 of leaves of cider gum (Eucalyptusgunnii), black spruce (Picea mariana (Mill.)), and red-barked dogwood (Cornus alba ‘Elegantissima’)are much higher than others, at 0.112, 0.082, and 0.080, respectively. The high Rs can be ascribedto the presence of epicuticular wax that reflects a large amount of incident light [11,22,24]. Furtherinvestigation into the surface characteristics of leaves with high Rs reveals that leaves with heavywax on the surface, or leathery or hard leaves with glabrous surfaces (Table A2 and Figure A1 in theAppendix A) usually have high Rs. Leaves of leatherleaf arrowwood (Viburnum rhytidophyllum) arelustrous but the estimated surface reflectance is not very high (mean Rs,550 = 0.042), probably due to thedeeply veined surface which increases the surface roughness and reduces surface specular reflectance.The estimated Rs of some pubescence leaves is also high, although not as high as waxy leaves. Theseresults demonstrate that the estimated Rs is able to represent the main reflectance characteristics ofleaf surfaces.
Remote Sens. 2019, 11, 1572 14 of 24
Figure 7. (a) Estimated leaf surface layer reflectance (Rs) for all leaf samples. (b) Distribution of Rs at 550 nm for all the samples. (c) Distribution of the proportion of Rs to leaf total reflectance at 550 nm (grey bars) and 680 nm (orange bars), respectively.
Statistics of the mean values of estimated Rs at 550 nm (Rs,550) for each species are shown in Figure 8 and Table A2. About 93% of all 56 species under study have mean Rs,550 in the range from 0.03 to 0.05. The mean reflectance of the upper boundary layer in PROSPECT-5 from 400–800 nm (ra=0.037) is also in this range. Among these species, mean Rs,550 of leaves of cider gum (Eucalyptus gunnii), black spruce (Picea mariana (Mill.)), and red-barked dogwood (Cornus alba ‘Elegantissi-ma’) are much higher than others, at 0.112, 0.082, and 0.080, respectively. The high Rs can be as-cribed to the presence of epicuticular wax that reflects a large amount of incident light [11,22,24]. Further investigation into the surface characteristics of leaves with high Rs reveals that leaves with heavy wax on the surface, or leathery or hard leaves with glabrous surfaces (Table A2 and Figure A1 in the appendix) usually have high Rs. Leaves of leatherleaf arrowwood (Viburnum rhytidophyllum) are lustrous but the estimated surface reflectance is not very high (mean Rs,550 = 0.042), probably due to the deeply veined surface which increases the surface roughness and reduces surface specular reflectance. The estimated Rs of some pubescence leaves is also high, although not as high as waxy leaves. These results demonstrate that the estimated Rs is able to represent the main reflectance characteristics of leaf surfaces.
Figure 8. Histogram of mean 550 nm leaf surface layer reflectance (Rs) values of the 56 plant species. Figure 8. Histogram of mean 550 nm leaf surface layer reflectance (Rs) values of the 56 plant species.
Remote Sens. 2019, 11, 1572 15 of 24
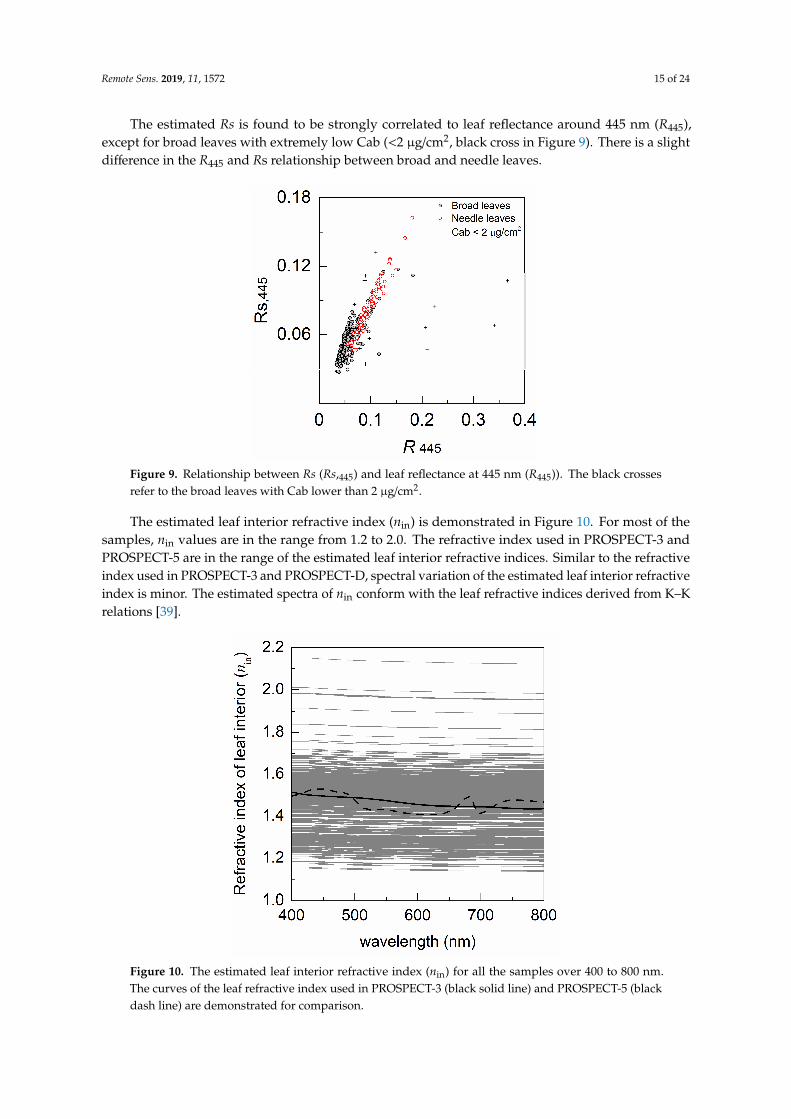
The estimated Rs is found to be strongly correlated to leaf reflectance around 445 nm (R445),except for broad leaves with extremely low Cab (<2 µg/cm2, black cross in Figure 9). There is a slightdifference in the R445 and Rs relationship between broad and needle leaves.
Remote Sens. 2019, 11, 1572 15 of 24
The estimated Rs is found to be strongly correlated to leaf reflectance around 445 nm (R445), except for broad leaves with extremely low Cab (<2 µg/cm2, black cross in Figure 9). There is a slight difference in the R445 and Rs relationship between broad and needle leaves.
Figure 9. Relationship between Rs (Rs,445) and leaf reflectance at 445 nm (R445)). The black crosses refer to the broad leaves with Cab lower than 2 µg/cm2.
The estimated leaf interior refractive index (nin) is demonstrated in Figure 10. For most of the samples, nin values are in the range from 1.2 to 2.0. The refractive index used in PROSPECT-3 and PROSPECT-5 are in the range of the estimated leaf interior refractive indices. Similar to the refractive index used in PROSPECT-3 and PROSPECT-D, spectral variation of the estimated leaf interior re-fractive index is minor. The estimated spectra of nin conform with the leaf refractive indices derived from K–K relations [39].
Figure 10. The estimated leaf interior refractive index (nin) for all the samples over 400 to 800 nm. The curves of the leaf refractive index used in PROSPECT-3 (black solid line) and PROSPECT-5 (black dash line) are demonstrated for comparison.
Figure 9. Relationship between Rs (Rs,445) and leaf reflectance at 445 nm (R445)). The black crossesrefer to the broad leaves with Cab lower than 2 µg/cm2.
The estimated leaf interior refractive index (nin) is demonstrated in Figure 10. For most of thesamples, nin values are in the range from 1.2 to 2.0. The refractive index used in PROSPECT-3 andPROSPECT-5 are in the range of the estimated leaf interior refractive indices. Similar to the refractiveindex used in PROSPECT-3 and PROSPECT-D, spectral variation of the estimated leaf interior refractiveindex is minor. The estimated spectra of nin conform with the leaf refractive indices derived from K–Krelations [39].
Remote Sens. 2019, 11, 1572 15 of 24
The estimated Rs is found to be strongly correlated to leaf reflectance around 445 nm (R445), except for broad leaves with extremely low Cab (<2 µg/cm2, black cross in Figure 9). There is a slight difference in the R445 and Rs relationship between broad and needle leaves.
Figure 9. Relationship between Rs (Rs,445) and leaf reflectance at 445 nm (R445)). The black crosses refer to the broad leaves with Cab lower than 2 µg/cm2.
The estimated leaf interior refractive index (nin) is demonstrated in Figure 10. For most of the samples, nin values are in the range from 1.2 to 2.0. The refractive index used in PROSPECT-3 and PROSPECT-5 are in the range of the estimated leaf interior refractive indices. Similar to the refractive index used in PROSPECT-3 and PROSPECT-D, spectral variation of the estimated leaf interior re-fractive index is minor. The estimated spectra of nin conform with the leaf refractive indices derived from K–K relations [39].
Figure 10. The estimated leaf interior refractive index (nin) for all the samples over 400 to 800 nm. The curves of the leaf refractive index used in PROSPECT-3 (black solid line) and PROSPECT-5 (black dash line) are demonstrated for comparison.
Figure 10. The estimated leaf interior refractive index (nin) for all the samples over 400 to 800 nm.The curves of the leaf refractive index used in PROSPECT-3 (black solid line) and PROSPECT-5 (blackdash line) are demonstrated for comparison.
Remote Sens. 2019, 11, 1572 16 of 24
4.3. Sensitivity to the Uncertainty Associated with Rs
4.3.1. Global Sensitivity Analysis
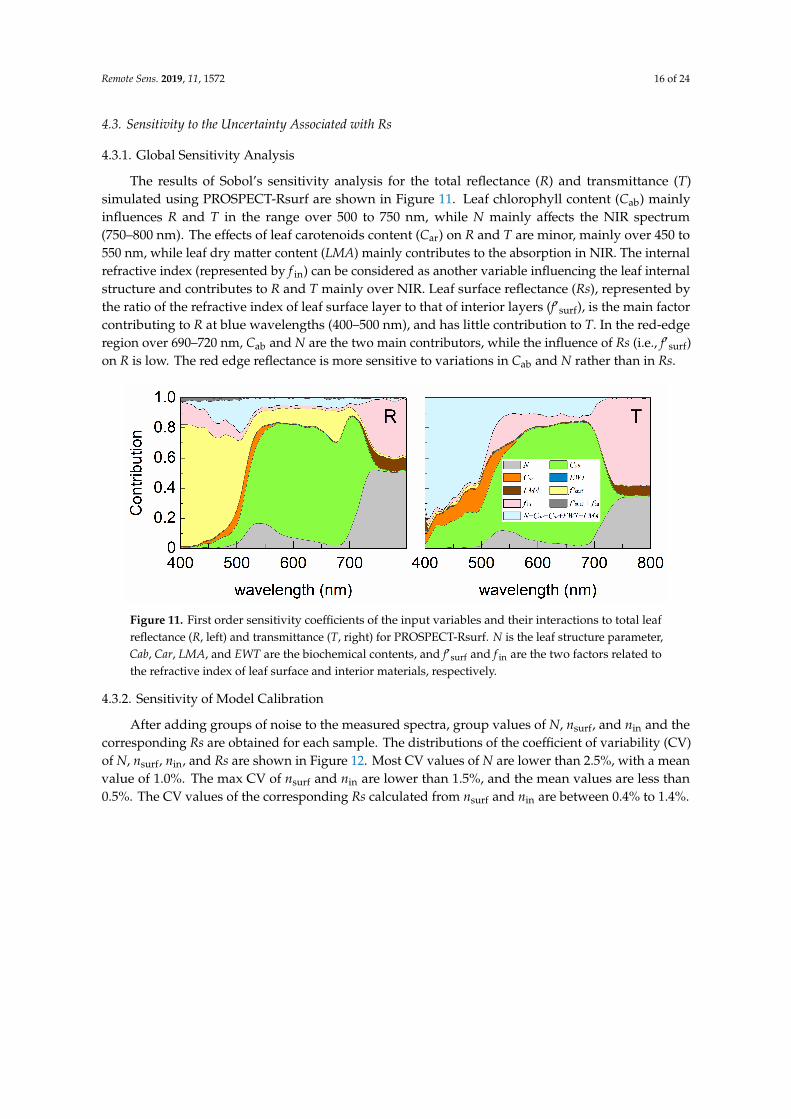
The results of Sobol’s sensitivity analysis for the total reflectance (R) and transmittance (T)simulated using PROSPECT-Rsurf are shown in Figure 11. Leaf chlorophyll content (Cab) mainlyinfluences R and T in the range over 500 to 750 nm, while N mainly affects the NIR spectrum(750–800 nm). The effects of leaf carotenoids content (Car) on R and T are minor, mainly over 450 to550 nm, while leaf dry matter content (LMA) mainly contributes to the absorption in NIR. The internalrefractive index (represented by f in) can be considered as another variable influencing the leaf internalstructure and contributes to R and T mainly over NIR. Leaf surface reflectance (Rs), represented bythe ratio of the refractive index of leaf surface layer to that of interior layers (f′surf), is the main factorcontributing to R at blue wavelengths (400–500 nm), and has little contribution to T. In the red-edgeregion over 690–720 nm, Cab and N are the two main contributors, while the influence of Rs (i.e., f′surf)on R is low. The red edge reflectance is more sensitive to variations in Cab and N rather than in Rs.
Remote Sens. 2019, 11, 1572 16 of 24
4.3. Sensitivity to the Uncertainty Associated with Rs
4.3.1. Global Sensitivity Analysis
The results of Sobol’s sensitivity analysis for the total reflectance (R) and transmittance (T) simulated using PROSPECT-Rsurf are shown in Figure 11. Leaf chlorophyll content (Cab) mainly influences R and T in the range over 500 to 750 nm, while N mainly affects the NIR spectrum (750–800 nm). The effects of leaf carotenoids content (Car) on R and T are minor, mainly over 450 to 550 nm, while leaf dry matter content (LMA) mainly contributes to the absorption in NIR. The in-ternal refractive index (represented by fin) can be considered as another variable influencing the leaf internal structure and contributes to R and T mainly over NIR. Leaf surface reflectance (Rs), repre-sented by the ratio of the refractive index of leaf surface layer to that of interior layers (f′surf), is the main factor contributing to R at blue wavelengths (400–500 nm), and has little contribution to T. In the red-edge region over 690–720 nm, Cab and N are the two main contributors, while the influence of Rs (i.e., f′surf) on R is low. The red edge reflectance is more sensitive to variations in Cab and N rather than in Rs.
Figure 11. First order sensitivity coefficients of the input variables and their interactions to total leaf reflectance (R, left) and transmittance (T, right) for PROSPECT-Rsurf. N is the leaf structure param-eter, Cab, Car, LMA, and EWT are the biochemical contents, and f′surf and fin are the two factors re-lated to the refractive index of leaf surface and interior materials, respectively.
4.3.2. Sensitivity of Model Calibration
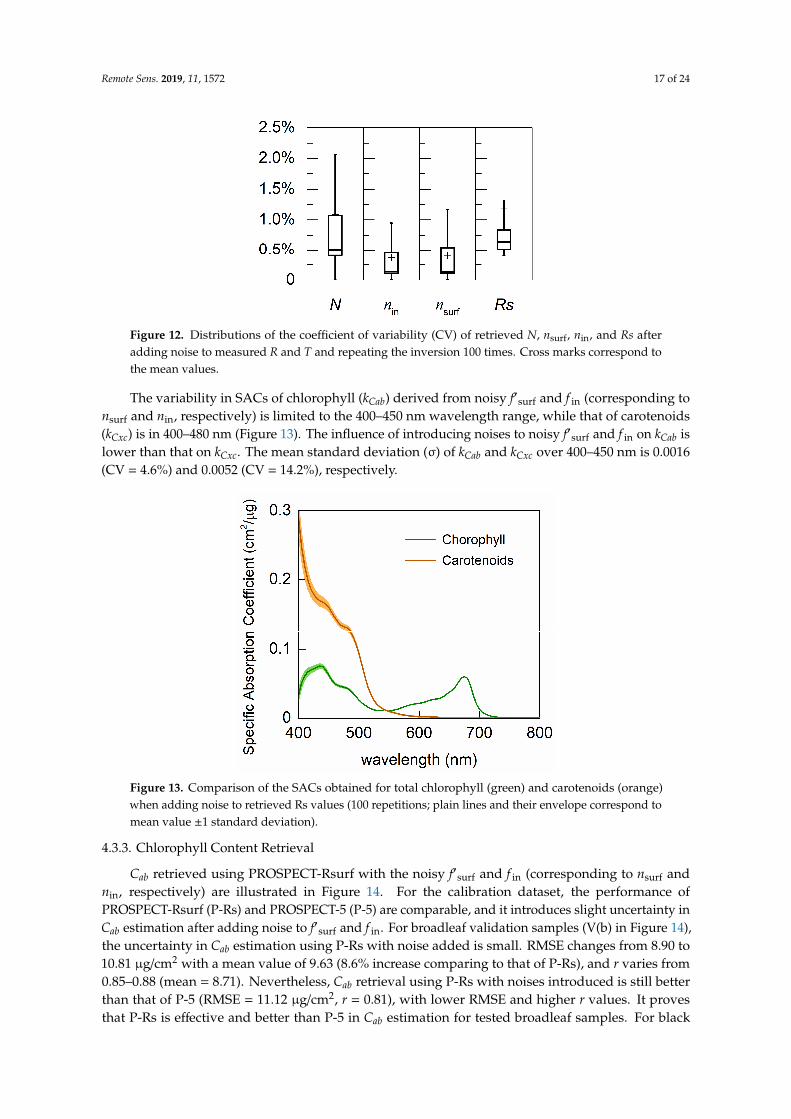
After adding groups of noise to the measured spectra, group values of N, nsurf, and nin and the corresponding Rs are obtained for each sample. The distributions of the coefficient of variability (CV) of N, nsurf, nin, and Rs are shown in Figure 12. Most CV values of N are lower than 2.5%, with a mean value of 1.0%. The max CV of nsurf and nin are lower than 1.5%, and the mean values are less than 0.5%. The CV values of the corresponding Rs calculated from nsurf and nin are between 0.4% to 1.4%.
Figure 11. First order sensitivity coefficients of the input variables and their interactions to total leafreflectance (R, left) and transmittance (T, right) for PROSPECT-Rsurf. N is the leaf structure parameter,Cab, Car, LMA, and EWT are the biochemical contents, and f′surf and f in are the two factors related tothe refractive index of leaf surface and interior materials, respectively.
4.3.2. Sensitivity of Model Calibration
After adding groups of noise to the measured spectra, group values of N, nsurf, and nin and thecorresponding Rs are obtained for each sample. The distributions of the coefficient of variability (CV)of N, nsurf, nin, and Rs are shown in Figure 12. Most CV values of N are lower than 2.5%, with a meanvalue of 1.0%. The max CV of nsurf and nin are lower than 1.5%, and the mean values are less than0.5%. The CV values of the corresponding Rs calculated from nsurf and nin are between 0.4% to 1.4%.
Remote Sens. 2019, 11, 1572 17 of 24Remote Sens. 2019, 11, 1572 17 of 24
Figure 12. Distributions of the coefficient of variability (CV) of retrieved N, nsurf, nin, and Rs after adding noise to measured R and T and repeating the inversion 100 times. Cross marks correspond to the mean values.
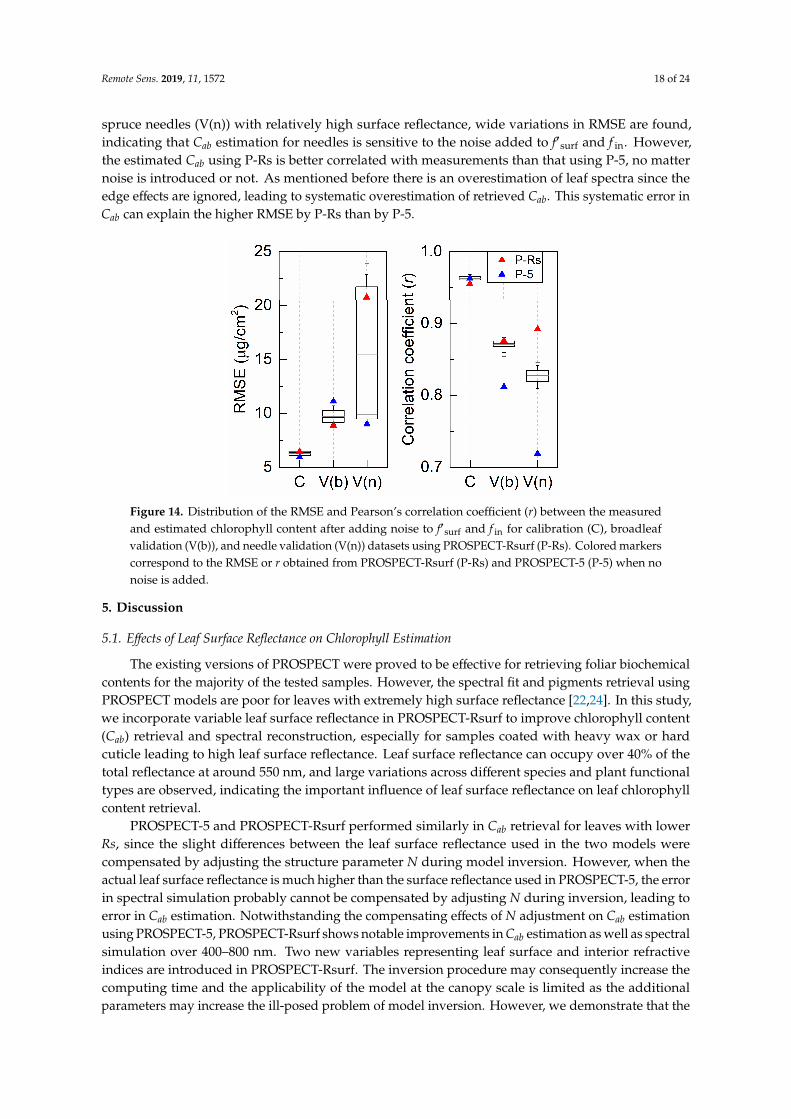
The variability in SACs of chlorophyll (kCab) derived from noisy f′surf and fin (corresponding to nsurf and nin, respectively) is limited to the 400–450 nm wavelength range, while that of carotenoids (kCxc) is in 400–480 nm (Figure 13). The influence of introducing noises to noisy f′surf and fin on kCab is lower than that on kCxc. The mean standard deviation (σ) of kCab and kCxc over 400–450 nm is 0.0016 (CV = 4.6%) and 0.0052 (CV = 14.2%), respectively.
Figure 13. Comparison of the SACs obtained for total chlorophyll (green) and carotenoids (orange) when adding noise to retrieved Rs values (100 repetitions; plain lines and their envelope correspond to mean value ±1 standard deviation).
4.3.3. Chlorophyll Content Retrieval
Cab retrieved using PROSPECT-Rsurf with the noisy f′surf and fin (corresponding to nsurf and nin, respectively) are illustrated in Figure 14. For the calibration dataset, the performance of PRO-SPECT-Rsurf (P-Rs) and PROSPECT-5 (P-5) are comparable, and it introduces slight uncertainty in Cab estimation after adding noise to f′surf and fin. For broadleaf validation samples (V(b) in Figure 14), the uncertainty in Cab estimation using P-Rs with noise added is small. RMSE changes from 8.90 to 10.81 µg/cm2 with a mean value of 9.63 (8.6% increase comparing to that of P-Rs), and r varies from 0.85–0.88 (mean = 8.71). Nevertheless, Cab retrieval using P-Rs with noises introduced is still better
Figure 12. Distributions of the coefficient of variability (CV) of retrieved N, nsurf, nin, and Rs afteradding noise to measured R and T and repeating the inversion 100 times. Cross marks correspond tothe mean values.
The variability in SACs of chlorophyll (kCab) derived from noisy f′surf and f in (corresponding tonsurf and nin, respectively) is limited to the 400–450 nm wavelength range, while that of carotenoids(kCxc) is in 400–480 nm (Figure 13). The influence of introducing noises to noisy f′surf and f in on kCab islower than that on kCxc. The mean standard deviation (σ) of kCab and kCxc over 400–450 nm is 0.0016(CV = 4.6%) and 0.0052 (CV = 14.2%), respectively.
Remote Sens. 2019, 11, 1572 17 of 24
Figure 12. Distributions of the coefficient of variability (CV) of retrieved N, nsurf, nin, and Rs after adding noise to measured R and T and repeating the inversion 100 times. Cross marks correspond to the mean values.
The variability in SACs of chlorophyll (kCab) derived from noisy f′surf and fin (corresponding to nsurf and nin, respectively) is limited to the 400–450 nm wavelength range, while that of carotenoids (kCxc) is in 400–480 nm (Figure 13). The influence of introducing noises to noisy f′surf and fin on kCab is lower than that on kCxc. The mean standard deviation (σ) of kCab and kCxc over 400–450 nm is 0.0016 (CV = 4.6%) and 0.0052 (CV = 14.2%), respectively.
Figure 13. Comparison of the SACs obtained for total chlorophyll (green) and carotenoids (orange) when adding noise to retrieved Rs values (100 repetitions; plain lines and their envelope correspond to mean value ±1 standard deviation).
4.3.3. Chlorophyll Content Retrieval
Cab retrieved using PROSPECT-Rsurf with the noisy f′surf and fin (corresponding to nsurf and nin, respectively) are illustrated in Figure 14. For the calibration dataset, the performance of PRO-SPECT-Rsurf (P-Rs) and PROSPECT-5 (P-5) are comparable, and it introduces slight uncertainty in Cab estimation after adding noise to f′surf and fin. For broadleaf validation samples (V(b) in Figure 14), the uncertainty in Cab estimation using P-Rs with noise added is small. RMSE changes from 8.90 to 10.81 µg/cm2 with a mean value of 9.63 (8.6% increase comparing to that of P-Rs), and r varies from 0.85–0.88 (mean = 8.71). Nevertheless, Cab retrieval using P-Rs with noises introduced is still better
Figure 13. Comparison of the SACs obtained for total chlorophyll (green) and carotenoids (orange)when adding noise to retrieved Rs values (100 repetitions; plain lines and their envelope correspond tomean value ±1 standard deviation).
4.3.3. Chlorophyll Content Retrieval
Cab retrieved using PROSPECT-Rsurf with the noisy f′surf and f in (corresponding to nsurf andnin, respectively) are illustrated in Figure 14. For the calibration dataset, the performance ofPROSPECT-Rsurf (P-Rs) and PROSPECT-5 (P-5) are comparable, and it introduces slight uncertainty inCab estimation after adding noise to f′surf and f in. For broadleaf validation samples (V(b) in Figure 14),the uncertainty in Cab estimation using P-Rs with noise added is small. RMSE changes from 8.90 to10.81 µg/cm2 with a mean value of 9.63 (8.6% increase comparing to that of P-Rs), and r varies from0.85–0.88 (mean = 8.71). Nevertheless, Cab retrieval using P-Rs with noises introduced is still betterthan that of P-5 (RMSE = 11.12 µg/cm2, r = 0.81), with lower RMSE and higher r values. It provesthat P-Rs is effective and better than P-5 in Cab estimation for tested broadleaf samples. For black
Remote Sens. 2019, 11, 1572 18 of 24
spruce needles (V(n)) with relatively high surface reflectance, wide variations in RMSE are found,indicating that Cab estimation for needles is sensitive to the noise added to f′surf and f in. However,the estimated Cab using P-Rs is better correlated with measurements than that using P-5, no matternoise is introduced or not. As mentioned before there is an overestimation of leaf spectra since theedge effects are ignored, leading to systematic overestimation of retrieved Cab. This systematic error inCab can explain the higher RMSE by P-Rs than by P-5.
Remote Sens. 2019, 11, 1572 18 of 24
than that of P-5 (RMSE = 11.12 µg/cm2, r = 0.81), with lower RMSE and higher r values. It proves that P-Rs is effective and better than P-5 in Cab estimation for tested broadleaf samples. For black spruce needles (V(n)) with relatively high surface reflectance, wide variations in RMSE are found, indicat-ing that Cab estimation for needles is sensitive to the noise added to f′surf and fin. However, the esti-mated Cab using P-Rs is better correlated with measurements than that using P-5, no matter noise is introduced or not. As mentioned before there is an overestimation of leaf spectra since the edge ef-fects are ignored, leading to systematic overestimation of retrieved Cab. This systematic error in Cab can explain the higher RMSE by P-Rs than by P-5.
Figure 14. Distribution of the RMSE and Pearson’s correlation coefficient (r) between the measured and estimated chlorophyll content after adding noise to f′surf and fin for calibration (C), broadleaf validation (V(b)), and needle validation (V(n)) datasets using PROSPECT-Rsurf (P-Rs). Colored markers correspond to the RMSE or r obtained from PROSPECT-Rsurf (P-Rs) and PROSPECT-5 (P-5) when no noise is added.
5. Discussion
5.1. Effects of Leaf Surface Reflectance on Chlorophyll Estimation
The existing versions of PROSPECT were proved to be effective for retrieving foliar biochemical contents for the majority of the tested samples. However, the spectral fit and pigments retrieval us-ing PROSPECT models are poor for leaves with extremely high surface reflectance [22,24]. In this study, we incorporate variable leaf surface reflectance in PROSPECT-Rsurf to improve chlorophyll content (Cab) retrieval and spectral reconstruction, especially for samples coated with heavy wax or hard cuticle leading to high leaf surface reflectance. Leaf surface reflectance can occupy over 40% of the total reflectance at around 550 nm, and large variations across different species and plant func-tional types are observed, indicating the important influence of leaf surface reflectance on leaf chlorophyll content retrieval.
PROSPECT-5 and PROSPECT-Rsurf performed similarly in Cab retrieval for leaves with lower Rs, since the slight differences between the leaf surface reflectance used in the two models were compensated by adjusting the structure parameter N during model inversion. However, when the actual leaf surface reflectance is much higher than the surface reflectance used in PROSPECT-5, the error in spectral simulation probably cannot be compensated by adjusting N during inversion, leading to error in Cab estimation. Notwithstanding the compensating effects of N adjustment on Cab estimation using PROSPECT-5, PROSPECT-Rsurf shows notable improvements in Cab estimation as well as spectral simulation over 400–800 nm. Two new variables representing leaf surface and inte-rior refractive indices are introduced in PROSPECT-Rsurf. The inversion procedure may conse-quently increase the computing time and the applicability of the model at the canopy scale is limited
Figure 14. Distribution of the RMSE and Pearson’s correlation coefficient (r) between the measuredand estimated chlorophyll content after adding noise to f′surf and f in for calibration (C), broadleafvalidation (V(b)), and needle validation (V(n)) datasets using PROSPECT-Rsurf (P-Rs). Colored markerscorrespond to the RMSE or r obtained from PROSPECT-Rsurf (P-Rs) and PROSPECT-5 (P-5) when nonoise is added.
5. Discussion
5.1. Effects of Leaf Surface Reflectance on Chlorophyll Estimation
The existing versions of PROSPECT were proved to be effective for retrieving foliar biochemicalcontents for the majority of the tested samples. However, the spectral fit and pigments retrieval usingPROSPECT models are poor for leaves with extremely high surface reflectance [22,24]. In this study,we incorporate variable leaf surface reflectance in PROSPECT-Rsurf to improve chlorophyll content(Cab) retrieval and spectral reconstruction, especially for samples coated with heavy wax or hardcuticle leading to high leaf surface reflectance. Leaf surface reflectance can occupy over 40% of thetotal reflectance at around 550 nm, and large variations across different species and plant functionaltypes are observed, indicating the important influence of leaf surface reflectance on leaf chlorophyllcontent retrieval.
PROSPECT-5 and PROSPECT-Rsurf performed similarly in Cab retrieval for leaves with lowerRs, since the slight differences between the leaf surface reflectance used in the two models werecompensated by adjusting the structure parameter N during model inversion. However, when theactual leaf surface reflectance is much higher than the surface reflectance used in PROSPECT-5, the errorin spectral simulation probably cannot be compensated by adjusting N during inversion, leading toerror in Cab estimation. Notwithstanding the compensating effects of N adjustment on Cab estimationusing PROSPECT-5, PROSPECT-Rsurf shows notable improvements in Cab estimation as well as spectralsimulation over 400–800 nm. Two new variables representing leaf surface and interior refractiveindices are introduced in PROSPECT-Rsurf. The inversion procedure may consequently increase thecomputing time and the applicability of the model at the canopy scale is limited as the additionalparameters may increase the ill-posed problem of model inversion. However, we demonstrate that the
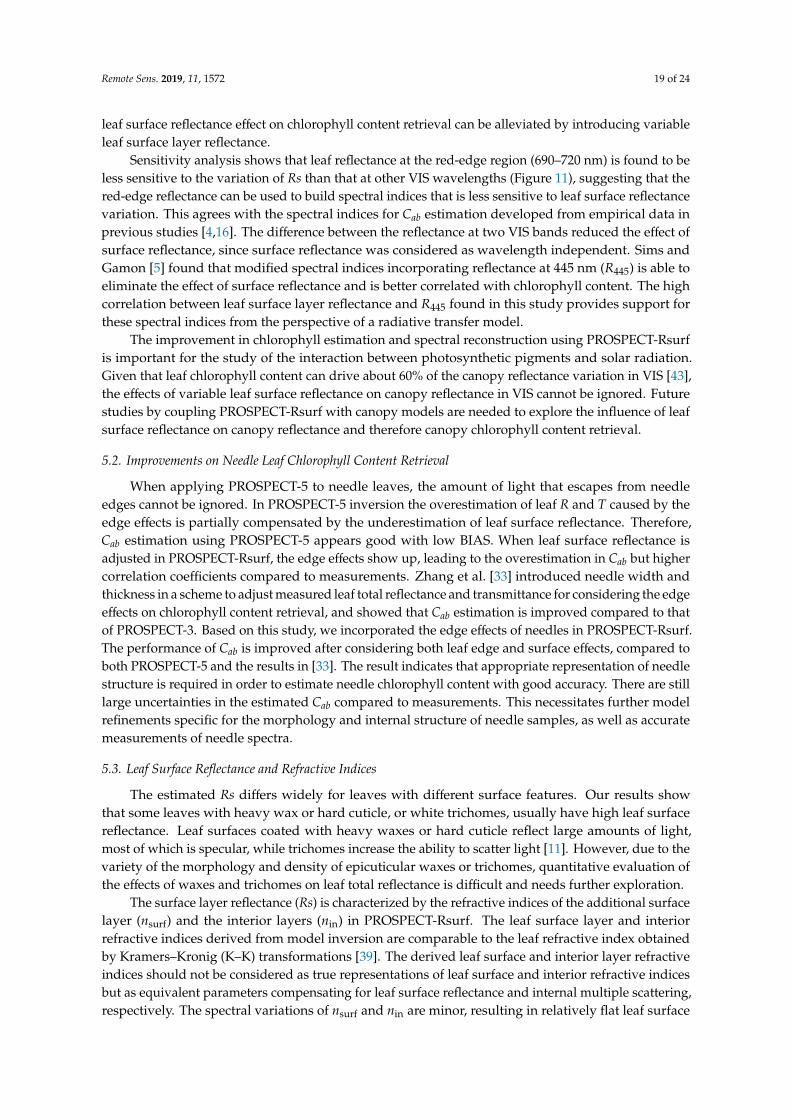
Remote Sens. 2019, 11, 1572 19 of 24
leaf surface reflectance effect on chlorophyll content retrieval can be alleviated by introducing variableleaf surface layer reflectance.
Sensitivity analysis shows that leaf reflectance at the red-edge region (690–720 nm) is found to beless sensitive to the variation of Rs than that at other VIS wavelengths (Figure 11), suggesting that thered-edge reflectance can be used to build spectral indices that is less sensitive to leaf surface reflectancevariation. This agrees with the spectral indices for Cab estimation developed from empirical data inprevious studies [4,16]. The difference between the reflectance at two VIS bands reduced the effect ofsurface reflectance, since surface reflectance was considered as wavelength independent. Sims andGamon [5] found that modified spectral indices incorporating reflectance at 445 nm (R445) is able toeliminate the effect of surface reflectance and is better correlated with chlorophyll content. The highcorrelation between leaf surface layer reflectance and R445 found in this study provides support forthese spectral indices from the perspective of a radiative transfer model.
The improvement in chlorophyll estimation and spectral reconstruction using PROSPECT-Rsurfis important for the study of the interaction between photosynthetic pigments and solar radiation.Given that leaf chlorophyll content can drive about 60% of the canopy reflectance variation in VIS [43],the effects of variable leaf surface reflectance on canopy reflectance in VIS cannot be ignored. Futurestudies by coupling PROSPECT-Rsurf with canopy models are needed to explore the influence of leafsurface reflectance on canopy reflectance and therefore canopy chlorophyll content retrieval.
5.2. Improvements on Needle Leaf Chlorophyll Content Retrieval
When applying PROSPECT-5 to needle leaves, the amount of light that escapes from needleedges cannot be ignored. In PROSPECT-5 inversion the overestimation of leaf R and T caused by theedge effects is partially compensated by the underestimation of leaf surface reflectance. Therefore,Cab estimation using PROSPECT-5 appears good with low BIAS. When leaf surface reflectance isadjusted in PROSPECT-Rsurf, the edge effects show up, leading to the overestimation in Cab but highercorrelation coefficients compared to measurements. Zhang et al. [33] introduced needle width andthickness in a scheme to adjust measured leaf total reflectance and transmittance for considering the edgeeffects on chlorophyll content retrieval, and showed that Cab estimation is improved compared to thatof PROSPECT-3. Based on this study, we incorporated the edge effects of needles in PROSPECT-Rsurf.The performance of Cab is improved after considering both leaf edge and surface effects, compared toboth PROSPECT-5 and the results in [33]. The result indicates that appropriate representation of needlestructure is required in order to estimate needle chlorophyll content with good accuracy. There are stilllarge uncertainties in the estimated Cab compared to measurements. This necessitates further modelrefinements specific for the morphology and internal structure of needle samples, as well as accuratemeasurements of needle spectra.
5.3. Leaf Surface Reflectance and Refractive Indices
The estimated Rs differs widely for leaves with different surface features. Our results showthat some leaves with heavy wax or hard cuticle, or white trichomes, usually have high leaf surfacereflectance. Leaf surfaces coated with heavy waxes or hard cuticle reflect large amounts of light,most of which is specular, while trichomes increase the ability to scatter light [11]. However, due to thevariety of the morphology and density of epicuticular waxes or trichomes, quantitative evaluation ofthe effects of waxes and trichomes on leaf total reflectance is difficult and needs further exploration.
The surface layer reflectance (Rs) is characterized by the refractive indices of the additional surfacelayer (nsurf) and the interior layers (nin) in PROSPECT-Rsurf. The leaf surface layer and interiorrefractive indices derived from model inversion are comparable to the leaf refractive index obtainedby Kramers–Kronig (K–K) transformations [39]. The derived leaf surface and interior layer refractiveindices should not be considered as true representations of leaf surface and interior refractive indicesbut as equivalent parameters compensating for leaf surface reflectance and internal multiple scattering,respectively. The spectral variations of nsurf and nin are minor, resulting in relatively flat leaf surface
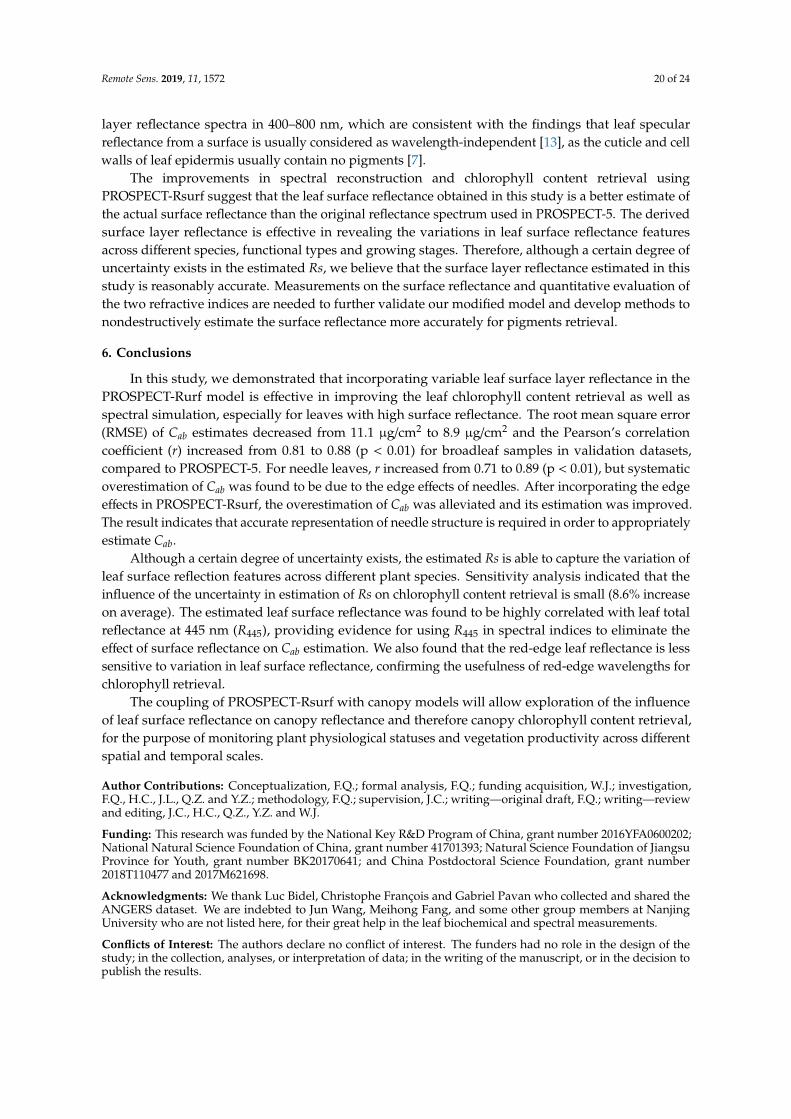
Remote Sens. 2019, 11, 1572 20 of 24
layer reflectance spectra in 400–800 nm, which are consistent with the findings that leaf specularreflectance from a surface is usually considered as wavelength-independent [13], as the cuticle and cellwalls of leaf epidermis usually contain no pigments [7].
The improvements in spectral reconstruction and chlorophyll content retrieval usingPROSPECT-Rsurf suggest that the leaf surface reflectance obtained in this study is a better estimate ofthe actual surface reflectance than the original reflectance spectrum used in PROSPECT-5. The derivedsurface layer reflectance is effective in revealing the variations in leaf surface reflectance featuresacross different species, functional types and growing stages. Therefore, although a certain degree ofuncertainty exists in the estimated Rs, we believe that the surface layer reflectance estimated in thisstudy is reasonably accurate. Measurements on the surface reflectance and quantitative evaluation ofthe two refractive indices are needed to further validate our modified model and develop methods tonondestructively estimate the surface reflectance more accurately for pigments retrieval.
6. Conclusions
In this study, we demonstrated that incorporating variable leaf surface layer reflectance in thePROSPECT-Rurf model is effective in improving the leaf chlorophyll content retrieval as well asspectral simulation, especially for leaves with high surface reflectance. The root mean square error(RMSE) of Cab estimates decreased from 11.1 µg/cm2 to 8.9 µg/cm2 and the Pearson’s correlationcoefficient (r) increased from 0.81 to 0.88 (p < 0.01) for broadleaf samples in validation datasets,compared to PROSPECT-5. For needle leaves, r increased from 0.71 to 0.89 (p < 0.01), but systematicoverestimation of Cab was found to be due to the edge effects of needles. After incorporating the edgeeffects in PROSPECT-Rsurf, the overestimation of Cab was alleviated and its estimation was improved.The result indicates that accurate representation of needle structure is required in order to appropriatelyestimate Cab.
Although a certain degree of uncertainty exists, the estimated Rs is able to capture the variation ofleaf surface reflection features across different plant species. Sensitivity analysis indicated that theinfluence of the uncertainty in estimation of Rs on chlorophyll content retrieval is small (8.6% increaseon average). The estimated leaf surface reflectance was found to be highly correlated with leaf totalreflectance at 445 nm (R445), providing evidence for using R445 in spectral indices to eliminate theeffect of surface reflectance on Cab estimation. We also found that the red-edge leaf reflectance is lesssensitive to variation in leaf surface reflectance, confirming the usefulness of red-edge wavelengths forchlorophyll retrieval.
The coupling of PROSPECT-Rsurf with canopy models will allow exploration of the influenceof leaf surface reflectance on canopy reflectance and therefore canopy chlorophyll content retrieval,for the purpose of monitoring plant physiological statuses and vegetation productivity across differentspatial and temporal scales.
Author Contributions: Conceptualization, F.Q.; formal analysis, F.Q.; funding acquisition, W.J.; investigation,F.Q., H.C., J.L., Q.Z. and Y.Z.; methodology, F.Q.; supervision, J.C.; writing—original draft, F.Q.; writing—reviewand editing, J.C., H.C., Q.Z., Y.Z. and W.J.
Funding: This research was funded by the National Key R&D Program of China, grant number 2016YFA0600202;National Natural Science Foundation of China, grant number 41701393; Natural Science Foundation of JiangsuProvince for Youth, grant number BK20170641; and China Postdoctoral Science Foundation, grant number2018T110477 and 2017M621698.
Acknowledgments: We thank Luc Bidel, Christophe François and Gabriel Pavan who collected and shared theANGERS dataset. We are indebted to Jun Wang, Meihong Fang, and some other group members at NanjingUniversity who are not listed here, for their great help in the leaf biochemical and spectral measurements.
Conflicts of Interest: The authors declare no conflict of interest. The funders had no role in the design of thestudy; in the collection, analyses, or interpretation of data; in the writing of the manuscript, or in the decision topublish the results.
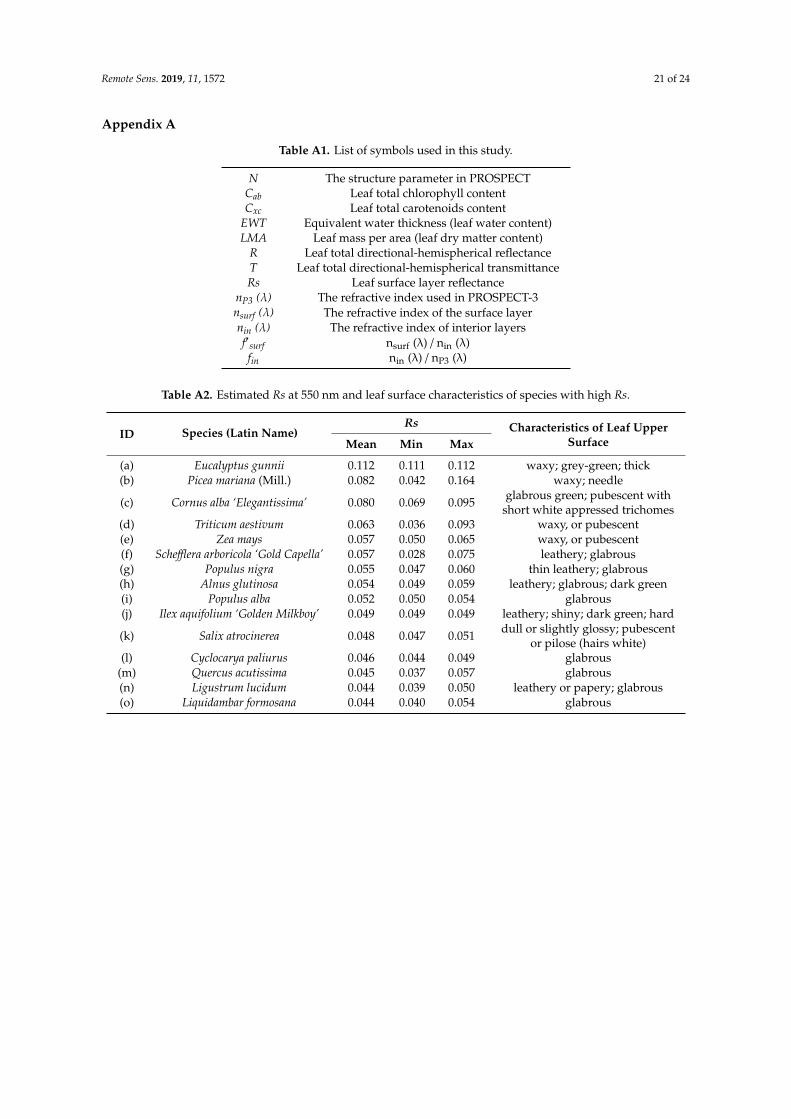
Remote Sens. 2019, 11, 1572 21 of 24
Appendix A
Table A1. List of symbols used in this study.
N The structure parameter in PROSPECTCab Leaf total chlorophyll contentCxc Leaf total carotenoids content
EWT Equivalent water thickness (leaf water content)LMA Leaf mass per area (leaf dry matter content)
R Leaf total directional-hemispherical reflectanceT Leaf total directional-hemispherical transmittanceRs Leaf surface layer reflectance
nP3 (λ) The refractive index used in PROSPECT-3nsurf (λ) The refractive index of the surface layernin (λ) The refractive index of interior layersf′surf nsurf (λ) / nin (λ)fin nin (λ) / nP3 (λ)
Table A2. Estimated Rs at 550 nm and leaf surface characteristics of species with high Rs.
ID Species (Latin Name)Rs Characteristics of Leaf Upper
SurfaceMean Min Max
(a) Eucalyptus gunnii 0.112 0.111 0.112 waxy; grey-green; thick(b) Picea mariana (Mill.) 0.082 0.042 0.164 waxy; needle
(c) Cornus alba ‘Elegantissima’ 0.080 0.069 0.095 glabrous green; pubescent withshort white appressed trichomes
(d) Triticum aestivum 0.063 0.036 0.093 waxy, or pubescent(e) Zea mays 0.057 0.050 0.065 waxy, or pubescent(f) Schefflera arboricola ‘Gold Capella’ 0.057 0.028 0.075 leathery; glabrous(g) Populus nigra 0.055 0.047 0.060 thin leathery; glabrous(h) Alnus glutinosa 0.054 0.049 0.059 leathery; glabrous; dark green(i) Populus alba 0.052 0.050 0.054 glabrous(j) Ilex aquifolium ‘Golden Milkboy’ 0.049 0.049 0.049 leathery; shiny; dark green; hard
(k) Salix atrocinerea 0.048 0.047 0.051 dull or slightly glossy; pubescentor pilose (hairs white)
(l) Cyclocarya paliurus 0.046 0.044 0.049 glabrous(m) Quercus acutissima 0.045 0.037 0.057 glabrous(n) Ligustrum lucidum 0.044 0.039 0.050 leathery or papery; glabrous(o) Liquidambar formosana 0.044 0.040 0.054 glabrous
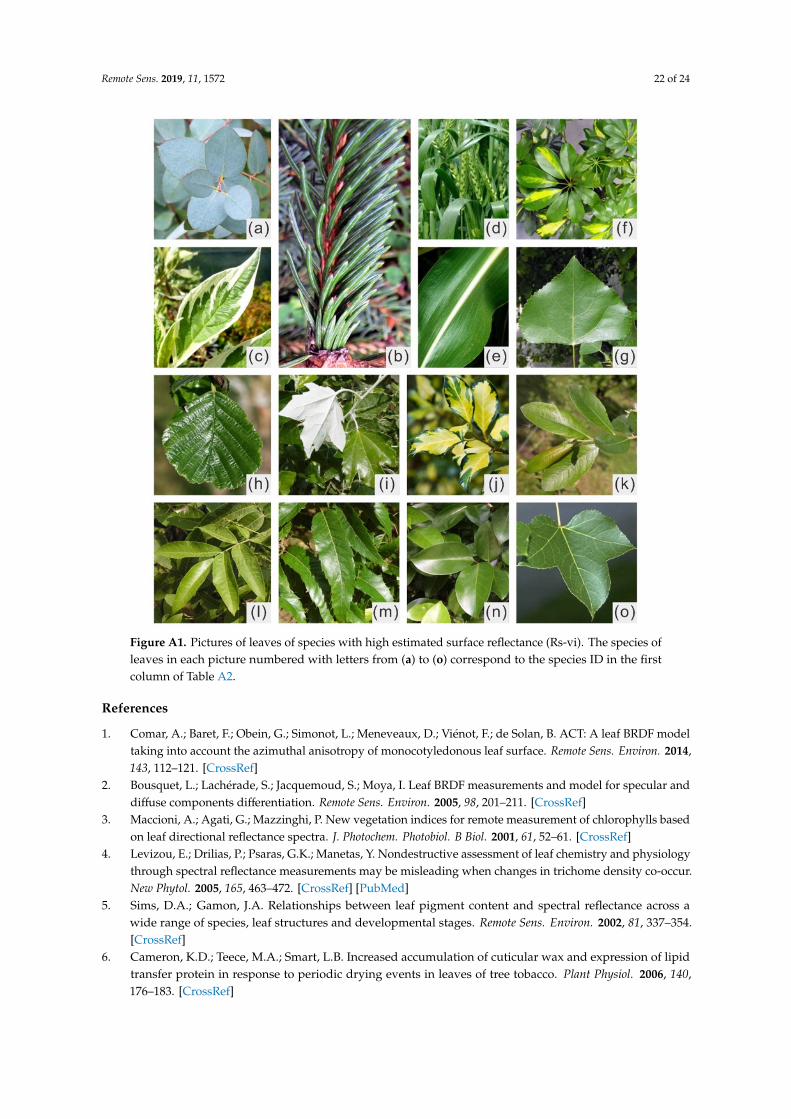
Remote Sens. 2019, 11, 1572 22 of 24Remote Sens. 2019, 11, 1572 22 of 24
Figure A1. Pictures of leaves of species with high estimated surface reflectance (Rs-vi). The species of leaves in each picture numbered with letters from (a) to (o) correspond to the species ID in the first column of Table A2.
References
1. Comar, A.; Baret, F.; Obein, G.; Simonot, L.; Meneveaux, D.; Viénot, F.; de Solan, B. ACT: A leaf BRDF model taking into account the azimuthal anisotropy of monocotyledonous leaf surface. Remote Sens. Environ. 2014, 143, 112–121, doi:10.1016/j.rse.2013.12.006.
2. Bousquet, L.; Lachérade, S.; Jacquemoud, S.; Moya, I. Leaf BRDF measurements and model for specular and diffuse components differentiation. Remote Sens. Environ. 2005, 98, 201–211, doi:10.1016/j.rse.2005.07.005.
3. Maccioni, A.; Agati, G.; Mazzinghi, P. New vegetation indices for remote measurement of chlorophylls based on leaf directional reflectance spectra. J. Photochem. Photobiol. B Biol. 2001, 61, 52–61, doi:10.1016/s1011-1344(01)00145-2.
4. Levizou, E.; Drilias, P.; Psaras, G.K.; Manetas, Y. Nondestructive assessment of leaf chemistry and physiology through spectral reflectance measurements may be misleading when changes in trichome density co-occur. New Phytol. 2005, 165, 463–472, doi:10.1111/j.1469-8137.2004.01250.x.
5. Sims, D.A.; Gamon, J.A. Relationships between leaf pigment content and spectral reflectance across a wide range of species, leaf structures and developmental stages. Remote Sens. Environ. 2002, 81, 337–354, doi:10.1016/S0034-4257(02)00010-X.
6. Cameron, K.D.; Teece, M.A.; Smart, L.B. Increased accumulation of cuticular wax and expression of lipid transfer protein in response to periodic drying events in leaves of tree tobacco. Plant Physiol. 2006, 140, 176–183, doi:10.1104/pp.105.069724.
Figure A1. Pictures of leaves of species with high estimated surface reflectance (Rs-vi). The species ofleaves in each picture numbered with letters from (a) to (o) correspond to the species ID in the firstcolumn of Table A2.
References
1. Comar, A.; Baret, F.; Obein, G.; Simonot, L.; Meneveaux, D.; Viénot, F.; de Solan, B. ACT: A leaf BRDF modeltaking into account the azimuthal anisotropy of monocotyledonous leaf surface. Remote Sens. Environ. 2014,143, 112–121. [CrossRef]
2. Bousquet, L.; Lachérade, S.; Jacquemoud, S.; Moya, I. Leaf BRDF measurements and model for specular anddiffuse components differentiation. Remote Sens. Environ. 2005, 98, 201–211. [CrossRef]
3. Maccioni, A.; Agati, G.; Mazzinghi, P. New vegetation indices for remote measurement of chlorophylls basedon leaf directional reflectance spectra. J. Photochem. Photobiol. B Biol. 2001, 61, 52–61. [CrossRef]
4. Levizou, E.; Drilias, P.; Psaras, G.K.; Manetas, Y. Nondestructive assessment of leaf chemistry and physiologythrough spectral reflectance measurements may be misleading when changes in trichome density co-occur.New Phytol. 2005, 165, 463–472. [CrossRef] [PubMed]
5. Sims, D.A.; Gamon, J.A. Relationships between leaf pigment content and spectral reflectance across awide range of species, leaf structures and developmental stages. Remote Sens. Environ. 2002, 81, 337–354.[CrossRef]
6. Cameron, K.D.; Teece, M.A.; Smart, L.B. Increased accumulation of cuticular wax and expression of lipidtransfer protein in response to periodic drying events in leaves of tree tobacco. Plant Physiol. 2006, 140,176–183. [CrossRef]
Remote Sens. 2019, 11, 1572 23 of 24
7. Grant, L.; Daughtry, C.S.T.; Vanderbilt, V.C. Polarized and specular reflectance variation with leaf surfacefeatures. Physiol. Plant. 1993, 88, 1–9. [CrossRef]
8. Pfündel, E.E.; Agati, G.; Cerovic, Z.G. Optical Properties of Plant Surfaces. In Annual Plant Reviews Volume 23:Biology of the Plant Cuticle; Blackwell Publishing Ltd.: Oxford, UK, 2006; pp. 216–249.
9. Baldini, E.; Facini, O.; Nerozzi, F.; Rossi, F.; Rotondi, A. Leaf characteristics and optical properties of differentwoody species. Trees 1997, 12, 73–81. [CrossRef]
10. Ehleringer, J.; Björkman, O.; Mooney, H.A. Leaf pubescence: Effects on absorptance and photosynthesis in adesert shrub. Science 1976, 192, 376–377. [CrossRef]
11. Holmes, M.G.; Keiller, D.R. Effects of pubescence and waxes on the reflectance of leaves in the ultravioletand photosynthetic wavebands: A comparison of a range of species. Plant Cell Environ. 2002, 25, 85–93.[CrossRef]
12. Breece, H.T.; Holmes, R.A. Bidirectional Scattering Characteristics of Healthy Green Soybean and CornLeaves in Vivo. Appl. Opt. 1971, 10, 119–127. [CrossRef] [PubMed]
13. Jay, S.; Bendoula, R.; Hadoux, X.; Féret, J.-B.; Gorretta, N. A physically-based model for retrieving foliarbiochemistry and leaf orientation using close-range imaging spectroscopy. Remote Sens. Environ. 2016, 177,220–236. [CrossRef]
14. Vanderbilt, V.C.; Grant, L. Polarization photometer to measure bidirectional reflectance factor R (55◦, 0◦; 55◦,180◦) of leaves. Opt. Eng. 1986, 25, 1002–1012. [CrossRef]
15. Verrelst, J.; Camps-Valls, G.; Muñoz-Marí, J.; Rivera, J.P.; Veroustraete, F.; Clevers, J.G.; Moreno, J. Opticalremote sensing and the retrieval of terrestrial vegetation bio-geophysical properties—A review. ISPRS J.Photogramm. Remote Sens. 2015, 108, 273–290. [CrossRef]
16. Gitelson, A.A.; Gritz, Y.; Merzlyak, M.N. Relationships between leaf chlorophyll content and spectralreflectance and algorithms for non-destructive chlorophyll assessment in higher plant leaves. J. Plant Physiol.2003, 160, 271–282. [CrossRef]
17. Croft, H.; Chen, J.M.; Zhang, Y. The applicability of empirical vegetation indices for determining leafchlorophyll content over different leaf and canopy structures. Ecol. Complex. 2014, 17, 119–130. [CrossRef]
18. Jacquemoud, S.; Baret, F. PROSPECT: A model of leaf optical properties spectra. Remote Sens. Environ. 1990,34, 75–91. [CrossRef]
19. Combal, B.; Baret, F.; Weiss, M.; Trubuil, A.; Macé, D.; Pragnère, A.; Myneni, R.; Knyazikhin, Y.; Wang, L.Retrieval of canopy biophysical variables from bidirectional reflectance: Using prior information to solve theill-posed inverse problem. Remote Sens. Environ. 2003, 84, 1–15. [CrossRef]
20. Darvishzadeh, R.; Skidmore, A.; Schlerf, M.; Atzberger, C. Inversion of a radiative transfer model forestimating vegetation LAI and chlorophyll in a heterogeneous grassland. Remote Sens. Environ. 2008, 112,2592–2604. [CrossRef]
21. Jacquemoud, S.; Ustin, S.L.; Verdebout, J.; Schmuck, G.; Andreoli, G.; Hosgood, B. Estimating LeafBiochemistry Using the PROSPECT Leaf Optical Properties Model. Remote Sens. Environ. 1996, 56, 194–202.[CrossRef]
22. Barry, K.; Newnham, G. Quantification of chlorophyll and carotenoid pigments in eucalyptus foliage with theradiative transfer model PROSPECT 5 is affected by anthocyanin and epicuticular waxes. In Proceedings ofthe Geospatial Science Research Symposium—GSR_2, Melbourne, Australia, 10–12 December 2012; pp. 1–7.
23. Barry, K.M.; Newnham, G.J.; Stone, C. Estimation of chlorophyll content in Eucalyptus globulus foliage withthe leaf reflectance model PROSPECT. Agric. For. Meteorol. 2009, 149, 1209–1213. [CrossRef]
24. Féret, J.B.; Gitelson, A.A.; Noble, S.D.; Jacquemoud, S. PROSPECT-D: Towards modeling leaf opticalproperties through a complete lifecycle. Remote Sens. Environ. 2017, 193, 204–215. [CrossRef]
25. Li, D.; Cheng, T.; Jia, M.; Zhou, K.; Lu, N.; Yao, X.; Tian, Y.; Zhu, Y.; Cao, W. PROCWT: Coupling PROSPECTwith continuous wavelet transform to improve the retrieval of foliar chemistry from leaf bidirectionalreflectance spectra. Remote Sens. Environ. 2018, 206, 1–14. [CrossRef]
26. Gerber, F.; Marion, R.; Olioso, A.; Jacquemoud, S.; Ribeiro da Luz, B.; Fabre, S. Modeling directional–hemispherical reflectance and transmittance of fresh and dry leaves from 0.4 µm to 5.7 µm with thePROSPECT-VISIR model. Remote Sens. Environ. 2011, 115, 404–414. [CrossRef]
27. Clark, J.B.; Lister, G.R. Photosynthetic Action Spectra of Trees. Plant Physiol. 1975, 55, 407–413. [CrossRef][PubMed]
Remote Sens. 2019, 11, 1572 24 of 24
28. Féret, J.-B.; François, C.; Asner, G.P.; Gitelson, A.A.; Martin, R.E.; Bidel, L.P.R.; Ustin, S.L.; le Maire, G.;Jacquemoud, S. PROSPECT-4 and 5: Advances in the leaf optical properties model separating photosyntheticpigments. Remote Sens. Environ. 2008, 112, 3030–3043. [CrossRef]
29. Lichtenthaler, H.K. Chlorophylls and carotenoids: Pigments of photosynthetic biomembranes.Methods Enzymol. 1987, 148, 350–381.
30. Minocha, R.; Martinez, G.; Lyons, B.; Long, S. Development of a standardized methodology for quantifyingtotal chlorophyll and carotenoids from foliage of hardwood and conifer tree species. Can. J. For. Res. 2009,39, 849–861. [CrossRef]
31. Zarco-Tejada, P.J.; Miller, J.R.; Harron, J.; Hu, B.; Noland, T.L.; Goel, N.; Mohammed, G.H.; Sampson, P.Needle chlorophyll content estimation through model inversion using hyperspectral data from boreal coniferforest canopies. Remote Sens. Environ. 2004, 89, 189–199. [CrossRef]
32. Harron, J. Optical Properties of Phytoelements in Conifers. Master’s Thesis, York University, North York,ON, Canada, 2000.
33. Zhang, Y.; Chen, J.M.; Miller, J.R.; Noland, T.L. Retrieving chlorophyll content in conifer needles fromhyperspectral measurements. Can. J. Remote Sens. 2008, 34, 296–310.
34. Zarco-Tejada, P.J.; Miller, J.R.; Mohammed, G.H.; Noland, T.L. Chlorophyll Fluorescence Effects on VegetationApparent Reflectance: I. Leaf-Level Measurements and Model Simulation. Remote Sens. Environ. 2000, 74,582–595. [CrossRef]
35. Croft, H.; Chen, J.M. Leaf pigment content. In Comprehensive Remote Sensing; Liang, S., Ed.; Elsevier: Oxford,UK, 2018; pp. 117–142.
36. Wellburn, A.R. The Spectral Determination of Chlorophylls a and b, as well as Total Carotenoids, UsingVarious Solvents with Spectrophotometers of Different Resolutions. J. Plant Physiol. 1994, 144, 307–313.[CrossRef]
37. Allen, W.A.; Gausman, H.W.; Richardson, A.J.; Thomas, J.R. Interaction of isotropic light with a compactplant leaf. J. Opt. Soc. Am. 1969, 59, 1376–1379. [CrossRef]
38. Lucarini, V.; Saarinen, J.; Peiponen, K.; Vartiainen, E. Kramers-Kronig Relations in Optical Materials Research;Rhodes, W.T., Ed.; Springer: Berlin, Germany, 2005; Volume 110, p. 162.
39. Chen, M.; Weng, F. Kramers-Kronig analysis of leaf refractive index with the PROSPECT leaf optical propertymodel. J. Geophys. Res. 2012, 117. [CrossRef]
40. D’Errico, J. Fminsearchbnd. MATLAB Central File Exchange. 2012. Available online: https://ww2.mathworks.cn/matlabcentral/fileexchange/8277-fminsearchbnd-fminsearchcon (accessed on 19 March 2014).
41. Gausman, H.W.; Allen, W.A.; Escobar, D.E. Refractive Index of Plant Cell Walls. Appl. Opt. 1974, 13, 109–111.[CrossRef] [PubMed]
42. Cannavó, F. Sensitivity analysis for volcanic source modeling quality assessment and model selection.Comput. Geosci. 2012, 44, 52–59. [CrossRef]
43. Jacquemoud, S.; Verhoef, W.; Baret, F.; Bacour, C.; Zarco-Tejada, P.J.; Asner, G.P.; François, C.; Ustin, S.L.PROSPECT + SAIL models: A review of use for vegetation characterization. Remote Sens. Environ. 2009, 113,S56–S66. [CrossRef]
© 2019 by the authors. Licensee MDPI, Basel, Switzerland. This article is an open accessarticle distributed under the terms and conditions of the Creative Commons Attribution(CC BY) license (http://creativecommons.org/licenses/by/4.0/).