Retirement in Canada: Lots to enjoy about ‘golden years...
37
For Immediate Release Canadian Public Opinion Poll Page 1 of 37 MEDIA CONTACT: Shachi Kurl, Senior Vice President: 604.908.1693 [email protected] @shachikurl Retirement in Canada: Lots to enjoy about ‘golden years,’ but financial worries loom large -- especially for those still working Most Canadians report retiring earlier or later because of circumstances beyond their control. July 1, 2015 – Who is retiring? When in their lives are they doing it? How are they funding it? Are they satisfied with the experience? A comprehensive new Angus Reid Institute poll provides insights into these questions, and many others. Overall, the survey findings show that the Canadian retirement experience is vastly different for different groups of people, but largely fulfilling for most -- notwithstanding quite widespread financial anxiety. Key Findings: Less than half (46%) of retirees say they retired when and as planned. The rest retired earlier (48%) or later (6%) because of circumstances outside their control. Retired Canadians are considerably more reliant on government and work pensions to finance their retirement than still-working Canadians expect to be when they retire. And, while a fairly concerning one-half (48%) of the already retired are worried about outliving their money, this anxiety is shared by three-quarters (74%) of Canadians who are not yet retired. There is a fairly stark divide in the post-work experiences of public sector and private sector employees. Private sector retirees are nearly twice as likely to report they are “struggling” (22%) METHODOLOGY: The Angus Reid Institute conducted online surveys among a total of 1,927 Canadian adults who are members of the Angus Reid Forum. The main survey was conducted between January 15 th and 19 th 2015 among a national randomized sample of 1507 Canadians, and an augment survey of 420 additional retired Canadians was taken between February 2 nd and 4 th to achieve the total retired sub-sample of 818. For comparison purposes only, probability samples of 1,100 non-retired and 800 retired would carry error margins of +/-3% and +/-3.5% respectively, 19 times out of 20. This survey was self-commissioned and paid for by ARI. Detailed tabular results are found at the end of this release. 18% 44% 38% 6% 46% 48% Making ends meet is a struggle I live comfortably but don't have money for extras I have enough money to do everything I want I retired later due at least partly to circumstances outside my control I retired when and as planned I retired earlier due at least partly to circumstances outside my control Timing and affordability of Canadian retirement
Transcript of Retirement in Canada: Lots to enjoy about ‘golden years...

For Immediate Release Canadian Public Opinion Poll
Page 1 of 37
MEDIA CONTACT: Shachi Kurl, Senior Vice President: 604.908.1693 [email protected] @shachikurl
Retirement in Canada:
Lots to enjoy about ‘golden years,’ but financial worries loom large -- especially for those still working Most Canadians report retiring earlier or later because of circumstances beyond their control.
July 1, 2015 – Who is retiring? When in their lives are they doing it? How are they funding it? Are they satisfied with the experience? A comprehensive new Angus Reid Institute poll provides insights into these questions, and many others. Overall, the survey findings show that the Canadian retirement experience is vastly different for different groups of people, but largely fulfilling for most -- notwithstanding quite widespread financial anxiety. Key Findings:
Less than half (46%) of
retirees say they retired
when and as planned.
The rest retired earlier
(48%) or later (6%)
because of
circumstances outside
their control.
Retired Canadians are
considerably more
reliant on government
and work pensions to finance their retirement than still-working Canadians expect to be when
they retire. And, while a fairly concerning one-half (48%) of the already retired are worried about
outliving their money, this anxiety is shared by three-quarters (74%) of Canadians who are not yet
retired.
There is a fairly stark divide in the post-work experiences of public sector and private sector
employees. Private sector retirees are nearly twice as likely to report they are “struggling” (22%)
METHODOLOGY:
The Angus Reid Institute conducted online surveys among a total of 1,927 Canadian adults who are members of the Angus Reid Forum. The main survey was conducted between January 15th and 19th 2015 among a national randomized sample of 1507 Canadians, and an augment survey of 420 additional retired Canadians was taken between February 2nd and 4th to achieve the total retired sub-sample of 818. For comparison purposes only, probability samples of 1,100 non-retired and 800 retired would carry error margins of +/-3% and +/-3.5% respectively, 19 times out of 20. This survey was self-commissioned and paid for by ARI. Detailed tabular results are found at the end of this release.
18%
44%
38%
6%
46%
48%
Making ends meet is a struggle
I live comfortably but don't havemoney for extras
I have enough money to doeverything I want
I retired later due at least partly tocircumstances outside my control
I retired when and as planned
I retired earlier due at least partly tocircumstances outside my control
Timing and affordability of Canadian retirement

For Immediate Release Canadian Public Opinion Poll
Page 2 of 37
MEDIA CONTACT: Shachi Kurl, Senior Vice President: 604.908.1693 [email protected] @shachikurl
as those retired from the public sector (12%), who are, in turn, almost twice as likely to rely on a
work pension (75%) as their private sector counterparts (39%).
Retired Canadians express significant satisfaction with a number of key aspects of retirement.
Indeed, four-in-ten say they have no regrets with life after work thus far. A large majority (more
than nine-in-ten) enjoy having the time to relax and do what they want, which are areas of equally
high expectations among the still-working crowd as well.
Some retirees (roughly one-in-three) do wish they had closer community connections and better
volunteer opportunities, as well as more time with family -- though most are happy with these
areas as well. Four-in-ten retirees admit to sometimes missing work, a concern shared by fully
six-in-ten Canadians who are still working.
A special segmentation analysis places Canadian retirees into four broad groups, each displaying
a distinct orientation towards retirement and each comprising roughly one-quarter of the retired
Canadian population. The four groups are broadly summarized by their names: The “Lovin’ It"
crowd, the Comfortable, the Strugglers and the Unhealthy.
PART 1: Anatomy and Financial Realities of Retirement There are 6.4 million retired or semi-retired people in Canada, according to the Canadian Association of Retired People. They make up nearly a fifth of the overall population. This special Angus Reid Institute study examined a number of key elements of what might be called the “anatomy of retirement” in Canada – with the main focus being on the circumstances precipitating retirement and Canadians’ financial security once out of the workforce. On both of these counts, the results paint a less-than-comforting picture of “the golden years.” Early exits for many First off, not even half (46%) of the retired Canadians surveyed controlled the circumstances surrounding their retirement – instead, as many (48%) said they “retired earlier due at least partly to circumstances outside my control”. Only a handful (6%) retired later than planned. This synchs with the fairly young retirement ages reported in the survey. Overall, our retired sample splits into three groups: 36 per cent retired at age 55 or younger; 28 per cent retired in their late 50’s (between 56 and 60); and 36 per cent retired at 61 or older. As would be expected, those who retired earlier than planned were younger still (44% of this group retired at 55 or younger) while the plurality (40%) of those who retired “when and as planned” worked until aged 61 or older.

For Immediate Release Canadian Public Opinion Poll
Page 3 of 37
MEDIA CONTACT: Shachi Kurl, Senior Vice President: 604.908.1693 [email protected] @shachikurl
Nationally, the average retirement age in 2014 was 63, though some specific economic sectors have averages that are higher or lower. According to Statistics Canada, the average retirement age has been rising slowly, but steadily, since 2010, when it was 62.1. Retirees’ financial security Financial security in retirement is part of the Canadian dream, but can hardly be taken for granted. Nearly half (48%) of the retired Canadians surveyed agreed with the statement: “I’m worried about my money lasting my lifetime”; roughly one-in-five (19%) strongly agreed. This anxiety is shared by substantial numbers of retired Canadians from all walks of life – including more than half (54%) of retired women and retirees with less formal education (52%). As bracing as this level of financial anxiety among retirees is, it is perhaps more remarkable that it is shared by roughly three-quarters (74%) of those not yet retired, more than a third of whom (36%) agree strongly with the statement.
Another survey item asked respondents to broadly describe how they are faring financially in retirement:
Four-in-ten (38%) of the retired Canadians surveyed said “I have enough money to do everything
I want”;
A slightly larger group – 44 per cent – “live comfortably but don’t have money for extras”;
And for the remaining one-in-five (18%) retired Canadians “making ends meet is a struggle”.
19%
29% 29%
23%
36%38%
18%
8%
Agree strongly Agree moderately Disagree moderately Disagree strongly
I'm worried about my money lasting my lifetime
Retirees Non-retired

For Immediate Release Canadian Public Opinion Poll
Page 4 of 37
MEDIA CONTACT: Shachi Kurl, Senior Vice President: 604.908.1693 [email protected] @shachikurl
Of course, these two measures are highly correlated: fully nine-in-ten (90%) of those struggling to make ends meet are worried about outliving their money, whereas this concern is shared by fewer than one-in-five (17%) of those who say they have plenty of money. Importantly, most (58%) of those in the largest group (those who say they’re “comfortable”) share some anxiety about their money lasting their lifetime. Freedom 55 – Really? An early or younger exit from the workforce is not necessarily to be envied from a financial security perspective. The almost half (48%) of retirees who said they were forced by circumstance to retire earlier than planned are as likely to be struggling as they are to say they have enough money to do what they want – 27 per cent in each case, with the plurality (46%) opting for the middle option of “living comfortably.” Compare this to those who retired when and as planned: 49 per cent say they have enough money to do whatever they want, four-in-ten (43%) are comfortable, and only one-in-ten (8%) is financially struggling.
*Small sample size How are Canadians financing retirement? The Canadian retirees surveyed highlighted the following primary means of financing their retirement:
Government pension – selected by 57 per cent as one of their three main sources of retirement
income;
A work pension – 53 per cent;
Retirement savings (i.e.: RRSP’s, etc) – 30 per cent;
27%
49%
37%
46%
43%
40%
27%
8%
23%
I retired earlier
I retired when and as planned
I retired later*
Financial security by retirement circumstance
I have enough money to do everything I want
I live comfortably but don't have money for extras
Making ends meet is a struggle

For Immediate Release Canadian Public Opinion Poll
Page 5 of 37
MEDIA CONTACT: Shachi Kurl, Senior Vice President: 604.908.1693 [email protected] @shachikurl
Investments – 13 per cent;
Downsizing/selling assets – 6 per cent;
Other sources (including: inheritance, support from children, etc) – cited by a total of 11 per cent.
Of course, how one’s retirement is funded is strongly correlated with financial security:
A government pension is a primary source of retirement income for two-thirds (67%) of those
struggling to make ends meet versus less than half (43%) of those who describe themselves as
well-off.
And less than one-in-three (28%) of those struggling are able to rely on a work pension –
whereas more than twice as many (61%) of the best-off group point to a work pension as a
primary means of support.
This affluent retired group is also considerably more likely to rely on retirement savings (40% do
so) or investment income (25%).
These two vehicles were cited much less often by the struggling group, who were more likely to
say they have downsized (13% had done so) or used other means (such as support from
children) to support themselves in retirement.
Public – Private sector divide
57%53%
30%
13%
6% 4%7%
Primary sources of retirement funding (choose up to 3)

For Immediate Release Canadian Public Opinion Poll
Page 6 of 37
MEDIA CONTACT: Shachi Kurl, Senior Vice President: 604.908.1693 [email protected] @shachikurl
Running through all these results is a rather sharp divide between public sector and private sector retirees and, relatedly, between those who had been union members and those who had not. The marked difference in perspective lends considerable credence to arguments about a growing inequity between Canada’s public and private sector workers. Consider the following:
Private sector retirees are considerably more likely to report leaving the workforce early due at
least partly to circumstances outside their control (53% versus 41%).
They are almost twice as likely to report that making ends meet is a struggle (22% versus 12%).
Private sector retirees are also more likely to worry about outliving their money (53% versus
41%).
And, of course, public sector retirees are much more likely to be relying on a work pension as a
primary support in their retirement (75% versus 39%) whereas their private sector counterparts
are more likely to be relying on other savings and supports. (Both groups, significantly, cite
Canadian government pensions as a main source of retirement support – 57% each.)
Public – Private Sector Divide
Did you control the circumstances of your retirement?
Public Sector Private Sector
I retired earlier due at least partly to circumstances outside my control
41% 53%
I retired when and as planned 55% 40%
I retired later due at least partly to circumstances outside my control
4% 8%
What best describes your situation?
Public Sector Private Sector
I have enough money to do everything I want 44% 34%
I live comfortably but don't have money for extras 44% 44%
Making ends meet is a struggle 12% 22%

For Immediate Release Canadian Public Opinion Poll
Page 7 of 37
MEDIA CONTACT: Shachi Kurl, Senior Vice President: 604.908.1693 [email protected] @shachikurl
I'm worried about my money lasting my lifetime.
Public Sector Private Sector
Strongly agree/Agree 41% 53%
Strongly disagree/Disagree 59% 47%
What are your main sources of retirement income?
Public Sector Private Sector
Government pension (Old Age pension) 57% 57%
Work pension 75% 39%
Your retirement savings (RRSPs, etc) 22% 35%
Investments 9% 15%
Downsizing/selling assets 5% 6%
Inheritance 1% 4%
Support from children/family 1% 1%
Other, specify 2% 10%
A very similar pattern is noted by union membership history – reflecting the reality of public versus private sector unionization in Canada today. PART 2: Working Canadians’ Plans and Expectations The expectations of Canadians who are not yet retired are somewhat at odds with some of the important retirement realities highlighted by the Angus Reid Institute survey of retirees.
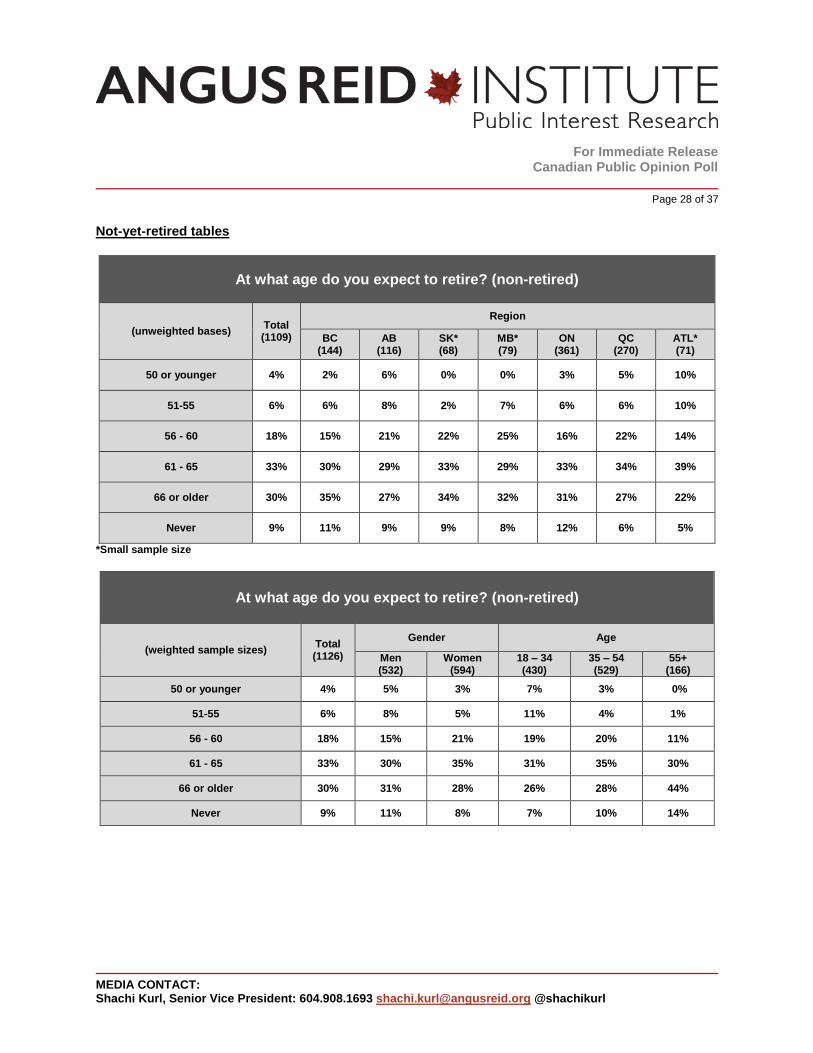
For example, retirement age. Most Canadians not yet retired (72%) expect to work into their 60’s,
but almost half (45%) would prefer to retire by age 55 – the gap here perhaps reflecting the reality
of financial insecurity being experienced by many who did retire younger, often not entirely by
their own choosing. Somewhat ironically, given the public-private sector divide discussed earlier,
public sector and union workers are decidedly keener about retiring earlier than they actually

For Immediate Release Canadian Public Opinion Poll
Page 8 of 37
MEDIA CONTACT: Shachi Kurl, Senior Vice President: 604.908.1693 [email protected] @shachikurl
expect to, whereas their private sector and non-union counterparts are more likely to be fine with
working into their 60’s.
Interestingly, the non-retired Canadians surveyed take a more pessimistic view of their likely
financial security in retirement. They are as likely as those currently retired to put themselves in
the middle comfortable group (48% versus 44% of current retirees), while only one-in-four (24%)
expect to have enough money to do everything they want (versus the 38% among those currently
retired) and more than one-in-four (28%) expect to be struggling to make ends meet (versus the
18% of current retired who report this).
Those not yet retired have quite different perspectives as to what will be their primary financial
support in retirement. Specifically, considerably fewer of those not yet retired expect to rely on a
pension – of either type: 45 per cent said they expect to rely on a government pension (versus
57% of those currently retired), and 34 per cent think they will have a work pension (versus the
53% of the currently retired who cited this as a primary source of their retirement income).
Instead, those not yet retired are much more likely to expect to rely on their own savings: fully half
(50%) said this will be a key means of support compared to less than one-in-three (30%) of those
already retired. Underlining the trepidation many non-retired are feeling, a fair number said they
expect to at least partly finance their retirement through downsizing assets (11%) and inheritance
or family support (8%).
And, as noted earlier, roughly three-quarters (74%) of not-yet-retired Canadians agree with the
statement: “I’m worried about my money lasting my lifetime”. This unfortunate sentiment is widely
shared by working Canadians from all walks of life.
Experiences and Expectations of Retirement Finances
What best describes your situation?
Retired Non-retired
I (expect to) have enough money to do everything I want
38% 24%
I (expect to) live comfortably but don't have money for extras
44% 48%
Making ends meet is (or will be) a struggle 18% 28%

For Immediate Release Canadian Public Opinion Poll
Page 9 of 37
MEDIA CONTACT: Shachi Kurl, Senior Vice President: 604.908.1693 [email protected] @shachikurl
What are (do you expect to be) your main sources of retirement income?
Retired Non-retired
Government pension (Old Age pension) 57% 45%
Work pension 53% 34%
Your retirement savings (RRSPs, etc) 30% 50%
Investments 13% 14%
Downsizing/selling assets 6% 11%
Inheritance 3% 5%
Support from children/family 1% 3%
Other, specify 7% 3%
PART 3: The Retirement Experience This research also took a fairly in-depth look at some of the less tangible – but still critical -- aspects of retirement with a view to better understanding Canadians’ overall experience with life after work. Meaning and letdowns Most retired Canadians do not seem to have trouble extracting meaning from this phase of their life. Three-quarters (76%) of those surveyed disagreed with the sentiment: “I feel like my life does not have as much meaning now that I’m retired.” So, what makes retirement meaningful and vital? Those surveyed were asked to choose up to three from a list of eight different possibilities. (Respondents were asked to set aside good health and having enough money and neither was offered on the choice list.) At the top of the list:
Quality time with family is a key source of meaning and vitality for most retirees (54%).
Travel is high on the list as well (50% chose it).
And for many, it’s about having fun:
Rest and relaxation should not be under-estimated: 45 per cent said this is key for them.
Almost as many (43%) chose participating in leisure activities as something that adds
meaning and vitality to their retirement.

For Immediate Release Canadian Public Opinion Poll
Page 10 of 37
MEDIA CONTACT: Shachi Kurl, Senior Vice President: 604.908.1693 [email protected] @shachikurl
Socializing with friends was highlighted by four-in-ten (39%).
Rounding out the list:
Volunteering was selected as a source of meaning in retirement by one-in-four (25%).
A rich spiritual life is important for one-in-seven (14%).
Part-time paid work was selected by roughly the same number (13%).
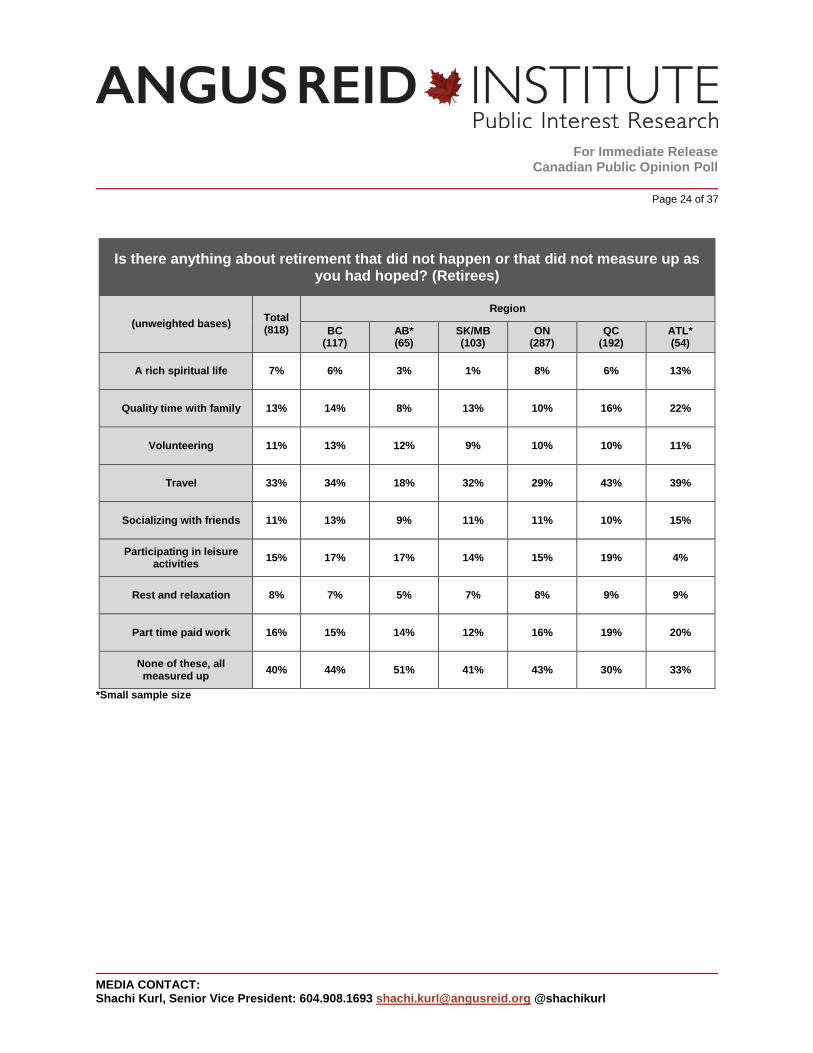
Interestingly, the non-retired group offered similar priorities when asked what they anticipate will enrich their own retirement. They were somewhat more likely than the already retired to highlight travel (61%) and family time (62%), and somewhat less likely to single out socializing with friends (26%) and volunteering (14%). But what about letdowns? At the end of the survey, retired respondents were asked to consider the same list and highlight anything about retirement that did not happen or did not measure up as hoped. (Again, health and money were set aside for this exercise.)
Happily, fully four-in-ten (40%) volunteered that none of the areas listed ended up as letdowns, all
areas had measured up.
Travel topped the list of disappointments, selected by one-in-three (33%) respondents.
Some of the other areas registered as disappointments for fewer retirees:
Participating in leisure activities (15%)
Quality time with family (13%)
Volunteering (11%)
Socializing with friends (11%)

For Immediate Release Canadian Public Opinion Poll
Page 11 of 37
MEDIA CONTACT: Shachi Kurl, Senior Vice President: 604.908.1693 [email protected] @shachikurl
While just more than one-in-ten (13%) volunteered that “quality time with family” is an aspect of retirement that did not measure up, a separate, focused question indicates this is a source of disappointment for a fair number of retirees. More than one-in-four (28%) agreed with the statement: “I am not able to spend as much time with my family as I would like”. What’s not to like? Overall, retired Canadians are enjoying this phase of life – the financial concerns of many notwithstanding. The Angus Reid Institute survey asked retirees to agree or disagree with a number of essential characterizations of “the golden years.” Those not yet retired were asked to contemplate their expectations in these same areas. The comparative results show a lot of cohesion between the two groups, but there are some important and interesting divergences as well. Again, these survey findings show it’s a lot about the leisure factor. The retired Canadians surveyed voiced very high agreement with some leisure-focused statements, and their non-retired counterparts’ expectations on this front are also very positive:
“I enjoy (look forward to) having enough time to do the hobbies I have always wanted to do.” A
large majority of already retired (86%) and not yet retired (87%) indicated agreement with this
statement.
54%
50%
45%43%
39%
25%
14% 13%13%
33%
8%
15%
11% 11%
7%
16%
40%
Quality timewith family
Travel Rest andrelaxation
Participatingin leisureactivities
Socializingwith friends
Volunteering A richspiritual life
Part timepaid work
None ofthese, all
measured up
Choose up to 3 things that make retirement meaningful and vital, and up to 3 that haven't measured up to your expectations
Enriching Hasn't measured up

For Immediate Release Canadian Public Opinion Poll
Page 12 of 37
MEDIA CONTACT: Shachi Kurl, Senior Vice President: 604.908.1693 [email protected] @shachikurl
“I love (look forward to) relaxing and not having to be anywhere.” Both groups were equally
enthusiastic about the concept of not having to be anywhere (84% of retired and 85% of non-
retired agreed).
Full days
A similarly large majority of retired Canadians (84%) disagreed with the sentiment: “I am bored
and have trouble filling my days” while only 16 per cent agreed. Interestingly, nearly twice as
many of the not yet retired (27%) share a concern that they may suffer boredom in retirement.
Most retired Canadians (59%) feel “connected and involved in the community”. The same number
of non-retired (61%) expect to feel this way as well.
There is a significant demand for better volunteer opportunities. One-in-three (35%) of the retired
Canadians surveyed agreed with the sentiment: “I wish I could find a volunteer opportunity that
suits me.” Likewise, among those not yet retired, roughly two-in-three (65%) agreed with a similar
(though not entirely comparable) statement: “I hope I will be able to find a volunteer opportunity
that suits me.”
Many do feel a bit of a void where work was: 39 per cent of retirees agreed “There are times
when I miss going to work.” This is a key area of divergence between the two groups. Fully six-in-
ten (62%) of those not yet retired expect they will miss work at times. (Interestingly, the sentiment
is considerably more widespread outside Quebec – 67% versus 49% within that province.)
As long as you have your health
27%
61%
62%
16%
59%
39%
I am (or will be) bored and have trouble fillingmy days
I feel (or will feel) connected and involved inmy community
There are (or will be) times when I miss goingto work
Do you agree with the following statements about retirement? (Retired vs. Non-retired responses)
Retired Non-retired

For Immediate Release Canadian Public Opinion Poll
Page 13 of 37
MEDIA CONTACT: Shachi Kurl, Senior Vice President: 604.908.1693 [email protected] @shachikurl
Of course, an unpleasant reality about retirement is that ill health can all too easily intrude and interfere mightily – or end altogether – the best laid plans. The survey’s focus was on other, more situational aspects of retirement, but we included one key measure of health status to ensure a fuller picture of the retirement experience (and to facilitate the segmentation analysis described below). Responses clearly highlight that health concerns cast a shadow on many Canadians’ retirement experience. One-in-three (35%) retired Canadians disagreed with the positive sentiment: “Health issues have not held me back from doing what I want to do”. Roughly the same number of still-working Canadians (33%) share this concern that health issues could well hold them back in retirement. PART 4: Segmentation analysis: retirement mindsets In order to fully mine this rich data, Angus Reid Institute researchers conducted a special segmentation (or cluster) analysis. This multivariate analytical technique helps uncover underlying structures and relationships within a given survey data set. Respondents are grouped or “segmented” based on shared attitudinal characteristics. This can powerfully illustrate the different unique “mindsets” surrounding the issue at hand – in this case, retirement.
This segmentation analysis identified four distinct groups of retirees, briefly summarized below:
“Lovin’ It” – As this segment name implies, members of this group – comprising 29 per cent of
the retired population – are happy with this phase of their lives. Very happy indeed. Socio-
demographically, these people are somewhat older (67% are over 65) and tend to have more
formal education and slightly higher incomes. In addition to having no health concerns (not to be
taken for granted at this age level), the “Lovin’ It” group are defined especially by an enviable
absence of financial anxiety. Most (66%) acknowledge that they “have enough money to do
Lovin' It 29%
The Comfortable 24%
The Strugglers 26%
The Unhealthy 21%
Four segments of Canadian retirees

For Immediate Release Canadian Public Opinion Poll
Page 14 of 37
MEDIA CONTACT: Shachi Kurl, Senior Vice President: 604.908.1693 [email protected] @shachikurl
everything they want” and, indeed, most (65%) enjoy a work pension. They are definitely enjoying
retirement, and their overall experience is measuring up as hoped.
“The Comfortable” describes one-in-four (24%) retired Canadians. This groups tilts towards
female representation. The Comfortable share the good health of the “Lovin’ It” group but, alas,
not the carefree attitude regarding finances. The vast majority of this group (87%) are worried
about outliving their money, even though most (56%) describe their financial situation as
“comfortable”. They are much more likely to have experienced disappointments in their
retirement (most notably less travel than hoped). Though not bored and enjoying hobbies and
relaxing, a fair number (36%) of the Comfortable also miss working.
“The Strugglers” describes a third segment representing roughly one-in-four (26%) retirees.
This group is somewhat younger and many (59%) also retired earlier. Health-wise, this is a mixed
bag, roughly evenly split in terms of being held back by health concerns (45% held back, 55%
not). Strugglers are indeed struggling with retirement. They are worried about their financial
security and (in contrast to the Comfortable) they have reason to be: four-in-ten Strugglers (40%)
find it tough to make ends meet and two-thirds (66%) rely on government pension programs. But
they have other problems with retirement on several important fronts. Many report
disappointments, covering things like travel plans, leisure activities and quality time with family. A
large number of Strugglers also admit to being bored in retirement (49%) and struggling with less
meaning in their lives (72%). They are least likely to be interested in volunteering and to feel a
strong community connection, and most (88%) miss working.
“The Unhealthy” describes the remaining one-fifth (21%) of Canadian retirees. The Unhealthy,
as the segment name implies, suffer from ill health – these retirees are being held back from
doing what they want to do by health concerns. Otherwise – though health is obviously an
overarching concern, the Unhealthy are quite content with retirement; they are not bored, are
enjoying the leisure time, and certainly not missing work. This Unhealthy group also does not
have conspicuous money concerns. But they don’t have their health.

For Immediate Release Canadian Public Opinion Poll
Page 15 of 37
MEDIA CONTACT: Shachi Kurl, Senior Vice President: 604.908.1693 [email protected] @shachikurl
The segments, summarized
Lovin’ It Comfortable Struggling Unhealthy
Demographically Older
More education Higher income
More women
More men Slightly younger Lower education
Lower income
More men Slightly younger
Anatomy
Retired as planned Plenty of money
Work pension and investments
A bit better off
Retired earlier Struggling financially Government pension
Downsizing/family support
Retired a bit earlier
Worried about money
Not at all No Yes No
Health Not holding them
back Not holding them
back Split 50/50 health-
wise Health is holding
them back
Regrets None, really Some, especially
travel Lots, of many kinds Some
Attitudinally Happy on all fronts. Enjoying hobbies,
socializing, relaxing
Quite content, but miss work or a better
volunteer gig
Feel lots of discontent.
Bored, lacking meaning
Not getting the most out of family or
community Miss work
Quite content, except held back by health
The Angus Reid Institute (ARI) was founded in October 2014 by pollster and sociologist, Dr. Angus Reid. ARI is a national, not-for-profit, non-partisan public opinion research organization established to advance education by commissioning, conducting and disseminating to the public accessible and impartial statistical data, research and policy analysis on economics, political science, philanthropy, public administration, domestic and international affairs and other socio-economic issues of importance to Canada and its world.

For Immediate Release Canadian Public Opinion Poll
Page 16 of 37
MEDIA CONTACT: Shachi Kurl, Senior Vice President: 604.908.1693 [email protected] @shachikurl
Retiree tables
*Small sample size
Did you control the circumstances around your retirement or did circumstances result in you retiring earlier or later than you may have planned? For example, health or
family issues or being laid off. (Retirees)
(weighted sample sizes) Total (819)
Gender Age
Men (424)
Women (393)
Under 55* (72)
55-64 (253)
65-74 (381)
75+ (114)
I retired earlier due at least partly to circumstances outside
my control 48% 46% 50% 66% 55% 43% 38%
I retired when and as planned 46% 46% 45% 32% 43% 49% 51%
I retired later due at least partly to circumstances outside
my control 6% 8% 5% 2% 3% 8% 10%
*Small sample size
Did you control the circumstances around your retirement or did circumstances result in you retiring earlier or later than you may have planned? For example, health or
family issues or being laid off. (Retirees)
(unweighted bases) Total (818)
Region
BC (117)
AB* (65)
SK/MB (103)
ON (287)
QC (192)
ATL* (54)
I retired earlier due at least partly to
circumstances outside my control
48% 50% 48% 42% 49% 45% 52%
I retired when and as planned
46% 44% 48% 55% 43% 48% 43%
I retired later due at least partly to circumstances
outside my control 6% 5% 5% 4% 7% 7% 6%

For Immediate Release Canadian Public Opinion Poll
Page 17 of 37
MEDIA CONTACT: Shachi Kurl, Senior Vice President: 604.908.1693 [email protected] @shachikurl
Did you control the circumstances around your retirement or did circumstances result in you retiring earlier or later than you may have planned? For example, health or
family issues or being laid off. (Retirees)
(weighted sample sizes) Total (819)
Sector Union Membership
Public sector (313)
Private sector (506)
Yes (297)
Professional association
(94)
No (428)
I retired earlier due at least partly to circumstances outside my control
48% 41% 53% 45% 44% 51%
I retired when and as planned 46% 55% 40% 50% 55% 41%
I retired later due at least partly to circumstances outside my control
6% 4% 8% 5% 1% 8%
At what age did you retire from your primary occupation? (Results by circumstances of retirement)
(weighted sample sizes) Total (819)
I retired earlier (394)
I retired when and as planned
(374)
I retired later* (51)
50 or younger 14% 20% 8% 4%
51-55 22% 24% 23% 4%
56 - 60 28% 29% 29% 17%
61 - 65 25% 23% 27% 23%
66 or older 11% 4% 13% 52%
*Small sample size

For Immediate Release Canadian Public Opinion Poll
Page 18 of 37
MEDIA CONTACT: Shachi Kurl, Senior Vice President: 604.908.1693 [email protected] @shachikurl
*Small sample size
Please indicate whether you agree or disagree with the following statement: I'm worried about my money lasting my lifetime. (Retirees)
(weighted sample sizes) Total (819)
Gender Age
Men (424)
Women (393)
Under 55* (72)
55-64 (253)
65-74 (381)
75+ (114)
Agree strongly 19% 16% 22% 19% 23% 19% 12%
Agree moderately 29% 27% 32% 41% 30% 28% 24%
Disagree moderately 29% 29% 28% 26% 28% 30% 27%
Disagree strongly 23% 27% 18% 15% 19% 23% 37%
*Small sample size
Please indicate whether you agree or disagree with the following statement: I'm worried about my money lasting my lifetime. (Retirees)
(unweighted bases) Total (818)
Region
BC (117)
AB* (65)
SK/MB (103)
ON (287)
QC (192)
ATL* (54)
Agree strongly 19% 21% 17% 18% 19% 17% 26%
Agree moderately 29% 20% 26% 36% 35% 27% 26%
Disagree moderately 29% 32% 35% 25% 22% 34% 33%
Disagree strongly 23% 27% 22% 21% 24% 22% 15%

For Immediate Release Canadian Public Opinion Poll
Page 19 of 37
MEDIA CONTACT: Shachi Kurl, Senior Vice President: 604.908.1693 [email protected] @shachikurl
Please indicate whether you agree or disagree with the following statement: I'm worried about my money lasting my lifetime. (Retirees)
(weighted sample size) Total (819)
Sector Union Membership
Public sector (313)
Private sector (506)
Yes (297)
Professional association
(94)
No (428)
Agree strongly 19% 14% 22% 18% 13% 21%
Agree moderately 29% 26% 31% 31% 26% 29%
Disagree moderately 29% 32% 27% 30% 28% 28%
Disagree strongly 23% 28% 20% 21% 33% 22%
*Small sample size
Which of the following categories best describes your situation? (Retirees)
(unweighted bases) Total (818)
Region
BC (117)
AB* (65)
SK/MB (103)
ON (287)
QC (192)
ATL* (54)
I have enough money to do everything I want
38% 42% 49% 41% 39% 32% 26%
I live comfortably but don't have money for
extras 44% 40% 35% 44% 44% 47% 52%
Making ends meet is a struggle
18% 18% 15% 15% 17% 21% 22%

For Immediate Release Canadian Public Opinion Poll
Page 20 of 37
MEDIA CONTACT: Shachi Kurl, Senior Vice President: 604.908.1693 [email protected] @shachikurl
Which of the following categories best describes your situation? (Retirees)
(weighted sample sizes) Total (819)
Gender Age
Men (424)
Women (393)
Under 55* (72)
55-64 (253)
65-74 (381)
75+ (114)
I have enough money to do everything I want
38% 37% 38% 25% 35% 37% 51%
I live comfortably but don't have money for extras
44% 47% 41% 40% 45% 46% 39%
Making ends meet is a struggle
18% 16% 21% 34% 20% 17% 10%
*Small sample size
Which of the following categories best describes your situation? (Retirees)
(weighted sample size) Total (819)
Sector Union Membership
Public sector (313)
Private sector (506)
Yes (297)
Professional association
(94)
No (428)
I have enough money to do everything I want
38% 44% 34% 33% 49% 38%
I live comfortably but don't have money for extras
44% 44% 44% 51% 42% 40%
Making ends meet is a struggle 18% 12% 22% 16% 10% 22%
Which of the following categories best describes your situation? (Results by circumstances of retirement)
(weighted sample size) Total (819)
I retired earlier (394)
I retired when and as planned
(374)
I retired later* (51)
I have enough money to do everything I want
38% 27% 49% 37%
I live comfortably but don't have money for extras
44% 46% 43% 40%
Making ends meet is a struggle 18% 27% 8% 23%
*Small sample size

For Immediate Release Canadian Public Opinion Poll
Page 21 of 37
MEDIA CONTACT: Shachi Kurl, Senior Vice President: 604.908.1693 [email protected] @shachikurl
*Small sample size
What are your main sources of retirement income? (choose up to three) (Retirees)
(unweighted bases) Total (818)
Region
BC (117)
AB* (65)
SK/MB (103)
ON (287)
QC (192)
ATL* (54)
Government pension (Old Age pension)
57% 64% 43% 55% 58% 57% 56%
Work pension 53% 51% 54% 54% 55% 48% 54%
Your retirement savings (RRSPs, etc)
30% 27% 28% 38% 29% 36% 17%
Investments 13% 15% 23% 14% 15% 7% 4%
Downsizing/selling assets
6% 9% 2% 5% 5% 6% 9%
Inheritance 3% 3% 2% 2% 2% 4% 7%
Support from children/family
1% 0% 2% 0% 1% 1% 2%
Other, specify 7% 9% 6% 2% 7% 6% 11%

For Immediate Release Canadian Public Opinion Poll
Page 22 of 37
MEDIA CONTACT: Shachi Kurl, Senior Vice President: 604.908.1693 [email protected] @shachikurl
What are your main sources of retirement income? (choose up to three) (Retirees)
(weighted sample sizes) Total (819)
Gender Age
Men (424)
Women (393)
Under 55* (72)
55-64 (253)
65-74 (381)
75+ (114)
Government pension (Old Age pension)
57% 58% 55% 27% 33% 74% 72%
Work pension 53% 57% 48% 31% 58% 54% 52%
Your retirement savings (RRSPs, etc)
30% 30% 30% 27% 31% 29% 36%
Investments 13% 13% 13% 21% 15% 8% 18%
Downsizing/selling assets 6% 4% 7% 8% 7% 5% 5%
Inheritance 3% 2% 4% 12% 4% 1% 1%
Support from children/family 1% 0% 2% 0% 2% 0% 2%
Other, specify 7% 6% 8% 23% 8% 5% 1%
*Small sample size
What are your main sources of retirement income? (choose up to three) (Retirees)
(weighted sample size) Total (819)
Sector Union Membership
Public sector (313)
Private sector (506)
Yes (297)
Professional association
(94)
No (428)
Government pension (Old Age pension)
57% 57% 57% 59% 41% 59%
Work pension 53% 75% 39% 70% 66% 37%
Your retirement savings (RRSPs, etc)
30% 22% 35% 20% 33% 36%
Investments 13% 9% 15% 8% 18% 15%
Downsizing/selling assets 6% 5% 6% 5% 2% 7%
Inheritance 3% 1% 4% 1% 3% 4%
Support from children/family 1% 1% 1% 0% 1% 1%
Other, specify 7% 2% 10% 5% 3% 9%

For Immediate Release Canadian Public Opinion Poll
Page 23 of 37
MEDIA CONTACT: Shachi Kurl, Senior Vice President: 604.908.1693 [email protected] @shachikurl
*Small sample size
EXCLUDING good health and enough money to do the things you would like, please pick up to three things that are making retirement meaningful and vital. (Retirees)
(weighted sample size) Total (819)
Gender Age
Men (424)
Women (393)
Under 55* (72)
55-64 (253)
65-74 (381)
75+ (114)
Quality time with family 54% 52% 57% 60% 52% 55% 53%
Travel 50% 50% 49% 41% 54% 49% 47%
Rest and relaxation 45% 48% 43% 55% 47% 44% 41%
Participating in leisure activities
43% 43% 43% 49% 50% 38% 40%
Socializing with friends 39% 34% 43% 28% 36% 40% 46%
Volunteering 25% 24% 27% 15% 21% 29% 30%
A rich spiritual life 14% 12% 16% 12% 10% 15% 21%
Part time paid work 13% 16% 11% 9% 14% 15% 8%
*Small sample size
EXCLUDING good health and enough money to do the things you would like, please pick up to three things that are making retirement meaningful and vital. (Retirees)
(unweighted bases) Total (818)
Region
BC (117)
AB* (65)
SK/MB (103)
ON (287)
QC (192)
ATL* (54)
Quality time with family 54% 50% 60% 50% 56% 54% 50%
Travel 50% 51% 51% 54% 51% 46% 46%
Rest and relaxation 45% 42% 35% 46% 48% 42% 61%
Participating in leisure activities
43% 50% 46% 46% 43% 39% 43%
Socializing with friends 39% 35% 40% 35% 36% 46% 37%
Volunteering 25% 30% 25% 24% 24% 26% 24%
A rich spiritual life 14% 16% 12% 17% 16% 8% 20%
Part time paid work 13% 11% 15% 9% 13% 17% 7%
For Immediate Release Canadian Public Opinion Poll
Page 24 of 37
MEDIA CONTACT: Shachi Kurl, Senior Vice President: 604.908.1693 [email protected] @shachikurl
*Small sample size
Is there anything about retirement that did not happen or that did not measure up as you had hoped? (Retirees)
(unweighted bases) Total (818)
Region
BC (117)
AB* (65)
SK/MB (103)
ON (287)
QC (192)
ATL* (54)
A rich spiritual life 7% 6% 3% 1% 8% 6% 13%
Quality time with family 13% 14% 8% 13% 10% 16% 22%
Volunteering 11% 13% 12% 9% 10% 10% 11%
Travel 33% 34% 18% 32% 29% 43% 39%
Socializing with friends 11% 13% 9% 11% 11% 10% 15%
Participating in leisure activities
15% 17% 17% 14% 15% 19% 4%
Rest and relaxation 8% 7% 5% 7% 8% 9% 9%
Part time paid work 16% 15% 14% 12% 16% 19% 20%
None of these, all measured up
40% 44% 51% 41% 43% 30% 33%

For Immediate Release Canadian Public Opinion Poll
Page 25 of 37
MEDIA CONTACT: Shachi Kurl, Senior Vice President: 604.908.1693 [email protected] @shachikurl
Is there anything about retirement that did not happen or that did not measure up as you had hoped? (Retirees)
(weighted sample sizes) Total (819)
Gender Age
Men (424)
Women (393)
Under 55* (72)
55-64 (253)
65-74 (381)
75+ (114)
A rich spiritual life 7% 8% 5% 9% 5% 7% 10%
Quality time with family 13% 14% 13% 17% 15% 10% 16%
Volunteering 11% 10% 11% 11% 9% 11% 12%
Travel 33% 34% 32% 25% 38% 33% 28%
Socializing with friends 11% 12% 10% 11% 12% 12% 8%
Participating in leisure activities
15% 17% 14% 14% 15% 16% 15%
Rest and relaxation 8% 10% 6% 10% 5% 10% 6%
Part time paid work 16% 19% 14% 10% 16% 18% 15%
None of these, all measured up
40% 37% 43% 41% 38% 38% 49%
*Small sample size

For Immediate Release Canadian Public Opinion Poll
Page 26 of 37
MEDIA CONTACT: Shachi Kurl, Senior Vice President: 604.908.1693 [email protected] @shachikurl
*Small sample size
[Summary of Agree] Please indicate whether you agree or disagree with each of the following statements (Retirees):
(unweighted bases) Total (818)
Region
BC (117)
AB* (65)
SK/MB (103)
ON (287)
QC (192)
ATL* (54)
I enjoy having enough time to do the hobbies I have
always wanted to do 86% 85% 86% 85% 87% 85% 87%
Health issues have not held me back from doing what I
want to do 65% 69% 65% 66% 64% 66% 61%
I feel connected and involved in my community
59% 70% 62% 64% 61% 48% 54%
There are times when I miss going to work
39% 38% 40% 44% 39% 33% 50%
I feel like my life does not have as much meaning now
that I'm retired 24% 27% 18% 22% 25% 22% 24%
I wish I could find a volunteer opportunity that
suits me 35% 32% 15% 32% 36% 41% 46%
I am bored and have trouble filling my days
16% 16% 14% 12% 15% 18% 17%
I love relaxing and not having to be anywhere
84% 90% 89% 83% 83% 80% 87%
I'm worried about my money lasting my lifetime
48% 40% 43% 54% 54% 43% 52%
I am not able to spend as much time with my family as I
would like 28% 32% 22% 37% 26% 25% 33%

For Immediate Release Canadian Public Opinion Poll
Page 27 of 37
MEDIA CONTACT: Shachi Kurl, Senior Vice President: 604.908.1693 [email protected] @shachikurl
[Summary of Agree] Please indicate whether you agree or disagree with each of the following statements (Retirees):
(weighted sample sizes) Total (819)
Gender Age
Men (424)
Women (393)
Under 55* (72)
55-64 (253)
65-74 (381)
75+ (114)
I enjoy having enough time to do the hobbies I have always wanted to
do 86% 85% 88% 81% 88% 86% 85%
Health issues have not held me back from doing what I want to do
65% 63% 68% 55% 63% 67% 72%
I feel connected and involved in my community
59% 58% 60% 61% 53% 61% 61%
There are times when I miss going to work
39% 40% 37% 53% 40% 34% 41%
I feel like my life does not have as much meaning now that I'm retired
24% 24% 24% 28% 24% 21% 28%
zI wish I could find a volunteer opportunity that suits me
35% 37% 34% 36% 35% 37% 30%
I am bored and have trouble filling my days
16% 19% 12% 25% 18% 13% 12%
I love relaxing and not having to be anywhere
84% 83% 85% 89% 90% 80% 81%
I'm worried about my money lasting my lifetime
48% 43% 54% 59% 53% 47% 36%
I am not able to spend as much time with my family as I would like
28% 25% 31% 26% 27% 29% 28%
*Small sample size
For Immediate Release Canadian Public Opinion Poll
Page 28 of 37
MEDIA CONTACT: Shachi Kurl, Senior Vice President: 604.908.1693 [email protected] @shachikurl
Not-yet-retired tables
*Small sample size
At what age do you expect to retire? (non-retired)
(weighted sample sizes) Total (1126)
Gender Age
Men (532)
Women (594)
18 – 34 (430)
35 – 54 (529)
55+ (166)
50 or younger 4% 5% 3% 7% 3% 0%
51-55 6% 8% 5% 11% 4% 1%
56 - 60 18% 15% 21% 19% 20% 11%
61 - 65 33% 30% 35% 31% 35% 30%
66 or older 30% 31% 28% 26% 28% 44%
Never 9% 11% 8% 7% 10% 14%
At what age do you expect to retire? (non-retired)
(unweighted bases) Total (1109)
Region
BC (144)
AB (116)
SK* (68)
MB* (79)
ON (361)
QC (270)
ATL* (71)
50 or younger 4% 2% 6% 0% 0% 3% 5% 10%
51-55 6% 6% 8% 2% 7% 6% 6% 10%
56 - 60 18% 15% 21% 22% 25% 16% 22% 14%
61 - 65 33% 30% 29% 33% 29% 33% 34% 39%
66 or older 30% 35% 27% 34% 32% 31% 27% 22%
Never 9% 11% 9% 9% 8% 12% 6% 5%

For Immediate Release Canadian Public Opinion Poll
Page 29 of 37
MEDIA CONTACT: Shachi Kurl, Senior Vice President: 604.908.1693 [email protected] @shachikurl
At what age do you expect to retire? (Non-retired)
(weighted sample sizes) Total (1126)
Sector Union Membership
Public sector (274)
Private sector (620)
Yes (253)
Professional association*
(47)
No (593)
50 or younger 4% 5% 4% 3% 13% 4%
51-55 6% 8% 6% 7% 15% 6%
56 - 60 18% 28% 15% 27% 15% 16%
61 - 65 33% 38% 31% 42% 29% 30%
66 or older 30% 17% 35% 17% 18% 36%
Never 9% 4% 9% 4% 11% 9%
*Small sample size
*Small sample size
And if it was entirely in your hands at what age would you prefer to retire? (non-retired)
(unweighted bases) Total (1109)
Region
BC (144)
AB (116)
SK* (68)
MB* (79)
ON (361)
QC (270)
ATL* (71)
50 or younger 25% 26% 33% 32% 15% 23% 24% 21%
51-55 20% 16% 18% 13% 21% 21% 22% 25%
56 - 60 23% 16% 18% 28% 25% 22% 29% 30%
61 - 65 17% 22% 16% 17% 24% 17% 16% 14%
66 or older 10% 14% 12% 7% 12% 12% 7% 6%
Never 4% 6% 4% 3% 3% 5% 2% 4%

For Immediate Release Canadian Public Opinion Poll
Page 30 of 37
MEDIA CONTACT: Shachi Kurl, Senior Vice President: 604.908.1693 [email protected] @shachikurl
And if it was entirely in your hands at what age would you prefer to retire? (non-retired)
(weighted sample sizes) Total (1126)
Gender Age
Men (532)
Women (594)
18 – 34 (430)
35 – 54 (529)
55+ (166)
50 or younger 25% 30% 20% 38% 19% 6%
51-55 20% 20% 21% 20% 26% 4%
56 - 60 23% 19% 27% 14% 28% 30%
61 - 65 17% 15% 19% 16% 15% 29%
66 or older 10% 12% 9% 8% 10% 19%
Never 4% 5% 4% 3% 3% 12%
And if it was entirely in your hands at what age would you prefer to retire? (non-retired)
(weighted sample sizes) Total (1126)
Sector Union Membership
Public sector (274)
Private sector (620)
Yes (253)
Professional association*
(47)
No (593)
50 or younger 25% 23% 27% 22% 43% 26%
51-55 20% 28% 16% 25% 15% 18%
56 - 60 23% 31% 22% 33% 13% 22%
61 - 65 17% 12% 19% 14% 11% 18%
66 or older 10% 6% 12% 4% 14% 12%
Never 4% 0% 5% 1% 4% 4%
*Small sample size

For Immediate Release Canadian Public Opinion Poll
Page 31 of 37
MEDIA CONTACT: Shachi Kurl, Senior Vice President: 604.908.1693 [email protected] @shachikurl
*Small sample size
Which of the following broad categories best describes your expectations for your personal finances in retirement? (non-retired)
(weighted sample sizes) Total (1126)
Gender Age
Men (532)
Women (594)
18 – 34 (430)
35 – 54 (529)
55+ (166)
I expect to have enough money to do everything I want
24% 25% 23% 33% 18% 21%
I expect to live comfortably but not have money for extras
48% 46% 49% 49% 47% 46%
I expect that making ends meet will be a struggle
28% 29% 27% 18% 35% 33%
Which of the following broad categories best describes your expectations for your personal finances in retirement? (non-retired)
(weighted sample sizes) Total (1126)
Sector Union Membership
Public sector (274)
Private sector (620)
Yes (253)
Professional association*
(47)
No (593)
I expect to have enough money to do everything I want
24% 24% 23% 25% 41% 21%
I expect to live comfortably but not have money for extras
48% 60% 46% 59% 39% 48%
I expect that making ends meet will be a struggle
28% 15% 31% 16% 20% 32%
*Small sample size
Which of the following broad categories best describes your expectations for your personal finances in retirement? (non-retired)
(unweighted bases) Total (1109)
Region
BC (144)
AB (116)
SK* (68)
MB* (79)
ON (361)
QC (270)
ATL* (71)
I expect to have enough money to do everything I
want 24% 29% 33% 22% 25% 21% 21% 24%
I expect to live comfortably but not have
money for extras 48% 39% 43% 43% 48% 50% 54% 44%
I expect that making ends meet will be a
struggle 28% 32% 23% 34% 27% 29% 25% 32%

For Immediate Release Canadian Public Opinion Poll
Page 32 of 37
MEDIA CONTACT: Shachi Kurl, Senior Vice President: 604.908.1693 [email protected] @shachikurl
*Small sample size
How will your retirement primarily be financed? (choose up to three) (non-retired)
(weighted sample size) Total (1126)
Gender Age
Men (532)
Women (594)
18 – 34 (430)
35 – 54 (529)
55+ (166)
Your retirement savings (RRSPs, etc)
50% 49% 51% 61% 43% 44%
Government pension (Old Age pension)
45% 42% 47% 36% 49% 56%
Work pension 34% 34% 33% 32% 36% 31%
Investments 14% 17% 12% 16% 12% 15%
Downsizing/selling assets 11% 12% 11% 7% 14% 15%
Inheritance 5% 5% 6% 5% 6% 3%
Support from children/family 3% 3% 4% 3% 3% 3%
Other, specify 3% 3% 2% 4% 2% 2%
How will your retirement primarily be financed? (choose up to three) (non-retired)
(unweighted bases) Total (1109)
Region
BC (144)
AB (116)
SK* (68)
MB* (79)
ON (361)
QC (270)
ATL* (71)
Your retirement savings (RRSPs, etc)
50% 55% 59% 39% 45% 47% 52% 42%
Government pension (Old Age pension)
45% 36% 40% 49% 37% 43% 52% 57%
Work pension 34% 34% 32% 51% 38% 33% 32% 38%
Investments 14% 19% 19% 9% 24% 17% 7% 10%
Downsizing/selling assets
11% 12% 9% 21% 9% 13% 10% 4%
Inheritance 5% 7% 3% 7% 4% 6% 3% 11%
Support from children/family
3% 1% 2% 0% 3% 5% 3% 0%
Other, specify 3% 4% 1% 0% 6% 2% 4% 3%

For Immediate Release Canadian Public Opinion Poll
Page 33 of 37
MEDIA CONTACT: Shachi Kurl, Senior Vice President: 604.908.1693 [email protected] @shachikurl
How will your retirement primarily be financed? (choose up to three) (non-retired)
(weighted sample sizes) Total (1126)
Sector Union Membership
Public sector (274)
Private sector (620)
Yes (253)
Professional association*
(47)
No (593)
Your retirement savings (RRSPs, etc)
50% 42% 54% 48% 47% 52%
Government pension (Old Age pension)
45% 34% 46% 36% 17% 47%
Work pension 34% 70% 23% 66% 40% 25%
Investments 14% 10% 18% 10% 28% 17%
Downsizing/selling assets 11% 7% 14% 7% 7% 14%
Inheritance 5% 4% 5% 3% 8% 5%
Support from children/family 3% 1% 2% 0% 4% 3%
Other, specify 3% 1% 3% 1% 4% 3%
*Small sample size
*Small sample size
Thinking ahead to your retirement, please indicate whether you agree or disagree with the following statement:
I am worried about my money lasting my lifetime. (non-retired)
(unweighted bases) Total (1109)
Region
BC (144)
AB (116)
SK* (68)
MB* (79)
ON (361)
QC (270)
ATL* (71)
Agree strongly 36% 31% 40% 38% 38% 41% 28% 32%
Agree moderately 38% 47% 37% 42% 27% 34% 42% 35%
Disagree moderately 18% 10% 16% 18% 29% 17% 21% 26%
Disagree strongly 8% 12% 7% 3% 5% 8% 9% 7%

For Immediate Release Canadian Public Opinion Poll
Page 34 of 37
MEDIA CONTACT: Shachi Kurl, Senior Vice President: 604.908.1693 [email protected] @shachikurl
Thinking ahead to your retirement, please indicate whether you agree or disagree with the following statement:
I am worried about my money lasting my lifetime. (non-retired)
(weighted sample sizes) Total (1126)
Gender Age
Men (532)
Women (594)
18 – 34 (430)
35 – 54 (529)
55+ (166)
Agree strongly 36% 32% 39% 33% 37% 36%
Agree moderately 38% 40% 36% 41% 37% 32%
Disagree moderately 18% 19% 18% 18% 17% 21%
Disagree strongly 8% 9% 7% 8% 8% 11%
Thinking ahead to your retirement, please indicate whether you agree or disagree with the following statement:
I am worried about my money lasting my lifetime. (non-retired)
(weighted sample sizes) Total (1126)
Sector Union Membership
Public sector (274)
Private sector (620)
Yes (253)
Professional association*
(47)
No (593)
Agree strongly 36% 32% 35% 30% 34% 36%
Agree moderately 38% 33% 41% 37% 32% 40%
Disagree moderately 18% 23% 17% 24% 12% 17%
Disagree strongly 8% 12% 7% 10% 22% 7%
*Small sample size

For Immediate Release Canadian Public Opinion Poll
Page 35 of 37
MEDIA CONTACT: Shachi Kurl, Senior Vice President: 604.908.1693 [email protected] @shachikurl
*Small sample size
EXCLUDING good health and enough money to do the things you would like, please pick up to three things that you think will make retirement meaningful and vital?
(non-retired)
(weighted sample sizes) Total (1126)
Gender Age
Men (532)
Women (594)
18 – 34 (430)
35 – 54 (529)
55+ (166)
Quality time with family 62% 59% 66% 64% 63% 55%
Travel 61% 57% 64% 62% 61% 56%
Rest and relaxation 45% 47% 43% 45% 46% 39%
Participating in leisure activities 41% 41% 41% 34% 46% 39%
Socializing with friends 26% 28% 24% 27% 26% 24%
A rich spiritual life 19% 17% 20% 20% 17% 22%
Part time paid work 15% 17% 13% 12% 12% 32%
Volunteering 14% 11% 17% 13% 13% 21%
EXCLUDING good health and enough money to do the things you would like, please pick up to three things that you think will make retirement meaningful and vital?
(non-retired)
(unweighted bases) Total (1109)
Region
BC (144)
AB (116)
SK* (68)
MB* (79)
ON (361)
QC (270)
ATL* (71)
Quality time with family 62% 59% 66% 67% 66% 60% 64% 67%
Travel 61% 67% 64% 66% 59% 61% 61% 45%
Rest and relaxation 45% 37% 46% 45% 35% 49% 40% 60%
Participating in leisure activities
41% 41% 33% 35% 41% 42% 47% 28%
Socializing with friends 26% 23% 24% 26% 34% 23% 33% 26%
A rich spiritual life 19% 21% 22% 27% 26% 19% 11% 30%
Part time paid work 15% 19% 14% 10% 16% 16% 13% 14%
Volunteering 14% 17% 13% 17% 11% 16% 11% 12%

For Immediate Release Canadian Public Opinion Poll
Page 36 of 37
MEDIA CONTACT: Shachi Kurl, Senior Vice President: 604.908.1693 [email protected] @shachikurl
*Small sample size
[Summary of Agree] Thinking ahead to your retirement, please indicate whether you agree or disagree with each of the following statements (non-retired)
(unweighted bases) Total (1109)
Region
BC (144)
AB (116)
SK* (68)
MB* (79)
ON (361)
QC (270)
ATL* (71)
I look forward to having enough time to do the hobbies I have always
wanted to do
87% 88% 92% 90% 87% 87% 84% 83%
I don't think health issues will hold me back from doing what I want to
do
67% 66% 68% 68% 71% 66% 67% 70%
I will feel connected and involved in my community
61% 68% 73% 64% 65% 59% 51% 67%
There will be times when I miss going to work
62% 73% 77% 54% 62% 63% 49% 68%
I won't feel like my life has as much meaning
when I'm retired 27% 25% 28% 27% 20% 29% 26% 29%
I hope I will be able to find a volunteer
opportunity that suits me 65% 68% 75% 70% 67% 62% 61% 75%
I will be bored and have trouble filling my days
27% 23% 34% 25% 34% 31% 21% 24%
I look forward to relaxing and not having to be
anywhere 85% 83% 91% 93% 87% 85% 79% 94%
I'm worried about my money lasting my lifetime
74% 78% 77% 80% 66% 75% 70% 67%
I am worried I won't be able to spend as much time with my family as I
would like
28% 30% 25% 41% 23% 30% 24% 34%

For Immediate Release Canadian Public Opinion Poll
Page 37 of 37
MEDIA CONTACT: Shachi Kurl, Senior Vice President: 604.908.1693 [email protected] @shachikurl
[Summary of Agree] Thinking ahead to your retirement, please indicate whether you agree or disagree with each of the following statements (non-retired)
(weighted sample sizes) Total (1126)
Gender Age
Men (532)
Women (594)
18 – 34 (430)
35 – 54 (529)
55+ (166)
I look forward to having enough time to do the hobbies I have always
wanted to do 87% 87% 87% 88% 88% 78%
I don't think health issues will hold me back from doing what I want to
do 67% 65% 69% 68% 65% 73%
I will feel connected and involved in my community
61% 59% 63% 63% 60% 58%
There will be times when I miss going to work
62% 61% 64% 68% 59% 58%
I won't feel like my life has as much meaning when I'm retired
27% 31% 24% 32% 25% 22%
I hope I will be able to find a volunteer opportunity that suits me
65% 60% 70% 69% 64% 61%
I will be bored and have trouble filling my days
27% 29% 26% 35% 21% 27%
I look forward to relaxing and not having to be anywhere
85% 84% 86% 86% 87% 77%
I'm worried about my money lasting my lifetime
74% 72% 75% 74% 75% 68%
I am worried I won't be able to spend as much time with my family
as I would like 28% 31% 26% 35% 26% 21%