Rethinking Teacher Compensation to Drive Student · PDF file · 2018-01-11Lay out...
77
© Education Resource Strategies, Inc., 2013 © Education Resource Strategies, Inc., 2013 Rethinking Teacher Compensation to Drive Student Performance Session 1: September 2013
Transcript of Rethinking Teacher Compensation to Drive Student · PDF file · 2018-01-11Lay out...

© Education Resource Strategies, Inc., 2013 © Education Resource Strategies, Inc., 2013
Rethinking Teacher Compensation to
Drive Student Performance
Session 1: September 2013

Agenda
1
Time Topic
9:00 am Introduction by TNDOE & Warren Co. Superintendent Bobby Cox
9:15 am Project Overview
9:30 am Compensation Reform as Part of an Overarching Human Capital Strategy
10:00 am First Step – Rethinking the Value Proposition for Teachers
10:30 am Group Value Proposition Exercise Parts 1 & 2
12:00 pm Working Lunch: Reflecting on the Morning Session
1:00 pm The Case For Change – Why Redesign Compensation?
1:15 pm Thinking Through the Elements of Compensation Redesign - Investments
2:00 pm Resource Opportunities
3:00 pm Four Ideas for a Reformed Compensation System in TN
3:45 pm Next Steps (15 min)

Project Overview

We will support compensation redesign by…
Holding 4 monthly workshops with district leaders and support groups
Providing advisory services to fiscal consultants on compensation redesign data analytics so that consultants can support the districts in developing fiscally sustainable and comprehensive redesign plans
Offering interactive tools that can be used for conceptual and contextual learning, both during and in between workshops
Informing the state on strategies to maximize success in district compensation redesign and implementation
3

We will hold 4 group sessions throughout this
engagement
4
Session Type Discussion Topics Timing
Compensation as a
Part of Human Capital
Strategy
Whole
Group
Introduce compensation reform as part of the overarching human
capital strategy
Identify and prioritize the value proposition to teachers
Make the case for compensation redesign and define compensation
reform design elements
TODAY
Human Capital
System Choices and
Impacts
Regional
Sessions
Review compensation elements and career path structures
Weigh the potential cost vs. student performance impact of various
design choices through What Price is Right?
Oct 16 - 18
Districts engage with their stakeholders
Fiscal Considerations
and Trade-offs
Regional
Sessions
Lay out the trade-offs and other fiscal considerations while
assembling design choices into a final and comprehensive set of
priorities and rationale
Demonstrate trade-offs via Budget Hold ‘em
Nov 20 – 22
Districts engage with their stakeholders
Building Support and
Communication
Whole
Group
Identify and prioritize implementation, communication, and other
non-fiscal barriers on the road ahead Dec 11
Discussion: What might success look like for
this engagement?
Each participating TN district will…
Understand its value proposition relative to neighboring markets
and adopt processes to continuously revaluate its value
proposition to meet its achievement goals.
Adopt by FY15 a new compensation system that includes specific
actions to make the teaching profession more attractive to highly
effective teachers and to improve student learning.
Increase retention of its most effective teachers and increase
attrition of its least effective teachers.
Meet its student achievement growth targets.
5

Compensation Redesign
as a Part of the Overarching
Human Capital Strategy
Introduction:
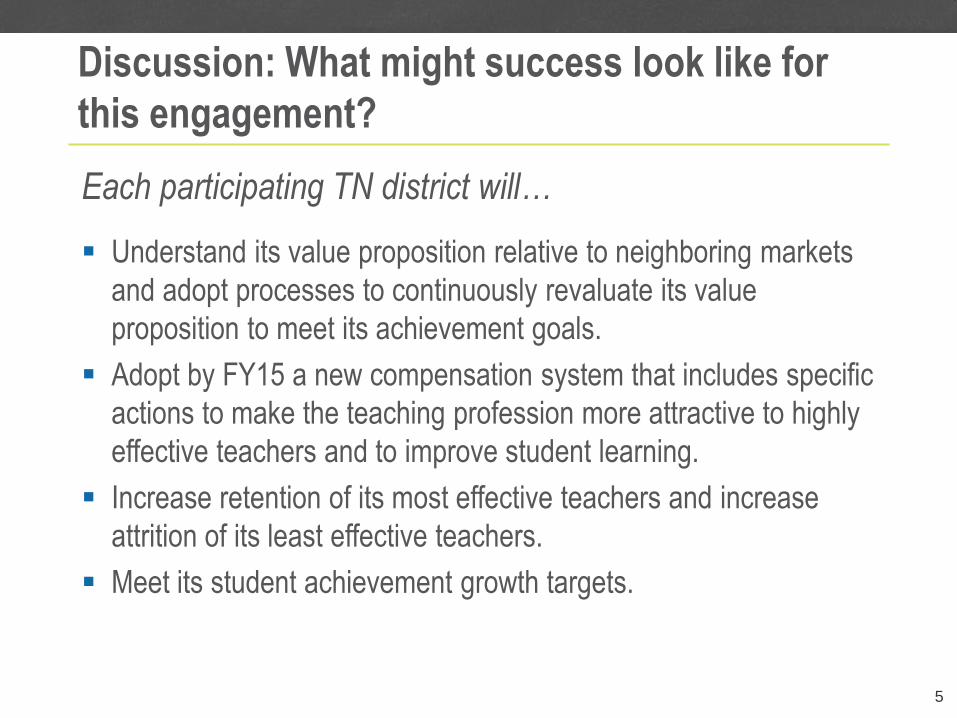
A comprehensive human capital strategy consists of…
7
Attract & Retain Top Talent
Hiring & Selective Retention
Improve the Existing Talent
Professional Growth
Make the Most of Talent
Strategic Assignments to Schools/Teams
and Roles
Ultimate goal
HC Levers to Achieve that Goal
HC Systems &
Structures that support all
HC Levers
HC Systems and Structures that
Support each Lever
Increase Student Achievement
Value Proposition, Compensation, Career Path/Differentiated Roles, Exiting Low-Performers
Data-Informed HC Decision-Making
Measurement and Evaluation (Pre-condition)

TEACHER EFFECTIVENESS IN IMPROVING STUDENT OUTCOMES
Hiring: Optimize new teacher supply by hiring from preparation programs whose teachers consistently achieve better student outcomes.
5
Instructional Support & Professional Development: Boost effectiveness of all teachers through targeted professional development.
3
Job & Team Assignment: Prioritize effective teachers for high-need students, and strategically assign teachers to jobs & teams.
2
Retain and leverage the most effective teachers.
4b
1 Measuring Teacher Effectiveness: Evaluate teachers based on a clear & rigorous combination of multiple measures.
Improve or exit persistently less effective teachers and replace with more effective teachers.
4c
Current Teacher
Performance
Potential Teacher
Performance
Career Path, Recognition, & Retention: Develop career trajectories that acknowledge different teacher needs and expertise.
4a
So what makes an effective human capital system?
Source: Slide adapted from The New Teacher Project’s “School Leader’s Toolbox,” http://schoolleaderstoolbox.org 8
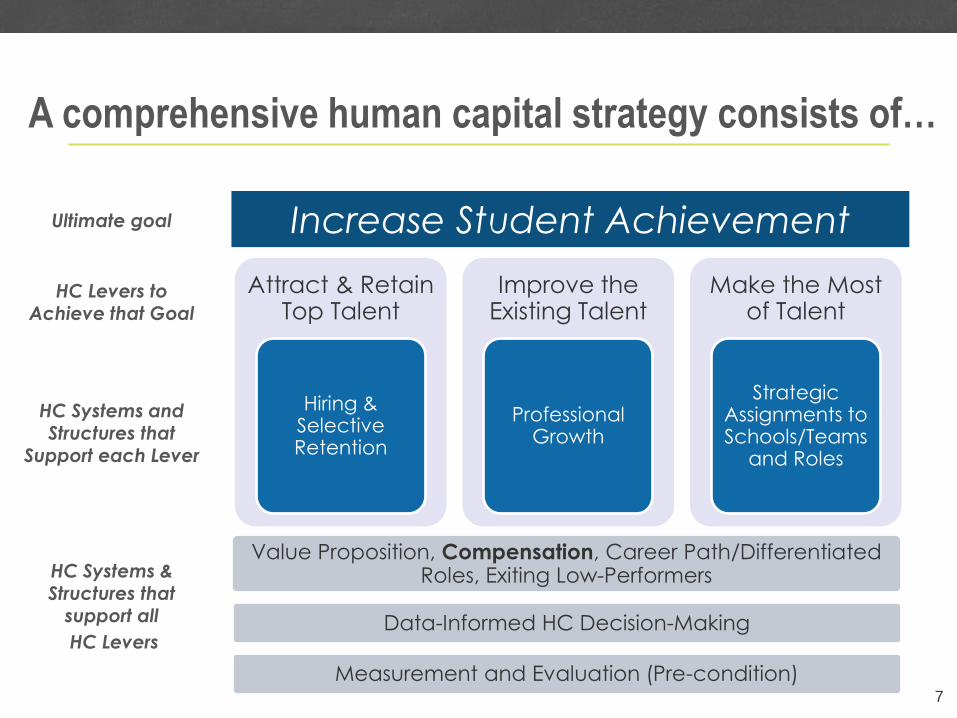
The district has an effective program to recruit and hire
high-quality teachers, especially in high-need areas:
9
0% 0%0%
A.
B.
C.
A. The district does not assess
teacher hiring needs in a
timely manner and does not
have a proactive recruitment
program to fill those needs.
B. The district is usually able to
fill all open positions by the
beginning of the school year,
but not all new hires are at
the desired level of quality.
C. The district is always able to
fill all open positions with
high-quality teachers.
A.
Needs
Improvement
C.
On the
Right
Track
B.
Some
Room
For
Improvement
A.
B.
C.
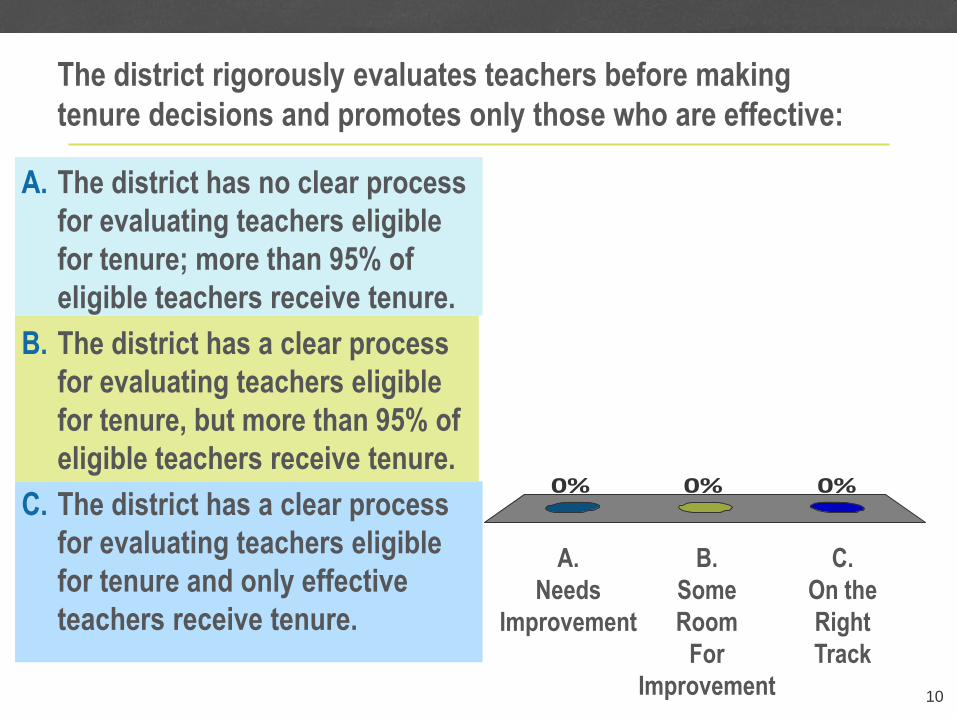
A. The district has no clear process
for evaluating teachers eligible
for tenure; more than 95% of
eligible teachers receive tenure.
B. The district has a clear process
for evaluating teachers eligible
for tenure, but more than 95% of
eligible teachers receive tenure.
C. The district has a clear process
for evaluating teachers eligible
for tenure and only effective
teachers receive tenure.
The district rigorously evaluates teachers before making
tenure decisions and promotes only those who are effective:
10
0% 0%0%
A.
Needs
Improvement
C.
On the
Right
Track
B.
Some
Room
For
Improvement

A.
B.
C.
A. Opportunities for advancement are
limited to full-time administrative
positions such as principal or
assistant principal.
B. Limited opportunities exist for
leadership positions that include both
teaching and other responsibilities
(e.g., teacher leader, department
head).
C. The district offers a robust “career
lattice” that includes a variety of
opportunities for teachers to combine
leadership roles with teaching and to
take on increased responsibilities
throughout their careers.
The district provides opportunities for strong teachers
to pursue multiple leadership paths:
11
A.
Needs
Improvement
C.
On the
Right
Track
B.
Some
Room
For
Improvement

Rethinking the
Value Proposition
for Teachers
First Step:

Think of teaching as a value proposition
13
We want to attract and keep great
employees
Why do people start teaching and keep teaching?
They are attracted by the…
Intrinsic value
Value Proposition
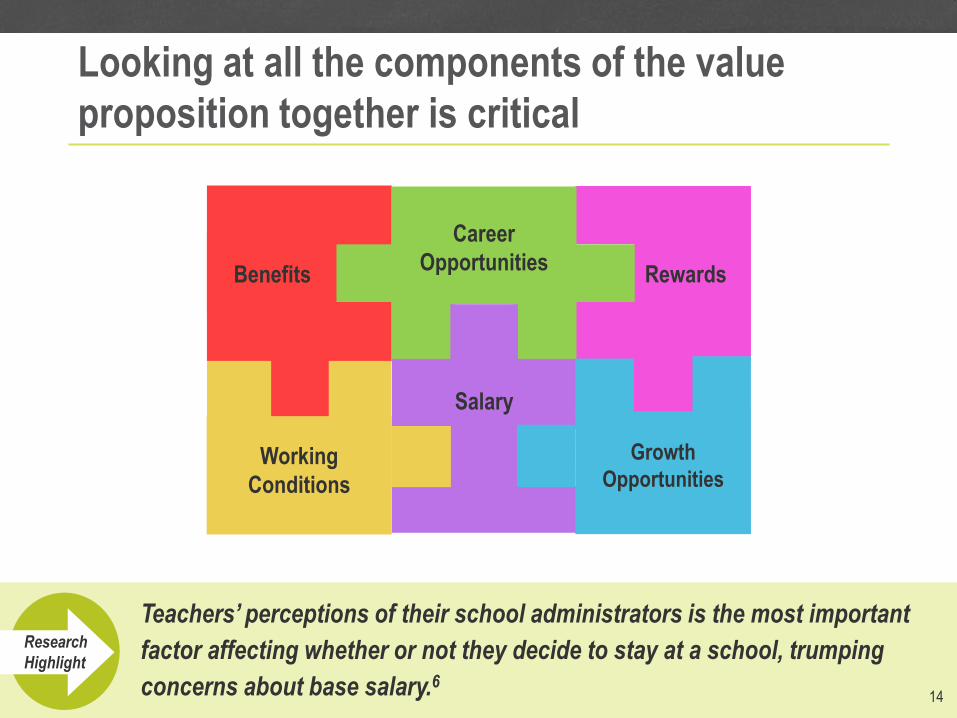
Looking at all the components of the value
proposition together is critical
14
Benefits
Career
Opportunities
Salary
Growth
Opportunities Working
Conditions
Rewards
Research
Highlight
Teachers’ perceptions of their school administrators is the most important
factor affecting whether or not they decide to stay at a school, trumping
concerns about base salary.6
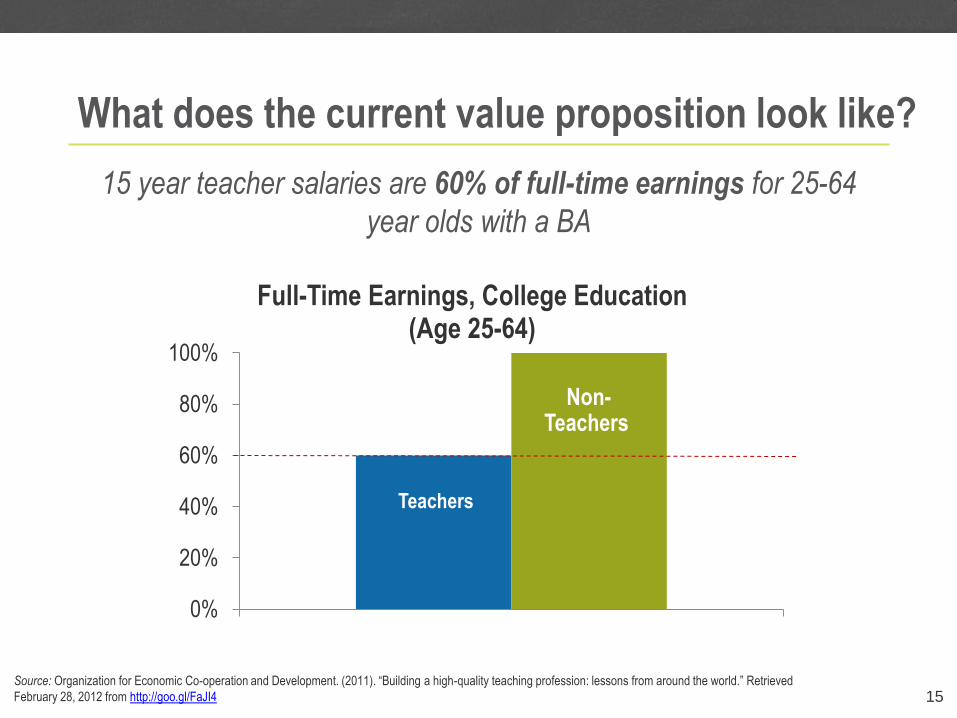
What does the current value proposition look like?
15 year teacher salaries are 60% of full-time earnings for 25-64
year olds with a BA
15
0%
20%
40%
60%
80%
100%
Full-Time Earnings, College Education (Age 25-64)
Teachers
Non- Teachers
Source: Organization for Economic Co-operation and Development. (2011). “Building a high-quality teaching profession: lessons from around the world.” Retrieved
February 28, 2012 from http://goo.gl/FaJI4
What does the current value proposition look like?
16
Teachers do not fully value districts’ significant investments
in their benefits and pensions
Source: Fitzpatrick, Maria (2011). “How Much Do Public School Teachers Value Their Retirement Benefits?” Department of Policy Analysis and Management, Cornell University.
Retrieved February 16, 2012 from http://goo.gl/x2bfg
“The majority of Illinois public school teachers are willing to pay
just 17 cents for a dollar increase in the present value of
expected retirement benefits.”
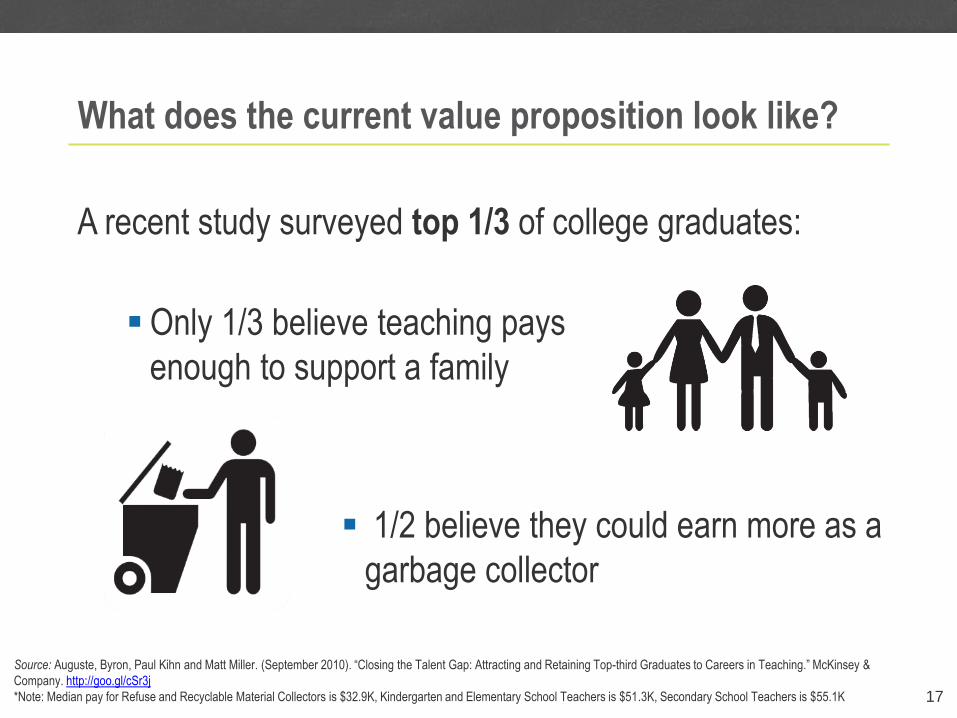
What does the current value proposition look like?
17
A recent study surveyed top 1/3 of college graduates:
Only 1/3 believe teaching pays
enough to support a family
1/2 believe they could earn more as a
garbage collector
Source: Auguste, Byron, Paul Kihn and Matt Miller. (September 2010). “Closing the Talent Gap: Attracting and Retaining Top-third Graduates to Careers in Teaching.” McKinsey &
Company. http://goo.gl/cSr3j
*Note: Median pay for Refuse and Recyclable Material Collectors is $32.9K, Kindergarten and Elementary School Teachers is $51.3K, Secondary School Teachers is $55.1K

Districts can vary widely in certain aspects of the
value proposition, such as total teacher hours
18
1245 1254
1315 1329
1346 1365
1440 1442
1470 1472
1,100
1,150
1,200
1,250
1,300
1,350
1,400
1,450
1,500
Ho
urs
Per
Yea
r
Total Number of Contractual Annual Teacher Hours (Length of Teacher Day) x (Number of Days)
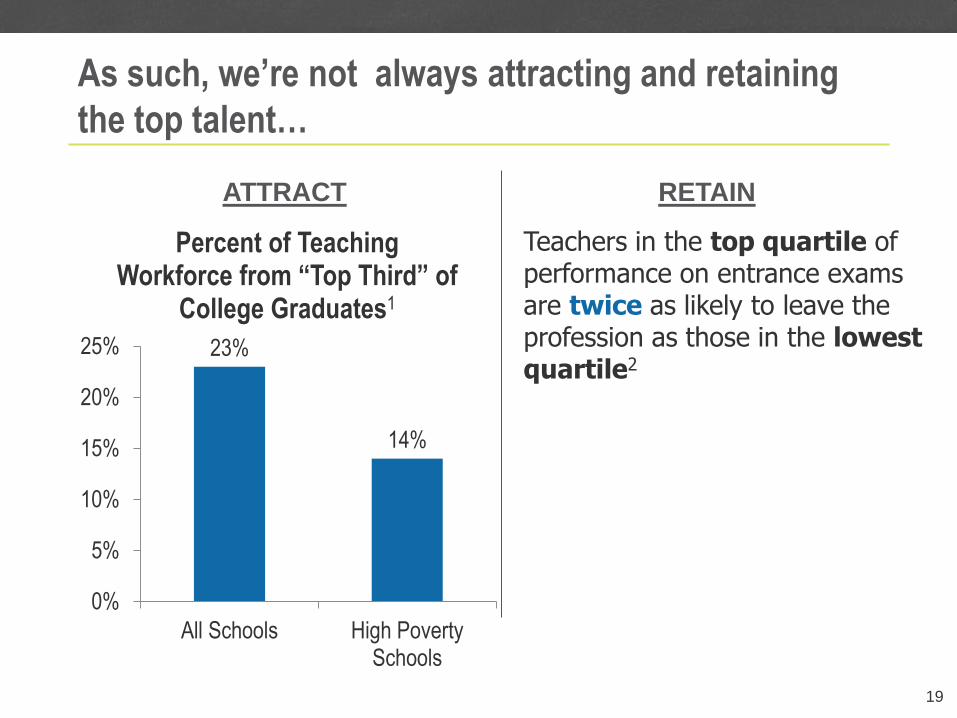
As such, we’re not always attracting and retaining
the top talent…
23%
14%
0%
5%
10%
15%
20%
25%
All Schools High PovertySchools
Percent of Teaching Workforce from “Top Third” of
College Graduates1
19
Teachers in the top quartile of performance on entrance exams are twice as likely to leave the profession as those in the lowest quartile2
ATTRACT RETAIN
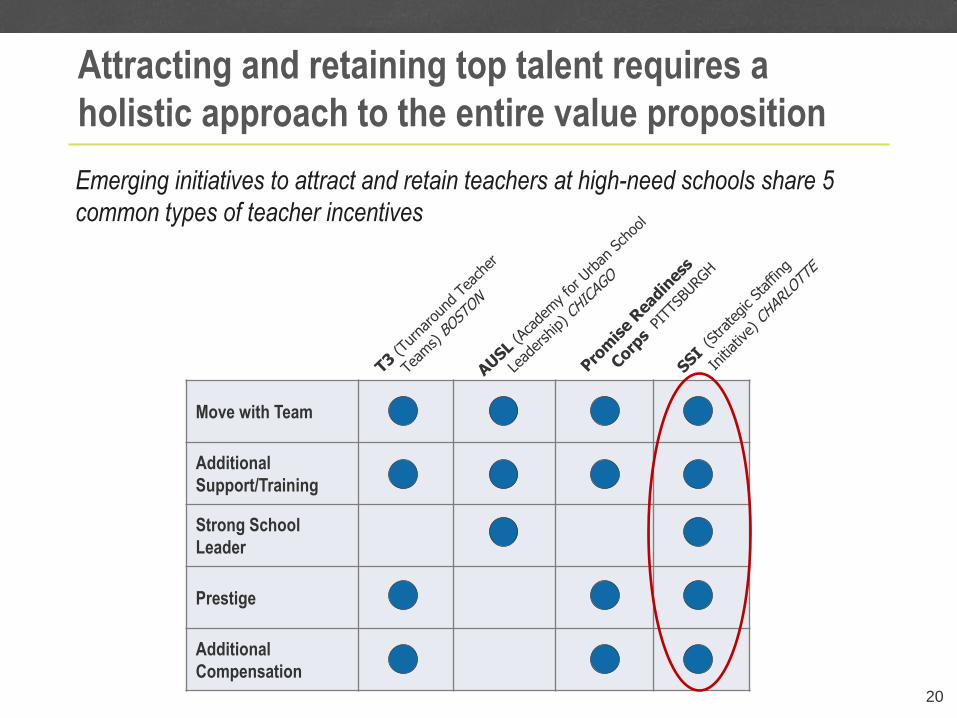
Attracting and retaining top talent requires a
holistic approach to the entire value proposition
20
Move with Team
Additional
Support/Training
Strong School
Leader
Prestige
Additional
Compensation
Emerging initiatives to attract and retain teachers at high-need schools share 5
common types of teacher incentives
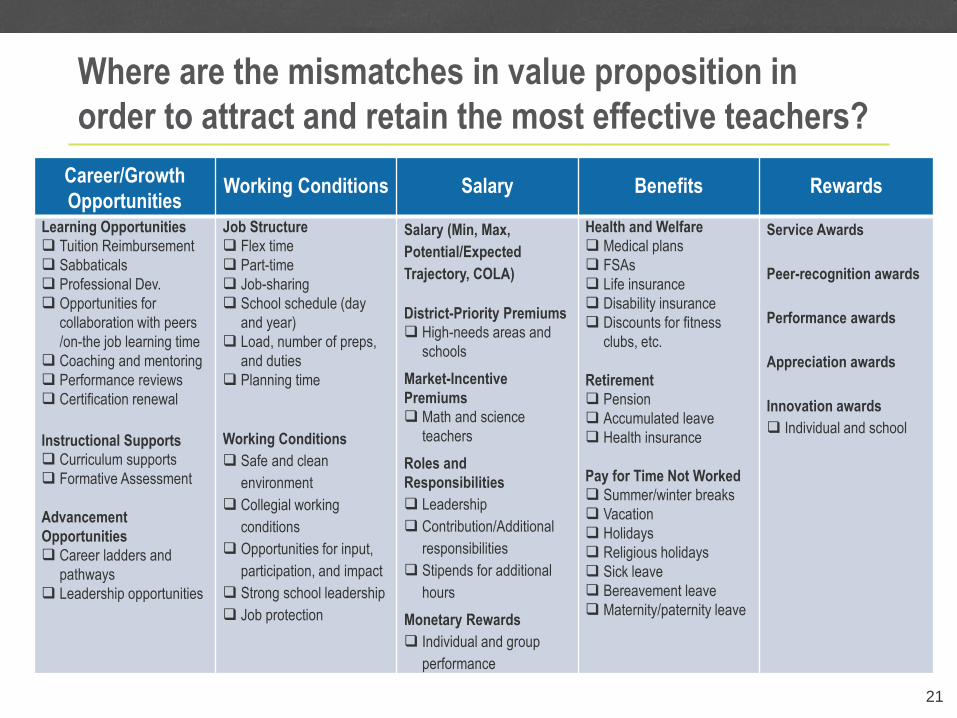
Where are the mismatches in value proposition in
order to attract and retain the most effective teachers?
21
Career/Growth
Opportunities Working Conditions Salary Benefits Rewards
Learning Opportunities
Tuition Reimbursement
Sabbaticals
Professional Dev.
Opportunities for
collaboration with peers
/on-the job learning time
Coaching and mentoring
Performance reviews
Certification renewal
Instructional Supports
Curriculum supports
Formative Assessment
Advancement
Opportunities
Career ladders and
pathways
Leadership opportunities
Job Structure
Flex time
Part-time
Job-sharing
School schedule (day
and year)
Load, number of preps,
and duties
Planning time
Working Conditions
Safe and clean
environment
Collegial working
conditions
Opportunities for input,
participation, and impact
Strong school leadership
Job protection
Salary (Min, Max,
Potential/Expected
Trajectory, COLA)
District-Priority Premiums
High-needs areas and
schools
Market-Incentive
Premiums
Math and science
teachers
Roles and
Responsibilities
Leadership
Contribution/Additional
responsibilities
Stipends for additional
hours
Monetary Rewards
Individual and group
performance
Health and Welfare
Medical plans
FSAs
Life insurance
Disability insurance
Discounts for fitness
clubs, etc.
Retirement
Pension
Accumulated leave
Health insurance
Pay for Time Not Worked
Summer/winter breaks
Vacation
Holidays
Religious holidays
Sick leave
Bereavement leave
Maternity/paternity leave
Service Awards
Peer-recognition awards
Performance awards
Appreciation awards
Innovation awards
Individual and school

Exercise: Thinking about Our Value Proposition (Part I)
22
Focus
Identify
Prioritize
Flag
Group: Be sure that you are seated with your district team
1. Focus on your biggest needs for improvement to attract
and keep the best. For which groups of teachers do you
need to improve your value proposition? (5 min)
2. Identify the strengths and weaknesses of your current
value proposition for each of the five components listed on
your handout (15 min)
3. Prioritize the top three weaknesses that are most
important to address and list why ( 15 min )
4. Flag elements of the value proposition that would require
more information to assess (10 min)

Exercise: Thinking about Our Value Proposition (Part II)
Group: Form groups of 2 – 3 districts
1. Share the three priorities that you identified in
Part I
2. Brainstorm different ideas on how to best make
progress on your priorities
3. Reflect on your district’s list of priorities. Are
there any changes to the list based on what was
shared and discussed?
4. Report out your value proposition priorities to
the whole group
23
Share
Brainstorm
Reflect
Report Out

What are some ways to continuously evaluate your
district’s value proposition?
Benchmarking Salaries
Working Hours
Principal Quality
Surveys Declined offers: Why were teaching offers turned down?
Entry: Why did teachers join the district?
Exit: What made teachers decide to leave the district?
Informal conversations w/ teachers
24
District leaders need to continuously reflect on how confident they are in the value
proposition, what they are tracking and how they can make it better over time.

Working Lunch: Reflecting on the Morning Session
(45 min)
During this time….
Please be sure to enjoy your lunch and to fill out the front
page of the handout.
Please hold onto the forms, we will ask you to fill out the
back and we will collect the forms at the end of the day.
Feel free to check your emails and phones.
25

Why We Need
Compensation
Reform
The Case for Change:
The current salary structure is a one size fits all
approach
27
Teachers are generally treated the same regardless of…
performance
contribution
skills
knowledge
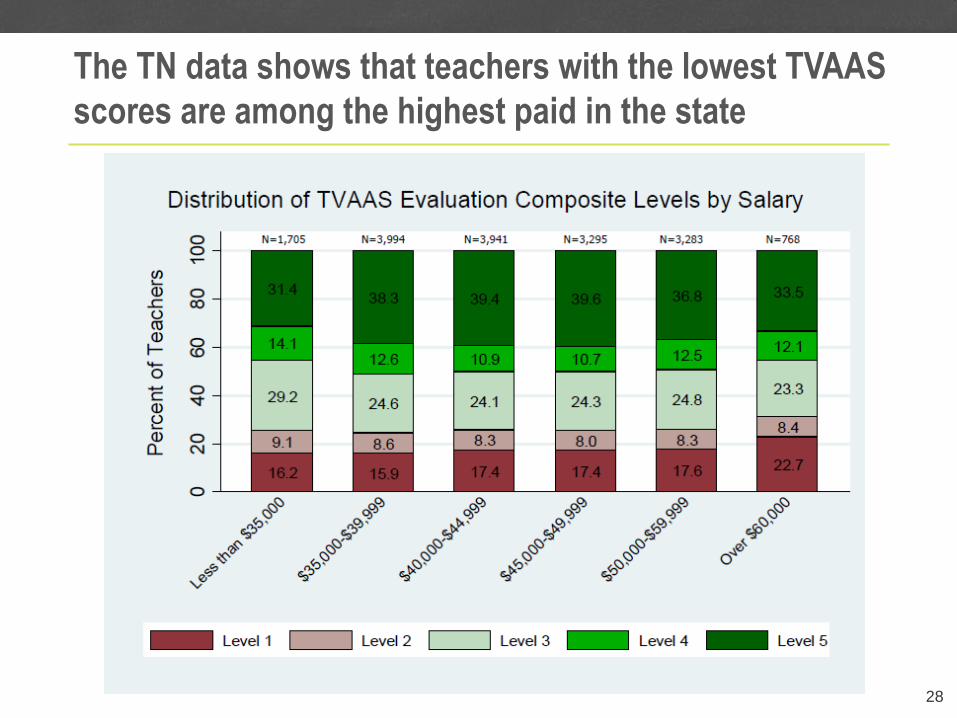
The TN data shows that teachers with the lowest TVAAS
scores are among the highest paid in the state
28
The current compensation structure is not
aligned with research
Experience Pay: Research has shown that years of
teaching experience have little effect on student
performance after the first 3-5 years1
Education Pay: There is no demonstrated correlation
between teaching effectiveness and educational
attainment beyond a bachelor’s degree, except for a
slight impact in the case of high school math and
science2
29 Source: Strategic Data Project. < http://www.gse.harvard.edu/cepr-resources/files/news-events/sdp-fcs-hc.pdf>

Spending on experience and degrees represents significant
investment, making up 15% of total compensation dollars
$1.9 $0.4
$0.2 $0.5
$1.0
$-
$0.5
$1.0
$1.5
$2.0
$2.5
$3.0
$3.5
$4.0
$4.5
State Base Pay Experience Education LocalSupplements
Benefits
FY
13 T
each
er C
om
pen
sati
on
($B
)
Total Teacher Compensation on Allocated Positions ~ $3.9 B
% of Total
Teacher
Compensation
48% 9% 6% 12% 24%
Note: Spending on Benefits for Additional Positions was calculated based of the % spending on Benefits for BEP funded positions. 30

Click to edit Master title style
Doctors and lawyers
reap the full rewards of
competence in their
profession within
almost 15 years of
entrance. Teachers
must wait three times
that long, even though
evidence suggests that
they become fully
competent in their
profession just as
quickly.4
It takes teachers a significant amount of time to
reach their top salary
31
Source: http://educationnext.org/scrap-the-sacrosanct-salary-schedule/
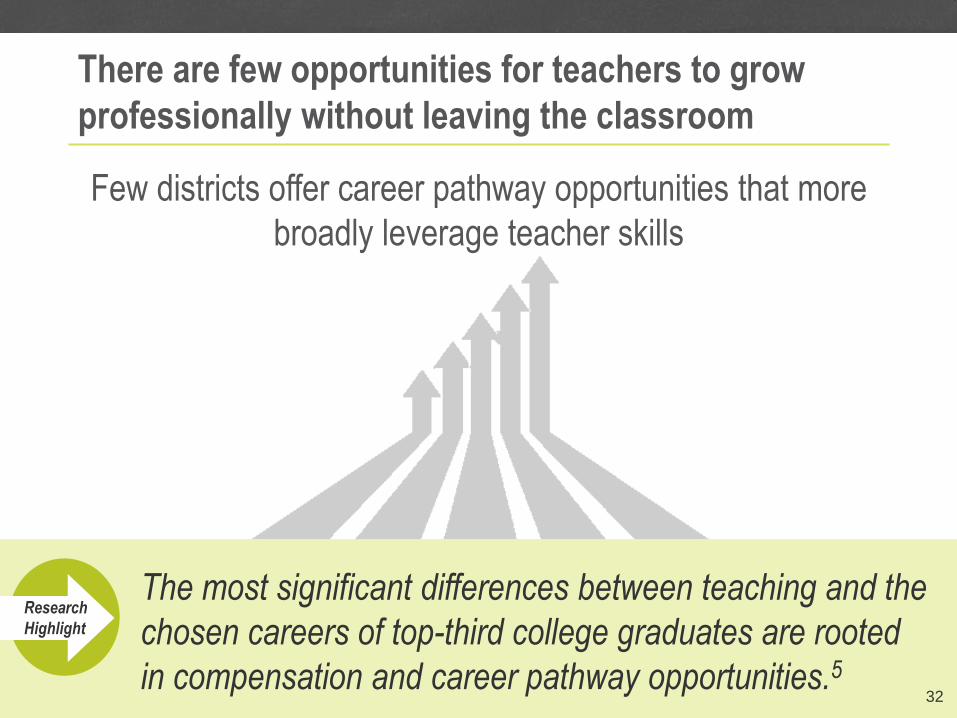
There are few opportunities for teachers to grow
professionally without leaving the classroom
Few districts offer career pathway opportunities that more
broadly leverage teacher skills
32
Research
Highlight
The most significant differences between teaching and the
chosen careers of top-third college graduates are rooted
in compensation and career pathway opportunities.5

Instead, a carefully designed and effective compensation
system will consist of the following four components…
Teacher Compensation Pyramid
Teacher Compensation
Pyramid
Rewards
District Incentives
Additional Roles & Responsibilities
Base
Increasing
by total amount
for a district
33

Which problems do you think are most urgent to solve?
34 A B C D
29%25%
36%
11%
A. Lack of reward for
differential effectiveness
B. Lack of career paths
C. Compensation increases
not tied to student
performance improvement
D. Great teachers cannot
reach top pay early in
their careers

Thinking Through the
Elements of Compensation
Redesign – Investments
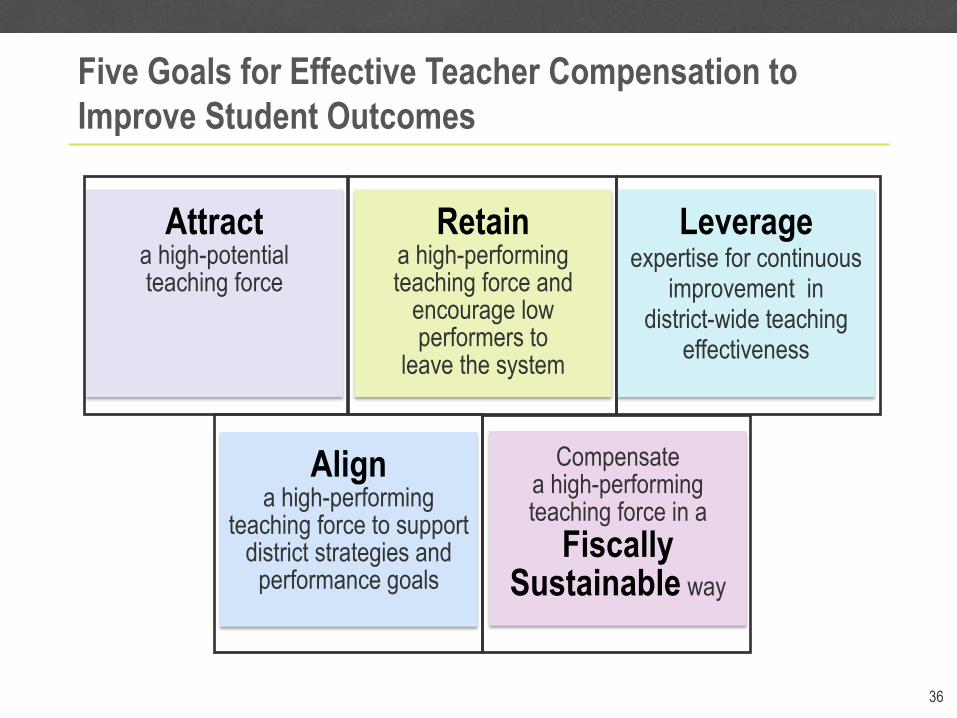
Five Goals for Effective Teacher Compensation to
Improve Student Outcomes
36
Attract a high-potential teaching force
Retain a high-performing teaching force and
encourage low performers to
leave the system
Leverage expertise for continuous
improvement in district-wide teaching
effectiveness
Align a high-performing
teaching force to support district strategies and
performance goals
Compensate a high-performing teaching force in a
Fiscally Sustainable way
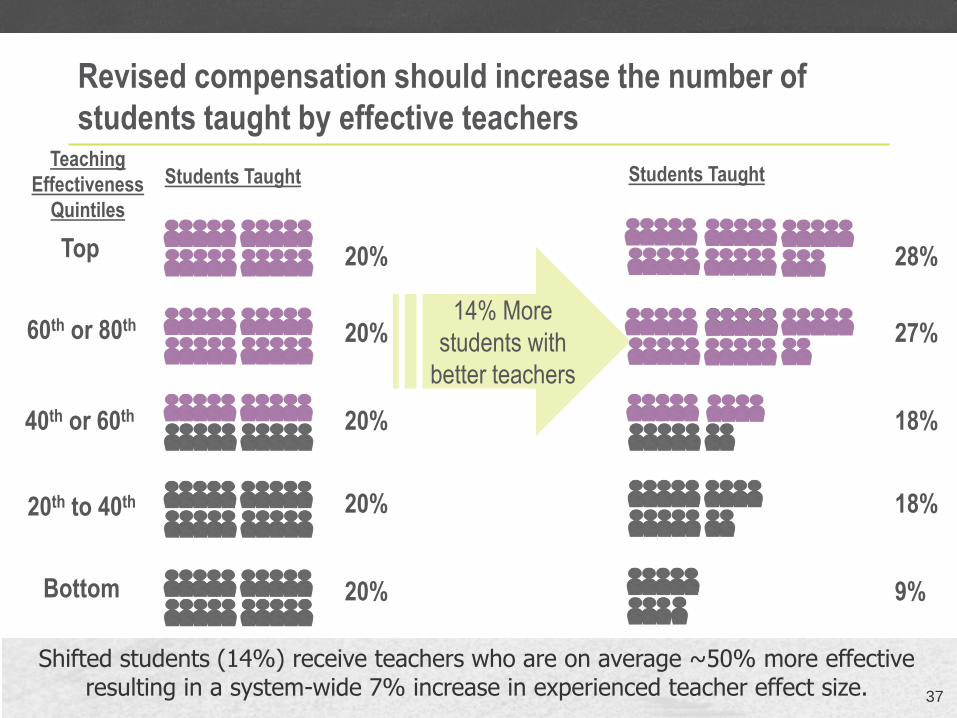
Revised compensation should increase the number of
students taught by effective teachers
37
Shifted students (14%) receive teachers who are on average ~50% more effective resulting in a system-wide 7% increase in experienced teacher effect size.
Bottom
20th to 40th
40th or 60th
60th or 80th
Top
Students Taught Students Taught Teaching
Effectiveness
Quintiles
28%
27%
18%
18%
9%
20%
20%
20%
20%
20%
14% More
students with
better teachers
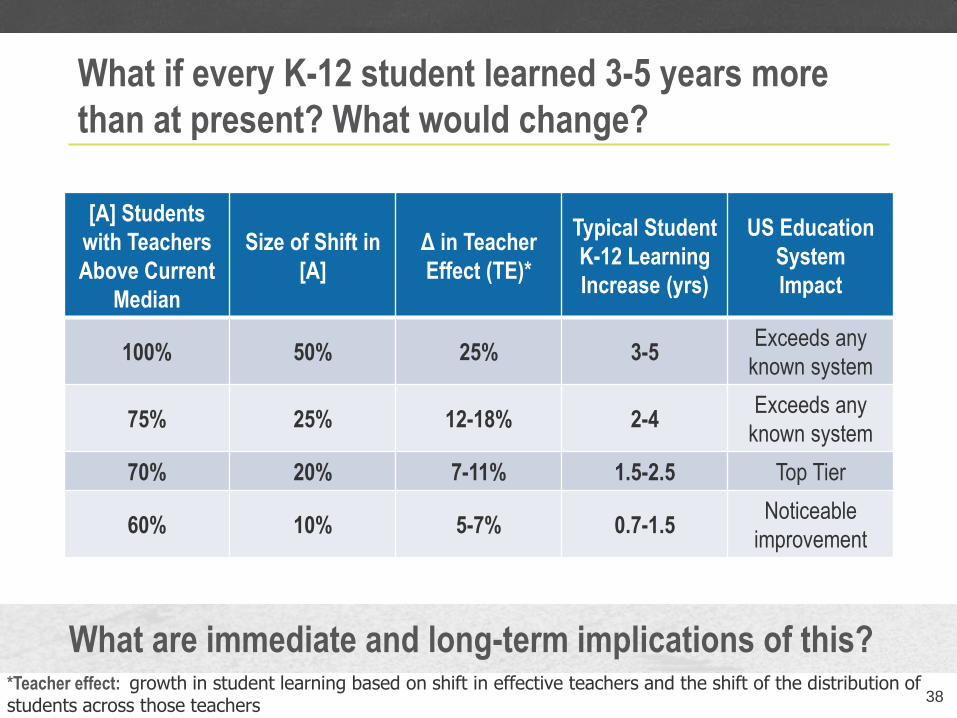
What if every K-12 student learned 3-5 years more
than at present? What would change?
38
[A] Students
with Teachers
Above Current
Median
Size of Shift in
[A]
Δ in Teacher
Effect (TE)*
Typical Student
K-12 Learning
Increase (yrs)
US Education
System
Impact
100% 50% 25% 3-5 Exceeds any
known system
75% 25% 12-18% 2-4 Exceeds any
known system
70% 20% 7-11% 1.5-2.5 Top Tier
60% 10% 5-7% 0.7-1.5 Noticeable
improvement
What are immediate and long-term implications of this? *Teacher effect: growth in student learning based on shift in effective teachers and the shift of the distribution of students across those teachers

The conundrum: Only paying more to top performers for
the same job may be expensive and cost ineffective
Year 1 5 10 15 20
Δ in TE 0% 0% 0% 0% 1%
Δ in cost 0% 1% 1.5% 2% 2.5%
TE/Cost 100% 99% 99% 98% 98%
50% 50% 51% 51%
0%
20%
40%
60%
0 5 10 15 20% o
f S
tud
ents
wit
h t
each
ers
abo
ve m
edia
n
Year of Reform
Distribution of Students Across Teachers in Redesigned System
% of Students with Teacher Above Median
Effectiveness Pay
Extending the Reach of Top Performers 39
Pay Top Performers More (Double raise for
level 5, 10% higher raise for level 4)
Effectiveness Steps (Remove raise from
category 1 and 2) 39

Why don’t we see a bigger effect for just paying top performers more? In part, because today’s top performers are already retained
75%
86% 90% 89%
50%
60%
70%
80%
90%
100%
District 1 District 2
Ret
enti
on
%
Average Retention Rates by Performance Quartile for all Teachers in Two Districts
Avg Q2 to Q4 Q1 - High Performing
At most, we will
retain ~5% more
highly effective
teachers at a cost
that exceeds the
immediate benefit
40

In short, paying top performers more for the same job they do
today is, at best, a long-run proposition …
We will show later that we can end up with top performers earning more than
lower performers by reducing raises for low performers and supplementing
effectiveness pay with pay for taking on additional roles and responsibilities
Suppose a 20% increase in pay for most effective teachers…
Districts would have to increase the
Top Quartile Teachers by…
To return to the current level of
Student Achievement Outcome per
Dollar Spent
10%
…in more than 20 years, if ever 20%
30%
40% 19 Years
50% 13 Years
60% 12 Years
Is this possible?
41

The solution: Three sustainable ways to reward top
contributors with current revenue streams
1) Eliminate raises to Level 1 & 2 teachers and invest the difference in slightly higher raises to Level 5 teachers (effectiveness steps)
2) Define effectiveness bands (e.g.: novice, professional, master, etc.)
3) Create roles that allow us to expand the impact of our effective teachers on students and teachers
42

Click to edit Master title style
• Annual raises vary by
effectiveness
• Low performing teachers
receive no raise
• Effectiveness Steps often
replace experience pay
Current Avg. Step: $314
Example Effectiveness
Steps:
Level 5: $400 per year
Level 3,4: $315 per year
Levels 1,2: No annual
raises
1) Effectiveness Steps: Annual increases that vary
based on effectiveness level
43

1) Effectiveness steps allow us to improve or
maintain career earnings for ~90% of TN teachers
44
% of
Workforce
Current
System
Redesigned
System
A teacher entering the new system
Level 5 33% $1.4M $1.5M
Level 4 35% $1.4M $1.4M
Level 3 22% $1.4M $1.4M
Level 2 9% $1.4M $1.2M
Level 1 1% $1.4M $1.2M
Career Earnings, by Teacher Perspective and System
~90% of teachers would earn equal or greater salary over
their careers and no teachers would lose money that they
are currently earning
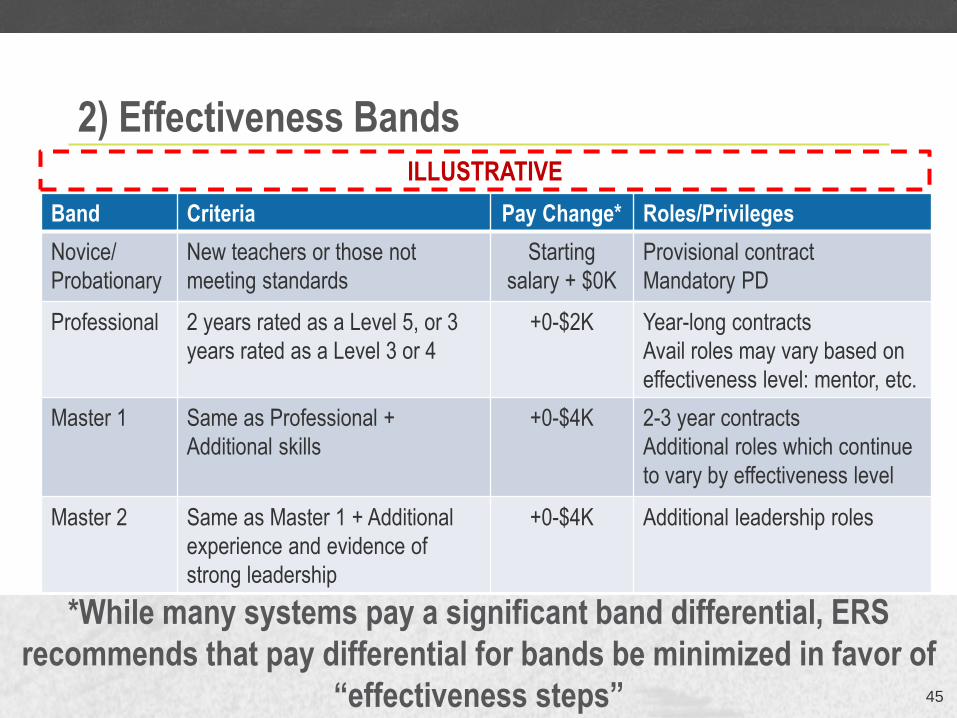
2) Effectiveness Bands
45
*While many systems pay a significant band differential, ERS
recommends that pay differential for bands be minimized in favor of
“effectiveness steps”
Band Criteria Pay Change* Roles/Privileges
Novice/
Probationary
New teachers or those not
meeting standards
Starting
salary + $0K
Provisional contract
Mandatory PD
Professional 2 years rated as a Level 5, or 3
years rated as a Level 3 or 4
+0-$2K Year-long contracts
Avail roles may vary based on
effectiveness level: mentor, etc.
Master 1 Same as Professional +
Additional skills
+0-$4K 2-3 year contracts
Additional roles which continue
to vary by effectiveness level
Master 2 Same as Master 1 + Additional
experience and evidence of
strong leadership
+0-$4K Additional leadership roles
ILLUSTRATIVE
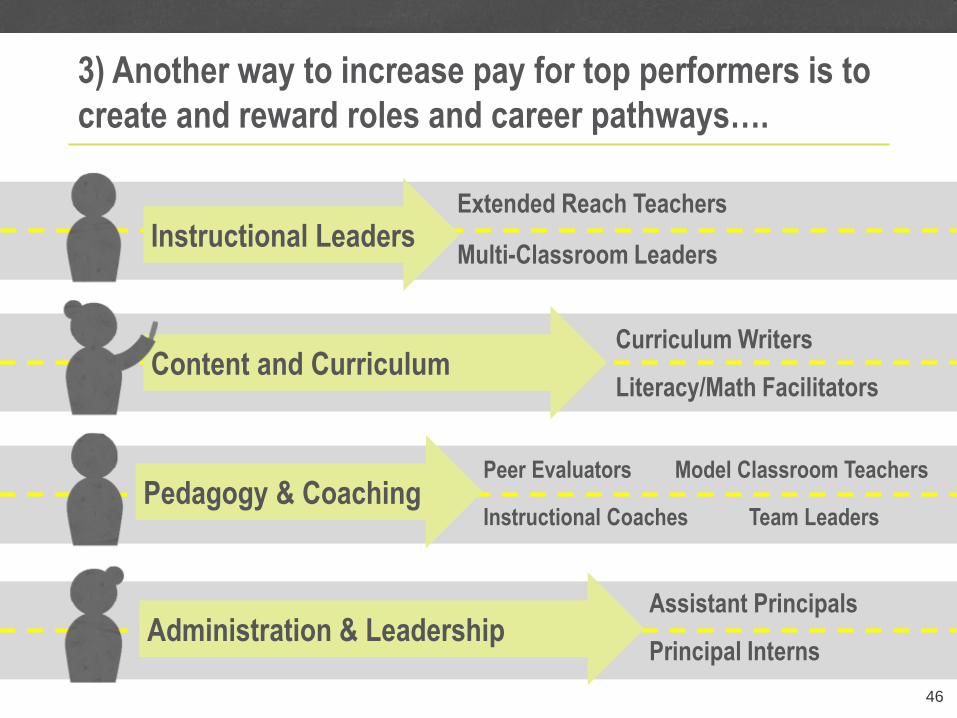
3) Another way to increase pay for top performers is to
create and reward roles and career pathways….
46
Instructional Leaders
Content and Curriculum
Pedagogy & Coaching
Administration & Leadership
Extended Reach Teachers
Multi-Classroom Leaders
Curriculum Writers
Literacy/Math Facilitators
Peer Evaluators Model Classroom Teachers
Instructional Coaches Team Leaders
Assistant Principals
Principal Interns
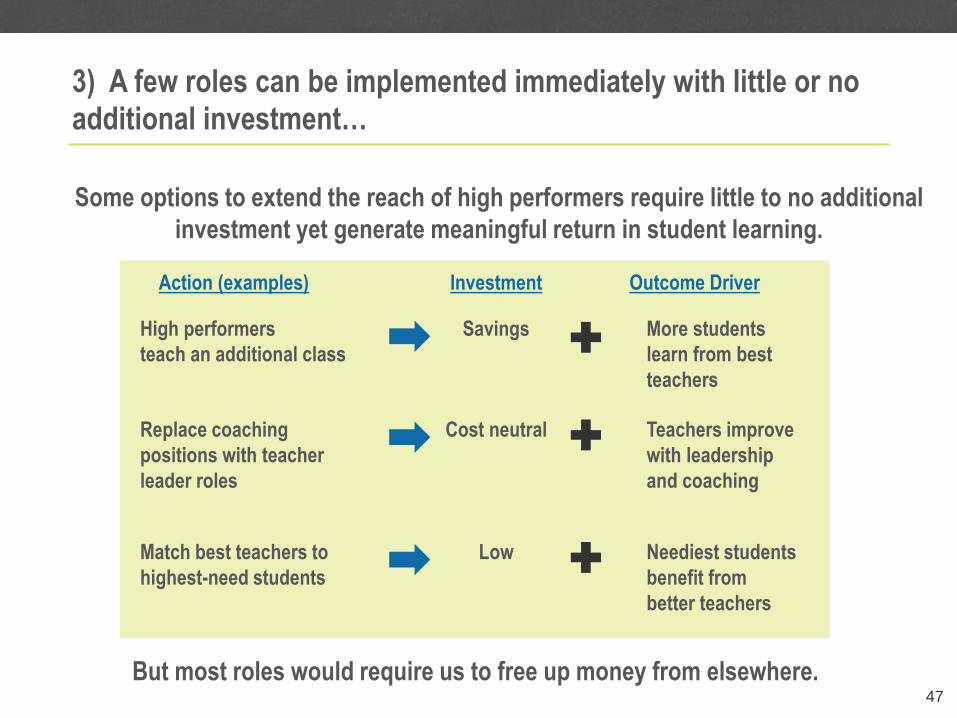
3) A few roles can be implemented immediately with little or no additional investment…
Some options to extend the reach of high performers require little to no additional
investment yet generate meaningful return in student learning.
High performers
teach an additional class
Action (examples) Investment Outcome Driver
Savings More students
learn from best
teachers
Replace coaching
positions with teacher
leader roles
Cost neutral Teachers improve
with leadership
and coaching
Match best teachers to
highest-need students
Low Neediest students
benefit from
better teachers
But most roles would require us to free up money from elsewhere. 47
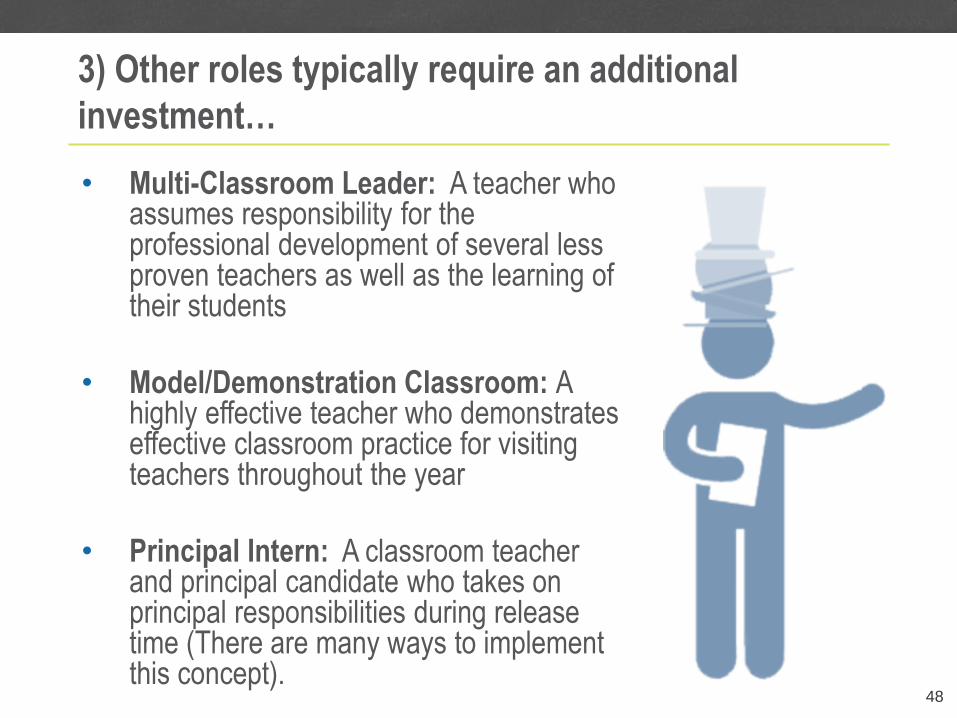
3) Other roles typically require an additional
investment…
• Multi-Classroom Leader: A teacher who assumes responsibility for the professional development of several less proven teachers as well as the learning of their students
• Model/Demonstration Classroom: A highly effective teacher who demonstrates effective classroom practice for visiting teachers throughout the year
• Principal Intern: A classroom teacher and principal candidate who takes on principal responsibilities during release time (There are many ways to implement this concept).
48

Group Discussion
Turn to your group, discuss the biggest
“aha moment” from this section
What is one actionable takeaway?
*Be prepared to share your ideas with
the entire group 49

Thinking Through the
Elements of Compensation
Design – Resource
Opportunities
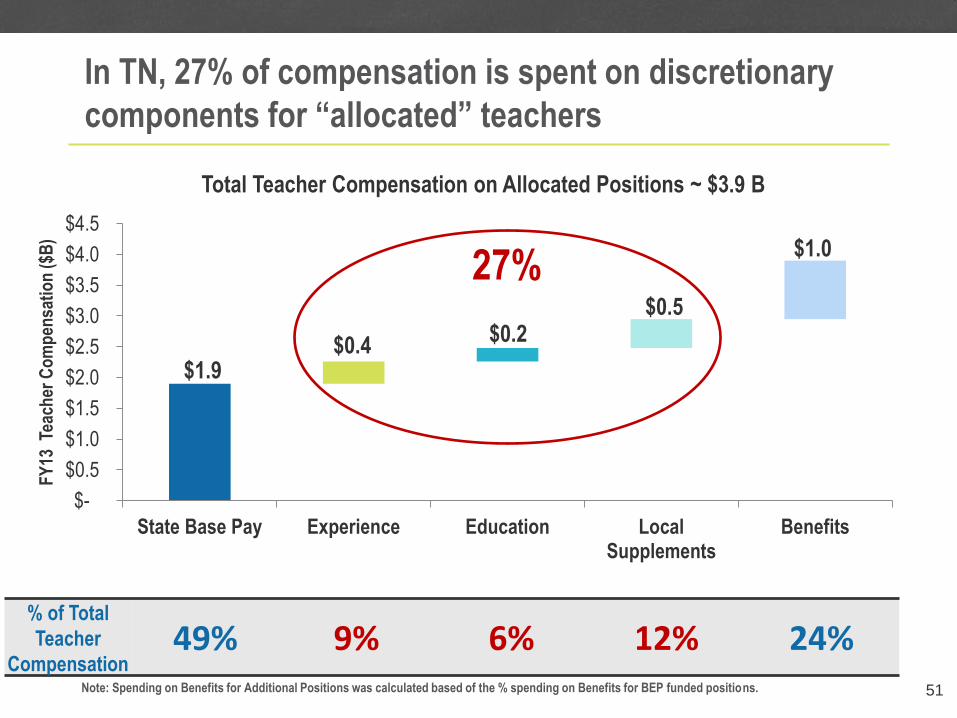
In TN, 27% of compensation is spent on discretionary
components for “allocated” teachers
$1.9 $0.4
$0.2 $0.5
$1.0
$-
$0.5
$1.0
$1.5
$2.0
$2.5
$3.0
$3.5
$4.0
$4.5
State Base Pay Experience Education LocalSupplements
Benefits
FY
13 T
each
er C
om
pen
sati
on
($B
)
Total Teacher Compensation on Allocated Positions ~ $3.9 B
% of Total
Teacher
Compensation 49% 9% 6% 12% 24%
Note: Spending on Benefits for Additional Positions was calculated based of the % spending on Benefits for BEP funded positions. 51
27%
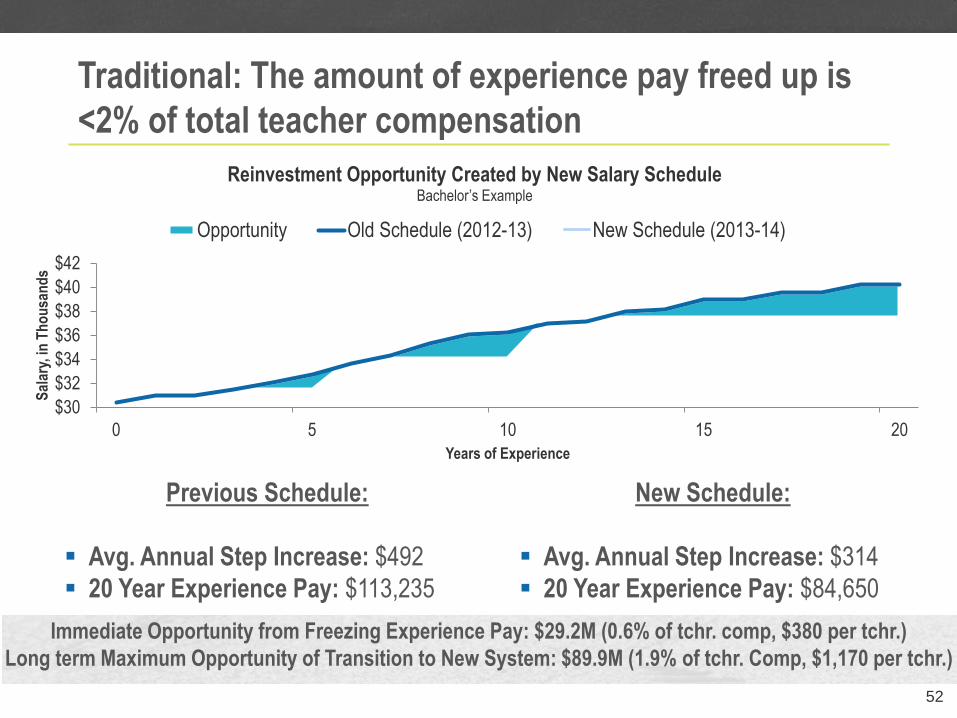
Traditional: The amount of experience pay freed up is
<2% of total teacher compensation
$30
$32
$34
$36
$38
$40
$42
0 5 10 15 20
Sal
ary,
in T
ho
usa
nd
s
Years of Experience
Reinvestment Opportunity Created by New Salary Schedule Bachelor’s Example
Opportunity Old Schedule (2012-13) New Schedule (2013-14)
52
Previous Schedule:
Avg. Annual Step Increase: $492
20 Year Experience Pay: $113,235
New Schedule:
Avg. Annual Step Increase: $314
20 Year Experience Pay: $84,650
Annual Statewide Opportunity: $12.5M Immediate Opportunity from Freezing Experience Pay: $29.2M (0.6% of tchr. comp, $380 per tchr.)
Long term Maximum Opportunity of Transition to New System: $89.9M (1.9% of tchr. Comp, $1,170 per tchr.)
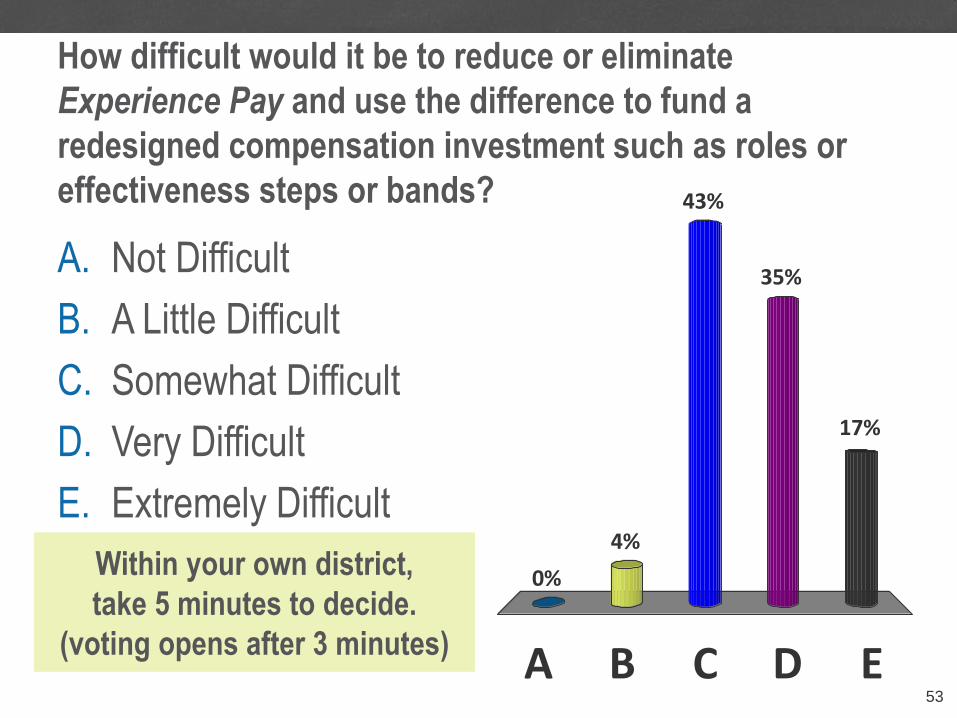
How difficult would it be to reduce or eliminate
Experience Pay and use the difference to fund a
redesigned compensation investment such as roles or
effectiveness steps or bands?
53
A B C D E
0%
4%
17%
35%
43%
A. Not Difficult
B. A Little Difficult
C. Somewhat Difficult
D. Very Difficult
E. Extremely Difficult
Within your own district,
take 5 minutes to decide.
(voting opens after 3 minutes)

Traditional: Education lane consolidation frees
up another <1% of teacher compensation
54
Avg. Education Pay per Year, by Degree Type
$0
Bachelors Advanced Degree
$3,804
Previous Schedule:
New Schedule:
$0
Bachelors Masters Masters
+ 30
Specialist
$4,138
$6,621
$8,373
$12,191
Doctorate
State Teacher
Distribution 38% 42% 9% 9% 2%
Immediate Opportunity from Freezing Education Pay: $2.5M (0.1% of tchr. comp, $32 per tchr.)
Long term Maximum Opportunity of Transition to New System: $52.2M (1.1% of tchr. Comp, $670 per tchr.)

How difficult would it be to reduce or eliminate
Education Pay and use the difference to fund a
redesigned compensation investment such as roles or
effectiveness steps or bands?
55
A B C D E
0%
14%11%
25%
50%
A. Not Difficult
B. A Little Difficult
C. Somewhat Difficult
D. Very Difficult
E. Extremely Difficult
Within your own district,
take 5 minutes to decide.
(voting opens after 3 minutes)

Local supplement opportunity varies based on
current use…
Local Supplement – Starting Difference between local and state starting salary for a
teacher with a BA
Local Supplement – Experience Difference between local and state spending for teacher
experience
Local Supplement – Education Difference between local and state spending for teachers with
advanced degrees
Locally Funding Positions Paid entirely from local funds
56
Avg Education Pay
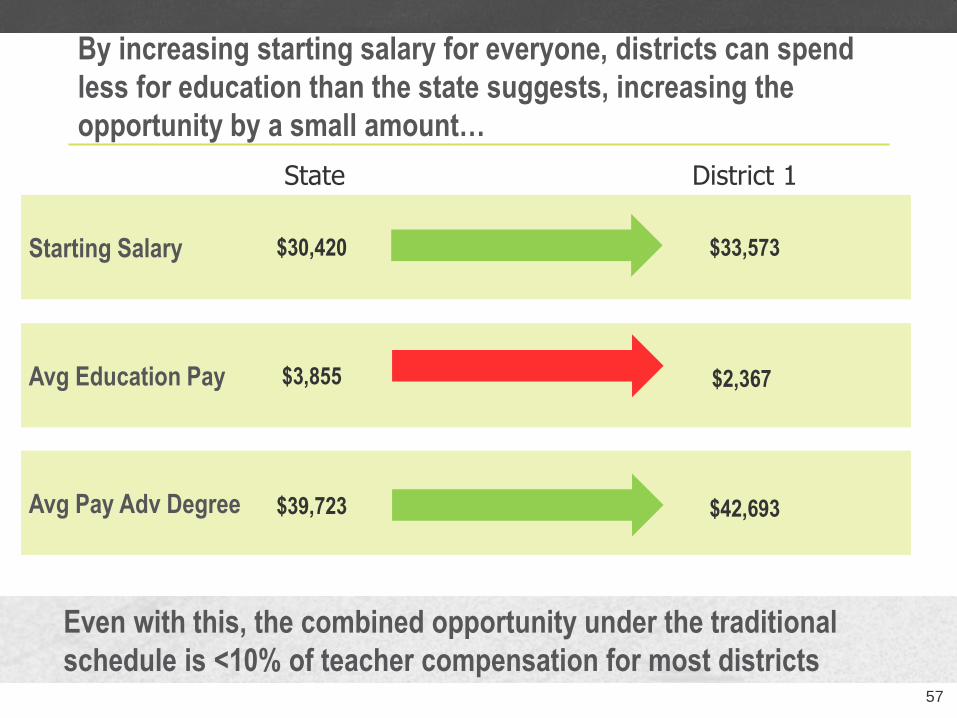
By increasing starting salary for everyone, districts can spend
less for education than the state suggests, increasing the
opportunity by a small amount…
57
District 1 State
Starting Salary $30,420 $33,573
$3,855 $2,367
Avg Pay Adv Degree $39,723 $42,693
Even with this, the combined opportunity under the traditional
schedule is <10% of teacher compensation for most districts

How difficult would it be to rethink the existing use of Local
Supplement Dollars for allocated positions and use the difference
to fund a redesigned compensation investment such as roles or
effectiveness steps or bands?
58
A. Not Difficult
B. A Little Difficult
C. Somewhat Difficult
D. Very Difficult
E. Extremely Difficult
Within your own district,
take 5 minutes to decide.
(voting opens after 3 minutes)
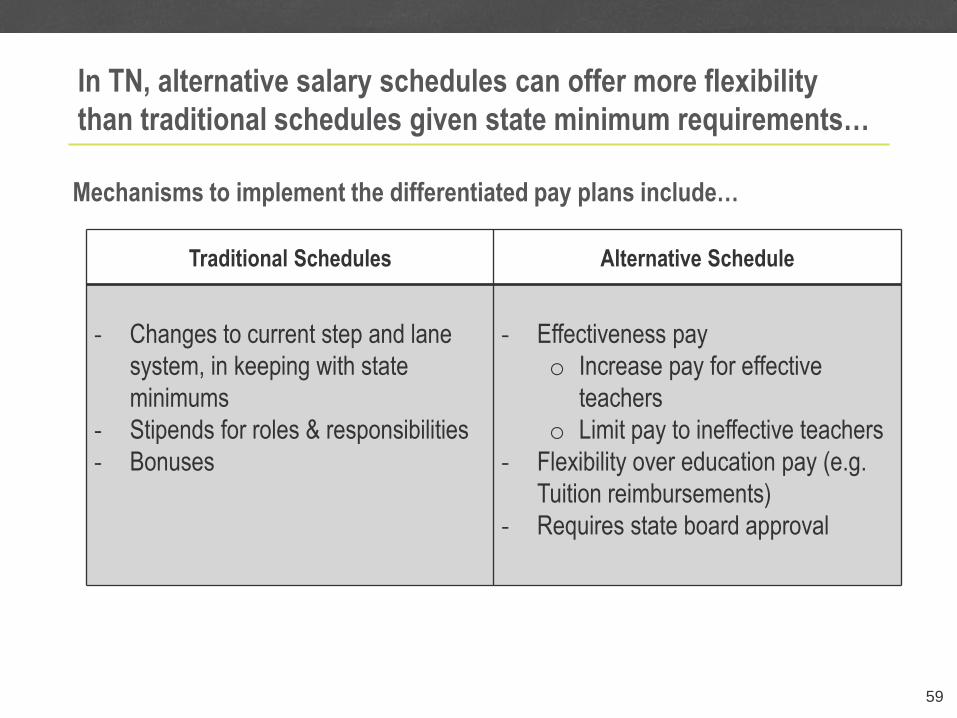
In TN, alternative salary schedules can offer more flexibility
than traditional schedules given state minimum requirements…
59
Traditional Schedules Alternative Schedule
- Changes to current step and lane
system, in keeping with state
minimums
- Stipends for roles & responsibilities
- Bonuses
- Effectiveness pay
o Increase pay for effective
teachers
o Limit pay to ineffective teachers
- Flexibility over education pay (e.g.
Tuition reimbursements)
- Requires state board approval
Mechanisms to implement the differentiated pay plans include…

Approval Process
60
Differentiated pay plans that keep the traditional schedule will be approved by TDOE.
Differentiated pay plans that transition to an alternative salary schedule must be approved by TDOE and then recommended to the State Board for approval. Application components may include:
Copy of the new schedule
Any associated policy changes
Evidence of stakeholder engagement
Communications plan
TDOE is available to provide extensive support and guidance for districts considering this option.
Click to edit Master title style
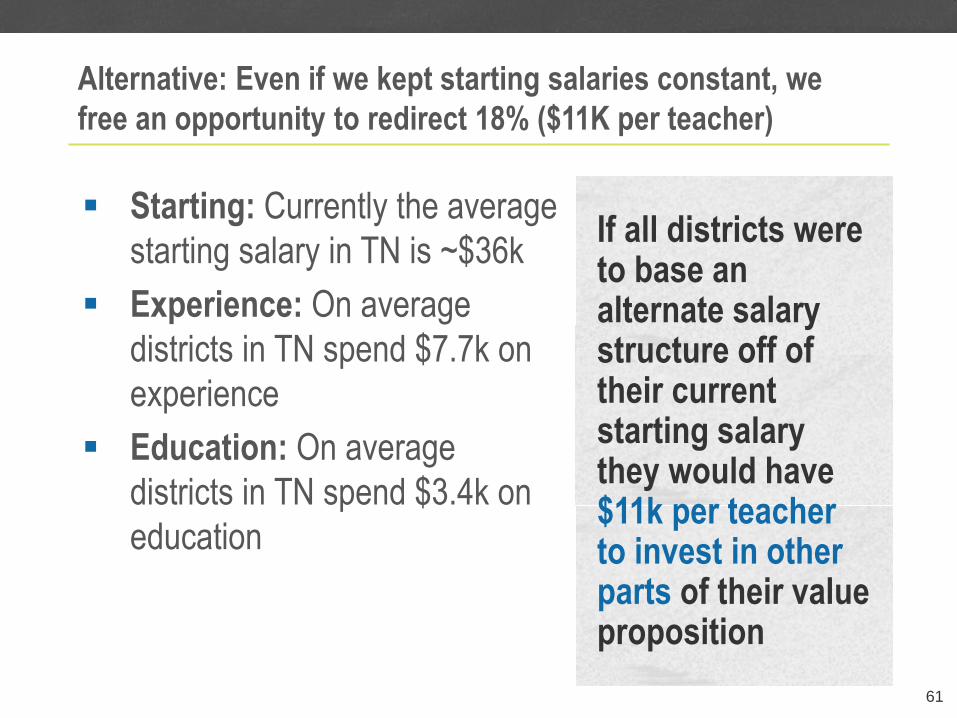
Starting: Currently the average
starting salary in TN is ~$36k
Experience: On average
districts in TN spend $7.7k on
experience
Education: On average
districts in TN spend $3.4k on
education
If all districts were to base an alternate salary structure off of their current starting salary they would have $11k per teacher to invest in other parts of their value proposition
Alternative: Even if we kept starting salaries constant, we
free an opportunity to redirect 18% ($11K per teacher)
61
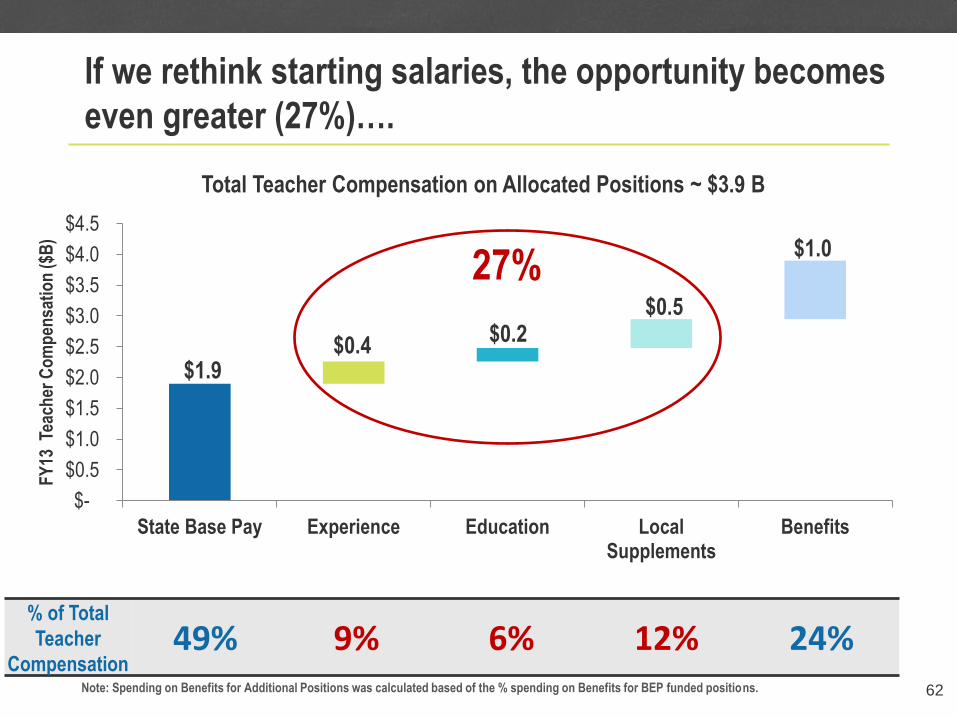
If we rethink starting salaries, the opportunity becomes
even greater (27%)….
$1.9 $0.4
$0.2 $0.5
$1.0
$-
$0.5
$1.0
$1.5
$2.0
$2.5
$3.0
$3.5
$4.0
$4.5
State Base Pay Experience Education LocalSupplements
Benefits
FY
13 T
each
er C
om
pen
sati
on
($B
)
Total Teacher Compensation on Allocated Positions ~ $3.9 B
% of Total
Teacher
Compensation 49% 9% 6% 12% 24%
Note: Spending on Benefits for Additional Positions was calculated based of the % spending on Benefits for BEP funded positions. 62
27%
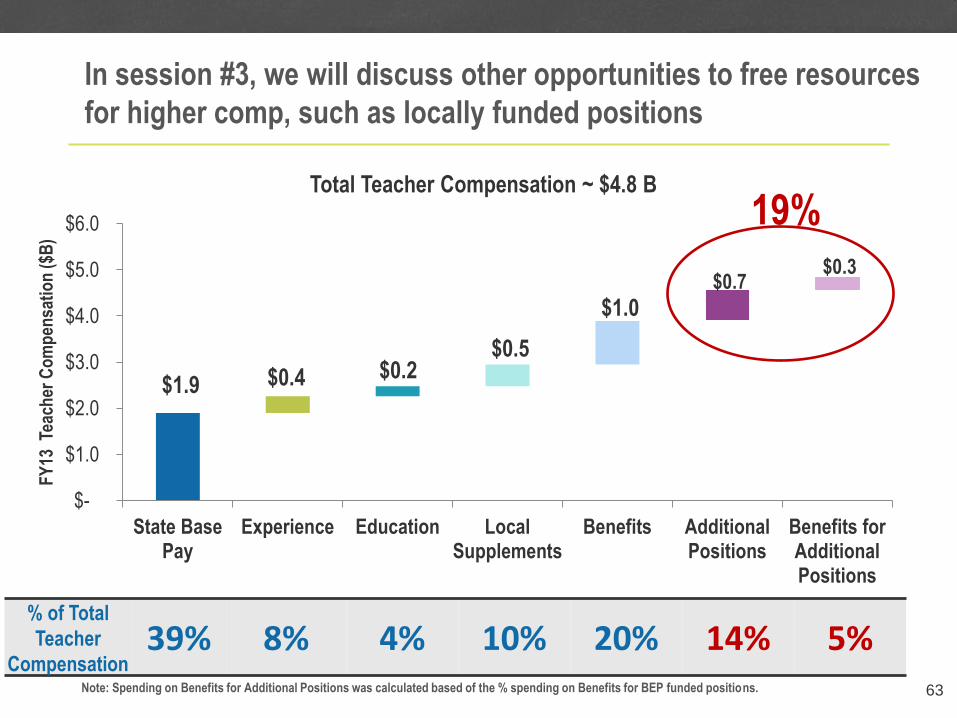
In session #3, we will discuss other opportunities to free resources
for higher comp, such as locally funded positions
$1.9 $0.4 $0.2 $0.5
$1.0 $0.7
$0.3
$-
$1.0
$2.0
$3.0
$4.0
$5.0
$6.0
State BasePay
Experience Education LocalSupplements
Benefits AdditionalPositions
Benefits forAdditionalPositions
FY
13 T
each
er C
om
pen
sati
on
($B
)
Total Teacher Compensation ~ $4.8 B
% of Total
Teacher
Compensation 39% 8% 4% 10% 20% 14% 5%
Note: Spending on Benefits for Additional Positions was calculated based of the % spending on Benefits for BEP funded positions. 63
19%

Four ideas for a reformed
compensation system in TN
that improves student
performance at no extra cost

The conundrum: Only paying more to top performers for
the same job may be expensive and cost ineffective
Year 1 5 10 15 20
Δ in TE 0% 0% 0% 0% 1%
Δ in cost 0% 1% 1.5% 2% 2.5%
TE/Cost 100% 99% 99% 98% 98%
50% 50% 51% 51%
0%
20%
40%
60%
0 5 10 15 20% o
f S
tud
ents
wit
h t
each
ers
abo
ve m
edia
n
Year of Reform
Distribution of Students Across Teachers in Redesigned System
% of Students with Teacher Above Median
Effectiveness Pay
Extending the Reach of Top Performers 65
Pay Top Performers More (Double raise for
level 5, 10% higher raise for level 4)
Effectiveness Steps (Remove raise from
category 1 and 2) 65
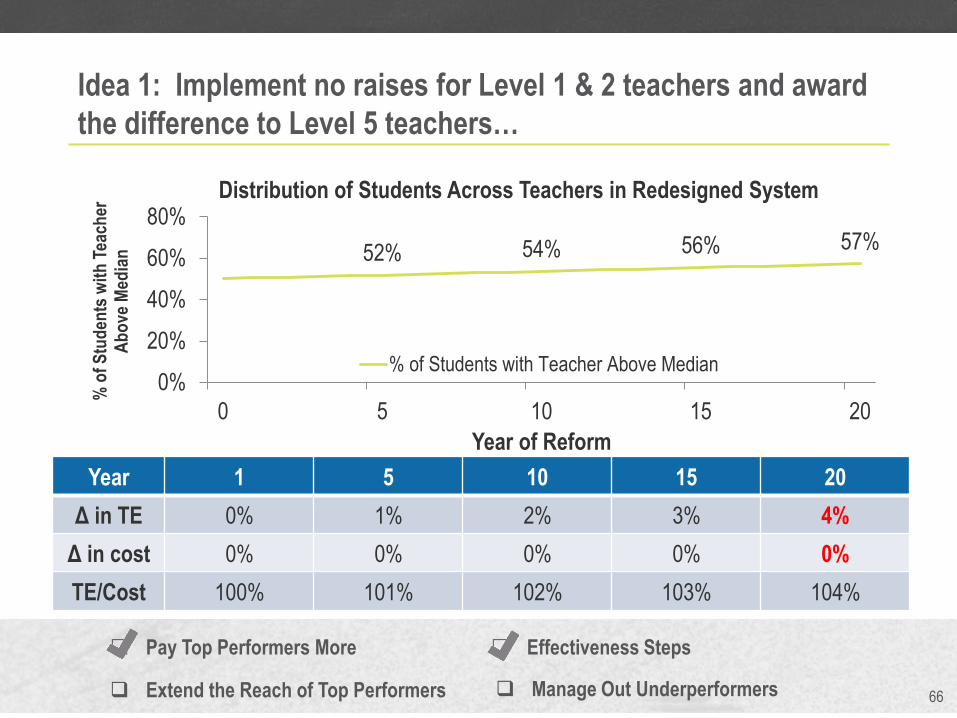
Idea 1: Implement no raises for Level 1 & 2 teachers and award
the difference to Level 5 teachers…
66
52% 54% 56% 57%
0%
20%
40%
60%
80%
0 5 10 15 20
% o
f S
tud
ents
wit
h T
each
er
Ab
ove
Med
ian
Year of Reform
Distribution of Students Across Teachers in Redesigned System
% of Students with Teacher Above Median
Year 1 5 10 15 20
Δ in TE 0% 1% 2% 3% 4%
Δ in cost 0% 0% 0% 0% 0%
TE/Cost 100% 101% 102% 103% 104%
Pay Top Performers More Effectiveness Steps
Extend the Reach of Top Performers Manage Out Underperformers 66

Idea 2: Invest to expand the roles of effective teachers to
students and other teachers…
67
Year 1 5 10 15 20
Δ in TE 0% 2% 4% 5% 7%
Δ in cost 0% 0% 0% 0% 0%
TE/Cost 100% 102% 104% 105% 107%
53% 57% 60% 64%
0%
50%
100%
0 5 10 15 20
% o
f S
tud
ents
wit
h T
each
er
Ab
ove
Med
ian
Year of Reform
Distribution of Students Across Teachers in Redesigned System with Extended Reach
% of Students with Teacher Above Median
Pay Top Performers More Effectiveness Steps
Extend the Reach of Top Performers Manage Out Underperformers

Idea 3: Implement compensation reform in the context of broader
human capital strategy that includes exiting low performers…
68
Year 1 5 10 15 20
Δ in TE 1% 5% 8% 9% 10%
Δ in cost 0% 0% 0% 0% 0%
TE/Cost 101% 105% 108% 109% 110%
Note: Scenario assumes 3% are managed out and that an additional 1.5% of the total workforce, coming from bottom performers, voluntarily exits
60% 65% 68% 71%
0%
50%
100%
0 5 10 15 20% o
f S
tud
ents
wit
h
Teac
her
Ab
ove
Med
ian
Year of Reform
Distribution of Students Across Teachers in Redesigned System
% of Students with Teacher Above Median
Pay Top Performers More Effectiveness Steps
Extend the Reach of Top Performers Manage Out Underperformers
Transformation
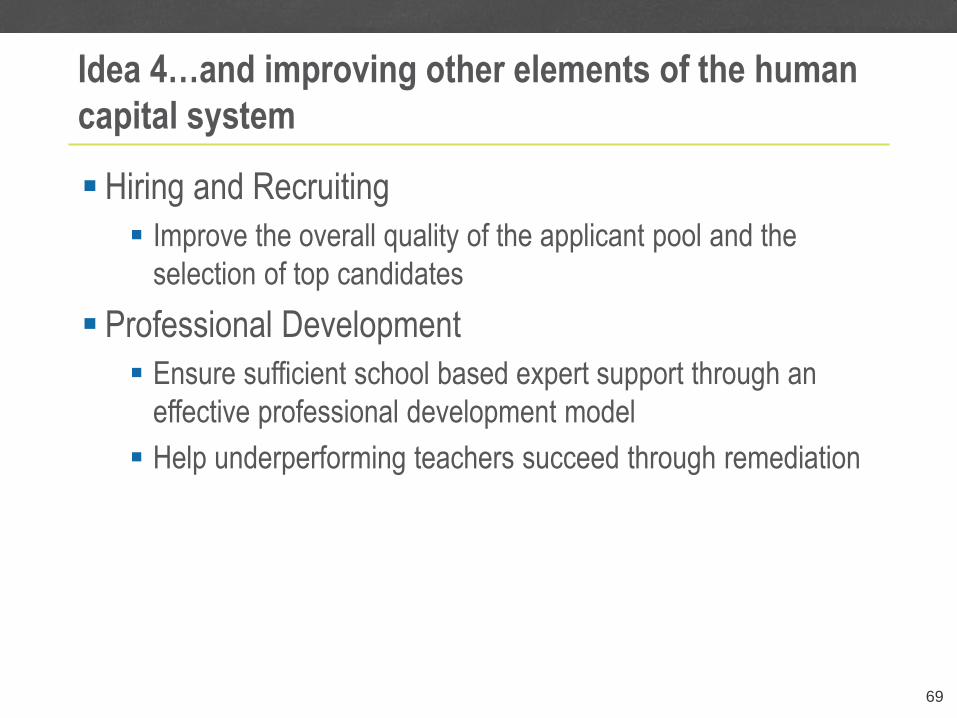
Idea 4…and improving other elements of the human
capital system
Hiring and Recruiting
Improve the overall quality of the applicant pool and the
selection of top candidates
Professional Development
Ensure sufficient school based expert support through an
effective professional development model
Help underperforming teachers succeed through remediation
69
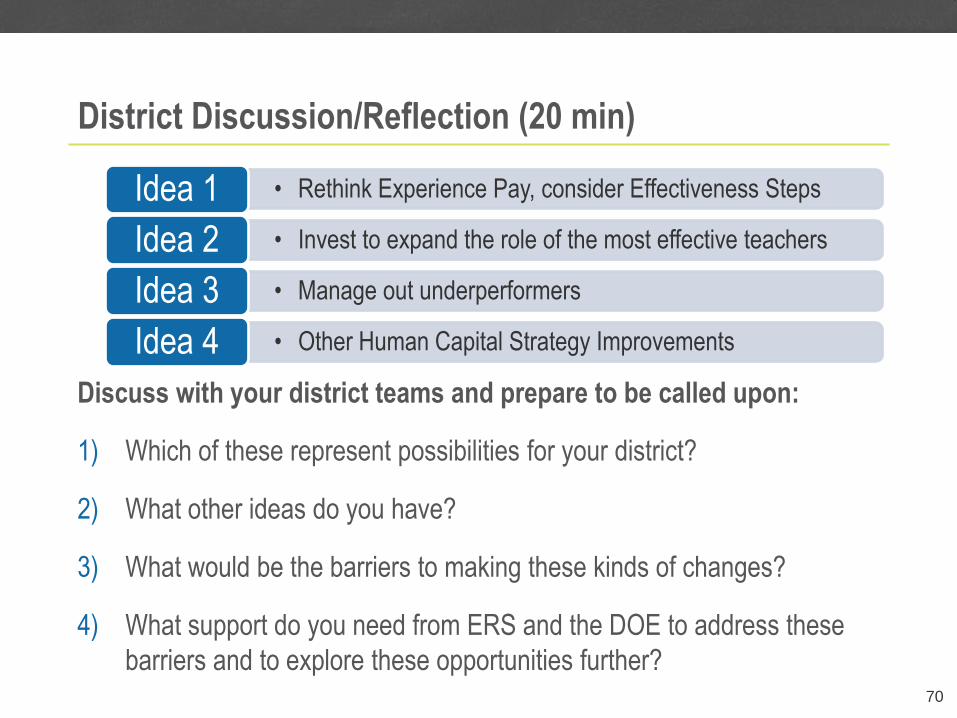
District Discussion/Reflection (20 min)
Discuss with your district teams and prepare to be called upon:
1) Which of these represent possibilities for your district?
2) What other ideas do you have?
3) What would be the barriers to making these kinds of changes?
4) What support do you need from ERS and the DOE to address these
barriers and to explore these opportunities further? 70
• Rethink Experience Pay, consider Effectiveness Steps Idea 1
• Invest to expand the role of the most effective teachers Idea 2
• Manage out underperformers Idea 3
• Other Human Capital Strategy Improvements Idea 4

Next Steps
We will support compensation redesign by…
Holding 4 monthly workshops with district leaders and support groups
Providing advisory services to fiscal consultants on compensation redesign data analytics so that consultants can support the districts in developing fiscally sustainable and comprehensive redesign plans
Offering interactive tools that can be used for conceptual and contextual learning, both during and in between workshops
Informing the state on strategies to maximize success in district compensation redesign and implementation
72
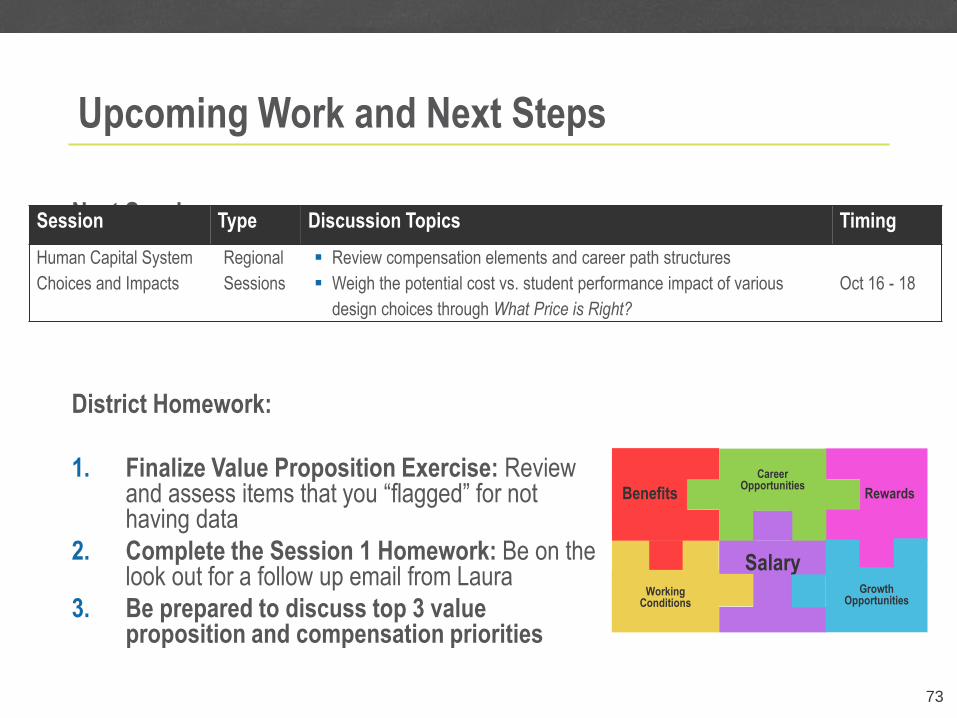
Upcoming Work and Next Steps
Next Session:
District Homework:
1. Finalize Value Proposition Exercise: Review and assess items that you “flagged” for not having data
2. Complete the Session 1 Homework: Be on the look out for a follow up email from Laura
3. Be prepared to discuss top 3 value proposition and compensation priorities
73
Session Type Discussion Topics Timing
Human Capital System
Choices and Impacts
Regional
Sessions
Review compensation elements and career path structures
Weigh the potential cost vs. student performance impact of various
design choices through What Price is Right?
Oct 16 - 18
Benefits
Career Opportunities
Salary Growth
Opportunities Working
Conditions
Rewards

Imagine what this work will mean for our state and
districts:
We make the teaching profession more attractive: o Teachers have a variety of meaningful career and promotion opportunities
that do not require them to leave the classroom
o Applicants and existing teachers know that they can earn more earlier in their careers and over their lifetime
o We understand and continuously improve our value proposition and our recruiting and hiring practices in ways that improve our ability to attract, identify, retain, and expand the reach of our top performing teachers
o Teams of teachers collaborate and learn from each other
Our student learning improves dramatically We make changes that immediately begin to improve student
learning
In as few as 7-8 years, we have met or exceeded our ambitious student learning goals
We make a strong case for a for long-term higher overall salary structure

Methodology
Appendix

ERS Methodology splits an employee’s salary into
various components
Years of Experience BA MA MA+30 Education Specialist Doctorate
1 $30,420 $33,835 $36,050 $37,525 $40,785
2 $30,990 $34,430 $36,640 $38,105 $41,370
3 $30,990 $34,430 $36,640 $38,105 $41,370
4 $31,475 $34,975 $37,215 $38,725 $42,060
5 $32,080 $35,690 $37,955 $39,510 $42,940
…
20 $40,255 $45,025 $47,770 $49,775 $54,105
76
Experience Pay:
$1,660
Education Pay:
$7,430
Starting Pay:
$30,420
Table: Salary Breakdown for Education Specialist with 5 Years of Experience
Total Pay:
$39,510
Experience Pay:
$1,660 + + Education Pay:
$7,430 =