Rethinking Resilience: Location Drivers in a Shifting ...
10
Rethinking Resilience: Location Drivers in a Shiſting Market Landscape Eleven Secondary Markets That Are Positioned to Thrive in the Next Decade
Transcript of Rethinking Resilience: Location Drivers in a Shifting ...

Rethinking Resilience: Location Drivers in a Shifting Market Landscape Eleven Secondary Markets That Are Positioned to Thrive in the Next Decade

Our largest cities, which led the economic resurgence from the last recession, will always be uniquely positioned
as vibrant centers of culture, talent and innovation. Despite current headwinds, that is unlikely to change in the
long term. However, this analysis offers an introductory look at new considerations for a location strategy. These
considerations won’t necessarily overlook the dense, dynamic “superstar” cities of the last decade. Instead,
they highlight less-heralded alternatives, which may provide their own advantages in the next decade. These
considerations include the following factors:
The following analysis presents a case study for analyzing these location drivers. By evaluating U.S. counties across
each topic, we can derive an applied example of the attributes that will be most valuable in meeting expected
challenges. The resulting markets are not a one-size-fits-all solution for every business requirement, and many
markets outside this analysis may be ideal locations for certain projects and priorities. The 11 counties below simply
exhibit a representative mix of characteristics that will be prioritized in a rapidly shifting landscape.
• Population size and density
• Population growth and momentum
• Public transit dependence
• Housing costs and foreclosure risks
• Fiscal impacts
• University pipeline
• Major airport access
• Climate
After a record economic expansion in the U.S., intermittent shutdowns caused by the COVID-19 pandemic continue to ripple through the economy. The effects of the shutdowns have fueled an uncertain future in the short term and recalibrated priorities of location strategies and the resulting real estate footprints. The COVID pandemic has amplified the need for companies to evaluate existing and new markets from fresh perspectives beyond the usual set of location drivers such as transportation costs, labor availability and cost, and taxes.
Greenville County(Greenville)
Knox County(Knoxville)
Franklin County(Columbus)
Kent County(Grand Rapids)
Polk County(Des Moines)
Johnson County(Suburban
Kansas City)
Douglas County(Omaha)
Davis County(Suburban Ogden)
SpokaneCounty
(Spokane)
Hamilton County(Suburban
Indianapolis)
Ada County(Boise)
Summary of FindingsThis map
highlights
the most
well-positioned
markets in this
analysis.
RETHINKING RESILIENCE: LOCATION DRIVERS IN A SHIFTING MARKET LANDSCAPE | 2CBRE
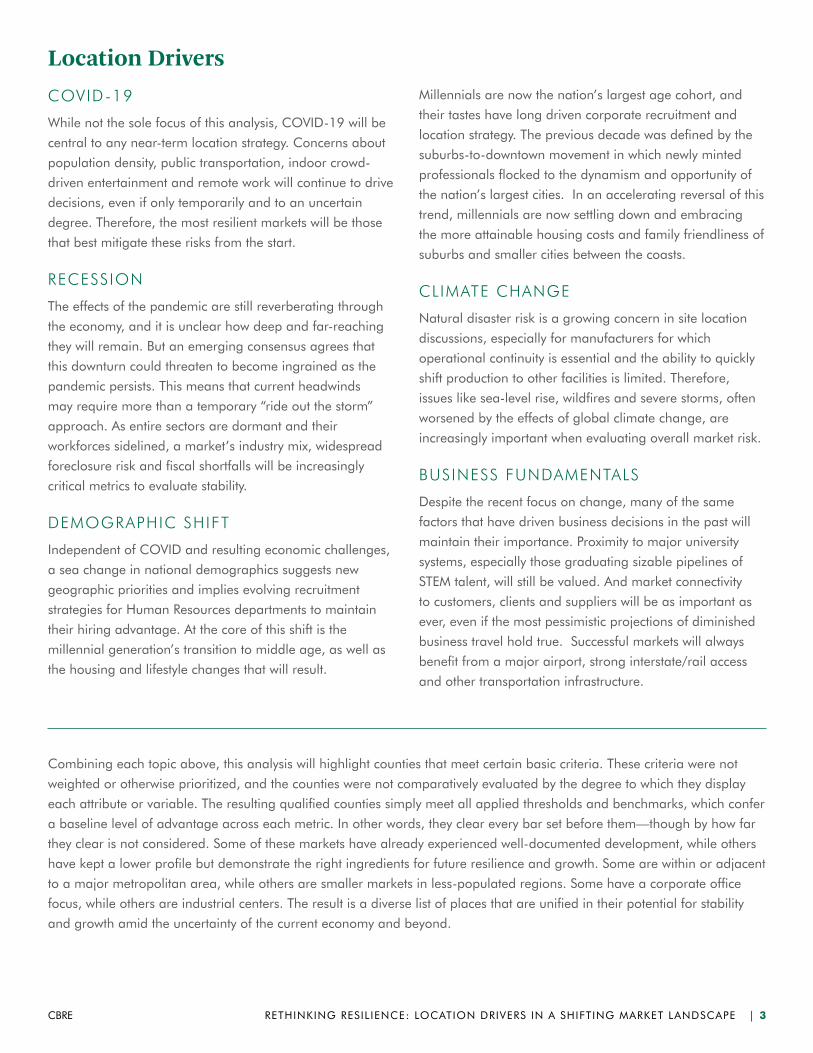
COVID-19
While not the sole focus of this analysis, COVID-19 will be
central to any near-term location strategy. Concerns about
population density, public transportation, indoor crowd-
driven entertainment and remote work will continue to drive
decisions, even if only temporarily and to an uncertain
degree. Therefore, the most resilient markets will be those
that best mitigate these risks from the start.
RECESSION
The effects of the pandemic are still reverberating through
the economy, and it is unclear how deep and far-reaching
they will remain. But an emerging consensus agrees that
this downturn could threaten to become ingrained as the
pandemic persists. This means that current headwinds
may require more than a temporary “ride out the storm”
approach. As entire sectors are dormant and their
workforces sidelined, a market’s industry mix, widespread
foreclosure risk and fiscal shortfalls will be increasingly
critical metrics to evaluate stability.
DEMOGRAPHIC SHIFT
Independent of COVID and resulting economic challenges,
a sea change in national demographics suggests new
geographic priorities and implies evolving recruitment
strategies for Human Resources departments to maintain
their hiring advantage. At the core of this shift is the
millennial generation’s transition to middle age, as well as
the housing and lifestyle changes that will result.
Millennials are now the nation’s largest age cohort, and
their tastes have long driven corporate recruitment and
location strategy. The previous decade was defined by the
suburbs-to-downtown movement in which newly minted
professionals flocked to the dynamism and opportunity of
the nation’s largest cities. In an accelerating reversal of this
trend, millennials are now settling down and embracing
the more attainable housing costs and family friendliness of
suburbs and smaller cities between the coasts.
CLIMATE CHANGE
Natural disaster risk is a growing concern in site location
discussions, especially for manufacturers for which
operational continuity is essential and the ability to quickly
shift production to other facilities is limited. Therefore,
issues like sea-level rise, wildfires and severe storms, often
worsened by the effects of global climate change, are
increasingly important when evaluating overall market risk.
BUSINESS FUNDAMENTALS
Despite the recent focus on change, many of the same
factors that have driven business decisions in the past will
maintain their importance. Proximity to major university
systems, especially those graduating sizable pipelines of
STEM talent, will still be valued. And market connectivity
to customers, clients and suppliers will be as important as
ever, even if the most pessimistic projections of diminished
business travel hold true. Successful markets will always
benefit from a major airport, strong interstate/rail access
and other transportation infrastructure.
Combining each topic above, this analysis will highlight counties that meet certain basic criteria. These criteria were not
weighted or otherwise prioritized, and the counties were not comparatively evaluated by the degree to which they display
each attribute or variable. The resulting qualified counties simply meet all applied thresholds and benchmarks, which confer
a baseline level of advantage across each metric. In other words, they clear every bar set before them—though by how far
they clear is not considered. Some of these markets have already experienced well-documented development, while others
have kept a lower profile but demonstrate the right ingredients for future resilience and growth. Some are within or adjacent
to a major metropolitan area, while others are smaller markets in less-populated regions. Some have a corporate office
focus, while others are industrial centers. The result is a diverse list of places that are unified in their potential for stability
and growth amid the uncertainty of the current economy and beyond.
Location Drivers
RETHINKING RESILIENCE: LOCATION DRIVERS IN A SHIFTING MARKET LANDSCAPE | 3CBRE
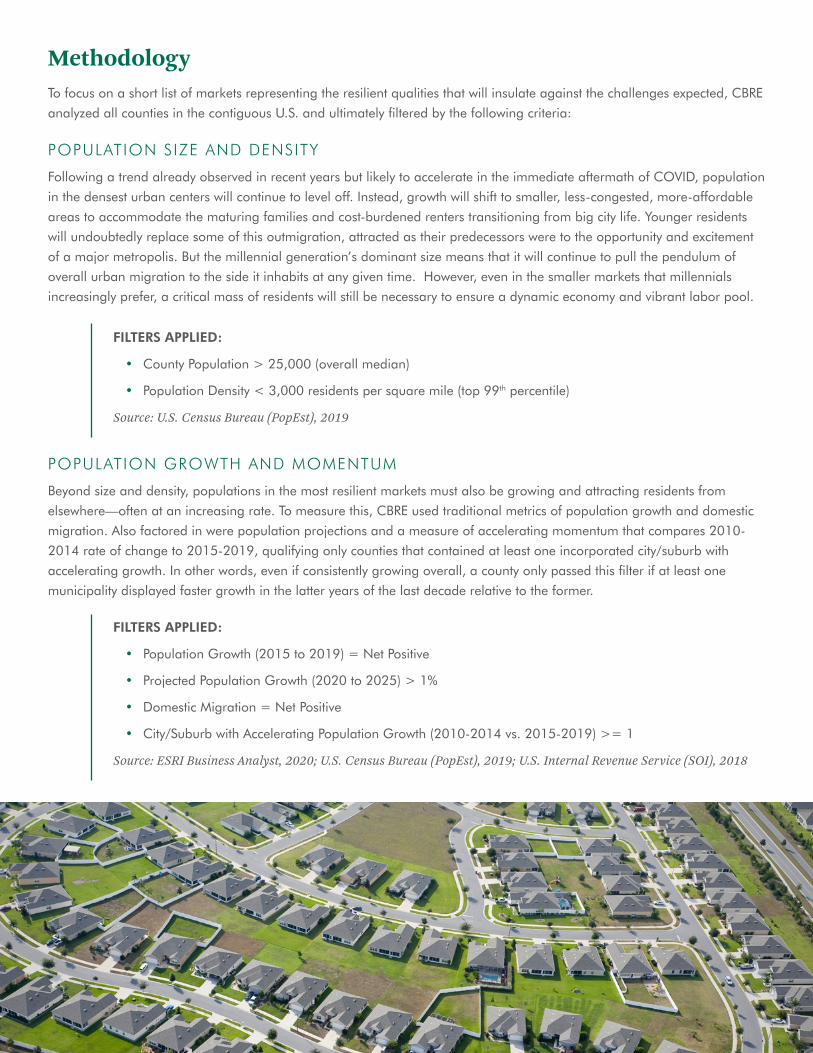
MethodologyTo focus on a short list of markets representing the resilient qualities that will insulate against the challenges expected, CBRE
analyzed all counties in the contiguous U.S. and ultimately filtered by the following criteria:
POPULATION SIZE AND DENSITY
Following a trend already observed in recent years but likely to accelerate in the immediate aftermath of COVID, population
in the densest urban centers will continue to level off. Instead, growth will shift to smaller, less-congested, more-affordable
areas to accommodate the maturing families and cost-burdened renters transitioning from big city life. Younger residents
will undoubtedly replace some of this outmigration, attracted as their predecessors were to the opportunity and excitement
of a major metropolis. But the millennial generation’s dominant size means that it will continue to pull the pendulum of
overall urban migration to the side it inhabits at any given time. However, even in the smaller markets that millennials
increasingly prefer, a critical mass of residents will still be necessary to ensure a dynamic economy and vibrant labor pool.
POPULATION GROWTH AND MOMENTUM
Beyond size and density, populations in the most resilient markets must also be growing and attracting residents from
elsewhere—often at an increasing rate. To measure this, CBRE used traditional metrics of population growth and domestic
migration. Also factored in were population projections and a measure of accelerating momentum that compares 2010-
2014 rate of change to 2015-2019, qualifying only counties that contained at least one incorporated city/suburb with
accelerating growth. In other words, even if consistently growing overall, a county only passed this filter if at least one
municipality displayed faster growth in the latter years of the last decade relative to the former.
FILTERS APPLIED:
• County Population > 25,000 (overall median)
• Population Density < 3,000 residents per square mile (top 99th percentile)
Source: U.S. Census Bureau (PopEst), 2019
FILTERS APPLIED:
• Population Growth (2015 to 2019) = Net Positive
• Projected Population Growth (2020 to 2025) > 1%
• Domestic Migration = Net Positive
• City/Suburb with Accelerating Population Growth (2010-2014 vs. 2015-2019) >= 1
Source: ESRI Business Analyst, 2020; U.S. Census Bureau (PopEst), 2019; U.S. Internal Revenue Service (SOI), 2018

PUBLIC TRANSIT DEPENDENCE
As pandemic fears linger and strained public budgets struggle to cover maintenance and operations, public transportation
systems are likely to suffer. Markets with minimal dependence on transit are likely to sidestep these risks.
HOUSING COSTS AND FORECLOSURE RISK
A key obstacle to livability is rapidly rising rents in many major cities—especially on the coasts—that are pushing residents
out to smaller, lower-cost metros where ownership is more attainable. Another is the risk of widespread foreclosures in
markets where large shares of homeowners are shouldering outsize debt burdens. To measure costs, housing outputs
were used from the Regional Price Parities (RPP) index from the U.S. Bureau of Economic Analysis. For debt burden and
foreclosure risk, mortgage data collected under the Home Mortgage Disclosure Act (HMDA) was analyzed to compare the
share of loans originated in 2019 to borrowers with debt-to-income (DTI) ratios higher than the standard target of 36% or
lower (meaning monthly debt payments compose 36% or less of gross income).
FILTERS APPLIED:
• Public Transit Usage < 3% of Total Commuters (U.S. Average)
Source: U.S. Census Bureau (5-Year ACS), 2018
FILTERS APPLIED:
• Metro Housing Costs < 90% of the U.S. Average
• Share of 36%+ DTI Loans < 105% of the U.S. Average
Source: Home Mortgage Disclosure Act (HMDA) Data, 2019; U.S. Bureau of Economic Analysis (RPP), 2018
-15.00% -10.00% -5.00% 0.00% 5.00% 10.00% 15.00% 20.00% 25.00% 30.00% 35.00%
COMPOUND ANNUAL GROWTH RATE (2010 - 2014)
-15.00% -10.00% -5.00% 0.00% 5.00% 10.00% 15.00% 20.00% 25.00% 30.00% 35.00%
COMPOUND ANNUAL GROWTH RATE (2015 - 2019)
0
20
40
60
80
100
120
140
160
180
200
220
MET
RO
HO
USI
NG
PR
ICE
IND
EX (
100 =
AV
ERA
GE)
5% Annual Growth 5% Annual Growth
CITY TYPECORE CITY
SUBURB
EXURB
ANNUAL CITY-LEVEL POPULATION GROWTH, RELATIVE TO METRO HOUSING COSTS (2010-2014 VS. 2015-2019)Source: CBRE Analysis of Data from the U.S. Bureau of Economic Analysis (RPP, 2018) and the U.S. Census Bureau (PopEst, 2019)
RETHINKING RESILIENCE: LOCATION DRIVERS IN A SHIFTING MARKET LANDSCAPE | 5CBRE
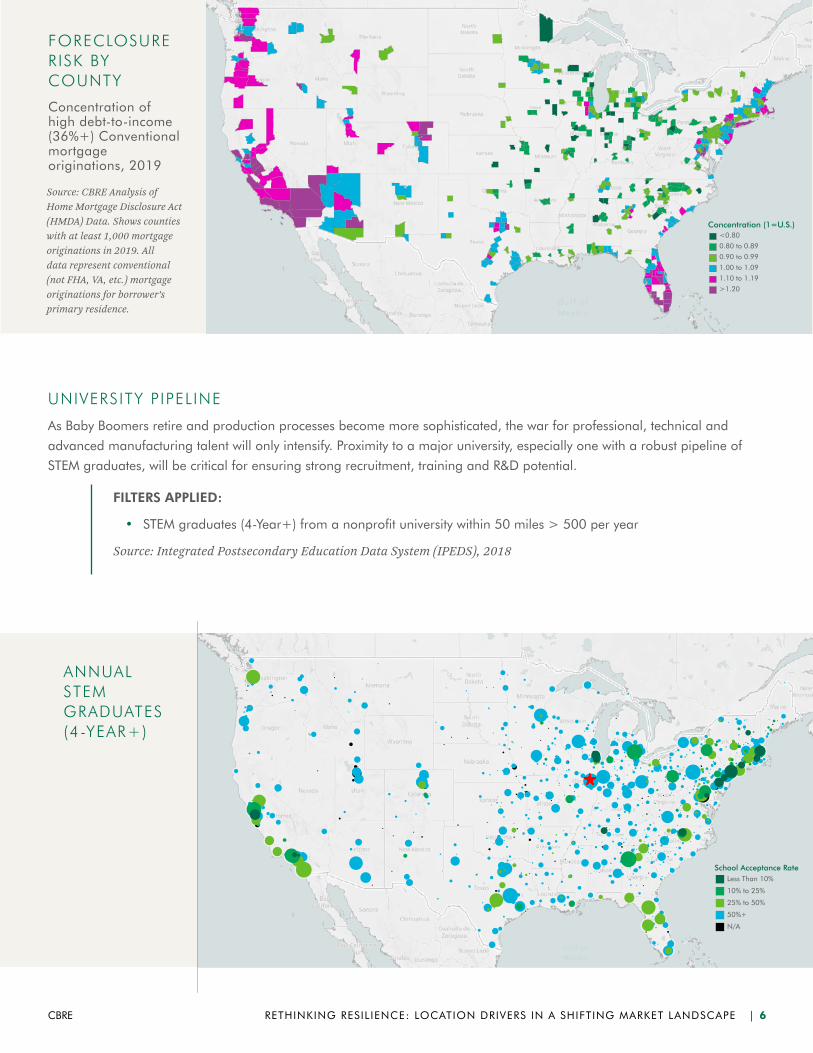
UNIVERSITY PIPELINE
As Baby Boomers retire and production processes become more sophisticated, the war for professional, technical and
advanced manufacturing talent will only intensify. Proximity to a major university, especially one with a robust pipeline of
STEM graduates, will be critical for ensuring strong recruitment, training and R&D potential.
FILTERS APPLIED:
• STEM graduates (4-Year+) from a nonprofit university within 50 miles > 500 per year
Source: Integrated Postsecondary Education Data System (IPEDS), 2018
School Acceptance RateLess Than 10%
10% to 25%
25% to 50%
50%+
N/A
ANNUAL STEM GRADUATES (4-YEAR+)
Concentration (1=U.S.)<0.80
0.80 to 0.89
0.90 to 0.99
1.00 to 1.09
1.10 to 1.19
>1.20
FORECLOSURE RISK BY COUNTY
Concentration of high debt-to-income (36%+) Conventional mortgage originations, 2019
Source: CBRE Analysis of Home Mortgage Disclosure Act (HMDA) Data. Shows counties with at least 1,000 mortgage originations in 2019. All data represent conventional (not FHA, VA, etc.) mortgage originations for borrower’s primary residence.
RETHINKING RESILIENCE: LOCATION DRIVERS IN A SHIFTING MARKET LANDSCAPE | 6CBRE

MAJOR AIRPORT ACCESS
Though business travel will likely be down for the near future, connectivity to markets, suppliers and other facilities within a
corporate footprint will remain essential. Regardless of the pandemic’s immediate effects on air travel, markets will continue
to benefit from proximity to a major airport.
INDUSTRY MIX
The intermittent shutdowns and shifting demand caused by the pandemic have touched every corner of the economy.
However, some industries—like hospitality, entertainment, retail, construction and real estate—have been more adversely
affected than others. Regardless of how long the pending recovery takes, these sectors present more risk in the near term.
FILTERS APPLIED:
• Annual Passengers Served from Airport(s) Within 50 Miles > 1 million
Source: U.S. Bureau of Transportation Statistics, 2019
FILTERS APPLIED:
• Concentration of Jobs in Accommodation/Food Service; Arts/Entertainment/Recreation; Construction; Real Estate; and Retail < 110% of the U.S. Average (LQ < 1.1)
Source: ESRI Business Analyst, 2020
Annual PassengersMore Than 10,000,000
5,000,001 to 10,000,000
1,000,001 to 5,000,000
500,001 to 1,000,000
Fewer Than 500,000
ANNUAL DOMESTIC PASSENGERS SERVED BY AIRPORTS WITHIN 50 MILES
RETHINKING RESILIENCE: LOCATION DRIVERS IN A SHIFTING MARKET LANDSCAPE | 7CBRE

CLIMATE
The accelerating effects of global climate change have literally altered the landscape, disrupting established weather
patterns and worsening natural disaster risk. The impact has been especially evident in the recent proliferation and intensity
of wildfires and hurricanes—as well as coastal flooding threats due to sea level rise.
To measure wildfire risk, the perimeter of every domestic fire between 2010 and 2019 was mapped—and the area of this
footprint was compared to total county area. On average, roughly 0.75% of each county’s area has burned since 2010—
that figure jumps to 2.7% when including only counties with at least one fire. However, 63 counties have experienced fires
that collectively burned 10% or more of their total area since 2010.
To measure hurricane risk, every Atlantic hurricane and tropical storm between 1851 and 2019 was mapped and
compared to a 100-mile buffer from the center of each county. Total hurricanes within 100 miles were aggregated and
compared across all counties.
To measure sea level rise, NOAA data for Coastal Flooding Impact areas was used to identify counties that present flooding
risk as global water levels increase.
FILTERS APPLIED:
• Wildfire Perimeter Since 2010 < 7.5% of Total County Area (10x Footprint of Average of County Impact)
• Hurricanes or Tropical Storms Since 1851 <=15 (Median Among Counties Affected by at Least 1 Storm)
• Counties with a Coastal Impact Area Excluded
Source: National Interagency Fire Center (Historic Wildfire Perimeters), 2019; National Oceanic and Atmospheric Administration, 2019
HISTORIC WILDFIRE PERIMETERS AND HURRICANE TRACKS
Dots represent location (including movement at 6-hour intervals) of all known hurricanes and tropical storms between 1851 and 2019.
RETHINKING RESILIENCE: LOCATION DRIVERS IN A SHIFTING MARKET LANDSCAPE | 8CBRE
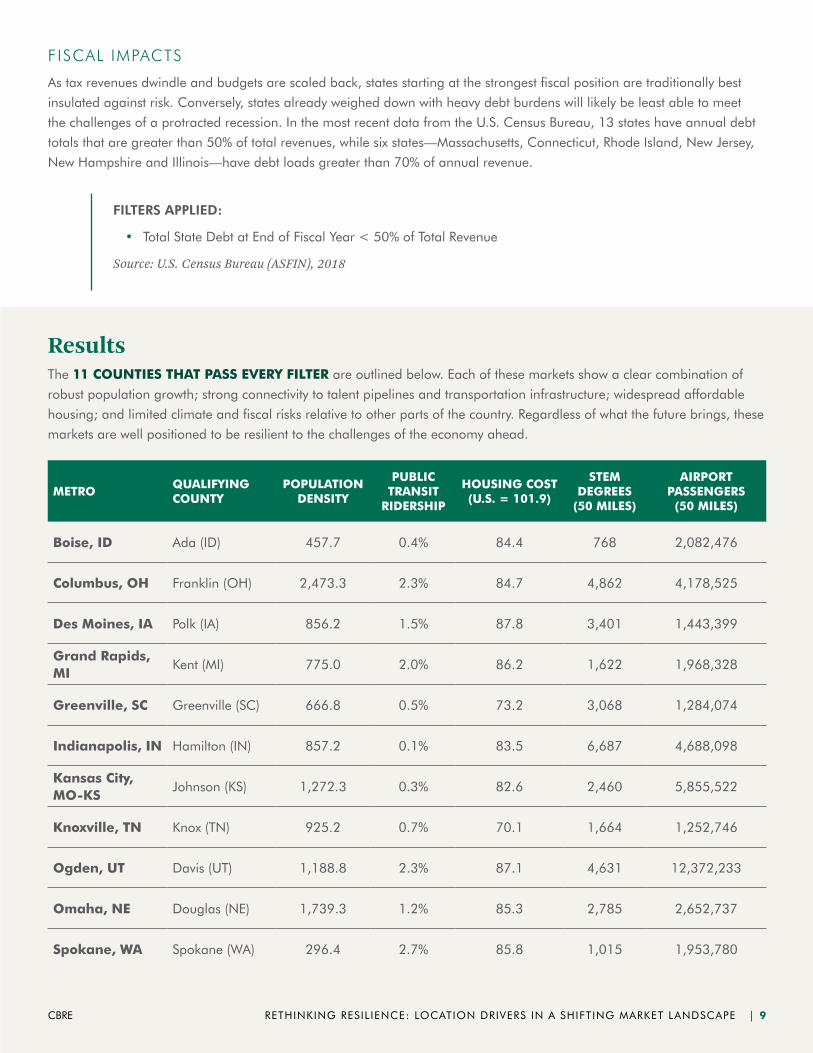
FISCAL IMPACTS
As tax revenues dwindle and budgets are scaled back, states starting at the strongest fiscal position are traditionally best
insulated against risk. Conversely, states already weighed down with heavy debt burdens will likely be least able to meet
the challenges of a protracted recession. In the most recent data from the U.S. Census Bureau, 13 states have annual debt
totals that are greater than 50% of total revenues, while six states—Massachusetts, Connecticut, Rhode Island, New Jersey,
New Hampshire and Illinois—have debt loads greater than 70% of annual revenue.
ResultsThe 11 COUNTIES THAT PASS EVERY FILTER are outlined below. Each of these markets show a clear combination of
robust population growth; strong connectivity to talent pipelines and transportation infrastructure; widespread affordable
housing; and limited climate and fiscal risks relative to other parts of the country. Regardless of what the future brings, these
markets are well positioned to be resilient to the challenges of the economy ahead.
FILTERS APPLIED:
• Total State Debt at End of Fiscal Year < 50% of Total Revenue
Source: U.S. Census Bureau (ASFIN), 2018
METROQUALIFYING COUNTY
POPULATION DENSITY
PUBLIC TRANSIT
RIDERSHIP
HOUSING COST (U.S. = 101.9)
STEM DEGREES
(50 MILES)
AIRPORT PASSENGERS
(50 MILES)
Boise, ID Ada (ID) 457.7 0.4% 84.4 768 2,082,476
Columbus, OH Franklin (OH) 2,473.3 2.3% 84.7 4,862 4,178,525
Des Moines, IA Polk (IA) 856.2 1.5% 87.8 3,401 1,443,399
Grand Rapids, MI
Kent (MI) 775.0 2.0% 86.2 1,622 1,968,328
Greenville, SC Greenville (SC) 666.8 0.5% 73.2 3,068 1,284,074
Indianapolis, IN Hamilton (IN) 857.2 0.1% 83.5 6,687 4,688,098
Kansas City, MO-KS
Johnson (KS) 1,272.3 0.3% 82.6 2,460 5,855,522
Knoxville, TN Knox (TN) 925.2 0.7% 70.1 1,664 1,252,746
Ogden, UT Davis (UT) 1,188.8 2.3% 87.1 4,631 12,372,233
Omaha, NE Douglas (NE) 1,739.3 1.2% 85.3 2,785 2,652,737
Spokane, WA Spokane (WA) 296.4 2.7% 85.8 1,015 1,953,780
RETHINKING RESILIENCE: LOCATION DRIVERS IN A SHIFTING MARKET LANDSCAPE | 9CBRE

Contact CBRE’s Location Incentives Group to evaluate your location strategy and potential incentives savings for your footprint.
TEDD CARRISONSenior Financial Analyst, Location Incentives+1 312 935 [email protected]
Learn more about CBRE Location Incentives.
CBRE © 2020 All Rights Reserved. All information included in this document pertaining to CBRE—including but not limited to its operations, employees, technology and clients—are proprietary and confidential, and are supplied with the understanding that they will be held in confidence and not disclosed to third parties without the prior written consent of CBRE. This document is intended solely as a preliminary expression of general intentions and is to be used for discussion purposes only. The parties intend that neither shall have any contractual obligations to the other with respect to the matters referred herein unless and until a definitive agreement has been fully executed and delivered by the parties. This document does not constitute a warranty, results may vary depending on specific circumstances. The parties agree that this document is not intended to create any agreement or obligation by either party to negotiate a definitive lease/purchase and sale agreement and imposes no duty whatsoever on either party to continue negotiations, including without limitation any obligation to negotiate in good faith or in any way other than at arm’s length. Prior to delivery of a definitive executed agreement, and without any liability to the other party, either party may (1) propose different terms from those summarized herein, (2) enter into negotiations with other parties and/or (3) unilaterally terminate all negotiations with the other party hereto. This document is not intended to constitute legal advice. CBRE does not provide legal advice and clients should consult with their own attorneys should they have any questions about their legal obligations. Some proposed activities could involve lobbying.