RETHINKING M BILITY - Princeton Universityalaink/SmartDrivingCars/PDFs/Rethinking... · INSIDE:...
64
INSIDE: Private Company Ecosystem RETHINKING M BILITY Goldman Sachs does and seeks to do business with companies covered in its research reports. As a result, investors should be aware that the firm may have a conflict of interest that could affect the objectivity of this report. Investors should consider this report as only a single factor in making their investment decision. For Reg AC certification and other important disclosures, see the Disclosure Appendix, or go to www.gs.com/research/hedge.html. Analysts employed by non-US affiliates are not registered/qualified as research analysts with FINRA in the U.S. The Goldman Sachs Group, Inc. EQUITY RESEARCH | May 23, 2017 The c.$7 tn global mobility market is speeding into the era of the “pay-as-you-go” car. Ride-hailing services such as Uber and Didi are pioneering a ‘cloud’ mobility system, which is using data to change how the wealthiest cities move. In Rethinking Mobility, we model how the ride-hailing opportunity can grow to $285 bn by 2030, and is the precursor to a broader technological and social transformation. We examine how the market might live up to the high valuations of its pioneers, why car sales may prove surprisingly resilient despite the change, and where automakers have a chance to transform their profitability as operators of fleets of autonomous cars. Stefan Burgstaller +44 20 7552-5784 [email protected] Goldman Sachs International Demian Flowers +44 20 7552-9374 demian.fl[email protected] Goldman Sachs International David Tamberrino, CFA +1 212 357-7617 [email protected] Goldman Sachs and Co. LLC Heath P. Terry, CFA +1 212 357-1849 [email protected] Goldman Sachs and Co. LLC Yipeng Yang +86(10)6627-3189 [email protected] Beijing Gao Hua Securities Company Limited The ‘pay-as-you-go’ car: Ride hailing just the start
Transcript of RETHINKING M BILITY - Princeton Universityalaink/SmartDrivingCars/PDFs/Rethinking... · INSIDE:...
INSIDE:
Private Company Ecosystem
RETHINKING M BILITY
Goldman Sachs does and seeks to do business with companies covered in its research reports. As aresult, investors should be aware that the firm may have a conflict of interest that could affect theobjectivity of this report. Investors should consider this report as only a single factor in making theirinvestment decision. For Reg AC certification and other important disclosures, see the DisclosureAppendix, or go to www.gs.com/research/hedge.html. Analysts employed by non-US affiliates are notregistered/qualified as research analysts with FINRA in the U.S.
The Goldman Sachs Group, Inc.
EQUITY RESEARCH | May 23, 2017
The c.$7 tn global mobility market is speeding into the era of the“pay-as-you-go” car. Ride-hailing services such as Uber and Didi arepioneering a ‘cloud’ mobility system, which is using data to changehow the wealthiest cities move. In Rethinking Mobility, we modelhow the ride-hailing opportunity can grow to $285 bn by 2030, and isthe precursor to a broader technological and social transformation.We examine how the market might live up to the high valuations ofits pioneers, why car sales may prove surprisingly resilient despitethe change, and where automakers have a chance to transform theirprofitability as operators of fleets of autonomous cars.
Stefan Burgstaller+44 20 [email protected] Sachs International
Demian Flowers+44 20 [email protected] Sachs International
David Tamberrino, CFA+1 212 [email protected] Sachs and Co. LLC
Heath P. Terry, CFA+1 212 [email protected] Sachs and Co. LLC
Yipeng Yang+86(10)[email protected] Beijing Gao Hua Securities Company Limited
The ‘pay-as-you-go’ car: Ride hailing just the start
May 23, 2017 Global: Automobiles
Goldman Sachs Global Investment Research 2
Contents
Portfolio managers’ summary 3
Pay-as-you-go mobility: Our ride-hailing market forecasts 7
‘Pay-as-you-go’ mobility: Car usage separating from ownership 8
Bear and bull scenarios 14
Emerging mobility models: Venture backing developments 17
The new ecosystem: Ride hailers are ‘optimizers’ of assets 18
Venture Capital Horizons: Today, private companies are leading the charge 20
Future of mobility services: highlighting the developments by key players 21
The new ecosystem: Autonomous the future battleground 23
The ride hailer-driver relationship will likely ultimately unwind 24
The biggest revenue pool in new mobility: Autonomous fleets 27
Autonomous fleets are potentially transformative for OEMs 28
Tech companies likely have a different vision 30
Regional considerations: Cities ripe for disruption 35
Regional variations in urban mobility 36
GS Urban Mobility Change Matrix 38
Car market impact: Ownership to survive, sales to hold firm 43
Ride-hailing impact on private car ownership 44
Private car penetration to decline but not collapse 47
Sizing the ride-hailing market: Further thoughts 49
Enablers of the ride-hailing revolution 51
BMW (BMWG.DE): Gearing up for iNEXT 52
Daimler (DAIGn.DE): Balancing breadth with focus 52
Ford (F): Smart mobility beginning with Chariot 53
GM (GM): Taking services seriously: Lyft among key partners 53
Tesla Inc. (TSLA): Pushing on with self-driving 54
Toyota (7203.T): Mobility Services Platform building broad ties 54
Volkswagen (VOWG_p.DE): MOIA unit playing on various fronts 55
Delphi (DLPH): AV research includes self-driving pilot programs 55
Didi Chuxing (privately held): Leading in China 56
Gett: Euro-centric, with VW as a partner 56
Lyft: Powerful partners in Waymo and GM 57
Uber (privately held): The ride-hailing leader 57
Avis (CAR): Fleet aspirations with Zipcar 58
Hertz (HTZ): Partnering with the ride hailers 59
Alphabet (GOOGL): Waymo seeks to monetize autonomous tech 59
Valuation methodology and risks 60
Disclosure Appendix 61 Prices in this report are based on the market close of May 22, 2017.
Other contributing authors: Alexander Duval, Kota Yuzawa, Piyush Mubayi, Heather
Bellini, Simona Jankowski and Gungun Verma.
May 23, 2017 Global: Automobiles
Goldman Sachs Global Investment Research 3
Portfolio managers’ summary
Cloud mobility: Disentangling usage from ownership
The global mobility market is worth $7.0 tn and growing: The global mobility market
(ground transportation, i.e. on cars and mass transit) is growing, fueled by population
growth and intensified by urbanization. At the same time, the private car is running out of
space, with congestion, pollution, low utilization levels and a rising cost of ownership all
weighing on its viability.
‘Cloud’ mobility businesses are changing how cities move: The assumption that we
need to own the vehicle in which we travel is dissolving. Cloud mobility services (in effect
invented by Uber, Didi Chuxing and peers) are emerging, disentangling ownership from
usage, improving vehicle utilization and driving costs of mobility down.
On our market sizing analysis, ride hailing is set to overtake and ultimately eclipse
taxi markets: In select cities, the ride-hailing market is already outsizing the local taxi
market by multiple times. San Francisco (the birthplace of ride hailing) is the most
progressive example (ride hailing is >4x its local taxi market). But on a global basis, it is early
days: the taxi market ($108 bn) is still 2.9x larger than today’s ride-hailing market ($36 bn).
We expect the ride-hailing market to grow eightfold to $285 bn in 2030: Rapid growth
has already occurred (c.120% yoy in 2016 from $16 bn in 2015). Our ride-hailing market
estimate of $285 bn (with bear and bull scenarios of $177 bn and $492 bn respectively) is
derived by thinking about how big the ride-hailing opportunity could be relative to today’s
local taxi markets: we assume it is four times larger in tier 1 cities (as per San Francisco
today), three times in tier 2, and two times in tier 3 (see page 11 for details of city tiering).
In our forecasts, we assume ride-hailing companies themselves would take a 23%
commission on gross market revenues, i.e. $65 bn in 2030.
The cloud mobility ecosystem is attracting capital
We focus in this report on ride hailing (e.g. Uber, Didi and Lyft), but many business model
variants are vying for share, for example smart shuttle bus services (such as Via and Chariot)
and various types of car-sharing services (e.g. Car2go, ZipCar, Maven and Turo).
We monitor this via our Venture Capital Horizons work: private companies are targeting
new urban mobility business opportunities through a diverse set of models including car
sharing, ride-hailing and intermodal ‘aggregator’ services. We highlight 20 companies that
have collectively attracted $36 bn in funding: the common thread running through them
is improving asset utilization of vehicles.
Autonomy: The trigger to transform the ecosystem
We believe the relationship between ride hailers and drivers will ultimately unwind… Autonomous cars may significantly disrupt the current ride-hailing ecosystem, opening up
new risks for today’s winners. Drivers’ influence over business models today is such that
their removal can quickly alter the competitive landscape. Ride hailers’ cost of expansion (i.e.
hiring or subsidizing drivers) is a significant contributor to the lack of operating profit in the
segment today: ultimately, fully autonomous vehicles have the potential to supplant 6.2 mn
drivers from the workforce.
This report is the latest
in a series exploring the
mega-trends shaping
the next era of the
Automotive Age. See
the full series on our
dedicated webpage or
check out our summary
infographic on the topic.
May 23, 2017 Global: Automobiles
Goldman Sachs Global Investment Research 4
…Opening up the biggest revenue pool in new mobility: Autonomous fleets. The
business opportunity of providing autonomous fleets to ride hailers would open up a new
and even bigger revenue pool than that of ride hailing itself: we estimate $220 bn by
2030, up to 3.4x bigger than the ride-hailer revenue opportunity at that point. We model
a scenario in which a fleet manager could generate profit of $14k per car over three years,
nine times what an OEM currently makes from selling a car.
Autonomous fleets are potentially transformative for OEMs: If OEMs can provide self-
driving technology through their assembly lines, they can create autonomous fleet
management businesses that would improve their margins, reduce cyclicality and
potentially improve (currently weak) investor sentiment towards them. Regional coverage
will be important for OEMs entering mobility services, possibly a factor behind all recent
automotive industry consolidation being intra-regional in nature (e.g. GM’s withdrawal
from Europe, PSA’s acquisition of Opel, Nissan’s purchase of a stake in Mitsubishi and
Toyota’s takeover of Daihatsu).
Tech companies likely have a different vision: One in which they evolve from being
suppliers (to OEMs) into customers (of OEMs), installing equipment into cars and
potentially resulting in ‘Foxconn-ification’ for certain OEMs, i.e. the loss of control over
their own product differentiation.
Autonomy will also remove the ride hailers’ growth shackles in several key ways: (1)
Eliminating driver subsidies, thereby reducing operating costs; (2) facilitating
geographic expansion by making it easier to co-locate supply with demand (by simply
moving the car); and (3) reducing regulatory challenges around employment contracts and
worker rights. Autonomous cars bring risks too, creating an opportunity for new market
participants. We do not envisage ride-hailing companies trying to buy or build their own
autonomous fleets given that they prize their current asset efficiency.
We do not believe autonomy heralds cheap mobility: This is because savings from the
removal of the driver would for the most part not accrue to customers, as they would be
absorbed by the cost of operating fleets. In addition, the scope to further improve the asset
utilization of ride-hailing vehicles is finite. We also see the risk of additional taxes on ride
hailing as authorities seek to replace taxes lost from challenged taxi industries.
Cities will feel the change
Our GS Urban Mobility Change Matrix reveals the cities where change could be
strongest. We analyze the 100 wealthiest cities, and find that those likely to feel change
most acutely are the ones where push factors (pollution, heavy traffic) and pull factors
(wealthy cities with low private car penetration and utilization) intersect. Many Asian
megacities screen as ready for disruption, with a secondary group of primarily US and
European cities identified as ‘willing adopters’.
Regional champions: Ride hailers seem to be developing as regional champions (e.g. Didi
in China, Uber and Lyft in the US), with regulatory factors (employment laws and other
regulations) still leaving significant question marks over whether and how mobility in
continental Europe might evolve.
May 23, 2017 Global: Automobiles
Goldman Sachs Global Investment Research 5
We expect car ownership to survive
2030E: Cars on the road peaking…but sales holding firm: Population and GDP growth
mean the big-city car population is likely to keep rising. Only on our most bullish change
scenario do we see alternative mobility concepts growing fast enough to cause a decline in
the tier 1 and 2 cities’ car parc by 2030. Car sales volumes on the other hand are likely to be
stable even if the parc declines. This is because shared cars will be utilized more, and thus
replaced more frequently.
Car ownership may prove surprisingly resilient: Overall, we forecast a stable global
car parc of 1.2 bn cars in 2030 vs. 1.1 bn today, with global car sales slightly higher at 100
mn vs. 87 mn today – in contrast to the commonly held view that declining private car
usage among younger drivers heralds a structural decline in car ownership.
The purchase decision is separate from the usage decision: To buy a car does not mean
to always go by car. Urban dwellers may choose mobility services more often (e.g. for
convenience, or to avoid expensive town center parking), but retain their own cars even
though they drive them less frequently. Elements of car ownership are completely non-
substitutable (e.g. security, optionality, status). Separately but importantly, the desire to
own a car is still strong in developing markets.
Top 10 Takeaways
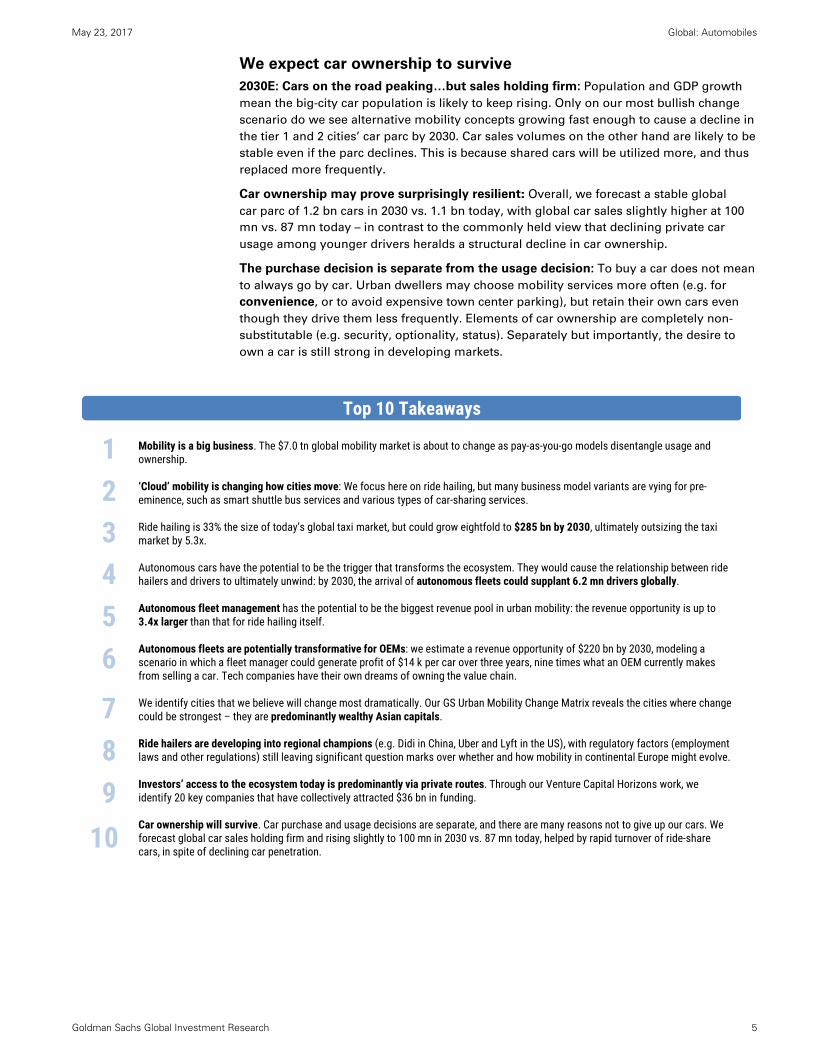
Mobility is a big business. The $7.0 tn global mobility market is about to change as pay-as-you-go models disentangle usage and ownership.
‘Cloud’ mobility is changing how cities move: We focus here on ride hailing, but many business model variants are vying for pre-eminence, such as smart shuttle bus services and various types of car-sharing services.
Ride hailing is 33% the size of today’s global taxi market, but could grow eightfold to $285 bn by 2030, ultimately outsizing the taxi market by 5.3x.
Autonomous cars have the potential to be the trigger that transforms the ecosystem. They would cause the relationship between ride hailers and drivers to ultimately unwind: by 2030, the arrival of autonomous fleets could supplant 6.2 mn drivers globally.
Autonomous fleet management has the potential to be the biggest revenue pool in urban mobility: the revenue opportunity is up to 3.4x larger than that for ride hailing itself.
Autonomous fleets are potentially transformative for OEMs: we estimate a revenue opportunity of $220 bn by 2030, modeling a scenario in which a fleet manager could generate profit of $14 k per car over three years, nine times what an OEM currently makes from selling a car. Tech companies have their own dreams of owning the value chain.
We identify cities that we believe will change most dramatically. Our GS Urban Mobility Change Matrix reveals the cities where change could be strongest – they are predominantly wealthy Asian capitals.
Ride hailers are developing into regional champions (e.g. Didi in China, Uber and Lyft in the US), with regulatory factors (employment laws and other regulations) still leaving significant question marks over whether and how mobility in continental Europe might evolve.
Investors’ access to the ecosystem today is predominantly via private routes. Through our Venture Capital Horizons work, we identify 20 key companies that have collectively attracted $36 bn in funding.
Car ownership will survive. Car purchase and usage decisions are separate, and there are many reasons not to give up our cars. We forecast global car sales holding firm and rising slightly to 100 mn in 2030 vs. 87 mn today, helped by rapid turnover of ride-share cars, in spite of declining car penetration.
1
234
5
6
7
8
9
10
Rethinking Mobility in Numbers
Ride-Hailing Opportunity
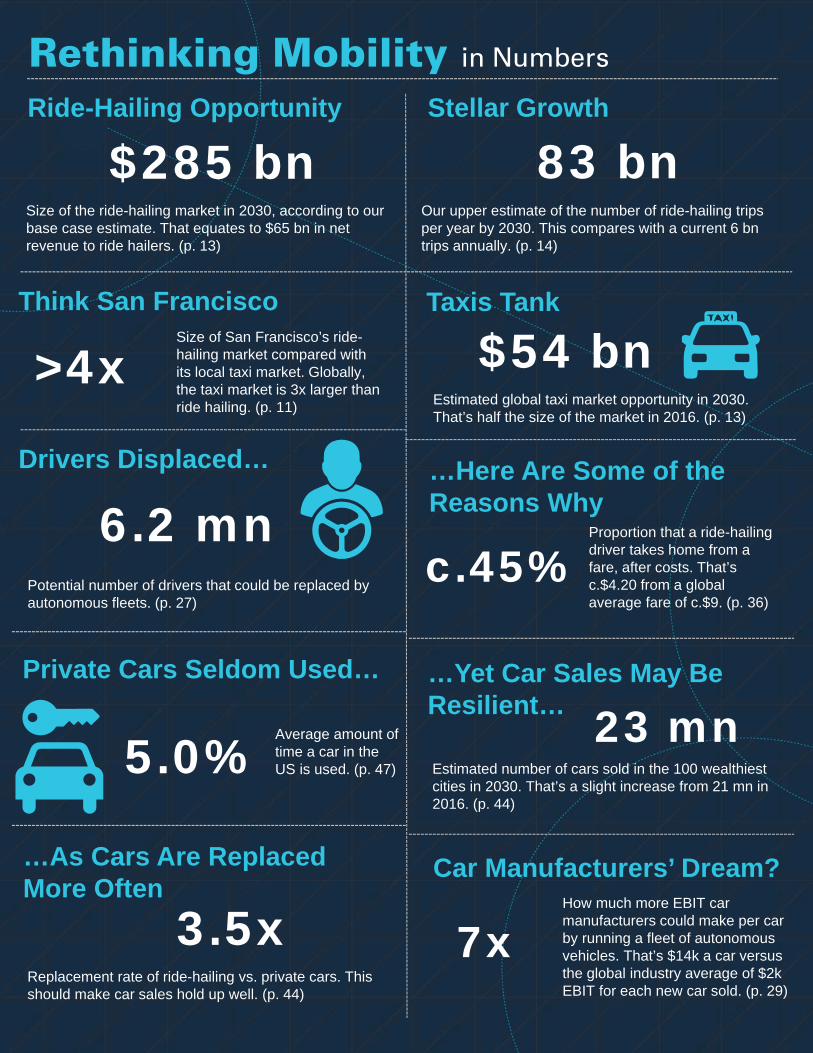
$285 bnSize of the ride-hailing market in 2030, according to our base case estimate. That equates to $65 bn in net revenue to ride hailers. (p. 13)
Think San Francisco
>4xSize of San Francisco’s ride-hailing market compared with its local taxi market. Globally, the taxi market is 3x larger than ride hailing. (p. 11)
Drivers Displaced…
6.2 mnPotential number of drivers that could be replaced by autonomous fleets. (p. 27)
Private Cars Seldom Used…
5.0%Average amount of time a car in the US is used. (p. 47)
…As Cars Are Replaced More Often
3.5xReplacement rate of ride-hailing vs. private cars. This should make car sales hold up well. (p. 44)
Stellar Growth
83 bnOur upper estimate of the number of ride-hailing trips per year by 2030. This compares with a current 6 bn trips annually. (p. 14)
Taxis Tank
$54 bnEstimated global taxi market opportunity in 2030. That’s half the size of the market in 2016. (p. 13)
c.45%Proportion that a ride-hailing driver takes home from a fare, after costs. That’s c.$4.20 from a global average fare of c.$9. (p. 36)
…Here Are Some of the Reasons Why
23 mnEstimated number of cars sold in the 100 wealthiest cities in 2030. That’s a slight increase from 21 mn in 2016. (p. 44)
…Yet Car Sales May Be Resilient…
7xHow much more EBIT car manufacturers could make per car by running a fleet of autonomous vehicles. That’s $14k a car versus the global industry average of $2k EBIT for each new car sold. (p. 29)
Car Manufacturers’ Dream?
Pay-as-you-go mobility Our ride-hailing market forecasts
Our base case: $285 bn market by 2030E (p. 13)
The bull and bear scenarios: What to expect if adoption is unexpected (p. 14)
Potential bottlenecks: Regulatory obstacles, lower-than-expected demand,
lack of willing drivers, worsening traffic, shift to other mobility options (p. 16)
May 23, 2017 Global: Automobiles
Goldman Sachs Global Investment Research 8
‘Pay-as-you-go’ mobility: Car usage separating from ownership
The c.$7.0 tn global mobility market is already changing profoundly in the largest,
wealthiest cities. As we pay-as-we-go, a ‘cloud’ mobility service system is emerging,
disentangling ownership from usage. In San Francisco, ride hailing is >4x bigger than
the local taxi market, indicating the potential for the service. If all global tier 1 cities (see
page 11 for details of city tiering) fostered ride-hailing businesses 4x the size of their
local taxi markets (with lower multiples in tier 2, 3 and 4 cities), ride hailing could grow
eightfold to $285 bn in 2030 (versus today’s taxi market worth >$100 bn): this is the
base case used in our analysis. We frame our estimate with bear ($177 bn) and bull
($492 bn) scenarios, and discuss sensitivities around other variables such as overall
societal mobility demand, uptake of ‘pooling’, and last-mile services.
Total mobility market of c.$7.0 tn...and growing
Whether for work, education, shopping or simply to visit friends, people want and need to
travel. Globally, we spend $7 tn each year on ‘mobility ‘, including buying and running cars,
and various forms of public transport (excluding air travel).
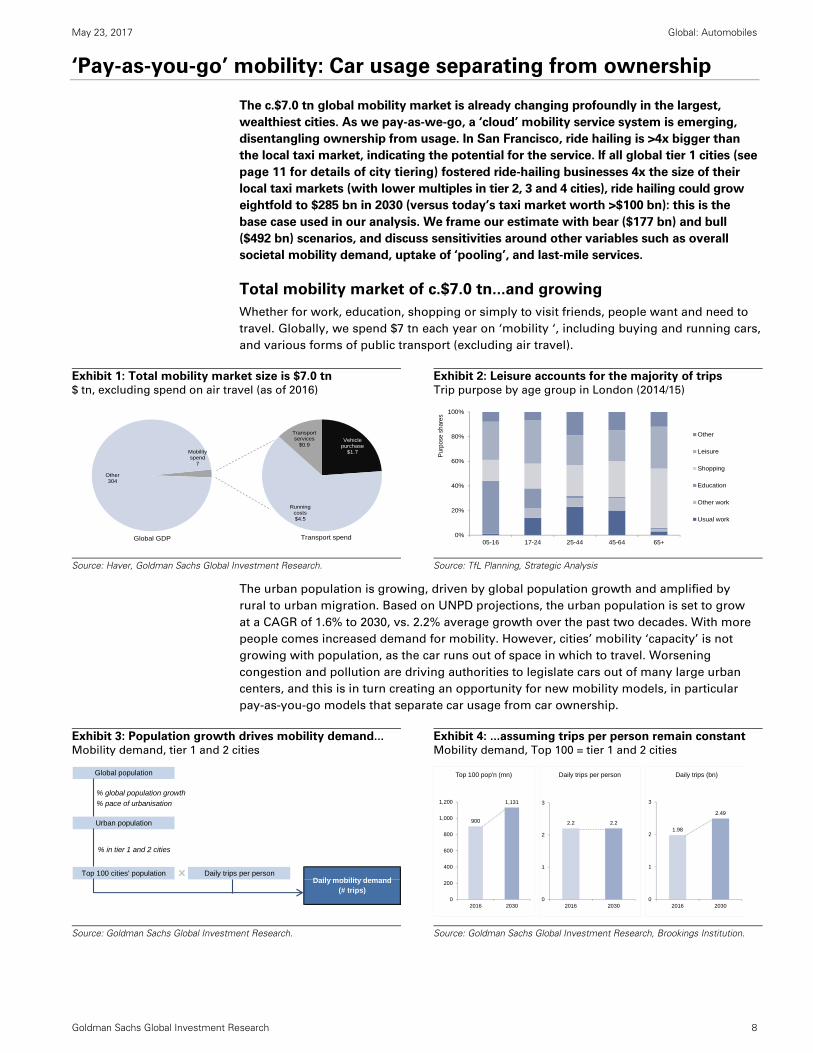
Exhibit 1: Total mobility market size is $7.0 tn $ tn, excluding spend on air travel (as of 2016)
Exhibit 2: Leisure accounts for the majority of trips Trip purpose by age group in London (2014/15)
Source: Haver, Goldman Sachs Global Investment Research. Source: TfL Planning, Strategic Analysis
The urban population is growing, driven by global population growth and amplified by
rural to urban migration. Based on UNPD projections, the urban population is set to grow
at a CAGR of 1.6% to 2030, vs. 2.2% average growth over the past two decades. With more
people comes increased demand for mobility. However, cities’ mobility ‘capacity’ is not
growing with population, as the car runs out of space in which to travel. Worsening
congestion and pollution are driving authorities to legislate cars out of many large urban
centers, and this is in turn creating an opportunity for new mobility models, in particular
pay-as-you-go models that separate car usage from car ownership.
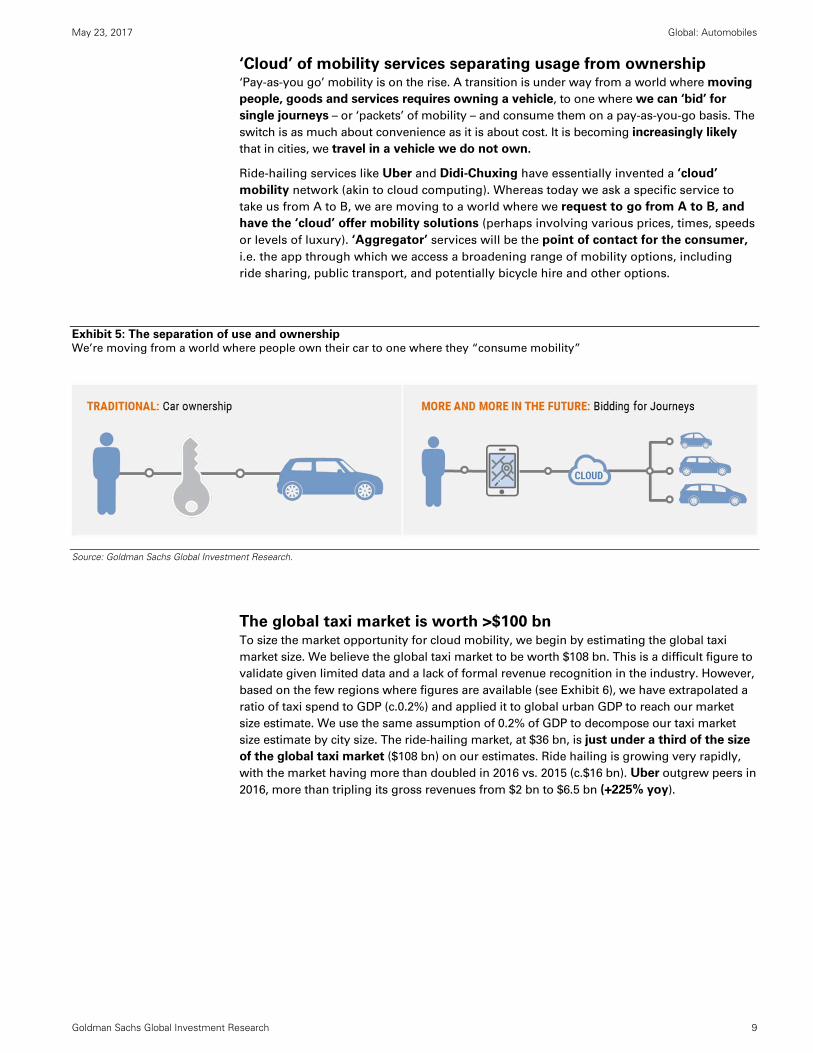
Exhibit 3: Population growth drives mobility demand... Mobility demand, tier 1 and 2 cities
Exhibit 4: ...assuming trips per person remain constant Mobility demand, Top 100 = tier 1 and 2 cities
Source: Goldman Sachs Global Investment Research. Source: Goldman Sachs Global Investment Research, Brookings Institution.
Mobility spend
7
Other304
Vehicle purchase
$1.7
Running costs$4.5
Transport services
$0.9
Global GDP Transport spend 0%
20%
40%
60%
80%
100%
05-16 17-24 25-44 45-64 65+
Pur
pose
sha
res
Other
Leisure
Shopping
Education
Other work
Usual work
Global population
Urban population
Top 100 cities' population Daily trips per personDaily mobility demand
(# trips)
% global population growth
% pace of urbanisation
% in tier 1 and 2 cities
900
1,131
0
200
400
600
800
1,000
1,200
2016 2030
Top 100 pop'n (mn)
2.2 2.2
0
1
2
3
2016 2030
Daily trips per person
1.98
2.49
0
1
2
3
2016 2030
Daily trips (bn)
May 23, 2017 Global: Automobiles
Goldman Sachs Global Investment Research 9
‘Cloud’ of mobility services separating usage from ownership ‘Pay-as-you go’ mobility is on the rise. A transition is under way from a world where moving
people, goods and services requires owning a vehicle, to one where we can ‘bid’ for
single journeys – or ‘packets’ of mobility – and consume them on a pay-as-you-go basis. The
switch is as much about convenience as it is about cost. It is becoming increasingly likely
that in cities, we travel in a vehicle we do not own.
Ride-hailing services like Uber and Didi-Chuxing have essentially invented a ‘cloud’ mobility network (akin to cloud computing). Whereas today we ask a specific service to
take us from A to B, we are moving to a world where we request to go from A to B, and
have the ‘cloud’ offer mobility solutions (perhaps involving various prices, times, speeds
or levels of luxury). ‘Aggregator’ services will be the point of contact for the consumer,
i.e. the app through which we access a broadening range of mobility options, including
ride sharing, public transport, and potentially bicycle hire and other options.
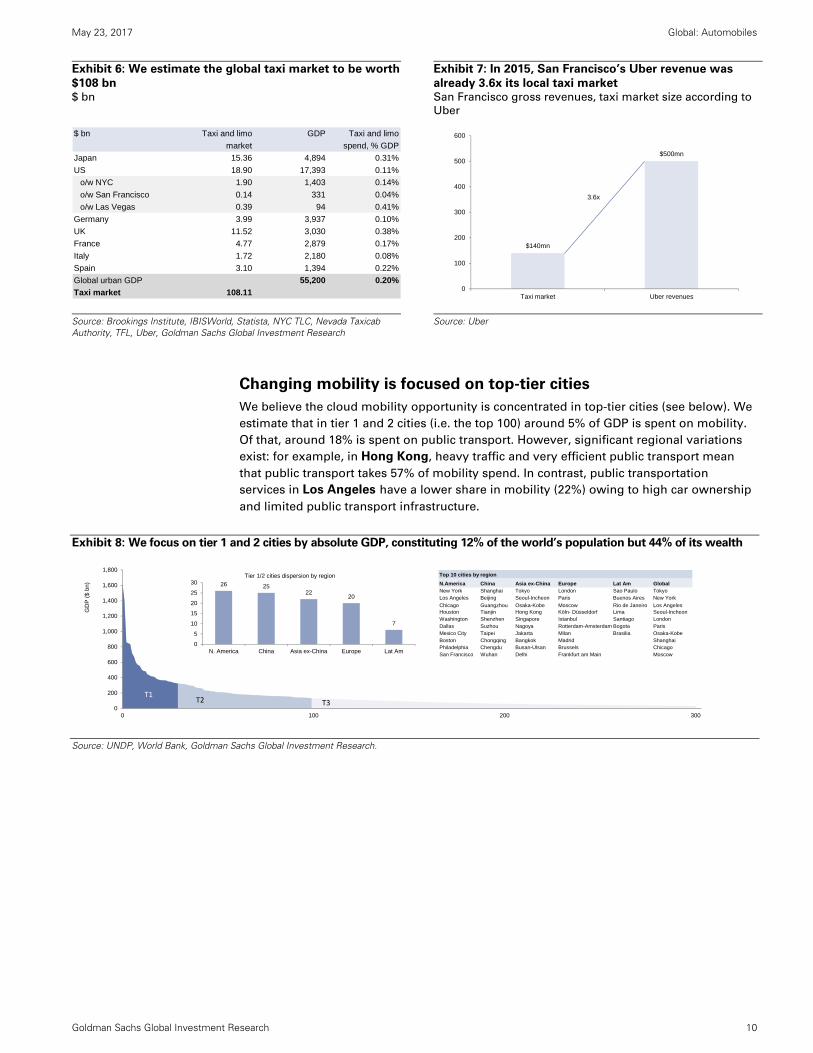
Exhibit 5: The separation of use and ownership We’re moving from a world where people own their car to one where they “consume mobility”
Source: Goldman Sachs Global Investment Research.
The global taxi market is worth >$100 bn To size the market opportunity for cloud mobility, we begin by estimating the global taxi
market size. We believe the global taxi market to be worth $108 bn. This is a difficult figure to
validate given limited data and a lack of formal revenue recognition in the industry. However,
based on the few regions where figures are available (see Exhibit 6), we have extrapolated a
ratio of taxi spend to GDP (c.0.2%) and applied it to global urban GDP to reach our market
size estimate. We use the same assumption of 0.2% of GDP to decompose our taxi market
size estimate by city size. The ride-hailing market, at $36 bn, is just under a third of the size
of the global taxi market ($108 bn) on our estimates. Ride hailing is growing very rapidly,
with the market having more than doubled in 2016 vs. 2015 (c.$16 bn). Uber outgrew peers in
2016, more than tripling its gross revenues from $2 bn to $6.5 bn (+225% yoy).
May 23, 2017 Global: Automobiles
Goldman Sachs Global Investment Research 10
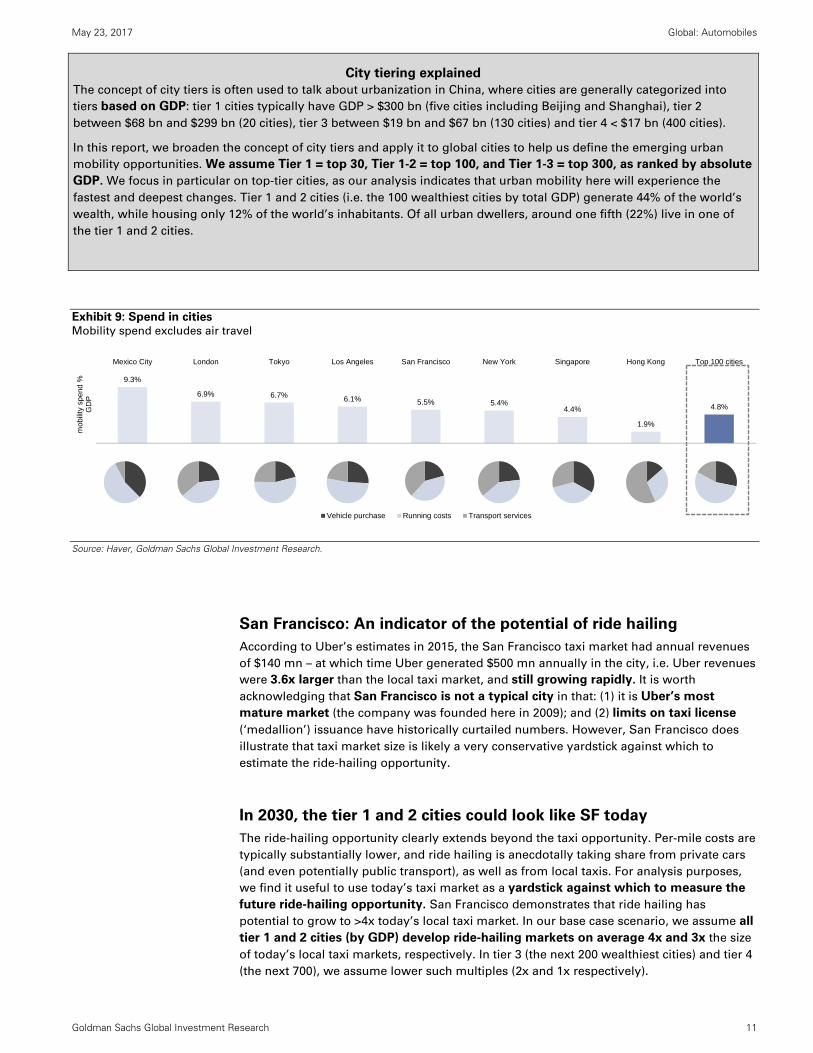
Exhibit 6: We estimate the global taxi market to be worth
$108 bn $ bn
Exhibit 7: In 2015, San Francisco’s Uber revenue was
already 3.6x its local taxi market San Francisco gross revenues, taxi market size according to
Uber
Source: Brookings Institute, IBISWorld, Statista, NYC TLC, Nevada Taxicab Authority, TFL, Uber, Goldman Sachs Global Investment Research
Source: Uber
Changing mobility is focused on top-tier cities
We believe the cloud mobility opportunity is concentrated in top-tier cities (see below). We
estimate that in tier 1 and 2 cities (i.e. the top 100) around 5% of GDP is spent on mobility.
Of that, around 18% is spent on public transport. However, significant regional variations
exist: for example, in Hong Kong, heavy traffic and very efficient public transport mean
that public transport takes 57% of mobility spend. In contrast, public transportation
services in Los Angeles have a lower share in mobility (22%) owing to high car ownership
and limited public transport infrastructure.
Exhibit 8: We focus on tier 1 and 2 cities by absolute GDP, constituting 12% of the world’s population but 44% of its wealth
Source: UNDP, World Bank, Goldman Sachs Global Investment Research.
$ bn Taxi and limo GDP Taxi and limo
market spend, % GDP
Japan 15.36 4,894 0.31%
US 18.90 17,393 0.11%
o/w NYC 1.90 1,403 0.14%
o/w San Francisco 0.14 331 0.04%
o/w Las Vegas 0.39 94 0.41%
Germany 3.99 3,937 0.10%
UK 11.52 3,030 0.38%
France 4.77 2,879 0.17%
Italy 1.72 2,180 0.08%
Spain 3.10 1,394 0.22%
Global urban GDP 55,200 0.20%
Taxi market 108.11
$140mn
$500mn
0
100
200
300
400
500
600
Taxi market Uber revenues
3.6x
0
200
400
600
800
1,000
1,200
1,400
1,600
1,800
0 100 200 300
GD
P (
$ bn
)
T1T2 T3
26 2522
20
7
0
5
10
15
20
25
30
N. America China Asia ex-China Europe Lat Am
Tier 1/2 cities dispersion by region Top 10 cities by region
N.America China Asia ex-China Europe Lat Am GlobalNew York Shanghai Tokyo London Sao Paulo TokyoLos Angeles Beijing Seoul-Incheon Paris Buenos Aires New York
Chicago Guangzhou Osaka-Kobe Moscow Rio de Janeiro Los AngelesHouston Tianjin Hong Kong Köln- Düsseldorf Lima Seoul-IncheonWashington Shenzhen Singapore Istanbul Santiago LondonDallas Suzhou Nagoya Rotterdam-Amsterdam Bogota ParisMexico City Taipei Jakarta Milan Brasilia Osaka-KobeBoston Chongqing Bangkok Madrid ShanghaiPhiladelphia Chengdu Busan-Ulsan Brussels ChicagoSan Francisco Wuhan Delhi Frankfurt am Main Moscow
May 23, 2017 Global: Automobiles
Goldman Sachs Global Investment Research 11
City tiering explained
The concept of city tiers is often used to talk about urbanization in China, where cities are generally categorized into
tiers based on GDP: tier 1 cities typically have GDP > $300 bn (five cities including Beijing and Shanghai), tier 2
between $68 bn and $299 bn (20 cities), tier 3 between $19 bn and $67 bn (130 cities) and tier 4 < $17 bn (400 cities).
In this report, we broaden the concept of city tiers and apply it to global cities to help us define the emerging urban
mobility opportunities. We assume Tier 1 = top 30, Tier 1-2 = top 100, and Tier 1-3 = top 300, as ranked by absolute
GDP. We focus in particular on top-tier cities, as our analysis indicates that urban mobility here will experience the
fastest and deepest changes. Tier 1 and 2 cities (i.e. the 100 wealthiest cities by total GDP) generate 44% of the world’s
wealth, while housing only 12% of the world’s inhabitants. Of all urban dwellers, around one fifth (22%) live in one of
the tier 1 and 2 cities.
Exhibit 9: Spend in cities Mobility spend excludes air travel
Source: Haver, Goldman Sachs Global Investment Research.
San Francisco: An indicator of the potential of ride hailing
According to Uber’s estimates in 2015, the San Francisco taxi market had annual revenues
of $140 mn – at which time Uber generated $500 mn annually in the city, i.e. Uber revenues
were 3.6x larger than the local taxi market, and still growing rapidly. It is worth
acknowledging that San Francisco is not a typical city in that: (1) it is Uber’s most
mature market (the company was founded here in 2009); and (2) limits on taxi license
(‘medallion’) issuance have historically curtailed numbers. However, San Francisco does
illustrate that taxi market size is likely a very conservative yardstick against which to
estimate the ride-hailing opportunity.
In 2030, the tier 1 and 2 cities could look like SF today
The ride-hailing opportunity clearly extends beyond the taxi opportunity. Per-mile costs are
typically substantially lower, and ride hailing is anecdotally taking share from private cars
(and even potentially public transport), as well as from local taxis. For analysis purposes,
we find it useful to use today’s taxi market as a yardstick against which to measure the
future ride-hailing opportunity. San Francisco demonstrates that ride hailing has
potential to grow to >4x today’s local taxi market. In our base case scenario, we assume all
tier 1 and 2 cities (by GDP) develop ride-hailing markets on average 4x and 3x the size
of today’s local taxi markets, respectively. In tier 3 (the next 200 wealthiest cities) and tier 4
(the next 700), we assume lower such multiples (2x and 1x respectively).
9.3%
6.9% 6.7% 6.1% 5.5% 5.4%4.4%
1.9%
4.8%
Mexico City London Tokyo Los Angeles San Francisco New York Singapore Hong Kong Top 100 cities
mob
ility
spe
nd %
G
DP
Vehicle purchase Running costs Transport services
May 23, 2017 Global: Automobiles
Goldman Sachs Global Investment Research 12
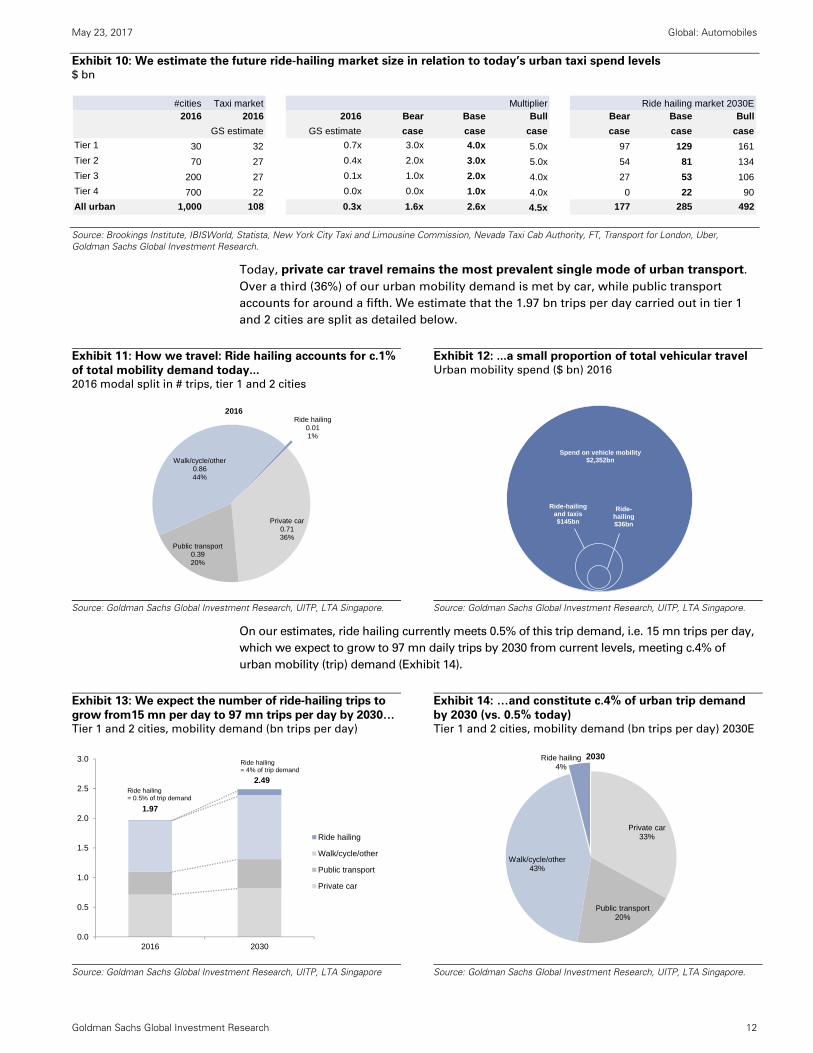
Exhibit 10: We estimate the future ride-hailing market size in relation to today’s urban taxi spend levels $ bn
Source: Brookings Institute, IBISWorld, Statista, New York City Taxi and Limousine Commission, Nevada Taxi Cab Authority, FT, Transport for London, Uber, Goldman Sachs Global Investment Research.
Today, private car travel remains the most prevalent single mode of urban transport.
Over a third (36%) of our urban mobility demand is met by car, while public transport
accounts for around a fifth. We estimate that the 1.97 bn trips per day carried out in tier 1
and 2 cities are split as detailed below.
Exhibit 11: How we travel: Ride hailing accounts for c.1%
of total mobility demand today... 2016 modal split in # trips, tier 1 and 2 cities
Exhibit 12: ...a small proportion of total vehicular travel Urban mobility spend ($ bn) 2016
Source: Goldman Sachs Global Investment Research, UITP, LTA Singapore.
Source: Goldman Sachs Global Investment Research, UITP, LTA Singapore.
On our estimates, ride hailing currently meets 0.5% of this trip demand, i.e. 15 mn trips per day,
which we expect to grow to 97 mn daily trips by 2030 from current levels, meeting c.4% of
urban mobility (trip) demand (Exhibit 14).
Exhibit 13: We expect the number of ride-hailing trips to
grow from15 mn per day to 97 mn trips per day by 2030… Tier 1 and 2 cities, mobility demand (bn trips per day)
Exhibit 14: …and constitute c.4% of urban trip demand
by 2030 (vs. 0.5% today) Tier 1 and 2 cities, mobility demand (bn trips per day) 2030E
Source: Goldman Sachs Global Investment Research, UITP, LTA Singapore
Source: Goldman Sachs Global Investment Research, UITP, LTA Singapore.
#cities Taxi market Multiplier Ride hailing market 2030E2016 2016 2016 Bear Base Bull Bear Base Bull
GS estimate GS estimate case case case case case case
Tier 1 30 32 0.7x 3.0x 4.0x 5.0x 97 129 161
Tier 2 70 27 0.4x 2.0x 3.0x 5.0x 54 81 134
Tier 3 200 27 0.1x 1.0x 2.0x 4.0x 27 53 106
Tier 4 700 22 0.0x 0.0x 1.0x 4.0x 0 22 90
All urban 1,000 108 0.3x 1.6x 2.6x 4.5x 177 285 492
Private car0.7136%
Public transport0.3920%
Walk/cycle/other0.8644%
Ride hailing0.011%
2016
Ride-hailingand taxis$145bn
Spend on vehicle mobility$2,352bn
Ride-hailing$36bn
1.97
2.49
0.0
0.5
1.0
1.5
2.0
2.5
3.0
2016 2030
Ride hailing
Walk/cycle/other
Public transport
Private car
Ride hailing = 0.5% of trip demand
Ride hailing = 4% of trip demand
Private car33%
Public transport20%
Walk/cycle/other43%
Ride hailing4%
2030
May 23, 2017 Global: Automobiles
Goldman Sachs Global Investment Research 13
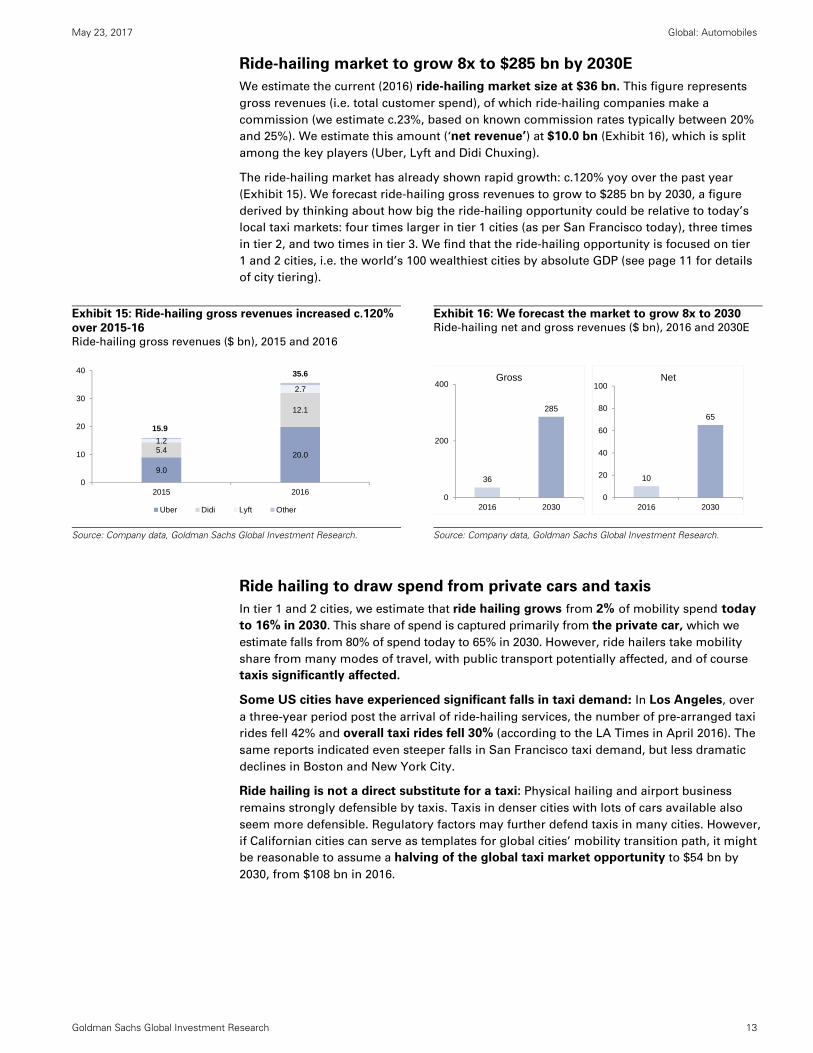
Ride-hailing market to grow 8x to $285 bn by 2030E
We estimate the current (2016) ride-hailing market size at $36 bn. This figure represents
gross revenues (i.e. total customer spend), of which ride-hailing companies make a
commission (we estimate c.23%, based on known commission rates typically between 20%
and 25%). We estimate this amount (‘net revenue’) at $10.0 bn (Exhibit 16), which is split
among the key players (Uber, Lyft and Didi Chuxing).
The ride-hailing market has already shown rapid growth: c.120% yoy over the past year
(Exhibit 15). We forecast ride-hailing gross revenues to grow to $285 bn by 2030, a figure
derived by thinking about how big the ride-hailing opportunity could be relative to today’s
local taxi markets: four times larger in tier 1 cities (as per San Francisco today), three times
in tier 2, and two times in tier 3. We find that the ride-hailing opportunity is focused on tier
1 and 2 cities, i.e. the world’s 100 wealthiest cities by absolute GDP (see page 11 for details
of city tiering).
Exhibit 15: Ride-hailing gross revenues increased c.120%
over 2015-16 Ride-hailing gross revenues ($ bn), 2015 and 2016
Exhibit 16: We forecast the market to grow 8x to 2030 Ride-hailing net and gross revenues ($ bn), 2016 and 2030E
Source: Company data, Goldman Sachs Global Investment Research.
Source: Company data, Goldman Sachs Global Investment Research.
Ride hailing to draw spend from private cars and taxis
In tier 1 and 2 cities, we estimate that ride hailing grows from 2% of mobility spend today
to 16% in 2030. This share of spend is captured primarily from the private car, which we
estimate falls from 80% of spend today to 65% in 2030. However, ride hailers take mobility
share from many modes of travel, with public transport potentially affected, and of course
taxis significantly affected.
Some US cities have experienced significant falls in taxi demand: In Los Angeles, over
a three-year period post the arrival of ride-hailing services, the number of pre-arranged taxi
rides fell 42% and overall taxi rides fell 30% (according to the LA Times in April 2016). The
same reports indicated even steeper falls in San Francisco taxi demand, but less dramatic
declines in Boston and New York City.
Ride hailing is not a direct substitute for a taxi: Physical hailing and airport business
remains strongly defensible by taxis. Taxis in denser cities with lots of cars available also
seem more defensible. Regulatory factors may further defend taxis in many cities. However,
if Californian cities can serve as templates for global cities’ mobility transition path, it might
be reasonable to assume a halving of the global taxi market opportunity to $54 bn by
2030, from $108 bn in 2016.
9.0
20.05.4
12.1
1.2
2.7
15.9
35.6
0
10
20
30
40
2015 2016
Uber Didi Lyft Other
36
285
0
200
400
2016 2030
Gross
10
65
0
20
40
60
80
100
2016 2030
Net
May 23, 2017 Global: Automobiles
Goldman Sachs Global Investment Research 14
Bear and bull scenarios
We lay out two scenarios which, relative to our base case assumptions, reflect: (1)
rapid disruption in mobility (bull case); and (2) a more ‘slow-burn’ approach to change
(bear case). The degree of change in our cities will reflect consumers’ willingness to
alter their behavior with regard to mode of travel and willingness to share.
In our bear case scenario, only the 30 wealthiest cities attain a ride-hailing market 3x larger
than their current respective taxi markets, and outside the top 300 cities, ride hailing gains
no presence. For context, Uber currently lists on its website around 400 cities in which it has a
presence, although for many of these, we assume its operations to be very limited. In our bull
scenario, the ride-hailing market grows to 5x the size of today’s taxi markets in all tier 1 and 2
cities, and 4x in tiers 3-4. In this scenario, ride hailing is therefore potentially a prevalent mode
of travel in all cities, not just the world’s capitals.
To summarize, in our base case estimates (see Exhibit 17), the ride-hailing market grows to
$285 bn, i.e. c.8.0x its current size, by 2030. In our bear scenario, this figure is $177 bn (c.5x
the current level). In our bull scenario, this market grows to $492 bn (14x today’s level).
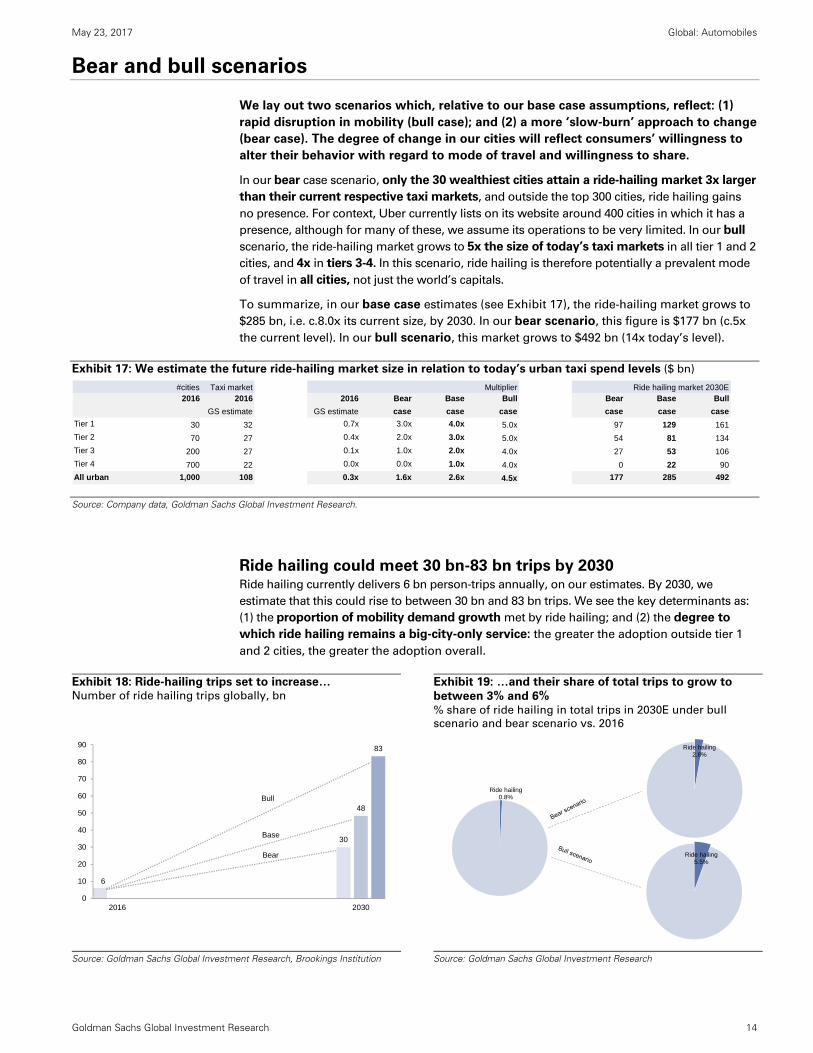
Exhibit 17: We estimate the future ride-hailing market size in relation to today’s urban taxi spend levels ($ bn)
Source: Company data, Goldman Sachs Global Investment Research.
Ride hailing could meet 30 bn-83 bn trips by 2030 Ride hailing currently delivers 6 bn person-trips annually, on our estimates. By 2030, we
estimate that this could rise to between 30 bn and 83 bn trips. We see the key determinants as:
(1) the proportion of mobility demand growth met by ride hailing; and (2) the degree to
which ride hailing remains a big-city-only service: the greater the adoption outside tier 1
and 2 cities, the greater the adoption overall.
Exhibit 18: Ride-hailing trips set to increase… Number of ride hailing trips globally, bn
Exhibit 19: …and their share of total trips to grow to
between 3% and 6% % share of ride hailing in total trips in 2030E under bull
scenario and bear scenario vs. 2016
Source: Goldman Sachs Global Investment Research, Brookings Institution
Source: Goldman Sachs Global Investment Research
#cities Taxi market Multiplier Ride hailing market 2030E2016 2016 2016 Bear Base Bull Bear Base Bull
GS estimate GS estimate case case case case case case
Tier 1 30 32 0.7x 3.0x 4.0x 5.0x 97 129 161
Tier 2 70 27 0.4x 2.0x 3.0x 5.0x 54 81 134
Tier 3 200 27 0.1x 1.0x 2.0x 4.0x 27 53 106
Tier 4 700 22 0.0x 0.0x 1.0x 4.0x 0 22 90
All urban 1,000 108 0.3x 1.6x 2.6x 4.5x 177 285 492
6
30
48
83
0
10
20
30
40
50
60
70
80
90
2016 2030
Bull
Bear
Base
Ride hailing5.5%
Ride hailing2.8%
Ride hailing0.8%
May 23, 2017 Global: Automobiles
Goldman Sachs Global Investment Research 15
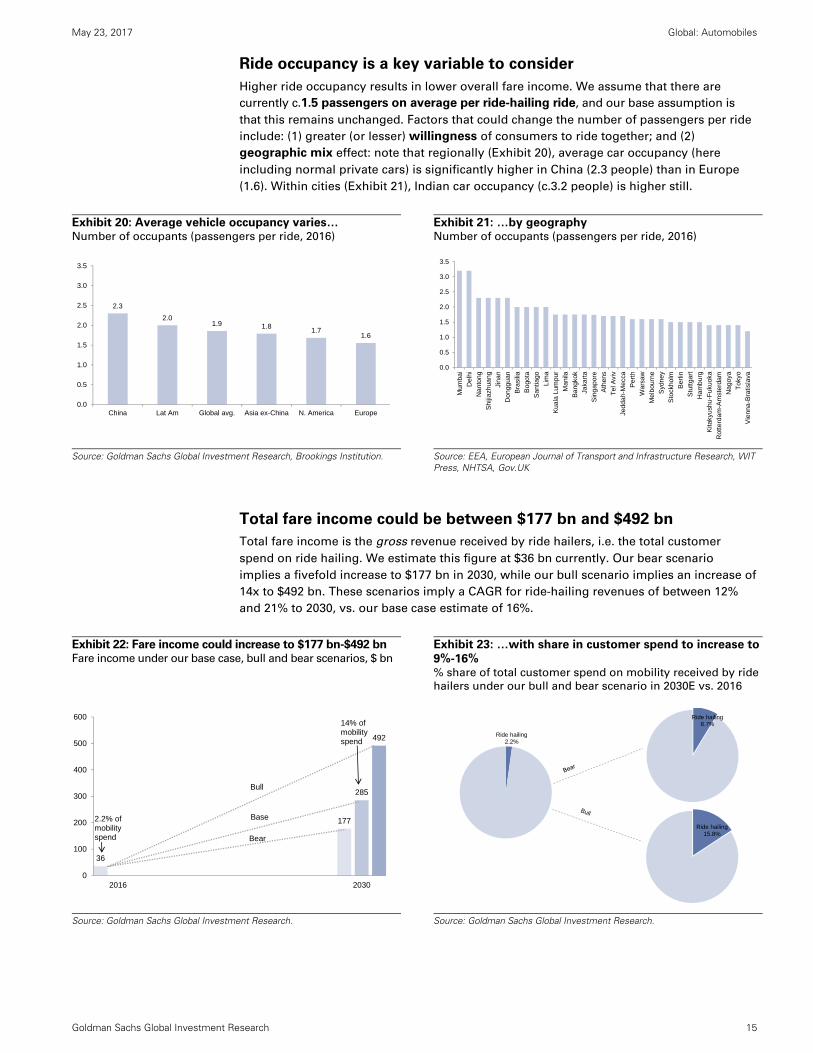
Ride occupancy is a key variable to consider
Higher ride occupancy results in lower overall fare income. We assume that there are
currently c.1.5 passengers on average per ride-hailing ride, and our base assumption is
that this remains unchanged. Factors that could change the number of passengers per ride
include: (1) greater (or lesser) willingness of consumers to ride together; and (2)
geographic mix effect: note that regionally (Exhibit 20), average car occupancy (here
including normal private cars) is significantly higher in China (2.3 people) than in Europe
(1.6). Within cities (Exhibit 21), Indian car occupancy (c.3.2 people) is higher still.
Exhibit 20: Average vehicle occupancy varies… Number of occupants (passengers per ride, 2016)
Exhibit 21: …by geography Number of occupants (passengers per ride, 2016)
Source: Goldman Sachs Global Investment Research, Brookings Institution.
Source: EEA, European Journal of Transport and Infrastructure Research, WIT Press, NHTSA, Gov.UK
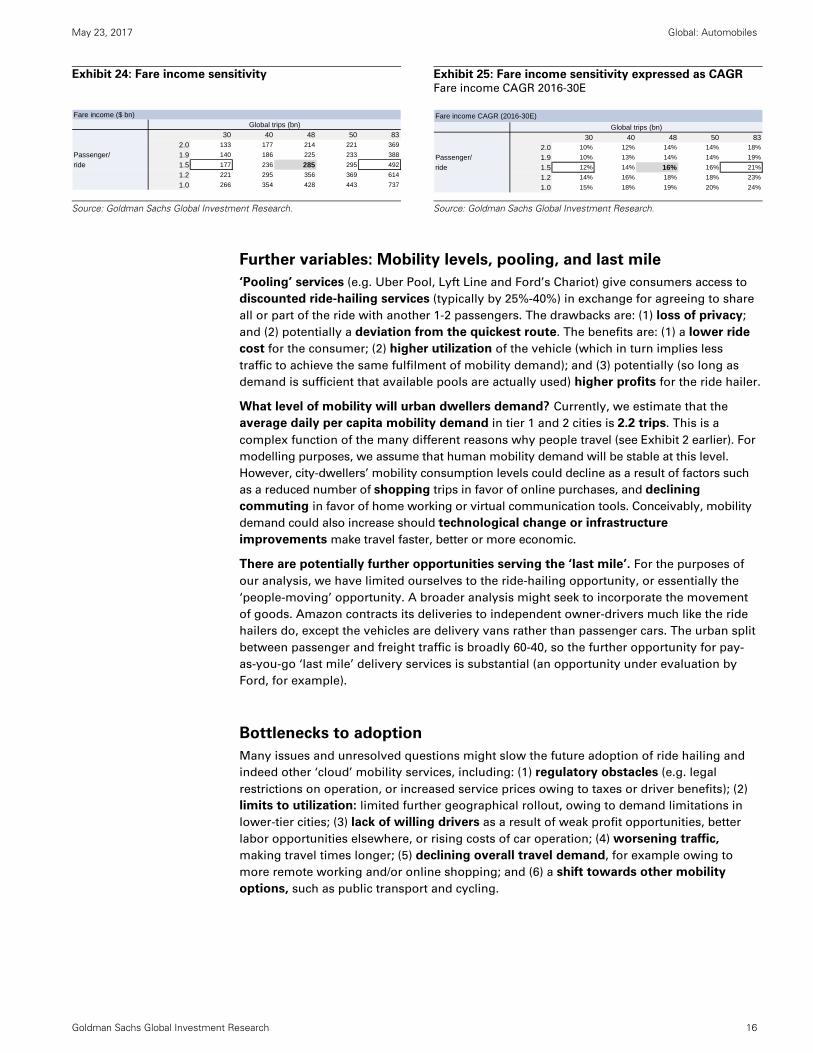
Total fare income could be between $177 bn and $492 bn
Total fare income is the gross revenue received by ride hailers, i.e. the total customer
spend on ride hailing. We estimate this figure at $36 bn currently. Our bear scenario
implies a fivefold increase to $177 bn in 2030, while our bull scenario implies an increase of
14x to $492 bn. These scenarios imply a CAGR for ride-hailing revenues of between 12%
and 21% to 2030, vs. our base case estimate of 16%.
Exhibit 22: Fare income could increase to $177 bn-$492 bn Fare income under our base case, bull and bear scenarios, $ bn
Exhibit 23: …with share in customer spend to increase to
9%-16% % share of total customer spend on mobility received by ride
hailers under our bull and bear scenario in 2030E vs. 2016
Source: Goldman Sachs Global Investment Research.
Source: Goldman Sachs Global Investment Research.
2.3
2.01.9 1.8
1.71.6
0.0
0.5
1.0
1.5
2.0
2.5
3.0
3.5
China Lat Am Global avg. Asia ex-China N. America Europe
0.0
0.5
1.0
1.5
2.0
2.5
3.0
3.5
Mu
mba
i
Del
hi
Nan
ton
g
Shi
jiazh
uang
Jina
n
Don
ggua
n
Bra
silia
Bog
ota
San
tiago
Lim
a
Kua
la L
umpu
r
Man
ila
Ban
gkok
Jaka
rta
Sin
gapo
re
Ath
ens
Te
l Avi
v
Jedd
ah-M
ecca
Per
th
Wa
rsa
w
Mel
bou
rne
Syd
ney
Sto
ckho
lm
Ber
lin
Stu
ttgar
t
Ham
bur
g
Kita
kyus
hu-F
ukuo
ka
Rot
terd
am-A
mst
erda
m
Nag
oya
To
kyo
Vie
nna-
Bra
tisla
va
36
177
285
492
0
100
200
300
400
500
600
2016 2030
Bull
Bear
Base2.2% of mobilityspend
14% of mobilityspend
Ride hailing15.8%
Ride hailing8.7%
Ride hailing2.2%
May 23, 2017 Global: Automobiles
Goldman Sachs Global Investment Research 16
Exhibit 24: Fare income sensitivity
Exhibit 25: Fare income sensitivity expressed as CAGR Fare income CAGR 2016-30E
Source: Goldman Sachs Global Investment Research.
Source: Goldman Sachs Global Investment Research.
Further variables: Mobility levels, pooling, and last mile
‘Pooling’ services (e.g. Uber Pool, Lyft Line and Ford’s Chariot) give consumers access to
discounted ride-hailing services (typically by 25%-40%) in exchange for agreeing to share
all or part of the ride with another 1-2 passengers. The drawbacks are: (1) loss of privacy;
and (2) potentially a deviation from the quickest route. The benefits are: (1) a lower ride
cost for the consumer; (2) higher utilization of the vehicle (which in turn implies less
traffic to achieve the same fulfilment of mobility demand); and (3) potentially (so long as
demand is sufficient that available pools are actually used) higher profits for the ride hailer.
What level of mobility will urban dwellers demand? Currently, we estimate that the
average daily per capita mobility demand in tier 1 and 2 cities is 2.2 trips. This is a
complex function of the many different reasons why people travel (see Exhibit 2 earlier). For
modelling purposes, we assume that human mobility demand will be stable at this level.
However, city-dwellers’ mobility consumption levels could decline as a result of factors such
as a reduced number of shopping trips in favor of online purchases, and declining
commuting in favor of home working or virtual communication tools. Conceivably, mobility
demand could also increase should technological change or infrastructure
improvements make travel faster, better or more economic.
There are potentially further opportunities serving the ‘last mile’. For the purposes of
our analysis, we have limited ourselves to the ride-hailing opportunity, or essentially the
‘people-moving’ opportunity. A broader analysis might seek to incorporate the movement
of goods. Amazon contracts its deliveries to independent owner-drivers much like the ride
hailers do, except the vehicles are delivery vans rather than passenger cars. The urban split
between passenger and freight traffic is broadly 60-40, so the further opportunity for pay-
as-you-go ‘last mile’ delivery services is substantial (an opportunity under evaluation by
Ford, for example).
Bottlenecks to adoption
Many issues and unresolved questions might slow the future adoption of ride hailing and
indeed other ‘cloud’ mobility services, including: (1) regulatory obstacles (e.g. legal
restrictions on operation, or increased service prices owing to taxes or driver benefits); (2)
limits to utilization: limited further geographical rollout, owing to demand limitations in
lower-tier cities; (3) lack of willing drivers as a result of weak profit opportunities, better
labor opportunities elsewhere, or rising costs of car operation; (4) worsening traffic,
making travel times longer; (5) declining overall travel demand, for example owing to
more remote working and/or online shopping; and (6) a shift towards other mobility
options, such as public transport and cycling.
Fare income ($ bn)Global trips (bn)
30 40 48 50 83
2.0 133 177 214 221 369
Passenger/ 1.9 140 186 225 233 388
ride 1.5 177 236 285 295 492
1.2 221 295 356 369 614
1.0 266 354 428 443 737
Fare income CAGR (2016-30E)
Global trips (bn)
30 40 48 50 832.0 10% 12% 14% 14% 18%
Passenger/ 1.9 10% 13% 14% 14% 19%
ride 1.5 12% 14% 16% 16% 21%
1.2 14% 16% 18% 18% 23%
1.0 15% 18% 19% 20% 24%
Emerging mobility models Venture backing developments
The emerging “optimizer” role for ride hailers (p. 18)
The venture capital landscape: Private players leading the charge in
ride hailing (p. 20)
Other innovative mobility models (p. 19)
May 23, 2017 Global: Automobiles
Goldman Sachs Global Investment Research 18
The new ecosystem: Ride hailers are ‘optimizers’ of assets
‘Pay-as-you go’ mobility is on the rise via an emerging ‘cloud’ of mobility services,
which is separating usage from ownership. A transition is under way from a world
where moving people, goods and services requires owning a vehicle, to one where
we can ‘bid’ for single journeys – or ‘packets’ of mobility – and consume them
(conveniently) on a pay-as-you-go basis. It is becoming increasingly likely that in
cities, we travel in a vehicle we do not own.
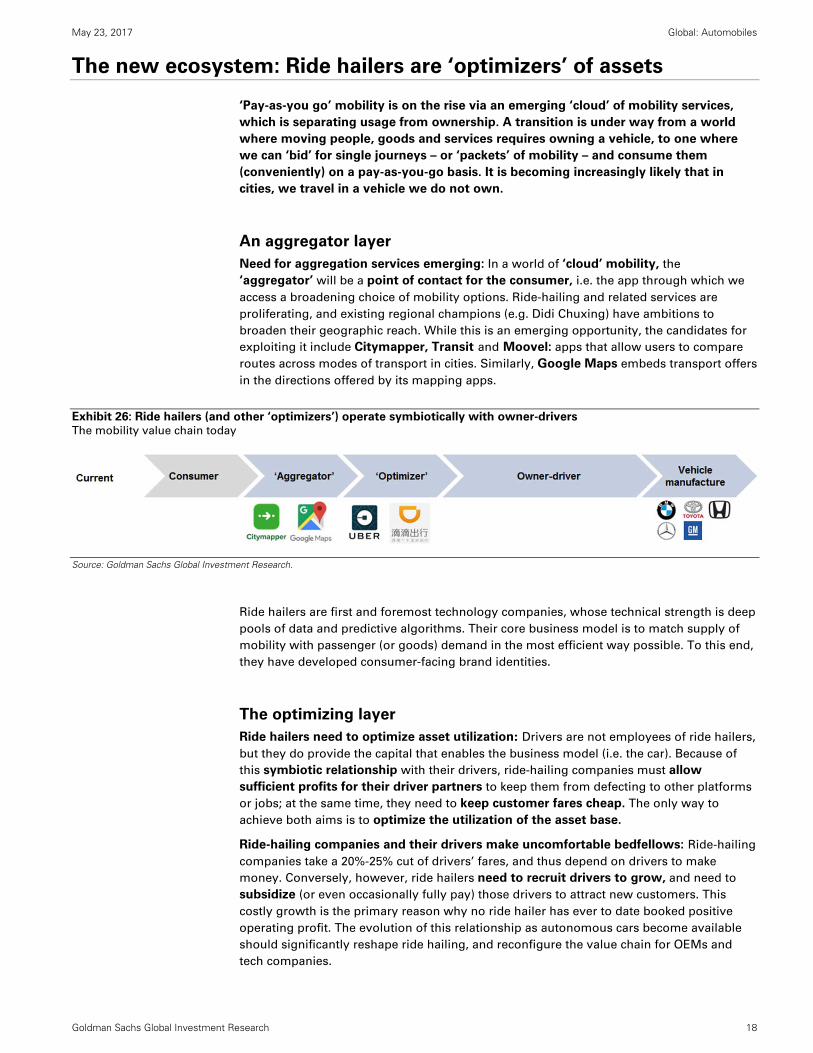
An aggregator layer
Need for aggregation services emerging: In a world of ‘cloud’ mobility, the
‘aggregator’ will be a point of contact for the consumer, i.e. the app through which we
access a broadening choice of mobility options. Ride-hailing and related services are
proliferating, and existing regional champions (e.g. Didi Chuxing) have ambitions to
broaden their geographic reach. While this is an emerging opportunity, the candidates for
exploiting it include Citymapper, Transit and Moovel: apps that allow users to compare
routes across modes of transport in cities. Similarly, Google Maps embeds transport offers
in the directions offered by its mapping apps.
Exhibit 26: Ride hailers (and other ‘optimizers’) operate symbiotically with owner-drivers The mobility value chain today
Source: Goldman Sachs Global Investment Research.
Ride hailers are first and foremost technology companies, whose technical strength is deep
pools of data and predictive algorithms. Their core business model is to match supply of
mobility with passenger (or goods) demand in the most efficient way possible. To this end,
they have developed consumer-facing brand identities.
The optimizing layer
Ride hailers need to optimize asset utilization: Drivers are not employees of ride hailers,
but they do provide the capital that enables the business model (i.e. the car). Because of
this symbiotic relationship with their drivers, ride-hailing companies must allow
sufficient profits for their driver partners to keep them from defecting to other platforms
or jobs; at the same time, they need to keep customer fares cheap. The only way to
achieve both aims is to optimize the utilization of the asset base.
Ride-hailing companies and their drivers make uncomfortable bedfellows: Ride-hailing
companies take a 20%-25% cut of drivers’ fares, and thus depend on drivers to make
money. Conversely, however, ride hailers need to recruit drivers to grow, and need to
subsidize (or even occasionally fully pay) those drivers to attract new customers. This
costly growth is the primary reason why no ride hailer has ever to date booked positive
operating profit. The evolution of this relationship as autonomous cars become available
should significantly reshape ride hailing, and reconfigure the value chain for OEMs and
tech companies.
May 23, 2017 Global: Automobiles
Goldman Sachs Global Investment Research 19
Ride hailing only one of many possible solutions
Ride hailing is not the only ‘solution’ at the intersection of cars and the sharing
economy. Car sharing, Airbnb-style models, and minivan shuttle services are all jostling
for position too – but all seek to improve asset utilization relative to the c.5% level of
private cars...and of course to deliver mobility with convenience to customers. The ride-
hailing model revolves around its symbiosis with its drivers, and the growth of such
services hinges on successful balancing of customer acquisition (achieved through
subsidies) and asset utilization. Capital is flowing into the space; in the following section,
we provide a list of companies that have collectively attracted some $36 bn of investment
capital (Exhibit 27).
Multiple business models
Ride hailing is perhaps the most obvious meeting point between the ‘sharing economy’
and the car. Sharing economy models aim to improve the utilization of a wide range of
assets by allowing users to ‘book’ and rent those assets via technology platforms. All of the
below business models will experience change in a post-autonomous world.
Ride-hailing companies aim to improve vehicle utilization by allowing users to book the
service for customized trips. Uber (market leader in the US) and Didi Chuxing (#1 in China)
are the dominant players in the ride-hailing market (c.90% of the global market by
revenues), while Lyft is the global #3, with operations currently confined to the US. The
smaller GrabTaxi was founded in Malaysia and is the #1 ride hailer in Southeast Asia.
Another group of business models has emerged as an add-on to local taxi industries: Gett
(in which VW has a $300 mn stake) has originated from an app-based service for booking
local (traditional) metered taxis. Similarly, Daimler-owned MyTaxi currently has a Germany
focus, and takes a flat booking fee on a per-ride basis.
Shuttle-services: Another set of variants uses minivans or buses to shuttle multiple
passengers together. Unlike traditional buses, the aim is to have dynamic routes that vary
with demand. Examples include: (1) Via, which operates in North America and is partnered
with Mercedes. Via collects customers from the nearest block as opposed to an exact
location, and charges a low flat fee irrespective of the distance; and (2) Chariot (acquired
by Ford last year for >$65 mn), which has features similar to Via, but is much smaller in size
and operates only in San Francisco.
Car-sharing services: The final group of variants is essentially ‘self-drive’ business models.
Unlike traditional (e.g. airport-based) rentals, customers rent cars for short periods of time
(by the hour or minute) from collection points generally within cities. Cars may be returned
to the collection point, or alternatively ‘free-floating’ services let cars be dropped off
anywhere within designated urban areas. Examples include: (1) Car2go (Daimler’s joint
venture with Europcar), which has a customer base of >2 mn users and provides a fleet of
smart or Mercedes vehicles; (2) ZipCar (a wholly owned subsidiary of Avis group), which
has a customer base of c.1 mn members and operates in similar regions as Car2go; and (3)
Maven, GM’s US-based car-sharing service.
Peer-to-peer car share models (Airbnb-style) allow car-owners to make money by letting
out their own cars for short periods, e.g. Turo and Daimler-owned Croove.
The common goal among business models is to improve asset utilization: The key
competencies for matching people with mobility are technological ones. Locating a
customer, taking their destination, and passing it to the nearest available driver (all
smartphone-dependent tasks) is the start. The key to minimizing per-mile costs is
maximizing asset utilization. This in turn demands algorithms that can estimate journey
times, and ultimately predict demand to avoid having idled or empty vehicles that are not
earning a return. In other words, the goal of the technology is to optimize the utilization
of the asset base.
May 23, 2017
Global: A
utomobiles
Goldm
an Sachs G
lobal Investment R
esearch
20
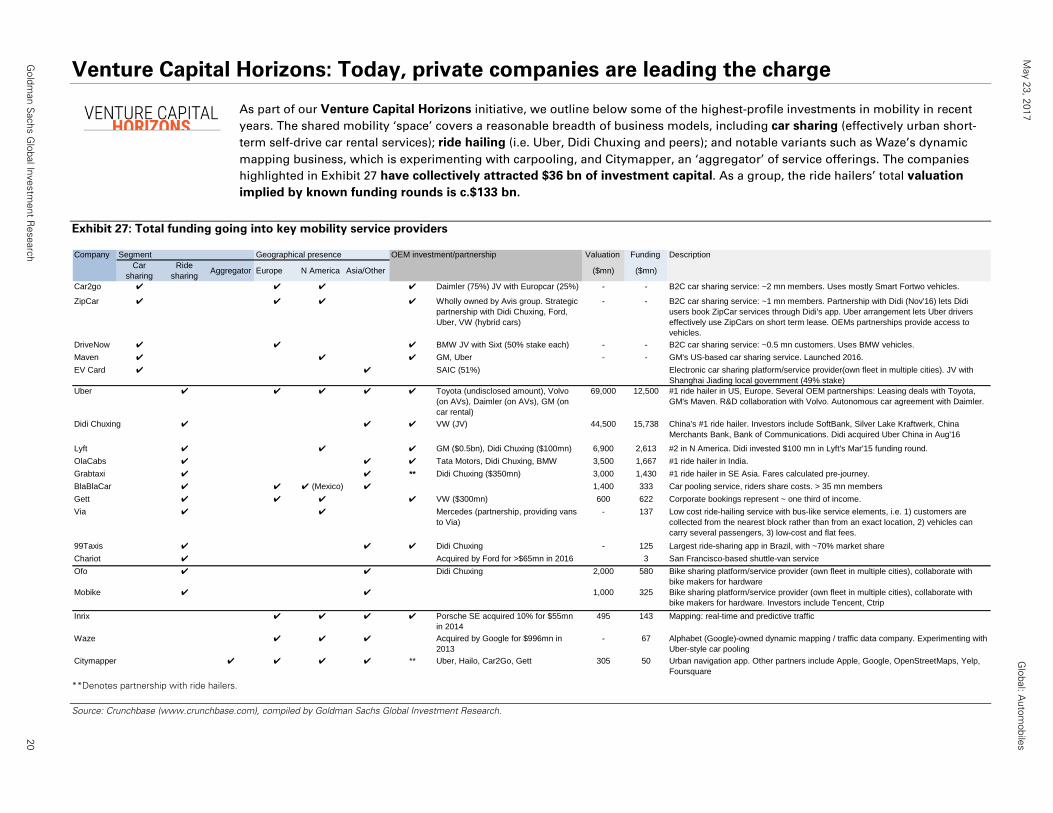
Venture Capital Horizons: Today, private companies are leading the charge
As part of our Venture Capital Horizons initiative, we outline below some of the highest-profile investments in mobility in recent
years. The shared mobility ‘space’ covers a reasonable breadth of business models, including car sharing (effectively urban short-
term self-drive car rental services); ride hailing (i.e. Uber, Didi Chuxing and peers); and notable variants such as Waze’s dynamic
mapping business, which is experimenting with carpooling, and Citymapper, an ‘aggregator’ of service offerings. The companies
highlighted in Exhibit 27 have collectively attracted $36 bn of investment capital. As a group, the ride hailers’ total valuation
implied by known funding rounds is c.$133 bn.
Exhibit 27: Total funding going into key mobility service providers
**Denotes partnership with ride hailers.
Source: Crunchbase (www.crunchbase.com), compiled by Goldman Sachs Global Investment Research.
Company Segment Geographical presence OEM investment/partnership Valuation Funding DescriptionCar
sharingRide
sharingAggregator Europe N America Asia/Other ($mn) ($mn)
Car2go ✔ ✔ ✔ ✔ Daimler (75%) JV with Europcar (25%) - - B2C car sharing service: ~2 mn members. Uses mostly Smart Fortwo vehicles.
ZipCar ✔ ✔ ✔ ✔ Wholly owned by Avis group. Strategic partnership with Didi Chuxing, Ford, Uber, VW (hybrid cars)
- - B2C car sharing service: ~1 mn members. Partnership with Didi (Nov'16) lets Didi users book ZipCar services through Didi's app. Uber arrangement lets Uber drivers effectively use ZipCars on short term lease. OEMs partnerships provide access to vehicles.
DriveNow ✔ ✔ ✔ BMW JV with Sixt (50% stake each) - - B2C car sharing service: ~0.5 mn customers. Uses BMW vehicles.
Maven ✔ ✔ ✔ GM, Uber - - GM's US-based car sharing service. Launched 2016.
EV Card ✔ ✔ SAIC (51%) Electronic car sharing platform/service provider(own fleet in multiple cities). JV with Shanghai Jiading local government (49% stake)
Uber ✔ ✔ ✔ ✔ ✔ Toyota (undisclosed amount), Volvo (on AVs), Daimler (on AVs), GM (on car rental)
69,000 12,500 #1 ride hailer in US, Europe. Several OEM partnerships: Leasing deals with Toyota, GM's Maven. R&D collaboration with Volvo. Autonomous car agreement with Daimler.
Didi Chuxing ✔ ✔ ✔ VW (JV) 44,500 15,738 China's #1 ride hailer. Investors include SoftBank, Silver Lake Kraftwerk, China Merchants Bank, Bank of Communications. Didi acquired Uber China in Aug'16
Lyft ✔ ✔ ✔ GM ($0.5bn), Didi Chuxing ($100mn) 6,900 2,613 #2 in N America. Didi invested $100 mn in Lyft's Mar'15 funding round.
OlaCabs ✔ ✔ ✔ Tata Motors, Didi Chuxing, BMW 3,500 1,667 #1 ride hailer in India.
Grabtaxi ✔ ✔ ** Didi Chuxing ($350mn) 3,000 1,430 #1 ride hailer in SE Asia. Fares calculated pre-journey.
BlaBlaCar ✔ ✔ ✔ (Mexico) ✔ 1,400 333 Car pooling service, riders share costs. > 35 mn members
Gett ✔ ✔ ✔ ✔ VW ($300mn) 600 622 Corporate bookings represent ~ one third of income.
Via ✔ ✔ Mercedes (partnership, providing vans to Via)
- 137 Low cost ride-hailing service with bus-like service elements, i.e. 1) customers are collected from the nearest block rather than from an exact location, 2) vehicles can carry several passengers, 3) low-cost and flat fees.
99Taxis ✔ ✔ ✔ Didi Chuxing - 125 Largest ride-sharing app in Brazil, with ~70% market share
Chariot ✔ Acquired by Ford for >$65mn in 2016 3 San Francisco-based shuttle-van service
Ofo ✔ ✔ Didi Chuxing 2,000 580 Bike sharing platform/service provider (own fleet in multiple cities), collaborate with bike makers for hardware
Mobike ✔ ✔ 1,000 325 Bike sharing platform/service provider (own fleet in multiple cities), collaborate with bike makers for hardware. Investors include Tencent, Ctrip
Inrix ✔ ✔ ✔ ✔ Porsche SE acquired 10% for $55mn in 2014
495 143 Mapping: real-time and predictive traffic
Waze ✔ ✔ ✔ Acquired by Google for $996mn in 2013
- 67 Alphabet (Google)-owned dynamic mapping / traffic data company. Experimenting with Uber-style car pooling
Citymapper ✔ ✔ ✔ ✔ ** Uber, Hailo, Car2Go, Gett 305 50 Urban navigation app. Other partners include Apple, Google, OpenStreetMaps, Yelp, Foursquare
May 23, 2017
Global: A
utomobiles
Goldm
an Sachs G
lobal Investment R
esearch
21
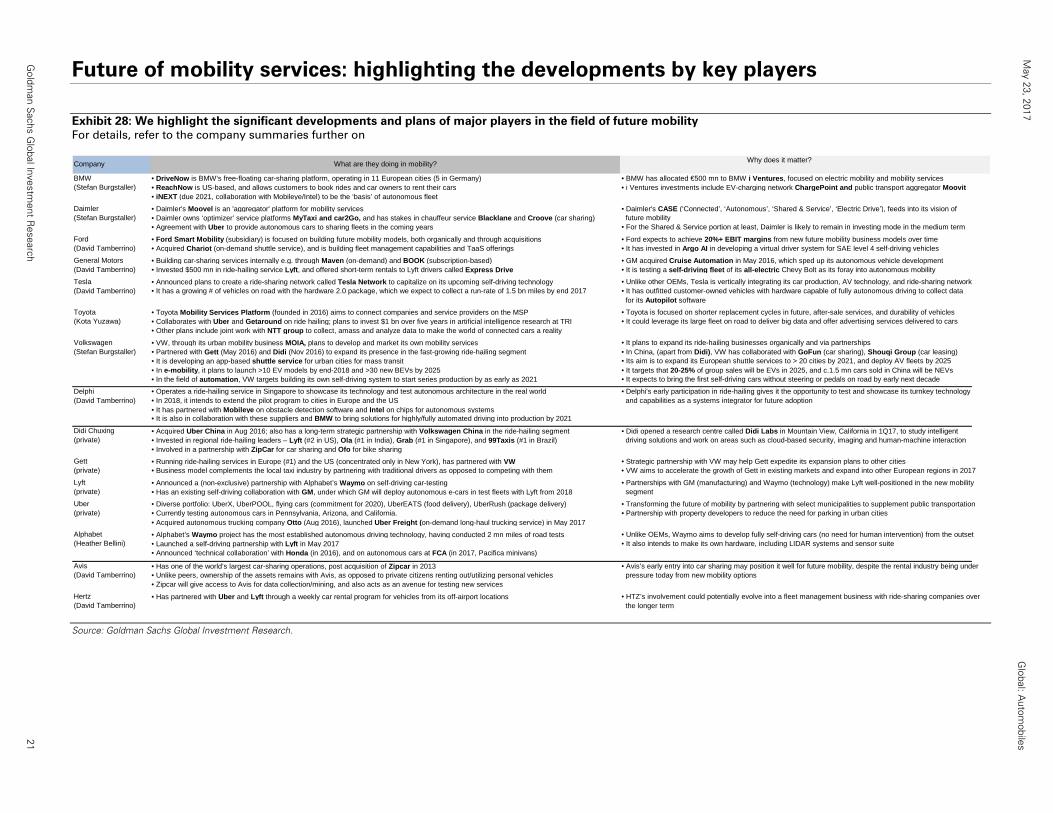
Future of mobility services: highlighting the developments by key players
Exhibit 28: We highlight the significant developments and plans of major players in the field of future mobility For details, refer to the company summaries further on
Source: Goldman Sachs Global Investment Research.
Why does it matter?
BMW • DriveNow is BMW's free-floating car-sharing platform, operating in 11 European cities (5 in Germany) • BMW has allocated €500 mn to BMW i Ventures, focused on electric mobility and mobility services(Stefan Burgstaller) • ReachNow is US-based, and allows customers to book rides and car owners to rent their cars • i Ventures investments include EV-charging network ChargePoint and public transport aggregator Moovit
• iNEXT (due 2021, collaboration with Mobileye/Intel) to be the ‘basis’ of autonomous fleet
Daimler • Daimler's Moovel is an 'aggregator' platform for mobility services • Daimler's CASE (‘Connected’, ‘Autonomous’, ‘Shared & Service’, ‘Electric Drive’), feeds into its vision of (Stefan Burgstaller) • Daimler owns ‘optimizer’ service platforms MyTaxi and car2Go, and has stakes in chauffeur service Blacklane and Croove (car sharing) future mobility
• Agreement with Uber to provide autonomous cars to sharing fleets in the coming years • For the Shared & Service portion at least, Daimler is likely to remain in investing mode in the medium term
Ford • Ford Smart Mobility (subsidiary) is focused on building future mobility models, both organically and through acquisitions • Ford expects to achieve 20%+ EBIT margins from new future mobility business models over time(David Tamberrino) • Acquired Chariot (on-demand shuttle service), and is building fleet management capabilities and TaaS offerings • It has invested in Argo AI in developing a virtual driver system for SAE level 4 self-driving vehicles
General Motors • Building car-sharing services internally e.g. through Maven (on-demand) and BOOK (subscription-based) • GM acquired Cruise Automation in May 2016, which sped up its autonomous vehicle development(David Tamberrino) • Invested $500 mn in ride-hailing service Lyft, and offered short-term rentals to Lyft drivers called Express Drive • It is testing a self-driving fleet of its all-electric Chevy Bolt as its foray into autonomous mobility
Tesla • Announced plans to create a ride-sharing network called Tesla Network to capitalize on its upcoming self-driving technology • Unlike other OEMs, Tesla is vertically integrating its car production, AV technology, and ride-sharing network(David Tamberrino) • It has a growing # of vehicles on road with the hardware 2.0 package, which we expect to collect a run-rate of 1.5 bn miles by end 2017 • It has outfitted customer-owned vehicles with hardware capable of fully autonomous driving to collect data
for its Autopilot software
Toyota • Toyota Mobility Services Platform (founded in 2016) aims to connect companies and service providers on the MSP • Toyota is focused on shorter replacement cycles in future, after-sale services, and durability of vehicles(Kota Yuzawa) • Collaborates with Uber and Getaround on ride hailing; plans to invest $1 bn over five years in artificial intelligence research at TRI • It could leverage its large fleet on road to deliver big data and offer advertising services delivered to cars
• Other plans include joint work with NTT group to collect, amass and analyze data to make the world of connected cars a reality
Volkswagen • VW, through its urban mobility business MOIA, plans to develop and market its own mobility services • It plans to expand its ride-hailing businesses organically and via partnerships(Stefan Burgstaller) • Partnered with Gett (May 2016) and Didi (Nov 2016) to expand its presence in the fast-growing ride-hailing segment • In China, (apart from Didi), VW has collaborated with GoFun (car sharing), Shouqi Group (car leasing)
• It is developing an app-based shuttle service for urban cities for mass transit • Its aim is to expand its European shuttle services to > 20 cities by 2021, and deploy AV fleets by 2025• In e-mobility, it plans to launch >10 EV models by end-2018 and >30 new BEVs by 2025 • It targets that 20-25% of group sales will be EVs in 2025, and c.1.5 mn cars sold in China will be NEVs• In the field of automation, VW targets building its own self-driving system to start series production by as early as 2021 • It expects to bring the first self-driving cars without steering or pedals on road by early next decade
Delphi • Operates a ride-hailing service in Singapore to showcase its technology and test autonomous architecture in the real world • Delphi's early participation in ride-hailing gives it the opportunity to test and showcase its turnkey technology (David Tamberrino) • In 2018, it intends to extend the pilot program to cities in Europe and the US and capabilities as a systems integrator for future adoption
• It has partnered with Mobileye on obstacle detection software and Intel on chips for autonomous systems• It is also in collaboration with these suppliers and BMW to bring solutions for highly/fully automated driving into production by 2021
Didi Chuxing • Acquired Uber China in Aug 2016; also has a long-term strategic partnership with Volkswagen China in the ride-hailing segment • Didi opened a research centre called Didi Labs in Mountain View, California in 1Q17, to study intelligent (private) • Invested in regional ride-hailing leaders – Lyft (#2 in US), Ola (#1 in India), Grab (#1 in Singapore), and 99Taxis (#1 in Brazil) driving solutions and work on areas such as cloud-based security, imaging and human-machine interaction
• Involved in a partnership with ZipCar for car sharing and Ofo for bike sharing
Gett • Running ride-hailing services in Europe (#1) and the US (concentrated only in New York), has partnered with VW • Strategic partnership with VW may help Gett expedite its expansion plans to other cities(private) • Business model complements the local taxi industry by partnering with traditional drivers as opposed to competing with them • VW aims to accelerate the growth of Gett in existing markets and expand into other European regions in 2017
Lyft • Announced a (non-exclusive) partnership with Alphabet’s Waymo on self-driving car-testing • Partnerships with GM (manufacturing) and Waymo (technology) make Lyft well-positioned in the new mobility(private) • Has an existing self-driving collaboration with GM, under which GM will deploy autonomous e-cars in test fleets with Lyft from 2018 segment
Uber • Diverse portfolio: UberX, UberPOOL, flying cars (commitment for 2020), UberEATS (food delivery), UberRush (package delivery) • Transforming the future of mobility by partnering with select municipalities to supplement public transportation(private) • Currently testing autonomous cars in Pennsylvania, Arizona, and California. • Partnership with property developers to reduce the need for parking in urban cities
• Acquired autonomous trucking company Otto (Aug 2016), launched Uber Freight (on-demand long-haul trucking service) in May 2017
Alphabet • Alphabet’s Waymo project has the most established autonomous driving technology, having conducted 2 mn miles of road tests • Unlike OEMs, Waymo aims to develop fully self-driving cars (no need for human intervention) from the outset(Heather Bellini) • Launched a self-driving partnership with Lyft in May 2017 • It also intends to make its own hardware, including LIDAR systems and sensor suite
• Announced ‘technical collaboration’ with Honda (in 2016), and on autonomous cars at FCA (in 2017, Pacifica minivans)
Avis • Has one of the world’s largest car-sharing operations, post acquisition of Zipcar in 2013 • Avis’s early entry into car sharing may position it well for future mobility, despite the rental industry being under (David Tamberrino) • Unlike peers, ownership of the assets remains with Avis, as opposed to private citizens renting out/utilizing personal vehicles pressure today from new mobility options
• Zipcar will give access to Avis for data collection/mining, and also acts as an avenue for testing new services
Hertz • Has partnered with Uber and Lyft through a weekly car rental program for vehicles from its off-airport locations • HTZ’s involvement could potentially evolve into a fleet management business with ride-sharing companies over(David Tamberrino) the longer term
Company What are they doing in mobility?

May 23, 2017 Global: Automobiles
Goldman Sachs Global Investment Research 22
The new ecosystem Autonomous the future battleground
Why autonomy doesn’t mean cheap mobility (p. 24)
The role for OEMs as “integrated fleet managers” (p. 28)
Profiles of autonomous services undergoing testing (p. 32)
Whoever delivers the most
drives, they are the service that
collects the most data. And
data remains the most valuable
part of mobility going forward.”
“
- Di-Ann Eisnor, Waze
December 2016
May 23, 2017 Global: Automobiles
Goldman Sachs Global Investment Research 24
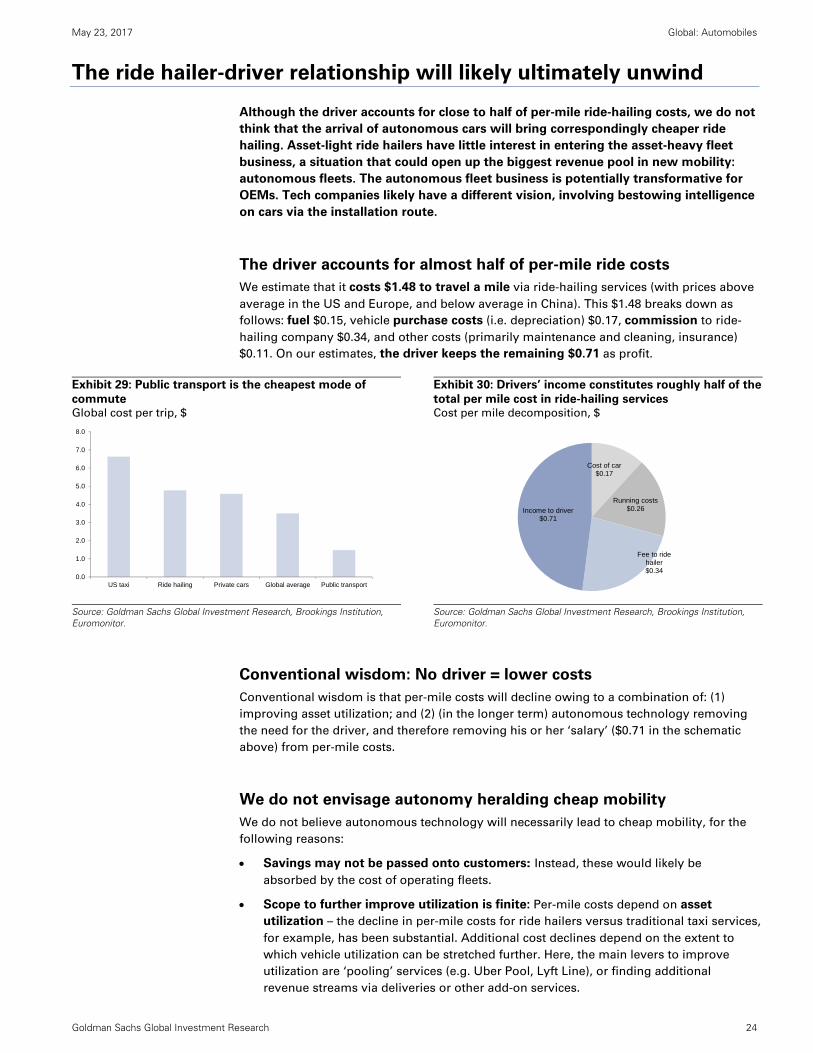
The ride hailer-driver relationship will likely ultimately unwind
Although the driver accounts for close to half of per-mile ride-hailing costs, we do not
think that the arrival of autonomous cars will bring correspondingly cheaper ride
hailing. Asset-light ride hailers have little interest in entering the asset-heavy fleet
business, a situation that could open up the biggest revenue pool in new mobility:
autonomous fleets. The autonomous fleet business is potentially transformative for
OEMs. Tech companies likely have a different vision, involving bestowing intelligence
on cars via the installation route.
The driver accounts for almost half of per-mile ride costs
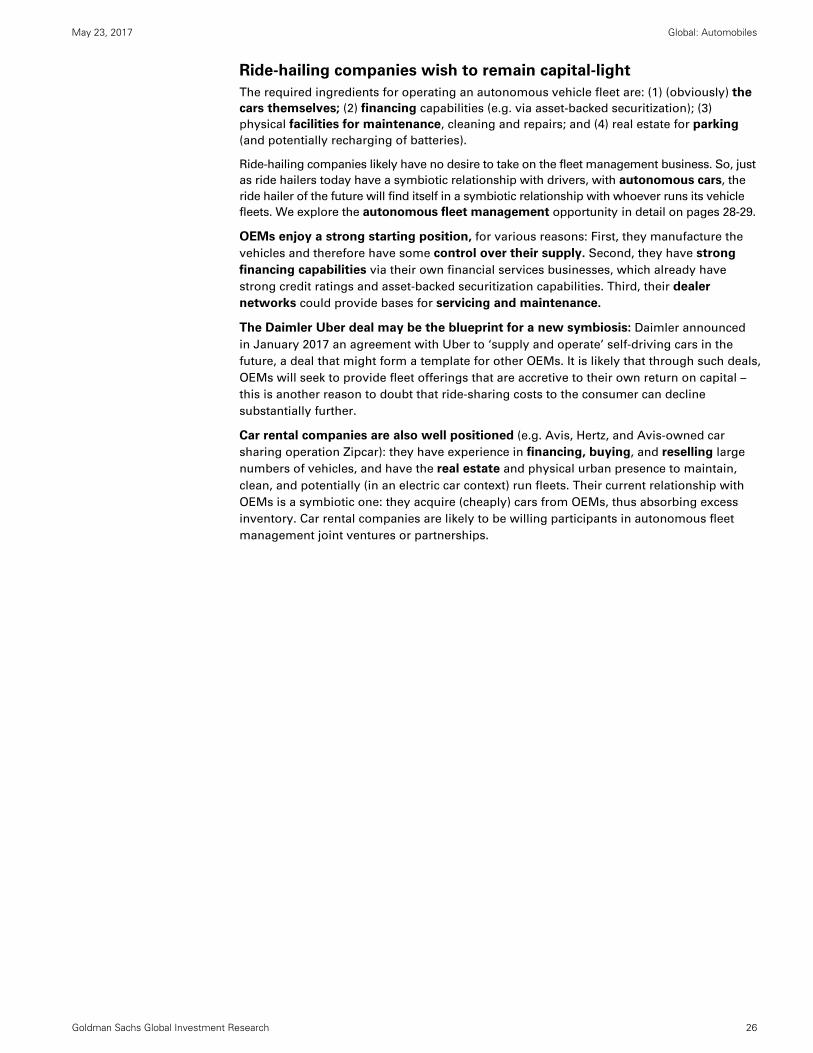
We estimate that it costs $1.48 to travel a mile via ride-hailing services (with prices above
average in the US and Europe, and below average in China). This $1.48 breaks down as
follows: fuel $0.15, vehicle purchase costs (i.e. depreciation) $0.17, commission to ride-
hailing company $0.34, and other costs (primarily maintenance and cleaning, insurance)
$0.11. On our estimates, the driver keeps the remaining $0.71 as profit.
Exhibit 29: Public transport is the cheapest mode of
commute Global cost per trip, $
Exhibit 30: Drivers’ income constitutes roughly half of the
total per mile cost in ride-hailing services Cost per mile decomposition, $
Source: Goldman Sachs Global Investment Research, Brookings Institution, Euromonitor.
Source: Goldman Sachs Global Investment Research, Brookings Institution, Euromonitor.
Conventional wisdom: No driver = lower costs
Conventional wisdom is that per-mile costs will decline owing to a combination of: (1)
improving asset utilization; and (2) (in the longer term) autonomous technology removing
the need for the driver, and therefore removing his or her ‘salary’ ($0.71 in the schematic
above) from per-mile costs.
We do not envisage autonomy heralding cheap mobility
We do not believe autonomous technology will necessarily lead to cheap mobility, for the
following reasons:
Savings may not be passed onto customers: Instead, these would likely be
absorbed by the cost of operating fleets.
Scope to further improve utilization is finite: Per-mile costs depend on asset
utilization – the decline in per-mile costs for ride hailers versus traditional taxi services,
for example, has been substantial. Additional cost declines depend on the extent to
which vehicle utilization can be stretched further. Here, the main levers to improve
utilization are ‘pooling’ services (e.g. Uber Pool, Lyft Line), or finding additional
revenue streams via deliveries or other add-on services.
0.0
1.0
2.0
3.0
4.0
5.0
6.0
7.0
8.0
US taxi Ride hailing Private cars Global average Public transport
Cost of car$0.17
Running costs$0.26
Fee to ride hailer$0.34
Income to driver$0.71
May 23, 2017 Global: Automobiles
Goldman Sachs Global Investment Research 25
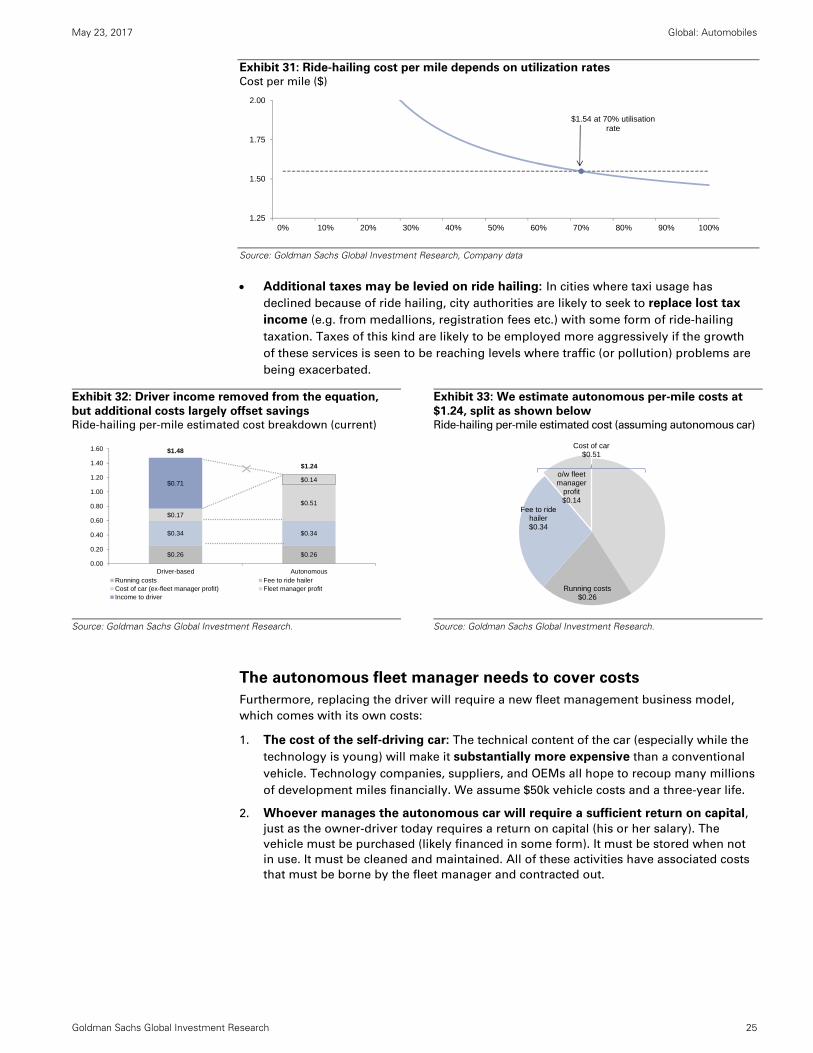
Exhibit 31: Ride-hailing cost per mile depends on utilization rates Cost per mile ($)
Source: Goldman Sachs Global Investment Research, Company data
Additional taxes may be levied on ride hailing: In cities where taxi usage has
declined because of ride hailing, city authorities are likely to seek to replace lost tax
income (e.g. from medallions, registration fees etc.) with some form of ride-hailing
taxation. Taxes of this kind are likely to be employed more aggressively if the growth
of these services is seen to be reaching levels where traffic (or pollution) problems are
being exacerbated.
Exhibit 32: Driver income removed from the equation,
but additional costs largely offset savings Ride-hailing per-mile estimated cost breakdown (current)
Exhibit 33: We estimate autonomous per-mile costs at
$1.24, split as shown below Ride-hailing per-mile estimated cost (assuming autonomous car)
Source: Goldman Sachs Global Investment Research.
Source: Goldman Sachs Global Investment Research.
The autonomous fleet manager needs to cover costs
Furthermore, replacing the driver will require a new fleet management business model,
which comes with its own costs:
1. The cost of the self-driving car: The technical content of the car (especially while the
technology is young) will make it substantially more expensive than a conventional
vehicle. Technology companies, suppliers, and OEMs all hope to recoup many millions
of development miles financially. We assume $50k vehicle costs and a three-year life.
2. Whoever manages the autonomous car will require a sufficient return on capital,
just as the owner-driver today requires a return on capital (his or her salary). The
vehicle must be purchased (likely financed in some form). It must be stored when not
in use. It must be cleaned and maintained. All of these activities have associated costs
that must be borne by the fleet manager and contracted out.
$1.54 at 70% utilisation rate
1.25
1.50
1.75
2.00
0% 10% 20% 30% 40% 50% 60% 70% 80% 90% 100%
$0.26 $0.26
$0.34 $0.34
$0.17
$0.51
$0.14$0.71
$1.48
$1.24
0.00
0.20
0.40
0.60
0.80
1.00
1.20
1.40
1.60
Driver-based AutonomousRunning costs Fee to ride hailerCost of car (ex-fleet manager profit) Fleet manager profitIncome to driver
Cost of car$0.51
Running costs$0.26
Fee to ride hailer$0.34
o/w fleet manager
profit$0.14
May 23, 2017 Global: Automobiles
Goldman Sachs Global Investment Research 26
Ride-hailing companies wish to remain capital-light
The required ingredients for operating an autonomous vehicle fleet are: (1) (obviously) the
cars themselves; (2) financing capabilities (e.g. via asset-backed securitization); (3)
physical facilities for maintenance, cleaning and repairs; and (4) real estate for parking
(and potentially recharging of batteries).
Ride-hailing companies likely have no desire to take on the fleet management business. So, just
as ride hailers today have a symbiotic relationship with drivers, with autonomous cars, the
ride hailer of the future will find itself in a symbiotic relationship with whoever runs its vehicle
fleets. We explore the autonomous fleet management opportunity in detail on pages 28-29.
OEMs enjoy a strong starting position, for various reasons: First, they manufacture the
vehicles and therefore have some control over their supply. Second, they have strong
financing capabilities via their own financial services businesses, which already have
strong credit ratings and asset-backed securitization capabilities. Third, their dealer
networks could provide bases for servicing and maintenance.
The Daimler Uber deal may be the blueprint for a new symbiosis: Daimler announced
in January 2017 an agreement with Uber to ‘supply and operate’ self-driving cars in the
future, a deal that might form a template for other OEMs. It is likely that through such deals,
OEMs will seek to provide fleet offerings that are accretive to their own return on capital –
this is another reason to doubt that ride-sharing costs to the consumer can decline
substantially further.
Car rental companies are also well positioned (e.g. Avis, Hertz, and Avis-owned car
sharing operation Zipcar): they have experience in financing, buying, and reselling large
numbers of vehicles, and have the real estate and physical urban presence to maintain,
clean, and potentially (in an electric car context) run fleets. Their current relationship with
OEMs is a symbiotic one: they acquire (cheaply) cars from OEMs, thus absorbing excess
inventory. Car rental companies are likely to be willing participants in autonomous fleet
management joint ventures or partnerships.
May 23, 2017 Global: Automobiles
Goldman Sachs Global Investment Research 27
The biggest revenue pool in new mobility: Autonomous fleets
Ride hailing likely to gravitate towards a fleet model Ride hailers have clear incentives to remain asset-light. We believe that no current
ride-hailing company has any desire to acquire and operate its own fleet of vehicles.
To do so would mean: (1) moving far beyond its current competencies; and (2) moving
from being an asset-light tech company to a traditional asset-heavy capital enterprise. A
transition to autonomous cars would cut the owner-driver out of the value chain and force
the industry to fill the funding gap with a new source of capital. Commercial fleets of
autonomous cars would at this point start to make economic sense.
Autonomous fleets are the future battleground: Ride-hailing companies currently take a
20%-25% cut of drivers’ fares; at the same time, they need to recruit drivers to grow, and
need to subsidize (or even occasionally fully pay) those drivers to attract new customers. We
believe customer subsidies are a significant contributor to the lack of operating profit
generated by the major ride-hailing companies today. We estimate that the business
opportunity of providing autonomous fleets to ride hailers has the potential to supplant a
population of 6.2 mn drivers. Despite the societal disruption, this process could open up a
new and even bigger revenue pool than that of ride hailing itself. We estimate $220 bn by
2030, up to 3.4x bigger than the net ride-hailer revenue opportunity at that point. We
model a scenario where fleet managers could generate profit of $14 k per car.
Fully autonomous vehicles will disrupt mobility services Most industry participants now agree that fully autonomous (L5) cars are technologically
possible and will be deployable to some degree during the next decade, if not sooner.
However, there remains limited consensus around the precise timing and form of the
rollout of such products or services.
Fleets have the potential to create economies of scale: Hailing services today use cars
(mainly provided by owner-drivers) from a highly fragmented set of sources. The use of
fleets in some form is likely to increase: in the first instance, this would enable
economies of scale. Then, as autonomous cars roll out, fleets would become a necessity,
since the owner-driver would no longer be present in the value chain to provide the capital
to purchase the vehicle. While consumers could buy autonomous cars and lease them out
to the ‘cloud’ (Airbnb style), we think commercial, logistical, and maintenance hurdles
mean commercial autonomous fleets make more sense.
Self-driving cars bring many benefits to ride hailers Fully autonomous cars could benefit ride hailers in several key ways: (1) eliminating
driver subsidies, thereby reducing operating costs; (2) facilitating geographic expansion
by making it easier to co-locate supply with demand (by simply moving the car); and (3)
reducing regulatory challenges around employment contracts and worker rights. All of
this creates the opportunity for a significant reconfiguration of the value chain, involving
replacing ride hailing’s owner-drivers with fleets of self-driving cars. What remains
unclear is how, by whom, and in what form these fleets will be provided.
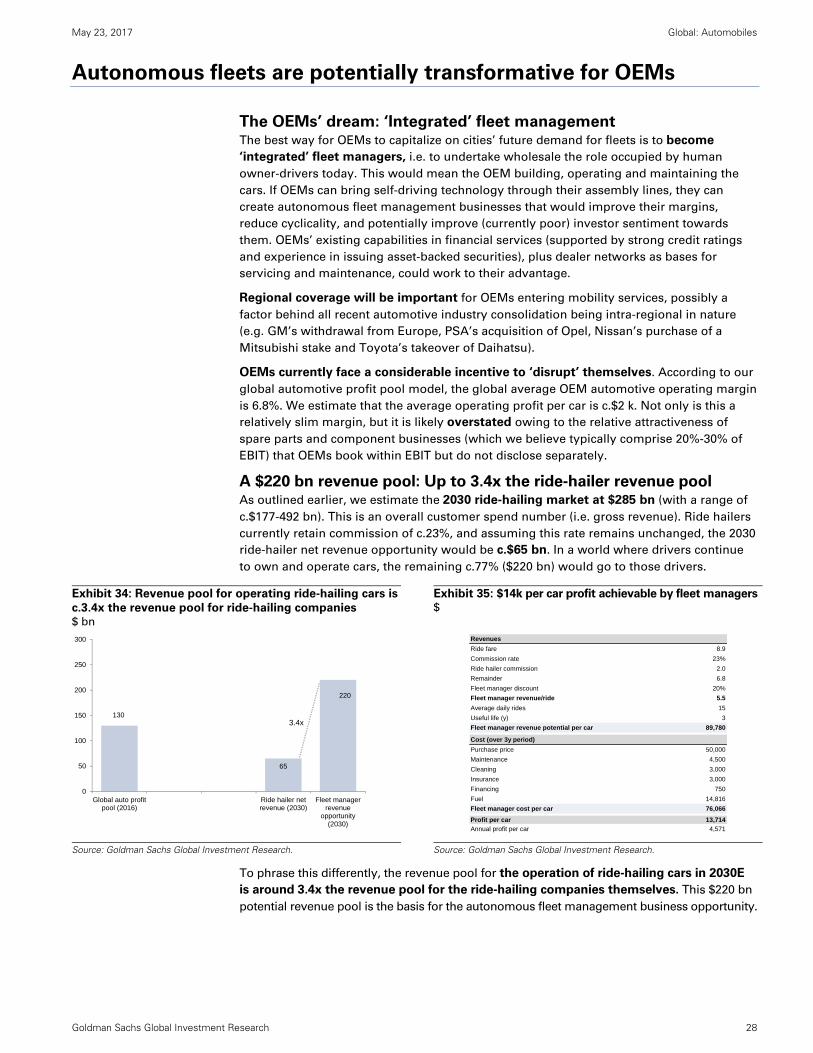
May 23, 2017 Global: Automobiles
Goldman Sachs Global Investment Research 28
Autonomous fleets are potentially transformative for OEMs
The OEMs’ dream: ‘Integrated’ fleet management The best way for OEMs to capitalize on cities’ future demand for fleets is to become
‘integrated’ fleet managers, i.e. to undertake wholesale the role occupied by human
owner-drivers today. This would mean the OEM building, operating and maintaining the
cars. If OEMs can bring self-driving technology through their assembly lines, they can
create autonomous fleet management businesses that would improve their margins,
reduce cyclicality, and potentially improve (currently poor) investor sentiment towards
them. OEMs’ existing capabilities in financial services (supported by strong credit ratings
and experience in issuing asset-backed securities), plus dealer networks as bases for
servicing and maintenance, could work to their advantage.
Regional coverage will be important for OEMs entering mobility services, possibly a
factor behind all recent automotive industry consolidation being intra-regional in nature
(e.g. GM’s withdrawal from Europe, PSA’s acquisition of Opel, Nissan’s purchase of a
Mitsubishi stake and Toyota’s takeover of Daihatsu).
OEMs currently face a considerable incentive to ‘disrupt’ themselves. According to our
global automotive profit pool model, the global average OEM automotive operating margin
is 6.8%. We estimate that the average operating profit per car is c.$2 k. Not only is this a
relatively slim margin, but it is likely overstated owing to the relative attractiveness of
spare parts and component businesses (which we believe typically comprise 20%-30% of
EBIT) that OEMs book within EBIT but do not disclose separately.
A $220 bn revenue pool: Up to 3.4x the ride-hailer revenue pool As outlined earlier, we estimate the 2030 ride-hailing market at $285 bn (with a range of
c.$177-492 bn). This is an overall customer spend number (i.e. gross revenue). Ride hailers
currently retain commission of c.23%, and assuming this rate remains unchanged, the 2030
ride-hailer net revenue opportunity would be c.$65 bn. In a world where drivers continue
to own and operate cars, the remaining c.77% ($220 bn) would go to those drivers.
Exhibit 34: Revenue pool for operating ride-hailing cars is
c.3.4x the revenue pool for ride-hailing companies $ bn
Exhibit 35: $14k per car profit achievable by fleet managers $
Source: Goldman Sachs Global Investment Research.
Source: Goldman Sachs Global Investment Research.
To phrase this differently, the revenue pool for the operation of ride-hailing cars in 2030E
is around 3.4x the revenue pool for the ride-hailing companies themselves. This $220 bn
potential revenue pool is the basis for the autonomous fleet management business opportunity.
130
65
220
0
50
100
150
200
250
300
Global auto profitpool (2016)
Ride hailer netrevenue (2030)
Fleet managerrevenue
opportunity(2030)
3.4x
Revenues
Ride fare 8.9
Commission rate 23%
Ride hailer commission 2.0
Remainder 6.8
Fleet manager discount 20%
Fleet manager revenue/ride 5.5
Average daily rides 15
Useful life (y) 3
Fleet manager revenue potential per car 89,780
Cost (over 3y period)
Purchase price 50,000
Maintenance 4,500
Cleaning 3,000
Insurance 3,000
Financing 750
Fuel 14,816
Fleet manager cost per car 76,066
Profit per car 13,714
Annual profit per car 4,571
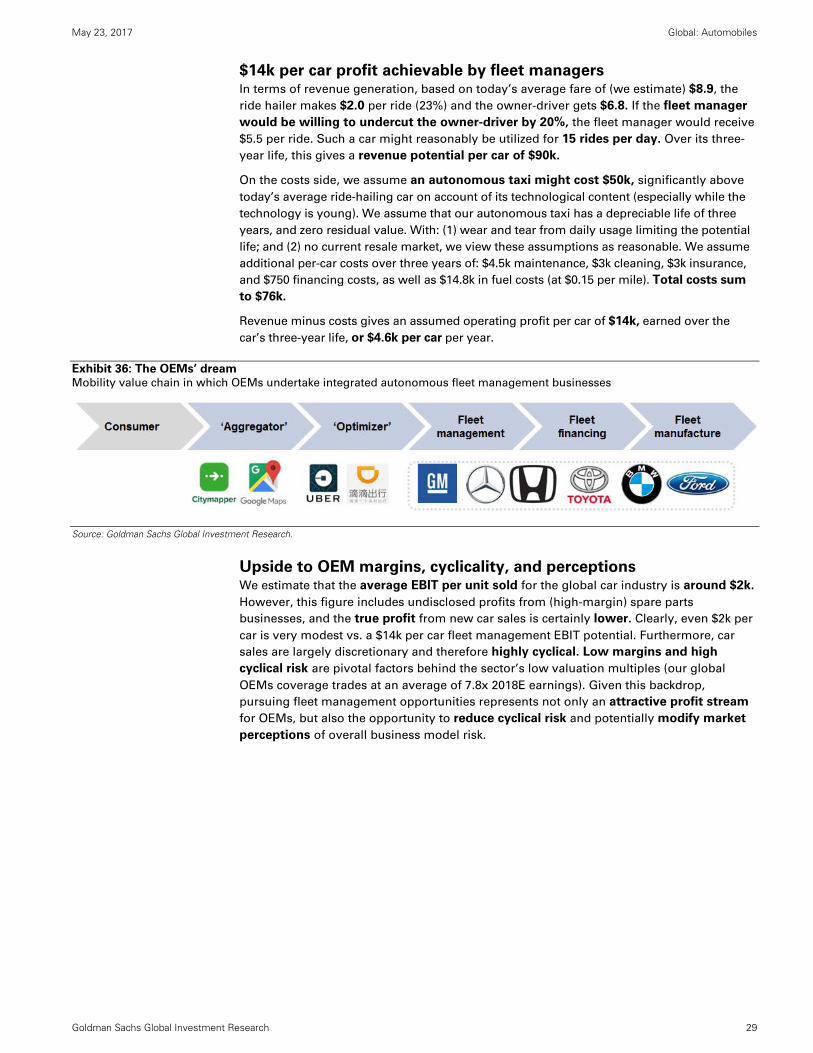
May 23, 2017 Global: Automobiles
Goldman Sachs Global Investment Research 29
$14k per car profit achievable by fleet managers In terms of revenue generation, based on today’s average fare of (we estimate) $8.9, the
ride hailer makes $2.0 per ride (23%) and the owner-driver gets $6.8. If the fleet manager
would be willing to undercut the owner-driver by 20%, the fleet manager would receive
$5.5 per ride. Such a car might reasonably be utilized for 15 rides per day. Over its three-
year life, this gives a revenue potential per car of $90k.
On the costs side, we assume an autonomous taxi might cost $50k, significantly above
today’s average ride-hailing car on account of its technological content (especially while the
technology is young). We assume that our autonomous taxi has a depreciable life of three
years, and zero residual value. With: (1) wear and tear from daily usage limiting the potential
life; and (2) no current resale market, we view these assumptions as reasonable. We assume
additional per-car costs over three years of: $4.5k maintenance, $3k cleaning, $3k insurance,
and $750 financing costs, as well as $14.8k in fuel costs (at $0.15 per mile). Total costs sum
to $76k.
Revenue minus costs gives an assumed operating profit per car of $14k, earned over the
car’s three-year life, or $4.6k per car per year.
Exhibit 36: The OEMs’ dream Mobility value chain in which OEMs undertake integrated autonomous fleet management businesses
Source: Goldman Sachs Global Investment Research.
Upside to OEM margins, cyclicality, and perceptions We estimate that the average EBIT per unit sold for the global car industry is around $2k.
However, this figure includes undisclosed profits from (high-margin) spare parts
businesses, and the true profit from new car sales is certainly lower. Clearly, even $2k per
car is very modest vs. a $14k per car fleet management EBIT potential. Furthermore, car
sales are largely discretionary and therefore highly cyclical. Low margins and high
cyclical risk are pivotal factors behind the sector’s low valuation multiples (our global
OEMs coverage trades at an average of 7.8x 2018E earnings). Given this backdrop,
pursuing fleet management opportunities represents not only an attractive profit stream
for OEMs, but also the opportunity to reduce cyclical risk and potentially modify market
perceptions of overall business model risk.
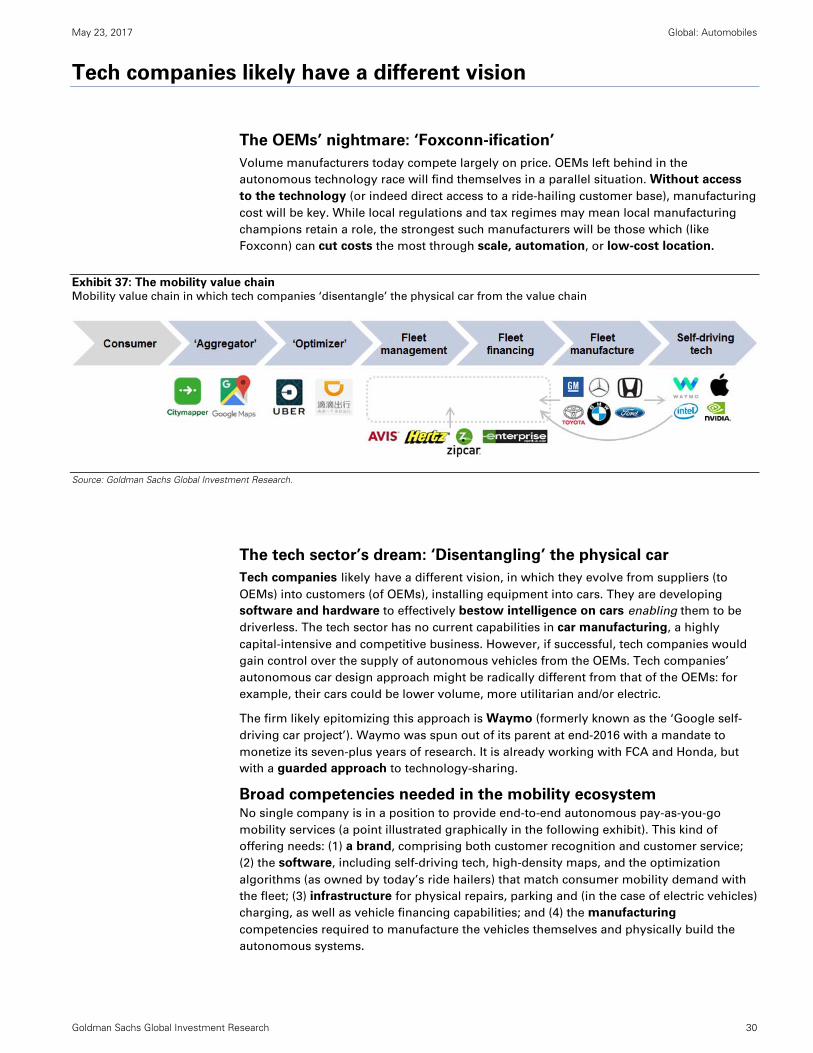
May 23, 2017 Global: Automobiles
Goldman Sachs Global Investment Research 30
Tech companies likely have a different vision
The OEMs’ nightmare: ‘Foxconn-ification’
Volume manufacturers today compete largely on price. OEMs left behind in the
autonomous technology race will find themselves in a parallel situation. Without access
to the technology (or indeed direct access to a ride-hailing customer base), manufacturing
cost will be key. While local regulations and tax regimes may mean local manufacturing
champions retain a role, the strongest such manufacturers will be those which (like
Foxconn) can cut costs the most through scale, automation, or low-cost location.
Exhibit 37: The mobility value chain Mobility value chain in which tech companies ‘disentangle’ the physical car from the value chain
Source: Goldman Sachs Global Investment Research.
The tech sector’s dream: ‘Disentangling’ the physical car
Tech companies likely have a different vision, in which they evolve from suppliers (to
OEMs) into customers (of OEMs), installing equipment into cars. They are developing
software and hardware to effectively bestow intelligence on cars enabling them to be
driverless. The tech sector has no current capabilities in car manufacturing, a highly
capital-intensive and competitive business. However, if successful, tech companies would
gain control over the supply of autonomous vehicles from the OEMs. Tech companies’
autonomous car design approach might be radically different from that of the OEMs: for
example, their cars could be lower volume, more utilitarian and/or electric.
The firm likely epitomizing this approach is Waymo (formerly known as the ‘Google self-
driving car project’). Waymo was spun out of its parent at end-2016 with a mandate to
monetize its seven-plus years of research. It is already working with FCA and Honda, but
with a guarded approach to technology-sharing.
Broad competencies needed in the mobility ecosystem No single company is in a position to provide end-to-end autonomous pay-as-you-go
mobility services (a point illustrated graphically in the following exhibit). This kind of
offering needs: (1) a brand, comprising both customer recognition and customer service;
(2) the software, including self-driving tech, high-density maps, and the optimization
algorithms (as owned by today’s ride hailers) that match consumer mobility demand with
the fleet; (3) infrastructure for physical repairs, parking and (in the case of electric vehicles)
charging, as well as vehicle financing capabilities; and (4) the manufacturing
competencies required to manufacture the vehicles themselves and physically build the
autonomous systems.
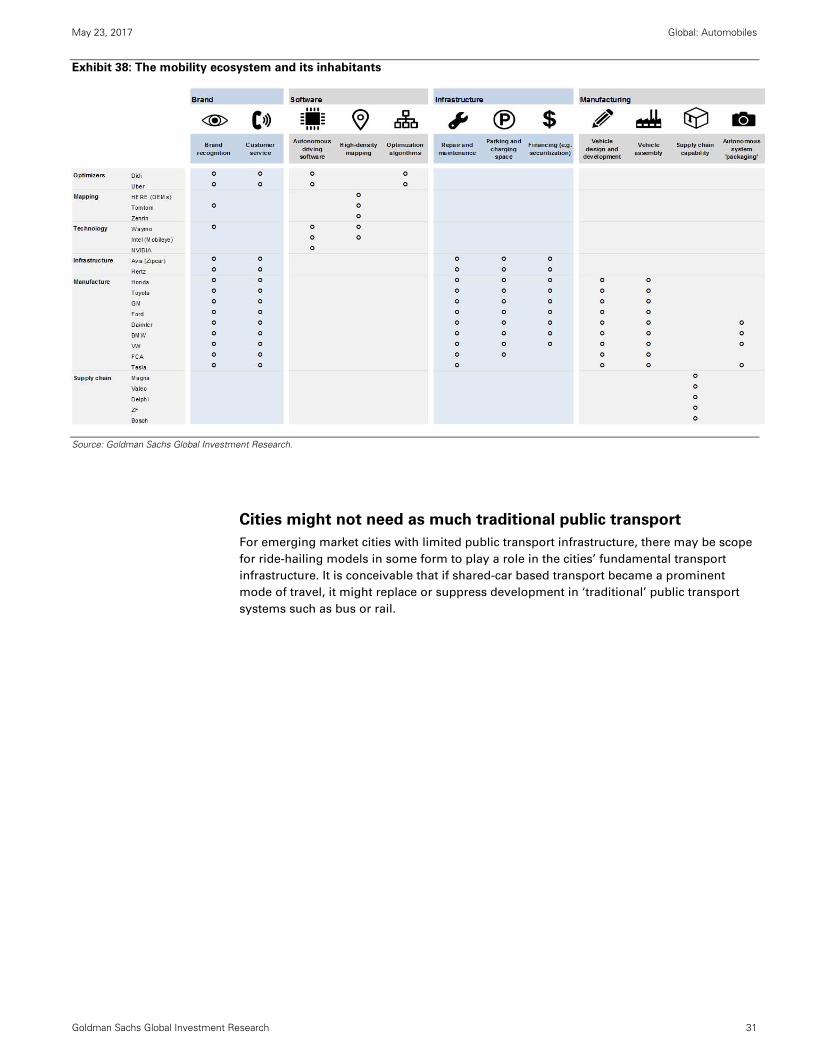
May 23, 2017 Global: Automobiles
Goldman Sachs Global Investment Research 31
Exhibit 38: The mobility ecosystem and its inhabitants
Source: Goldman Sachs Global Investment Research.
Cities might not need as much traditional public transport
For emerging market cities with limited public transport infrastructure, there may be scope
for ride-hailing models in some form to play a role in the cities’ fundamental transport
infrastructure. It is conceivable that if shared-car based transport became a prominent
mode of travel, it might replace or suppress development in ‘traditional’ public transport
systems such as bus or rail.
May 23, 2017 Global: Automobiles
Goldman Sachs Global Investment Research 32
Apple has long been the subject of speculation that it is developing a car, within a workflow called ‘Project Titan’. The
existence of the unofficial project appears largely irrefutable: Tesla CEO Elon Musk has described the project as an
“open secret”. However, the project’s timeline, scope, and level of ambition have been the subject of significant debate
in the press. For example, there is a lack of agreement on whether Apple is developing an Apple-branded car as a
consumer product, or whether it is developing self-driving technologies to be ‘supplied’ to existing manufacturers (as its
CarPlay infotainment suite is today).
Press reports also suggest that the company’s level of commitment to the project has fluctuated: initial stories in
September 2015 (The Wall Street Journal) suggested Apple had assigned several hundred employees to vehicle
development. One year later (September 2016), The New York Times reported that Apple was ‘rethinking’ its strategy on
self-driving cars, and had laid off ‘dozens’ of employees.
While Apple has not officially announced the project, there is evidence of activity. Apple is now trialing its technology
on roads in California, evidenced by its participation (as of April 2017) in California’s department of motor vehicles
(DMV) autonomous vehicle tester program. In addition, late last year (November 2016) Steve Kenner, Apple’s director of
Product Integrity, wrote a now-public letter to US car safety regulator NHTSA urging a loosening of the administrative
burden around autonomous car testing. Apple invested $1 bn in Chinese ride-hailer Didi Chuxing in 2016, suggesting
some interest in broader mobility concepts as distinct from the car as a pure consumer product.
Apple has also engaged in discussions regarding partnerships in technology and manufacturing. Discussions with
German carmakers BMW and Daimler (separately) ended over disagreements over who would lead the projects, and
who would own the data, according to Handelsblatt in April 2016. Apple also approached supercar builder and F1 team
owner McLaren regarding its potential acquisition, according to the FT in September 2015. On the manufacturing front,
FAZ (April 2017) claims that Apple will contract Magna Steyr (a subsidiary of Magna (MGA)) to build the vehicle.
In terms of timing, reports (The Information, July 2016) suggest a planned launch in 2021, pushed back from a previously
planned 2020, highlighting the significant manufacturing and technological challenges involved in such a project.
Delivering mobility services via autonomous vehicles is a complex challenge being addressed on multiple fronts by
various companies all along the value chain. Alphabet (Google) has long-established technology, but not yet a clearly
disclosed vision of how to monetize it. Uber, various automotive manufacturers, tier 1 suppliers, and new entrants are
all working in various forms towards bringing such services closer to reality.
Alphabet: Technology front-runner
Alphabet’s Waymo project has so far driven more than 2 mn miles on road, mostly in California (plus 1 bn miles in
simulation). The self-driving car project started in 2009 within Google and used various modified production cars;
from 2014, it also trialed a fully self-driving vehicle with no driver controls.
In 2016, the project was renamed Waymo and spun into a separate company that remains wholly owned by
Alphabet, but with a clearer mandate to monetize the technology. Waymo has a stated target to release the first
commercial driverless vehicle in 2020.
Another Alphabet-owned company, Waze, has begun experimenting with service offerings, operating car-pooling
trials in Israel and the San Francisco Bay area.
Apple: A word on ‘Project Titan’
On the ground: Autonomous services in testing
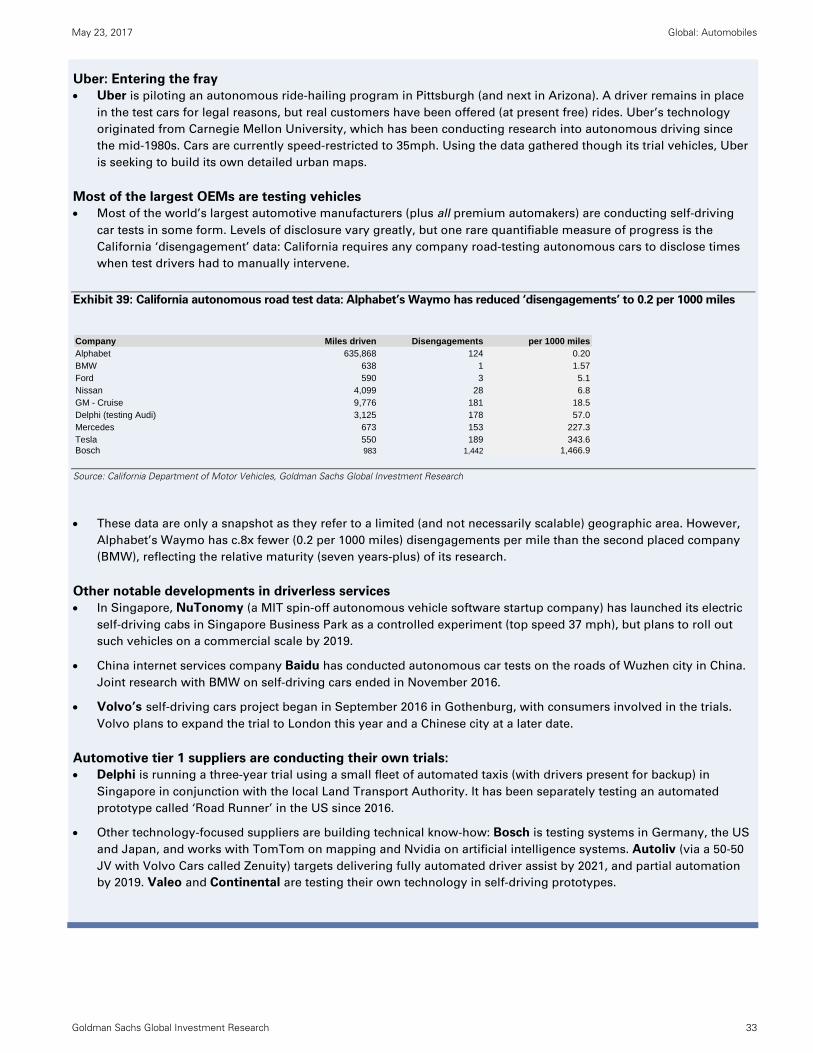
May 23, 2017 Global: Automobiles
Goldman Sachs Global Investment Research 33
Uber: Entering the fray
Uber is piloting an autonomous ride-hailing program in Pittsburgh (and next in Arizona). A driver remains in place
in the test cars for legal reasons, but real customers have been offered (at present free) rides. Uber’s technology
originated from Carnegie Mellon University, which has been conducting research into autonomous driving since
the mid-1980s. Cars are currently speed-restricted to 35mph. Using the data gathered though its trial vehicles, Uber
is seeking to build its own detailed urban maps.
Most of the largest OEMs are testing vehicles
Most of the world’s largest automotive manufacturers (plus all premium automakers) are conducting self-driving
car tests in some form. Levels of disclosure vary greatly, but one rare quantifiable measure of progress is the
California ‘disengagement’ data: California requires any company road-testing autonomous cars to disclose times
when test drivers had to manually intervene.
Exhibit 39: California autonomous road test data: Alphabet’s Waymo has reduced ‘disengagements’ to 0.2 per 1000 miles
Source: California Department of Motor Vehicles, Goldman Sachs Global Investment Research
These data are only a snapshot as they refer to a limited (and not necessarily scalable) geographic area. However,
Alphabet’s Waymo has c.8x fewer (0.2 per 1000 miles) disengagements per mile than the second placed company
(BMW), reflecting the relative maturity (seven years-plus) of its research.
Other notable developments in driverless services
In Singapore, NuTonomy (a MIT spin-off autonomous vehicle software startup company) has launched its electric
self-driving cabs in Singapore Business Park as a controlled experiment (top speed 37 mph), but plans to roll out
such vehicles on a commercial scale by 2019.
China internet services company Baidu has conducted autonomous car tests on the roads of Wuzhen city in China.
Joint research with BMW on self-driving cars ended in November 2016.
Volvo’s self-driving cars project began in September 2016 in Gothenburg, with consumers involved in the trials.
Volvo plans to expand the trial to London this year and a Chinese city at a later date.
Automotive tier 1 suppliers are conducting their own trials:
Delphi is running a three-year trial using a small fleet of automated taxis (with drivers present for backup) in
Singapore in conjunction with the local Land Transport Authority. It has been separately testing an automated
prototype called ‘Road Runner’ in the US since 2016.
Other technology-focused suppliers are building technical know-how: Bosch is testing systems in Germany, the US
and Japan, and works with TomTom on mapping and Nvidia on artificial intelligence systems. Autoliv (via a 50-50
JV with Volvo Cars called Zenuity) targets delivering fully automated driver assist by 2021, and partial automation
by 2019. Valeo and Continental are testing their own technology in self-driving prototypes.
Company Miles driven Disengagements per 1000 milesAlphabet 635,868 124 0.20BMW 638 1 1.57Ford 590 3 5.1Nissan 4,099 28 6.8GM - Cruise 9,776 181 18.5Delphi (testing Audi) 3,125 178 57.0Mercedes 673 153 227.3Tesla 550 189 343.6Bosch 983 1,442 1,466.9

May 23, 2017 Global: Automobiles
Goldman Sachs Global Investment Research 34
Regional considerations Cities ripe for disruption
Introducing the GS Urban Mobility Change Matrix (p. 38)
Push and pull forces at work: A case study in car ownership from
Singapore (p. 42)
Challenges and advantages of regulation from a ride hailer’s
perspective (p. 40)
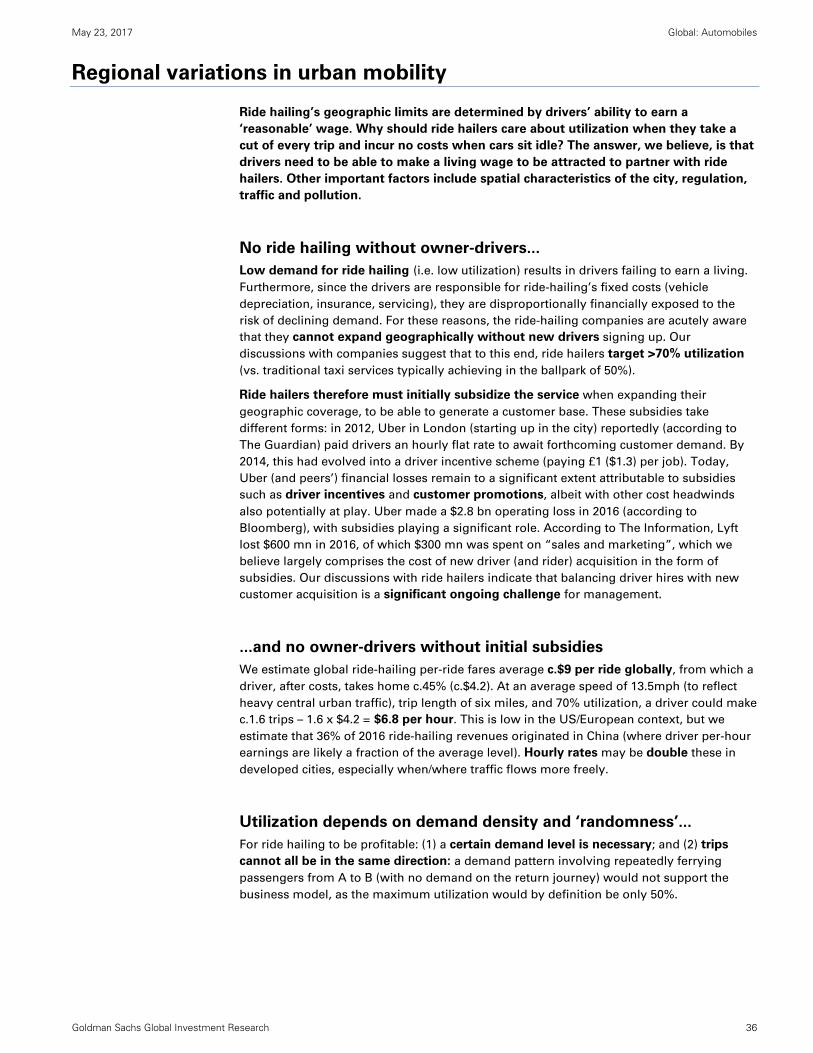
May 23, 2017 Global: Automobiles
Goldman Sachs Global Investment Research 36
Regional variations in urban mobility
Ride hailing’s geographic limits are determined by drivers’ ability to earn a
‘reasonable’ wage. Why should ride hailers care about utilization when they take a
cut of every trip and incur no costs when cars sit idle? The answer, we believe, is that
drivers need to be able to make a living wage to be attracted to partner with ride
hailers. Other important factors include spatial characteristics of the city, regulation,
traffic and pollution.
No ride hailing without owner-drivers...
Low demand for ride hailing (i.e. low utilization) results in drivers failing to earn a living.
Furthermore, since the drivers are responsible for ride-hailing’s fixed costs (vehicle
depreciation, insurance, servicing), they are disproportionally financially exposed to the
risk of declining demand. For these reasons, the ride-hailing companies are acutely aware
that they cannot expand geographically without new drivers signing up. Our
discussions with companies suggest that to this end, ride hailers target >70% utilization
(vs. traditional taxi services typically achieving in the ballpark of 50%).
Ride hailers therefore must initially subsidize the service when expanding their
geographic coverage, to be able to generate a customer base. These subsidies take
different forms: in 2012, Uber in London (starting up in the city) reportedly (according to
The Guardian) paid drivers an hourly flat rate to await forthcoming customer demand. By
2014, this had evolved into a driver incentive scheme (paying £1 ($1.3) per job). Today,
Uber (and peers’) financial losses remain to a significant extent attributable to subsidies
such as driver incentives and customer promotions, albeit with other cost headwinds
also potentially at play. Uber made a $2.8 bn operating loss in 2016 (according to
Bloomberg), with subsidies playing a significant role. According to The Information, Lyft
lost $600 mn in 2016, of which $300 mn was spent on “sales and marketing”, which we
believe largely comprises the cost of new driver (and rider) acquisition in the form of
subsidies. Our discussions with ride hailers indicate that balancing driver hires with new
customer acquisition is a significant ongoing challenge for management.
...and no owner-drivers without initial subsidies
We estimate global ride-hailing per-ride fares average c.$9 per ride globally, from which a
driver, after costs, takes home c.45% (c.$4.2). At an average speed of 13.5mph (to reflect
heavy central urban traffic), trip length of six miles, and 70% utilization, a driver could make
c.1.6 trips – 1.6 x $4.2 = $6.8 per hour. This is low in the US/European context, but we
estimate that 36% of 2016 ride-hailing revenues originated in China (where driver per-hour
earnings are likely a fraction of the average level). Hourly rates may be double these in
developed cities, especially when/where traffic flows more freely.
Utilization depends on demand density and ‘randomness’...
For ride hailing to be profitable: (1) a certain demand level is necessary; and (2) trips
cannot all be in the same direction: a demand pattern involving repeatedly ferrying
passengers from A to B (with no demand on the return journey) would not support the
business model, as the maximum utilization would by definition be only 50%.
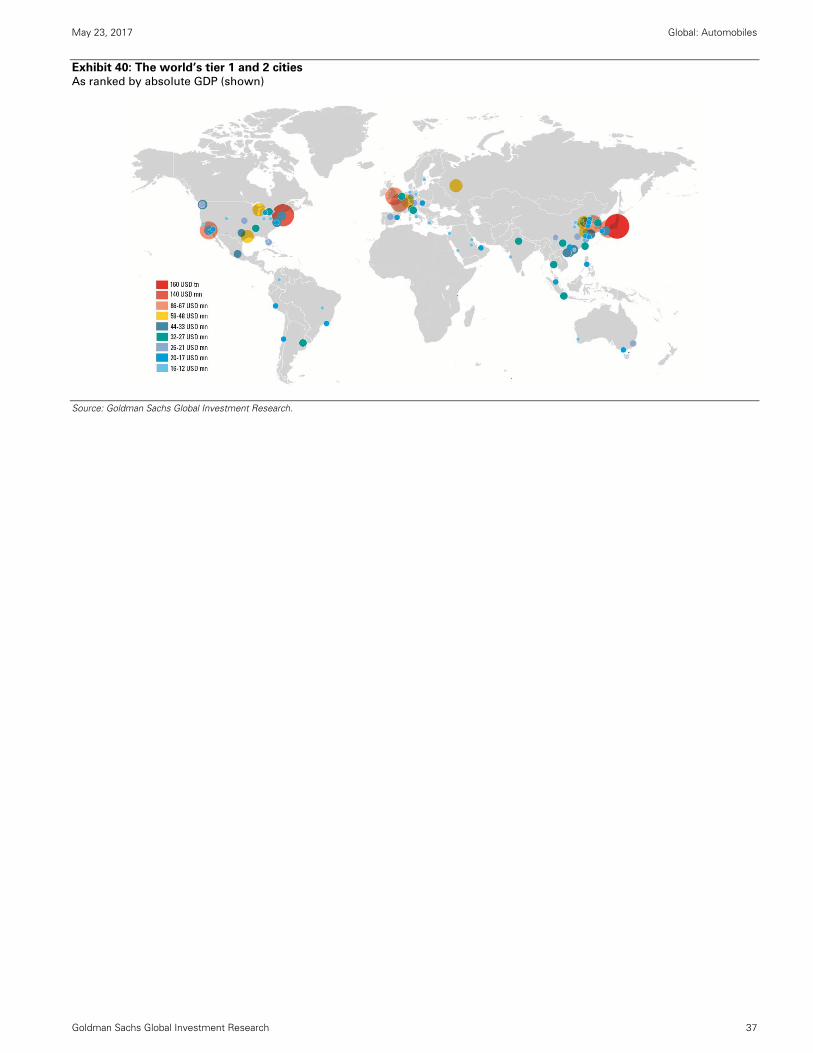
May 23, 2017 Global: Automobiles
Goldman Sachs Global Investment Research 37
Exhibit 40: The world’s tier 1 and 2 cities As ranked by absolute GDP (shown)
Source: Goldman Sachs Global Investment Research.
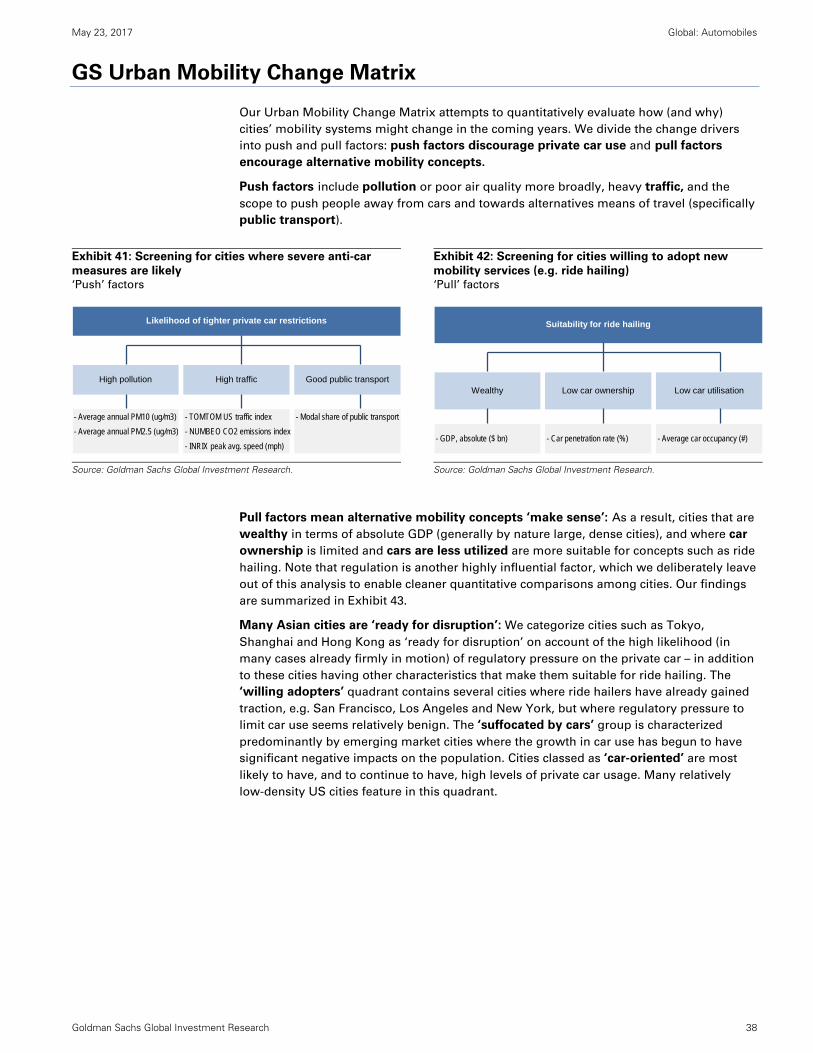
May 23, 2017 Global: Automobiles
Goldman Sachs Global Investment Research 38
GS Urban Mobility Change Matrix
Our Urban Mobility Change Matrix attempts to quantitatively evaluate how (and why)
cities’ mobility systems might change in the coming years. We divide the change drivers
into push and pull factors: push factors discourage private car use and pull factors
encourage alternative mobility concepts.
Push factors include pollution or poor air quality more broadly, heavy traffic, and the
scope to push people away from cars and towards alternatives means of travel (specifically
public transport).
Exhibit 41: Screening for cities where severe anti-car
measures are likely ‘Push’ factors
Exhibit 42: Screening for cities willing to adopt new
mobility services (e.g. ride hailing) ‘Pull’ factors
Source: Goldman Sachs Global Investment Research.
Source: Goldman Sachs Global Investment Research.
Pull factors mean alternative mobility concepts ‘make sense’: As a result, cities that are
wealthy in terms of absolute GDP (generally by nature large, dense cities), and where car
ownership is limited and cars are less utilized are more suitable for concepts such as ride
hailing. Note that regulation is another highly influential factor, which we deliberately leave
out of this analysis to enable cleaner quantitative comparisons among cities. Our findings
are summarized in Exhibit 43.
Many Asian cities are ‘ready for disruption’: We categorize cities such as Tokyo,
Shanghai and Hong Kong as ‘ready for disruption’ on account of the high likelihood (in
many cases already firmly in motion) of regulatory pressure on the private car – in addition
to these cities having other characteristics that make them suitable for ride hailing. The
‘willing adopters’ quadrant contains several cities where ride hailers have already gained
traction, e.g. San Francisco, Los Angeles and New York, but where regulatory pressure to
limit car use seems relatively benign. The ‘suffocated by cars’ group is characterized
predominantly by emerging market cities where the growth in car use has begun to have
significant negative impacts on the population. Cities classed as ‘car-oriented’ are most
likely to have, and to continue to have, high levels of private car usage. Many relatively
low-density US cities feature in this quadrant.
- Average annual PM10 (ug/m3) - TOMTOM US traffic index - Modal share of public transport
- Average annual PM2.5 (ug/m3) - NUMBEO CO2 emissions index
- INRIX peak avg. speed (mph)
High pollution High traffic Good public transport
Likelihood of tighter private car restrictions
- GDP, absolute ($ bn) - Car penetration rate (%) - Average car occupancy (#)
Low car ownership
Suitability for ride hailing
Wealthy Low car utilisation
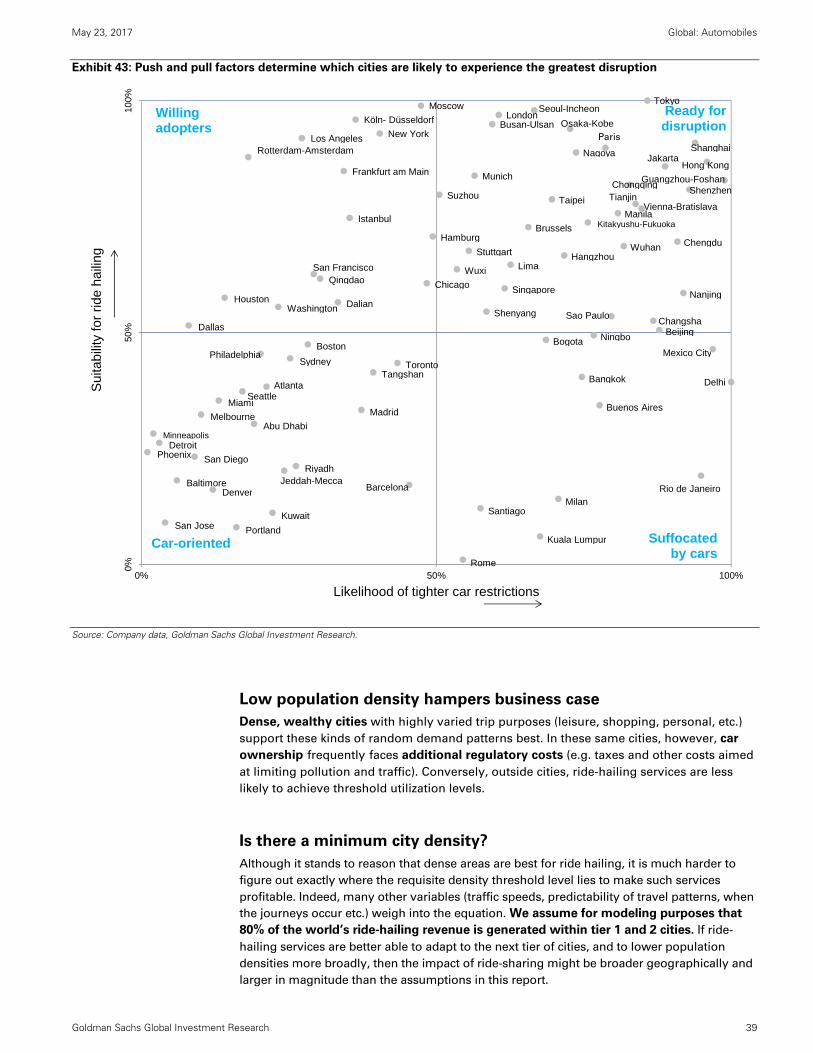
May 23, 2017 Global: Automobiles
Goldman Sachs Global Investment Research 39
Exhibit 43: Push and pull factors determine which cities are likely to experience the greatest disruption
Source: Company data, Goldman Sachs Global Investment Research.
Low population density hampers business case
Dense, wealthy cities with highly varied trip purposes (leisure, shopping, personal, etc.)
support these kinds of random demand patterns best. In these same cities, however, car
ownership frequently faces additional regulatory costs (e.g. taxes and other costs aimed
at limiting pollution and traffic). Conversely, outside cities, ride-hailing services are less
likely to achieve threshold utilization levels.
Is there a minimum city density?
Although it stands to reason that dense areas are best for ride hailing, it is much harder to
figure out exactly where the requisite density threshold level lies to make such services
profitable. Indeed, many other variables (traffic speeds, predictability of travel patterns, when
the journeys occur etc.) weigh into the equation. We assume for modeling purposes that
80% of the world’s ride-hailing revenue is generated within tier 1 and 2 cities. If ride-
hailing services are better able to adapt to the next tier of cities, and to lower population
densities more broadly, then the impact of ride-sharing might be broader geographically and
larger in magnitude than the assumptions in this report.
0%50
%10
0%
0% 50% 100%
Sui
tabi
lity
for
ride
haili
ng
Likelihood of tighter car restrictions
Tokyo
New YorkLos Angeles
Seoul-IncheonLondon
Paris
Osaka-Kobe
Shanghai
Chicago
Moscow
Beijing
Köln- Düsseldorf
HoustonWashington
Sao Paulo
Hong Kong
Dallas
Mexico City
Guangzhou-Foshan
Tianjin
Singapore
Nagoya
Shenzhen
Boston
Istanbul
Philadelphia
Suzhou
San Francisco
Taipei
JakartaRotterdam-Amsterdam
Buenos Aires
Chongqing
Milan
Bangkok
Busan-Ulsan
Atlanta Delhi
Toronto
SeattleMiami
Madrid
Brussels
ChengduWuhan
Frankfurt am Main
Sydney
Munich
Hangzhou
Wuxi
Minneapolis
Qingdao
DetroitPhoenix
Nanjing
San Diego
Dalian
Kitakyushu-Fukuoka
ShenyangChangsha
Vienna-BratislavaManila
Ningbo
MelbourneAbu Dhabi
Rio de Janeiro
Lima
Baltimore
Kuala Lumpur
Santiago
BarcelonaDenver
Kuwait
Riyadh
Rome
Tangshan
Hamburg
Jeddah-Mecca
San Jose
Bogota
Portland
Stuttgart
Ready for disruption
Suffocatedby cars
Willing adopters
Car-oriented
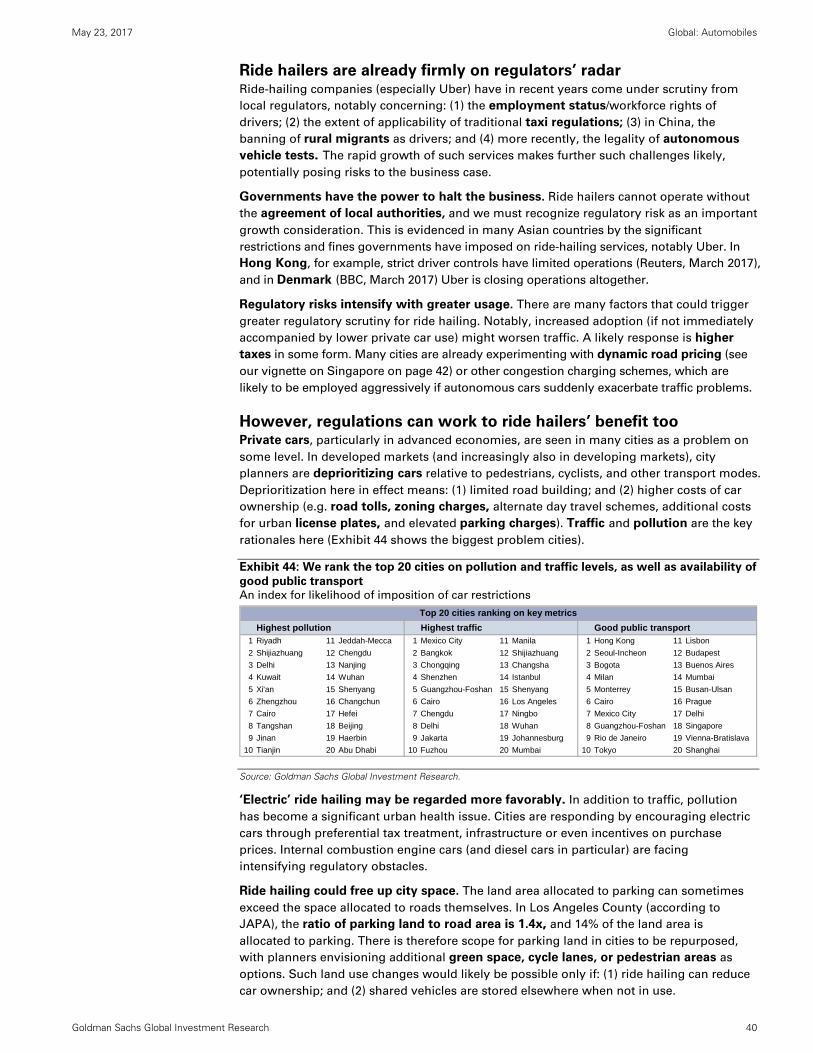
May 23, 2017 Global: Automobiles
Goldman Sachs Global Investment Research 40
Ride hailers are already firmly on regulators’ radar Ride-hailing companies (especially Uber) have in recent years come under scrutiny from
local regulators, notably concerning: (1) the employment status/workforce rights of
drivers; (2) the extent of applicability of traditional taxi regulations; (3) in China, the
banning of rural migrants as drivers; and (4) more recently, the legality of autonomous
vehicle tests. The rapid growth of such services makes further such challenges likely,
potentially posing risks to the business case.
Governments have the power to halt the business. Ride hailers cannot operate without
the agreement of local authorities, and we must recognize regulatory risk as an important
growth consideration. This is evidenced in many Asian countries by the significant
restrictions and fines governments have imposed on ride-hailing services, notably Uber. In
Hong Kong, for example, strict driver controls have limited operations (Reuters, March 2017),
and in Denmark (BBC, March 2017) Uber is closing operations altogether.
Regulatory risks intensify with greater usage. There are many factors that could trigger
greater regulatory scrutiny for ride hailing. Notably, increased adoption (if not immediately
accompanied by lower private car use) might worsen traffic. A likely response is higher
taxes in some form. Many cities are already experimenting with dynamic road pricing (see
our vignette on Singapore on page 42) or other congestion charging schemes, which are
likely to be employed aggressively if autonomous cars suddenly exacerbate traffic problems.
However, regulations can work to ride hailers’ benefit too Private cars, particularly in advanced economies, are seen in many cities as a problem on
some level. In developed markets (and increasingly also in developing markets), city
planners are deprioritizing cars relative to pedestrians, cyclists, and other transport modes.
Deprioritization here in effect means: (1) limited road building; and (2) higher costs of car
ownership (e.g. road tolls, zoning charges, alternate day travel schemes, additional costs
for urban license plates, and elevated parking charges). Traffic and pollution are the key
rationales here (Exhibit 44 shows the biggest problem cities).
Exhibit 44: We rank the top 20 cities on pollution and traffic levels, as well as availability of
good public transport An index for likelihood of imposition of car restrictions
Source: Goldman Sachs Global Investment Research.
‘Electric’ ride hailing may be regarded more favorably. In addition to traffic, pollution
has become a significant urban health issue. Cities are responding by encouraging electric
cars through preferential tax treatment, infrastructure or even incentives on purchase
prices. Internal combustion engine cars (and diesel cars in particular) are facing
intensifying regulatory obstacles.
Ride hailing could free up city space. The land area allocated to parking can sometimes
exceed the space allocated to roads themselves. In Los Angeles County (according to
JAPA), the ratio of parking land to road area is 1.4x, and 14% of the land area is
allocated to parking. There is therefore scope for parking land in cities to be repurposed,
with planners envisioning additional green space, cycle lanes, or pedestrian areas as
options. Such land use changes would likely be possible only if: (1) ride hailing can reduce
car ownership; and (2) shared vehicles are stored elsewhere when not in use.
Highest pollution Highest traffic Good public transport1 Riyadh 11 Jeddah-Mecca 1 Mexico City 11 Manila 1 Hong Kong 11 Lisbon
2 Shijiazhuang 12 Chengdu 2 Bangkok 12 Shijiazhuang 2 Seoul-Incheon 12 Budapest
3 Delhi 13 Nanjing 3 Chongqing 13 Changsha 3 Bogota 13 Buenos Aires
4 Kuwait 14 Wuhan 4 Shenzhen 14 Istanbul 4 Milan 14 Mumbai
5 Xi'an 15 Shenyang 5 Guangzhou-Foshan 15 Shenyang 5 Monterrey 15 Busan-Ulsan
6 Zhengzhou 16 Changchun 6 Cairo 16 Los Angeles 6 Cairo 16 Prague
7 Cairo 17 Hefei 7 Chengdu 17 Ningbo 7 Mexico City 17 Delhi
8 Tangshan 18 Beijing 8 Delhi 18 Wuhan 8 Guangzhou-Foshan 18 Singapore
9 Jinan 19 Haerbin 9 Jakarta 19 Johannesburg 9 Rio de Janeiro 19 Vienna-Bratislava
10 Tianjin 20 Abu Dhabi 10 Fuzhou 20 Mumbai 10 Tokyo 20 Shanghai
Top 20 cities ranking on key metrics
May 23, 2017 Global: Automobiles
Goldman Sachs Global Investment Research 41
Regional ride-hailing champions emerging
The ride-hailing business model is dependent on scale, for which substantial investment
is a requisite. Building up a population of owner-drivers that is: (1) right-sized to customer
demand in the region; and (2) confident of sufficient work to earn their required wage is a
costly process. Uber pulled out of China in 2016 (having incurred regional expansion costs
peaking at $1 bn a year), selling its operations to Didi. We believe that ride hailers will
continue to develop into regional champions as market participants approach
aggressively competitive markets with continued caution. Continental Europe remains a
largely open market opportunity, mainly because of the aforementioned regulatory
hurdles limiting opportunities to date in selected countries.
5G infrastructure plays an enabling role
We expect 5G networks to play a meaningful role as a technological enabler for
autonomous vehicles. While L2 vehicles currently in production largely rely on sensors
within the vehicle, our Tech analysts have previously argued that wireless connectivity will be
an important element of technology underpinning fully autonomous vehicles.
For instance, V2V connectivity will be relevant for autonomous driving. While the
processing of data from sensors on the vehicle itself can facilitate autonomy, V2V can add
an extra layer of robustness such that regulators have enough confidence to allow L4/L5
driving. In this context, vehicles would need to gather information from other cars and
make informed decisions quickly. This demands extremely reliable communication
systems given that human safety is involved and owing to the exacting failure rate
requirements of automotive grade technology. We note that Nokia sees end-to-end latency
requirements in this context as being as low as 5-10ms. As a result, the improved latency
qualities of 5G base stations (as opposed to those of 4G ones) will be required.
Further, in line with our colleagues’ thesis, real-time mapping will be an important
component of autonomous driving. While again, a car could in theory operate
autonomously solely based on a sensor array and intelligent processing of the generated
data on the car, frequently updated maps of key road features (crowdsourced from
consumers’ cars) will add extra needed reliability. This means that vehicles will be
generating significant amounts of data that will be sent to the cloud to be processed and
integrated into a constantly evolving granular map, and will also need to receive mapping
data frequently so that the car can react in a new driving scene. While the bandwidth of
data transfer required can vary with different approaches to mapping (i.e. 2D vs. 3D maps),
we see 5G as a key enabler for autonomous driving given faster speeds (c.600x faster than
LTE) and ultra-low latency features.
Finally, we also expect 5G to enable OTA (over-the-air) software and firmware updates
in cars (Cloud-to-Car connectivity), which could be pivotal for autonomous driving from a
security perspective (with updates potentially occurring with relatively high frequency).
Given recent hacking incidents, we expect an intense focus on the ability to dynamically
upgrade the car to protect against threats.
Under the ground or into the air
The tech sector is evaluating mobility-oriented ideas significantly more radical than ride
hailing. Small vehicles that can take off vertically in urban environments are an old idea
gaining renewed traction: Airbus plans to begin testing a self-piloted flying vehicle during
2017, with the idea that this could be used in urban hailing scenarios. Uber is also exploring
flying vehicles, and plans to give an ‘urban aviation ecosystem’ demo by 2020 (in partnership
with the cities of Dallas and Dubai). Meanwhile Tesla CEO Elon Musk has established a
tunneling business (‘The Boring Company’) and presented a concept for an underground
network of tunnels that carry cars on electrified trailers on rails.
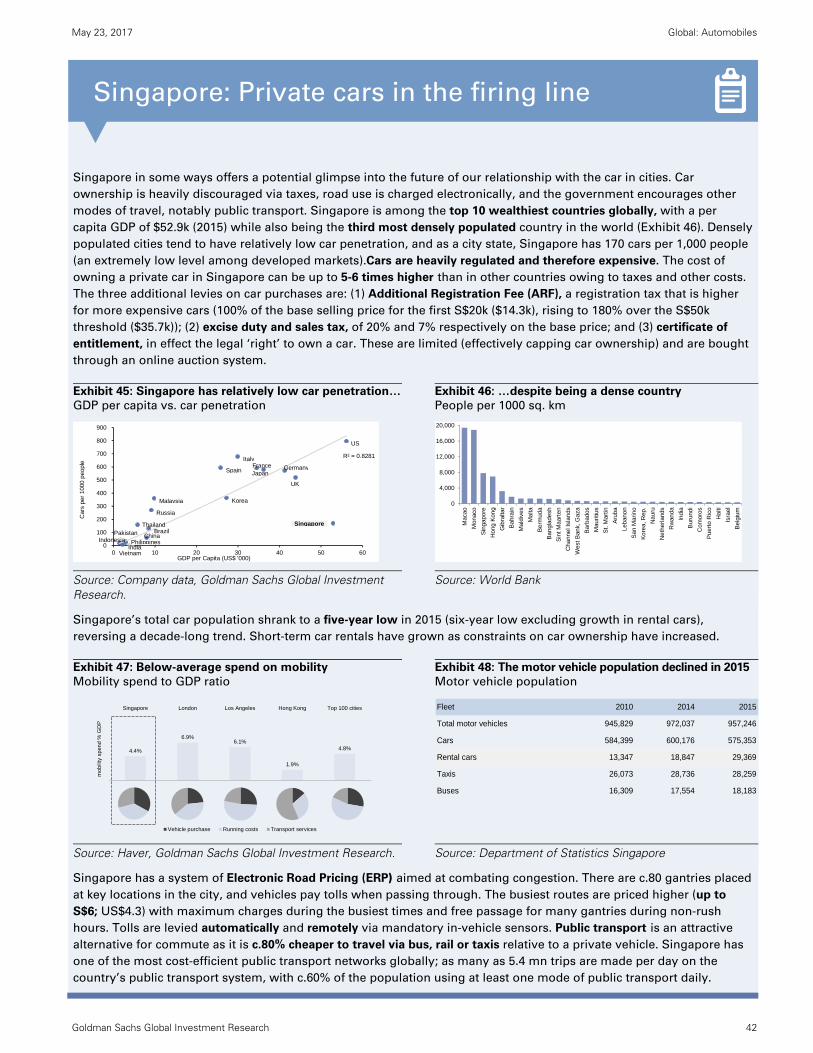
May 23, 2017 Global: Automobiles
Goldman Sachs Global Investment Research 42
Singapore in some ways offers a potential glimpse into the future of our relationship with the car in cities. Car
ownership is heavily discouraged via taxes, road use is charged electronically, and the government encourages other
modes of travel, notably public transport. Singapore is among the top 10 wealthiest countries globally, with a per
capita GDP of $52.9k (2015) while also being the third most densely populated country in the world (Exhibit 46). Densely
populated cities tend to have relatively low car penetration, and as a city state, Singapore has 170 cars per 1,000 people
(an extremely low level among developed markets).Cars are heavily regulated and therefore expensive. The cost of
owning a private car in Singapore can be up to 5-6 times higher than in other countries owing to taxes and other costs.
The three additional levies on car purchases are: (1) Additional Registration Fee (ARF), a registration tax that is higher
for more expensive cars (100% of the base selling price for the first S$20k ($14.3k), rising to 180% over the S$50k
threshold ($35.7k)); (2) excise duty and sales tax, of 20% and 7% respectively on the base price; and (3) certificate of
entitlement, in effect the legal ‘right’ to own a car. These are limited (effectively capping car ownership) and are bought
through an online auction system.
Exhibit 45: Singapore has relatively low car penetration…
GDP per capita vs. car penetration
Exhibit 46: …despite being a dense country
People per 1000 sq. km
Source: Company data, Goldman Sachs Global Investment Research.
Source: World Bank
Singapore’s total car population shrank to a five-year low in 2015 (six-year low excluding growth in rental cars),
reversing a decade-long trend. Short-term car rentals have grown as constraints on car ownership have increased.
Exhibit 47: Below-average spend on mobility
Mobility spend to GDP ratio
Exhibit 48: The motor vehicle population declined in 2015
Motor vehicle population
Source: Haver, Goldman Sachs Global Investment Research.
Source: Department of Statistics Singapore
Singapore has a system of Electronic Road Pricing (ERP) aimed at combating congestion. There are c.80 gantries placed
at key locations in the city, and vehicles pay tolls when passing through. The busiest routes are priced higher (up to
S$6; US$4.3) with maximum charges during the busiest times and free passage for many gantries during non-rush
hours. Tolls are levied automatically and remotely via mandatory in-vehicle sensors. Public transport is an attractive
alternative for commute as it is c.80% cheaper to travel via bus, rail or taxis relative to a private vehicle. Singapore has
one of the most cost-efficient public transport networks globally; as many as 5.4 mn trips are made per day on the
country’s public transport system, with c.60% of the population using at least one mode of public transport daily.
R² = 0.8281
0
100
200
300
400
500
600
700
800
900
0 10 20 30 40 50 60
Car
s pe
r 10
00 p
eopl
e
GDP per Capita (US$ '000)
Japan
US
Korea
FranceItaly
UK
GermanySpain
Brazil
Russia
India
China
Malaysia
Thailand
Indonesia
Vietnam
Philippines
Pakistan
Singapore
0
4,000
8,000
12,000
16,000
20,000
Mac
ao
Mon
aco
Sin
ga
pore
Hon
g K
ong
Gib
ralta
r
Ba
hrai
n
Ma
ldiv
es
Ma
lta
Be
rmu
da
Ba
ngla
desh
Sin
t Maa
rten
Cha
nne
l Isl
ands
Wes
t Ban
k, G
aza
Ba
rbad
os
Mau
ritiu
s
St.
Mar
tin
Aru
ba
Leba
non
Sa
n M
arin
o
Ko
rea,
Rep
.
Nau
ru
Ne
the
rland
s
Rw
and
a
Indi
a
Bu
rund
i
Com
oros
Pu
erto
Ric
o
Hai
ti
Isra
el
Be
lgiu
m
4.4%
6.9%6.1%
1.9%
4.8%
Singapore London Los Angeles Hong Kong Top 100 cities
mob
ility
sp
end
% G
DP
Vehicle purchase Running costs Transport services
Fleet 2010 2014 2015
Total motor vehicles 945,829 972,037 957,246
Cars 584,399 600,176 575,353
Rental cars 13,347 18,847 29,369
Taxis 26,073 28,736 28,259
Buses 16,309 17,554 18,183
Singapore: Private cars in the firing line
Car market impact Ownership to survive, sales to hold firm
Understanding the high-turnover model for ride-sharing vehicles (p. 44)
Emerging market considerations: Ownership still the goal (p. 46)
Developed market considerations: Ownership and sharing aren’t
substitutes (p. 47)
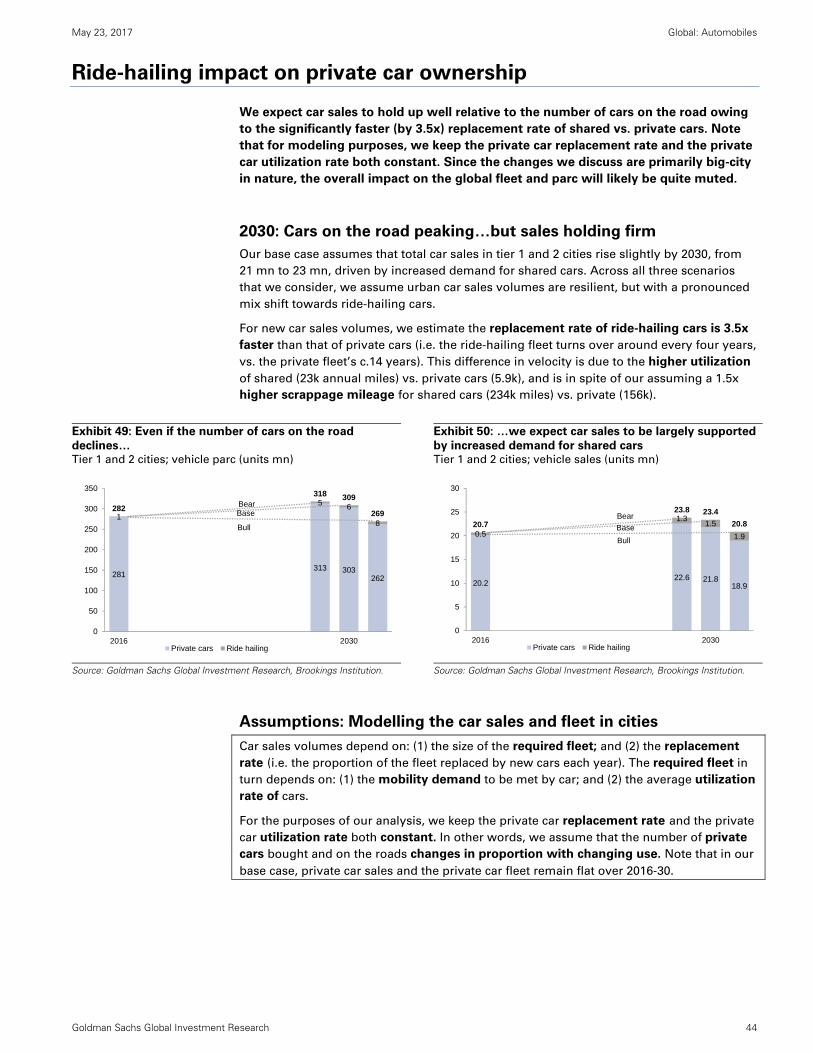
May 23, 2017 Global: Automobiles
Goldman Sachs Global Investment Research 44
Ride-hailing impact on private car ownership
We expect car sales to hold up well relative to the number of cars on the road owing
to the significantly faster (by 3.5x) replacement rate of shared vs. private cars. Note
that for modeling purposes, we keep the private car replacement rate and the private
car utilization rate both constant. Since the changes we discuss are primarily big-city
in nature, the overall impact on the global fleet and parc will likely be quite muted.
2030: Cars on the road peaking…but sales holding firm
Our base case assumes that total car sales in tier 1 and 2 cities rise slightly by 2030, from
21 mn to 23 mn, driven by increased demand for shared cars. Across all three scenarios
that we consider, we assume urban car sales volumes are resilient, but with a pronounced
mix shift towards ride-hailing cars.
For new car sales volumes, we estimate the replacement rate of ride-hailing cars is 3.5x
faster than that of private cars (i.e. the ride-hailing fleet turns over around every four years,
vs. the private fleet’s c.14 years). This difference in velocity is due to the higher utilization
of shared (23k annual miles) vs. private cars (5.9k), and is in spite of our assuming a 1.5x
higher scrappage mileage for shared cars (234k miles) vs. private (156k).
Exhibit 49: Even if the number of cars on the road
declines… Tier 1 and 2 cities; vehicle parc (units mn)
Exhibit 50: …we expect car sales to be largely supported
by increased demand for shared cars Tier 1 and 2 cities; vehicle sales (units mn)
Source: Goldman Sachs Global Investment Research, Brookings Institution.
Source: Goldman Sachs Global Investment Research, Brookings Institution.
Assumptions: Modelling the car sales and fleet in cities
Car sales volumes depend on: (1) the size of the required fleet; and (2) the replacement
rate (i.e. the proportion of the fleet replaced by new cars each year). The required fleet in
turn depends on: (1) the mobility demand to be met by car; and (2) the average utilization
rate of cars.
For the purposes of our analysis, we keep the private car replacement rate and the private
car utilization rate both constant. In other words, we assume that the number of private
cars bought and on the roads changes in proportion with changing use. Note that in our
base case, private car sales and the private car fleet remain flat over 2016-30.
281313 303
262
1
5 6
8
282
318 309
269
0
50
100
150
200
250
300
350
2016 2030Private cars Ride hailing
Bear
Bull
Base
20.222.6 21.8
18.9
0.5
1.31.5
1.9
20.7
23.8 23.4
20.8
0
5
10
15
20
25
30
2016 2030Private cars Ride hailing
Bear
Bull
Base
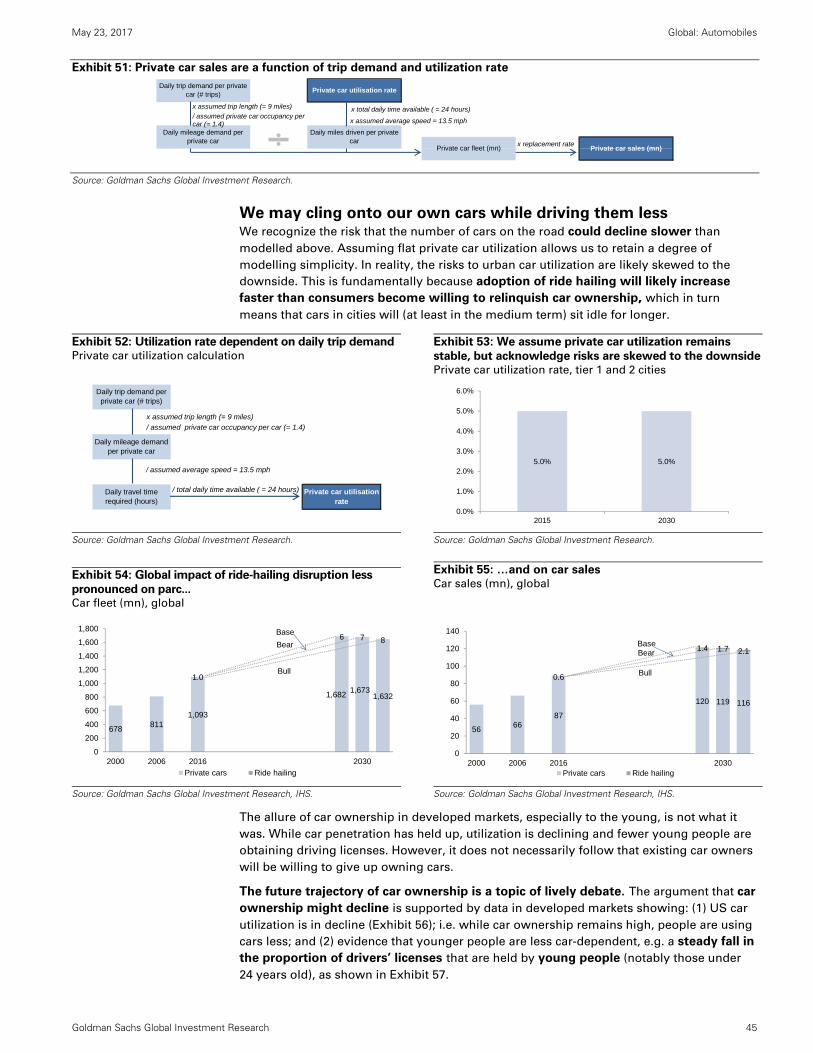
May 23, 2017 Global: Automobiles
Goldman Sachs Global Investment Research 45
Exhibit 51: Private car sales are a function of trip demand and utilization rate
Source: Goldman Sachs Global Investment Research.
We may cling onto our own cars while driving them less We recognize the risk that the number of cars on the road could decline slower than
modelled above. Assuming flat private car utilization allows us to retain a degree of
modelling simplicity. In reality, the risks to urban car utilization are likely skewed to the
downside. This is fundamentally because adoption of ride hailing will likely increase
faster than consumers become willing to relinquish car ownership, which in turn
means that cars in cities will (at least in the medium term) sit idle for longer.
Exhibit 52: Utilization rate dependent on daily trip demandPrivate car utilization calculation
Exhibit 53: We assume private car utilization remains
stable, but acknowledge risks are skewed to the downsidePrivate car utilization rate, tier 1 and 2 cities
Source: Goldman Sachs Global Investment Research.
Source: Goldman Sachs Global Investment Research.
Exhibit 54: Global impact of ride-hailing disruption less
pronounced on parc... Car fleet (mn), global
Exhibit 55: …and on car sales Car sales (mn), global
Source: Goldman Sachs Global Investment Research, IHS.
Source: Goldman Sachs Global Investment Research, IHS.
The allure of car ownership in developed markets, especially to the young, is not what it
was. While car penetration has held up, utilization is declining and fewer young people are
obtaining driving licenses. However, it does not necessarily follow that existing car owners
will be willing to give up owning cars.
The future trajectory of car ownership is a topic of lively debate. The argument that car
ownership might decline is supported by data in developed markets showing: (1) US car
utilization is in decline (Exhibit 56); i.e. while car ownership remains high, people are using
cars less; and (2) evidence that younger people are less car-dependent, e.g. a steady fall in
the proportion of drivers’ licenses that are held by young people (notably those under
24 years old), as shown in Exhibit 57.
Private car sales (mn)
Daily trip demand per private car (# trips)
Daily mileage demand per private car
Private car utilisation rate
Daily miles driven per private car
Private car fleet (mn)
x assumed trip length (= 9 miles)
/ assumed private car occupancy per car (= 1.4)
x total daily time available ( = 24 hours)
x assumed average speed = 13.5 mph
x replacement rate
Daily mileage demand per private car
Daily travel time required (hours)
Private car utilisation rate
Daily trip demand per private car (# trips)
x assumed trip length (= 9 miles)
/ assumed private car occupancy per car (= 1.4)
/ assumed average speed = 13.5 mph
/ total daily time available ( = 24 hours)
5.0% 5.0%
0.0%
1.0%
2.0%
3.0%
4.0%
5.0%
6.0%
2015 2030
678811
1,093
1,6821,673
1,632
1.0
6 7 8
0
200
400
600
800
1,000
1,200
1,400
1,600
1,800
2000 2006 2016 2030
Private cars Ride hailing
Bear
Bull
Base
5666
87
120 119 116
0.6
1.4 1.7 2.1
0
20
40
60
80
100
120
140
2000 2006 2016 2030Private cars Ride hailing
Bear
Bull
Base
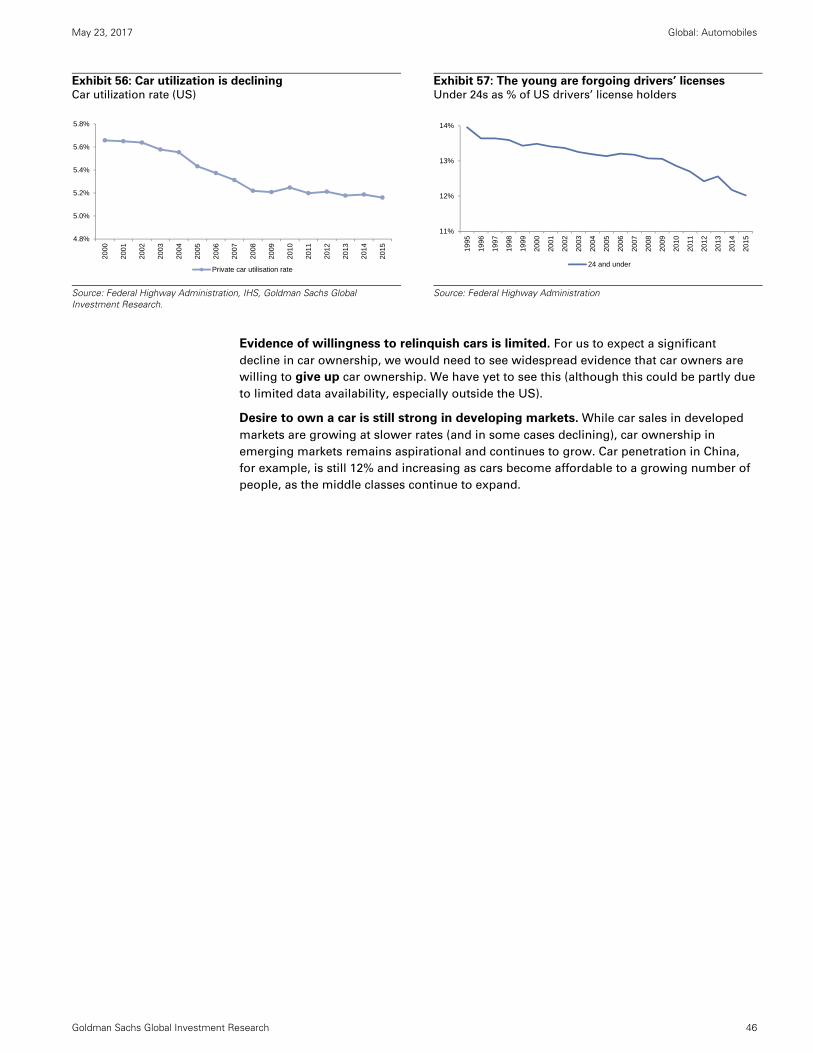
May 23, 2017 Global: Automobiles
Goldman Sachs Global Investment Research 46
Exhibit 56: Car utilization is declining Car utilization rate (US)
Exhibit 57: The young are forgoing drivers’ licenses Under 24s as % of US drivers’ license holders
Source: Federal Highway Administration, IHS, Goldman Sachs Global Investment Research.
Source: Federal Highway Administration
Evidence of willingness to relinquish cars is limited. For us to expect a significant
decline in car ownership, we would need to see widespread evidence that car owners are
willing to give up car ownership. We have yet to see this (although this could be partly due
to limited data availability, especially outside the US).
Desire to own a car is still strong in developing markets. While car sales in developed
markets are growing at slower rates (and in some cases declining), car ownership in
emerging markets remains aspirational and continues to grow. Car penetration in China,
for example, is still 12% and increasing as cars become affordable to a growing number of
people, as the middle classes continue to expand.
4.8%
5.0%
5.2%
5.4%
5.6%
5.8%
2000
2001
2002
2003
2004
2005
2006
2007
2008
2009
2010
2011
2012
2013
2014
2015
Private car utilisation rate
11%
12%
13%
14%
1995
1996
1997
1998
1999
2000
2001
2002
2003
2004
2005
2006
2007
2008
2009
2010
2011
2012
2013
2014
2015
24 and under
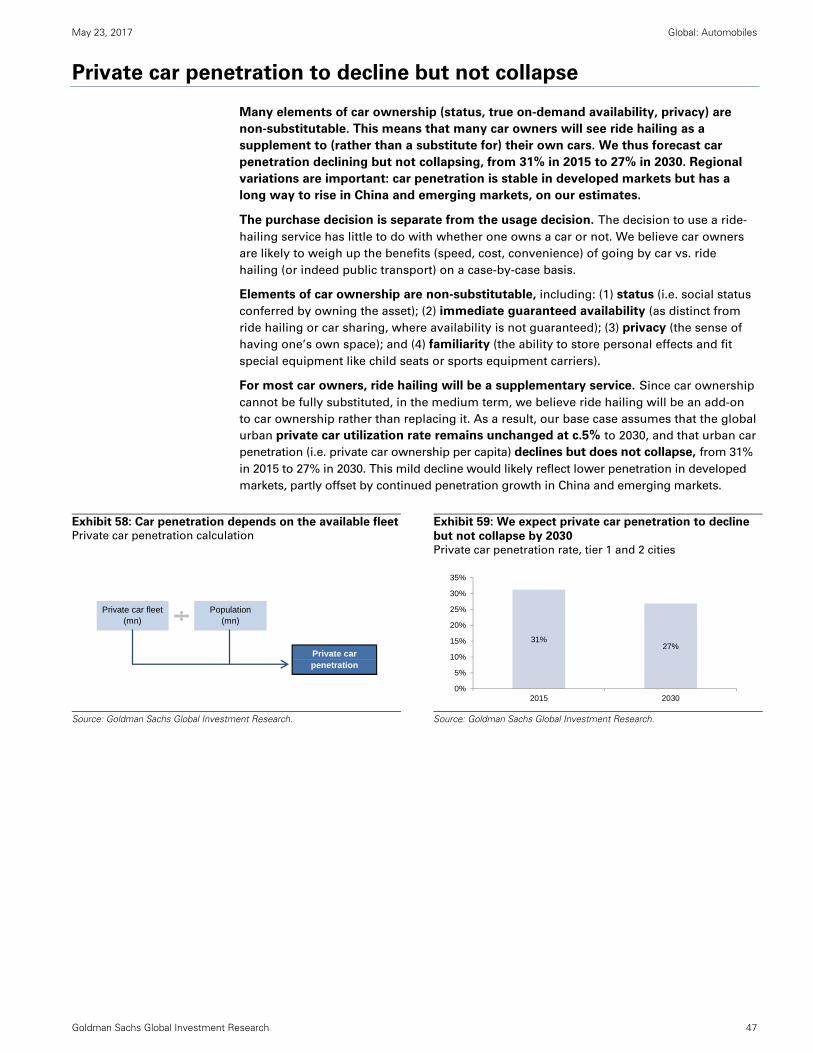
May 23, 2017 Global: Automobiles
Goldman Sachs Global Investment Research 47
Private car penetration to decline but not collapse
Many elements of car ownership (status, true on-demand availability, privacy) are
non-substitutable. This means that many car owners will see ride hailing as a
supplement to (rather than a substitute for) their own cars. We thus forecast car
penetration declining but not collapsing, from 31% in 2015 to 27% in 2030. Regional
variations are important: car penetration is stable in developed markets but has a
long way to rise in China and emerging markets, on our estimates.
The purchase decision is separate from the usage decision. The decision to use a ride-
hailing service has little to do with whether one owns a car or not. We believe car owners
are likely to weigh up the benefits (speed, cost, convenience) of going by car vs. ride
hailing (or indeed public transport) on a case-by-case basis.
Elements of car ownership are non-substitutable, including: (1) status (i.e. social status
conferred by owning the asset); (2) immediate guaranteed availability (as distinct from
ride hailing or car sharing, where availability is not guaranteed); (3) privacy (the sense of
having one’s own space); and (4) familiarity (the ability to store personal effects and fit
special equipment like child seats or sports equipment carriers).
For most car owners, ride hailing will be a supplementary service. Since car ownership
cannot be fully substituted, in the medium term, we believe ride hailing will be an add-on
to car ownership rather than replacing it. As a result, our base case assumes that the global
urban private car utilization rate remains unchanged at c.5% to 2030, and that urban car
penetration (i.e. private car ownership per capita) declines but does not collapse, from 31%
in 2015 to 27% in 2030. This mild decline would likely reflect lower penetration in developed
markets, partly offset by continued penetration growth in China and emerging markets.
Exhibit 58: Car penetration depends on the available fleetPrivate car penetration calculation
Exhibit 59: We expect private car penetration to decline
but not collapse by 2030 Private car penetration rate, tier 1 and 2 cities
Source: Goldman Sachs Global Investment Research.
Source: Goldman Sachs Global Investment Research.
Private car fleet (mn)
Population (mn)
Private car penetration
31%27%
0%
5%
10%
15%
20%
25%
30%
35%
2015 2030
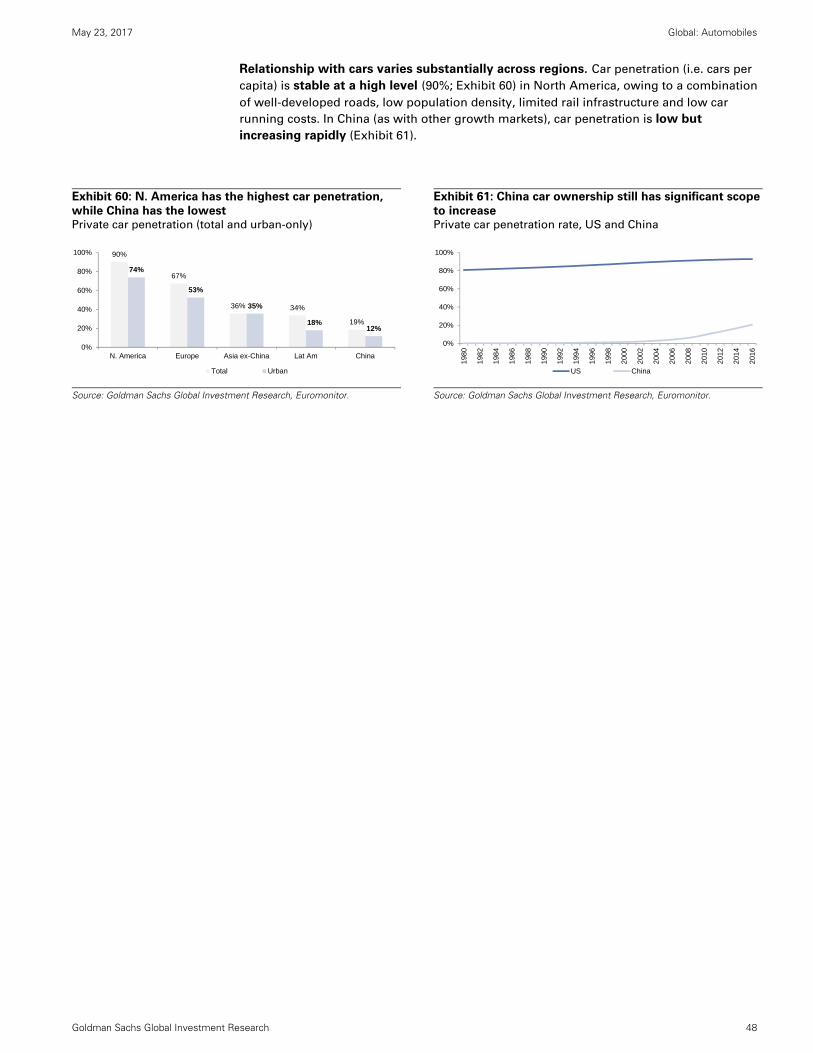
May 23, 2017 Global: Automobiles
Goldman Sachs Global Investment Research 48
Relationship with cars varies substantially across regions. Car penetration (i.e. cars per
capita) is stable at a high level (90%; Exhibit 60) in North America, owing to a combination
of well-developed roads, low population density, limited rail infrastructure and low car
running costs. In China (as with other growth markets), car penetration is low but
increasing rapidly (Exhibit 61).
Exhibit 60: N. America has the highest car penetration,
while China has the lowest Private car penetration (total and urban-only)
Exhibit 61: China car ownership still has significant scope
to increase Private car penetration rate, US and China
Source: Goldman Sachs Global Investment Research, Euromonitor.
Source: Goldman Sachs Global Investment Research, Euromonitor.
90%
67%
36% 34%
19%
74%
53%
35%
18%12%
0%
20%
40%
60%
80%
100%
N. America Europe Asia ex-China Lat Am China
Total Urban
0%
20%
40%
60%
80%
100%
198
0
198
2
198
4
198
6
198
8
199
0
199
2
199
4
199
6
199
8
200
0
200
2
200
4
200
6
200
8
201
0
201
2
201
4
201
6
US China
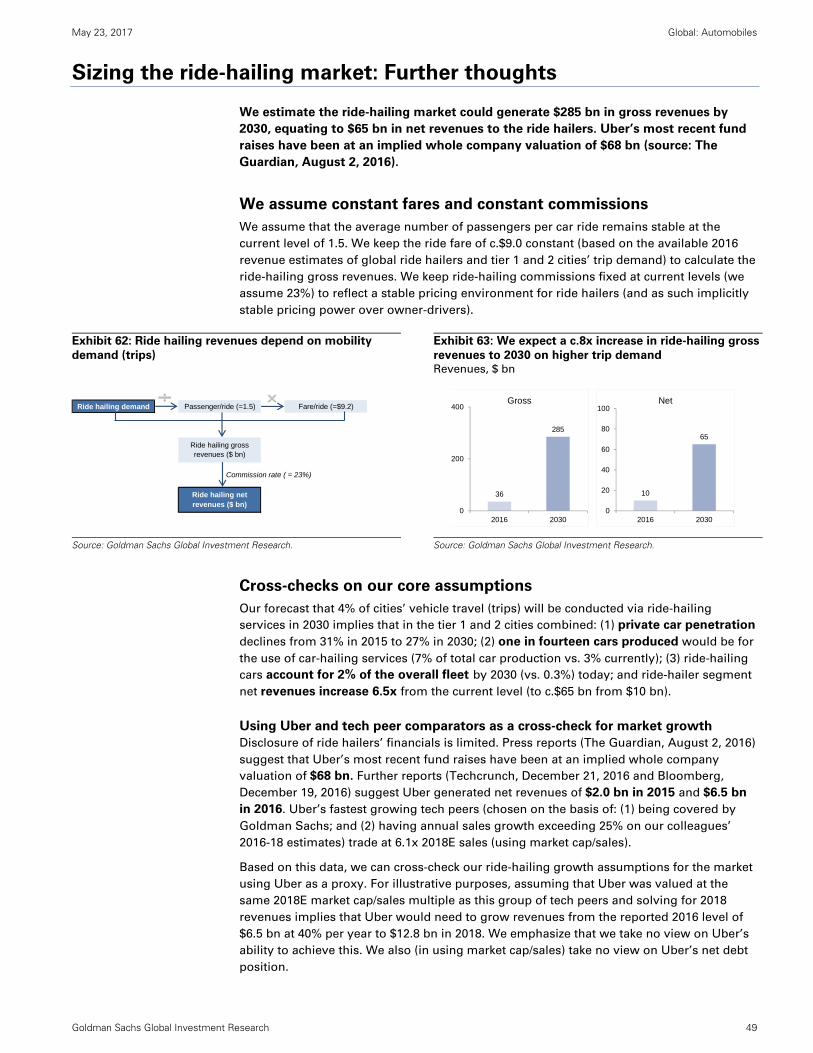
May 23, 2017 Global: Automobiles
Goldman Sachs Global Investment Research 49
Sizing the ride-hailing market: Further thoughts
We estimate the ride-hailing market could generate $285 bn in gross revenues by
2030, equating to $65 bn in net revenues to the ride hailers. Uber’s most recent fund
raises have been at an implied whole company valuation of $68 bn (source: The
Guardian, August 2, 2016).
We assume constant fares and constant commissions
We assume that the average number of passengers per car ride remains stable at the
current level of 1.5. We keep the ride fare of c.$9.0 constant (based on the available 2016
revenue estimates of global ride hailers and tier 1 and 2 cities’ trip demand) to calculate the
ride-hailing gross revenues. We keep ride-hailing commissions fixed at current levels (we
assume 23%) to reflect a stable pricing environment for ride hailers (and as such implicitly
stable pricing power over owner-drivers).
Exhibit 62: Ride hailing revenues depend on mobility
demand (trips)
Exhibit 63: We expect a c.8x increase in ride-hailing gross
revenues to 2030 on higher trip demand Revenues, $ bn
Source: Goldman Sachs Global Investment Research.
Source: Goldman Sachs Global Investment Research.
Cross-checks on our core assumptions
Our forecast that 4% of cities’ vehicle travel (trips) will be conducted via ride-hailing
services in 2030 implies that in the tier 1 and 2 cities combined: (1) private car penetration
declines from 31% in 2015 to 27% in 2030; (2) one in fourteen cars produced would be for
the use of car-hailing services (7% of total car production vs. 3% currently); (3) ride-hailing
cars account for 2% of the overall fleet by 2030 (vs. 0.3%) today; and ride-hailer segment
net revenues increase 6.5x from the current level (to c.$65 bn from $10 bn).
Using Uber and tech peer comparators as a cross-check for market growth
Disclosure of ride hailers’ financials is limited. Press reports (The Guardian, August 2, 2016)
suggest that Uber’s most recent fund raises have been at an implied whole company
valuation of $68 bn. Further reports (Techcrunch, December 21, 2016 and Bloomberg,
December 19, 2016) suggest Uber generated net revenues of $2.0 bn in 2015 and $6.5 bn
in 2016. Uber’s fastest growing tech peers (chosen on the basis of: (1) being covered by
Goldman Sachs; and (2) having annual sales growth exceeding 25% on our colleagues’
2016-18 estimates) trade at 6.1x 2018E sales (using market cap/sales).
Based on this data, we can cross-check our ride-hailing growth assumptions for the market
using Uber as a proxy. For illustrative purposes, assuming that Uber was valued at the
same 2018E market cap/sales multiple as this group of tech peers and solving for 2018
revenues implies that Uber would need to grow revenues from the reported 2016 level of
$6.5 bn at 40% per year to $12.8 bn in 2018. We emphasize that we take no view on Uber’s
ability to achieve this. We also (in using market cap/sales) take no view on Uber’s net debt
position.
Ride hailing demand Passenger/ride (=1.5) Fare/ride (=$9.2)
Ride hailing net revenues ($ bn)
Ride hailing gross revenues ($ bn)
Commission rate ( = 23%)
36
285
0
200
400
2016 2030
Gross
10
65
0
20
40
60
80
100
2016 2030
Net
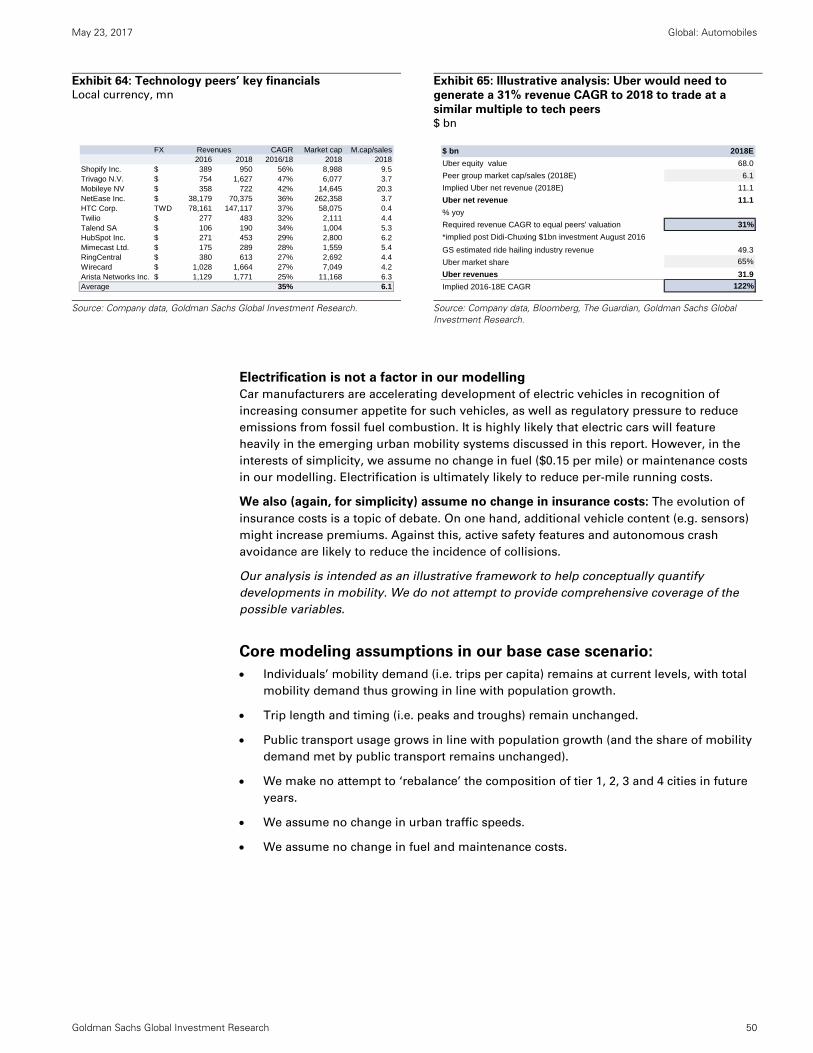
May 23, 2017 Global: Automobiles
Goldman Sachs Global Investment Research 50
Exhibit 64: Technology peers’ key financials Local currency, mn
Exhibit 65: Illustrative analysis: Uber would need to
generate a 31% revenue CAGR to 2018 to trade at a
similar multiple to tech peers $ bn
Source: Company data, Goldman Sachs Global Investment Research.
Source: Company data, Bloomberg, The Guardian, Goldman Sachs Global Investment Research.
Electrification is not a factor in our modelling
Car manufacturers are accelerating development of electric vehicles in recognition of
increasing consumer appetite for such vehicles, as well as regulatory pressure to reduce
emissions from fossil fuel combustion. It is highly likely that electric cars will feature
heavily in the emerging urban mobility systems discussed in this report. However, in the
interests of simplicity, we assume no change in fuel ($0.15 per mile) or maintenance costs
in our modelling. Electrification is ultimately likely to reduce per-mile running costs.
We also (again, for simplicity) assume no change in insurance costs: The evolution of
insurance costs is a topic of debate. On one hand, additional vehicle content (e.g. sensors)
might increase premiums. Against this, active safety features and autonomous crash
avoidance are likely to reduce the incidence of collisions.
Our analysis is intended as an illustrative framework to help conceptually quantify
developments in mobility. We do not attempt to provide comprehensive coverage of the
possible variables.
Core modeling assumptions in our base case scenario:
Individuals’ mobility demand (i.e. trips per capita) remains at current levels, with total
mobility demand thus growing in line with population growth.
Trip length and timing (i.e. peaks and troughs) remain unchanged.
Public transport usage grows in line with population growth (and the share of mobility
demand met by public transport remains unchanged).
We make no attempt to ‘rebalance’ the composition of tier 1, 2, 3 and 4 cities in future
years.
We assume no change in urban traffic speeds.
We assume no change in fuel and maintenance costs.
FX CAGR Market cap M.cap/sales2016 2018 2016/18 2018 2018
Shopify Inc. $ 389 950 56% 8,988 9.5Trivago N.V. $ 754 1,627 47% 6,077 3.7Mobileye NV $ 358 722 42% 14,645 20.3NetEase Inc. $ 38,179 70,375 36% 262,358 3.7HTC Corp. TWD 78,161 147,117 37% 58,075 0.4Twilio $ 277 483 32% 2,111 4.4Talend SA $ 106 190 34% 1,004 5.3HubSpot Inc. $ 271 453 29% 2,800 6.2Mimecast Ltd. $ 175 289 28% 1,559 5.4RingCentral $ 380 613 27% 2,692 4.4Wirecard $ 1,028 1,664 27% 7,049 4.2Arista Networks Inc. $ 1,129 1,771 25% 11,168 6.3Average 35% 6.1
Revenues $ bn 2018E
Uber equity value 68.0
Peer group market cap/sales (2018E) 6.1
Implied Uber net revenue (2018E) 11.1
Uber net revenue 11.1
% yoy
Required revenue CAGR to equal peers' valuation 31%
*implied post Didi-Chuxing $1bn investment August 2016
GS estimated ride hailing industry revenue 49.3
Uber market share 65%
Uber revenues 31.9
Implied 2016-18E CAGR 122%
Enablers of the ride-hailing revolution
Private companies in focus: Uber and Didi (pp. 56-7)
How rental car companies are getting into the game (p. 58-9)
May 23, 2017 Global: Automobiles
Goldman Sachs Global Investment Research 52
BMW (BMWG.DE): Gearing up for iNEXT
What is BMW doing in mobility?
BMW’s mobility offerings are centered on its DriveNow and ReachNow services.
DriveNow is primarily a free-floating car-sharing platform, operating in 11 European cities
(of which five are in Germany). ReachNow is US-based and adds the ability to book rides
(i.e. cars with a driver), as well as for car owners to rent out their cars (Airbnb style) to
others. BMW also says its iNEXT model (due 2021) will be the ‘basis’ for fleets of fully
autonomous cars, although the vehicle (incorporating tech from BMW’s Mobileye/Intel
partnership) will be partially rather than wholly self-driving.
Why does it matter?
Post disappointing demand for its i3 electric car (launched in 2013), BMW’s approach to
both electrification and mobility services now seems more circumspect. That said, BMW
operates a breadth of service offerings that prepare it for potential changes to its end
markets. In addition, the company runs a venture fund, BMW i Ventures, to which BMW
has allocated €500 mn, and which has focused on smaller investments in electric mobility
and mobility services, including EV charging network ChargePoint and public transport
aggregator Moovit.
Daimler (DAIGn.DE): Balancing breadth with focus
What is Daimler doing in mobility?
Daimler has arguably invested more broadly across the mobility value chain than any other
OEM. Its subsidiary Moovel is an ‘aggregator’ platform for mobility services, born of a
2014 acquisition, RideScout. Daimler also owns several ‘optimizer’ service platforms, most
notably MyTaxi, a Germany-based taxi booking service, but also car2Go (car sharing). The
company also owns a stake in Blacklane (chauffeur service) and Croove (Airbnb style
peer-to-peer car sharing). Its fleet management operations (enlarged post the €1.1 bn/$1.2
bn acquisition of Athlon in 2016) include lease management and financing (via its financial
services division) businesses. In addition, Daimler’s 2017 agreement with Uber paves the
way for Daimler to provide autonomous cars to sharing fleets in the coming years.
Why does it matter?
With all OEMs grappling with how mobility will affect their business model, Daimler is
pursuing a breadth of options. In the broader business context, Daimler defines four future
fields under the acronym CASE (‘Connected’, ‘Autonomous’, ‘Shared & Service’, and
‘Electric Drive’), which all feed into its vision of future mobility. For the Shared & Service
portion at least, Daimler is likely to remain in investing mode in the medium term.
Stefan Burgstaller Neutral, last close €85.9 12m PT €84
Stefan Burgstaller Neutral, last close €67.7 12m PT €81
May 23, 2017 Global: Automobiles
Goldman Sachs Global Investment Research 53
Ford (F): Smart mobility beginning with Chariot
What is Ford doing in mobility?
Through its Ford Smart Mobility subsidiary, Ford is focusing on building out future
mobility business models, both organically and through acquisitions, that can exist both
pre- and post-autonomous vehicles. To date, the company has acquired Chariot, an on-
demand shuttle service, and has increased its internal data and analytics team to build out
fleet management capabilities, as well as transportation as a service (TaaS) offerings,
including digital services. Ford is aiming to package these services together and sell
solutions to/collaborate with cities, which the company believes will be the center choke
point for transportation in the future as the world population becomes more urbanized.
Further, we believe the recent change in CEO signals a significant change in culture and
strategy at Ford, where the company will look to accelerate the pace of adoption and clock-
speed of the implementation of new data analytics, AI, 3D printing, etc., to optimize the
business as well as its broader mobility offering.
Why does it matter?
The company has made a clear pivot to future mobility business models given the much
larger global addressable market for transportation as a service; in this market, Ford not
only sees itself as an integral partner through offering higher-value-added services, but as
a potentially more valuable asset given that it expects to achieve 20%+ EBIT margins from
its new business models over time. In addition, the company has made a strategic
investment in Argo AI, which is working on developing the virtual driver system for SAE
level 4 self-driving vehicles.
GM (GM): Taking services seriously: Lyft among key partners
What is GM doing in mobility?
GM has focused on building car-sharing services internally, while partnering externally
with Lyft (where it has a strategic investment) for shared mobility. Among others, the
company has launched two car-sharing services: Maven, an app-based service that allows
on-demand short-term rentals; and BOOK, a monthly subscription service that allows
customers to drive any available Cadillac model. GM has also made a $500 mn strategic
investment in ride-hailing service Lyft, and has offered short-term rentals to Lyft drivers
called Express Drive. Over time, the company plans to turn this partnership into a fleet-
rental service. In addition, in May 2017, Lyft and Waymo entered a deal to collaborate on
self-driving technology, although GM’s role was left uncertain.
Why does it matter?
The company is investing in ancillary revenue streams related to mobility, and is primarily
targeting already proven business models akin to ZipCar. GM’s largest strategic move was
the acquisition of Cruise Automation in May 2016, which sped up its autonomous vehicle
development. On that front, the company has made it clear that it believes its future
mobility businesses will be largely dependent on its ability to launch a mass-produced
autonomous vehicle, and that its strategy will hinge on producing a market-leading safe AV
that will drive customer acceptance. In that vein, the company is testing a self-driving fleet
of its all-electric Chevy Bolt as its foray into autonomous mobility.
David Tamberrino Neutral, last close $11.1 12m PT $11
David Tamberrino Neutral, last close $32.9 12m PT $31
May 23, 2017 Global: Automobiles
Goldman Sachs Global Investment Research 54
Tesla Inc. (TSLA): Pushing on with self-driving
What is Tesla doing in mobility? Tesla has announced its ambition to create a ride-sharing network called the Tesla Network
to capitalize on its upcoming self-driving technology. Tesla owners with the fully
autonomous software package will purportedly be able to offer their cars for short-term
rentals in a self-driving fleet. In addition, the company could also deploy vehicles that come
back off-lease in its own fleet, at a time when the vehicle depreciation math makes more
sense for a ride-share vehicle. The company has not provided a timeline on the eventual
rollout of the service, but we believe it is likely to be offered at the time of the “Full-Self
Driving” software update. On that front, the company has a growing number of vehicles
racking up miles out on the road with its hardware 2.0 package that should be collecting a
run-rate of 1.5 bn miles by year-end 2017 on our volume estimates. For details, refer to
Model 3 is all that matters, NDR meeting takeaways, May 15, 2017.
Why does it matter? The company is doubling-down on its proprietary approach to mobility and autonomous
vehicles, similar to other OEMs. However, Tesla is unusual in that it is vertically integrating
the vehicle production, autonomous technology, and ride-sharing network, whereas other
OEMs have partners and investments, and/or have made acquisitions to gain access to
autonomous vehicle technology. Further, in a mobility world dependent on miles and
connectivity, Tesla is somewhat differentiated in that: (1) it has outfitted its vehicles with
hardware that it believes is capable of fully autonomous driving (although recently, the
company mentioned that it has not fully written off LIDAR); (2) those vehicles are customer-
owned and collecting data for its autopilot software (vs. OEMs running their own fleets to
collect data); and (3) its vehicles are fully over-the-air update capable.
Toyota (7203.T): Mobility Services Platform building broad ties
What is Toyota doing in mobility? Toyota established the TMSP (Toyota Mobility Services Platform) in 2016, with an aim of
openly connecting various companies and service providers on the MSP. The platform
includes various features such as the Smart Key Box, flexible leases, telematics insurance,
use of traffic information and management of fleet vehicles. In the field of car sharing, Toyota
has already announced collaborations with Uber and Getaround, and has plans to invest $1 bn
over five years in artificial intelligence research at the recently established Toyota Research
Institute (TRI). Other plans include joint work with the NTT group to collect, amass and
analyze data to make the world of connected cars a reality. In this way, Toyota is moving to
establish a wide array of business models across various vehicle-related fields.
Why does it matter? Toyota’s fundamental belief is that, unlike consumer electronics, vehicles have a direct
connection with people’s lives. However, given the limits to which Toyota can handle the
increasingly diverse array of car services by itself, it places value on the creation of
partnerships. As a car company, Toyota is focusing attention on dealing with shorter
replacement cycles in future, bolstering after-sale services, and, above all, developing
vehicles with outstanding levels of durability as the number of vehicles on the road increases.
However, in order to be more than a pure car sales company, it will likely seek to rebuild
ties with insurance, car-sharing and telecoms companies. From an earnings perspective,
we could see Toyota leveraging its significant number of cars on the road to deliver big
data and offer advertising services delivered into the car (on the premise that it can be
done safely), rather than merely supplying devices with which to use new telecom services.
David Tamberrino Sell, last close $310.3 6m PT $190
Kota Yuzawa Neutral, last close ¥6,000 12m PT ¥6,000
May 23, 2017 Global: Automobiles
Goldman Sachs Global Investment Research 55
Volkswagen (VOWG_p.DE): MOIA unit playing on various fronts
What is Volkswagen doing in mobility?
Following the diesel scandal, Volkswagen has accelerated its efforts in new mobility
solutions. Through its recently established urban mobility business unit MOIA, it plans to
develop and market its own mobility services. VW’s partnerships with the ride-hailing
services Gett (May 2016) and Didi (November 2016) mark the first entry point towards
exploiting the potential of the fast-growing ride-hailing taxi market. In the mass transit
segment, VW is developing an app-based shuttle service for urban cities, combining the
features of regular city bus and shared taxis. In electric mobility, VW plans to launch more
than ten electric vehicle models by end-2018 and over 30 new battery electric vehicles
(BEVs) by 2025. In the field of automation, VW targets building its own self-driving system
to start series production by as early as 2021.
Why does it matter?
Volkswagen plans to expand its ride-hailing business organically and via partnerships. In
2017, VW intends to boost growth at Gett in the UK, Russia, Israel and the US, and also
enter the new markets of Germany, Spain, France and Italy. In China, in addition to Didi,
VW has collaborated with GoFun on car sharing (one of China’s biggest car-sharing
companies), and Shouqi Group on car leasing. On mass mobility in Europe, VW’s aim is to
expand its shuttle services to > 20 European cities by 2021, and eventually deploy
autonomous driverless fleets by 2025. On electrification, VW’s targets that 20%-25% of
group sales will be electric vehicles in 2025, and in China alone, c.1.5 mn cars sold will be
NEVs (mostly electric) in the same year. On automation, VW expects to bring the first self-
driving cars without steering or pedals on road by early next decade.
Delphi (DLPH): AV research includes self-driving pilot programs
What is Delphi doing in mobility?
Delphi currently operates a ride-hailing service to showcase its technology and test
autonomous architecture in a real-world application. Currently, the service operates a pilot
fleet of six self-driving vehicles in Singapore, which are monitored by staff members and
shuttle passengers to and from mass transit stations. However, in the coming year, DLPH
intends to extend the pilot program to cities in Europe and the US. In addition to using
DLPH’s sensors and radar, the autonomous system is developed in conjunction with
Mobileye, which provides the obstacle detection software, and Intel, which produces chips.
DLPH is aiming to remove the staff monitors by 2019 and launch the driverless service
commercially by 2022. DLPH is also in collaboration with these suppliers and BMW to bring
solutions for highly and fully automated driving into series production by 2021.
Why does it matter?
As AV technology moves from the R&D phase to validation in the coming years, there is
increased pressure on companies to be first to market and on suppliers to establish
leadership in this area. Ride-hailing services as opposed to individual ownership offer a
good fit for early driverless car technologies as fleets can stay within specific parameters,
trained driver monitors can be used in the interim, and fleet operators can perform daily
maintenance and monitor the early technology. DLPH’s early participation in ride hailing
gives it the opportunity to test and showcase its turnkey technology and capabilities as a
systems integrator for future adoption.
Stefan Burgstaller CL-Buy, last close €138.4 12m PT €209
David Tamberrino Buy, last close $87.1 6m PT $96
May 23, 2017 Global: Automobiles
Goldman Sachs Global Investment Research 56
Didi Chuxing (privately held): Leading in China
What is Didi doing in mobility?
Didi is the largest ride-hailing service in China (#2 globally), with annual revenues of c.$3 bn
(2016 vs. Uber $6.5 bn, according to press reports), servicing > 300 mn users in over 400
Chinese cities, with average daily rides of 6.6 mn (as of December 2016). Didi’s scale of
operations is 5x-6x bigger than competitors, and its service portfolio includes taxi-hailing,
ride-sharing, private car-hailing, designated driver (Didi Chauffeur), car rental, and enterprise
solution and bus services. Didi is backed by investment from the biggest internet giants
Tencent ($15 mn in April 2013), Alibaba (unknown, June 2016) and Apple ($4.5 bn in June
2016). To date, it has raised c.$16 bn in 11 rounds of funding, including a significant $5.5 bn
investment in April 2017 (investors include SoftBank, China Merchants Bank Co. and Bank
of Communications Co.) at a valuation of $44.5 bn, to grow internationally and work on
autonomous driving.
To expand its scale in China, Didi acquired Uber China in August 2016 in a $35 bn deal. It
also has a long-term strategic partnership with Volkswagen China in the ride-hailing
segment. Further endeavors to broaden its geographical footprint led Didi to invest in
regional ride-hailing leaders Lyft (#2 in US, $100 mn investment), Ola (#1 in India), Grab
(#1 in Singapore), and 99Taxis (#1 in Brazil), together covering more than 50% of the
world’s population. Outside this segment, Didi is also involved in a partnership with ZipCar
for car sharing and Ofo for bike sharing.
Why does it matter?
Didi’s recent funding of US$5.5 bn will be used to further execute its international
growth/expansion plans as well as undertake investment in artificial intelligence to bring
breakthroughs in intelligent driving technologies and smart transportation architecture. It
has already opened a research center called Didi Labs in Mountain View, California in 1Q17,
to study intelligent driving solutions, as well as to work on areas such as cloud-based
security, imaging and human-machine interaction.
Gett: Euro-centric, with VW as a partner
What is Gett doing in mobility?
Gett is an on-demand ride-hailing company (#1 in Europe), with operations concentrated in
> 100 cities in the UK, Israel and Russia, while in the US, it is concentrated in New York.
With annual estimated revenue of $500 mn in 2016 (Business Insider, December 13, 2016),
Gett is significantly smaller than market leaders Uber ($6.5 bn) and Didi ($2.7 bn). Gett’s
business model is different from peers in that it complements the local taxi industry, by
partnering with the traditional taxi drivers as opposed to competing with them (in London,
for example, almost half of the black cab drivers currently use Gett). Gett has received total
funding of c.$620 mn to date (eight rounds), of which nearly half ($300 mn) was from
Volkswagen (May 2016) alone.
Why does it matter?
The partnership with VW may help Gett expedite its expansion plans to other cities (for
example, Gett recently purchased the US ride-hailing service Juno for $200 mn), while
giving VW: (1) entry into the fast-growing ride-hailing market; and (2) access to big data
(artificial intelligence, predictive algorithms and heat maps) to help it develop its future
autonomous services. In 2017, VW aims to accelerate the growth of Gett in existing
markets while also pushing its expansion into other European regions such as Germany,
Spain, France and Italy.
Not listed
Not listed
May 23, 2017 Global: Automobiles
Goldman Sachs Global Investment Research 57
Lyft: Powerful partners in Waymo and GM
What is Lyft doing in mobility?
Lyft is global #3 in the ride hailing market (#2 in the US), although it significantly lags its
peers Uber and Didi in size ($700 mn net revenues vs. $6.5 bn and $2.7 bn respectively), in
part owing to its limited geographical presence (it operates in the US alone). Lyft recently
announced a (non-exclusive) partnership with Alphabet’s Waymo (Bloomberg, May 15,
2017) in self-driving car testing, which we view as a big step towards the commercialization
of the autonomous technology. This would allow Waymo’s best-in-class self-driving
expertise to reach more people and more places by utilizing Lyft’s established customer
base (c.13 mn rides/month). Waymo has already begun testing self-driving vehicles in
Phoenix in April. In addition, Lyft also has an existing self-driving collaboration with GM,
under which GM will deploy thousands of autonomous electric cars in test fleets along with
Lyft from early 2018. Lyft has raised total funding of $2.6 bn (11 rounds) so far, and is
currently valued at $6.9 bn (source: Financial Times, April 6, 2017).
Why does it matter?
Lyft’s powerful partnerships position it better than its market share might suggest. With
GM, it has connections to a manufacturing partner. With Waymo, it has an extremely
capable technology partner. It remains to be seen whether these connections can
ultimately translate into a commercially viable solution to autonomous mobility services.
Lyft’s President John Zimmer is optimistic on the company’s efforts in this vertical, and has
commented that by 2021, autonomous vehicles will account for the majority of Lyft rides
(Business Insider, January 5, 2017).
Uber (privately held): The ride-hailing leader
What is Uber doing in mobility?
Uber is essentially defining the on-demand transportation market. Founded in March 2009,
the company now offers on-demand pickup in nearly 600 cities globally. Uber has driven
innovation in the category with: (1) UberX, a service that launched in 2012, allowing
individuals to join the Uber fleet using their own car; (2) carpooling functionality through
UberPOOL in 2014; (3) self-driving car trials in the fall of 2016; and (4) a commitment to
launch flying cars by 2020. The company is currently testing autonomous cars in
Pennsylvania, Arizona, and California. Uber is not limiting itself to passenger delivery: its
food delivery service, UberEATS, now operates in 72 cities; Uber acquired autonomous
trucking company Otto in August 2016 and launched Uber Freight, an on-demand long-haul
trucking service, in May 2017. UberRush is providing enterprise level on-demand package
delivery and fulfilment in New York, Chicago, and San Francisco.
Uber reportedly generated $6.5 bn in revenue in 2016 as it doubled annual gross bookings
to $20 bn.
Not listed
Not listed
May 23, 2017 Global: Automobiles
Goldman Sachs Global Investment Research 58
Why does it matter?
Uber is almost unarguably the most disruptive new technology company created in the last
decade, to the point that “Uberification” and the “Uber of X” have defined the most recent
venture capital cycle in Silicon Valley and its global equivalents. The company’s access to
capital, having raised $12.5 bn to date, and technology talent, having acquired or hired
high-profile technologists from Google, Carnegie Mellon’s Robotics Engineering Center,
NASA, and the University of Toronto, have positioned Uber to join Facebook, Google, and
Amazon as “winner take all” companies. Uber is expanding its influence on the future of
mobility by partnering with select municipalities to formally supplement their public
transportation networks and with property developers to reduce the need for parking. The
company is pushing and helping to craft the regulatory framework for ride-sharing, the
“gig economy”, and autonomous driving. That process is not without friction as Uber has
been the subject of driver protests, regulatory action, fines and lawsuits. Uber’s future will
be dependent on its ability to continue to navigate those challenges.
Avis (CAR): Fleet aspirations with Zipcar
What is Avis doing in mobility?
Avis currently has one of the world’s largest car-sharing operations in Zipcar, which it
acquired in 2013. Zipcar offers a fleet of vehicles available to its members (monthly or
annual fee), billable by the hour or day, for predominantly round-trip rentals, although the
company is rolling out more flexible offerings with one-way trips and the ability to change
drop-off plans. We view Zipcar as having a slight competitive advantage relative to peers
given its size and membership base, which recently passed the million member mark.
Further, the product offering differs from other car-sharing/ride-hailing
companies/networks as the ownership of the assets remains at the company level, as
opposed to private citizens renting out/utilizing their personal vehicles. Overall, we believe
Avis’s involvement with Zipcar gives the company a view into the changing mobility
landscape and different use cases, allows for data collection/mining, and also acts as an
avenue for testing new services.
Why does it matter?
We believe the rental car industry is experiencing slight pressure from a multitude of new
mobility options, including ride sharing and car sharing. However, Avis’s early entry into
car sharing may position it well for the future of mobility. Although we do not see ride-
sharing as a material threat to traditional rental car operators in the near term, in the longer
term, penetration of car-sharing operations (private assets being rented peer-to-peer),
further growth in OEM mobility platforms, and the potential for autonomous vehicles could
create an existential threat to rental car operators. With the right positioning, we believe
the next ten years will present a dynamic environment that could prove rental car
companies to be either valuable fleet operators or vestigial business models.
David Tamberrino Neutral, last close $23.65 6m PT $26
May 23, 2017 Global: Automobiles
Goldman Sachs Global Investment Research 59
Hertz (HTZ): Partnering with the ride hailers
What is Hertz doing in mobility?
Hertz has chosen to turn ride-sharing into a revenue opportunity by partnering with Uber and
Lyft through a weekly car rental program for vehicles from its off-airport locations. This has
several impacts on Hertz. On the positive side, Hertz is able to improve the utilization of its
off-airport fleet – a business that typically experiences lower demand than on-airport locations,
by including a minimum one-week rental. In addition, Hertz can use this as a channel for its
older vehicles that are nearing their rotation out of the fleet – under the program, Hertz offers
mid-size cars that are a little more than two years old or in excess of 30,000 miles, as a way to
extend the useful life of the earning asset at a time when the depreciation curve is less steep
and potentially wait for a more favorable price in its sales channels. However, with rental
rates for this program below industry average revenue and no mileage cap, additional wear
and tear on the vehicle may not be offset by incremental revenue.
Why does it matter?
Over the longer term, HTZ’s involvement could potentially evolve into a fleet management
business with the ride-sharing companies, where the rental car operators can utilize their
fleet maintenance expertise and support networks to provide a valuable service that is
complementary to its existing rental car operations. With the right positioning, we believe
the next decade will present a dynamic environment that could prove an opportunity for
HTZ to be a fleet manager within mobility. However, we note that without participation,
and in the near term, ride-sharing does pose an inherent threat for rental car operators, as
we believe they are already seeing some pressure as both corporate and leisure customers
have a growing transportation alternative on-airport with an easier to use customer
interface and increased convenience (i.e. on-phone app as opposed to rental car
counter/vehicle pick-up and drop-off experience). Further, this model likely only works if
potential ride-hailing partners (i.e. Uber and Lyft) do not want to own their assets, which is
still an unknown for the future business model.
Alphabet (GOOGL): Waymo seeks to monetize autonomous tech
What is Alphabet doing in mobility?
Alphabet’s Waymo project has the most established autonomous driving technology,
having conducted 2 mn miles of road tests (plus 1 bn miles in simulation). The self-driving
car project started in 2009 within Google, and from 2014 showcased a fully self-driving
vehicle with no driver controls. In 2016, the project was renamed Waymo and spun into a
separate company that remains wholly owned by Alphabet, but with a clearer mandate to
monetize the technology. The clearest evidence of this intention came with the May 2017
announcement that Waymo will launch a self-driving vehicle partnership. This will begin
with an autonomous ride hailing pilot in Phoenix.
Why does it matter?
Waymo has ambitious aims. Unlike the automotive OEMs that are evolving in self-driving
through the addition of ever more intelligent active safety features, Waymo aims to develop
fully self-driving cars (no need for human intervention) from the outset. Waymo further
differentiates itself from automakers through its intention to manufacture its own hardware:
this encompasses the entire sensor suite, including the pivotal LIDAR (a laser-based radar-like
technology) systems. OEMs by contrast are creating their systems via various technology
partnerships. That said, Waymo has formed automotive partnerships of its own: it
announced a ‘technical collaboration’ with Honda in December 2016, and in 2017 has
collaborated with Fiat Chrysler on rolling out several hundred autonomous Pacifica minivans.
David Tamberrino Sell, last close $10.49 6m PT $11
Heather Bellini CL-Buy, last close $964.07 12m PT $1,100
May 23, 2017 Global: Automobiles
Goldman Sachs Global Investment Research 60
Valuation methodology and risks
Exhibit 66: Valuation methodology and risks to our views
Source: Goldman Sachs Global Investment Research.
Disclaimer
Third-party brands used in this report are the property of their respective owners, and are
used here for informational purposes only. The use of such brands should not be viewed
as an endorsement, affiliation or sponsorship by or for Goldman Sachs or any of its
products/services.
Financial advisory disclosure
Goldman Sachs and/or one of its affiliates is acting as a financial advisor in connection with
an announced strategic matter involving the following company or one of its affiliates:
Delphi Automotive Plc
BMW ROICLower (or higher) organic volume growth, weaker (or more resilient) consolidated China profitability, worse (or better) structural cost containment efforts, and FX moves vs. euro
Daimler ROICCyclical developments in trucks (especially to the downside in the key NAFTA market), lower (or higher) organic volume growth with the E-Class roll out marking the start of a product cycle pause, weaker (or more resilient) consolidated China profitability, worse (or better) structural cost containment efforts, and significant FX moves vs. euro
Ford P/E and EV/EBITDAUpside: a moderation of price pressures following production cuts, a sustained strong demand environment for pickups, and conservative management projections. Downside: earlier than expected US SAAR declines, incremental competitive pressures in light truck, and a difficult Brexit environment
GM P/E and EV/EBITDAPUpside risks: NA cycle elongation, further market share gains, and positive pricing in the United States. Downside risks: weaker NA/China pricing, softer US/China retail sales, and potential dividend instability
Tesla SOTP Stronger Model S/Model X demand and/or production, positive free cash flow generation, and incremental new product announcements
Toyota P/B-ROEImprovement/deterioration in the US sales environment, forex swings (we assume ¥110/$; each ¥1 fluctuation has an impact of just over ¥40 bn on the operating line).
Volkswagen ROICFaster China profit contraction; weaker volumes/price/mix; US border tax adjustments; electric/emissions investment costs; and further diesel scandal fallout
Delphi50% P/E and EV/EBITDA &
50%SOTP
FX volatility, the pace of sales/production in North America, Europe, and China, incremental autonomous vehicle announcements/partnerships bycompetitors/OEMs, and the cadence of new product launches
Avis P/E and EV/EBITDA
Upside: acceleration in demand from growth in leisure and/or corporate travel, a demonstrated ability to raise pricing in the industry, and incremental improvement in asset utilization. Downside: reversal of positive pricing trends in the US, larger than anticipated declines in residual values, and an influx ofsupply into the market from OEM overproduction.
Hertz EV/EBITDAExecution on higher pricing, a rebound in leisure/corporate travel, increased use of alternative channels to dispose of vehicle fleet, higher residual values, delivery on long term cost reduction/margin targets, and increased partnerships with ride-hailing companies
AlphabetP/E, EV/EBITDA &
DCFWeaker-than-expected cost discipline, competition, dilutive M&A.
Company Methodology Risks to our estimates and target price
May 23, 2017 Global: Automobiles
Goldman Sachs Global Investment Research 61
Disclosure Appendix
Reg AC
We, Stefan Burgstaller, Demian Flowers, David Tamberrino, CFA, Heath P. Terry, CFA, Yipeng Yang, Heather Bellini, CFA and Kota Yuzawa, hereby
certify that all of the views expressed in this report accurately reflect our personal views about the subject company or companies and its or their
securities. We also certify that no part of our compensation was, is or will be, directly or indirectly, related to the specific recommendations or views
expressed in this report.
Unless otherwise stated, the individuals listed on the cover page of this report are analysts in Goldman Sachs' Global Investment Research division.
GS Factor Profile
The Goldman Sachs Factor Profile provides investment context for a security by comparing key attributes of that security to its conviction sector and
the market. The four key attributes depicted are: growth, returns, multiple and an integrated IP score. Growth returns and multiple are indexed based
on composites of several methodologies to determine the stocks percentile ranking within the region's coverage universe. The precise calculation of
each metric may vary depending on the fiscal year, industry and region but the standard approach is as follows:
Growth is a composite of next year's estimate over current year's estimate, e.g. EPS, EBITDA, Revenue. Return is a year one prospective aggregate
of various return on capital measures, e.g. CROCI, ROACE, and ROE. Multiple Multiple is a composite of one-year forward valuation ratios, e.g. P/E,
dividend yield, EV/FCF, EV/EBITDA, EV/DACF, Price/Book. Integrated IP score is a composite of Growth, Return and Multiple scores.
Quantum
Quantum is Goldman Sachs' proprietary database providing access to detailed financial statement histories, forecasts and ratios. It can be used for
in-depth analysis of a single company, or to make comparisons between companies in different sectors and markets.
GS SUSTAIN
GS SUSTAIN is a global investment strategy aimed at long-term, long-only performance with a low turnover of ideas. The GS SUSTAIN focus list
includes leaders our analysis shows to be well positioned to deliver long term outperformance through sustained competitive advantage and
superior returns on capital relative to their global industry peers. Leaders are identified based on quantifiable analysis of three aspects of corporate
performance: cash return on cash invested, industry positioning and management quality (the effectiveness of companies' management of the
environmental, social and governance issues facing their industry).
Disclosures
Coverage group(s) of stocks by primary analyst(s)
Stefan Burgstaller: Europe-Autos & Auto Parts.
Europe-Autos & Auto Parts: Autoliv Inc., BMW, CNH Industrial, CNH Industrial, Continental, Daimler AG, Faurecia, Fiat Chrysler Automobiles NV, Fiat
Chrysler Automobiles NV, Hella KGaA Hueck, Michelin, Nokian Renkaat, Peugeot, Porsche, Renault, Valeo, Volkswagen, Volvo.
Company-specific regulatory disclosures
Compendium report: please see disclosures at http://www.gs.com/research/hedge.html. Disclosures applicable to the companies included in this
compendium can be found in the latest relevant published research
Distribution of ratings/investment banking relationships
Goldman Sachs Investment Research global Equity coverage universe
Rating Distribution Investment Banking Relationships
Buy Hold Sell Buy Hold Sell
Global 33% 53% 14% 63% 57% 50%
As of April 1, 2017, Goldman Sachs Global Investment Research had investment ratings on 2,857 equity securities. Goldman Sachs assigns stocks as
Buys and Sells on various regional Investment Lists; stocks not so assigned are deemed Neutral. Such assignments equate to Buy, Hold and Sell for
the purposes of the above disclosure required by the FINRA Rules. See 'Ratings, Coverage groups and views and related definitions' below. The
Investment Banking Relationships chart reflects the percentage of subject companies within each rating category for whom Goldman Sachs has
provided investment banking services within the previous twelve months.
Price target and rating history chart(s)
Compendium report: please see disclosures at http://www.gs.com/research/hedge.html. Disclosures applicable to the companies included in this
compendium can be found in the latest relevant published research
Regulatory disclosures
Disclosures required by United States laws and regulations
See company-specific regulatory disclosures above for any of the following disclosures required as to companies referred to in this report: manager
or co-manager in a pending transaction; 1% or other ownership; compensation for certain services; types of client relationships; managed/co-
managed public offerings in prior periods; directorships; for equity securities, market making and/or specialist role. Goldman Sachs trades or may
trade as a principal in debt securities (or in related derivatives) of issuers discussed in this report.
The following are additional required disclosures: Ownership and material conflicts of interest: Goldman Sachs policy prohibits its analysts,
professionals reporting to analysts and members of their households from owning securities of any company in the analyst's area of
coverage. Analyst compensation: Analysts are paid in part based on the profitability of Goldman Sachs, which includes investment banking
revenues. Analyst as officer or director: Goldman Sachs policy prohibits its analysts, persons reporting to analysts or members of their
households from serving as an officer, director, advisory board member or employee of any company in the analyst's area of coverage. Non-U.S. Analysts: Non-U.S. analysts may not be associated persons of Goldman, Sachs & Co. and therefore may not be subject to FINRA Rule 2241 or FINRA
Rule 2242 restrictions on communications with subject company, public appearances and trading securities held by the analysts.
May 23, 2017 Global: Automobiles
Goldman Sachs Global Investment Research 62
Distribution of ratings: See the distribution of ratings disclosure above. Price chart: See the price chart, with changes of ratings and price targets in
prior periods, above, or, if electronic format or if with respect to multiple companies which are the subject of this report, on the Goldman Sachs
website at http://www.gs.com/research/hedge.html.
Additional disclosures required under the laws and regulations of jurisdictions other than the United States
The following disclosures are those required by the jurisdiction indicated, except to the extent already made above pursuant to United States laws
and regulations. Australia: Goldman Sachs Australia Pty Ltd and its affiliates are not authorised deposit-taking institutions (as that term is defined in
the Banking Act 1959 (Cth)) in Australia and do not provide banking services, nor carry on a banking business, in Australia. This research, and any
access to it, is intended only for "wholesale clients" within the meaning of the Australian Corporations Act, unless otherwise agreed by Goldman
Sachs. In producing research reports, members of the Global Investment Research Division of Goldman Sachs Australia may attend site visits and
other meetings hosted by the issuers the subject of its research reports. In some instances the costs of such site visits or meetings may be met in part
or in whole by the issuers concerned if Goldman Sachs Australia considers it is appropriate and reasonable in the specific circumstances relating to
the site visit or meeting. Brazil: Disclosure information in relation to CVM Instruction 483 is available at
http://www.gs.com/worldwide/brazil/area/gir/index.html. Where applicable, the Brazil-registered analyst primarily responsible for the content of this
research report, as defined in Article 16 of CVM Instruction 483, is the first author named at the beginning of this report, unless indicated otherwise at
the end of the text. Canada: Goldman Sachs Canada Inc. is an affiliate of The Goldman Sachs Group Inc. and therefore is included in the company
specific disclosures relating to Goldman Sachs (as defined above). Goldman Sachs Canada Inc. has approved of, and agreed to take responsibility for,
this research report in Canada if and to the extent that Goldman Sachs Canada Inc. disseminates this research report to its clients. Hong Kong: Further information on the securities of covered companies referred to in this research may be obtained on request from Goldman Sachs
(Asia) L.L.C. India: Further information on the subject company or companies referred to in this research may be obtained from Goldman Sachs
(India) Securities Private Limited, Research Analyst - SEBI Registration Number INH000001493, 951-A, Rational House, Appasaheb Marathe Marg,
Prabhadevi, Mumbai 400 025, India, Corporate Identity Number U74140MH2006FTC160634, Phone +91 22 6616 9000, Fax +91 22 6616 9001. Goldman
Sachs may beneficially own 1% or more of the securities (as such term is defined in clause 2 (h) the Indian Securities Contracts (Regulation) Act,
1956) of the subject company or companies referred to in this research report. Japan: See below. Korea: Further information on the subject
company or companies referred to in this research may be obtained from Goldman Sachs (Asia) L.L.C., Seoul Branch. New Zealand: Goldman
Sachs New Zealand Limited and its affiliates are neither "registered banks" nor "deposit takers" (as defined in the Reserve Bank of New Zealand Act
1989) in New Zealand. This research, and any access to it, is intended for "wholesale clients" (as defined in the Financial Advisers Act 2008) unless
otherwise agreed by Goldman Sachs. Russia: Research reports distributed in the Russian Federation are not advertising as defined in the Russian
legislation, but are information and analysis not having product promotion as their main purpose and do not provide appraisal within the meaning of
the Russian legislation on appraisal activity. Singapore: Further information on the covered companies referred to in this research may be obtained
from Goldman Sachs (Singapore) Pte. (Company Number: 198602165W). Taiwan: This material is for reference only and must not be reprinted
without permission. Investors should carefully consider their own investment risk. Investment results are the responsibility of the individual
investor. United Kingdom: Persons who would be categorized as retail clients in the United Kingdom, as such term is defined in the rules of the
Financial Conduct Authority, should read this research in conjunction with prior Goldman Sachs research on the covered companies referred to
herein and should refer to the risk warnings that have been sent to them by Goldman Sachs International. A copy of these risks warnings, and a
glossary of certain financial terms used in this report, are available from Goldman Sachs International on request.
European Union: Disclosure information in relation to Article 4 (1) (d) and Article 6 (2) of the European Commission Directive 2003/125/EC is available
at http://www.gs.com/disclosures/europeanpolicy.html which states the European Policy for Managing Conflicts of Interest in Connection with
Investment Research.
Japan: Goldman Sachs Japan Co., Ltd. is a Financial Instrument Dealer registered with the Kanto Financial Bureau under registration number Kinsho
69, and a member of Japan Securities Dealers Association, Financial Futures Association of Japan and Type II Financial Instruments Firms
Association. Sales and purchase of equities are subject to commission pre-determined with clients plus consumption tax. See company-specific
disclosures as to any applicable disclosures required by Japanese stock exchanges, the Japanese Securities Dealers Association or the Japanese
Securities Finance Company.
Ratings, coverage groups and views and related definitions
Buy (B), Neutral (N), Sell (S) -Analysts recommend stocks as Buys or Sells for inclusion on various regional Investment Lists. Being assigned a Buy
or Sell on an Investment List is determined by a stock's return potential relative to its coverage group as described below. Any stock not assigned as
a Buy or a Sell on an Investment List is deemed Neutral. Each regional Investment Review Committee manages various regional Investment Lists to a
global guideline of 25%-35% of stocks as Buy and 10%-15% of stocks as Sell; however, the distribution of Buys and Sells in any particular coverage
group may vary as determined by the regional Investment Review Committee. Additionally, the regional Investment Review Committees each
manage regional Conviction lists which represent investment recommendations focused on either the size of the potential return or the likelihood of
the realization of the return. Addition or removal of stocks from such Conviction lists do not represent a change in the analysts’ investment rating for
such stocks.
Total return potential represents the upside or downside differential between the current share price and the price target, including all paid or
anticipated dividends, expected during the time horizon associated with the price target. Price targets are required for all covered stocks. The total
return potential, price target and associated time horizon are stated in each report adding or reiterating an Investment List membership.
Coverage groups and views: A list of all stocks in each coverage group is available by primary analyst, stock and coverage group at
http://www.gs.com/research/hedge.html. The analyst assigns one of the following coverage views which represents the analyst's investment outlook
on the coverage group relative to the group's historical fundamentals and/or valuation. Attractive (A). The investment outlook over the following 12
months is favorable relative to the coverage group's historical fundamentals and/or valuation. Neutral (N). The investment outlook over the
following 12 months is neutral relative to the coverage group's historical fundamentals and/or valuation. Cautious (C). The investment outlook over
the following 12 months is unfavorable relative to the coverage group's historical fundamentals and/or valuation.
Not Rated (NR). The investment rating and target price have been removed pursuant to Goldman Sachs policy when Goldman Sachs is acting in an
advisory capacity in a merger or strategic transaction involving this company and in certain other circumstances. Rating Suspended (RS). Goldman
Sachs Research has suspended the investment rating and price target for this stock, because there is not a sufficient fundamental basis for
determining, or there are legal, regulatory or policy constraints around publishing, an investment rating or target. The previous investment rating and
price target, if any, are no longer in effect for this stock and should not be relied upon. Coverage Suspended (CS). Goldman Sachs has suspended
coverage of this company. Not Covered (NC). Goldman Sachs does not cover this company. Not Available or Not Applicable (NA). The
information is not available for display or is not applicable. Not Meaningful (NM). The information is not meaningful and is therefore excluded.
Global product; distributing entities
The Global Investment Research Division of Goldman Sachs produces and distributes research products for clients of Goldman Sachs on a global
basis. Analysts based in Goldman Sachs offices around the world produce equity research on industries and companies, and research on
macroeconomics, currencies, commodities and portfolio strategy. This research is disseminated in Australia by Goldman Sachs Australia Pty Ltd
(ABN 21 006 797 897); in Brazil by Goldman Sachs do Brasil Corretora de Títulos e Valores Mobiliários S.A.; in Canada by either Goldman Sachs
May 23, 2017 Global: Automobiles
Goldman Sachs Global Investment Research 63
Canada Inc. or Goldman, Sachs & Co.; in Hong Kong by Goldman Sachs (Asia) L.L.C.; in India by Goldman Sachs (India) Securities Private Ltd.; in
Japan by Goldman Sachs Japan Co., Ltd.; in the Republic of Korea by Goldman Sachs (Asia) L.L.C., Seoul Branch; in New Zealand by Goldman Sachs
New Zealand Limited; in Russia by OOO Goldman Sachs; in Singapore by Goldman Sachs (Singapore) Pte. (Company Number: 198602165W); and in
the United States of America by Goldman, Sachs & Co. Goldman Sachs International has approved this research in connection with its distribution in
the United Kingdom and European Union.
European Union: Goldman Sachs International authorised by the Prudential Regulation Authority and regulated by the Financial Conduct Authority
and the Prudential Regulation Authority, has approved this research in connection with its distribution in the European Union and United Kingdom;
Goldman Sachs AG and Goldman Sachs International Zweigniederlassung Frankfurt, regulated by the Bundesanstalt für
Finanzdienstleistungsaufsicht, may also distribute research in Germany.
General disclosures
This research is for our clients only. Other than disclosures relating to Goldman Sachs, this research is based on current public information that we
consider reliable, but we do not represent it is accurate or complete, and it should not be relied on as such. The information, opinions, estimates and
forecasts contained herein are as of the date hereof and are subject to change without prior notification. We seek to update our research as
appropriate, but various regulations may prevent us from doing so. Other than certain industry reports published on a periodic basis, the large
majority of reports are published at irregular intervals as appropriate in the analyst's judgment.
Goldman Sachs conducts a global full-service, integrated investment banking, investment management, and brokerage business. We have
investment banking and other business relationships with a substantial percentage of the companies covered by our Global Investment Research
Division. Goldman, Sachs & Co., the United States broker dealer, is a member of SIPC (http://www.sipc.org).
Our salespeople, traders, and other professionals may provide oral or written market commentary or trading strategies to our clients and principal
trading desks that reflect opinions that are contrary to the opinions expressed in this research. Our asset management area, principal trading desks
and investing businesses may make investment decisions that are inconsistent with the recommendations or views expressed in this research.
The analysts named in this report may have from time to time discussed with our clients, including Goldman Sachs salespersons and traders, or may
discuss in this report, trading strategies that reference catalysts or events that may have a near-term impact on the market price of the equity
securities discussed in this report, which impact may be directionally counter to the analyst's published price target expectations for such stocks. Any
such trading strategies are distinct from and do not affect the analyst's fundamental equity rating for such stocks, which rating reflects a stock's
return potential relative to its coverage group as described herein.
We and our affiliates, officers, directors, and employees, excluding equity and credit analysts, will from time to time have long or short positions in,
act as principal in, and buy or sell, the securities or derivatives, if any, referred to in this research.
The views attributed to third party presenters at Goldman Sachs arranged conferences, including individuals from other parts of Goldman Sachs, do
not necessarily reflect those of Global Investment Research and are not an official view of Goldman Sachs.
Any third party referenced herein, including any salespeople, traders and other professionals or members of their household, may have positions in
the products mentioned that are inconsistent with the views expressed by analysts named in this report.
This research is not an offer to sell or the solicitation of an offer to buy any security in any jurisdiction where such an offer or solicitation would be
illegal. It does not constitute a personal recommendation or take into account the particular investment objectives, financial situations, or needs of
individual clients. Clients should consider whether any advice or recommendation in this research is suitable for their particular circumstances and, if
appropriate, seek professional advice, including tax advice. The price and value of investments referred to in this research and the income from them
may fluctuate. Past performance is not a guide to future performance, future returns are not guaranteed, and a loss of original capital may occur.
Fluctuations in exchange rates could have adverse effects on the value or price of, or income derived from, certain investments.
Certain transactions, including those involving futures, options, and other derivatives, give rise to substantial risk and are not suitable for all investors.
Investors should review current options disclosure documents which are available from Goldman Sachs sales representatives or at
http://www.theocc.com/about/publications/character-risks.jsp. Transaction costs may be significant in option strategies calling for multiple purchase
and sales of options such as spreads. Supporting documentation will be supplied upon request.
All research reports are disseminated and available to all clients simultaneously through electronic publication to our internal client websites. Not all
research content is redistributed to our clients or available to third-party aggregators, nor is Goldman Sachs responsible for the redistribution of our
research by third party aggregators. For research, models or other data available on a particular security, please contact your sales representative or
go to http://360.gs.com.
Disclosure information is also available at http://www.gs.com/research/hedge.html or from Research Compliance, 200 West Street, New York, NY
10282.
© 2017 Goldman Sachs.
No part of this material may be (i) copied, photocopied or duplicated in any form by any means or (ii) redistributed without the prior written consent of The Goldman Sachs Group, Inc.
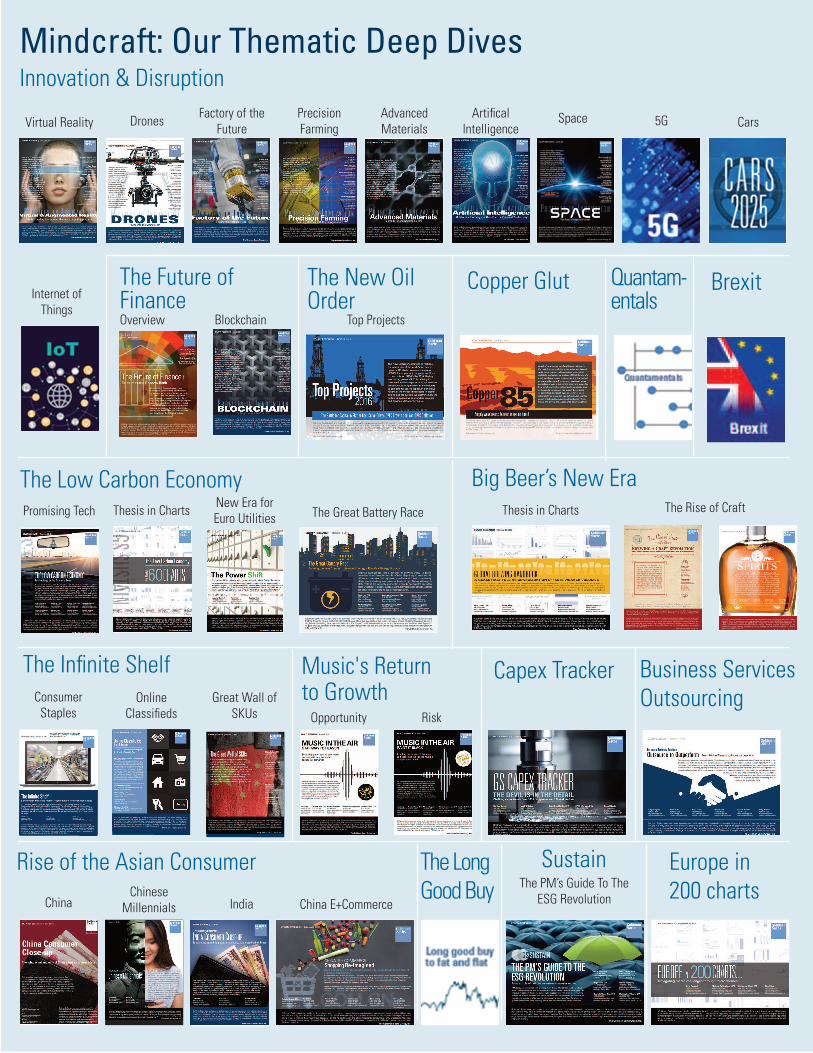
Mindcraft: Our Thematic Deep DivesInnovation & Disruption
Virtual Reality Drones Factory of theFuture
Precision Farming
AdvancedMaterials
ArtificalIntelligence
5G Cars
Internet ofThings
Blockchain
The Future ofFinanceOverview
The New Oil Order
Top Projects
Copper Glut
The Low Carbon EconomyThe Great Battery RacePromising Tech Thesis in Charts New Era for
Euro Utilities
Big Beer’s New EraThesis in Charts The Rise of Craft
Quantam-entals
Brexit
The Infinite ShelfOnline
ClassifiedsConsumer Staples
Music's Return to Growth
RiskOpportunity
Capex Tracker Business ServicesOutsourcing
Rise of the Asian Consumer
ChinaChinese
Millennials China E+CommerceIndia
Europe in 200 charts
Great Wall ofSKUs
Space
SustainThe Long Good Buy The PM’s Guide To The
ESG Revolution