Retail Study Review London Borough of Harrow
261
Retail Study Review London Borough of Harrow
Transcript of Retail Study Review London Borough of Harrow
Retail Study Review
London Borough of Harrow
1
September 2009
Nathaniel Lichfield & Partners Ltd
14 Regent's Wharf
All Saints Street
London N1 9RL
T 020 7837 4477
F 020 7837 2277
www.nlpplanning.com
LONDON BOROUGH OF HARROW
RETAIL STUDY REVIEW
CL11947/PW
Offices also in
Cardiff
Manchester
Newcastle upon Tyne

11947/756914v1
Contents3
1.0 Introduction 1 The Study 1 Content of the Report 1
2.0 Retail Trends 2 Expenditure Growth 2 New Forms of Retailing 3
3.0 Planning Policy Context 6 National Retail Planning Policy 6 The London Plan 12 West London Sub-Regional Development Framework 16 Harrow Unitary Development Plan 16 Local Development Framework 17
4.0 The Shopping Hierarchy and Catchment Area 19 Major Shopping Centres in Harrow and the Surrounding Area 19 Socio-Economic Characteristics within LB of Harrow 22
5.0 Household Survey 26 Survey Structure 26 Food and Grocery Shopping 27
6.0 Harrow Town Centre 38 Introduction 38 Mix of Uses and Occupier Representation 38 Accessibility and Movement 42 Environmental Quality 44 Conclusion 45
7.0 Burnt Oak 47 Introduction 47 Mix of Uses and Occupier Representation 47 Accessibility and Movement 49 Environmental Quality 50 Conclusion 50
8.0 Kenton 51 Introduction 51 Mix of Uses and Occupier Representation 51 Accessibility and Movement 53
11947/756914v1756914_1.DOC
Environmental Quality 53 Conclusion 54
9.0 Kingsbury 55 Introduction 55 Mix of Uses and Occupier Representation 55 Accessibility and Movement 57 Environmental Quality 58 Conclusion 58
10.0 North Harrow 59 Introduction 59 Mix of Uses and Occupier Representation 59 Accessibility and Movement 61 Environmental Quality 62 Conclusion 63
11.0 Pinner 64 Introduction 64 Mix of Uses and Occupier Representation 64 Accessibility and Movement 66 Environmental Quality 67 Conclusion 68
12.0 Rayners Lane 69 Introduction 69 Mix of Uses and Occupier Representation 69 Accessibility and Movement 72 Environmental Quality 72 Conclusion 74
13.0 South Harrow 75 Introduction 75 Mix of Uses and Occupier Representation 75 Environmental Quality 78 Conclusions 79
14.0 Stanmore 80 Introduction 80 Mix of Uses and Occupier Representation 80 Accessibility and Movement 82 Environmental Quality 83 Conclusion 84

11947/756914v1756914_1.DOC
15.0 Wealdstone 85 Introduction 85 Mix of Uses and Occupier Representation 85 Accessibility and Movement 87 Environmental Quality 88 Conclusions 88
16.0 The Need for New Retail Development 89 Introduction 89 Methodology and Data 89 Population and Spending 90 Existing Retail Floorspace 2009 92 Existing Spending Patterns 2009 93 Quantitative Capacity for Additional Convenience Floorspace 95 Quantitative Capacity for Additional Comparison Floorspace 97 The Qualitative Need for Retail Development 100 Occupier Demand 102
17.0 Scope for Accommodating Growth 106 Floorspace Projections 106 Accommodating Future Growth 107 Potential Development Opportunities 108 Summary and Conclusions 111
18.0 Conclusions and Recommendations 112
11947/756914v1
GLOSSARY OF TERMS
Benchmark Turnover Expected turnover of existing retail floorspace
based on national averages which the identified
available expenditure can be measured against.
Class A1 Commercial units classed as retail or shop uses
within the Use Classes Order.
Class A1 Services Non-retail uses classed as A1 within the Use
Classes Order, such as hairdressers, travel agents
and dry cleaners.
Class A2 Commercial units classed as financial or
professional services, for example banks and
building societies, within the Use Classes Order.
Class A3/A4/A5 Commercial units classed as food or drink outlets,
for example pubs, restaurants and takeaways,
within the Use Classes Order.
Convenience Goods Consumer goods purchased on a regular basis,
including food and groceries and cleaning
materials.
Comparison Goods Durable goods such as clothing, household goods,
furniture, DIY and electrical goods.
Dodona Research A consulting firm specialising in the cinema
industry.
Experian A data consultancy who are widely used for retail
planning information.
EGi A published source of information providing known
retail operators’ space requirements in
towns across the country.
Goad Plans Town centre plans prepared by Experian, which a
based on occupier surveys of over 1,200 town
centres across the country.
Gross floorspace Total external floorspace including exterior walls.

11947/756914v1756914_1.DOC
Higher order Durable goods which tend to be high value, bought
comparison goods on an occasional basis and/or where customers
are most likely to shop around and compare
products in different shops e.g. adult fashion
items, high value electrical goods, jewellery,
furniture etc. Customers are usually prepared to
travel further to purchase these items.
Lower order Durable goods which tend to be lower value, bought
comparison goods on a regular basis and/or where customers are
less likely to shop around e.g. small household
goods, books, pharmaceutical and toiletries.
Customers are less likely to travel long distances
to purchase these items.
Market share/ The proportion of total consumer expenditure within
Penetration rate a given area taken by a particular town or shopping
facility.
MHE Management Horizons Europe (MHE) Retail
Shopping Index is a database of over six thousand
retail locations that enables the user to rank and
sort the UK’s shopping venues against a range of
different criteria (including market size; location
type; market position; and sector
Multiple traders National or regional ‘chain store’ retailers.
Net floorspace Retail floorspace devoted to the sale of goods,
excluding storage space.
Zone A Rent The annual rental charge per square foot for the
first 20 foot depth of a shop unit, which is the
most suitable measure for standardising and
comparing rental levels.

P1/120 11947/756914v1
1.0 Introduction
The Study
1.1 Nathaniel Lichfield and Partners (NLP) were commissioned by London Borough
of Harrow to review and update the Council’s 2006 Retail Study. This review
includes an assessment of Harrow town centre and the other main district
centres within the Borough. The objectives of the study are to provide:
• a qualitative analysis of the existing retail facilities within the Borough in
order to identify the role of each centre and the relationship between the
centres and neighbouring boroughs;
• a quantitative and qualitative need assessment for new retail facilities
within the Borough up to 2025, including an assessment of both food and
non-food retailing;
• recommendations for the future development strategy.
Content of the Report
1.2 Section 2.0 provides an overview of retail trends. Section 3.0 provides an
overview of the national, regional and local planning policy context. Section 4.0
provides a description of the shopping hierarchy.
1.3 Sections 5.0 summarises the results of the household shopper survey.
Sections 6.0 to 15.0 provide town centre health checks for Harrow and other
main centres in the Borough.
1.4 Section 16.0 sets out an analysis of shopping needs within the Borough and
assesses the ability of existing facilities to meet the needs of the community.
Section 17.0 assesses the opportunities to accommodate the future need for
new retail development. Section 18.0 assesses the town centre and strategic
objectives and sets out recommendations and conclusions.

P2/120 11947/756914v1
2.0 Retail Trends
2.1 An assessment of the need for retail facilities in LB Harrow is set out in Section
16.0 of this report. In the section below, we provide an overview of national
tends within the retail sector.
Expenditure Growth
2.2 Historic retail trends indicate that expenditure has consistently grown in real
terms in the past, generally following a cyclical growth trend. The underlying
trend shows consistent growth and this trend is expected to continue in the
future. However, the current economic downturn is expected to lead to limited
growth over the next few years.
Figure 2.1: Retail Spending Trends
0
50000
100000
150000
200000
250000
300000
1980
1982
1984
1986
1988
1990
1992
1994
1996
1998
2000
2002
2004
2006
2008
2010
2012
2014
2016
Year
Sp
en
din
g (
£M
)
Spending on Comparison Goods
Spending on Convenience Goods
Source: Experian Briefing Note 6.1 (Jan 2009)
2.3 In the past expenditure growth has fuelled the growth in retail floorspace,
including major out-of-centre development particularly in the 1980’s and
1990’s. The economic downturn suggests that recent rates of growth during
the past few years are unlikely to be achieved in the short term. However, the
underlying trend over the medium and long terms is expected to lead to a need
for further retail floorspace. We anticipate these national trends will be
mirrored in LB Harrow.
P3/120 11947/756914v1
New Forms of Retailing
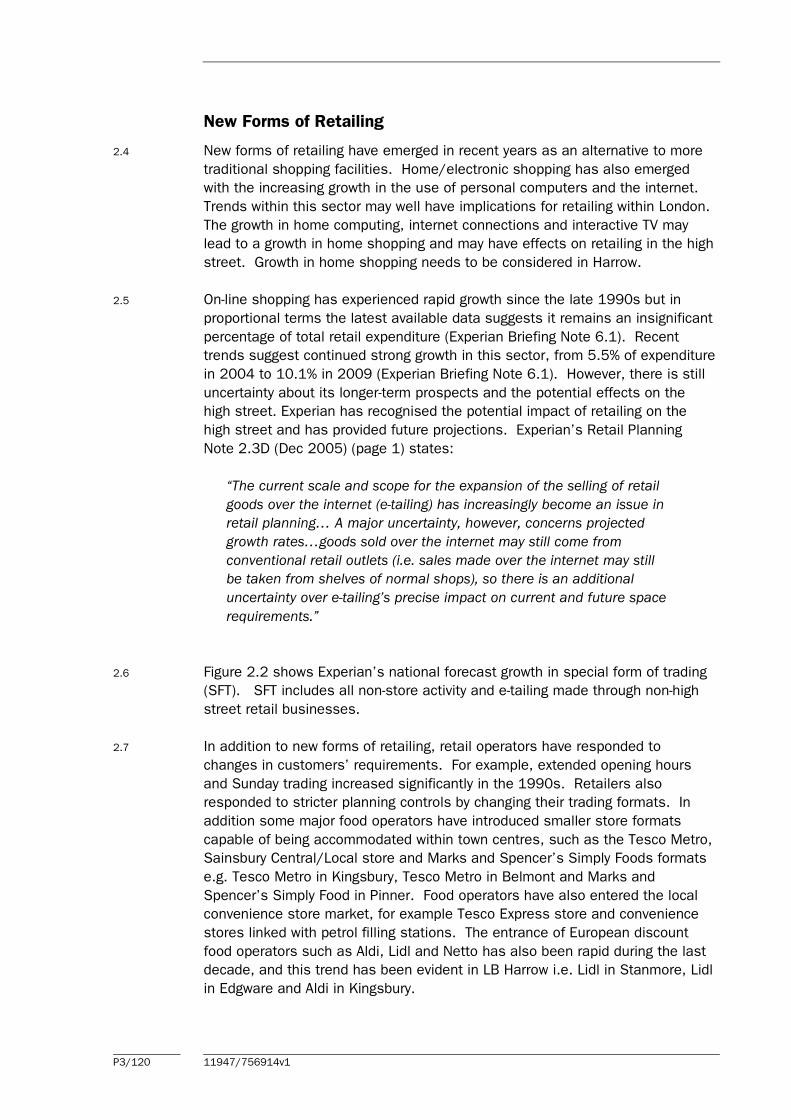
2.4 New forms of retailing have emerged in recent years as an alternative to more
traditional shopping facilities. Home/electronic shopping has also emerged
with the increasing growth in the use of personal computers and the internet.
Trends within this sector may well have implications for retailing within London.
The growth in home computing, internet connections and interactive TV may
lead to a growth in home shopping and may have effects on retailing in the high
street. Growth in home shopping needs to be considered in Harrow.
2.5 On-line shopping has experienced rapid growth since the late 1990s but in
proportional terms the latest available data suggests it remains an insignificant
percentage of total retail expenditure (Experian Briefing Note 6.1). Recent
trends suggest continued strong growth in this sector, from 5.5% of expenditure
in 2004 to 10.1% in 2009 (Experian Briefing Note 6.1). However, there is still
uncertainty about its longer-term prospects and the potential effects on the
high street. Experian has recognised the potential impact of retailing on the
high street and has provided future projections. Experian’s Retail Planning
Note 2.3D (Dec 2005) (page 1) states:
“The current scale and scope for the expansion of the selling of retail
goods over the internet (e-tailing) has increasingly become an issue in
retail planning… A major uncertainty, however, concerns projected
growth rates…goods sold over the internet may still come from
conventional retail outlets (i.e. sales made over the internet may still
be taken from shelves of normal shops), so there is an additional
uncertainty over e-tailing’s precise impact on current and future space
requirements.”
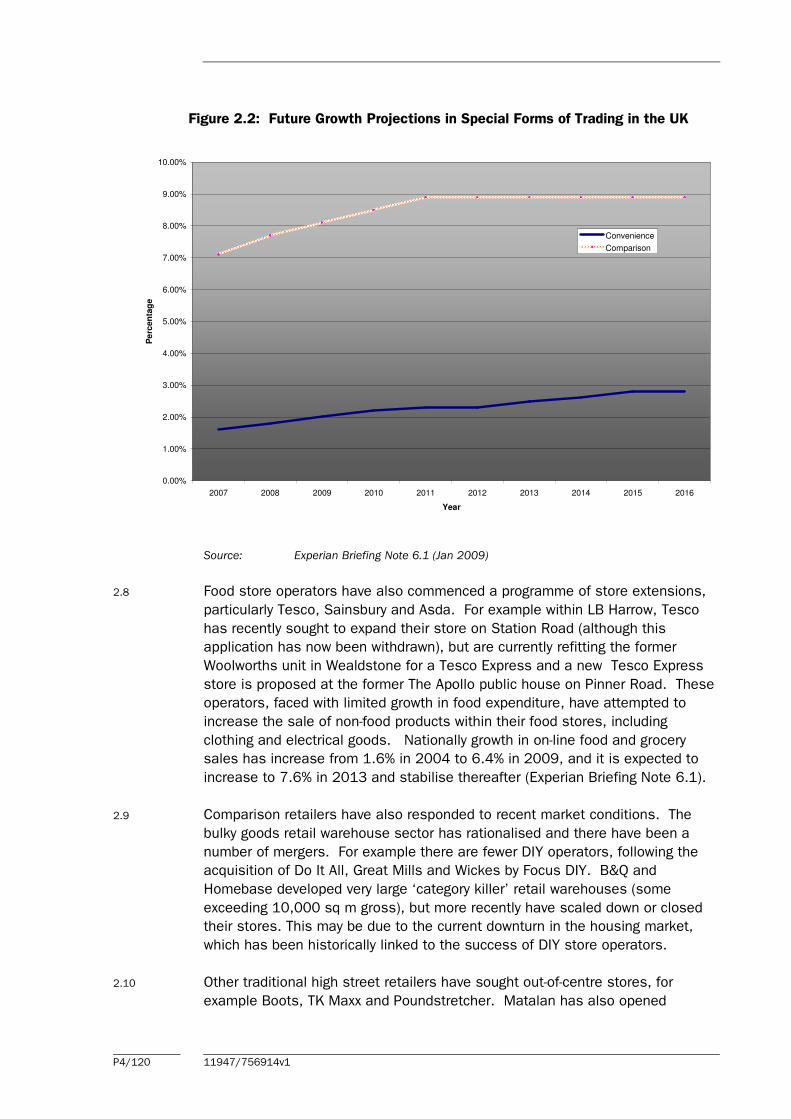
2.6 Figure 2.2 shows Experian’s national forecast growth in special form of trading
(SFT). SFT includes all non-store activity and e-tailing made through non-high
street retail businesses.
2.7 In addition to new forms of retailing, retail operators have responded to
changes in customers’ requirements. For example, extended opening hours
and Sunday trading increased significantly in the 1990s. Retailers also
responded to stricter planning controls by changing their trading formats. In
addition some major food operators have introduced smaller store formats
capable of being accommodated within town centres, such as the Tesco Metro,
Sainsbury Central/Local store and Marks and Spencer’s Simply Foods formats
e.g. Tesco Metro in Kingsbury, Tesco Metro in Belmont and Marks and
Spencer’s Simply Food in Pinner. Food operators have also entered the local
convenience store market, for example Tesco Express store and convenience
stores linked with petrol filling stations. The entrance of European discount
food operators such as Aldi, Lidl and Netto has also been rapid during the last
decade, and this trend has been evident in LB Harrow i.e. Lidl in Stanmore, Lidl
in Edgware and Aldi in Kingsbury.
P4/120 11947/756914v1
Figure 2.2: Future Growth Projections in Special Forms of Trading in the UK
0.00%
1.00%
2.00%
3.00%
4.00%
5.00%
6.00%
7.00%
8.00%
9.00%
10.00%
2007 2008 2009 2010 2011 2012 2013 2014 2015 2016
Year
Pe
rcen
tag
e
Convenience
Comparison
Source: Experian Briefing Note 6.1 (Jan 2009)
2.8 Food store operators have also commenced a programme of store extensions,
particularly Tesco, Sainsbury and Asda. For example within LB Harrow, Tesco
has recently sought to expand their store on Station Road (although this
application has now been withdrawn), but are currently refitting the former
Woolworths unit in Wealdstone for a Tesco Express and a new Tesco Express
store is proposed at the former The Apollo public house on Pinner Road. These
operators, faced with limited growth in food expenditure, have attempted to
increase the sale of non-food products within their food stores, including
clothing and electrical goods. Nationally growth in on-line food and grocery
sales has increase from 1.6% in 2004 to 6.4% in 2009, and it is expected to
increase to 7.6% in 2013 and stabilise thereafter (Experian Briefing Note 6.1).
2.9 Comparison retailers have also responded to recent market conditions. The
bulky goods retail warehouse sector has rationalised and there have been a
number of mergers. For example there are fewer DIY operators, following the
acquisition of Do It All, Great Mills and Wickes by Focus DIY. B&Q and
Homebase developed very large ‘category killer’ retail warehouses (some
exceeding 10,000 sq m gross), but more recently have scaled down or closed
their stores. This may be due to the current downturn in the housing market,
which has been historically linked to the success of DIY store operators.
2.10 Other traditional high street retailers have sought out-of-centre stores, for
example Boots, TK Maxx and Poundstretcher. Matalan has also opened
P5/120 11947/756914v1
numerous discount clothing stores across the country. Sports clothing retail
warehouses including JJB Sports and Decathlon have also expanded out-of-
centre.
2.11 The economic downturn has had, and is likely to continue to have, an impact on
the retail sector, e.g. Woolworth, Borders and MFI are notable victims. The
effects of the recession (to date) have not had a significant impact in Harrow,
because the shop vacancy rate is still significantly below the national average.
The demand for premises within the bulky goods sector, i.e. furniture, carpets,
electrical and DIY goods are particularly weak at present.
2.12 Within town centres, some high street multiple comparison retailers changed
their format. High street national multiples have increasingly sought larger
modern shop units (over 200 sq m - 2,150 sq ft) with an increasing polarisation
of activity into the larger regional and sub-regional centres. The continuation of
these trends will influence future operator requirements in LB Harrow, with
smaller vacant units becoming less attractive for new occupiers and existing
retailers looking to relocate into larger units.
2.13 Operator demand for space has decreased during the recession, and of those
national multiples looking for space may prefer to locate in larger centres i.e.
Metropolitan Centres in London. Demand from multiples within the Borough is
likely to be strongest in Harrow town centre rather than the smaller centres in
the Borough, which will affect the appropriate strategies for individual centres.
Harrow town centre has the best prospects for retaining and attracting new
multiple retailers.
2.14 Factory outlet centres (FOCs) have been developed across the country as an
alternative to fashion shops within town centres. These developments are
usually large and can provide over 10,000 sq m of comparison retailing,
focusing primarily on fashion items and clothing, offering designer clothing at
discounted prices. A number of FOCs have emerged across Great Britain and
draw from a wide catchment area, for example the Hatfield Galleria and
Bicester Village. FOC tend to be located in out-of-centre locations. National
policy in PPS6 and draft PPS4 indicates that retail development should be
focused were possible within town centres, which suggests the future potential
for new FOC’s may be limited.

P6/120 11947/756914v1
3.0 Planning Policy Context
National Retail Planning Policy
3.1 PPS6: Planning for Town Centres (March 2005) sets out the Government’s
policies on town centres, retail, commercial leisure and other town centre uses.
3.2 The Government’s key objective for town centres (this covers city, town, district
and local centres) is to promote their vitality and viability by planning for growth
and development of existing centres and promoting and enhancing existing
centres, by focusing development in such centres and encouraging a wide
range of services in a good environment, accessible to all.
3.3 Other Government objectives that need to be taken account of in the context of
the key objective are set out in paragraph 1.4 of PPS6:
• Enhancing consumer choice by making provision for a range of shopping,
leisure and local services, which allow genuine choice to meet the needs of
the entire community and particularly socially excluded groups;
• Supporting efficient, competitive and innovative retail, leisure, tourism and
other sectors, with improving productivity; and
• Improving accessibility, ensuring that existing or new development is, or will
be, accessible and well served by a choice of means of transport.
3.4 Regional planning bodies (RPB’s) and local planning authorities (LPAs) are
advised in paragraph 1.6 to implement the Government’s objectives for town
centres, by planning positively for their growth and development. They should
therefore:
• develop a hierarchy and network of centres;
• assess the need for further main town centre uses and ensure there is
capacity to accommodate them;
• focus development in, and plan for the expansion of, existing centres as
appropriate, and at the local level identify appropriate sites in development
plan documents;
• promote town centre management, creating partnerships to develop,
improve and maintain the town centre and manage the evening and night-
time economy; and
• regularly monitor and review the impact and effectiveness of their policies
for promoting vital and viable town centres.
3.5 Paragraph 2.1 states that in order to deliver the Government’s key objective,
RPB’s and LPA’s should actively promote growth and manage change in town
centres, define the network and a hierarchy of centres, each performing their
appropriate role to meet the needs of their catchment, and adopt a pro-active,
plan-led approach to planning for town centres, through regional and local
planning.

P7/120 11947/756914v1
3.6 The main town centre uses to which PPS6 applies are outlined in paragraph
1.8:
• retail (including warehouse clubs and factory outlet centres);
• leisure, entertainment facilities and the more intensive sport and recreation
uses (including cinemas, restaurants, drive-through restaurants, bars and
pubs, night-clubs, casinos, health and fitness centres, indoor bowling
centres and bingo halls);
• offices, both commercial and those of public bodies; and
• arts, culture and tourism (theatres, museums, galleries and concert halls,
hotels and conference facilities).
3.7 Paragraph 1.9 of PPS6 also acknowledges that housing will be an important
element in most mixed-use, multi-storey developments.
3.8 PPS6, paragraphs 2.15 to 2.17 offers specific guidance to LPA’s on the role of
plans at local level, including the need to work in conjunction with stakeholders
and the community to:
1 assess the need for new floorspace for retail, leisure and other main town
centre uses, taking account of both quantitative and qualitative
considerations;
2 identify deficiencies in provision, assess the capacity of existing centres to
accommodate new development, including, where appropriate, the scope for
extending the primary shopping area and/or town centre, and identify
centres in decline where change needs to be managed;
3 identify the centres within their area where development will be focused, as
well as the need for any new centres of local importance, and develop
strategies for developing and strengthening centres within their area;
4 define the extent of the primary shopping area and the town centre, for the
centres in their area on their Proposal Map;
5 identify and allocate sites in accordance with the considerations on site
selection and land assembly e.g. assessment of need, appropriate scale of
development, sequential approach, impact and accessibility (set out in
para. 2.28-2.51 of PPS6);
6 review all existing allocations and reallocate sites which do not comply with
PPS6;
7 develop spatial policies and proposals to promote and secure investment in
deprived areas by strengthening and/or identifying opportunities for growth
of existing centres, and to seek to improve access to local facilities; and

P8/120 11947/756914v1
8 set out criteria based policies, in accordance with PPS6, for assessing and
locating new development proposals, including development on sites not
allocated in development plan documents.
3.9 PPS6 also indicates that:
“In addition to defining the extent of the primary shopping area for their local
centres, LPA’s may distinguish between primary and secondary frontages. These
frontages should be realistically defined. Having regard to the need to encourage
diversification of uses in town centres as a whole, primary frontages should
contain a high proportion of retail uses, while secondary frontages provide
greater opportunities for flexibility and diversity of uses. Where frontages are
identified the appropriate local development documents should includes policies
that make clear which uses will be permitted in such locations.”
(Para.2.17, PPS6)
Demonstrating Need for Development
3.10 PPS6 states in paragraph 2.33 that:
“In assessing the need and capacity for additional retail and leisure development,
local planning authorities should place greater weight on quantitative need for
additional floorspace for the specific types of retail and leisure developments.
However local planning authorities should also take account of qualitative
considerations. In deprived areas which lack access to a range of services and
facilities, and there will be clear and demonstrable benefits in identifying sites for
appropriate development to serve the communities in these areas, additional
weight should be given to meeting these qualitative considerations”.
3.11 In assessing quantitative need for additional development, local planning
authorities should assess the likely future demand for additional retail
floorspace, having regard to a realistic assessment of the existing forecast
population levels, forecast expenditure for specific classes of goods to be sold,
within the broad categories of comparison and convenience goods and for main
leisure sectors and forecast improvements in productivity in the use of
floorspace.
3.12 With regards to assessing the qualitative need for additional development,
paragraph 2.35 states:
“In assessing the qualitative need for additional development when preparing its
development plan documents, a key consideration for a LPA will be to provide for
consumer choice, by ensuring that:
- an appropriate distribution of locations is achieved, subject to the key objective
of promoting the vitality and viability of town centres and the application of the
sequential approach, to improve accessibility for the whole community; and

P9/120 11947/756914v1
- provision is made for a range of sites for shopping, leisure and local services,
which allow genuine choice to meet the needs of the whole community,
particularly the needs of those living in deprived areas.”
3.13 Other local issues, although not necessarily elements of ‘need’, can be
important material considerations.
Appropriate Scale of Development
3.14 PPS6 also requires that local planning authorities ensure that the scale of
opportunities identified is directly related to the role and function of the centre
and its catchment. Paragraph 2.41 states:
“The aim should be to locate the appropriate type and scale of development in
the right type of centre, to ensure that is fits into that centre and that it
complements its role and function.”
3.15 For city and town centres, PPS6, paragraph 2.43 states that where a need has
been identified, LPA’s should seek to identify sites in the centre, or failing that
on the edge of the centre, capable of accommodating larger format
developments. Paragraph 2.42 indicates that in most cases it is likely to be
inappropriate to include local centres within the search area to be applied
under the sequential approach for large scale developments.
3.16 The guidance places greater emphasis on the regeneration of town centres,
particularly smaller centres and the need to define a network of centres, and
where appropriate to plan for the decline of some centres. Local authorities
are expected to set indicative upper limits on the scale of new floorspace
appropriate in different types of centres.
The Sequential Approach
3.17 PPS6 sets out the sequential approach to site selection for new retail
development (paragraph 2.44), namely that first preference should be existing
centres where suitable sites or buildings for conversion are, or are likely to
become available, taking account of an appropriate scale of development in
relation to the role and function of the centre, followed by edge-of-centre
locations, with preference given to sites that are or will be well-connected to the
centre and only then out-of-centre sites, with preference given to sites which
are or will be well served by a choice of means of transport and which are close
to the centre and have a high likelihood of forming links with the centre.
3.18 Further to this LPA’s should, in consultation with stakeholders (including the
development industry) and the community, identify an appropriate range of sites
to allow for accommodation of the identified need. Paragraph 2.45
emphasises the need for flexibility and realism from both LPA’s and developers
and operators in discussing the identification of sites:

P10/120 11947/756914v1
“LPA’s should be sensitive to the needs of the community and stakeholders,
including developers and operators and identify sites that are, or are likely to
become available for development during the development plan document period
and which allow for the accommodation of the identified need, including sites
capable of accommodating a range of business models.”
3.19 The factors that should be taken into account in considering business models
are scale, format, car park provision and the scope for disaggregation.
3.20 In selecting sites for allocation, the LPA should also consider the degree to
which other considerations, including specific local circumstances, may be
material to the choice of appropriate locations for development, and these
include physical regeneration, employment, economic growth and social
inclusion.
3.21 The guidance clearly states that local planning authorities should plan positively
for growth by making provision for a range and choice of shopping and services.
If a ‘need’ for new development is established, it will be necessary to identify
opportunities to meet that need. PPS6 indicates that local authorities should
allocate sufficient sites to meet anticipated demand for the next five years.
PPS6 also suggests that an apparent lack of sites of the right size and in the
right location should not be construed as an obstacle to site allocation and
development to meet this need. Local planning authorities should consider the
scope for effective site assembly using their compulsory purchase order (CPO)
powers, to ensure that suitable sites within or on the edge of centres are
brought forward for development.
3.22 This suggests the onus is placed on the Council to identify sites to
accommodate the 5-year demand for development. This study provides
floorspace projections up to 2025. Therefore, it may not be appropriate for the
Council to seek to identify opportunities to accommodate, with any certainty,
projections up to 2025 at this stage, but to put in place appropriate monitoring
provisions to ensure appropriate sites/floorspace are made available at the
appropriate time and location to meet any unsatisfied demand as well as wider
strategic outcomes.
3.23 PPS6 also suggests that where growth cannot be accommodated in identified
existing centres, local planning authorities should plan for the extension of the
primary shopping area if there is a need for additional retail provision or, where
appropriate, plan for the extension of the town centre to accommodate other
main town centre uses. Extension of the primary shopping area or town centre
may also be appropriate where a need for large developments has been
identified and this cannot be accommodated within the centre. Larger stores
may deliver benefits for consumers and local planning authorities should seek
to make provision for them in this context. In such cases, local planning
authorities should seek to identify, designate and assemble larger sites
adjoining the primary shopping area (i.e. in edge-of-centre locations).
P11/120 11947/756914v1
Proposed Changes to PPS6 and Draft PPS4
3.24 On 10 July 2008, the Department of Communities and Local Government
published a Consultation Document on proposed changes to PPS6 Planning for
Town Centres. On 5th May 2009, DCLG published a further consultation paper
on a new PPS4: Planning for Prosperous Economies. The latter incorporates
policy contained in PPS6 and the policies on economic development in urban
and rural areas in PPG4, PPG5 and PPS7 into a merged single PPS. Both
consultation papers propose to replace the current ‘need’ and ‘impact’ tests
set out in PPS6 with a new ‘impact test’.
3.25 The aim of the documents is to address the unintended effects of the current
guidance. The key Government objective to promote the vitality and viability of
town centres remains, as does much of the Government’s guidance on positive
planning and the Plan-led approach. However, other objectives which should be
taken into account, or wider Government objectives that may be relevant
include:
• promotion of competition between retailers;
• raising the productivity growth rate of the UK economy;
• encouraging investment in deprived areas;
• building prosperous communities by improving economic performance;
• helping to tackle climate change; and
• consideration of terrorism as well as crime.
3.26 The need for local authorities to consider quantitative and qualitative need
remains. However, Councils are also expected to have regard to the strategic
objectives set out in the Regional Economic Strategy and use relevant market
information and economic data.
3.27 The roles and responsibilities for regional planning bodies and local planning
authorities in preparing the evidence base that will underpin development plan
policy are clearly specified. New requirements for local planning authorities
include the need to:
• identify deficiencies in floorspace provision, including the provision of local
convenience shopping and other facilities which serve day-to-day needs;
• define the network and hierarchy of lower order centres and set out a
spatial vision and strategy for the management and growth of centres in
their Core Strategy;
• consider setting thresholds for the scale of edge-of-centre and out-of-centre
development which should be the subject of an impact assessment, specify
the areas where this will apply and the types of impacts having particular
local importance; and
• prepare policies for the scale of development likely to be permissible in
different centres.
P12/120 11947/756914v1
3.28 With the proposed removal of the need test, the two key tests for applications
are the expanded impact test and the sequential test. The assessment of each
should be proportionate to the scale and nature of proposals and their likely
impact. The sequential test remains largely unchanged.
3.29 Impact assessments are to consider positive and negative impacts, including
cumulative effects. The list of impact issues to be considered is longer and
more stringent than that which first appeared in the draft PPS6. Eight “key
impacts” are defined to assess proposals. These include whether the proposal
has been planned over the lifetime of the development to limit carbon dioxide
emissions. In addition, scale and accessibility have been added.
3.30 There remains considerable emphasis on the plan-led approach and the “town
centres first” policy.
3.31 The roles and responsibilities for regional planning bodies and local planning
authorities in preparing the evidence base that will underpin development plan
policy are clearly specified. Regional planning bodies will focus on the
requirements for comparison retail, leisure and office uses, and must define a
network and hierarchy of higher level centres.
Planning Policy Guidance Note 13: Transport (PPG 13, March 2001)
3.32 The key objectives, set out at paragraph 4 of PPG13 are to integrate planning
and transport, in order to:
“▪ promote more sustainable transport choices for both people and for moving
freight;
▪ promote accessibility to jobs, shopping, leisure facilities and services by public
transport; and
▪ reduce the need to travel, especially by car.”
3.33 The Guidance advises that planning policies should seek to promote the vitality
and viability of existing town centres, which should be the preferred locations
for new retail and leisure developments. When this development cannot be
accommodated in or on the edge of existing centres, it may be appropriate to
combine the proposal with existing out-of-centre developments.
The London Plan
3.34 The London Plan: Spatial Development Strategy has replaced strategic planning
guidance for London (formerly RPG3). The London Plan was published in
February 2004, and alterations were consolidated in 2008. One of the strategic
priorities for West London (Policy 5F.1) is to secure: “the attractiveness of town
centres and manage their restructuring where necessary”.

P13/120 11947/756914v1
3.35 Policy 3D.1 relates to town centres stating that the Mayor and London
Boroughs should: “enhance access to goods and services and strengthen the
wider role of town centres, including UDP policies to:
• Encourage retail, leisure, and other related uses in town centres, and
discourage them outside the town centres;
• Improve access to town centres by public transport, cycling and walking;
• Enhance the quality for retail and other consumer service in town centres
• Support a wide role for town centres as locations for leisure and cultural
activities, as well as business and housing;
• Require the location of appropriate health, education and other public and
community serving in town centres;
• Designate core areas primarily for shopping uses and secondary areas for
shopping and other uses and set out policies for the appropriate
management of both types of area;
• Undertake regular town centre health checks; and
• Support and encourage town centre management, partnerships and
strategies including the introduction of Business Improvement District in
appropriate locations.”
3.36 Policies 3D.2 and 3D.3 are consistent with advice set out in PPS6, regarding
maintaining town centres and focusing development within centres. Policies
3D.4 and 3D.5 seek to promote and protect arts/culture and sports facilities.
3.37 The London Plan sets out a hierarchy/classification of centres across London,
i.e. international centres (2), metropolitan centres (11), major centres (35) and
district centres (146). Harrow is classified as metropolitan centre. The following
centres in the Borough are defined as district centres: Pinner, Wealdstone
(identified as containing specialist provision of more than local importance),
Rayners Lane, South Harrow, Stanmore, North Harrow, Kingsbury (in Brent and
Harrow) and Burnt Oak (in Barnet, Brent and Harrow). The London Plan
indicates that the broad classification of centres should be refined in the light
of local circumstances through development plans.
Consumer Expenditure and Comparison Goods Retail Floorspace Need in London
(March 2009)
3.38 Supporting the London Plan the Mayor has published the Consumer
Expenditure and Comparison Goods Retail Floorspace Need in London
(CDCGRFL), which sets out the future requirement for comparison retail
floorspace. It was prepared by Experian and published in March 2009.

P14/120 11947/756914v1
3.39 In terms of comparison goods, the CDCGRFL uses two different scenarios to
estimate need; scenario 1 is based on existing floorspace remaining the same
and scenario 2 incorporates allowances for retail commitments and proposals
in the planning pipeline. Scenario 2 is considered to more accurately reflect
future floorspace requirements. Experian incorporates high, mid-range and low
floorspace estimates based on differing productivity growth rates of 1.5%, 2.2%
and 2.8% respectively.
3.40 The estimated requirement for additional comparison goods floorspace in LB of
Harrow, West London and the wider London area, based on scenario 2, is
shown in Table 3.1 below.
Table 3.1: Gross Comparison Goods Floorspace Requirements
Space required (sq m gross) Year Productivity
Growth % Harrow West London London
2011 1.5
2.2
2.8
6,950
3,167
46
84,084
48,804
19,698
476,732
272,656
104,288
2016 1.5
2.2
2.8
16,470
8,372
1,900
193,753
117,033
55,722
1,075,378
629,645
273,435
2021 1.5
2.2
2.8
32,798
19,255
8,771
360,584
231,094
130,859
2,087,461
1,330,595
744,723
2026 1.5
2.2
2.8
51,341
31,203
16,105
538,195
343,773
198,003
2,872,429
2,076,553
1,220,566
2031 1.5
2.2
2.8
76,258
47,570
26,737
796,194
516,471
313,337
4,429,838
2,940,596
1,816,478
Source: CDCGRFL (March 2009), Tables 67- 71 pages 113- 117.
3.41 The CDCGRFL includes a cumulative impact analysis of major pipeline retail
developments including White City, Stratford and Brent Cross. The impact on
Harrow town centre is estimated to be 6.4% in 2031, a reduction of about £50
million. The CDCGRFL predicts that the centre will decline in the Greater
London rankings based on pipeline developments and this reduction in turnover
from 11th in 2006 to 19th in 2031 in terms of total comparison goods
expenditure (CDCGRFL Table 46 page 86). The floorspace projections shown in
Table 3.1 appear to take into account the expected cumulative impact and drop
in turnover. Unfortunately the CDCGRFL does not indicate what scale of
development would be required in Harrow town centre to maintain existing
market share and/or Harrow’s current rank. In order to maintain its relative
position (11th), Harrow town centre would need to increase its turnover in 2031
from £732 million to £842 million. We estimate the retail floorspace
P15/120 11947/756914v1
projections for Harrow at 2031 in Table 3.1 would need to be increased by
about 25% i.e. +6,700 to +19,000 sq m.
Convenience Goods Floorspace Need in London (June 2005)
3.42 The Convenience Goods Floorspace Need in London (CGFNL) document
provides detailed strategic guidance on the need for additional convenience
goods floorspace in Greater London over the 2001 to 2016 period. It was
produced by Experian in 2005. This study is based on retail data that has now
been out of date. On this basis, the findings of this report should be viewed
with caution and hold limited weight. This work is not currently being update by
the GLA.
3.43 The CGFNL estimates future convenience requirements based on a ‘timeline’
approach within which an allowance is made for committed and proposed retail
developments. Three different productivity growth rates of 0.15%, 0.5% and
1.0% are applied to the results and two different sales densities of £5,500 per
sq m and £9,400 per sq m are used to estimate the turnover of pipeline
developments. Experian’s latest information Brief (6.1) suggest past growth in
turnover efficiency nationally was 2.9% per annum between 1999 and 2007,
but this was influenced by one off factors i.e. the introduction of Sunday trading
and longer opening hours. Experian’s recommended future growth rate is 0.8%
per annum. NLP’s assessment of current floorspace in the Borough and
company average sales density information suggests the existing average sales
density in the Borough is around £6,700 per sq m, i.e. within the ranges
suggested by the CGFNL.
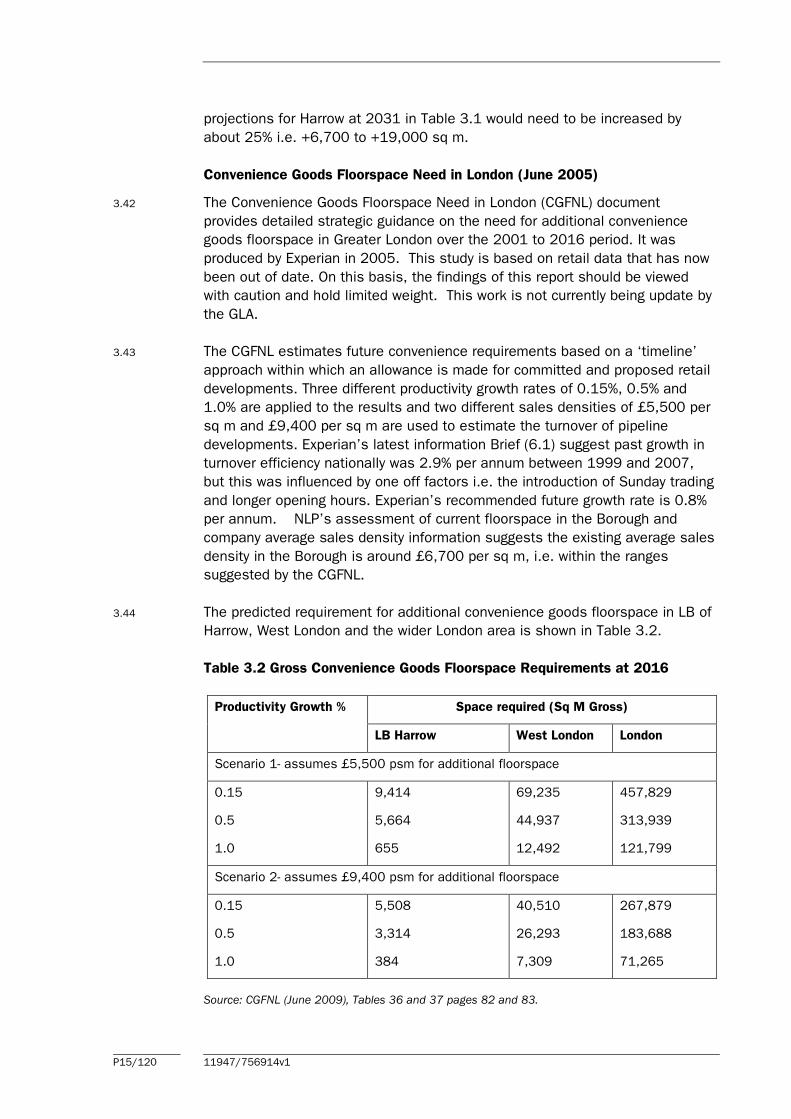
3.44 The predicted requirement for additional convenience goods floorspace in LB of
Harrow, West London and the wider London area is shown in Table 3.2.
Table 3.2 Gross Convenience Goods Floorspace Requirements at 2016
Space required (Sq M Gross) Productivity Growth %
LB Harrow West London London
Scenario 1- assumes £5,500 psm for additional floorspace
0.15
0.5
1.0
9,414
5,664
655
69,235
44,937
12,492
457,829
313,939
121,799
Scenario 2- assumes £9,400 psm for additional floorspace
0.15
0.5
1.0
5,508
3,314
384
40,510
26,293
7,309
267,879
183,688
71,265
Source: CGFNL (June 2009), Tables 36 and 37 pages 82 and 83.

P16/120 11947/756914v1
West London Sub-Regional Development Framework
3.45 The West London Sub-Regional Development Framework (WLSRDF) was
adopted in May 2006 and aims to provide guidance on the implementation of
policies in the London Plan in West London. It is divided into two parts: Part
One concerns the overall direction of the Sub-Region whilst Part Two looks at
implementation.
3.46 In Part Two of the WLSRDF, the need to focus most new comparison goods
floorspace on Metropolitan Centres is highlighted (para.125). Specifically in
terms of Harrow Metropolitan Centre, it emphases the need to take advantage
of the scope for mixed-use intensification as well as expanding the retail sector.
Harrow Unitary Development Plan
3.47 The Harrow Unitary Development Plan was adopted in July 2004. Following the
Planning and Compulsory Purchase Act (2004) some policies were not saved
and only saved policies are referred to below.
3.48 The hierarchy of shopping centres in the Borough is defined in Policy SEM2 as
follows:
• Harrow Metropolitan Centre;
• District Town Centres;
• Local Centres; and
• Local Parades and Shops.
3.49 The supporting text states that this hierarchy is not rigid and the position of
centres may change over time. The UDP recognises that diversity will be
important to the future of the Metropolitan Centre, District and Local Centres in
light of increased competition from superstores.
3.50 Policy EM5 relates to new large scale retail and leisure development and sets
out the sequential approach to site selection, the need and impact tests,
consistent with PPS6.
3.51 The supporting text indicates the Council will encourage complementary uses of
an appropriate size and layout in the town centres, and will resist development
prejudicial to the health of the town centres. No size threshold for large-scale
redevelopment is stated.
3.52 Policies EM6, EM7 and EM9 outline the approach which the Council will adopt
towards new retail development. Policy EM10 supports open air markets on
appropriate sites within town centres.
3.53 Policies EM16, EM17, EM18, EM19 and EM20 relate to permitted uses within
the Primary Shopping Frontages, Secondary Shopping Frontages, Designated

P17/120 11947/756914v1
Shopping Frontages of Local Centres, Change of Use of Shops in Non -
Designated Parades and Change of Use of Shops Outside Town Centres.
3.54 Policy EM25 relates to food, drink and late night uses and stipulates that the
Council will seek to ensure that these do not have a harmful effect on
residential amenity.
Local Development Framework
3.55 LB Harrow is in the process of preparing its Local Development Framework
(LDF) in line with the new provision of the Planning and Compulsory Purchase
Act 2004. When adopted, the LDF will replace the UDP and will cover the
period to 2026.
3.56 Public consultation on Core Strategy Draft Preferred Options (CSDPO) ended in
July 2008. It outlines two alternative development scenarios: Harrow Central
Corridor Growth and Public Transport Focus Growth. Harrow Central Corridor
Growth would provide the opportunity for more intensive redevelopment, whilst
the public transport focus would spread development over a wider area.
3.57 Strategic Policy 1 in the CSDPO seeks to regenerate the town and district
centres in LB of Harrow by providing a mixture of uses to include retail,
employment, leisure, recreational and housing within a high quality public
realm.

P18/120 11947/756914v1
3.58 The LDF will comprise five Development Plan Documents in total which
comprise:
• Core Strategy DPD (CSDPO consultation ended July 2008);
• Joint Waste DPD (Issues and Options consultation ended April 2009);
• Development Management Policies DPD (consultation will occur once Core
Strategy has been submitted to the Planning Inspectorate);
• Site Allocation DPD (consultation will occur once Core Strategy has been
submitted to the Planning Inspectorate); and
• Proposals Map DPD (consultation has yet to occur).

P19/120 11947/756914v1
4.0 The Shopping Hierarchy and Catchment Area
Major Shopping Centres in Harrow and the Surrounding Area
4.1 Harrow Town Centre is the only Metropolitan Centre within the Borough.
Wealdstone, South Harrow, Rayners Lane, North Harrow, Pinners, Stanmore,
Edgware, Burnt Oak and Kingsbury are District Centres. These town centres sit
within a wider retail hierarchy that extends beyond the Borough’s boundaries.
The centres are influenced by major shopping destinations in Central and
North/West London, including Brent Cross, London’s West End, Uxbridge and
Watford. The catchment areas of many of the centres listed above overlap to a
large extent.
4.2 Management Horizons Europe’s UK Shopping Index 2008 provides an index of
retail centres on the basis of a weighted score for multiple retailers
represented in each centre. Management Horizon’s rank for centres in the
Borough and sub-region is shown in Table 4.1 below.
Table 4.1 Management Horizons Europe Shopping Index (2008)
Centre Rank MHE Index
Score
London, West End 1 1143
Watford 31 301
Uxbridge 90 217
Ealing 99 206
Harrow town centre 108 201
Brent Cross 116 190
Edgware 309 101
South Ruislip 458 74
Ruislip 553 62
Wembley 711 50
Pinner 731 49
South Harrow 779 46
Kenton 1207 30
Stanmore 1481 24
Kingsbury 1481 24
Burnt Oak 1590 22
Wealdstone 1950 17
North Harrow 3120 8
Rayners Lane 3321 7
Source: Management Horizon Europe 2008
4.3 The Managements Horizons’ index ranks Harrow town centre as the main
centre in the Borough (108th). In relation to other centres in the sub-region,
P20/120 11947/756914v1
London West End (1st), Watford (31st), Uxbridge (90th) and Ealing (99th) are all
ranked above Harrow town centre. Harrow town centre appears to be a second
tier centre, along with Uxbridge and Ealing.
4.4 In respect of other centres within the Borough, the rank and index are much
lower than for Harrow town centres, and are third tier centres below Harrow
town centre.
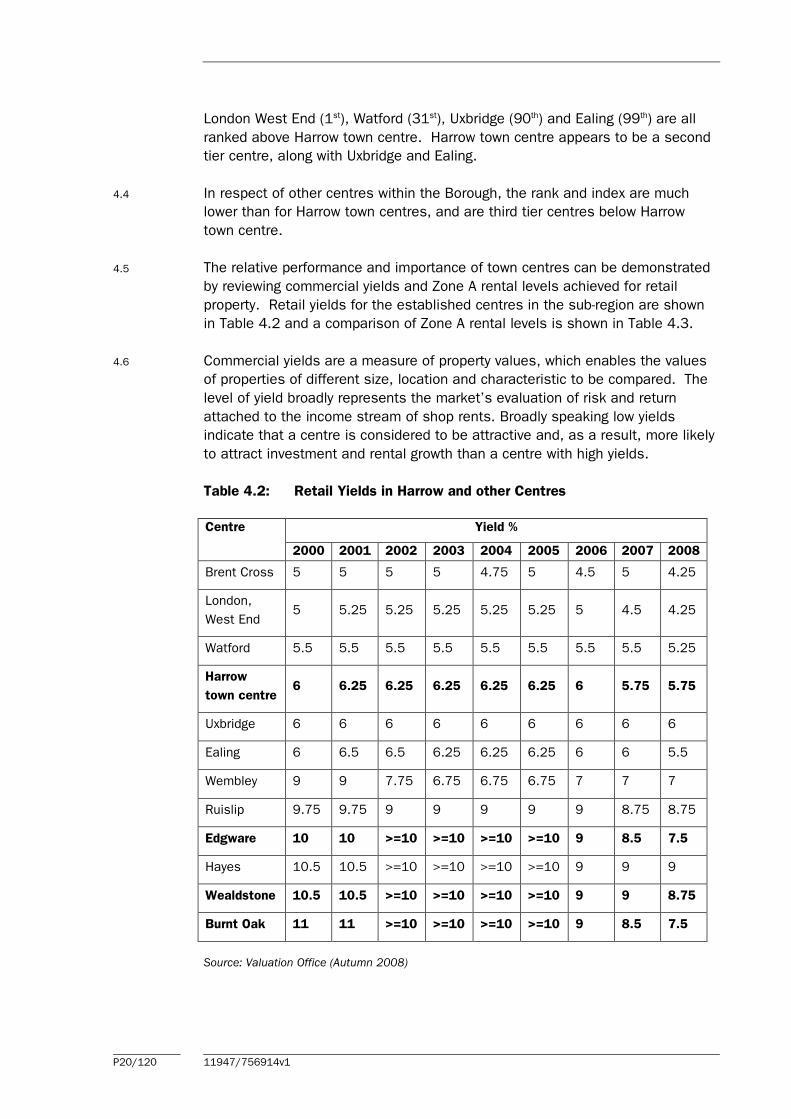
4.5 The relative performance and importance of town centres can be demonstrated
by reviewing commercial yields and Zone A rental levels achieved for retail
property. Retail yields for the established centres in the sub-region are shown
in Table 4.2 and a comparison of Zone A rental levels is shown in Table 4.3.
4.6 Commercial yields are a measure of property values, which enables the values
of properties of different size, location and characteristic to be compared. The
level of yield broadly represents the market’s evaluation of risk and return
attached to the income stream of shop rents. Broadly speaking low yields
indicate that a centre is considered to be attractive and, as a result, more likely
to attract investment and rental growth than a centre with high yields.
Table 4.2: Retail Yields in Harrow and other Centres
Yield % Centre
2000 2001 2002 2003 2004 2005 2006 2007 2008
Brent Cross 5 5 5 5 4.75 5 4.5 5 4.25
London,
West End 5 5.25 5.25 5.25 5.25 5.25 5 4.5 4.25
Watford 5.5 5.5 5.5 5.5 5.5 5.5 5.5 5.5 5.25
Harrow
town centre 6 6.25 6.25 6.25 6.25 6.25 6 5.75 5.75
Uxbridge 6 6 6 6 6 6 6 6 6
Ealing 6 6.5 6.5 6.25 6.25 6.25 6 6 5.5
Wembley 9 9 7.75 6.75 6.75 6.75 7 7 7
Ruislip 9.75 9.75 9 9 9 9 9 8.75 8.75
Edgware 10 10 >=10 >=10 >=10 >=10 9 8.5 7.5
Hayes 10.5 10.5 >=10 >=10 >=10 >=10 9 9 9
Wealdstone 10.5 10.5 >=10 >=10 >=10 >=10 9 9 8.75
Burnt Oak 11 11 >=10 >=10 >=10 >=10 9 8.5 7.5
Source: Valuation Office (Autumn 2008)
P21/120 11947/756914v1
4.7 Within the Borough retail yield data is only available for Harrow town centre,
Edgware, Wealdstone and Burnt Oak. The retail yield in Harrow town centre in
2008 was relatively low (good) at 5.75%. The yield has decreased (improved)
since 2005, from 6.25%, indicating that the centre may have become more
attractive to investors. However yields within Harrow town centre are still
marginally higher (worse) than Brent Cross, London West End, Watford and
Ealing, but slightly lower (better) than Uxbridge. Rental levels are significantly
higher is Uxbridge, therefore capital values are also significantly higher than in
Harrow, despite the slightly higher (worse) yield.
4.8 Edgware and Burnt Oak have higher retail yields, indicating that they are less
attractive to investors than other centres in the sub-region, although it is
notable that yields for both have decreased in recent years, suggesting that
their attractiveness for investment was improving in 2008.
4.9 The strengthening of yields between 2005 and 2008 reflected national and
Greater London trends, with a strong retail property sector. However, it seems
inevitable the recession will affect yields in 2009 and 2010, and return to pre-
2005 levels.
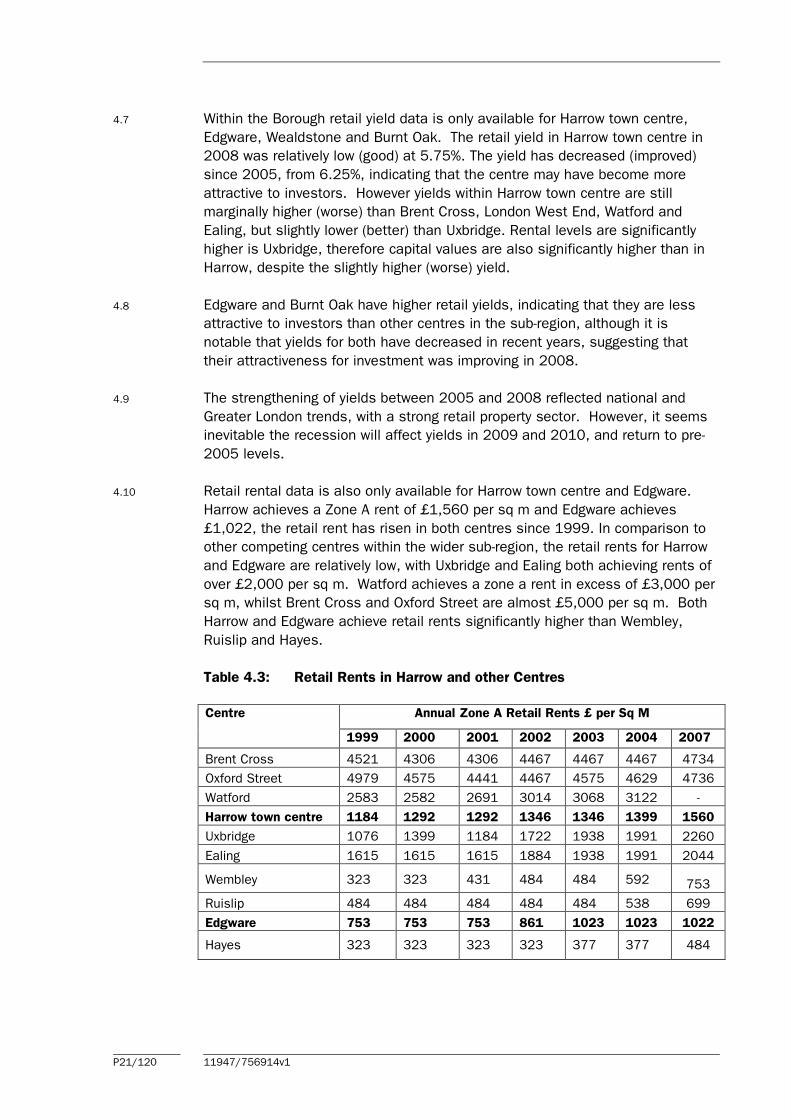
4.10 Retail rental data is also only available for Harrow town centre and Edgware.
Harrow achieves a Zone A rent of £1,560 per sq m and Edgware achieves
£1,022, the retail rent has risen in both centres since 1999. In comparison to
other competing centres within the wider sub-region, the retail rents for Harrow
and Edgware are relatively low, with Uxbridge and Ealing both achieving rents of
over £2,000 per sq m. Watford achieves a zone a rent in excess of £3,000 per
sq m, whilst Brent Cross and Oxford Street are almost £5,000 per sq m. Both
Harrow and Edgware achieve retail rents significantly higher than Wembley,
Ruislip and Hayes.
Table 4.3: Retail Rents in Harrow and other Centres
Annual Zone A Retail Rents £ per Sq M Centre
1999 2000 2001 2002 2003 2004 2007
Brent Cross 4521 4306 4306 4467 4467 4467 4734
Oxford Street 4979 4575 4441 4467 4575 4629 4736
Watford 2583 2582 2691 3014 3068 3122 -
Harrow town centre 1184 1292 1292 1346 1346 1399 1560
Uxbridge 1076 1399 1184 1722 1938 1991 2260
Ealing 1615 1615 1615 1884 1938 1991 2044
Wembley 323 323 431 484 484 592 753
Ruislip 484 484 484 484 484 538 699
Edgware 753 753 753 861 1023 1023 1022
Hayes 323 323 323 323 377 377 484

P22/120 11947/756914v1
4.11 The yield and rental information reflects each centres position within the wider
retail hierarchy, i.e. larger centres have higher Zone A rents and lower yields
than smaller centres. Lower rents and higher yields do not necessarily
indicate a smaller centre is performing badly or that the centre is not vital and
viable. Rents in Harrow town centre improved between 2003 and 2007, but
remain much lower than larger centres, and notably Uxbridge. Uxbridge may
have overtaken Harrow following major investment at the Chimes shopping
Centre. Harrow has lacked major investment in recent years.
4.12 Edgware and Burnt Oak have higher retail yields, indicating that they are less
attractive to investors than other centres in the sub-region, although it is
notable that yields for both have decreased between 2005 to 2008. Again this
strengthening of yields reflected national trends. The recession is likely to
increase yields, which will make investment less attractive.
Socio-Economic Characteristics within LB of Harrow
4.13 Shopping needs may vary considerably, often related to socio-economic
characteristics. For example, residents without access to a car or those on low
incomes will have different needs to those who are mobile by car or who enjoy
higher income. Lower income groups without access to a car may be less able
to travel to shopping facilities and may also be socially excluded from high
priced shops, therefore, the availability of discount or value retail facilities may
be important for these groups. The socio-economic characteristics of LB of
Harrow have been examined and compared with the Outer London and national
averages.
4.14 Car ownership in LB Harrow (77.3% of households) is slightly higher than the
Outer London average (71.4%), and is above the UK average (73.2%), as shown
in Table 4.4. The amount of households with two or more cars is also above
the national and Outer London averages.
Table 4.4: Car Ownership 2001
% Households 2001
Characteristic LB Harrow Outer London
England/Wales
Average
Car Ownership
Two or more
One
None
33.2
44.1
22.7
25.8
45.6
28.6
29.4
43.8
26.8
Sources: 2001 Census of Population
4.15 LB Harrow has a reasonable proportion of economically active adults in
employment as shown in Table 4.5 with 62.4% of employed, marginally above
both the Outer London and UK average. The unemployment rate is slightly
lower than the Outer London average and the national average. The proportion
of student residents is higher than both the Outer London and UK average. The

P23/120 11947/756914v1
proportion of retired residents is slightly lower than the UK average, but in line
with Outer London as a whole.
Table 4.5: Economic Activity 2001
% People aged 16-74 Status
LB Harrow Outer London UK Average
Employed
Unemployed
Looking after home/family
Students
Retired
Other inactive
62.4
3.1
6.9
9.3
11.2
7.1
62.1
3.6
7.2
8.3
11.2
7.7
60.2
3.4
6.5
7.3
13.6
9.0
Sources: 2001 Census of Population
4.16 The age structure in Harrow is broadly in line with national and Outer London
averages, as shown on Table 4.6. LB Harrow has slightly less children under 15
years of age than the Outer London average, although the figure is in line with
the UK average. Consistent with other Outer London boroughs, LB of Harrow
has a higher proportion of adults aged 15-44 than the UK as a whole, albeit the
proportion of these age groups in LB Harrow is slightly lower than Outer London
average.
Table 4.6: Age Structure 2001
% of Population 2001 Status
Harrow Outer London UK Average
Children 0-14
Adults 15 to 29
Adults 30 to 44
Adults 45 to 59
Adults 60 to 74
Adults 75 +
18.8
20.4
23.4
18.4
12.0
7.1
19.4
20.6
24.6
17.3
11.4
6.6
18.9
18.8
22.6
19.0
13.0
7.4
Sources: 2001 Census of Population
4.17 Harrow has a lower proportion of White British residents than the Outer London
average, and the proportion of White British is almost half the England average.
LB Harrow has a notably high proportion of Asian or Asian British (Indian)
residents (21.9%). This represents almost three times the Outer London
average (8%) and ten times the England average (2.1%).

P24/120 11947/756914v1
Table 4.7: Ethnic Groups 2001
% of Population 2001
Status Harrow
Outer
London
England
Average
White
White Irish
Other White
Mixed (White and Black Caribbean)
Mixed (White and Black African)
Mixed (White and Asian)
Other Mixed
Asian or Asian British (Indian)
Asian or Asian British (Pakistani)
Asian or Asian British (Bangladeshi)
Other Asian
Black/Black British (Caribbean)
Black/ Black British (African)
Other Black/ Black British
Chinese
Other Ethnic Group
49.9
4.4
4.5
0.7
0.3
1.0
0.9
21.9
2.1
0.5
5.2
3.0
2.7
0.5
1.2
1.4
65.6
2.9
6.1
0.8
0.4
0.8
0.7
8.0
2.2
0.6
2.2
3.5
3.4
0.6
0.9
1.3
87.0
1.3
2.7
0.5
0.2
0.4
0.3
2.1
1.4
0.6
0.5
1.1
1.0
0.2
0.5
0.4
Sources: 2001 Census of Population
4.18 The average house price in LB of Harrow is about 285,000, just below the
London average of £307,000 (Land Registry December 2008). The national
average is only £159,000. Average house prices are higher in Harrow when
compared with many other Outer London Boroughs e.g. Bromley (£279,000),
Enfield (£255,000), Hillingdon (£255,000), Hounslow (£267,000) and Waltham
Forest (£232,000).
4.19 The average gross earnings in the Borough is £31,462 (Annual Survey of Hours
and Earnings – 2008), similar to Outer London average (£32,576), but higher
than the national average of £26,719. Average earnings are higher in Harrow
when compared with many other Outer London Boroughs e.g. Enfield
(£28,362), Hillingdon (£28,144), Hounslow (£28,971) and Waltham Forest
(£28,362).
4.20 This socio-economic analysis indicates that the profile of residents in LB
Harrow is similar to the rest of Outer London, but in many respects the Borough
is relatively affluent e.g. in terms of car ownership, economic activity, average
house price and average earnings. The Borough has a relatively high
proportion of young adults (aged 15 to 44) when compared with the national

P25/120 11947/756914v1
average, and conversely a lower proportion of adults over 59 years of age. The
Borough’s high proportion of Asian/British Asian suggests for ethnic shopping
facilities will be high in the Borough.
4.21 The Borough has relatively high levels of car ownership, which may enable
residents to access a wider range of centres (including those outside of the
Borough). The high performing centres within the wider sub-region, such as
Brent Cross and Watford are likely to attract these mobile residents. If Harrow
can improve its retail offer then the potential exists to retain more affluent
customers and expenditure.

P26/122 11947/756914v1
5.0 Household Survey
Survey Structure
5.1 NEMS Market Research carried out a telephone survey of 1,000 households
across the retail study area in May 2009. The survey results are shown in
Appendix E and summarised in this section. The study area, shown in Appendix
A, was split into ten sectors or zones based on postcode boundaries, as
follows:
• Zone 1: Northwood
• Zone 2: Ruislip
• Zone 3: Eastcote
• Zone 4: Hatch End
• Zone 5: Rayners Lane
• Zone 6: Harrow
• Zone 7: Wembley
• Zone 8: Kenton
• Zone 9: Edgware
• Zone 10: Stanmore
5.2 The study area is broadly consistent with the study area adopted by
Donaldsons in 2005, and includes all parts of the Borough of Harrow and also
parts of adjacent boroughs where people are likely to shop within the Borough.
A list of the postcodes contained in each zone is shown in Appendix A. The
zones were chosen based on postcode boundaries which best fit the likely
primary catchment areas of the main centres in the Borough.
5.3 The number of interviews undertaken in each zone reflects the population in
each respective zone in order to provide statistically reliable sub-samples. The
main aims of the survey were to establish patterns for the following:
• Main food and grocery shopping;
• Top-up food and grocery shopping;
• Non-food shopping, including:
- clothing and footwear;
- domestic electrical appliances;
- other electrical goods (TV, Hi-Fi and computers);
- furniture, soft furnishing or carpets;
- DIY/garden items and hardware;
- health, beauty and chemist goods; and
- other non-food items.
P27/122 11947/756914v1
Food and Grocery Shopping
Main Food Shopping
5.4 The larger food stores in the study area are the primary destination for
respondents’ main food shopping trip across the study area. The survey results
suggest most residents do their food shopping at food stores relatively close to
home.
5.5 Overall, the Sainsbury’s at Kenton and the Sainsbury’s in South Ruislip were
the two most popular main food shopping destinations each achieving a market
share of 7.9% across the study area as a whole. The popularity of main food
shopping destinations was variable across the different survey zones.
5.6 In Zone 1 (Northwood) the Waitrose in Northwood was the most popular main
food shopping destination with a market share of 38.2%, followed by the Tesco,
Pinner (21.8%). The Waitrose in Ruislip is the most popular destination in Zone
2 (Ruislip) attaining a market share of 32.0% followed by the Sainsbury’s store
in South Ruislip with a 28.0% market share. The Sainsbury’s, South Ruislip is
the most popular store in Zone 3 (Eastcote) within which it achieves a market
share of 33% of main food shopping trips.
5.7 In Zone 4 (Hatch End) the Morrison’s, Hatch End and Sainsbury’s, Pinner were
the most popular main food shopping destinations with market shares of 20.0%
and 18.8% respectively. With regard to Zone 5 (Rayners Lane) the most popular
main food shopping destinations were Sainsbury’s, South Harrow and
Sainsbury’s, South Ruislip, which achieved a market share of 18.2% each.
5.8 The most popular main food shopping destination in Zone 6 (Harrow) was the
Tesco in Harrow with a 28.3% market share. In Zone 7 (Wembley), 22.3% of
respondents shop at Sainsbury’s in Alperton, followed by Sainsbury’s, Kenton
(20.0%) and Asda, Wembley (16.2%).
5.9 In Zone 8 (Kenton) the destination which attracted the largest proportion of
main food shopping trips was the Sainsbury’s in Kenton (31.9%) which was
followed in popularity by the Morrison’s in Queensbury (21.5%). In Zone 9
(Edgware) the Morrison’s in Queensbury (26.4%) and the Asda in Colindale
(24.5%) are the most popular main food shopping destinations. Finally in Zone
10 (Stanmore) the Sainsbury’s in Stanmore was the most popular last main
food shopping destination with a market share of (31.4%).
Mode of Travel for Main Food Shopping
5.10 In the study area as a whole 77.0% of respondents indicated that they travel to
do their main food shopping by car (either as driver or passenger), which is
marginally higher than NLP’s average derived from similar surveys across the
Country (around 75%). A comparable proportion of households travel by bus
(7.8%) and travel by bicycle (0.5%) compared with the NLP average (8% and
0.5% respectively), and a slightly higher proportion walk, 12.6% compared with

P28/122 11947/756914v1
the NLP average of 11.5%. A small proportion of respondents (0.5%) stated
that they used the train/tube to travel to their last main food shopping
destination with 0.7% travelling by taxi.
Mode of Travel for Non Main Food Shopping
5.11 The most popular means of travel for non-food shopping was also by car with
59.9% of respondents travelling by car, the remainder were; bus (17.6%),
walking (7.8%) and train (4.5%). Generally more shoppers use public transport
for non-food shopping than food shopping, as shown in Figure 5.1.
Figure 5.1: Mode of Travel to Shopping Destination
0.00%
10.00%
20.00%
30.00%
40.00%
50.00%
60.00%
70.00%
80.00%
90.00%
Car Bus/ Coach Walk Tube/ Train Bicycle
Mode of Travel
Percentage of Respondents
Food Shopping
Non-Food Shopping
Top-Up Food Shopping
5.12 Top-up food shopping trips are usually made in addition to main weekly (or less
frequent) shopping trips. Nearly 76% of households across the study area
indicated that they undertake small-scale or top-up shopping trips in addition to
their main food shopping trips. The results show that households primarily use
local shops for top-up shopping, and residents are less inclined to travel to
purchase top-up goods when compared with main food shopping patterns.
Overall Food and Grocer Shopping Patterns
5.13 The household survey results have been used to assess expenditure shopping
patterns within the study area zones. Shopping patterns are summarised in
Figure 5.2 below. This diagram shows the level of expenditure retained within

P29/122 11947/756914v1
LB of Harrow (circled figures) and the main cross flows of expenditure into and
out of the Borough.
Figure 5.2: Convenience Expenditure Shopping Patterns
5.14 Figure 5.2 indicates that convenience expenditure retention is relatively high
(71% to 81%) in the west half of the Borough and the north east (75% in the
Stanmore area), but there is significant leakage in the south eats of the
Borough to food stores in LB Brent and LB Barnet. Food stores in LB of Harrow
attract reasonable levels of trade from LB Hillingdon to the west.
49%
35%
5%
11%
7%
43%74%
8%
11%
55%
81%
15%
71%
22%
17%
24%
53%
5%
81%
7%
6%
3%
75%
10%
6%
5%
31%
56%
8%
27%
59%
49%
35%
5%
11%
7%
43%74%
8%
11%
55%
81%
15%
71%
22%
17%
24%
53%
5%
81%
7%
6%
3%
75%
10%
6%
5%
31%
56%
8%
27%
59%

P30/122 11947/756914v1
Non-Food Shopping
5.15 Households were asked in which location they buy most of their household’s
non-food shopping. Harrow town centre was the most popular destination in
the study area as a whole, attracting 35.8% of households. The next most
popular non-food shopping destinations include Watford (17.2%), Brent Cross
(5.8%), Uxbridge (4.3%) and Central London/ West End (4.2%). Harrow town
centre was the most popular destination for non-food shopping in four zones
(Zones 5, 6, 7 and 8). Watford is the most popular non-food shopping
destination in Zone 1 (60.0% market share), Zone 3 (26.1%) and Zone 4
(37.6%). Watford is the second most popular non-food shopping destination in
Zone 2 (24.0%) behind Uxbridge (36.0%). Edgware is most the most popular
non-food shopping destinations in Zone 9 (28.2%). In Zone 10, Brent Cross and
Watford are the most popular non-food shopping destinations attaining market
share so 17.1% each.
Figure 5.3: Main Non-Food Shopping Destinations
0.00%
5.00%
10.00%
15.00%
20.00%
25.00%
30.00%
35.00%
40.00%
Har
row
Watfo
rd
Don
't kn
ow /
varie
s
Brent
Cro
ss
Uxb
ridge
Cen
tral L
ondo
n/ W
est E
nd
Edgwar
eO
ther
Pinne
r
Wem
bley
Inte
rnet
/ Deliver
ed
Rui
slip
South
Har
row
Stanm
ore
Kings
bury
Col
inda
le
Eastc
ote
Kento
n
Nor
thwoo
d
Ray
ners
Lan
e
Weal
dsto
ne
Shopping Location
Pe
rce
nta
ge
of
Re
sid
en
ts
5.16 Households were also asked where they last shopped for different types of non-
food goods.

P31/122 11947/756914v1
5.17 In terms of clothing and footwear goods, Harrow was the most popular
destination overall and was the single most popular destination in Zones 3
(23.5%), 5 (50.3%), 6 (62.1%), 7 (43.8%) and 8 (43.0%). Watford was the
second most popular destination across the study area for clothing and
footwear goods and was the most popular destination in Zone 1 (47.3%) and 4
(40.0%). Uxbridge was the most popular destination for this type of shopping in
Zone 2 (40.0%), and Brent Cross was the most popular destination in Zone 9
(22.7%) and 10 (25.7%).
5.18 With regards to domestic electrical appliances, the most popular destination
overall is Watford, with a market share of 13.9%, followed by Harrow (10.3%).
Internet/ mail attract some 7.5% of shopping trips and draws trips from all ten
of the survey zones. Watford is the most popular destination for domestic
electrical appliances in Zones 1 (43.6%) and 4 (40.0%). Harrow is the most
popular destination for domestic electrical appliances only in Zone 6 (22.8%).
Brent Cross is the most popular last destination in Zone 7 (11.5%), 8 (17.0%)
and 9 (20.9%) and Edgware is most popular in Zone 10 (17.1%). The Currys
store on Stonebridge Way in Ruislip also appears to be popular and was the
most popular location in Zone 3 (27.8%) and Zone 5 (22.4%), and the joint
most popular destination in Zone 2 with internet/ delivered (16.0% each).
5.19 For other types of electrical goods, such as TVs, Hi-Fis and computers, the
most popular destinations overall are Watford and internet/ delivered attracted
14.6% and 10.8% respectively of residents last shopping trips for this type of
goods. Watford is the most popular destination in Zones 1 (34.5%), 4 (40.0%)
and 10 (20.0%), Brent Cross is most popular in Zones 7 (16.2%), 8 (17.8%)
and 9 (21.8%) whilst Currys in Ruislip, is the most popular destinations in
Zones 3 (23.5%) and 5 (18.2%).
5.20 Watford, Harrow and Brent Cross are the most popular destinations for buying
furniture, soft furnishings and floor coverings with 10.6%, 7.0% and 4.4%
respectively. The highest proportion of respondents in Zones 1, 3, 4 and 10
shop in Watford and in Zone 2 Ruislip was the most popular last destination for
purchasing these kinds of goods. In Zones 8 and 9 Brent Cross was the most
popular last destination for purchasing furniture, soft furnishings and floor
coverings attaining respective market shares of 10.4% and 10.9% in these
zones. Harrow is the most popular destination in Zone 5 (9.1%) and 6 (16.6%)
and in Zone 7 the most popular destination was Wembley (10.8%).
5.21 In terms of DIY, hardware and garden items are purchased from freestanding
stores, and across the study area as a whole the most popular destinations are
Homebase in Ruislip (15.0%), B&Q in Queensbury (12.0%) and Homebase in
Harrow Weald (11.1%). In Zones 2, 3 and 5 the Homebase store in Ruislip is
the most popular destination for DIY, hardware and garden items. B&Q,
Queensbury is the most popular last destination in Zones 7, 8 and 9;
Homebase in Harrow Weald was most popular in Zone 4 and 10, with the B&Q
in Watford the most popular in Zone 1. Zone 6 was the only zone within which

P32/122 11947/756914v1
the most popular destination for these goods was not a large store, with
Harrow being the most popular destination attaining a market share of 13.8%,
5.22 Respondents indicated a lesser propensity to travel larger distances to
undertake shopping for chemist, health and beauty items with a higher number
of individual destinations recorded compared to other types of comparison
goods. One would expect these types of good to be regularly be purchased in
local centre, i.e. within close proximity to GP surgeries.
5.23 Overall the most popular destination was Harrow which achieved a market
share of 27.1%, and is the single most popular destination in Zones 5, 6, 7
and 8. Pinner was the second most popular destination overall with a market
share of 6.9% and was the most popular destination in Zone 4. In the other
survey zones, the most popular destination for these goods are centres within
closes proximity to residents. In Zone 1 the most popular destination was
Northwood, Ruislip was most popular in Zone 2, Eastcote is most popular in
Zone 3, Edgware is most popular in Zone 9 and Stanmore is most popular in
Zone 10.
5.24 Across the study area as a whole, 24.1% of respondents last brought other
comparison goods items such as books, CD’s, toys and gifts from Harrow and
16.4% last bought these types of items in over the internet or had them
delivered. Harrow was the most popular destination in Zone 5 (31.5%), 6
(48.3%), 7 (27.7%) and 8 (28.1%). Watford was the most popular destination
in Zone 1 (34.5%) and 4 (25.9%) and Brent Cross was the most popular in
Zone 9 (15.5%).
5.25 Table 5.1 shows the shopping destination with the highest proportion of
respondents for each comparison goods category in each zone. This indicates
broadly where people prefer to shop for each type of good and allows
comparison between each zone.

P33/122 11947/756914v1
Table 5.1: Destinations with High Proportions of Respondents
Comparison Good Zone 1
Northwood
Zone 2
Ruislip
Zone 3
Eastcote
Zone 4
Hatch End
Zone 5
Rayners Lane
Clothing & Footwear Watford Uxbridge Harrow Watford Harrow
Domestic Appliances Watford Currys, Ruislip/
Internet/ delivered Currys, Ruislip Watford Currys, Ruislip
Electrical Goods Watford
Currys, Ruislip/
Internet/ delivered/
Watford
Currys, Ruislip Watford Currys, Ruislip
Furnishings Watford Ruislip Watford Watford Harrow
DIY & Hardware B&Q, Watford Homebase, Ruislip Homebase, Ruislip Homebase, Harrow
Weald Homebase, Ruislip
Health & Beauty Northwood Ruislip Eastcote Pinner Harrow
Books/CDs/Toys/Gifts Watford Internet/ delivered Internet/ delivered Watford Harrow
Comparison Good Zone 6
Harrow
Zone 7
Wembley
Zone 8
Kenton
Zone 9
Edgware
Zone 10
Stanmore
Clothing & Footwear Harrow Harrow Harrow Brent Cross Brent Cross
Domestic Appliances Harrow Brent Cross Brent Cross Brent Cross Edgware
Electrical Goods Harrow/ Internet/
delivered Brent Cross Brent Cross Brent Cross Watford
Furnishings Harrow Wembley Brent Cross Brent Cross Watford
DIY & Hardware Harrow B&Q, Stanmore B&Q, Stanmore B&Q, Stanmore Homebase, Harrow
Weald
Health & Beauty Harrow Harrow Harrow Edgware Stanmore
Books/CDs/Toys/Gifts Harrow Harrow Harrow Brent Cross Internet/ delivered
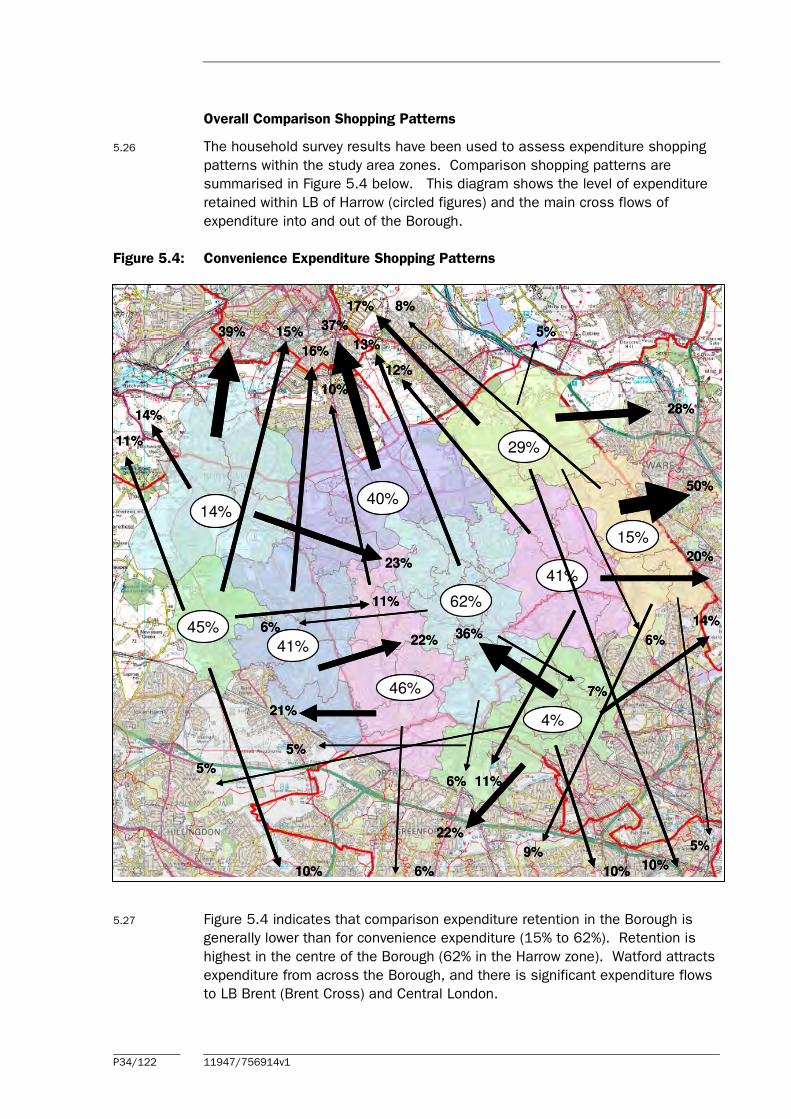
P34/122 11947/756914v1
Overall Comparison Shopping Patterns
5.26 The household survey results have been used to assess expenditure shopping
patterns within the study area zones. Comparison shopping patterns are
summarised in Figure 5.4 below. This diagram shows the level of expenditure
retained within LB of Harrow (circled figures) and the main cross flows of
expenditure into and out of the Borough.
Figure 5.4: Convenience Expenditure Shopping Patterns
5.27 Figure 5.4 indicates that comparison expenditure retention in the Borough is
generally lower than for convenience expenditure (15% to 62%). Retention is
highest in the centre of the Borough (62% in the Harrow zone). Watford attracts
expenditure from across the Borough, and there is significant expenditure flows
to LB Brent (Brent Cross) and Central London.
14%
23%
39%
14%
11%
22%45%
15%
11%
41%
40%
16%
46%
21%
36%
4%
22%
5%
62%
7%
6%
13%
29%
28%
6%
5%
41%
15%
50%
10%
37%
17%
10%
6%
6%
20%
14%
5%
12%
11%
8%
9%10%10%
5%
14%
23%
39%
14%
11%
22%45%
15%
11%
41%
40%
16%
46%
21%
36%
4%
22%
5%
62%
7%
6%
13%
29%
28%
6%
5%
41%
15%
50%
10%
37%
17%
10%
6%
6%
20%
14%
5%
12%
11%
8%
9%10%10%
5%
14%
23%
39%
14%
11%
22%45%
15%
11%
41%
40%
16%
46%
21%
36%
4%
22%
5%
62%
7%
6%
13%
29%
28%
6%
5%
41%
15%
50%
10%
37%
17%
10%
6%
6%
20%
14%
5%
12%
11%
8%
9%10%10%
5%

P35/122 11947/756914v1
Improvements to the Metropolitan and District Centres
5.28 Residents who shop in the Metropolitan and District Centres within the Borough
were asked about what improvements could be made to these centres to make
them shop there more frequently. The responses to this question are shown in
Table 5.2 below.
Table 5.2: Improvements to the Centres
Harrow Burnt Oak Kingsbury North
Harrow
Pinner
Nothing 53.4% 47.7% 49.6% 50.1% 54.9%
Better choice of shops
in general
11.0% 3.2% 5.5% 6.4% 6.4%
Cheaper/ free car
parking
8.0% 0.6% 1.2% 1.2% 3.6%
More car parking 6.7% 2.7% 3.4% 2.9% 2.9%
Better maintenance/
cleanliness
5.9% 1.5% 1.1% 0.1% 0.4%
Better safety/ more
police/ CCTV
4.1% 0.2% 0.2% 0.4% 0.0%
Better quality shops 3.8% 0.4% 1.1% 1.1% 1.9%
More large shops 3.5% 0.0% 0.6% 0.9% 1.3%
Better choice of
clothing shops
3.3% 1.0% 1.2% 1.5% 2.4%
More food
supermarkets
2.1% 0.2% 0.9% 3.2% 0.4%
Rayners
Lane
South
Harrow
Stanmore Wealdstone
Nothing 50.6% 51.9% 51.9% 49.0%
Better choice of shops
in general
6.3% 6.3% 5.6% 6.2%
Cheaper/ free car
parking
2.1% 1.2% 1.8% 1.3%
More car parking 4.2% 3.3% 4.0% 2.2%
Better maintenance/
cleanliness
0.6% 0.7% 0.1% 1.8%
Better safety/ more
police/ CCTV
0.5% 0.2% 0.2% 1.1%
Better quality shops 0.6% 1.1% 1.1% 1.5%
More large shops 0.2% 0.7% 0.7% 0.7%
Better choice of
clothing shops
1.0% 2.1% 1.1% 1.0%
More food
supermarkets
1.3% 0.6% 0.9% 2.5%
5.29 A significant proportion of respondents indicated that ‘nothing’ would make
them shop in the centre more often. However, 11% suggested a better choice
of shops would make them consider shopping in Harrow town centre, followed
by 8% cheaper or free car parking and 5.9% better maintenance. These results
are not insignificant when compared with the responses relating to the other
centres. The results demonstrate that there are actions that could be

P36/122 11947/756914v1
undertaken to improve the attractiveness of the town centre and increase
patronage. Such matters could form part of LDF policy considerations, actions
to be progressed through a Harrow town centre BID.
Brent Cross
5.30 The household survey asked specific questions regarding the proposals to
expand shopping facilities at Brent Cross. Only 13.0% of respondents indicated
that they were aware of these proposals, with the highest levels in Zone 9
(31.7%) and Zone 7 (23.2%) in the south east corner of the study area. Of
those respondents that are aware of these proposals, most (52.3%) stated that
they thought it would make them shop in Brent Cross more often, but the
proportions were much lower in the western half of the study area (Zones 1 to 3
and 6). If correct these figures suggest that the Brent Cross proposals will
draw a significant level of trade from the Borough. In order to respond to this
potential loss of trade significant improvements to retail provision will need to
be implemented in order to counter this loss of trade.
Key Messages from the Household Survey Results
5.31 Key findings of the household survey are summarised below:
• large food stores are the most popular destinations for main food shopping
accounting for the majority of main food shopping trips, but residents will
generally shop at stores that are close to home;
• nearly 76% of respondents indicated that they undertook small scale
shopping or top-up shopping trips in addition to their main food shopping
trips, and local shops are frequently used;
• most main food shopping trips are by car. The proportion of respondents
who use the bus of travel by foot to undertake their main food shop in LB
Harrow is comparable to the national average. Residents are more likely to
undertaking their non-food shopping by public transport;
• across the study area as a whole, Harrow town centre was the most popular
destination for non-food shopping, followed by Watford. However the
popularity of different destinations varied for different types of goods, with
residents willing to travel further distances for higher order items such as
clothing and footwear compared with lower order goods such as health and
beauty products;
• for DIY, hardware and garden items the majority of respondents used large
DIY stores such the B&Q in Stanmore and the Homebase stores in Ruislip
and Harrow Weald;
• the increasing importance of the internet for some comparison goods items,
such as electrical goods and books/CDs/toys/gifts, was evident from the
household survey responses;

P37/122 11947/756914v1
• development within Brent Cross is expected to attract more shopping trips
from the study area, particularly in the south east part of the study area;
• the survey identified a number of improvements that can be made to Harrow
town centre, in particular, that would make it significantly more attractive as
a place where people would chose to shop more often.

P38/122 11947/756914v1
6.0 Harrow Town Centre
Introduction
6.1 Harrow Town Centre (TC) is located to the south of the Borough and is
designated as a Metropolitan Centre in the UDP and London Plan. The defined
primary frontage comprises St Ann’s Centre, St George’s Centre, St Ann’s Road
and parts of Station Road closest to the junction of St Ann’s Road. The
secondary frontage comprises parts of Station Road north towards Tesco,
south towards the railway line and parts of Central Parade and College Road.
Mix of Uses and Occupier Representation
6.2 Harrow’s key roles include:
• convenience shopping – there are three large convenience stores in the
centre, comprising Tesco and Iceland on Station Road and the M&S food
hall on St Ann’s Road. These facilities serve main food and grocery
shopping trips in addition to basket/top-up food shopping trips. There are
also a small number of newsagents;
• comparison shopping – there is a good provision of comparison shopping in
the centre, and in particular a strong provision of clothes/ footwear stores,
consistent with its Metropolitan Centre function. There are a number of
national multiple comparison retailers present in the centre. There are also
a number of independent retailers on the peripheral areas of the centre;
• services – including a number of hairdressers, nail salons, travel agents,
estate agents and dry cleaners;
• entertainment – including 8 pubs and bars; and
• community facilities – including a church, a college and a recreational
ground.
6.3 The diversity of uses present in Harrow town centre is shown in Table 6.1
below. This is derived from the Council’s survey of town centre shopping
frontages in June 2008. The results are compared to the national average at
April 2009. It should be noted that since the survey was undertaken the
Woolworths in St George’s Centre has closed, and this has been reflected in
the land use tables.

P39/122 11947/756914v1
Table 6.1: Harrow Town Centre Use Class Mix by Unit
Number of Units % of Total Number of Units
Type of Unit
2008
Harrow town
centre 2008 National Average*
Comparison Retail 125 39.6 44
Convenience Retail 27 8.5 9.5
A1 Services 34 10.8 10.8
A2 Services 56 17.7 9.5
A3 and A5 48 15.2 14.8
A4 8 2.5 N/A
Vacant 18 5.7 11.4
Total 316 100.0 100 Source: LB Harrow Shopping Frontages Survey (June 2008) * UK average for all town centres surveyed by Goad Plans (Apr 09).
6.4 Comparison units account for the largest proportion of retail units in Harrow
town centre (39.6%), although this is slightly below the national average
(44.0%). Convenience retailers (8.5 %) represent a slightly lower proportion
compared to the national average (9.5%). The proportion of A1 services in
Harrow town centre (10.8%) is exactly the same as the national average. A3
and A5 services is slightly above the national average (accounting for 15.2% of
units compared to a national average of 14.8%), with the proportion of A2
services (17.7%) almost double the national average proportion (9.5%). In
terms of vacant premises, information compiled by Goad demonstrates that the
proportion of vacant units in Harrow town centre (5.7%) is significantly below
the national average (11.4%).
6.5 The GLA indicated that based on Goad data, Harrow town centre has about
69,400 sq m gross occupied by comparison retail uses in 2006, significantly
smaller than some other Metropolitan centres, i.e. Croydon (180,500 sq m),
Kingston (169,500 sq m), Ilford (127,500 sq m), Bromley (108,200 sq m),
Romford (103,700 sq m) and Sutton (95,800 sq m). In terms of comparison
shopping floorspace, Harrow is also slightly smaller than Wood Green (76,800
sq m) and Uxbridge (74,800 sq m) but larger than Hounslow (68,600 sq m).
Harrow is one of the smallest Metropolitan centres in London.
6.6 The analysis of the shopping hierarchy in Section 4 also confirms that Harrow’s
shopping offer is below that of other Metropolitan Centres, and the quality of
national multiples is relatively poor. The household survey results suggest the
centre has a relatively small catchment area for a designated Metropolitan
Centre.
Retailer Representation
6.7 Harrow Town Centre has 125 comparison units reflecting the centre’s role as
the main shopping and commercial centre in Harrow. Table 6.2 provides a
breakdown of comparison shop uses by goods categories.

P40/122 11947/756914v1
6.8 All categories of comparison goods trader are represented in Harrow town
centre, except for ‘florists, nurserymen and seedsmen’, reflecting the strong
range of comparison goods available in the centre. The proportion of ‘clothing
and footwear’ is slightly above the national average and is the largest
comparison category represented, consistent with its role as the Metropolitan
Centre, but the choice and quality shops could be improved. . The proportion
of ‘electrical, gas, music and photography’ units in Harrow Town Centre (16.8%)
is markedly higher than the national average (9.8%). The proportion of
‘furniture, carpets and textiles’, ‘booksellers, arts, crafts and stationers’, ‘cars,
motorcycles & motor accessories’ and ‘toys, hobby, cycle & sport’ are all
slightly below the national average. The remaining categories are broadly
similar to the national average proportions. Overall, these results indicate that
the centre provides a reasonable range of comparison goods. However, one
would expect a Metropolitan Centre to have a better choice and quality of
shops with these goods categories.
Table 6.2: Harrow Town Centre Breakdown of Comparison Units
Harrow town centre
Type of Unit Units
2008
%
2008
% UK*
Average
Clothing and Footwear 39 31.2 26.6
Furniture, carpets and textiles 4 3.2 9.1
Booksellers, arts, crafts and stationers 6 4.8 9.4
Electrical, gas, music and photography 21 16.8 9.8
DIY, hardware & homewares 7 5.6 6.6
China, glass, gifts & fancy goods 6 4.8 3.8
Cars, motorcycles & motor accessories. 1 0.8 3.1
Chemists, drug stores & opticians 13 10.4 8.9
Variety, department & catalogue 7 5.6 1.8
Florists, nurserymen & seedsmen 0 0.0 2.5
Toys, hobby, cycle & sport 3 2.4 5.1
Jewellers 7 5.6 4.9
Other comparison retailers 11 8.8 8.4
Total 125 100 100 Source: LB Harrow Shopping Frontages Survey (June 2008) * UK average for all town centres surveyed by Goad Plans (Apr 09).
6.9 There is a reasonable presence of major national comparison retailers in the
centre, but the focus is primarily on the middle and discount end of the market
rather than higher end/quality operators. The main operators include:
• Argos;
• BHS
• Boots;
• Carpet Right;
• Clinton Cards;
• Primark;
• River Island;
• Superdrug;

P41/122 11947/756914v1
• Debenhams;
• Dorothy Perkins;
• Footlocker;
• H&M;
• Marks and Spencer
• Monsoon/ Accessorize;
• Next;
• New Look;
• The Body Shop;
• TK Maxx;
• Waterstones; and
• WH Smith.
6.10 National multiple retailers in Harrow town centre are concentrated around the
central area of St Ann’s Road/Station Road, St Ann’s Centre, St George’s
Centre area. The Marks & Spencer is centrally located on St Ann’s Road, as is
the Iceland on Station Road. The Tesco and Carpet Right stores on Station
Road occupy a more peripheral location to the north of the centre.
Service Uses
6.11 Harrow town centre has a good range of service uses, with all categories
represented as shown in Table 6.3.
6.12 The proportion of units in each category is broadly similar to the national
average, save for ‘banks/other financial services’ (22.1%), which is above the
national average (14.3%). Banks and building societies present in the centre
include, Natwest, Barclays, Lloyds TSB, RBS, HSBC, Northern Rock,
Nationwide, Bradford and Bingley, Cheltenham and Gloucester, Skipton Building
Society, Chelsea Building Society, Halifax, Abbey, Alliance and Leicester and
Britannia Building Society.
Table 6.3: Harrow Town Centre Analysis of Selected Service Uses
Harrow town centre
Type of Unit Units
2008
%
2008
% UK*
Average
Restaurants/cafes/takeaways 48 42.5 43.9
Banks/other financial services 25 22.1 14.3
Estate agents/valuers 13 11.5 11.7
Travel agents 3 2.7 4.2
Hairdressers/beauty parlours 21 18.6 22.8
Laundries/dry cleaners 3 2.7 3.1
Total 113 100.0 100 Source: LB Harrow Shopping Frontages Survey (June 2008) * UK average for all town centres surveyed by Goad Plans (Apr 09).
6.13 In terms of other A2 services there are also a number of bookmakers in the
centre e.g. Timpson, Coral, William Hill and Ladbrokes. In addition to Class A
service uses, Harrow town centre is represented by many other non-retail uses,
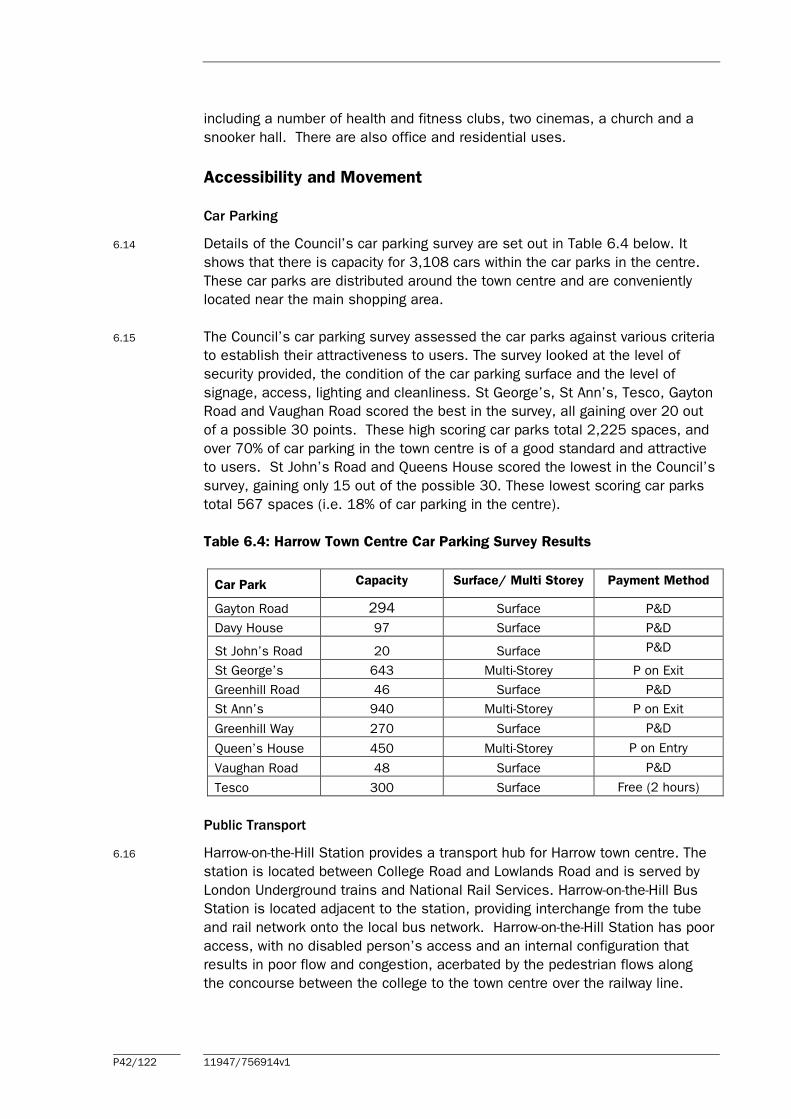
P42/122 11947/756914v1
including a number of health and fitness clubs, two cinemas, a church and a
snooker hall. There are also office and residential uses.
Accessibility and Movement
Car Parking
6.14 Details of the Council’s car parking survey are set out in Table 6.4 below. It
shows that there is capacity for 3,108 cars within the car parks in the centre.
These car parks are distributed around the town centre and are conveniently
located near the main shopping area.
6.15 The Council’s car parking survey assessed the car parks against various criteria
to establish their attractiveness to users. The survey looked at the level of
security provided, the condition of the car parking surface and the level of
signage, access, lighting and cleanliness. St George’s, St Ann’s, Tesco, Gayton
Road and Vaughan Road scored the best in the survey, all gaining over 20 out
of a possible 30 points. These high scoring car parks total 2,225 spaces, and
over 70% of car parking in the town centre is of a good standard and attractive
to users. St John’s Road and Queens House scored the lowest in the Council’s
survey, gaining only 15 out of the possible 30. These lowest scoring car parks
total 567 spaces (i.e. 18% of car parking in the centre).
Table 6.4: Harrow Town Centre Car Parking Survey Results
Car Park Capacity Surface/ Multi Storey Payment Method
Gayton Road 294 Surface P&D
Davy House 97 Surface P&D
St John’s Road 20 Surface P&D
St George’s 643 Multi-Storey P on Exit
Greenhill Road 46 Surface P&D
St Ann’s 940 Multi-Storey P on Exit
Greenhill Way 270 Surface P&D
Queen’s House 450 Multi-Storey P on Entry
Vaughan Road 48 Surface P&D
Tesco 300 Surface Free (2 hours)
Public Transport
6.16 Harrow-on-the-Hill Station provides a transport hub for Harrow town centre. The
station is located between College Road and Lowlands Road and is served by
London Underground trains and National Rail Services. Harrow-on-the-Hill Bus
Station is located adjacent to the station, providing interchange from the tube
and rail network onto the local bus network. Harrow-on-the-Hill Station has poor
access, with no disabled person’s access and an internal configuration that
results in poor flow and congestion, acerbated by the pedestrian flows along
the concourse between the college to the town centre over the railway line.

P43/122 11947/756914v1
6.17 Metropolitan line services run from Harrow-on-the-Hill Underground Station. This
provides south bound services going into Central London and northbound
services, where the line splits, to north/west London terminating at Chesham,
Watford, Amersham and Uxbridge.
6.18 Chiltern Railways provides services from the Harrow-on-the-Hill National Rail
Station with services to Central London (Marylebone Station) and to Aylesbury.
6.19 There are 16 day bus services that run from Harrow-on-the-Hill Bus Station to a
wide range of local destinations. There are services to Mill Hill Broadway,
Ruislip, Harrow Weald, Heathrow Terminals 1, 2 and 3, Golders Green, Pinner,
Brent Cross, Northwick Park Hospital, Wembley Central, Watford Junction,
Edgware, Harold Weald, South Harrow, Henton, Hatch End, North Harrow. There
are also two night bus services that run from and to Central London and
Heathrow Terminals 1, 2 and 3. We understand there has been a long-standing
proposal to reorganise/redevelop the Bus Station, because the existing layout
is poor, with limited ability to accommodate additional capacity, which raises
user safety issues. This would form part of a wider redevelopment taking
account of accessibility issues of both the train and bus stations.
Traffic Congestion and Pedestrian Movement
6.20 There are a series of A-Roads that converge in the town centre (the A404,
A312, A4005 and the A406). These main roads circumnavigate the centre, via
Greenhill Way (to the north), Shepcote Road (to the west, which runs into
Station Road to the north) and Kenton and Lowlands Road (to the South).
These road have high volumes of fast moving traffic (the majority of which is
two lanes), but they reduce the volume of through traffic in the town centre
itself. The one way system in the town centre also helps to reduce the amount
of traffic in the centre.
6.21 St Ann’s Road is a wide, pedestrianised street, which has level access to both
the town centres shopping malls off of it. St Ann’s Centre is located in the
middle of St Ann’s Road and directly south of it and St George’s Centre is
located at the western end of it. The majority of the primary shopping area is
wide, flat and traffic free, facilitating pedestrian movement and wheelchair/
pushchair access.
6.22 The Council commissioned a pedestrian flow count survey in 20041 to look at
pedestrian movement within the town centre. This showed that the highest
pedestrian flows were along St Ann’s Road and the entrances off of St Ann’s
Road into St Ann’s Centre and St George’s Centre. These patterns were also
observed during NLP’s visits.
1 PMRS Pedestrian Market Research Services, Harrow 2004 pedestrian flow counts (11th-12th June
2004).

P44/122 11947/756914v1
6.23 The seating at this eastern end of St Ann’s Road, around the public art of the
‘skipping Katie’ statue provides an attractive setting for people to stop and sit.
St Ann’s Fruitier located in the middle of the Road at the eastern end creates
vibrancy at this end of the road.
6.24 The lowest recorded pedestrian flows from the Council’s pedestrian flow count
survey were at the northern end of Station Road, towards Tesco and the most
southern end, extending into Peterborough Road.
6.25 Harrow-on-the-Hill Station is located directly adjacent to St Ann’s Centre’s
frontage on College Road, there is access through the centre onto St Ann’s
Road. College Road, apart from the station and bus station, does not have a
large amount of pedestrian movement.
6.26 When the St Ann’s Centre is closed this means pedestrians have to take a
longer route to access the main shopping area, giving a poor initial perception
about the accessibility of the town centre and is a potential barrier to promoting
a more vibrant night-time economy.
Environmental Quality
6.27 Environmental quality is generally high in the Primary Shopping Frontage, but is
dominated by the covered St Ann’s Centre. Outside the managed centre the
quality of the shopping environment is adequate but not particularly attractive.
6.28 St Ann’s Road is wide, clean, well paved and includes a variety of street
furniture, including seating, lighting and bins. There are also a small number of
trees and planting beds providing a limited amount of green space. The units
are fairly modern and of a good quality. Small concrete and glass awnings run
the length of the buildings and provide some protection from the elements for
shoppers.
6.29 At the eastern end of St Ann’s Road there are more established trees, making
the area greener than the western end. There are some older buildings at this
end of the road, located above the shops in addition to the noteworthy NatWest
bank building on the corner with Station Road (which is Grade II listed). The
seating at this eastern end of St Ann’s Road, around the public art of the
‘skipping Katie’ statue provides a pleasant setting for shoppers and office
workers to sit.
6.30 In terms of the shopping malls within the town centre, both the St Ann’s and St
George’s Centre provide a clean, attractive, quality shopping environments.
6.31 In terms of layout the centre is relatively compact but the shopping circuit is
poor, with dead ends in Station Road. There is also limited open space for
visitors to sit and relax, or to promote out door dining and the evening
economy.

P45/122 11947/756914v1
View west along St Ann’s Road towards
St George’s Centre.
Viewed east along St Ann’s Road.
View looking north along Station Road
(from the junction with College Road).
View looking west along St Ann’s Road,
from Station Road (including the ‘Katie’
statue and the Grade II listed Natwest
Bank building).
6.32 The more peripheral areas generally have a lower level of environmental quality.
The environmental quality at the northern end of Station Road is of a lower
standard, with the high volumes of traffic making it a noisy area with noticeably
lower air quality. The paving remains of a good quality, but the overall
environment is starker than other areas of the town centre with metal
pedestrian barriers dividing the pavement from the road and no trees to provide
landscaping. The retail units generally comprise ground floor units set within
older 3 storey buildings and are generally adequately maintained and of a good
standard.
6.33 The southern end of Station Road, from the junction with College Road was
also noticeably of a lower environmental quality.
Conclusion
6.34 Harrow Town Centre provides an important role in comparison and convenience
shopping. It has a high proportion of ‘clothing and footwear’ units when
compared with other centres in the Borough. However, one would expect a
Metropolitan Centre to have a better range and choice of clothing and footwear
shops. The current focus is on middle and discount sectors of the market
rather than the upper and quality end of the market. The quality of fashion

P46/122 11947/756914v1
shopping could be significantly improved in the town centre. It also has a large
amount of convenience retail floorspace, providing for both grocery shopping
and top up shopping needs. The centre has low vacancy rate and a reasonable
proportion of national multiple retailers. However as a Metropolitan Centre the
quality of the comparison shopping offer and evening economy could be
improved.
6.35 The centre has strong public transport accessibility levels enabling good access
to the centre by surrounding residents, but the bus and rail entry points could
be improved. The environmental quality of the centre is variable and
deteriorates at the periphery. The quality of the environment and public open
spaces could be improved.

P47/122 11947/756914v1
7.0 Burnt Oak
Introduction
7.1 This linear centre is located along the western side of Burnt Oak Broadway in
the east of the Borough adjacent to the boundary with LB Brent and Barnet.
Retail frontages to the south of Oakleigh Avenue are defined as forming the
Primary Shopping Frontage and retail units to the north of Oakleigh Avenue form
the Secondary Shopping Frontage.
7.2 It should be noted that retail uses extend significantly beyond the centre
boundaries as defined in the Harrow UDP, to include retail units along the
eastern side of Burnt Oak Broadway into Barnet and extending further south
into Brent. This health check assesses the centre as a whole including retail
uses in Brent and Barnet. This excludes the section regarding mix of uses
which only considers retail uses in LB Harrow.
7.3 Burnt Oak’s key roles include:
• convenience shopping – the centre contains an Iceland store and a Tesco
Metro in addition to a wide range of independent retailers in this sector;
• lower order comparison shopping – a range of comparison goods are
available in the centre which are predominately in the independent sector
and provide lower order goods;
• services – including retail banks, restaurants/cafes/takeaways and
hairdressers/beauty parlours; and
• entertainment – the centre contains several public houses.
Mix of Uses and Occupier Representation
7.4 Table 7.1 indicates the mix of uses present in the part of Burnt Oak that falls
within Harrow LPA area, is based on a survey of shopping frontages undertaken
by the Council in June 2008. It indicates that the centre is well provided for by
convenience retailers, with more than double the national average. Comparison
retail uses and A3 and A5 are below the national average, as are the proportion
of vacant units. However, if the wider centre is considered a range of additional
retail units and goods are provided including a Tesco Metro.

P48/122 11947/756914v1
Table 7.1: Burnt Oak Use Class Mix by Unit
Number of Units % of Total Number of Units Type of Unit
2008 Burnt Oak National Average*
Comparison Retail 18 30.5 44.0
Convenience Retail 12 20.3 9.5
A1 Services 10 16.9 10.8
A2 Services 8 13.6 9.5
A3 and A5 5 8.5 14.8
A4 0 n/a n/a
Vacant 6 10.2 11.4
Total 59 100.0 100.0 Source: LB Harrow Shopping Frontages Survey (June 2008) * UK average for all town centres surveyed by Goad Plans (Apr 09).
Retailer Representation
7.5 The breakdown of comparison units in the part of Burnt Oak centre is shown in
Table 7.2. The centre contains a particularly high proportion of ‘chemists, drug
stores & opticians’, ‘variety, department & catalogue’, ‘china, glass, gifts &
fancy goods’ and ‘other comparison retailers’ when compared to the national
average, although it contains no representation in six categories. However,
there is a wider range of comparison shops available beyond the Harrow LPA
boundary including a Peacocks store. Other comparison goods national
multiples are limited to Oxfam and Shoe Zone. The Woolworths store which was
open at the time of the Council’s survey has subsequently ceased to trade (this
has been taken into account in the land use figures).
Table 7.2: Burnt Oak Breakdown of Comparison Units
Burnt Oak
Type of Unit Units
2008
%
2008
% UK*
Average
Clothing and Footwear 2 11.1 26.6
Furniture, carpets and textiles 3 16.7 9.1
Booksellers, arts, crafts and stationers 0 0.0 9.4
Electrical, gas, music and photography 2 11.1 9.8
DIY, hardware & homewares 0 0.0 6.6
China, glass, gifts & fancy goods 2 11.1 3.8
Cars, motorcycles & motor access. 0 0.0 3.1
Chemists, drug stores & opticians 4 21.2 8.9
Variety, department & catalogue 1 5.6 1.8
Florists, nurserymen & seedsmen 0 0.0 2.5
Toys, hobby, cycle & sport 0 0.0 5.1
Jewellers 0 0.0 4.9
Other comparison retailers 4 21.2 8.4
Total 18 100.0 100.0 Source: LB Harrow Shopping Frontages Survey (June 2008) * UK average for all town centres surveyed by Goad Plans (Apr 09).

P49/122 11947/756914v1
Service Uses
7.6 The mix of service uses within Burnt Oak is shown in Table 7.3. This indicates
that all sub-sectors except travel agents are represented. Additional provision is
provided within neighbouring authorities. The centre contains three retail
banks/building societies comprising Abbey, NatWest and Nationwide.
Table 7.3: Burnt Oak Analysis of Selected Service Uses
Burnt Oak
Type of Unit Units
2008
%
2008
% UK*
Average
Restaurants/cafes/takeaways 5 29.4 43.9
Banks/other financial services 4 23.5 14.3
Estate agents/valuers 1 5.9 11.7
Travel agents 0 0.0 4.2
Hairdressers/beauty parlours 5 29.4 22.8
Laundries/dry cleaners 2 11.8 3.1
Total 17 100.0 100.0 Source: LB Harrow Shopping Frontages Survey (June 2008) * UK average for all town centres surveyed by Goad Plans (Apr 09). N.B. ‘Restaurants, cafés and takeaways’ does not include drinking establishments in the centre.
Accessibility and Movement
Car Parking
7.7 On-street parking is provided in the centre along the western side of Burnt Oak
Broadway from the junction with Oakleigh Terrace and Stag Lane in the north
and south of the junction with Limesdale Gardens. Surface level car parking is
provided to the rear of the Tesco Metro store and there is a surface level car
park adjacent to Burnt Oak station about 250 metres to the east of the centre.
Public Transport
7.8 Eleven bus services operated through the centre along Burnt Oak Broadway,
Stag Lane and Watling Avenue. These provide connections to a variety of
destinations including Barnet, Borehamwood, Edgware, Kingsbury and South
Harrow. Burnt Oak underground station is on the northern line and is situated
approximately 250m to the east of the defined town centre boundaries.
Traffic Congestion and Pedestrian Access
7.9 Burnt Oak Broadway forms part of the A5 which links to Junction 4 of the M1 in
the north-west to central London in the south-east. It is busy with vehicular
traffic, however pavements are wide and pedestrian crossings and islands are
provided at regular intervals. Parts of the centre i.e. the western side of Burnt
Oak Broadway from the junction with Oakleigh Avenue in the north to Stag Lane
in the south, incorporate a traffic island and on-street parking between the
pavement and the road, which reduces the impact of the A5 on pedestrians.
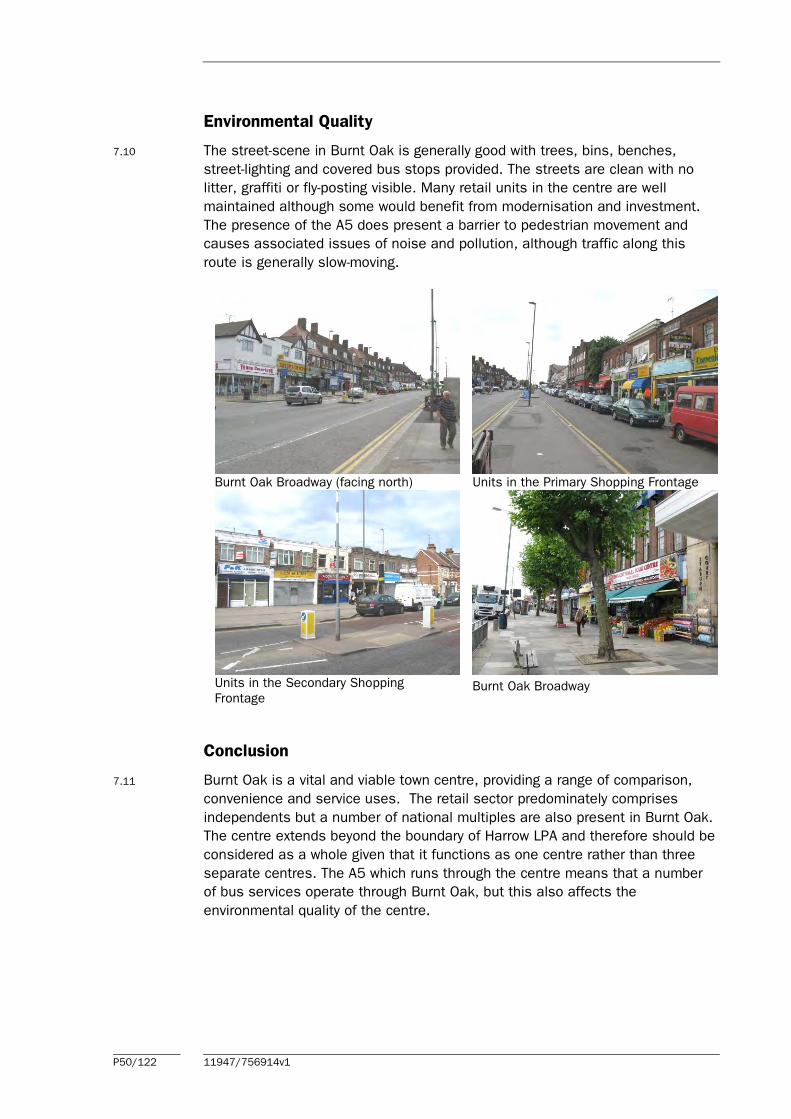
P50/122 11947/756914v1
Environmental Quality
7.10 The street-scene in Burnt Oak is generally good with trees, bins, benches,
street-lighting and covered bus stops provided. The streets are clean with no
litter, graffiti or fly-posting visible. Many retail units in the centre are well
maintained although some would benefit from modernisation and investment.
The presence of the A5 does present a barrier to pedestrian movement and
causes associated issues of noise and pollution, although traffic along this
route is generally slow-moving.
Burnt Oak Broadway (facing north)
Units in the Primary Shopping Frontage
Units in the Secondary Shopping
Frontage
Burnt Oak Broadway
Conclusion
7.11 Burnt Oak is a vital and viable town centre, providing a range of comparison,
convenience and service uses. The retail sector predominately comprises
independents but a number of national multiples are also present in Burnt Oak.
The centre extends beyond the boundary of Harrow LPA and therefore should be
considered as a whole given that it functions as one centre rather than three
separate centres. The A5 which runs through the centre means that a number
of bus services operate through Burnt Oak, but this also affects the
environmental quality of the centre.
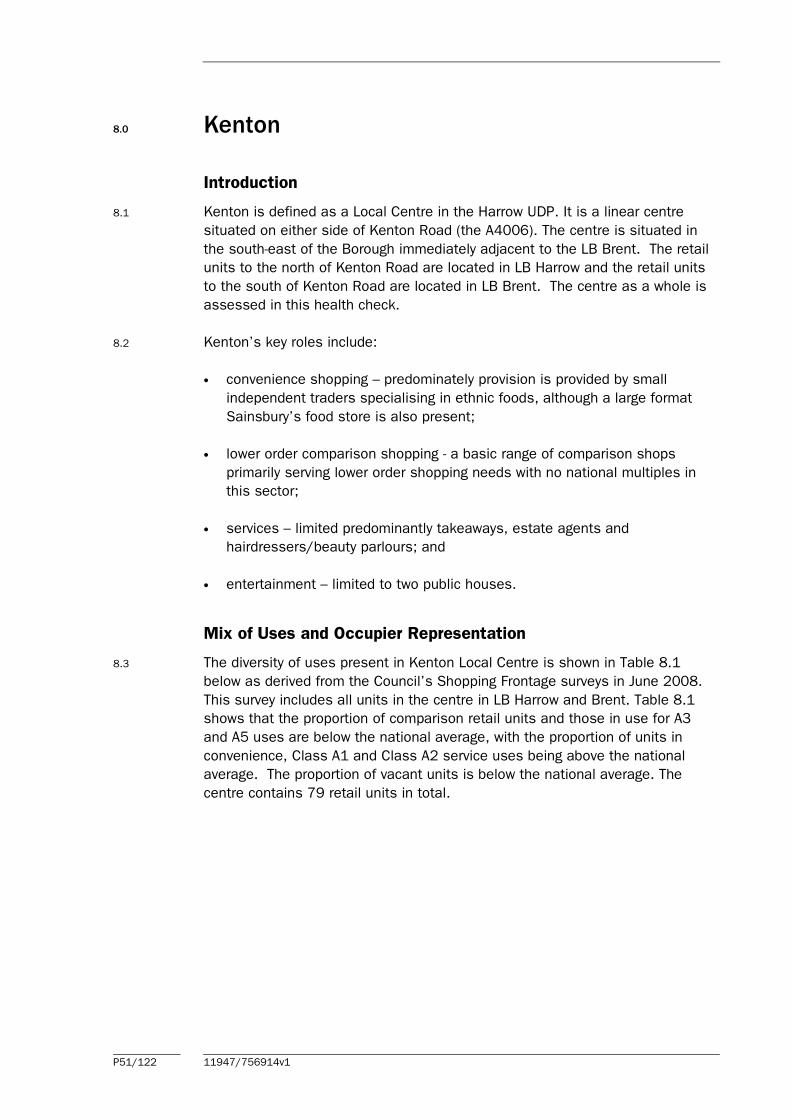
P51/122 11947/756914v1
8.0 Kenton
Introduction
8.1 Kenton is defined as a Local Centre in the Harrow UDP. It is a linear centre
situated on either side of Kenton Road (the A4006). The centre is situated in
the south-east of the Borough immediately adjacent to the LB Brent. The retail
units to the north of Kenton Road are located in LB Harrow and the retail units
to the south of Kenton Road are located in LB Brent. The centre as a whole is
assessed in this health check.
8.2 Kenton’s key roles include:
• convenience shopping – predominately provision is provided by small
independent traders specialising in ethnic foods, although a large format
Sainsbury’s food store is also present;
• lower order comparison shopping - a basic range of comparison shops
primarily serving lower order shopping needs with no national multiples in
this sector;
• services – limited predominantly takeaways, estate agents and
hairdressers/beauty parlours; and
• entertainment – limited to two public houses.
Mix of Uses and Occupier Representation
8.3 The diversity of uses present in Kenton Local Centre is shown in Table 8.1
below as derived from the Council’s Shopping Frontage surveys in June 2008.
This survey includes all units in the centre in LB Harrow and Brent. Table 8.1
shows that the proportion of comparison retail units and those in use for A3
and A5 uses are below the national average, with the proportion of units in
convenience, Class A1 and Class A2 service uses being above the national
average. The proportion of vacant units is below the national average. The
centre contains 79 retail units in total.

P52/122 11947/756914v1
8.1: Kenton Use Class Mix by Unit
Number of Units % of Total Number of Units Type of Unit
2008 Kenton National Average*
Comparison Retail 25 31.6 44.0
Convenience Retail 7 8.9 9.5
A1 Services 10 12.7 10.8
A2 Services 16 20.3 9.5
A3 and A5 10 12.7 14.8
A4 4 5.1 n/a
Vacant 7 8.9 11.4
Total 79 100.0 100.0 Source: LB Harrow Shopping Frontages Survey (June 2008) * UK average for all town centres surveyed by Goad Plans (Apr 09).
Retailer Representation
8.4 The centre contains 25 retail units, consistent with the size and role of the
centre. The range of comparison goods is focused on a small number of sub-
sectors and tends to be lower order comparison goods. The centre contains no
national multiples except for an RSPCA charity shop.
Table 8.2: Kenton Breakdown of Comparison Units
Kenton
Type of Unit Units
2008
%
2008
% UK*
Average
Clothing and Footwear 2 8.0 26.6
Furniture, carpets and textiles 1 4.0 9.1
Booksellers, arts, crafts and stationers 0 0.0 9.4
Electrical, gas, music and photography 3 12.0 9.8
DIY, hardware & homewares 3 12.0 6.6
China, glass, gifts & fancy goods 1 4.0 3.8
Cars, motorcycles & motor access. 5 20.0 3.1
Chemists, drug stores & opticians 2 8.0 8.9
Variety, department & catalogue 0 0.0 1.8
Florists, nurserymen & seedsmen 0 0.0 2.5
Toys, hobby, cycle & sport 1 4.0 5.1
Jewellers 0 0.0 4.9
Other comparison retailers 7 28.0 8.4
Total 25 100.0 100.0 Source: LB Harrow Shopping Frontages Survey (June 2008) * UK average for all town centres surveyed by Goad Plans (Apr 09).
Service Uses
8.5 Kenton contains a reasonable range of service uses for a local centre, with all
categories except a travel agent represented. The majority of units in this
sector are in the restaurants, cafes, takeaways, banks, financial services,
hairdressers and beauty parlour sectors. The centre contains only one high
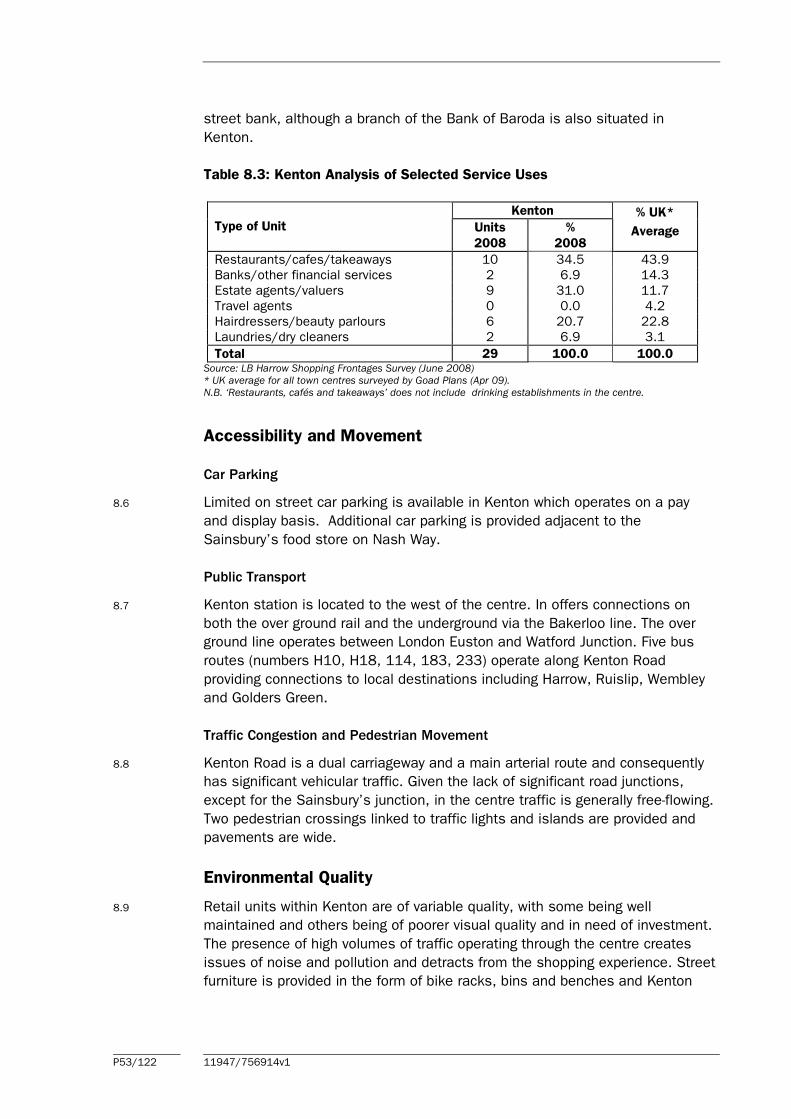
P53/122 11947/756914v1
street bank, although a branch of the Bank of Baroda is also situated in
Kenton.
Table 8.3: Kenton Analysis of Selected Service Uses
Kenton
Type of Unit Units
2008
%
2008
% UK*
Average
Restaurants/cafes/takeaways 10 34.5 43.9
Banks/other financial services 2 6.9 14.3
Estate agents/valuers 9 31.0 11.7
Travel agents 0 0.0 4.2
Hairdressers/beauty parlours 6 20.7 22.8
Laundries/dry cleaners 2 6.9 3.1
Total 29 100.0 100.0 Source: LB Harrow Shopping Frontages Survey (June 2008) * UK average for all town centres surveyed by Goad Plans (Apr 09). N.B. ‘Restaurants, cafés and takeaways’ does not include drinking establishments in the centre.
Accessibility and Movement
Car Parking
8.6 Limited on street car parking is available in Kenton which operates on a pay
and display basis. Additional car parking is provided adjacent to the
Sainsbury’s food store on Nash Way.
Public Transport
8.7 Kenton station is located to the west of the centre. In offers connections on
both the over ground rail and the underground via the Bakerloo line. The over
ground line operates between London Euston and Watford Junction. Five bus
routes (numbers H10, H18, 114, 183, 233) operate along Kenton Road
providing connections to local destinations including Harrow, Ruislip, Wembley
and Golders Green.
Traffic Congestion and Pedestrian Movement
8.8 Kenton Road is a dual carriageway and a main arterial route and consequently
has significant vehicular traffic. Given the lack of significant road junctions,
except for the Sainsbury’s junction, in the centre traffic is generally free-flowing.
Two pedestrian crossings linked to traffic lights and islands are provided and
pavements are wide.
Environmental Quality
8.9 Retail units within Kenton are of variable quality, with some being well
maintained and others being of poorer visual quality and in need of investment.
The presence of high volumes of traffic operating through the centre creates
issues of noise and pollution and detracts from the shopping experience. Street
furniture is provided in the form of bike racks, bins and benches and Kenton

P54/122 11947/756914v1
Road is tree lined. The centre appeared clean and free of graffiti and fly-posting
during NLP’s survey.
On-street parking on Kenton Road
(looking south)
Kenton Road (looking north)
Pavement on the southern side of Kenton
Road
Retail units in Kenton
Conclusion
8.10 Kenton provides a modest level of convenience, comparison and service uses,
reflecting its Local Centre designation in the Harrow UDP. It is dominated by
independent retailers and is of variable environmental quality. It provides a
number of important goods and services and has a below average number of
vacant units. The centre is easily accessible by a range of means of transport.
A Sainsbury’s food store is situated in the centre and acts as an important
anchor to the centre.
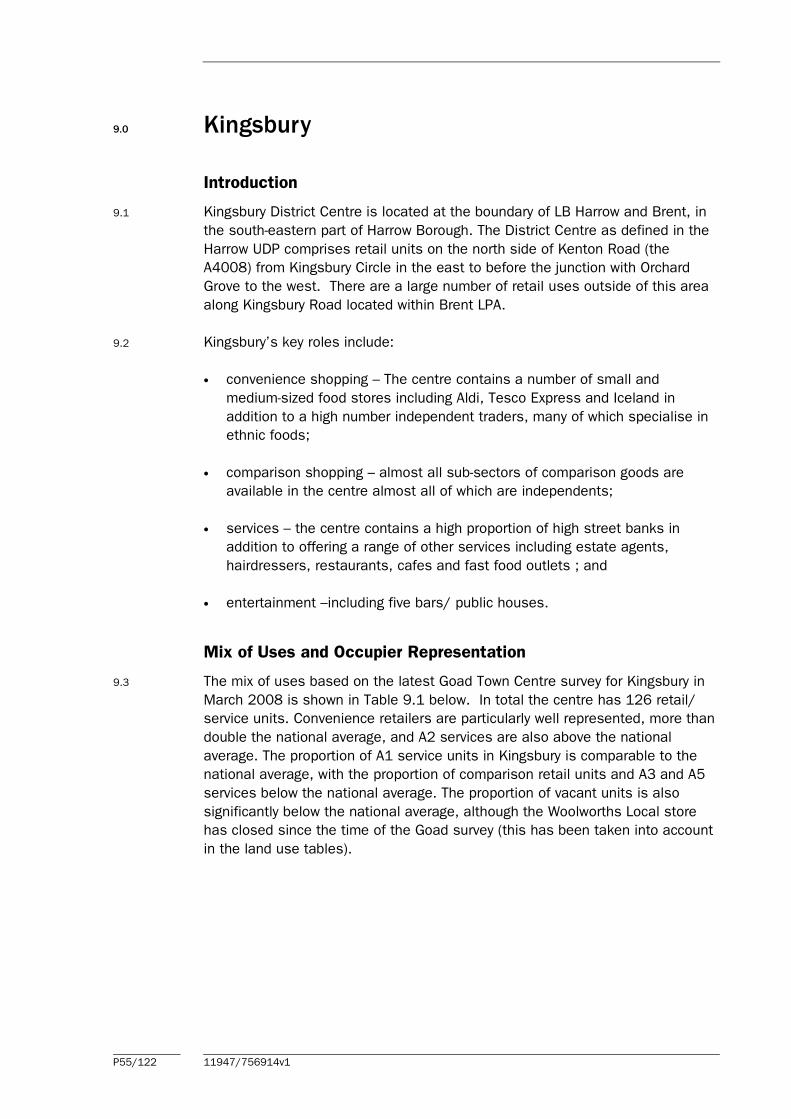
P55/122 11947/756914v1
9.0 Kingsbury
Introduction
9.1 Kingsbury District Centre is located at the boundary of LB Harrow and Brent, in
the south-eastern part of Harrow Borough. The District Centre as defined in the
Harrow UDP comprises retail units on the north side of Kenton Road (the
A4008) from Kingsbury Circle in the east to before the junction with Orchard
Grove to the west. There are a large number of retail uses outside of this area
along Kingsbury Road located within Brent LPA.
9.2 Kingsbury’s key roles include:
• convenience shopping – The centre contains a number of small and
medium-sized food stores including Aldi, Tesco Express and Iceland in
addition to a high number independent traders, many of which specialise in
ethnic foods;
• comparison shopping – almost all sub-sectors of comparison goods are
available in the centre almost all of which are independents;
• services – the centre contains a high proportion of high street banks in
addition to offering a range of other services including estate agents,
hairdressers, restaurants, cafes and fast food outlets ; and
• entertainment –including five bars/ public houses.
Mix of Uses and Occupier Representation
9.3 The mix of uses based on the latest Goad Town Centre survey for Kingsbury in
March 2008 is shown in Table 9.1 below. In total the centre has 126 retail/
service units. Convenience retailers are particularly well represented, more than
double the national average, and A2 services are also above the national
average. The proportion of A1 service units in Kingsbury is comparable to the
national average, with the proportion of comparison retail units and A3 and A5
services below the national average. The proportion of vacant units is also
significantly below the national average, although the Woolworths Local store
has closed since the time of the Goad survey (this has been taken into account
in the land use tables).
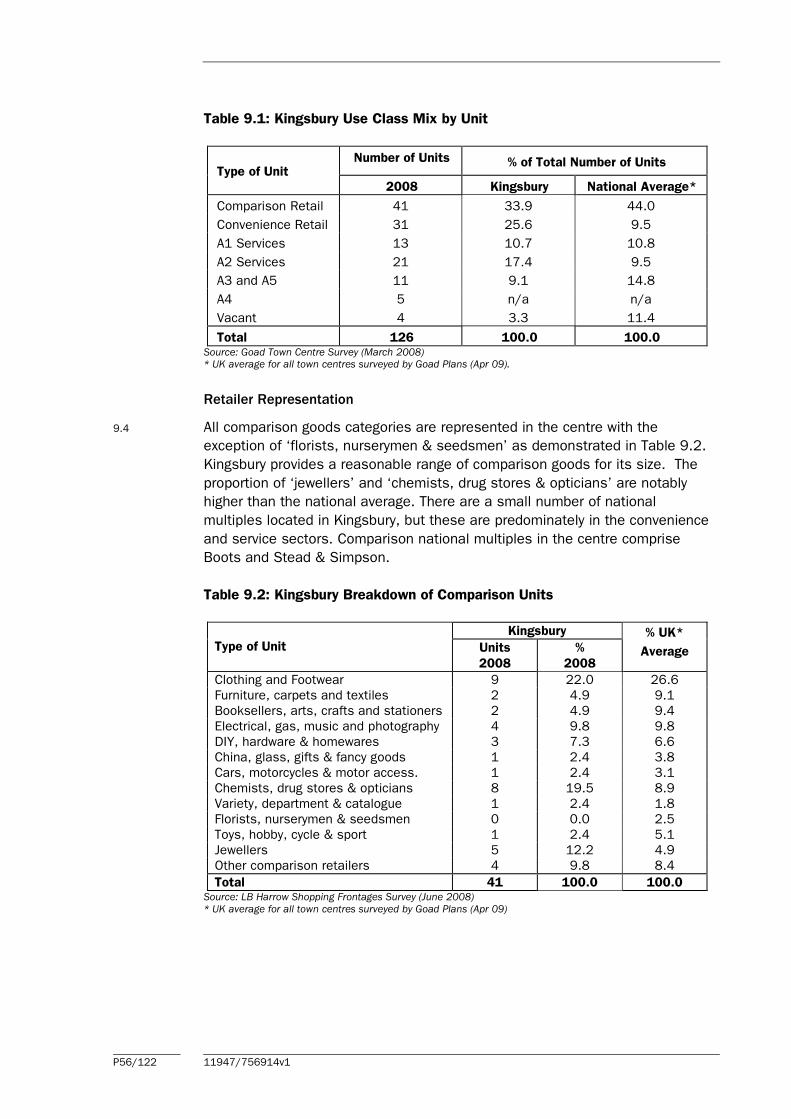
P56/122 11947/756914v1
Table 9.1: Kingsbury Use Class Mix by Unit
Number of Units % of Total Number of Units Type of Unit
2008 Kingsbury National Average*
Comparison Retail 41 33.9 44.0
Convenience Retail 31 25.6 9.5
A1 Services 13 10.7 10.8
A2 Services 21 17.4 9.5
A3 and A5 11 9.1 14.8
A4 5 n/a n/a
Vacant 4 3.3 11.4
Total 126 100.0 100.0 Source: Goad Town Centre Survey (March 2008) * UK average for all town centres surveyed by Goad Plans (Apr 09).
Retailer Representation
9.4 All comparison goods categories are represented in the centre with the
exception of ‘florists, nurserymen & seedsmen’ as demonstrated in Table 9.2.
Kingsbury provides a reasonable range of comparison goods for its size. The
proportion of ‘jewellers’ and ‘chemists, drug stores & opticians’ are notably
higher than the national average. There are a small number of national
multiples located in Kingsbury, but these are predominately in the convenience
and service sectors. Comparison national multiples in the centre comprise
Boots and Stead & Simpson.
Table 9.2: Kingsbury Breakdown of Comparison Units
Kingsbury
Type of Unit Units
2008
%
2008
% UK*
Average
Clothing and Footwear 9 22.0 26.6
Furniture, carpets and textiles 2 4.9 9.1
Booksellers, arts, crafts and stationers 2 4.9 9.4
Electrical, gas, music and photography 4 9.8 9.8
DIY, hardware & homewares 3 7.3 6.6
China, glass, gifts & fancy goods 1 2.4 3.8
Cars, motorcycles & motor access. 1 2.4 3.1
Chemists, drug stores & opticians 8 19.5 8.9
Variety, department & catalogue 1 2.4 1.8
Florists, nurserymen & seedsmen 0 0.0 2.5
Toys, hobby, cycle & sport 1 2.4 5.1
Jewellers 5 12.2 4.9
Other comparison retailers 4 9.8 8.4
Total 41 100.0 100.0 Source: LB Harrow Shopping Frontages Survey (June 2008) * UK average for all town centres surveyed by Goad Plans (Apr 09)

P57/122 11947/756914v1
Service Uses
9.5 Table 9.3 below provides a detailed breakdown of the service use category of
uses present in Kingsbury. This indicates that the centre contains no ‘travel
agents’ although all other categories of service uses are represented. The
proportion of units occupied by ‘banks/ other financial services’ and by ‘estate
agents/ valuers’ is above the national average. High street banks located in
the centre comprise Abbey, NatWest, Barclays, Halifax, HSBC, Lloyds TSB and
Nationwide.
Table 9.3: Kingsbury Analysis of Selected Service Uses
Kingsbury
Type of Unit Units
2008
%
2008
% UK*
Average
Restaurants/cafes/takeaways 11 31.4 43.9
Banks/other financial services 8 22.9 14.3
Estate agents/valuers 8 22.9 11.7
Travel agents 0 0.0 4.2
Hairdressers/beauty parlours 7 20.0 22.8
Laundries/dry cleaners 1 2.9 3.1
Total 35 100.0 100.0 Source: LB Harrow Shopping Frontages Survey (June 2008) * UK average for all town centres surveyed by Goad Plans (Apr 09). N.B. ‘Restaurants, cafés and takeaways’ does not include drinking establishments in the centre.
Accessibility and Movement
Car Parking
9.6 Kingsbury offers a mixture of on and off-street car parking. On-street car parking
is provided along Kenton Road adjacent to shop units and this is separated
from Kenton Road by a traffic island and this is free of charge. On-street car
parking is also located along parts of Kingsbury Road and operates on a pay
and display basis. A surface level car park is situated off Berkeley Road to the
rear of retail units on the northern side of Kingsbury Road, whilst the Tesco and
Iceland stores all provide customer car parking.
Public Transport
9.7 Kingsbury Underground Station is located on the south side of Kingsbury Road
and is located on the Jubilee Line. A number of bus services operate in the
area of Kingsbury Station and Kingsbury Circle. These provide transport
connections to Edgware, Hendon, Harrow and Wembley and buses serving the
centre include the 79, 183, 204, 305 and N98 (night bus).
Traffic Congestion and Pedestrian Access
9.8 Kenton Road and Kingsbury Road both form part of the A4009. Vehicular traffic
along this route tends to be slow moving and the presence of on-street car
parking, railings, traffic islands and wide pavements provides a high degree of
separation between the road and the pavements. Pedestrian crossings are

P58/122 11947/756914v1
provided and pedestrian movement is unproblematic. Cycle lanes are demarked
in the centre.
Environmental Quality
9.9 The quality of occupied units within the centre is variable, with some poor
quality frontages visible including the former Woolworths unit. Streets are wide
and generally free from litter, with no graffiti or fly-posting apparent. Parts of
Kingsbury Road are tree-lined and street-lighting, cycle racks and bins are
provided. Despite the busy nature of the A4009, the presence of vehicular
traffic does not unduly detract from the environmental quality of the centre.
Retail units on Kenton Road
On-street car parking along Kingsbury
Road
Wide pavements along Kingsbury Street
Eastern end of Kingsbury Road
Conclusion
9.10 Kingsbury is a vital and viable centre. Convenience provision and A2 services,
including banks, are particularly well represented. The range of comparison
goods and other services is good for a centre of this size. The centre contains
a number of specialist ethnic stores such as grocers, jewellers and clothing
retailers. Vacancies are below the national average and the centre is
accessible by a range of means of transport. Environmental quality in the
centre is adequate.

P59/122 11947/756914v1
10.0 North Harrow
Introduction
10.1 North Harrow is located within the western half of Harrow Borough. The centre
is located around North Harrow tube station, on the junction of Imperial Drive,
Station Road and Pinner Road. The centre also extends to the north on the
western side of Pinner Road.
10.2 The primary frontage runs along the western side of Station Road from the
station to the junction with Pinner Road and on both sides of Pinner Road from
the junction with Station Road to Canterbury Road. The secondary frontage runs
along the western side of Pinner Road from the junction with Canterbury Road
to the church, adjacent to the junction with Southfield Park. It also extends
south east down Pinner Road from the junction with Station Road and on south
west down Station Road from the junction with Pinner Road to the junction with
Argyle Road.
Mix of Uses and Occupier Representation
10.3 North Harrow’s key roles include:
• convenience shopping – includes a Tesco Express, a Costcutter and a
number of independent traders;
• comparison shopping – includes a limited amount and range of comparison
shopping. There are a number of ‘furniture, carpets and textiles’ operators
within the centre. There is also a strong provision of ‘DIY, hardware &
homewares’, ‘chemists, drug stores & opticians’ and ‘electrical, gas, music
and photography’ by independent operators;
• services include one high street national bank (Lloyds TSB), a large number
of restaurants and cafes, a number of hairdressers, a couple of dry cleaners
and opticians and a number of estate agents;
• entertainment space –including three pubs; and
• community facilities – the centre includes North Harrow Library, North
Harrow Home Guard Sports and Social Club and a dental surgery.
10.4 The diversity of uses present in North Harrow is shown in Table 10.1. This is
derived from the Council’s town centre survey in June 2008. The results are
compared to the GOAD national average from April 2009.
10.5 The Council’s survey shows that the number of comparison units (27.4%) is
substantially below the national average (44%). This is consistent with the
lower order character of this centre. The amount of convenience retailers

P60/122 11947/756914v1
present in the centre (17.9%) is almost double the national average (9.5%). The
mix of A1 and A2 services is broadly in line with the national average. The
amount of A3 and A5 uses is slightly above the national average. The number
of vacant units is slightly below the national average.
Table 10.1: North Harrow Use Class Mix by Unit
Number of Units % of Total Number of Units
Type of Unit
2008
North Harrow
2008
National
Average*
Comparison Retail 26 27.4 44
Convenience Retail 17 17.9 9.5
A1 Services 11 11.6 10.8
A2 Services 12 12.6 9.5
A3 and A5 17 17.9 14.8
A4 3 3.2 N/A
Vacant 9 9.5 11.4
Total 95 100 100 Source: LB Harrow Shopping Frontages Survey (June 2008) * UK average for all town centres surveyed by Goad Plans (Apr 09).
Retailer Representation
10.6 Table 10.2 provides a breakdown of the comparison shops within the centre by
goods categories.
Table 10.2: North Harrow Breakdown of Comparison Units
North Harrow
Type of Unit Units
2008
%
2008
% UK*
Average
Clothing and Footwear 0 0.0 26.6
Furniture, carpets and textiles 5 19.2 9.1
Booksellers, arts, crafts and stationers 0 0.0 9.4
Electrical, gas, music and photography 6 23.1 9.8
DIY, hardware & homewares 4 15.4 6.6
China, glass, gifts & fancy goods 1 3.8 3.8
Cars, motorcycles & motor access. 2 7.7 3.1
Chemists, drug stores & opticians 5 19.2 8.9
Variety, department & catalogue 0 0.0 1.8
Florists, nurserymen & seedsmen 0 0.0 2.5
Toys, hobby, cycle & sport 1 3.8 5.1
Jewellers 1 3.8 4.9
Other comparison retailers 1 3.8 8.4
Total 26 100 100 Source: LB Harrow Shopping Frontages Survey (June 2008) * UK average for all town centres surveyed by Goad Plans (Apr 09).
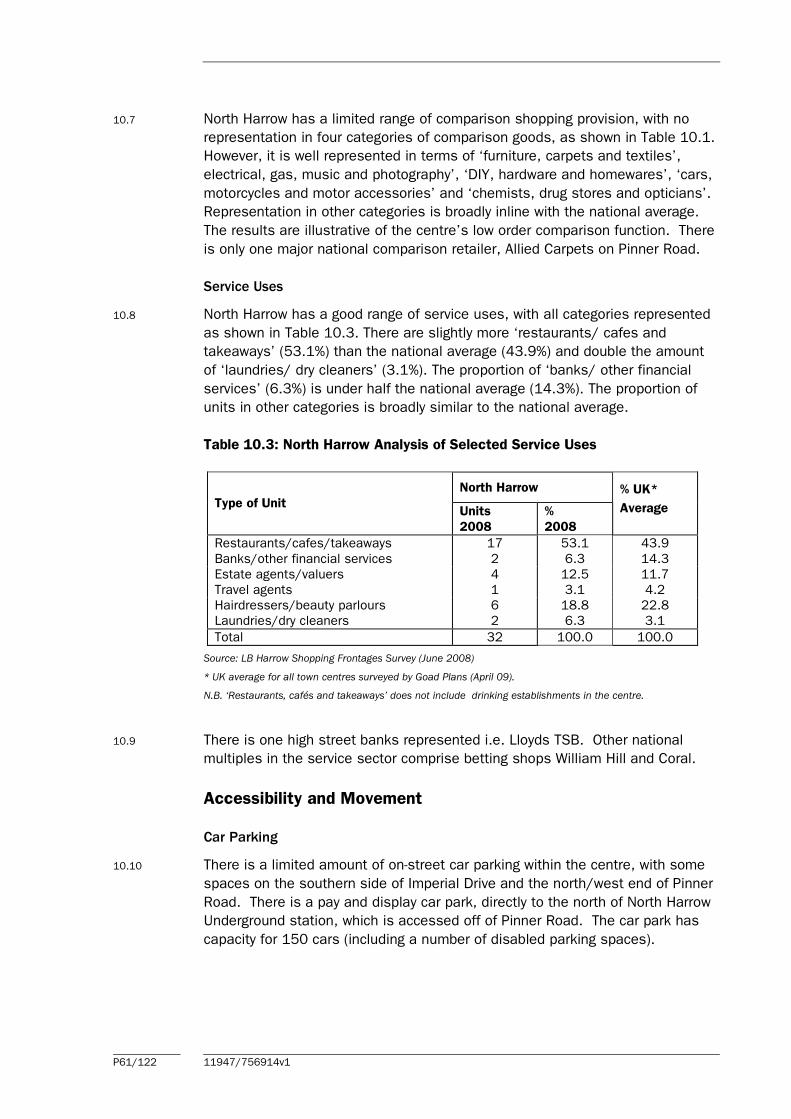
P61/122 11947/756914v1
10.7 North Harrow has a limited range of comparison shopping provision, with no
representation in four categories of comparison goods, as shown in Table 10.1.
However, it is well represented in terms of ‘furniture, carpets and textiles’,
electrical, gas, music and photography’, ‘DIY, hardware and homewares’, ‘cars,
motorcycles and motor accessories’ and ‘chemists, drug stores and opticians’.
Representation in other categories is broadly inline with the national average.
The results are illustrative of the centre’s low order comparison function. There
is only one major national comparison retailer, Allied Carpets on Pinner Road.
Service Uses
10.8 North Harrow has a good range of service uses, with all categories represented
as shown in Table 10.3. There are slightly more ‘restaurants/ cafes and
takeaways’ (53.1%) than the national average (43.9%) and double the amount
of ‘laundries/ dry cleaners’ (3.1%). The proportion of ‘banks/ other financial
services’ (6.3%) is under half the national average (14.3%). The proportion of
units in other categories is broadly similar to the national average.
Table 10.3: North Harrow Analysis of Selected Service Uses
North Harrow
Type of Unit Units
2008
%
2008
% UK*
Average
Restaurants/cafes/takeaways 17 53.1 43.9
Banks/other financial services 2 6.3 14.3
Estate agents/valuers 4 12.5 11.7
Travel agents 1 3.1 4.2
Hairdressers/beauty parlours 6 18.8 22.8
Laundries/dry cleaners 2 6.3 3.1
Total 32 100.0 100.0
Source: LB Harrow Shopping Frontages Survey (June 2008)
* UK average for all town centres surveyed by Goad Plans (April 09).
N.B. ‘Restaurants, cafés and takeaways’ does not include drinking establishments in the centre.
10.9 There is one high street banks represented i.e. Lloyds TSB. Other national
multiples in the service sector comprise betting shops William Hill and Coral.
Accessibility and Movement
Car Parking
10.10 There is a limited amount of on-street car parking within the centre, with some
spaces on the southern side of Imperial Drive and the north/west end of Pinner
Road. There is a pay and display car park, directly to the north of North Harrow
Underground station, which is accessed off of Pinner Road. The car park has
capacity for 150 cars (including a number of disabled parking spaces).
P62/122 11947/756914v1
Public Transport
10.11 North Harrow Underground Station is located at the southern end of the centre,
on Station Road. Metropolitan line services run from the station. This provides
south bound services going into Central London and northbound services,
where the line splits, to north/west London terminating at Chesham, Watford,
and Amersham.
10.12 There are six bus stops in the centre with six daytime bus services. These
comprise services between Golders Green and Pinner, Harrow and Mount
Vernon Hospital, Harrow via Rayners Lane, Harrow via Kenton, Harrow via
Belmont and to Harrow.
Traffic Congestion and Pedestrian Movement
10.13 The District Centre is set around the junction of busy A-Roads, Imperial Drive/
Station Road (A4090) and Pinner Road (A404). Small tail backs at this junction
were observed. Throughout the rest of the centre the volumes of traffic were
low to medium. There is an area for pedestrians to cross at the main Station
Road/ Pinner Road junction, but no dedicated pedestrian lights creating a
potential point of conflict. There is a crossing point to the south, on Station
Road and a crossing by the station entrance. On Pinner Road there is one
pedestrian crossing controlled by lights, by the junction with Station Road and
one other non marked crossing. From observations, these crossing points
appeared sufficient for the number of pedestrians, and vehicles do not appear
to restrict movement around the centre.
10.14 The pavements throughout the centre are wide and of a reasonable standard,
facilitating movement around the centre. In addition to the pedestrian paving,
there are dedicated cycle routes through the centre. The cycle lanes are defined
by the use of different coloured paving in some places, and in other areas
through physical separation, which prevents conflict between cyclists and
pedestrians.
Environmental Quality
10.15 The environmental quality throughout the District Centre is generally of a high
standard. The paving is of a good quality and is generally wide and free from
clutter. Street furniture present includes bins, bus stops, cycle lanes and
benches. There are a few trees which enhance the environment. No litter or
graffiti was observed.
10.16 The southern end of the District Centre on Imperial Drive, Station Road and the
southern end of Pinner Road is generally of a high standard. On Pinner Road,
towards the junction with Station Road, different materials are used across the
footway. The quality of surfacing differs and the mismatch detracts slightly from
the street scene. The northern end of Pinner Road is generally of a good
quality, although cracked paving was observed in this area.

P63/122 11947/756914v1
View North towards North Harrow Tube
Station from Imperial Drive.
View north along Pinner Road
View South towards North Harrow Tube
Station, along Station Road
View south along Pinner Road, towards
junction with Station Road.
Conclusion
10.17 North Harrow serves an important top-up convenience function for the
surrounding residential area. It also serves a more limited comparison retail
role, including a strong presence of furniture and DIY/hardware shops. The
centre has a good range of services and community facilities serving local
needs. The area is easily accessible by public transport. The setting of the
centre around busy A-roads impacts on the centre’s attractiveness, although
the centre is generally clean and tidy.
P64/122 11947/756914v1
11.0 Pinner
Introduction
11.1 Pinner is located to the north west of Harrow Borough, and is designated as a
District Centre in the UDP. The defined primary frontage runs along High Street,
Barters Walk, Bishops Walk, Red Lion Parade and parts of Bridge Street and
Love Lane. The defined secondary frontage runs along parts of Bridge Street
and Local Lane, Chapel Lane, Marsh Road and Station Approach.
Mix of Uses and Occupier Representation
11.2 Pinner’s key roles include:
• convenience shopping – there is a good range of convenience traders
serving convenience shopping needs within the centre, including a large
Sainsbury’s store, Marks & Spencer Simply Food and a Lidl. There is also a
small number of independent newsagents and a butchers and delicatessen;
• higher order comparison shopping - a good range of independent
comparison shops serving higher order shopping needs in addition to a
small amount of units serving every day shopping needs, including Boots.
There is a large range of gift shops and fancy goods, in addition to a high
proportion of charity shops;
• services - including high end restaurants and coffee shops, banks, dry
cleaners, hairdressers and beauticians and a large provision of estate
agents;
• entertainment – including two pubs and a fitness centre; and
• community facilities – including a dentists and a police station.
11.3 The diversity of uses present in Pinner is shown in Table 11.1 below. This is
derived from the Council’s survey of town centre shopping frontages in June
2008. It should be noted that since the Council’s survey was undertaken the
Woolworths Local on Bridge Street has become vacant and this has been taken
into account in the land use tables below.
11.4 Pinner has 57 comparison retail units (39%), which is slightly below the
national average, but this representation reflects its district centre role. The
number of convenience retail units is slightly below the national average (7.5%
compared to 9.5%), however the amount of convenience sales floorspace is
substantial. So whilst there are only 11 convenience retail ‘units’ within the
centre, these include a large Sainsbury superstore, Marks & Spencer Simply
Food and a Lidl store.
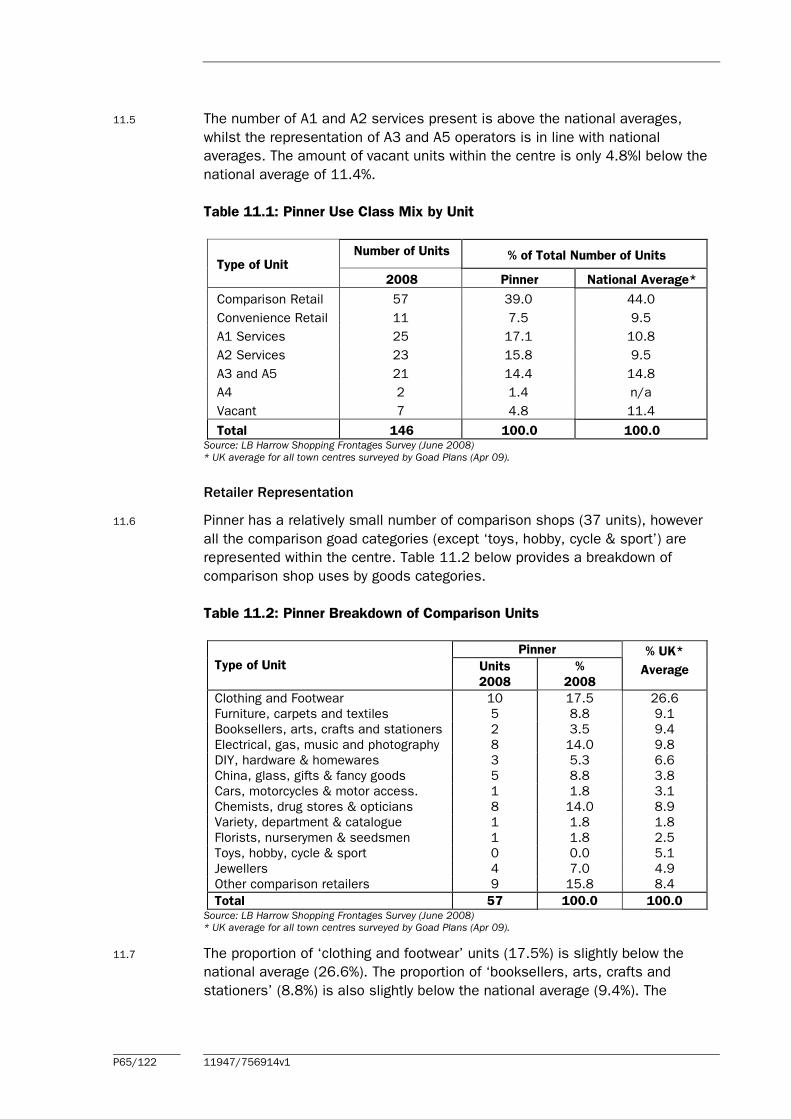
P65/122 11947/756914v1
11.5 The number of A1 and A2 services present is above the national averages,
whilst the representation of A3 and A5 operators is in line with national
averages. The amount of vacant units within the centre is only 4.8%l below the
national average of 11.4%.
Table 11.1: Pinner Use Class Mix by Unit
Number of Units % of Total Number of Units Type of Unit
2008 Pinner National Average*
Comparison Retail 57 39.0 44.0
Convenience Retail 11 7.5 9.5
A1 Services 25 17.1 10.8
A2 Services 23 15.8 9.5
A3 and A5 21 14.4 14.8
A4 2 1.4 n/a
Vacant 7 4.8 11.4
Total 146 100.0 100.0 Source: LB Harrow Shopping Frontages Survey (June 2008) * UK average for all town centres surveyed by Goad Plans (Apr 09).
Retailer Representation
11.6 Pinner has a relatively small number of comparison shops (37 units), however
all the comparison goad categories (except ‘toys, hobby, cycle & sport’) are
represented within the centre. Table 11.2 below provides a breakdown of
comparison shop uses by goods categories.
Table 11.2: Pinner Breakdown of Comparison Units
Pinner
Type of Unit Units
2008
%
2008
% UK*
Average
Clothing and Footwear 10 17.5 26.6
Furniture, carpets and textiles 5 8.8 9.1
Booksellers, arts, crafts and stationers 2 3.5 9.4
Electrical, gas, music and photography 8 14.0 9.8
DIY, hardware & homewares 3 5.3 6.6
China, glass, gifts & fancy goods 5 8.8 3.8
Cars, motorcycles & motor access. 1 1.8 3.1
Chemists, drug stores & opticians 8 14.0 8.9
Variety, department & catalogue 1 1.8 1.8
Florists, nurserymen & seedsmen 1 1.8 2.5
Toys, hobby, cycle & sport 0 0.0 5.1
Jewellers 4 7.0 4.9
Other comparison retailers 9 15.8 8.4
Total 57 100.0 100.0 Source: LB Harrow Shopping Frontages Survey (June 2008) * UK average for all town centres surveyed by Goad Plans (Apr 09).
11.7 The proportion of ‘clothing and footwear’ units (17.5%) is slightly below the
national average (26.6%). The proportion of ‘booksellers, arts, crafts and
stationers’ (8.8%) is also slightly below the national average (9.4%). The
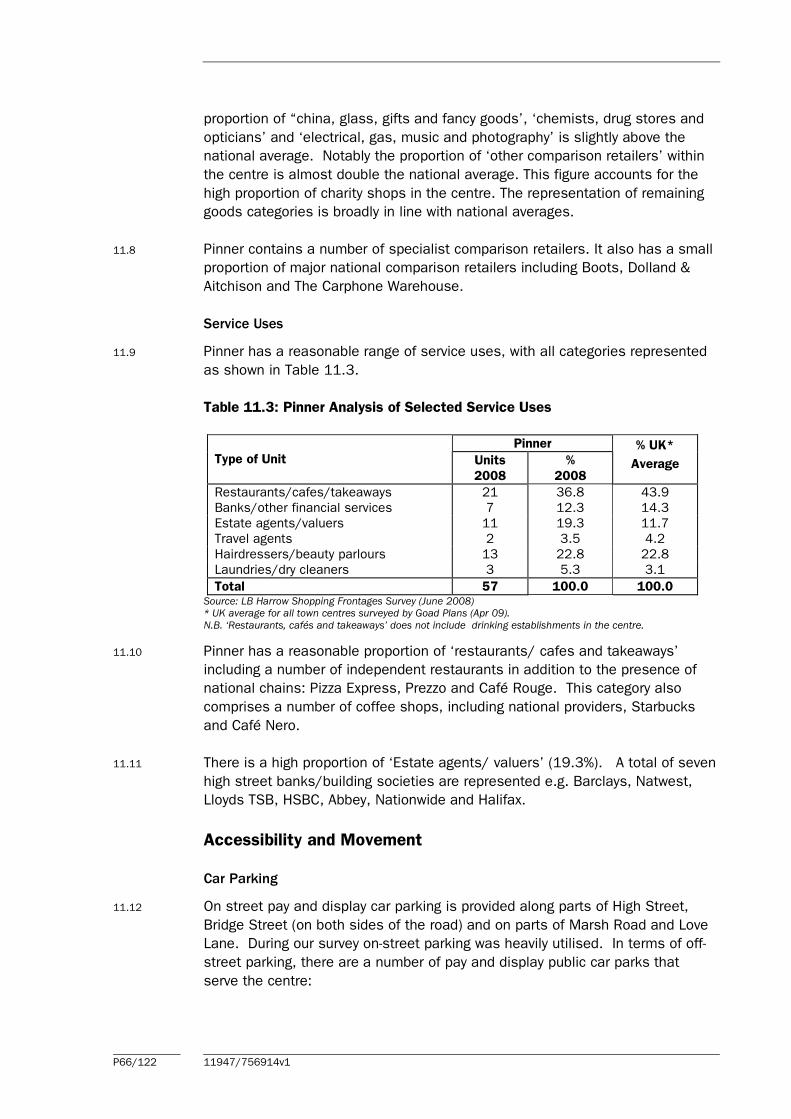
P66/122 11947/756914v1
proportion of “china, glass, gifts and fancy goods’, ‘chemists, drug stores and
opticians’ and ‘electrical, gas, music and photography’ is slightly above the
national average. Notably the proportion of ‘other comparison retailers’ within
the centre is almost double the national average. This figure accounts for the
high proportion of charity shops in the centre. The representation of remaining
goods categories is broadly in line with national averages.
11.8 Pinner contains a number of specialist comparison retailers. It also has a small
proportion of major national comparison retailers including Boots, Dolland &
Aitchison and The Carphone Warehouse.
Service Uses
11.9 Pinner has a reasonable range of service uses, with all categories represented
as shown in Table 11.3.
Table 11.3: Pinner Analysis of Selected Service Uses
Pinner
Type of Unit Units
2008
%
2008
% UK*
Average
Restaurants/cafes/takeaways 21 36.8 43.9
Banks/other financial services 7 12.3 14.3
Estate agents/valuers 11 19.3 11.7
Travel agents 2 3.5 4.2
Hairdressers/beauty parlours 13 22.8 22.8
Laundries/dry cleaners 3 5.3 3.1
Total 57 100.0 100.0 Source: LB Harrow Shopping Frontages Survey (June 2008) * UK average for all town centres surveyed by Goad Plans (Apr 09). N.B. ‘Restaurants, cafés and takeaways’ does not include drinking establishments in the centre.
11.10 Pinner has a reasonable proportion of ‘restaurants/ cafes and takeaways’
including a number of independent restaurants in addition to the presence of
national chains: Pizza Express, Prezzo and Café Rouge. This category also
comprises a number of coffee shops, including national providers, Starbucks
and Café Nero.
11.11 There is a high proportion of ‘Estate agents/ valuers’ (19.3%). A total of seven
high street banks/building societies are represented e.g. Barclays, Natwest,
Lloyds TSB, HSBC, Abbey, Nationwide and Halifax.
Accessibility and Movement
Car Parking
11.12 On street pay and display car parking is provided along parts of High Street,
Bridge Street (on both sides of the road) and on parts of Marsh Road and Love
Lane. During our survey on-street parking was heavily utilised. In terms of off-
street parking, there are a number of pay and display public car parks that
serve the centre:
P67/122 11947/756914v1
• Love Lane Car Park (183 spaces);
• Chapel Lane Car Park (150 spaces); and
• Waxwell Lane (111 spaces).
11.13 In addition to these public car parks, Sainsbury Car Park provides 243 parking
spaces and is free for 2 hours for Sainsbury’s customers. Lidl also has a
sizeable multi-storey car park to the rear of its store (approximately 250
spaces), which is free for Lidl customers.
Public Transport
11.14 Pinner Underground Station is located centrally within Pinner and is accessed
off of Station Approach. Metropolitan line services run from the station. This
provides south bound services going into Central London and northbound
services, where the line splits, to north/west London terminating at Chesham,
Watford and Amersham.
11.15 There are six bus stops within the centre and four bus routes run through the
centre, these comprise services between Harrow and Mount Vernon Hospital,
South Harrow and Stanmore, Northwood Hills and Ruislip Lido and a service
towards Golders Green.
Traffic Congestion and Pedestrian Movement
11.16 Unlike many other centres within the Borough, Pinner is not located on an A-
Road, and as a result, traffic congestion is generally lower. The main area of
congestion observed was at the roundabout junction of Love Lane and Bridge
Street.
11.17 Pedestrian movement around the centre is good. The paving through the centre
is of a high standard. Street furniture is limited to bins, bus stops, benches and
bike stands, avoiding clutter in the street scene.
11.18 The centre has pedestrian routes (Barters Walk and Bridge Walk) that enable
car free access from the station through to the High Street. These routes are
anchored by the station and Sainsbury at one end and the M&S Simply Food
and Love Lane car park at the other and pedestrian flows are strong.
Environmental Quality
11.19 The low levels of traffic through the centre assists the overall environmental
quality of the centre. The centre was clean and tidy and largely free from graffiti.
11.20 The High Street, which forms part of the Pinner High Street Conservation Area,
has a very high environmental quality. It has historic buildings, many of which
are listed and have been sensitively converted into retail units to provide a
variety of cafes and specialist shops, as well as public houses, restaurants and
offices.

P68/122 11947/756914v1
11.21 The environmental quality of Bridge Street and Love Lane is also high, although
is more consistent with a normal commercial parade of shops. Bridge Street
has wide pavements and trees creating an attractive street scene, with some
landscaping.
11.22 At the western end of the High Street, surrounded by Marsh Road and Chapel
Lane there is a reasonably sized area of green open space, adding to the
environmental quality of the centre. There is landscaping on Bishops Walk,
adjacent to the M&S unit and this route provides an interesting contrast form
the rest of the centre. Marsh Road has a slightly lower environmental quality.
The narrower pavement means that the impact of traffic is more marked. The
retail units in this area were generally of a lower quality than in the rest of the
centre.
View south/west along High Street,
towards the junction with Bridge Street
View south/east along Bridge Street,
from junction with Waxwell Lane.
View south along Marsh Road
Bridge Street.
Conclusion
11.23 Pinner is one of the largest district centres in the Borough, but is significantly
smaller than Harrow town centre and has a more localised catchment area.
The choice and range of comparison shopping is limited, but the centre has an
extensive provision of non-retail services. Pinner provides a convenience retail
role for food and grocery shopping. It also offers some specialist comparison
retail shopping, and has a good quality restaurant/café provision within the
historic setting. The centre has good car parking provision and is easily
accessible by public transport.

P69/122 11947/756914v1
12.0 Rayners Lane
Introduction
12.1 Rayners Lane is located in the south west of Harrow Borough and is designated
as a District Centre in the UDP. The District Centre is located around Rayners
Lane Underground Station and extends to the south of the station on Alexandra
Avenue and to the north on the forked roads of Imperial Drive and Rayners
Lane. The centre also includes Village Way East which circularly links Rayners
Lane with Imperial Drive.
12.2 The designated primary shopping frontage comprises the western side of
Alexandra Avenue, extending up the western and eastern side of Rayners Lane
closest to the station. The designated secondary frontage comprises the
northern most point of the western side of Alexandra Avenue, the eastern side
of Alexandra Avenue, the northern part of Rayners Lane and all of Village Way
East.
Mix of Uses and Occupier Representation
12.3 Rayners Lane’s key roles include:
• convenience shopping – there is a good range of convenience shopping in
the centre for top-up shopping. This includes a Sainsbury Local, a number of
off-licences. There are also a number of independent cash and carry units,
grocers, specialist Halal butchers, newsagents and sandwich shops,
including a Subway;
• lower order comparison shopping - a basic range of comparison shops
primarily serving lower order shopping needs. There is no national multiples
located within the centre;
• services - including banks, takeaways and hairdressers, dry cleaners and
laundrette;
• entertainment –including a couple of pubs and clubs; and
• community facilities – including a library and a religious centre.
12.4 The diversity of uses present in Rayners Lane is shown in Table 12.1 below.
This is derived from the Council’s survey in June 2008. The results are
compared to the national average at April 2009. It should be noted that since
the Council’s survey the Woolworths on Rayners Lane/Imperial Drive is now
closed, this is set to become an Iceland, and this new vacancy/commitment
has been taken into account in the land use tables detailed below.

P70/122 11947/756914v1
12.5 The proportion of comparison retail units within Rayners Lane is low (28%)
compared with the national average (44%), but this is consistent with the
centre’s lower order role. The proportion of convenience retail units is double
the national average. In addition to the convenience units within the District
Centre, it is worth noting that the there is a Tesco Express unit, directly to the
south of the centre, which also serves the top-up shopping needs of the area.
12.6 The proportion of A1 services is almost 5% above the national average. The
proportion of A2 Services and A3 and A5 uses is slightly above the national
average. The proportion of vacant units is slightly below the national average at
8.3% compared to 11.4%.
Table 12.1: Rayners Lane Use Class Mix by Unit
Number of Units % of Total Number of Units Type of Unit
2008 Rayners Lane National Average*
Comparison Retail 37 28.0 44.0
Convenience Retail 25 18.9 9.5
A1 Services 20 15.2 10.8
A2 Services 17 12.9 9.5
A3 and A5 20 15.2 14.8
A4 2 1.5 n/a
Vacant 11 8.3 11.4
Total 132 100.0 100.0 Source: LB Harrow Shopping Frontages Survey (June 2008) * UK average for all town centres surveyed by Goad Plans (Apr 09).
Retailer Representation
12.7 All broad categories of comparison shops, apart from “booksellers, arts, crafts
and stationers” are represented in Rayners Lane. Representation of ‘clothing
and footwear’, ‘furniture, carpets and textiles’ and ‘jewellers’ are below the
national averages. The proportion of ‘electrical, gas, music and photography’
units is above the national average. The number of ‘other comparison retailers’
is double the national average. The number of ‘DIY, hardware & homewares’
and ‘chemists, drug stores & opticians’ is slightly above the national average.
For all other uses the proportion of units represented in the centre is broadly in
line with the national average. There are no national multiple comparison
retailers in Rayners Lane.

P71/122 11947/756914v1
Table 12.2: Rayners Lane Breakdown of Comparison Units
Rayners Lane
Type of Unit Units
2008
%
2008
% UK*
Average
Clothing and Footwear 2 5.4 26.6
Furniture, carpets and textiles 2 5.4 9.1
Booksellers, arts, crafts and stationers 0 0 9.4
Electrical, gas, music and photography 10 27.0 9.8
DIY, hardware & homewares 4 10.8 6.6
China, glass, gifts & fancy goods 1 2.7 3.8
Cars, motorcycles & motor access. 1 2.7 3.1
Chemists, drug stores & opticians 5 13.5 8.9
Variety, department & catalogue 2 5.4 1.8
Florists, nurserymen & seedsmen 1 2.7 2.5
Toys, hobby, cycle & sport 2 5.4 5.1
Jewellers 1 2.7 4.9
Other comparison retailers 6 16.2 8.4
Total 37 100.0 100.0 Source: LB Harrow Shopping Frontages Survey (June 2008) * UK average for all town centres surveyed by Goad Plans (Apr 09).
Service Uses
12.8 Rayners Lane has a reasonable range of service uses, with all categories
represented as shown in Table 12.3. The proportion of units in Rayners Lane is
broadly in line with the national average. The proportion of ‘laundries/dry
cleaners’ (8.5%) is over double the national average (3.1%), whilst the
proportion of ‘banks/other financial services’ (8.5%) is slightly lower than the
national average (14.3%). There are three high street banks/building societies
within Rayners Lane - NatWest, Nationwide and Abbey
Table 12.3: Rayners Lane Analysis of Selected Service Uses
Rayners Lane
Type of Unit Units
2008
%
2008
% UK*
Average
Restaurants/cafes/takeaways 20 42.6 43.9
Banks/other financial services 4 8.5 14.3
Estate agents/valuers 7 14.9 11.7
Travel agents 2 4.3 4.2
Hairdressers/beauty parlours 10 21.3 22.8
Laundries/dry cleaners 4 8.5 3.1
Total 47 100 100.0 Source: LB Harrow Shopping Frontages Survey (June 2008) * UK average for all town centres surveyed by Goad Plans (Apr 09). N.B. ‘Restaurants, cafés and takeaways’ does not include drinking establishments in the centre.

P72/122 11947/756914v1
Accessibility and Movement
Car Parking
12.9 The centre has on-street parking on Rayners Lane with spaces on both sides of
the road. There is also on-street parking bays along the eastern side of Imperial
Drive. There are only a handful of on-street parking spaces on Alexandra
Avenue. The TFL Car Park, is a pay and display facility, located adjacent to
Rayners Lane station. It has capacity for 244 car parking spaces.
Public Transport
12.10 Rayners Lane Underground Station is located at the heart of the District Centre.
Metropolitan and Piccadilly Line services run from the station. The Metropolitan
Line provides south bound services going into Central London. Rayners Lane is
on the Uxbridge branch of the line, with northbound services terminating at
Uxbridge. The Piccadilly Line provides services north to Uxbridge and south to
Heathrow Terminals 1, 2 and 3 and Cockfosters, via Central London.
12.11 There are five bus stops within the District Centre and four bus routes serve the
centre, i.e. between Greenford and Ruislip, South Harrow and Stanmore and
two services go to Harrow, one via South Harrow and the other via Kenton,
Harrow and Wealdstone and North Harrow.
Traffic Congestion and Pedestrian Movement
12.12 Imperial Drive/Alexandra Avenue (A4090) runs through the centre to North
Harrow and South Harrow with two lanes of traffic in each direction. Moderate
levels of traffic were observed in this part of the centre and small tail backs at
the junction with Rayners Lane were observed. Traffic observed on Rayners
Lane and Village Way East was much lighter.
12.13 Pedestrian movement around the centre is generally good. The setting of the
centre around A-roads creates potential pedestrian/traffic conflicts. The traffic
on Imperial Drive/Alexandra Avenue creates a barrier to movement between the
eastern sides of the road and the western side of the centre. In addition the
railway line bi-sects the centre and creates a barrier to movement between the
northern and southern parts of the centre.
12.14 There are dedicated cycle routes along the western side of Alexandra Avenue
and Rayners Lane. The cycle lanes are defined by the use of different coloured
paving in some places, and in other areas through physical separation by a
curb. This differentiation avoids conflicts occurring between cyclists and
pedestrians.
Environmental Quality
12.15 The commercial property in the centre is generally two storey with residential
above. The properties on the western side of Rayners Lane, towards the
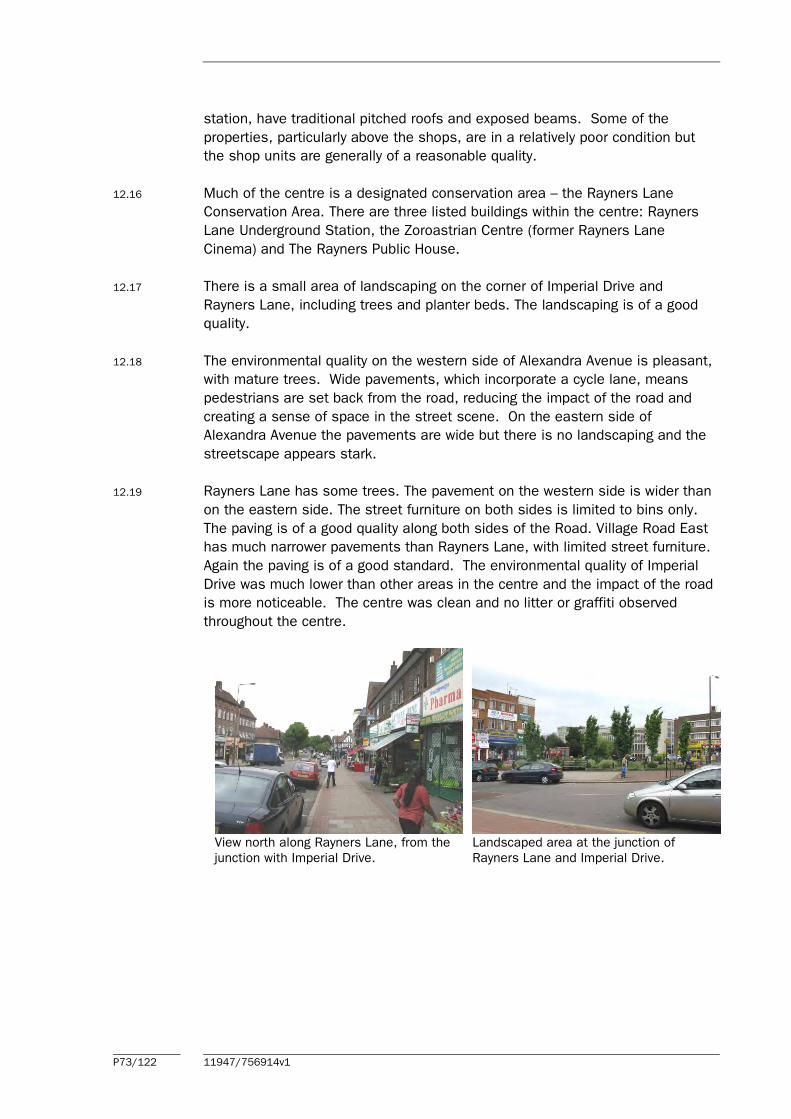
P73/122 11947/756914v1
station, have traditional pitched roofs and exposed beams. Some of the
properties, particularly above the shops, are in a relatively poor condition but
the shop units are generally of a reasonable quality.
12.16 Much of the centre is a designated conservation area – the Rayners Lane
Conservation Area. There are three listed buildings within the centre: Rayners
Lane Underground Station, the Zoroastrian Centre (former Rayners Lane
Cinema) and The Rayners Public House.
12.17 There is a small area of landscaping on the corner of Imperial Drive and
Rayners Lane, including trees and planter beds. The landscaping is of a good
quality.
12.18 The environmental quality on the western side of Alexandra Avenue is pleasant,
with mature trees. Wide pavements, which incorporate a cycle lane, means
pedestrians are set back from the road, reducing the impact of the road and
creating a sense of space in the street scene. On the eastern side of
Alexandra Avenue the pavements are wide but there is no landscaping and the
streetscape appears stark.
12.19 Rayners Lane has some trees. The pavement on the western side is wider than
on the eastern side. The street furniture on both sides is limited to bins only.
The paving is of a good quality along both sides of the Road. Village Road East
has much narrower pavements than Rayners Lane, with limited street furniture.
Again the paving is of a good standard. The environmental quality of Imperial
Drive was much lower than other areas in the centre and the impact of the road
is more noticeable. The centre was clean and no litter or graffiti observed
throughout the centre.
View north along Rayners Lane, from the
junction with Imperial Drive.
Landscaped area at the junction of
Rayners Lane and Imperial Drive.

P74/122 11947/756914v1
View west along Village Road East.
View south along Alexandra Avenue.
Conclusion
12.20 The centre provides top-up convenience shopping, including a Sainsbury Local
and specialist ethnic goods. The centre has a more limited comparison retail
role, with no national multiple retailers present. The centre provides services
and community facilities serving immediate local needs, consistent with its
District Centre role. The centre has good public transport accessibility, but a
limited amount of car parking. The environmental quality is reasonable to good
throughout the centre.
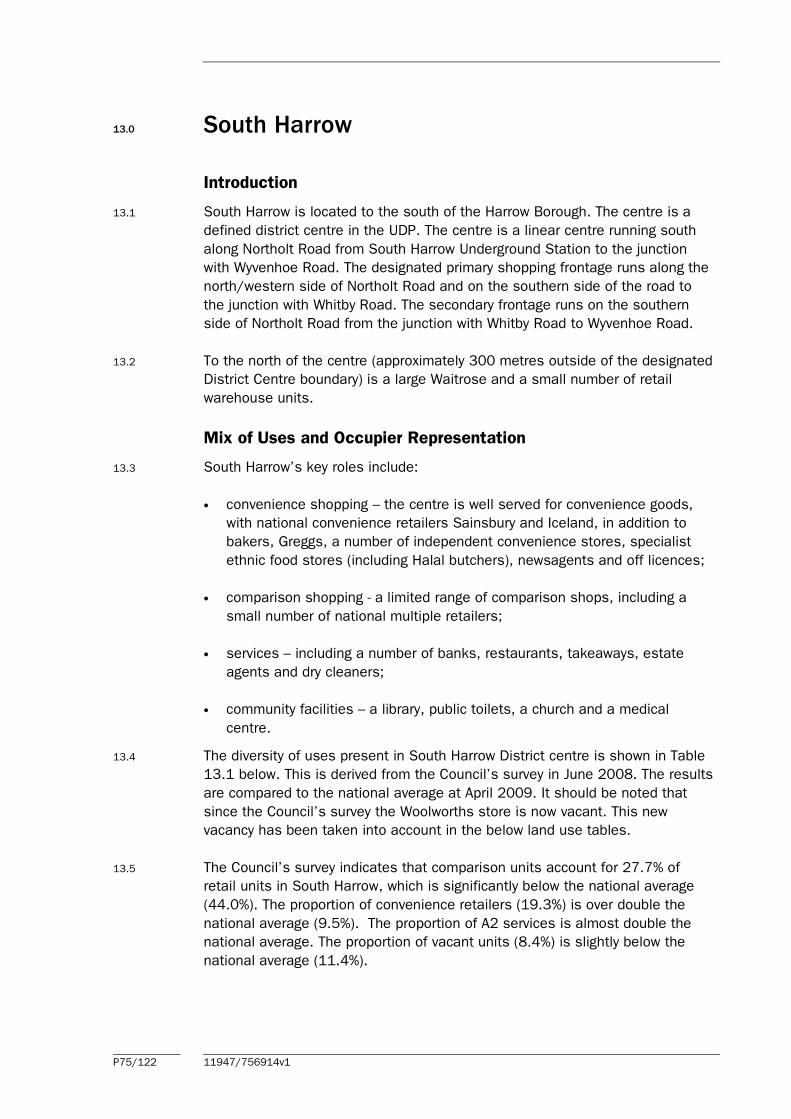
P75/122 11947/756914v1
13.0 South Harrow
Introduction
13.1 South Harrow is located to the south of the Harrow Borough. The centre is a
defined district centre in the UDP. The centre is a linear centre running south
along Northolt Road from South Harrow Underground Station to the junction
with Wyvenhoe Road. The designated primary shopping frontage runs along the
north/western side of Northolt Road and on the southern side of the road to
the junction with Whitby Road. The secondary frontage runs on the southern
side of Northolt Road from the junction with Whitby Road to Wyvenhoe Road.
13.2 To the north of the centre (approximately 300 metres outside of the designated
District Centre boundary) is a large Waitrose and a small number of retail
warehouse units.
Mix of Uses and Occupier Representation
13.3 South Harrow’s key roles include:
• convenience shopping – the centre is well served for convenience goods,
with national convenience retailers Sainsbury and Iceland, in addition to
bakers, Greggs, a number of independent convenience stores, specialist
ethnic food stores (including Halal butchers), newsagents and off licences;
• comparison shopping - a limited range of comparison shops, including a
small number of national multiple retailers;
• services – including a number of banks, restaurants, takeaways, estate
agents and dry cleaners;
• community facilities – a library, public toilets, a church and a medical
centre.
13.4 The diversity of uses present in South Harrow District centre is shown in Table
13.1 below. This is derived from the Council’s survey in June 2008. The results
are compared to the national average at April 2009. It should be noted that
since the Council’s survey the Woolworths store is now vacant. This new
vacancy has been taken into account in the below land use tables.
13.5 The Council’s survey indicates that comparison units account for 27.7% of
retail units in South Harrow, which is significantly below the national average
(44.0%). The proportion of convenience retailers (19.3%) is over double the
national average (9.5%). The proportion of A2 services is almost double the
national average. The proportion of vacant units (8.4%) is slightly below the
national average (11.4%).

P76/122 11947/756914v1
Table 13.1: South Harrow Use Class Mix by Unit
Number of Units % of Total Number of Units Type of Unit
2008 South Harrow National Average*
Comparison Retail 23 27.7 44.0
Convenience Retail 16 19.3 9.5
A1 Services 9 10.8 10.8
A2 Services 15 18.1 9.5
A3 and A5 12 14.5 14.8
A4 1 1.2 n/a
Vacant 7 8.4 11.4
Total 83 100.0 100.0 Source: LB Harrow Shopping Frontages Survey (June 2008) * UK average for all town centres surveyed by Goad Plans (Apr 09).
Retailer Representation
13.6 South Harrow has a limited selection of comparison shops (23 units) reflecting
the centre’s low order in the Harrow shopping hierarchy. Table 13.2 provides a
breakdown of comparison shop uses by goods categories.
Table 13.2: South Harrow Breakdown of Comparison Units
South Harrow
Type of Unit Units
2008
%
2008
% UK*
Average
Clothing and Footwear 2 8.7 26.6
Furniture, carpets and textiles 0 0.0 9.1
Booksellers, arts, crafts and stationers 0 0.0 9.4
Electrical, gas, music and photography 3 13.0 9.8
DIY, hardware & homewares 2 8.7 6.6
China, glass, gifts & fancy goods 4 17.4 3.8
Cars, motorcycles & motor access. 0 0.0 3.1
Chemists, drug stores & opticians 7 30.4 8.9
Variety, department & catalogue 0 0.0 1.8
Florists, nurserymen & seedsmen 0 0.0 2.5
Toys, hobby, cycle & sport 0 0.0 5.1
Jewellers 1 4.3 4.9
Other comparison retailers 4 17.4 8.4
Total 23 100.0 100.0 Source: LB Harrow Shopping Frontages Survey (June 2008) * UK average for all town centres surveyed by Goad Plans (Apr 09).
13.7 There are six comparison goods categories not represented in South Harrow,
which illustrates the limited range of comparison shopping in the centre. The
proportion of ‘chemists, drug stores & opticians’ (30.4%) is over three times
the national average (8.9%) and the proportion of ‘china, glass and fancy
goods’ units (17.4%) is above the national average (3.8%). The proportion of
‘other comparison retailers’ (17.4%) is also above the national average (8.4%),
but these include three charity shops.

P77/122 11947/756914v1
13.8 The centre has a reasonable representation of comparison national retailers,
given its lower order comparison retailing role. National comparison retailers
present in the centre comprise Boots, Superdrug, Stead and Simpson, The Car
Phone Warehouse, Hallmark and Specsaver Opticians.
Service Uses
13.9 South Harrow has a reasonable selection of service uses, with all categories,
except travel agents represented, as shown in Table 13.3. The centre has a
good representation of ‘restaurants/cafes/takeaways’. The centre has a higher
proportion of ‘banks/ other financial services’, ‘estate agents/ valuers’ and
‘laundries/ dry cleaners’ than the national average. The proportion of
‘hairdressers and beauty parlours’ is half that of the national average.
Table 13.3: South Harrow Analysis of Selected Service Uses
South Harrow
Type of Unit Units
2008
%
2008
% UK*
Average
Restaurants/cafes/takeaways 12 44.4 43.9
Banks/other financial services 5 18.5 14.3
Estate agents/valuers 5 18.5 11.7
Travel agents 0 0.0 4.2
Hairdressers/beauty parlours 3 11.1 22.8
Laundries/dry cleaners 2 7.4 3.1
Total 27 100 100.0 Source: LB Harrow Shopping Frontages Survey (June 2008) * UK average for all town centres surveyed by Goad Plans (Apr 09). N.B. ‘Restaurants, cafés and takeaways’ does not include drinking establishments in the centre.
13.10 There are four high street banks/building societies represented within South
Harrow i.e. Lloyds TSB, HSBC, Nationwide and Abbey.
Accessibility and Movement
Car Parking
13.11 There is a small amount of on-street car parking available on Northolt Road.
There are 66 car parking spaces in the Sainsbury car park (accessed off of
Corbin’s Road. Parking is free for two hours for Sainsbury customers. There are
also 75 spaces at the South Harrow London Underground car park, accessed
off of South Hill Avenue, which partly falls within the District Centre.
Public Transport
13.12 South Harrow Underground Station is located at the south of the District
Centre. Piccadilly Line services run from the station westbound to Uxbridge and
eastbound to Heathrow Terminals 1, 2 and 3 and Cockfosters, via Central
London.
13.13 There are six bus stops within the District Centre served by eight bus routes,
including one 24 hour service. These bus routes comprise a service from Mill
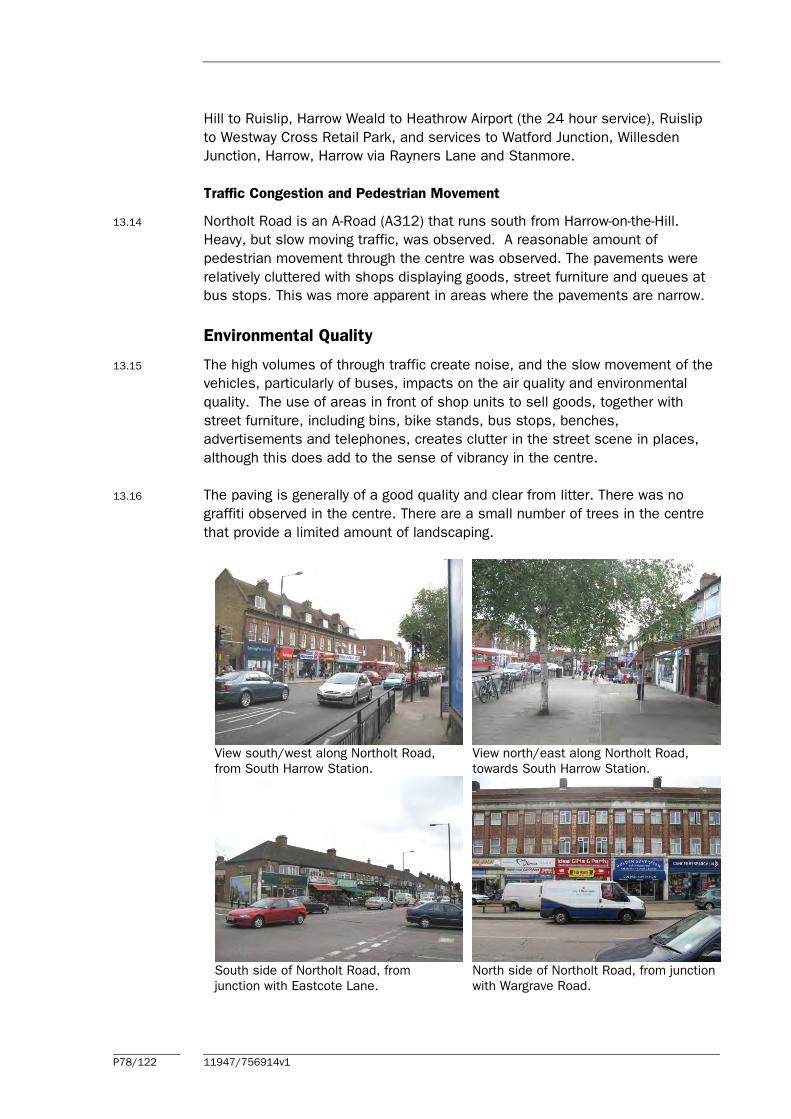
P78/122 11947/756914v1
Hill to Ruislip, Harrow Weald to Heathrow Airport (the 24 hour service), Ruislip
to Westway Cross Retail Park, and services to Watford Junction, Willesden
Junction, Harrow, Harrow via Rayners Lane and Stanmore.
Traffic Congestion and Pedestrian Movement
13.14 Northolt Road is an A-Road (A312) that runs south from Harrow-on-the-Hill.
Heavy, but slow moving traffic, was observed. A reasonable amount of
pedestrian movement through the centre was observed. The pavements were
relatively cluttered with shops displaying goods, street furniture and queues at
bus stops. This was more apparent in areas where the pavements are narrow.
Environmental Quality
13.15 The high volumes of through traffic create noise, and the slow movement of the
vehicles, particularly of buses, impacts on the air quality and environmental
quality. The use of areas in front of shop units to sell goods, together with
street furniture, including bins, bike stands, bus stops, benches,
advertisements and telephones, creates clutter in the street scene in places,
although this does add to the sense of vibrancy in the centre.
13.16 The paving is generally of a good quality and clear from litter. There was no
graffiti observed in the centre. There are a small number of trees in the centre
that provide a limited amount of landscaping.
View south/west along Northolt Road,
from South Harrow Station.
View north/east along Northolt Road,
towards South Harrow Station.
South side of Northolt Road, from
junction with Eastcote Lane.
North side of Northolt Road, from junction
with Wargrave Road.

P79/122 11947/756914v1
Conclusions
13.17 South Harrow provides an important convenience shopping role, including
national retailers Iceland and Sainsbury. It also has a range of independent
retailers, including specialist ethnic shops. The centre has a limited range of
comparison goods, although this is consistent with its lower order function. The
centre provides a good range of services including a number of banks and
restaurants/takeaways. It also serves local community needs including a
library. The centre has good public transport accessibility and a reasonable
environmental quality, although the busy roads create noise and pollution.
P80/122 11947/756914v1
14.0 Stanmore
Introduction
14.1 Stanmore centre is situated in the north east of the Borough. The defined
centre for retail purposes comprises parts of Church Road and Stanmore Hill
and all of The Broadway. The northern part of the Broadway and the Sainsbury’s
frontage on the south of the Broadway is defined as being the Primary Shopping
Frontage, whilst the secondary shopping frontage comprises retail units on
Stanmore Hill and along the southern part of Church Road up to the junction
with Elm Park.
14.2 Stanmore’s key roles include:
• convenience shopping – contains Sainsbury’s and Lidl food stores in
addition to a number of independent traders;
• comparison shopping – a range of comparison goods retailers are present in
the centre including a number of national multiples. These offer a range of
everyday essential items such as pharmaceuticals and also higher order
goods such as clothing:
• services - including banks, building societies, restaurants and cafes;
• entertainment –including several pubs; and
• community facilities – the centre includes a public library.
Mix of Uses and Occupier Representation
14.3 The diversity of uses present in the centre is shown in Table 14.1 below. This
is derived from the Council’s town centre survey in June 2008.
14.4 In overall terms the proportion units in retail and service use in Stanmore are
consistent with the national average and the centre offers a wide array of goods
and services to shoppers. Only the comparison retail sector (33.3%) is below
the national average (44.0%). Vacant units are below the national average
implying that there is a relatively high level of demand for representation in the
centre from occupiers.

P81/122 11947/756914v1
Table 14.1 Stanmore Use Class Mix by Unit
Number of Units % of Total Number of Units Type of Unit
2008 Stanmore National Average*
Comparison Retail 28 33.3 44.0
Convenience Retail 9 10.7 9.5
A1 Services 15 17.9 10.8
A2 Services 17 20.2 9.5
A3 and A5 12 14.3 14.8
A4 3 n/a n/a
Vacant 3 3.6 11.4
Total 87 100.0 100.0 Source: LB Harrow Shopping Frontages Survey (June 2008) * UK average for all town centres surveyed by Goad Plans (Apr 09)
Retailer Representation
14.5 Table 14.2 provides a breakdown of comparison shop uses by goods
categories.
Table 14.2: Stanmore Breakdown of Comparison Units
Stanmore
Type of Unit Units
2008
%
2008
% UK*
Average
Clothing and Footwear 9 32.1 26.6
Furniture, carpets and textiles 3 10.7 9.1
Booksellers, arts, crafts and stationers 0 0.0 9.4
Electrical, gas, music and photography 2 7.1 9.8
DIY, hardware & homewares 0 0.0 6.6
China, glass, gifts & fancy goods 1 3.6 3.8
Cars, motorcycles & motor access. 0 0.0 3.1
Chemists, drug stores & opticians 5 17.9 8.9
Variety, department & catalogue 0 0.0 1.8
Florists, nurserymen & seedsmen 2 7.1 2.5
Toys, hobby, cycle & sport 0 0.0 5.1
Jewellers 1 3.6 4.9
Other comparison retailers 5 17.9 8.4
Total 28 100.0 100.0 Source: LB Harrow Shopping Frontages Survey (June 2008) * UK average for all town centres surveyed by Goad Plans (Apr 09)
14.6 The centre contains no representation in four categories of comparison shops,
but the following are well represented; ‘florists, nurserymen & seedsmen’,
‘chemists, drug stores & opticians’ and ‘other comparison retailers’ all of which
are more than double the national average, and by ‘clothing and footwear’
retailers. National multiples in this sector are Boots, Carpet Right, Lloyds
Pharmacy and The Carphone Warehouse, in addition to a number of national
charity shops. Additional comparison sales are provided by the Sainsbury’s
and Lidl food stores.
P82/122 11947/756914v1
Service Uses
14.7 Stanmore contains good representation in the services sector with all sub-
sectors of services represented, as shown in Table 14.3. All sub-sectors are
above average except for ‘travel agents’ and ‘restaurants/cafes/takeaways’,
despite the latter accounting for the highest number of unit.
Table 14.3: Stanmore Analysis of Selected Service Uses
Stanmore
Type of Unit Units
2008
%
2008
% UK*
Average
Restaurants/cafes/takeaways 12 31.6 43.9
Banks/other financial services 8 21.1 14.3
Estate agents/valuers 5 13.2 11.7
Travel agents 1 2.6 4.2
Hairdressers/beauty parlours 9 23.7 22.8
Laundries/dry cleaners 3 7.9 3.1
Total 38 100.0 100.0 Source: LB Harrow Shopping Frontages Survey (June 2008) * UK average for all town centres surveyed by Goad Plans (Apr 09). N.B. ‘Restaurants, cafés and takeaways’ does not include drinking establishments in the centre.
14.8 National multiples in this sector include Caffé Nero, Ladbrokes, Pizza Express,
Subway and William Hill, plus eight high street banks/building societies e.g.
Abbey, Barclays Bank, Bradford & Bingley, Halifax, HSBC, Nationwide, NatWest
and Lloyds TSB.
Accessibility and Movement
Car Parking
14.9 On-street pay and display car parking is provided along The Broadway and is
separated from the road by a pavement. The Sainsbury’s car park also contains
dedicated shopper parking and is accessed via Elm Park. There is a large
surface level car park to the rear of the Lidl store and other retail units on the
northern part of The Broadway, adjacent to the library. Stanmore underground
station also contains a surface level car park about 400 metres to the east of
the centre.
Public Transport
14.10 Stanmore underground station is the northern terminus of the Jubilee line, and
is situated approximately 400 metres to the east of Stanmore. Three bus
routes operate through the centre, i.e. the 340 runs between Harrow and
Edgware, the 142 runs between Watford Junction and Brent Cross, and the H12
between Stanmore and South Harrow. The N98 night bus also operates in the
evenings between Stanmore and Holborn.

P83/122 11947/756914v1
Traffic Congestion and Pedestrian Movement
14.11 The centre is located on either side of key arterial routes, i.e. Stanmore Hill
forming part of the A4140 and Church Road/The Broadway (A410). The centre
has heavy traffic, and at the junctions traffic frequently backs up from the
Church Road/Stanmore Hill/The Broadway junction and The Broadway/ London
Road/Marsh Lane junction to the east of the centre.
14.12 Pedestrian crossings are provided but the busy roads still present a significant
barrier to pedestrian movement. Cycle racks are provided.
Environmental Quality
14.13 The environmental quality of Stanmore suffers from the presence of heavy
vehicular traffic throughout it. Retail units are however well maintained and
there is a mix between old and new buildings and purpose built/converted
units. Retail units vary from between two and three stories in height and appear
to be used for employment and residential purposes. No graffiti or litter was
visible in the centre on the day of our site visit.
The Broadway (looking east)
Church Road/ Stanmore Hill/ The
Broadway junction
Church Road (looking east)
Retail units on The Broadway. Church
Road

P84/122 11947/756914v1
Conclusion
14.14 Stanmore is a vital and viable centre and performs an important role in the
provision of convenience goods and services to its catchment area.
Comparison goods provision is below the national average in terms of the
proportion of units, but the centre still offers an important range of goods in
this sector including a high number of clothing retailers. The centre contains a
reasonable mix of independents and national multiples for its size, and has a
low level of vacant units, which implies a healthy level of demand for
representation in the centre. Busy vehicular routes run through the heart of the
centre and create noise/pollution and impact on pedestrian movement.
P85/122 11947/756914v1
15.0 Wealdstone
Introduction
15.1 Wealdstone is centrally located within LB Harrow, and is defined as a town
centre in the UDP. The defined Primary Shopping Frontage runs along the High
Street from the junction with Grant Road to the north to Palmerston Road to the
south. The Secondary Shopping Frontage extents to the north and south of the
Primary Shopping Frontage and includes retail units on Headstone Drive and
Canning Road.
Mix of Uses and Occupier Representation
15.2 Wealdstone’s key roles include:
• convenience shopping – there are Budgens and Iceland stores, and a Tesco
Express store has been opened in part of the former Woolworth store.
These small store mainly provides a top-up shopping role to residents;
• lower order comparison shopping – there is a range of comparison shops
which are predominantly independent traders. The centre includes an ‘In-
store’ shop unit which provides internal market pitches for independent
traders.
• services - including a range of high street banks, a small number of cafés,
restaurants, takeaways, hairdressers and estate agents;
• entertainment space –includes several pubs; and
• community facilities –including a public library.
15.3 The diversity of uses present in Wealdstone is shown in Table 15.1 below. This
is derived from the Council’s survey in June 2008.
Table 15.1: Wealdstone Use Class Mix by Unit
Number of Units % of Total Number of Units Type of Unit
2008 Wealdstone National Average*
Comparison Retail 24 24.2 44.0
Convenience Retail 17 17.2 9.5
A1 Services 14 14.1 10.8
A2 Services 19 19.2 9.5
A3 and A5 13 13.1 14.8
A4 4 4.0 n/a
Vacant 8 8.1 11.4
Total 99 100.0 100.0 Source: LB Harrow Shopping Frontages Survey (June 2008) * UK average for all town centres surveyed by Goad Plans (Apr 09).
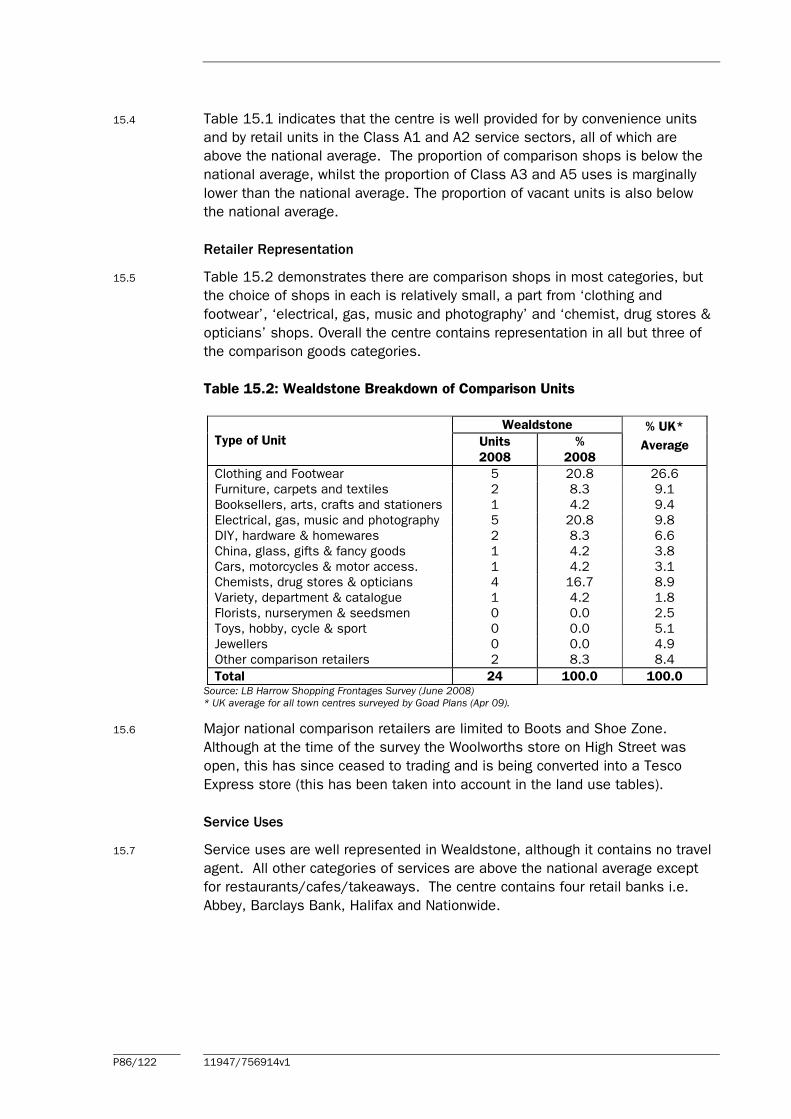
P86/122 11947/756914v1
15.4 Table 15.1 indicates that the centre is well provided for by convenience units
and by retail units in the Class A1 and A2 service sectors, all of which are
above the national average. The proportion of comparison shops is below the
national average, whilst the proportion of Class A3 and A5 uses is marginally
lower than the national average. The proportion of vacant units is also below
the national average.
Retailer Representation
15.5 Table 15.2 demonstrates there are comparison shops in most categories, but
the choice of shops in each is relatively small, a part from ‘clothing and
footwear’, ‘electrical, gas, music and photography’ and ‘chemist, drug stores &
opticians’ shops. Overall the centre contains representation in all but three of
the comparison goods categories.
Table 15.2: Wealdstone Breakdown of Comparison Units
Wealdstone
Type of Unit Units
2008
%
2008
% UK*
Average
Clothing and Footwear 5 20.8 26.6
Furniture, carpets and textiles 2 8.3 9.1
Booksellers, arts, crafts and stationers 1 4.2 9.4
Electrical, gas, music and photography 5 20.8 9.8
DIY, hardware & homewares 2 8.3 6.6
China, glass, gifts & fancy goods 1 4.2 3.8
Cars, motorcycles & motor access. 1 4.2 3.1
Chemists, drug stores & opticians 4 16.7 8.9
Variety, department & catalogue 1 4.2 1.8
Florists, nurserymen & seedsmen 0 0.0 2.5
Toys, hobby, cycle & sport 0 0.0 5.1
Jewellers 0 0.0 4.9
Other comparison retailers 2 8.3 8.4
Total 24 100.0 100.0 Source: LB Harrow Shopping Frontages Survey (June 2008) * UK average for all town centres surveyed by Goad Plans (Apr 09).
15.6 Major national comparison retailers are limited to Boots and Shoe Zone.
Although at the time of the survey the Woolworths store on High Street was
open, this has since ceased to trading and is being converted into a Tesco
Express store (this has been taken into account in the land use tables).
Service Uses
15.7 Service uses are well represented in Wealdstone, although it contains no travel
agent. All other categories of services are above the national average except
for restaurants/cafes/takeaways. The centre contains four retail banks i.e.
Abbey, Barclays Bank, Halifax and Nationwide.

P87/122 11947/756914v1
Table 15.3: Wealdstone Analysis of Selected Service Uses
Wealdstone
Type of Unit Units
2008
%
2008
% UK*
Average
Restaurants/cafes/takeaways 13 39.4 43.9
Banks/other financial services 6 18.2 14.3
Estate agents/valuers 4 12.1 11.7
Travel agents 0 0.0 4.2
Hairdressers/beauty parlours 8 24.2 22.8
Laundries/dry cleaners 2 6.1 3.1
Total 33 100.0 100.0 Source: LB Harrow Shopping Frontages Survey (June 2008) * UK average for all town centres surveyed by Goad Plans (Apr 09). N.B. ‘Restaurants, cafés and takeaways’ does not include drinking establishments in the centre.
Accessibility and Movement
Car Parking
15.8 The centre is served by a number of car parks and also contains limited on-
street car parking. The largest public car parking facility is the Peel House multi-
storey (257 parking spaces) with Palmerston Road surface level car park (27
spaces) located adjacent. There is also a 118 space surface-level car park on
Station Road adjacent to Harrow and Wealdstone Station. Parking in the centre
operates on a pay and display basis.
Public Transport
15.9 Wealdstone is easily accessible by public transport. Harrow and Wealdstone
Station is located to the south of the centre. This provides overland
connections to Central London, Milton Keynes and other local destinations and
underground connections to Central London and other destinations via the
Bakerloo line.
15.10 A total of seven bus routes serve the centre providing direct connections to
destinations including Brent Cross, Edgware, Harrow, Heathrow Airport, Watford
and Wembley.
Traffic Congestion and Pedestrian Movement
15.11 The Primary Shopping Frontage of Wealdstone along High Street is restricted to
20 mph and is subject to low levels of traffic. Pedestrian crossings with lowered
pavements are provided in this area, and movement on foot is not problematic.
The north part of the High Street forms part of the A409 and has heavy
vehicular traffic and tails backs. Pedestrian crossings linked to traffic lights are
provided, although the potential for vehicular/ pedestrian crossings exists.
Cycle paths are marked out throughout the centre.
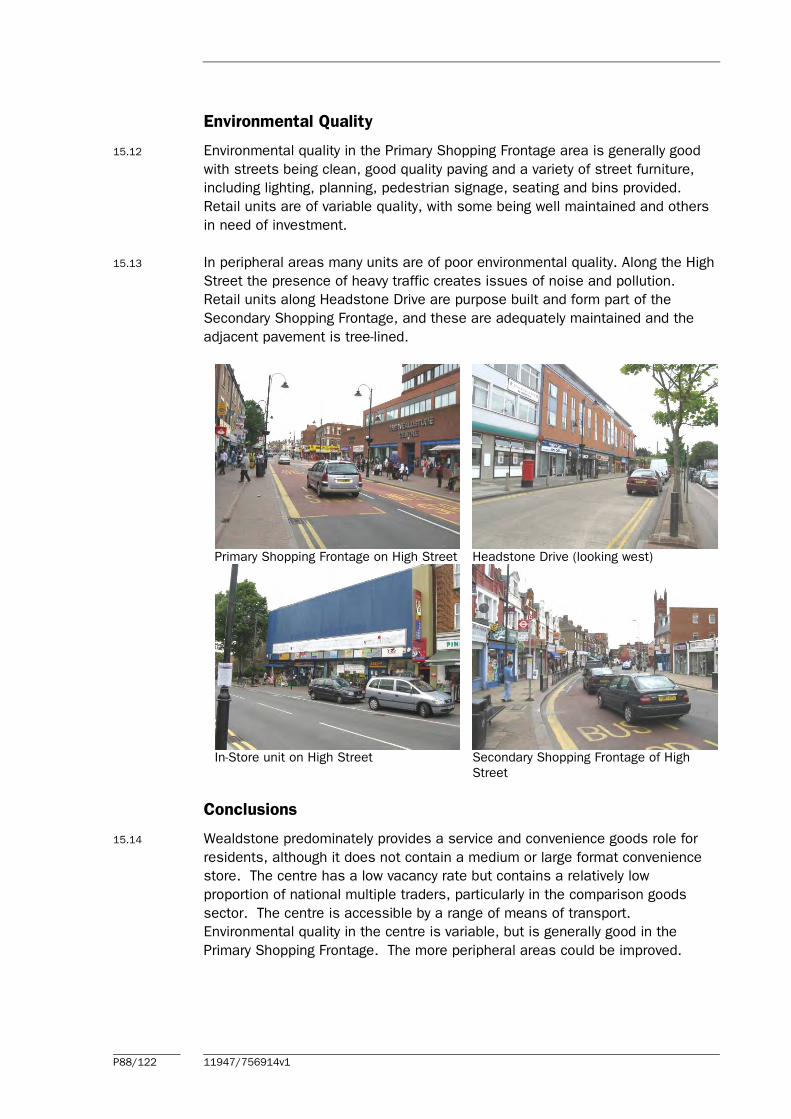
P88/122 11947/756914v1
Environmental Quality
15.12 Environmental quality in the Primary Shopping Frontage area is generally good
with streets being clean, good quality paving and a variety of street furniture,
including lighting, planning, pedestrian signage, seating and bins provided.
Retail units are of variable quality, with some being well maintained and others
in need of investment.
15.13 In peripheral areas many units are of poor environmental quality. Along the High
Street the presence of heavy traffic creates issues of noise and pollution.
Retail units along Headstone Drive are purpose built and form part of the
Secondary Shopping Frontage, and these are adequately maintained and the
adjacent pavement is tree-lined.
Primary Shopping Frontage on High Street
Headstone Drive (looking west)
In-Store unit on High Street
Secondary Shopping Frontage of High
Street
Conclusions
15.14 Wealdstone predominately provides a service and convenience goods role for
residents, although it does not contain a medium or large format convenience
store. The centre has a low vacancy rate but contains a relatively low
proportion of national multiple traders, particularly in the comparison goods
sector. The centre is accessible by a range of means of transport.
Environmental quality in the centre is variable, but is generally good in the
Primary Shopping Frontage. The more peripheral areas could be improved.

P89/122 11947/756914v1
16.0 The Need for New Retail Development
Introduction
16.1 This section assesses the quantitative and qualitative scope for new retail
floorspace in Harrow Borough over the LDF period. It sets out the methodology
adopted for this analysis and provides a quantitative capacity analysis in terms
of levels of spending for convenience and comparison shopping. A qualitative
assessment of the range and scale of existing shopping facilities has been
undertaken.
16.2 All monetary values expressed in this analysis are at 2007 prices, consistent
with Experian’s base year expenditure figures for 2007. This is the most up to
date and robust local expenditure data currently available. Expenditure data for
2008 is not currently available and 2007 is the most up to date information.
Methodology and Data
16.3 The quantitative analysis is based on a defined study area that covers the
London Borough of Harrow and parts of the neighbouring authorities (i.e.
Barnet, Brent, Hillingdon, Ealing and Three Rivers). The study area is sub-
divided into 10 zones, consistent with the zones adopted in the Donaldson’s
2006 retail.
16.4 The study area is based on postcode area boundaries. The extent of the study
area is based on the previous study area in the 2006 study and reflects the
proximity of competing shopping destinations, i.e. shopping facilities within the
Borough are expected to attract their trade from residents within the study area
and there will be a minimal level of trade drawn from beyond the study area.
16.5 The level of available expenditure to support retailers is based on first
establishing per capita levels of spending for the study area population.
Experian’s local consumer expenditure estimates for comparison and
convenience goods for each of the study area zones for the year 2007 have
been obtained.
16.6 Experian’s EBS national expenditure information has been used to forecast
expenditure within the study area in the short term (2007 to 2011). Unlike
previous expenditure growth rates provided by The Data Consultancy (formerly
URPI), which were based on past trends, Experian’s projections are based on
an econometric model of disaggregated consumer spending. This model takes
a number of macro-economic forecasts (chiefly consumer spending, incomes
and inflation) and uses them to produce forecasts of consumer spending
volumes, prices and value, broken down into separate categories of goods.
16.7 For longer term projections Experian’s ultra long term growth rate has been
adopted (0.7% for convenience goods and 4.6% for comparison) to project

P90/122 11947/756914v1
expenditure between 2011 to 2016 and beyond. We believe the Experian’s
lower EBS growth rates reflect the current economic downturn and provide an
appropriate growth rate for the short term. In the longer term it is more difficult
to forecast year on year changes in expenditure, and in our view past trend line
growth rates provide the most appropriate average growth rate and the
potential post recession recovery.
16.8 To assess the capacity for new retail floorspace, penetration rates are
estimated for shopping facilities within the study area. The assessment of
penetration rates (or market shares) is based on a range of factors but
primarily information gathered through the 2009 household survey.
16.9 The total turnover of shops within the London Borough of Harrow is estimated
based on penetration rates. These turnover estimates are then compared to
average company benchmark or average sales floorspace densities derived
from Verdict information and Mintel’s Retail Rankings 2008, which provides an
indication of how individual retail units and centres are performing against
expected turnover averages. This allows the identification of potential surplus
or deficit capacity for retail sales floorspace.
Population and Spending
16.10 The study area population for 2009 to 2025 is set out in Tables 1B in Appendix
B. Experian provides population estimates for each of the survey zones at 2001
based on Census data. These have been projected forward to 2025 based on
the Greater London Authorities low population projections. The GLA
recommends the use of the low projections for planning purposes at a Borough
level. For other parts of the study area outside London, ONS population
projections have been adopted.
16.11 On this basis, the population within the study area is expected to increase
between 2009 and 2025 by 6.3%.
16.12 Table 2B in the Appendix B sets out the forecast growth in spending per head
for convenience goods within each zone in the study area up to 2025.
Comparison forecasts of per capita spending are shown in Table 1C in
Appendix C. These figures take into account Experian’s latest projects which
take into account the expected effects of the recession.
16.13 The levels of available spending are derived by combining the population in
Table 1B per capita spending figures in Tables 2B and 1C. For both comparison
and convenience spending, a reduction has been made for special forms of
trading.
16.14 Special Forms of Trading (SFT) and non-store activity are included within
Experian’s Goods Based Expenditure (GBE) estimates. “Special forms of
trading” includes other forms of retail expenditure not spent in shops e.g. mail
order sales, some internet sales, vending machines, party plan selling, market
P91/122 11947/756914v1
stalls and door to door selling. SFT needs to be excluded from retail
assessments because it relates to expenditure not spent in shops and does
not have a direct relationship to the demand for retail floorspace. The growth in
home computing, Internet connections and interactive TV may lead to a growth
in home shopping and may have effects on retailing in the high street. Experian
provides projections for special forms of trading and E-tailing (Retail Planner
Briefing Note 6.1 – January 2009).
16.15 This Experian information suggests that non-store retail sales in 2008 is:
• 5.9% of convenience goods expenditure; and
• 11.3% of comparison goods expenditure.
16.16 Experian predicts that these figures will increase to 8.1% and 13.9% by 2016.
Again these are Experian’s latest projections, which take into account the
effects of the recession. For convenience expenditure 5.8% of the 5.9% is
estimated to be E-tailing, and the rest 0.1% is other forms of SFT e.g. mail
order. E-tailing in 2004 was broken down into E-tailing through retail
businesses (e.g. Tesco and Sainsbury) at 1.1% and non-retail businesses
(0.5%). The E-tailing split for retail and non-retail businesses was approximately
70:30 in 2004.
16.17 For comparison expenditure in 2008, 9.1% of the 11.3% is estimated to be E-
tailing, and the rest 2.2% is other forms of SFT e.g. mail order. E-tailing
through retail businesses (e.g. Next and Argos) was 1.3% and for non-retail
businesses 1.8% (e.g. Amazon) in 2004. The E-tailing split for retail and non-
retail businesses was approximately 40:60 in 2004.
16.18 Experian provide projections for E-tailing and other SFT. These projections have
been used to exclude expenditure attributed to e-tailing through non-retail
businesses, which will not directly impact on the demand for retail floorspace.
Based on Experian data SFT (including non-retail e-tailing but excluding e-tail
through retail businesses) is 1.8% and 7.7% of total convenience and
comparison goods expenditure respectively in 2008. The projections provided
by Experian suggest that these percentages could increase to 2.8% and 8.9%
by 2016. The amount of e-tail expenditure through non-retail businesses is
expected to increase significantly in proportional terms, but as a proportion of
total expenditure this sector is expected to remain relatively insignificant for the
foreseeable future.
16.19 Home/electronic shopping has also emerged with the increasing growth in the
use of personal computers and the Internet. Trends within this sector may well
have implications for retailing. Therefore, it will be necessary to carefully
monitor the growth within this sector particularly in the long term and the effect
that it may have on diverting expenditure that might otherwise be spent in
shops.

P92/122 11947/756914v1
16.20 In broad terms, home/electronic shopping from non-retail businesses is
classified by Experian as “special forms of trading”, as mentioned previously,
this includes other forms of retail expenditure not spent in shops e.g. mail
order. Special forms of trading have been excluded from the quantitative
capacity analysis within this study because this expenditure does not affect the
need for retail floorspace. The growth in home computing, Internet connections
and interactive TV may lead to a growth in home shopping and may have effects
on retailing in the high street. The impact of e-tailing is likely to be more
significant on certain sectors e.g. electronic goods, books, CDs, travel and
estate agents. However, home shopping (via mail order) has always been
significant in most of these sectors, and therefore not all of the growth in e-
tailing will be diverted from the high street.
16.21 This study makes an allowance for future growth in e-tailing based on Experian
projections. It will be necessary to monitor the amount of sales attributed to
home shopping in the future in order to review future policies and development
allocations.
16.22 On-line shopping has experienced rapid growth since the late 1990s but in
proportional terms the latest available data suggests it remains an insignificant
percentage of total retail expenditure. Recent trends suggest continued strong
growth in this sector. However, there is still uncertainty about its longer-term
prospects. Experian’s figures suggest that the growth in e-tailing has to a
certain extent been at the expense of other forms of home shopping such as
catalogue and mail order shopping.
16.23 The implications on the demand for retail space are unclear. For example,
some retailers operate on-line sales from their traditional retail premises e.g.
food store operators. Therefore, growth in on-line sales may not always mean
there is a reduction in the need for retail floorspace. Given the uncertainties
relating to internet shopping and the likelihood that it will increase in
proportional terms, this assessment has adopted relatively cautious growth
projections for retail expenditure.
16.24 As a consequence of growth in population and per capita spending,
convenience goods spending within the study area is forecast to increase by
16.4% from £674.31 million in 2009 to £784.92 million in 2025, as shown in
Table 3B.
16.25 Comparison goods spending is forecast to nearly double between 2009 and
2025, increasing from £1,052.32 million in 2009 to £2,086.25 million, as
shown in Table 2C. These figures relate to real growth and exclude inflation.
Existing Retail Floorspace 2009
16.26 Existing convenience goods retail sales floorspace within the Borough is
41,828 sq m net as set out in Table 1A, Appendix A. This floorspace figures
excludes comparison sales floorspace within food stores (4,579 sq m net).

P93/122 11947/756914v1
16.27 Comparison goods retail floorspace within the Borough is estimated as 93,524
sq m net as shown in Tables 2A, Appendix A.
Existing Spending Patterns 2009
Convenience Shopping
16.28 The results of the household shopper questionnaire survey undertaken by
NEMS in May 2009 have been used to estimate existing shopping patterns
within the study area. The estimates of market share or penetration within
each study area zone are shown in Table 4B, Appendix B.
16.29 Table 4B indicates that a significant proportion of residents within Zones 4 to 6
(the Hatch End, Rayners Lane and Harrow zones) carry out their convenience
retail shopping within London Borough of Harrow (ranging from 71% to 81%).
Expenditure retention is also relatively high in the Stanmore zone (75% in zone
10).
16.30 LB of Harrow’s market share of expenditure is much lower in the zones to the
west of the Borough (Zones 1 to 3 – Northwood, Ruislip and Eastcote) and the
south east part of the study area (Zones 7 to 9 – Wembley, Kenton and
Edgware).
16.31 The level of convenience goods expenditure attracted to shops/stores in the
Borough in 2009 is estimated to be £329.01 million as shown in Table 5B,
Appendix B. London Borough of Harrow’s market share of total convenience
expenditure in the study area as a whole is estimated to be about 48%
(£322.43 million of £674.31 million). However, if the study area zones that
are wholly or predominantly located outside the Borough are excluded then
expenditure retention within the Borough is over 66%.
16.32 Company average turnover to sales floorspace densities are available for major
food store operators and are compiled by Verdict. Company average sales
densities (adjusted to exclude petrol and comparison sales and include VAT)
have been applied to the sales area of the large food stores listed in Table 1A,
Appendix A, and a benchmark turnover for each store has been calculated.
This benchmark turnover is not necessarily the actual turnover of the food
store, but it does provide a useful benchmark for assessing existing shopping
patterns and the adequacy of current floorspace in quantitative terms.
16.33 The estimated convenience goods sales areas have been derived from a
combination of Experian Goad data, the Council’s own floorspace surveys,
Institute of Grocery Distribution (IGD) and NLP estimates based on site visits.
Estimates for comparison sales floorspace within large food stores has been
deducted from the figures in Table 1A in Appendix A, for consistency with the
use of goods based expenditure figures.

P94/122 11947/756914v1
16.34 Average sales densities are not widely available for small convenience shops,
particularly independent retailers. An average sales density of £4,000 per sq
m has been adopted for small convenience shops. The total benchmark
turnover of existing convenience sales floorspace within the Borough is
£280.65 million at 2009.
16.35 The assessment of shopping patterns, based on the household survey results,
suggests that convenience goods expenditure attracted by facilities in the
Borough in 2009 is £329.01 million. These figures suggest that collectively
convenience retail facilities in the Borough are trading healthily at 17% above
expected levels. Large food stores (over 1,000 sq m net) within the Borough
appear to be trading particularly well. The identified available expenditure is
+£48.36 million) above benchmark levels.
Comparison Shopping
16.36 The estimated comparison goods expenditure currently attracted by shopping
facilities within the Borough is £405.14 million in 2009, as shown in Table 3C,
Appendix C.
16.37 London Borough of Harrow’s market share of total comparison goods
expenditure generated within the study area is about 37%. However, if the
study area zones that are wholly or predominantly located outside the Borough
are excluded then expenditure retention within the Borough is over 45%. The
market share within the core of the Borough (Zones 4, 5, 6 and 8) is 48%, with
52% attracted to destinations outside of the Borough. Leakage form the
Borough is around 55%, which is not unusual for outer London Borough, due to
the high level of competition. However, these figures suggest there may be
scope for Harrow to increase its market share, and as a minimum the future
strategy should seek to ensure the proportional level of leakage does not
increase.
16.38 The average sales density for existing comparison sales floorspace (93,524 sq
m net) is £4,332 per sq m net. Mintel’s Retail Rankings 2008 provides
company average sales density information for a selection of national retailers.
This data suggests a notional average sales density for national comparison
retailers (£5,220 per sq m). Based on our recent experience across the
country and Greater London, average sales densities for comparison floorspace
can range from £2,000 to £7,000 per sq m net. The higher end of this range
is usually only achieved by very successful shopping centres, which reflects the
higher proportion of quality multiple retailers. The analysis of existing
comparison shopping patterns in 2009 suggests the following average sales
density figures for Harrow town centre and the rest of the Borough.
16.39 Table 16.1 indicates that trading levels in Harrow town centre and the rest of
the Borough vary significantly. However, the average sales density figures
should be viewed in the context of the type of floorspace in Harrow town centre
and elsewhere in the Borough. Comparison facilities in Harrow town centre are

P95/122 11947/756914v1
trading towards the higher end of the range of sales densities, whilst other
comparison floorspace in the Borough is trading towards the lower end of the
range. The rest of LB Harrow figure includes retail warehouses, which generally
trade at a lower density than high street shops, and local/independent shops
which may trade at a lower density than high street multiples. On balance
comparison shopping facilities within London Borough of Harrow appear to be
trading satisfactorily.
Table 16.1: Defined Centres Average Sales Densities
Centre Average Sales Density 2009
£ per sq m net
Harrow Town Centre £5,689
Other in LB of Harrow £2,906
London Borough of Harrow Average £4,332
Quantitative Capacity for Additional Convenience Floorspace
16.40 The level of available convenience goods expenditure in 2015, 2020 and 2025
is shown at Tables 6B to 8B, in Appendix B. These tables assume existing
2009 market shares will be maintained in the future. The total level of
convenience goods expenditure available for shops in London Borough of
Harrow between 2009 and 2025 is summarised in Table 9B. This table takes
into account the population and expenditure projections shown in Table 1B to
3B in Appendix B. The benchmark turnover of existing convenience floorspace
has been subtracted from the estimates of available expenditure to provide
surplus expenditure estimates, as shown in Table 9B, Appendix B.
16.41 Convenience expenditure available to shopping facilities in London Borough of
Harrow is expected to increase from £329.01 million in 2009 to £380.07
million in 2025.
16.42 The following commitments/changes in London Borough of Harrow have been
taken into account :
• the proposed Sainsbury store on Pinner Road (3,458 sq m net); and the
• occupation of vacant former Woolworth stores by Tesco Express and Iceland
and a new Tesco Express on Pinner Road.
16.43 The benchmark turnover of these commitments is set out in Table 3A at
Appendix A.
16.44 Table 9B assumes that the benchmark turnover of convenience floorspace will
not increase between 2009 to 2011 due to the recession and limited projected
expenditure growth. In the longer term existing floorspace is expected to
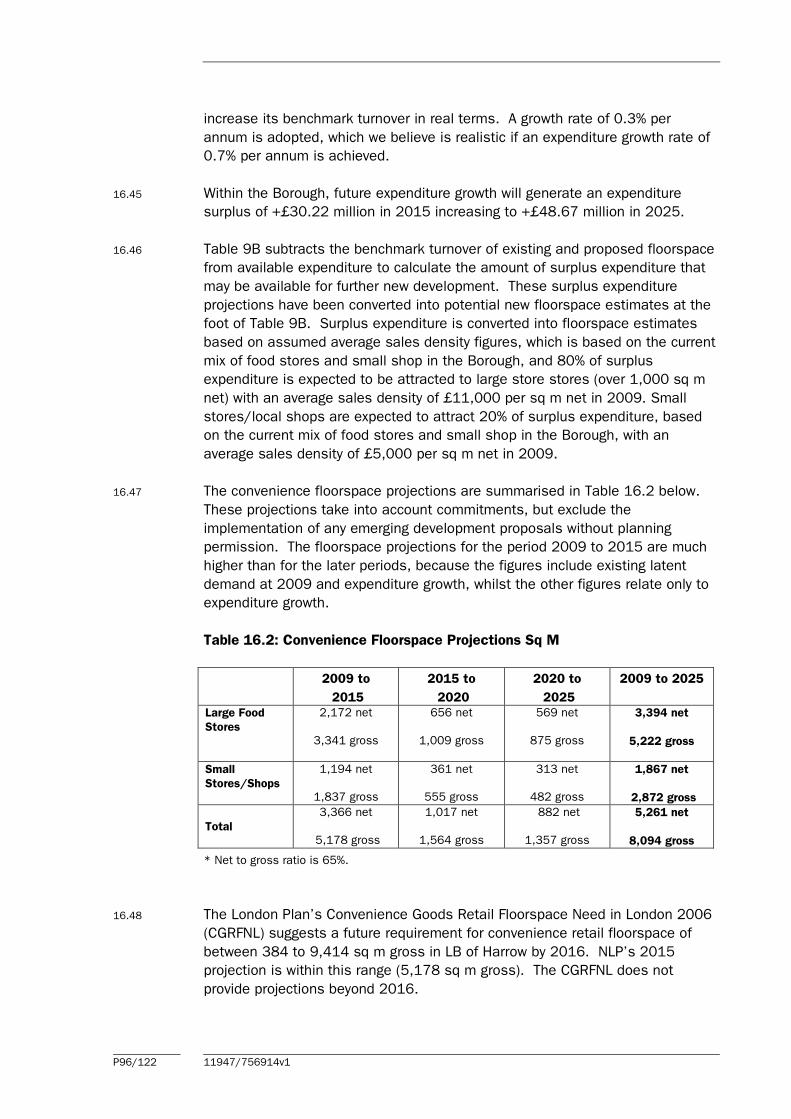
P96/122 11947/756914v1
increase its benchmark turnover in real terms. A growth rate of 0.3% per
annum is adopted, which we believe is realistic if an expenditure growth rate of
0.7% per annum is achieved.
16.45 Within the Borough, future expenditure growth will generate an expenditure
surplus of +£30.22 million in 2015 increasing to +£48.67 million in 2025.
16.46 Table 9B subtracts the benchmark turnover of existing and proposed floorspace
from available expenditure to calculate the amount of surplus expenditure that
may be available for further new development. These surplus expenditure
projections have been converted into potential new floorspace estimates at the
foot of Table 9B. Surplus expenditure is converted into floorspace estimates
based on assumed average sales density figures, which is based on the current
mix of food stores and small shop in the Borough, and 80% of surplus
expenditure is expected to be attracted to large store stores (over 1,000 sq m
net) with an average sales density of £11,000 per sq m net in 2009. Small
stores/local shops are expected to attract 20% of surplus expenditure, based
on the current mix of food stores and small shop in the Borough, with an
average sales density of £5,000 per sq m net in 2009.
16.47 The convenience floorspace projections are summarised in Table 16.2 below.
These projections take into account commitments, but exclude the
implementation of any emerging development proposals without planning
permission. The floorspace projections for the period 2009 to 2015 are much
higher than for the later periods, because the figures include existing latent
demand at 2009 and expenditure growth, whilst the other figures relate only to
expenditure growth.
Table 16.2: Convenience Floorspace Projections Sq M
2009 to
2015
2015 to
2020
2020 to
2025
2009 to 2025
Large Food
Stores
2,172 net
3,341 gross
656 net
1,009 gross
569 net
875 gross
3,394 net
5,222 gross
Small
Stores/Shops
1,194 net
1,837 gross
361 net
555 gross
313 net
482 gross
1,867 net
2,872 gross
Total
3,366 net
5,178 gross
1,017 net
1,564 gross
882 net
1,357 gross
5,261 net
8,094 gross
* Net to gross ratio is 65%.
16.48 The London Plan’s Convenience Goods Retail Floorspace Need in London 2006
(CGRFNL) suggests a future requirement for convenience retail floorspace of
between 384 to 9,414 sq m gross in LB of Harrow by 2016. NLP’s 2015
projection is within this range (5,178 sq m gross). The CGRFNL does not
provide projections beyond 2016.

P97/122 11947/756914v1
Changes since the Donaldson’s 2005 Retail Study
16.49 The convenience retail floorspace projections within the Donaldson’s 2005
study were as follows (NB. projections only up to 2016 were provided):
• Harrow Town Centre by 2016 = 5,255 sq m net;
• Non-town centre food stores by 2016 = 13,347 sq m net.
16.50 NLP’s projection for the Borough as a whole up to 2015, appear to be much
lower than Donaldson’s projections. The Donaldson’s study suggested surplus
capacity in 2016 would be £232 million (at 2001 prices). NLP’s surplus figure
for 2015 is £30.19 million, or £32.13 million extrapolated to 2016. The
difference not taking into account price bases is about £200 million.
16.51 The main reason for this difference relates to expenditure per capita growth
projections and reductions for special forms of trading. NLP’s projection
(£1,738 million 2007 prices) is 18.4% lower than Donaldson’s expenditure per
capita projection for 2016 (£2,131 at 2001 prices). Donaldson’s projections
were based on 2001 expenditure figures, but NLP’s figures are based on more
up to date figures for 2007, which are therefore more robust. For example
Donaldsons adopt a high growth rate (0.8% per annum) to forecast up to 2016.
Experian’s latest growth rates reflect the recession and predict lower growth in
the period up to 2011, with a 0.4% drop in expenditure between 2007 and
2011. Donaldson’s population projection for 2016 is also 1.2% higher than
NLP’s adopted figure.
16.52 If Donaldson’s expenditure projection for 2016 is reduced by 18.4% then the
expenditure surplus (£232 million) would reduce by about £97 million.
16.53 We also note that Donaldson’s adopted an average expenditure figure for the
study area as a whole. NLP adopts separate figures for each zone, and in this
respect is more accurate.
16.54 Donaldson’s figures did not take into account current commitments, e.g.
Sainsbury Pinner Road. Current commitments would further reduce
Donaldson’s expenditure surplus by about £37 million.
16.55 The remaining difference (i.e. about £98 million) is due to changes in market
shares since, as suggested by the household shopper survey results.
Donaldson’s retail model suggests convenience facilities in LB of Harrow had
higher market shares in the peripheral parts of the study area (i.e. areas
outside the Borough) than NLP’s study. NLP’s market shares are based on a
more up to date (2009) household survey.
Quantitative Capacity for Additional Comparison Floorspace
16.56 The household survey suggests that London Borough of Harrow’s retention of
comparison expenditure is lower than for convenience goods, i.e. ranging from
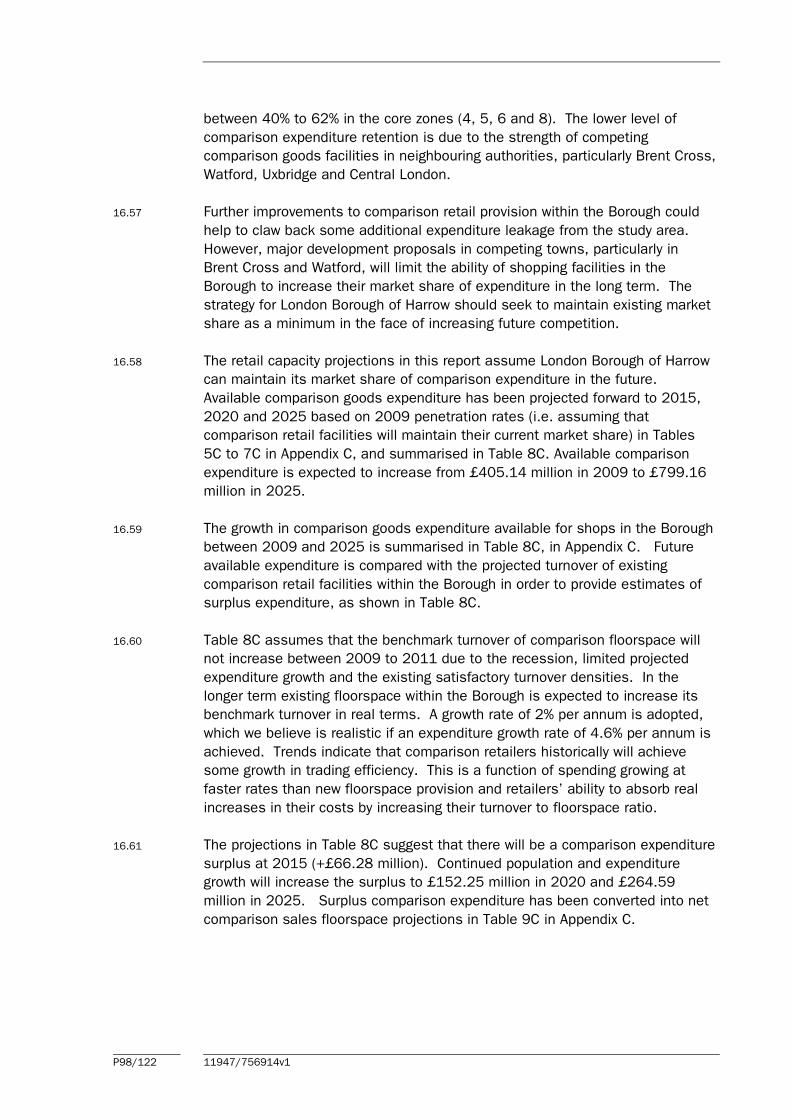
P98/122 11947/756914v1
between 40% to 62% in the core zones (4, 5, 6 and 8). The lower level of
comparison expenditure retention is due to the strength of competing
comparison goods facilities in neighbouring authorities, particularly Brent Cross,
Watford, Uxbridge and Central London.
16.57 Further improvements to comparison retail provision within the Borough could
help to claw back some additional expenditure leakage from the study area.
However, major development proposals in competing towns, particularly in
Brent Cross and Watford, will limit the ability of shopping facilities in the
Borough to increase their market share of expenditure in the long term. The
strategy for London Borough of Harrow should seek to maintain existing market
share as a minimum in the face of increasing future competition.
16.58 The retail capacity projections in this report assume London Borough of Harrow
can maintain its market share of comparison expenditure in the future.
Available comparison goods expenditure has been projected forward to 2015,
2020 and 2025 based on 2009 penetration rates (i.e. assuming that
comparison retail facilities will maintain their current market share) in Tables
5C to 7C in Appendix C, and summarised in Table 8C. Available comparison
expenditure is expected to increase from £405.14 million in 2009 to £799.16
million in 2025.
16.59 The growth in comparison goods expenditure available for shops in the Borough
between 2009 and 2025 is summarised in Table 8C, in Appendix C. Future
available expenditure is compared with the projected turnover of existing
comparison retail facilities within the Borough in order to provide estimates of
surplus expenditure, as shown in Table 8C.
16.60 Table 8C assumes that the benchmark turnover of comparison floorspace will
not increase between 2009 to 2011 due to the recession, limited projected
expenditure growth and the existing satisfactory turnover densities. In the
longer term existing floorspace within the Borough is expected to increase its
benchmark turnover in real terms. A growth rate of 2% per annum is adopted,
which we believe is realistic if an expenditure growth rate of 4.6% per annum is
achieved. Trends indicate that comparison retailers historically will achieve
some growth in trading efficiency. This is a function of spending growing at
faster rates than new floorspace provision and retailers’ ability to absorb real
increases in their costs by increasing their turnover to floorspace ratio.
16.61 The projections in Table 8C suggest that there will be a comparison expenditure
surplus at 2015 (+£66.28 million). Continued population and expenditure
growth will increase the surplus to £152.25 million in 2020 and £264.59
million in 2025. Surplus comparison expenditure has been converted into net
comparison sales floorspace projections in Table 9C in Appendix C.
P99/122 11947/756914v1
Table 16.3: Comparison Floorspace Projections (Sq M)
2009 to 2015 2015 to 2020 2020 to 2025 2009 to 2025
Harrow
Town Centre
6,879 net
9,171 gross
7,383 net
9,844 gross
8,176 net
10,901 gross
22,438 net
29,918 gross
Other LB
Harrow
4,991 net
6,654 gross
5,465 net
7,287 gross
6,018 net
8,024 gross
16,474 net
21,965 gross
LB Harrow
Total
11,869 net
15,826 gross
12,848 net
17,131 gross
14,194 net
18,925 gross
38,912 net
51,883 gross
16.62 The London Plan’s Consumer Expenditure and Comparison Goods Retail
Floorspace Need in London (CDCGRFL) suggests a future requirement for
comparison retail floorspace of between 1,900 to 16,470 sq m gross in LB of
Harrow by 2016. The CDCGRFL projection for 2021 is between 8,771 to
32,798 sq m gross, compared with NLP’s 2020 projection of 32,957 sq m
gross. CDCGRFL projection for 2026 is between 16,105 to 51,341 sq m
gross, compared with NLP’s 2025 projection of 51,883 sq m gross.
16.63 NLP’s projections are broadly consistent with the top end of the range
suggested within the CDCGRFL. We believe the top end of the range
suggested by the CDCGRFL is appropriate for planning purposes, because in
our view the lower projections are based on an unrealistically high productivity
growth rate for existing floorspace (2.2% and 2.8% per annum).
Changes since the Donaldson’s 2005 Retail Study
16.64 The comparison retail floorspace projection within the Donaldson’s 2005 study
for Harrow town centre by 2016 was 29,084 sq m net. NLP’s projection for the
Borough as a whole up to 2015 is only 11,869 sq m net, and the updated
projections appear to be much lower than Donaldson’s 2016 projection.
16.65 The Donaldson’s study suggested surplus capacity in 2016 would be £174.5
million (at 2001 prices). NLP’s surplus figure for Harrow town centre at 2015
is £44.67 million, or £56.19 million extrapolated to 2016. The difference is
£118 million.
16.66 Again, the main reason for this difference relates to expenditure per capita
growth projections and reductions for special forms of trading. NLP’s
expenditure per capita projection for 2016 (£3,307) is 44.7% lower than
Donaldson’s projection (£5,983). Donaldsons adopted a high growth rate
(3.8% per annum) to forecast expenditure between 2004 to 2016. Experian’s
latest growth rates reflect the recession and predict lower growth.

P100/122 11947/756914v1
The Qualitative Need for Retail Development
Food and Grocery Shopping
16.67 Most households tend to undertake two kinds of food and grocery shopping
trips, i.e. a main shopping trip generally made once a week or less often and
top-up shopping trips made more frequently. Many households will also
undertake bulk food shopping trips, particularly households who live in rural
areas who have access to a car for shopping. The availability of a wide range
of products and free surface level car parking are important requirements for
bulk food shopping trips. Large supermarkets or superstores (usually at least
2,000 sq m net or more), are the usual destination for these types of shopping
trip. The provision of food stores in the Borough are shown in Table 1A in
Appendix A.
16.68 There are six large food stores (over 2,000 sq m net) in the Borough i.e. two
Sainsbury’s stores in Pinner and Stanmore; two Tesco stores in Harrow town
centre and on Ash Hill Drive, a Waitrose store in South Harrow and a Morrison’s
store in Hatch End. There is planning permission for a further Sainsbury store
on Pinner Road. There are also superstores outside the Borough but close to
the Borough boundary, as follows:
• Morrison’s, Honeypot Lane, Queensway;
• Sainsbury, Broadwalk Centre, Edgware;
• Sainsbury, Long Drive, Ruislip;
• Asda, Edgware Road, Colindale.
16.69 Residents in the Borough will have the choice of 11 large food stores following
the implementation of the Sainsbury commitment on Pinner Road. In addition to
these superstores, there are also two other large food stores (with a sales area
of over 1,000 sq m net) within the Borough, which are suitable for main and
bulk food shopping, i.e. Sainsbury in South Harrow and Waitrose in Harrow
Weald. The discount food sector is also represented with two Lidl stores in
Stanmore and Edgware and Aldi in Pinner.
16.70 These food stores are the dominant shopping destinations used by residents in
the Borough for main/bulk food shopping. There is a good distribution of large
food store throughout the Borough and nearby in neighbouring Boroughs, and
there is no obvious area of deficiency.
16.71 These large food stores are supported by a relatively good range of smaller
supermarkets and convenience stores, as shown in Tables 1A and a large
number of small convenience shops. There are a number of small stores (200
sq m net to 1,000 sq m net) that provide basket and top-up shopping facilities
including a Marks & Spencer Simply Food store and a food hall and two Iceland
stores.
16.72 The capacity projections in this section suggest there is scope for additional
convenience retail floorspace within London Borough of Harrow, over and above

P101/122 11947/756914v1
commitments. The potential level of surplus expenditure available within the
Borough at 2015 is estimated to be £33.73 million, which could support 3,757
sq m net of new sales floorspace.
High Street Comparison Shopping
16.73 A detailed audit and qualitative analysis of shopping provision within the main
centres in the Borough is set out in Sections 6.0 to 15.0. LB of Harrow has
one Metropolitan Centre (Harrow town centre) as defined by the London Plan. It
also has seven District centres (Pinner, Wealdstone, Rayners Lane, South
Harrow, Stanmore, North Harrow and Kenton (part in LB Harrow). Edgware is a
Major Centre predominantly within LB of Barnet, but partly in LB of Harrow. The
main centres in the Borough are compared in Table 16.4 below.
16.74 Table 16.4 illustrates that Harrow Metropolitan Centre is the main centre in
terms of comparison shopping offer, followed by Pinner and Wealdstone. All
the main centres provide a good range of comparison shopping destinations
across the Borough. The east of the Borough is also served by Edgware and
Brent Cross. Residents in the north of the Borough have good access to
comparison shopping facilities in Watford.
Table 16.4: Main Centres in Harrow
Centre Number of Comparison
Shops
Comparison
Sales Floorspace Sq M Net
Harrow Town Centre 125 44,773
Pinner 57 4,150
Wealdstone 24 3,751
Rayners Lane 37 2,641
South Harrow 23 2,132
Stanmore 28 3,124
North Harrow 26 2,237
Kenton 25 1,328
Burnt Oak 18 2,053
16.75 Overall, residents in the Borough have a large choice of shopping destinations
both within and outside the Borough. The household survey indicates that
households in the eastern part of the Borough (Zones 9 – Edgware and 10 –
Stanmore) mainly undertake their non-food shopping outside the Borough e.g.
in Edgware or Brent Cross. Watford attracts a significant number of customers
from across the Borough, but particularly in the Hatch End area. Uxbridge and
other destinations in LB of Hillingdon attract a reasonable proportion of
customers from the south west of the Borough (Rayners Lane area).
P102/122 11947/756914v1
Large Format Stores/Retail Warehouses
16.76 There are no major retail warehouse parks within the Borough, but there are a
number of retail parks close to the Borough boundary, as follows:
• Century Park, Watford;
• Colne Valley Retail Park, Watford;
• Pentavia Retail Park, M1 Junction 2, LB Barnet;
• Victoria Retail Park, South Ruislip;
• Wembley Retail Park, Wembley;
• Broadway Retail Park, Cricklewood.
16.77 Bulky comparison goods destinations within the Borough include:
• B & Q, Honeypot Lane, Stanmore
• Carpet Right, Harrow, (Station Road)
• Carpet Right, Stanmore, (The Broadway)
• Currys, St Ann’s Centre, Harrow
• Dunelm Mill, Northolt Road, Harrow
• Harrow Electronics, Station Road, Harrow
• Homebase, High Road, Harrow
• Robert Dyas Station Road, Harrow.
16.78 Retail warehouses in North West London are generally concentrated in
neighbouring Boroughs. The existing provision of retail warehouse stores within
North West London is relatively good. The provision may not be evenly
distributed, but residents in LB of Harrow still have good access to retail
warehouses in neighbouring boroughs.
Occupier Demand
16.79 The floorspace capacity projections in this section indicate the theoretical
scope for new development based on expenditure growth. It is also necessary
to consider the potential level of demand from operators for new floorspace
within London Borough of Harrow. Estates Gazette Interactive (EGi) provides
details of the number and type of national multiple retailers seeking
representation in different centres across the UK.
16.80 In terms of Harrow town centre at June 2009, EGi records only 19 operators
seeking floorspace. It should be noted that this only relates to operators with a
specific interest in Harrow and excludes operators with general national
requirements for floorspace, and consequently the true level of demand for
representation in the centre could be slightly higher. Nevertheless, current
operator demand in Harrow town centre is relatively poor for a centre of its size
and this perhaps reflects the current economic downturn, with many operators
postponing their expansion plans. By way of comparison EGi’s recorded
requirements for Brent Cross (23), Watford (18) and Uxbridge (13) were also
relatively low.
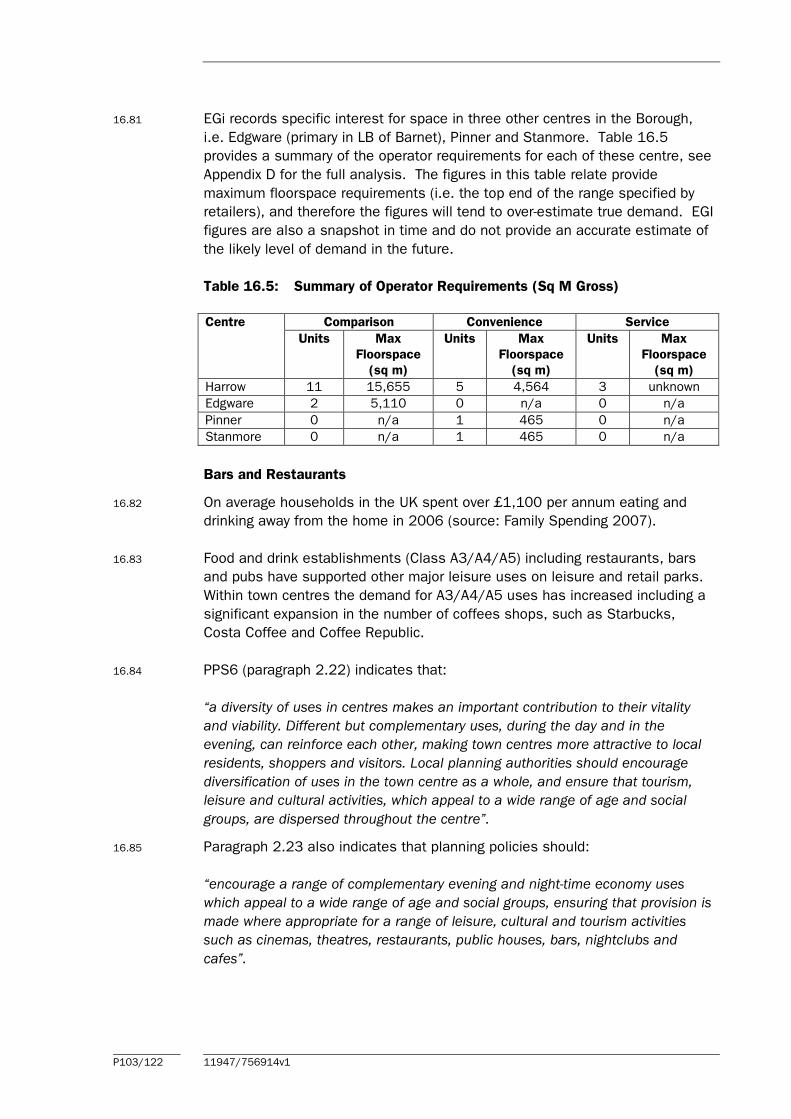
P103/122 11947/756914v1
16.81 EGi records specific interest for space in three other centres in the Borough,
i.e. Edgware (primary in LB of Barnet), Pinner and Stanmore. Table 16.5
provides a summary of the operator requirements for each of these centre, see
Appendix D for the full analysis. The figures in this table relate provide
maximum floorspace requirements (i.e. the top end of the range specified by
retailers), and therefore the figures will tend to over-estimate true demand. EGI
figures are also a snapshot in time and do not provide an accurate estimate of
the likely level of demand in the future.
Table 16.5: Summary of Operator Requirements (Sq M Gross)
Comparison Convenience Service Centre
Units Max
Floorspace
(sq m)
Units Max
Floorspace
(sq m)
Units Max
Floorspace
(sq m)
Harrow 11 15,655 5 4,564 3 unknown
Edgware 2 5,110 0 n/a 0 n/a
Pinner 0 n/a 1 465 0 n/a
Stanmore 0 n/a 1 465 0 n/a
Bars and Restaurants
16.82 On average households in the UK spent over £1,100 per annum eating and
drinking away from the home in 2006 (source: Family Spending 2007).
16.83 Food and drink establishments (Class A3/A4/A5) including restaurants, bars
and pubs have supported other major leisure uses on leisure and retail parks.
Within town centres the demand for A3/A4/A5 uses has increased including a
significant expansion in the number of coffees shops, such as Starbucks,
Costa Coffee and Coffee Republic.
16.84 PPS6 (paragraph 2.22) indicates that:
“a diversity of uses in centres makes an important contribution to their vitality
and viability. Different but complementary uses, during the day and in the
evening, can reinforce each other, making town centres more attractive to local
residents, shoppers and visitors. Local planning authorities should encourage
diversification of uses in the town centre as a whole, and ensure that tourism,
leisure and cultural activities, which appeal to a wide range of age and social
groups, are dispersed throughout the centre”.
16.85 Paragraph 2.23 also indicates that planning policies should:
“encourage a range of complementary evening and night-time economy uses
which appeal to a wide range of age and social groups, ensuring that provision is
made where appropriate for a range of leisure, cultural and tourism activities
such as cinemas, theatres, restaurants, public houses, bars, nightclubs and
cafes”.

P104/122 11947/756914v1
16.86 National branded pub/restaurant chains have been investing heavily, although
not exclusively in larger centres. Many chains such as All Bar One, JD
Wetherspoons and Yates Wine Bars have sought representation in smaller
centres close to residential communities.
16.87 National information available from Goad Plans indicates that the proportion of
non-retail uses within town centres across the country has increased over the
last decade as shown in Table 16.6. The proportion of Class A1 retail uses in
Goad town centres has decreased by 12% between 1994 to 2008 (7.2
percentage points), whilst non-retail uses including Class A2, A3 and non-retail
(service) A1 uses have all increased.
Table 16.6: GB Goad Plan Town Centres Use Class Mix
Proportion of Total Number of Units (%)
Type of Unit
% Change
1994 to
2009 1994 2000 2005 2009
Class A1 (Retail) - 13.3 61.2 59.1 56.4 54.0
Class A1 (Services) + 42.0 6.9 8.2 9.6 9.8
Class A2 + 5.9 8.5 8.9 8.9 9.0
Class A3/A5* + 57.6 9.2 11.2 13.7 14.5
Miscellaneous + 30 1.0 1.4 1.4 1.3
Vacant/under
Const. - 20 13.2 11.2 10.1 11.4
Total - 100.0 100.0 100.0 100.0
Source: Goad Centre Reports *excludes Bars/Public houses (A4)
16.88 The number of bars and pubs continued to decline in 2006 according to figures
produced by the Department of Culture, Media and Sport and this was prior to
the smoking ban.
16.89 The Beer Orders were acts passed by the government in the early 1990’s which
saw a massive expansion of themed bar operators and pub restaurants, such
as JD Wetherspoons. These outlets generally require a minimum 50,000
population and are usually located on main streets or secondary positions
close to prime retail, commercial and other leisure users. The district’s centres
have a limited provision of themed bar operators. Operators usually require
large premises of 250 - 1,500 sq m, in close proximity to public car parks and
good transport links.
16.90 Themed restaurants also expanded rapidly in the 1990’s. These operators have
located in out of centre retail/leisure parks as well as good secondary/primary
high street locations. Fast food operators such as McDonalds and Burger King
have expanded the number of drive through outlets, and town centre outlets.
Outlets have been developed within retail/leisure parks or on busy roads.
16.91 As indicated in earlier sections of this report, the proportion of Class A3/A5
uses in the main centres in the Borough is broadly consistent with the national
average. Growth in Class A3 to A5 uses within town centres may continue in

P105/122 11947/756914v1
the future, and will compete for shop premises with other town centre uses. A
balance between Class A1 and Class A3 to A5 uses needs to be maintained.
16.92 Based on the current mix of non-retail uses within the main centres, it may be
reasonable to assume a further 25% for services and Class A2 to A5 uses.
Future town centre development should provide additional space for these uses
as well as Class A1 retail.

P106/122 11947/756914v1
17.0 Scope for Accommodating Growth
Floorspace Projections
17.1 The floorspace projections set out in the previous sections assume that new
shopping facilities within LB of Harrow can maintain their current market share
of expenditure within the study area, recognising that other competing centres
are likely to improve in the future. There are a number of issues that may
influence the scope for new floorspace and the appropriate location for this
development, as follows:
• major retail developments in competing centres, such as Brent Cross;
• the re-occupation of vacant town centre floorspace;
• the availability of land to accommodate new development;
• the reliability of long term expenditure projections, particularly after 2015;
• the effect of internet/home shopping on the demand for retail property;
• the acceptability of higher than average trading levels;
• the limited current level of operator demand for floorspace in Harrow;
• the likelihood that Harrow’s existing market share of expenditure will change
in the future in the face of increasing competition;
• the potential impact new development may have on existing centres.
17.2 The long term floorspace projections (up to 2020 and beyond) shown in Section
16.0 should be treated with caution and should only be used as a broad guide,
particularly when translated into the development plan allocations or when used
to guide development control decisions. Long term forecasts may be subject to
change due to unforeseen circumstances. Projected surplus expenditure is
primarily attributable to projected growth in spending per capita. If the growth
in expenditure is lower than that forecast then the scope for additional space
will reduce. Long term projections should be monitored and kept under-review.
Recommendations on monitoring and updating projections are set out in
Section 18.0.
17.3 The expenditure projections in this study take into account home shopping
made through non-retail businesses, because special forms of trading have
been excluded. The study assumes that special forms of trading will increase
in the future, including the growth of internet shopping. However, the impact
of internet growth on the demand for retail floorspace is unclear. Some
retailers’ home delivery and Internet services utilise existing stores rather than
warehouses, for example Tesco Direct. Therefore, internet sales will not always
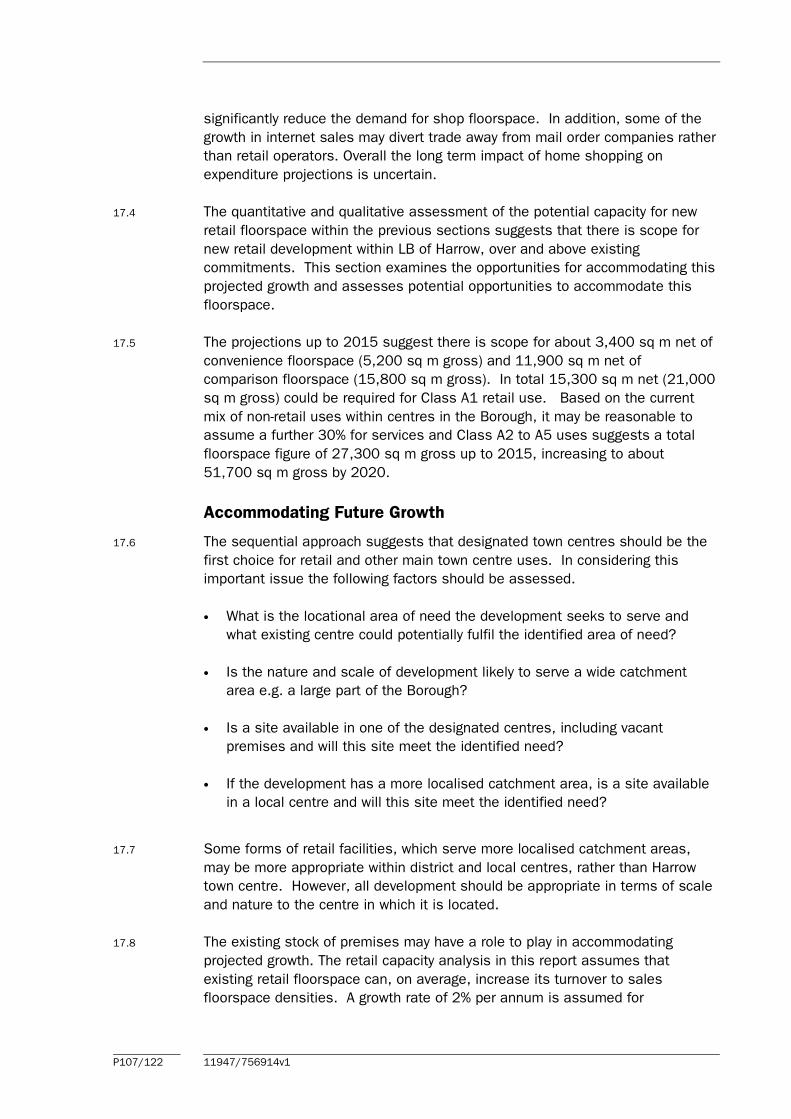
P107/122 11947/756914v1
significantly reduce the demand for shop floorspace. In addition, some of the
growth in internet sales may divert trade away from mail order companies rather
than retail operators. Overall the long term impact of home shopping on
expenditure projections is uncertain.
17.4 The quantitative and qualitative assessment of the potential capacity for new
retail floorspace within the previous sections suggests that there is scope for
new retail development within LB of Harrow, over and above existing
commitments. This section examines the opportunities for accommodating this
projected growth and assesses potential opportunities to accommodate this
floorspace.
17.5 The projections up to 2015 suggest there is scope for about 3,400 sq m net of
convenience floorspace (5,200 sq m gross) and 11,900 sq m net of
comparison floorspace (15,800 sq m gross). In total 15,300 sq m net (21,000
sq m gross) could be required for Class A1 retail use. Based on the current
mix of non-retail uses within centres in the Borough, it may be reasonable to
assume a further 30% for services and Class A2 to A5 uses suggests a total
floorspace figure of 27,300 sq m gross up to 2015, increasing to about
51,700 sq m gross by 2020.
Accommodating Future Growth
17.6 The sequential approach suggests that designated town centres should be the
first choice for retail and other main town centre uses. In considering this
important issue the following factors should be assessed.
• What is the locational area of need the development seeks to serve and
what existing centre could potentially fulfil the identified area of need?
• Is the nature and scale of development likely to serve a wide catchment
area e.g. a large part of the Borough?
• Is a site available in one of the designated centres, including vacant
premises and will this site meet the identified need?
• If the development has a more localised catchment area, is a site available
in a local centre and will this site meet the identified need?
17.7 Some forms of retail facilities, which serve more localised catchment areas,
may be more appropriate within district and local centres, rather than Harrow
town centre. However, all development should be appropriate in terms of scale
and nature to the centre in which it is located.
17.8 The existing stock of premises may have a role to play in accommodating
projected growth. The retail capacity analysis in this report assumes that
existing retail floorspace can, on average, increase its turnover to sales
floorspace densities. A growth rate of 2% per annum is assumed for

P108/122 11947/756914v1
comparison floorspace after 2011, and 0.3% per annum for convenience
floorspace. The adoption of these growth rates represents a balanced
approach. The floorspace projections reflect these assumptions. In addition to
the growth in sales densities, vacant shops could help to accommodate future
growth.
17.9 There were 80 vacant shop units within the main centres in the Borough, a
vacancy rate of about 6.5%, which is below the Goad national average (11.4%).
If the current vacancy level fell from 6.5% to 5% then this could accommodate
about 4,000 sq m gross of commercial space (assuming 200 sq m gross per
unit). However, all centres will have a certain level of vacancy at any given time
and this represents the normal turnover of operators. The relatively low
vacancy rate within the Borough suggests there may be limited scope for
existing premises to absorb future growth.
17.10 The short term priority during the recession should be to ensure that the
vacancy rate does not significantly increase within the Borough, but this should
not preclude investment within appropriate town centre locations.
Potential Development Opportunities
17.11 A review of potential development sites has been undertaken in the main
centres in the Borough. Sites in each centre have been evaluated, in terms of
their implications on the scope and need for additional retail and other main
town centre uses, and have been assessed against the following factors:
• existing land uses and availability, categorised as follows:
- short to medium term – up to 2015;
- long term - likely to be completed after 2015;
• commercial potential for retail development and the most likely form of
development, categorised as follows:
- prime site - likely to attract a developer and occupiers;
- secondary site – which may generate limited demand or only demand for
a specific kind of use.
• potential scope to accommodate additional retail floorspace (net increase),
categorised as follows:
- small scale - under 1,000 sq m gross floorspace;
- medium scale – 1,000 to 2,500 sq m gross floorspace;
- large scale - over 2,500 sq m gross floorspace;
• potential development constraints; and
• possible alternative uses.
17.12 The overall development prospects of each opportunity, taking on board all of
the factors listed above, has been categorised as follows:

P109/122 11947/756914v1
• Good - development sites that have good prospects for providing additional
retail floorspace, and should be considered for implementation in the short
to medium term;
• Reasonable - development sites which are well located and may provide
potential for additional floorspace, although obstacles to development will
need to be overcome, but implementation may only be achieved in the long
term; and
• Poor - development sites that may be unattractive or unsuitable for retail or
leisure development where their delivery is very uncertain.
17.13 This overall rating is based on an initial evaluation for each site. The level of
analysis undertaken at this stage is limited, i.e. detailed appraisals of
development constraints, land ownership and potential development costs have
not been undertaken. More detailed examinations of each site will need to be
undertaken before sites can be brought forward for development or ruled out as
viable options. The evaluations undertaken for each opportunity are not
detailed planning appraisals and they do not imply that planning permission
should be granted or refused for retail development on any site. However, the
evaluation is expected to identify potentially suitable development opportunities
that may be worthy of further consideration by the Council. This evaluation
provides a framework within which the Council can consider the implementation
of a development strategy for each centre.
Evaluation of Potential Development Sites
17.14 Each opportunity site identified has been evaluated based on the factors listed
earlier in this section. An assessment of each site is provided in Appendix F,
and is summarised in Table 17.1.

P110/122 11947/756914v1
Table 17.1: Site Evaluation Summary
Site Potential
Availability
Potential Scale
Development
Overall
Potential
Harrow Metropolitan Centre
H1 – Tesco store/car park, Station Rd Short to Medium Large Good
H2 – Debenhams/car park, Greenhill
Way
Long Large Good
H3 – Offices and car park Lyons Rd Medium to Long Large Reasonable/Poor
H4 – Havelock Place Medium to Long Large Reasonable
H5 – Station Site/South side of
College Road
Medium to Long Large Good
H6 – St Ann’s Centre Service Yard
West, Clarenden Road
Medium to Long Medium Good
H7 – 132-176 College Road Medium Large Reasonable
Wealdstone
W1 – Corner of Canning Road and
George Gange Way
Short to Medium Small Reasonable/Poor
W2 – Land to north of Canning Road Short to Medium Small Good
W3 – Peel House car park and hall to
south of Canning Road
Medium to Long Medium Reasonable/Poor
W4 – Land to south of Palmerston
Road and west of George Gange Way
Medium to Long Small Good
W5 – Land to south of Palmerston
Road and east of George Gange Way
Medium to Long Small Reasonable
W6 – Harrow and Wealdstone Car
Park, Ellen Webb Drive
Short Small Poor
Pinner
P1 – Sainsbury’s Car Park, Station
Approach
Medium to Long Medium Reasonable/Poor
P2 - Land between High Street and
Love Lane
Medium to Long Medium Reasonable
P3 – M&S Car Park off Love Lane Short to Medium Medium Poor
Rayners Lane
RL1 – Units south of tube station on
Alexandra Avenue
Short to Medium Small Good
RL2 – Harrow West Conservative
Assoc. and Hallmark Cars, Village Way
Medium Small Good
RL3 – Rayners Lane car park and
former Pub, Village Way East.
Short Medium Good
North Harrow
NH1 - Cambridge Road Car Park and
North Harrow Home Guard Club, Off
Pinner Road
Medium Medium Reasonable/Poor
NH2 – North Harrow Methodist Church,
Pinner Road
Medium Medium Reasonable
Stanmore
S1 – Stanmore Broadway car park Medium Medium Reasonable
S2 – Telephone Exchange, Elm Park Medium Small Reasonable/Poor
South Harrow
SH1 – Roxeth Library and Northolt
Road Clinic, Northolt Road
Medium Small Reasonable
Kingsbury
K1 – Land at junction of Kenton Rd
and Honeypot Lane
Short to Medium Small Good

P111/122 11947/756914v1
17.15 Within the Borough 25 opportunities have been identified, of which 17 sites are
considered to have reasonable or above potential to deliver additional retail
floorspace. The floorspace of these 17 sites is broken down by centre as
follows:
1 Harrow Metropolitan Centre – 37,000 sq m (gross)
2 Wealdstone District Centre – 2,800 sq m (gross)
3 Pinner District Centre – 1,500 sq m (gross)
4 Rayners Lane District Centre – 3,500 sq m (gross)
5 North Harrow District Centre – 2,000 sq m (gross)
6 Stanmore District Centre – 2,000 sq m (gross)
7 South Harrow District Centre – 1,000 sq m (gross)
8 Kingsbury District Centre – 1,000 sq m (gross)
Summary and Conclusions
17.16 A number of sites with reasonable or good development potential have been
identified. Together these sites could accommodate additional retail floorspace
of about 50,000 sq m gross.
17.17 Opportunities in the Borough are more than capable of accommodating the
retail floorspace projection up to 2015 (27,300 sq m gross). This includes a
convenience floorspace projection of 5,200 sq m (gross), a comparison
floorspace projection of 15,800 sq m (gross) and an allowance of 30% for other
non-retail commercial uses A2/A3/A4/A5 and B1a (15% A3-A5 and 10% A2
and B1a) of 6,300 sq m (gross).
17.18 The potential development sites are potentially capable of accommodating
most of the retail floorspace projections up to 2020 (51,700 sq m). This
includes a convenience floorspace projection of 6,740 sq m (gross), a
comparison floorspace projection of 33,000 sq m (gross) and an allowance of
30% for other non-retail commercial uses A2/A3/A4/A5 and B1a (15% A3-A5
and 10% A2 and B1a) of 11,900 sq m (gross).
P112/122 11947/756914v1
18.0 Conclusions and Recommendations
18.1 This report provides a borough wide needs assessment for retail in the Harrow.
It provides a guide to the shopping needs of the Borough up to 2015, 2020,
and 2025. The principal conclusions of the analysis contained within this study
are summarised below.
Meeting Shopping Needs in the London Borough of Harrow
18.2 Overall, in order to meet projected growth in expenditure, there is a need for
additional shopping and service facilities. Future planning policy and site
allocations should seek, in line with PPS6, to identify opportunities to
accommodate growth.
18.3 The floorspace projections shown in this report provide broad guidance.
Meeting the projections between 2009 and 2015 remains the priority. The
projections should not be considered to be maximum or minimum limits or
targets, particularly when translated into the development plan allocations or
when used to guide development control decisions. For instance if a major
scheme comes forward within a designated centre in the period to 2015,
although the implementation of this proposal may possibly result in an over-
supply of comparison retail floorspace, it may be acceptable to permit such a
scheme if it is of an appropriate scale in terms of the role and function of that
centre.
18.4 Floorspace projections should not inhibit competition between retailers when
located within centres, subject to the consideration of scale and impact.
However, if an out-of-centre proposal exceeds the floorspace projections then
the need for the proposal and impact will need to be carefully considered.
18.5 Long term forecasts (beyond 2020) may be more susceptible to change, due to
unforeseen circumstances. Projected surplus expenditure beyond 2015 is
attributable to projected growth in spending per capita, extrapolated from past
growth projections. If the growth in expenditure is lower than that forecast then
the scope for additional space will reduce. Long term projections should be
monitored and kept under review. The implications of major retail development
within and surrounding the Borough should also be monitored and the affects
proposals may have on the demand for additional development in the London
Borough of Harrow should be considered carefully.
Accommodating Future Growth
18.6 The sequential approach suggests that town and centres should be the first
choice for retail development. In Harrow the preferred location for retail
development needs to be carefully considered, particularly for major
development which may have an extensive catchment area. Major development
should be located within the Harrow Metropolitan Centre or the nine district
centres.
P113/122 11947/756914v1
18.7 A number of sites with reasonable or good development potential have been
identified. Together these sites could accommodate additional retail floorspace
of about 50,000 sq m gross.
18.8 Opportunities in the Borough are more than capable of accommodating the
retail floorspace projection up to 2015 (27,300 sq m gross). This includes a
convenience floorspace projection of 5,200 sq m (gross), a comparison
floorspace projection of 15,800 sq m (gross) and an allowance of 30% for other
non-retail commercial uses A2/A3/A4/A5 and B1a (15% A3-A5 and 10% A2
and B1a) of 6,300 sq m (gross).
18.9 The potential development sites are potentially capable of accommodating
most of the retail floorspace projections up to 2020 (51,700 sq m). This
includes a convenience floorspace projection of 6,740 sq m (gross), a
comparison floorspace projection of 33,000 sq m (gross) and an allowance of
30% for other non-retail commercial uses A2/A3/A4/A5 and B1a (15% A3-A5
and 10% A2 and B1a) of 11,900 sq m (gross).
18.10 Some forms of retail facilities which serve more localised catchment areas may
be more appropriate within local centres, rather than the main centres.
However, all development should be appropriate in terms of scale and nature to
the centre in which it is located. Development may be required to serve new
residential development area, but these facilities are likely to be of a scale to
serve local shopping needs only.
18.11 The existing stock of premises may have a role to play in accommodating
projected growth. The retail capacity analysis in this report assumes that
existing retail floorspace can, on average, increase its turnover to sales
floorspace densities. The floorspace projections reflect these assumptions. In
addition to the growth in sales densities, vacant shops could help to
accommodate future growth.
18.12 The existing 2009 shop vacancy rate is relatively low in most centres in the
Borough, with all centres having a vacancy rate below the GOAD national
average (11.4%).
18.13 The average vacancy rate for the main centres is 6.5% If the current vacancy
level fell from 6.5% to 5% then this could accommodate about 4,000 sq m
gross of commercial space (assuming 200 sq m gross per unit). The relatively
low vacancy rate within the Borough suggests there may be limited scope for
existing premises to absorb future growth, however, the strategy should seek to
reduce the vacancy rate across the Borough by, where possible, directing new
retail uses into vacant premises.
18.14 Growth in sales densities and vacant shops will not be able to accommodate all
the future growth in retail expenditure, therefore potential development sites
need to be identified through the Local Development Framework process to
accommodate longer term growth.

P114/122 11947/756914v1
Convenience Goods Development
18.15 On the basis of the assumption that existing convenience retailers trade at
national average turnover levels, the quantitative capacity analysis indicates
there is potential for further convenience goods floorspace (3,362 sq m net)
within the Borough up to 2015, increasing to 4,379 sq m net by 2020.
Comparison Goods Development
18.16 The strategy should seek to promote further comparison retail development
within Harrow Metropolitan Centre, as the main comparison shopping
destination in the Borough. The strategy should seek to maintain their current
position in the shopping hierarchy and as a minimum seek to maintain the
centre’s existing market share of expenditure. In order to maintain their
existing position it will be necessary to continue to improve comparison
shopping facilities in the longer term. Comparison retail development within
the district centres in the Borough should be consistent in terms of scale and
nature with the nearest centre and should not serve a Borough wide catchment
area.
18.17 The quantitative capacity analysis indicates that in the short to medium term up
to 2015 there could be scope for about 11,900 sq m net (15,800 sq m gross)
of comparison floorspace in the Borough as a whole, and this could increase to
24,700 sq m net (33,000 sq m gross) by 2020.
18.18 The Council should seek to identify sites within the designated centres to meet
at least the floorspace projections up to 2015, and then longer term
opportunities to meet projections up to 2020/2025. Sites identified in the LDF
should continue to be explored with the landowner/developers, recognising it
may take a number of years to complete complex developments.
18.19 Any major comparison retail proposals outside the designated centres will be
required to demonstrate there is a need for the development proposed (subject
to proposed draft PPS4), comply with the sequential approach to site selection,
and the applicant will also need to demonstrate the proposal will not have an
unacceptable impact on existing centres. Development within centres will also
need to be consistent in terms of scale and nature with the role of that centre
and the catchment area that the centre serves.
The Role of Shopping Centres
18.20 PPS6 indicates that local planning authorities should adopt a positive and
proactive approach to planning for the future of the centres within their areas,
whether planning for growth, consolidation or decline. Local planning
authorities are expected to set out a vision and strategy for the pattern and
hierarchy of centres, including town, district and local centres within their area.
This strategy should set out how the role of different centres will contribute to
the overall vision for their area.

P115/122 11947/756914v1
18.21 The current UDP defines the current hierarchy which is in line with the London
Plan with Harrow town centre defined as a Metropolitan Centre. Harrow should
continue to act as the principal centre within the Borough supported by the
district centres, particularly Pinner and Wealdstone.
18.22 The local centres are also expected to cater for top-up and basket convenience
shopping and services, but are likely to provide a more limited range of
comparison shopping.
18.23 The sequential approach indicates that town, district and local centres are the
preferred location for new retail development. Development should be
appropriate in terms of scale and the catchment area the centre serves.
Therefore, large-scale development should be concentrated within the larger
centres, i.e. in Harrow, or failing that, district centres.
18.24 Some forms of development may be more appropriate in smaller centres, if
there are localised areas of deficiency. The key issues are the nature and
scale of retail/leisure development proposed and the catchment area the
development seeks to serve. Development should normally be consistent in
terms of scale and nature with the character and role of the nearest centre.
Therefore, development plan policies should provide clear advice in this
respect. In general development within local centres/parades in the urban area
should primarily serve walk-in catchment areas, approximately 500 metres from
the centre and local area needs assessment should be based on that
parameter.
18.25 PPS6 suggests that local authorities should adopt policies that enable town,
district and local centres to meet the needs of residents of their area. The
sequential approach indicates that the first preference for new developments
should be within centres followed by edge-of-centre sites in town and district
centre locations. Out of centre sites are last in the order of preference.
18.26 As indicated, development within all centres should be appropriate in terms of
nature and scale to the role of the centre. Developments which are likely to
attract customers from a significantly wider area than the centre’s intended
catchment area may be considered to be out-of-scale with the role of the
centre, and may be better located within a larger centre, if alternative sites are
available, which would meet the identified need. Again, each proposal would
need to be considered on its individual merits. The hierarchy of centres for the
Borough is shown below with a brief description of the function of that centre.

P116/122 11947/756914v1
Table 18.1: Hierarchy and Function of Centres
Centre Designation Function
Harrow Metropolitan Principal centre for comparison shopping
within the Borough.
Good range of service uses.
Pinner District Relatively large district centre with a good
range of shops including comparison retailers
(both national and independent) and Class
A3/A5 uses.
Wealdstone District Relatively large district centre, limited
comparison retailers, high proportion of
convenience retailers and service uses.
Rayners Lane District Medium sized district centre primarily serving
residents day to day shopping needs with a
good range of service and Class A3/A5 uses.
Stanmore District Relatively large district centre serving day to
day shopping needs with a good range of
service uses.
North Harrow District Medium sized district centre primarily serving
residents day to day shopping needs
particularly service and A3/A5 uses.
South Harrow District Small district centre primarily convenience
and A2 service uses.
Kingsbury District Medium sized district centre with a good
range of convenience and comparison
retailers.
Kenton Local Medium sized district centre serving day to
day shopping needs with limited comparison
or A3/A5 uses.
Burnt Oak District Medium sized district centre with a high
proportion of convenience retailers and a
good mix of service uses.
Edgware District Not assessed
Belmont Local Not assessed
Harrow Weald Local Not assessed
Hatch End Local Not assessed
Queensway Local Not assessed
Sudbury Hill Local Not assessed
18.27 Development plan policies should continue to seek to concentrate shopping
development within defined centres and the clear guidance in relation to what
type of development will be appropriate in each type of centre should be
maintained.
Harrow Metropolitan Centre
18.28 Harrow Metropolitan Centre should be maintained and enhanced. As the main
centre in the Borough it should serve the Borough as a whole, and should
embrace a wide range of activities. The centre should function as the main
comparison shopping destination in the Borough and also the main destination

P117/122 11947/756914v1
for leisure, entertainment and cultural activities that serve the Borough’s
residents.
18.29 In order to maintain and enhance this role, Harrow should be the focus for
major comparison retail developments. To meet the Borough’s need for retail
and other town centre uses major development is required in the town centre’s
in the medium to long term. An appropriate balance of uses needs to be
maintained and existing town centre uses should be protected.
18.30 The quality and choice of comparison shopping and evening economy uses
should be improved uses. There is potential to expand Harrow town centre’s
catchment area, which currently does not fully reflect its status as a
Metropolitan Centre.
District Centres
18.31 Accommodating the identified need in the district centres is constrained by the
proximity of residential development and road/rail lines. NLP’s assessment
indicates that Wealdstone and Rayners Lane have the most potential sites and
should be the focus for meeting the retail need in the Borough, outside Harrow
Metropolitan Centre.
Designated Primary and Secondary Shopping Frontages
18.32 The Study has identified a need for new retail development, over and above the
existing commitments. It will also be necessary to retain where appropriate
existing retail uses within the centres. Therefore, there is a continuing need to
monitor the designated shopping frontages within the town centres, and
continue to protect Class A uses. Changes of use or redevelopment which
involve the net loss of Class A use should be carefully considered and only
permitted in exceptional circumstances, i.e. where retention of Class A use is
unviable. This will need to be determined on a case by case basis.
18.33 The Primary and Secondary Shopping Frontage designations are currently
defined in the ‘saved’ policies of the Harrow UDP. A review of the frontages
was undertaken and the following potential changes should be considered by
the Council;
• Harrow Town Centre – no change.
• Pinner – Re-designate no’s 38-52 (even) and 29-39 (odd) High Street as
Secondary Shopping Frontage. The frontage contains mainly independent
and service retailers and does not have the same footfall as the rest of the
Primary Shopping Frontage.
• Wealdstone – Designate no’s 87-111b High Street as Secondary Shopping
Frontage. The frontage contains independent and service retailers similar to
those found in the existing Secondary Shopping Frontage within the Centre.

P118/122 11947/756914v1
• Rayners Lane – No change.
• Stanmore – No change.
• North Harrow – Re-designate 435 Pinner Road and 34-56 (even) Station
Road as Primary Shopping Frontage or designate all frontages within the
centre as Secondary Shopping Frontage. The frontage contains similar
retailers to those found in the Primary Shopping Frontage opposite including
Lloyds TSB.
• South Harrow – Re-designate no’s 273-295 (odd) Northolt Road as Primary
Shopping Frontage or designate all frontages within the centre as Secondary
Shopping Frontage. The frontage includes key national retailers within the
centre such as Boots, Shoe Zone and Greggs.
• Kingsbury – No change.
• Kenton – No change.
• Burnt Oak – No change.
Future Strategy Implementation and Monitoring
18.34 There are a number of broad areas of possible action the Council could pursue
in order to maintain and enhance the role of shopping centres within the
Borough and to address the weaknesses highlighted in the centre health
checks, as follows:
• application of guidance within PPS6, particularly relating to need and the
sequential approach in determining out-of-centre retail and other
development proposals that generate significant numbers of trips;
• improving the range and choice of shops and services in all centres (where
appropriate in terms of scale) by encouraging intensification, development
and the re-occupation of vacant premises, and continuing to promote the
centres through town centre management initiatives;
• maintaining the generally high quality environment within each centre;
• measures to improve accessibility and public transport to the town, district
and local centres in order to encourage more residents to shop in their
nearest centre, which may involve maintaining an appropriate level of car
parking at a competitive cost and safeguarding and improving public
transport services;
• measures (such as planning briefs and development partnerships) to bring
forward development opportunities to improve the availability of modern
premises suitable for new occupiers.

P119/122 11947/756914v1
• pro-active approach to site assembly which may require the use of
compulsory purchase powers.
18.35 The recommendations and projections within this study are expected to assist
the Council in preparing development plan policies over the coming years and
to assist development control decisions during this period. The study provides
a broad overview of the potential need for further retail development up to
2015, with longer term forecast up to 2020 and 2025. However, projections
are subject to uncertainty and forecasts may need to be amended to reflect
emerging changes as and when new information becomes available. In
particular long-term projections up to 2025 should be treated with caution.
18.36 We would recommend that this retail study should be updated in 4-5 years time
and the floorspace projections rolled forward. The following key assumptions
should be updated as necessary:
• population projections;
• local expenditure estimates (information from Experian or other recognised
data providers);
• growth rate assumptions for expenditure per capita (information from
Experian or other recognised data providers);
• the impact of potential increases in home and internet shopping;
• existing retail floorspace and average turnover to floorspace densities
(floorspace surveys and turnover data from Management Horizons, Retail
Ranking); and
• implemented development within and around the study area.
18.37 These key inputs into the retail capacity assessment can be amended to
provide revised capacity projections. We do not envisage that the structure of
the capacity assessment set out in this report will need to be amended. It may
be necessary to undertake an updated household survey to address the
implementation of major developments that will significantly alter shopping
patterns in the Borough.
18.38 The Council should continue monitoring and updating the centre health checks
provided in this study on a regular basis to accord with the provisions of the
Planning and Compulsory Purchase Act 2004 with regard to the submission of
annual monitoring reports. In particular changes in Class A1 representations
and vacancy rates should be monitored. Property market data should also be
monitored i.e. rents. The visitor survey and pedestrian flow counts could be
updated less frequently e.g. bi-annually.
18.39 Many of the recommendations contained in this study have been formulated
having regard to the guidance set out in PPS6. This guidance is currently under
review by the Government and the final version of PPS4 may be published later
this year and the Council may need to review our recommendations in the light
of changes made. This will be particularly relevant to new guidance covering the
need and sequential test and implications for the annual monitoring of policies.

Appendix A
Study Area and Existing Retail Facilities

HARROW STUDY AREA ZONES
Zone Area Postcode Sectors
1 Northwood HA 6 1
HA 6 2
HA6 3
2 Ruislip HA 4 7
3 Eastcote HA 5 1
HA 5 2
HA 4 0
HA 4 8
HA4 9
4 Hatch End HA 5 3
HA 5 4
HA 3 6
WD19 6
5 Rayners Lane HA 5 5
HA 2 0
HA 2 7
HA 2 8
HA 2 9
UB 5 4
6 Harrow HA 1 1
HA 1 2
HA 1 3
HA 1 4
HA 2 6
HA 3 5
HA 3 7
7 Wembley HA 0 3
HA 0 2
HA 9 7
HA 9 8
UB 6 0
8 Kenton HA 7 1
HA 7 2
HA 3 0
HA 3 8
HA 3 9
9 Edgware HA 8 5
HA 8 6
HA 8 7
NW 9 0
NW 9 9
10 Stanmore HA 7 3
HA 7 4

HARROW STUDY AREA ZONES
1
2
9
10
4
5
6
3
8
7
1
2
9
10
4
5
6
3
8
7

Table 1A - Convenience Floorspace and Expected Turnover
Net Sales % Convenience Turnover to Sales Total
Floorspace Convenience Sales Floorspace Floorspace Convenience
Sq M Sales Sq M Density Per Sq M Turnover £M
Harrow TC
Tesco, Station Road 3,314 80% 2,651 £13,203 £35.01
Iceland, Station Road 667 85% 567 £5,505 £3.12
Marks and Spencer, St Ann's Road 700 100% 700 £11,814 £8.27
Harrow Other 1,308 100% 1,308 £4,000 £5.23
Total 5,989 5,226 £51.63
Burnt Oak
Iceland 491 95% 467 £5,505 £2.57
Burnt Oak Other 785 100% 785 £4,000 £3.14
Total 1,276 1,251 £5.71
Kingsbury
Kingbury Other 1,000 100% 1,000 £4,000 £4.00
Total 1,000 1,000 £4.00
North Harrow
North Harrow Other 929 100% 929 £4,000 £3.72
Total 929 929 £3.72
South Harrow
Sainsburys, Northolt Road 1,289 80% 1,031 £9,548 £9.84
South Harrow Other 1,528 100% 1,528 £4,000 £6.11
Total 2,817 2,559 £15.95
Wealdstone
Wealdstone Other 1,860 100% 1,860 £4,000 £7.44
Total 1,860 1,860 £7.44
Rayners Lane
Rayners Lane Other 1,859 100% 1,859 £4,000 £7.44
Total 1,859 1,859 £7.44
Pinner
Sainsbury, Barters Walk 2,893 70% 2,025 £9,548 £19.34
Marks and Spencer, Simply Food, Bishops Walk 905 100% 905 £11,814 £10.69
Pinner Other 556 100% 556 £4,000 £2.23
Total 4,355 3,487 £32.25
Stanmore
Sainsbury, The Broadway 2,426 70% 1,698 £9,548 £16.21
Lidl, High Street 173 80% 138 £2,679 £0.37
Stanmore other 422 100% 422 £4,000 £1.69
Total 3,020 2,258 £18.27
Edgware (inside LB Harrow Only)
Edgware Other 242 100% 242 £4,000 £0.97
Total 242 242 £0.97
Kenton
Kenton Other 1,039 100% 1,039 £4,000 £4.15
Total 1,039 1,039 £4.15
Other Neighbourhood Centres
Waitrose, High Road, Harold Weald 1,388 80% 1,111 £11,142 £12.37
Tesco Metro, Kenton Lane, Belmont 477 95% 453 £13,203 £5.98
Neighbourhood Centres Other 3,816 100% 3,816 £4,000 £15.26
Total 5,681 5,380 £33.62
Other Convenience Floorspace within the BoroughLidl, High Street, Edgware 656 80% 525 £2,679 £1.41
Tesco, Ash Hill Drive, Pinner Green 2,169 75% 1,627 £13,203 £21.48
Waitrose, Northolt Road, South Harrow 2,285 80% 1,828 £11,142 £20.37
Morrisons, Uxbridge Road, Hatch End 2,919 75% 2,189 £10,814 £23.68
Other local shops 8,570 100% 8,570 £4,000 £34.28
Total 16,599 14,739 £101.21
GRAND TOTAL 46,665 41,828 £280.65
Comparison Sales Floorspace in Food Stores Sq M Net 4,579
Sources: IGD Food Store Directory 2009
Harrow Council Retail Survey 2008

Table 2A - Comparison Floorspace
Gross Net Sales
Centre Floorspace SQ M Floorspace Sq M
Harrow
Comparison shops 62,871 47,153
Comparison floorspace in food stores n/a 763
Harrow Total 62,871 47,916
Stanmore
Comparison shops 3,633 2,361
Comparison floorspace in food stores n/a 762
Stanmore Total 3,633 3,124
Burnt Oak
Comparison shops 3,120 2,028
Comparison floorspace in food stores n/a 25
Burnt Oak Total 3,120 2,053
Edgware (LB of Harrow Only)
Comparison shops 1,369 890
Edgware Total 1,369 890
Kingsbury
Comparison shops 493 320
Kingsbury Total 493 320
North Harrow
Comparison shops 3,442 2,237
North Harrow Total 3,442 2,237
South Harrow
Comparison shops 2,883 1,874
Comparison floorspace in food stores n/a 258
South Harrow Total 2,883 2,132
Pinner
Comparison shops 5,049 3,282
Comparison floorspace in food stores n/a 868
Pinner Total 5,049 4,150
Wealdstone
Comparison shops 5,770 3,751
Wealdstone Total 5,770 3,751
Rayners Lane
Comparison shops 4,063 2,641
Rayners Lane Total 4,063 2,641
Kenton
Comparison shops 2,043 1,328
Kenton Total 2,043 1,328
Other Neighbourhood Centres
Comparison shops 10,330 6,715
Comparison floorspace in food stores n/a 301
Other Neighbourhood Centres Total 10,330 7,016
Out of Centre
Comparison Shops 22,196 14,427
Comparison floorspace in food stores n/a 1,860
Out of Centre Total 22,196 16,288
GRAND TOTAL 126,769 93,524
Sources: Harrow Council Land Use Survey 2008
Table 1A

Table 3A - Estimated Turnover of Committed Retail Development and Proposals (2007 prices)
Convenience (2009) - Commitments
Store Net Sales Convenience Convenience Turnover Total
Floorspace % Sales Floorspace Density Convenience
Sq M Floorspace Sq M Net £ per Sq M Turnover £M
Sainsbury store, Pinner Road, Harrow 3,458 80% 2,766 £9,548 £26.41
Wealdstone - Tesco Express in vacant Woolworths unit 451 95% 428 £13,203 £5.66
Tesco Express, Pinner Road 279 95% 265 £13,203 £3.50
Rayners Lane - Iceland in vacant Woolworths unit. 300 95% 285 £5,505 £1.57
Total 4,488 - 3,745 - £37.14
Comparison (2009) - Commitments
Store Net Sales Comparison Comparison Turnover Total
Floorspace % Sales Floorspace Density Comparison
Sq M Floorspace Sq M Net £ per Sq M Turnover £M
Sainsbury store, Pinner Road, Harrow 3,458 20% 692 £7,724 £5.34
Total - 692 - £5.34

Appendix B
Convenience Retail Assessment

Table 1B : Population Projections
Catchment Area 2001 2009 2015 2020 2025
1 - Northwood 21,584 22,249 23,241 24,033 24,496
2 - Ruislip 9,529 9,697 10,081 10,393 10,507
3 - Eastcote 44,223 45,061 46,911 48,112 48,529
4 - Hatch End 34,080 35,220 36,997 37,188 37,351
5 - Rayners Lane 63,528 65,143 68,138 68,108 68,040
6 - Harrow 55,828 57,303 60,116 59,866 59,593
7 - Wembley 51,000 52,406 54,981 56,294 57,107
8 - Kenton 51,894 53,307 55,987 56,265 56,342
9 - Edgware 42,221 43,394 45,609 46,112 46,354
10 - Stanmore 14,294 14,672 15,392 15,328 15,258
388,181 398,454 417,453 421,699 423,577
Sources: Greater London Authority 2008 Low Demographic Projections
Experian Population Census 2001
ONS 2006 Population Projections for Three Rivers part of catchment Table 2B: Convenience Goods Expenditure Per Capita (2007 Prices)
Expenditure Per Capita 2009 2015 2020 2025 Growth Growth Growth
2009-2015 2009-2020 2009-2025
1 - Northwood £1,931 £1,972 £2,042 £2,114 2.1% 5.7% 9.5%
2 - Ruislip £1,835 £1,873 £1,940 £2,009 2.1% 5.7% 9.5%
3 - Eastcote £1,785 £1,822 £1,887 £1,954 2.1% 5.7% 9.5%
4 - Hatch End £1,792 £1,829 £1,894 £1,961 2.1% 5.7% 9.4%
5 - Rayners Lane £1,635 £1,669 £1,729 £1,790 2.1% 5.7% 9.5%
6 - Harrow £1,674 £1,709 £1,769 £1,832 2.1% 5.7% 9.4%
7 - Wembley £1,624 £1,658 £1,717 £1,778 2.1% 5.7% 9.5%
8 - Kenton £1,624 £1,658 £1,717 £1,778 2.1% 5.7% 9.5%
9 - Edgware £1,586 £1,619 £1,677 £1,736 2.1% 5.7% 9.5%
10 - Stanmore £1,845 £1,883 £1,950 £2,019 2.1% 5.7% 9.4%
Sources:
Experian local estimates of 2007 convenience goods expenditure per capita
Excluding special forms of trading - 2.0% in 2009, 2.2% in 2010, 2.3% in 2011 and 2012, 2.5% in 2013, 2.6% in 2014 and 2.8% in 2015 and beyond
Experian Business Strategies - forecast annual growth rates for 2007 to 2011 (0.9%, -0.5%, -0.1% and 0.2%)
Experian Business Strategies - ultra long term growth rate adopted beyond 2011 (0.7% per annum)

Table 3B: Total Available Convenience Goods Expenditure (£M - 2007 Prices)
Catchment Area 2009 2015 2020 2025 Growth Growth Growth
2009-2015 2009-2020 2009-2025
1 - Northwood £42.96 £45.83 £49.08 £51.78 6.7% 14.2% 20.5%
2 - Ruislip £17.79 £18.88 £20.16 £21.11 6.1% 13.3% 18.6%
3 - Eastcote £80.43 £85.47 £90.79 £94.82 6.3% 12.9% 17.9%
4 - Hatch End £63.11 £67.67 £70.43 £73.25 7.2% 11.6% 16.1%
5 - Rayners Lane £106.51 £113.72 £117.76 £121.79 6.8% 10.6% 14.3%
6 - Harrow £95.93 £102.74 £105.90 £109.18 7.1% 10.4% 13.8%
7 - Wembley £85.11 £91.16 £96.66 £101.54 7.1% 13.6% 19.3%
8 - Kenton £86.57 £92.83 £96.61 £100.18 7.2% 11.6% 15.7%
9 - Edgware £68.82 £73.84 £77.33 £80.47 7.3% 12.4% 16.9%
10 - Stanmore £27.07 £28.98 £29.89 £30.81 7.1% 10.4% 13.8%
Total £674.31 £721.12 £754.60 £784.92 6.9% 11.9% 16.4%
Sources: Table 1B and Table 2B

Table 4B: Convenience Shopping Penetration Rates 2009
Centre/Facilities Zone 1 Zone 2 Zone 3 Zone 4 Zone 5 Zone 6 Zone 7 Zone 8 Zone 9 Zone 10 %
Northwood Ruislip Eastcote Hatch End Rayners Ln Harrow Wembley Kenton Edgware Stanmore Inflow
Large Food Store (Over 1,000 sq m net)
Tesco, Station Road Harrow 0% 0% 1% 1% 6% 22% 4% 4% 0% 3% 2%
Sainsbury, Pinner 2% 0% 11% 14% 8% 3% 0% 0% 0% 0% 2%
Sainsbury, Stanmore 0% 0% 0% 0% 0% 1% 0% 6% 2% 35% 2%
Sainsbury, South Harrow 0% 0% 1% 0% 15% 1% 0% 0% 0% 0% 2%
Morrisons, Hatch End 2% 0% 3% 19% 4% 10% 0% 1% 0% 4% 2%
Waitrose, Harrow Weald 0% 0% 0% 12% 0% 7% 0% 4% 0% 15% 2%
Waitrose, South Harrow 0% 0% 2% 0% 11% 8% 5% 0% 0% 0% 2%
Tesco, Pinner Green 16% 2% 10% 5% 2% 1% 0% 1% 0% 2% 2%
Other in LB Harrow 15% 5% 15% 30% 25% 28% 8% 15% 6% 16% 2%
LB Harrow Total 35% 7% 43% 81% 71% 81% 17% 31% 8% 75% n/a
LB Barnet 0% 0% 0% 0% 0% 1% 1% 2% 27% 10% n/a
LB Brent 0% 0% 0% 1% 0% 7% 24% 56% 59% 6% n/a
LB Ealing 0% 0% 0% 1% 5% 6% 53% 8% 3% 0% n/a
LB Hillingdon 49% 74% 55% 0% 22% 1% 5% 0% 0% 0% n/a
Hertsmere 0% 0% 0% 2% 0% 0% 0% 1% 0% 5% n/a
Watford 5% 8% 1% 15% 1% 3% 0% 1% 2% 2% n/a
Outside LB Harrow 11% 11% 1% 0% 1% 1% 0% 1% 1% 2% n/a
Other Sub-Total 65% 93% 57% 19% 29% 19% 83% 69% 92% 25% n/a
Market Share Total 100% 100% 100% 100% 100% 100% 100% 100% 100% 100% n/a
Source: Market shares based on NEMS Household survey results

Table 5B: Convenience Expenditure 2009 £ Million (2007 Prices)
Centre/Facilities Zone 1 Zone 2 Zone 3 Zone 4 Zone 5 Zone 6 Zone 7 Zone 8 Zone 9 Zone 10 % Total
Northwood Ruislip Eastcote Hatch End Rayners Ln Harrow Wembley Kenton Edgware Stanmore Inflow Turnover
Expenditure 2009 42.96 17.79 80.43 63.11 106.51 95.93 85.11 86.57 68.82 27.07
Large Food Store (Over 1,000 sq m net)
Tesco, Station Road Harrow 0.00 0.00 0.80 0.63 6.39 21.10 3.40 3.46 0.00 0.81 0.75 37.36
Sainsbury, Pinner 0.86 0.00 8.85 8.84 8.52 2.88 0.00 0.00 0.00 0.00 0.61 30.55
Sainsbury, Stanmore 0.00 0.00 0.00 0.00 0.00 0.96 0.00 5.19 1.38 9.47 0.35 17.35
Sainsbury, South Harrow 0.00 0.00 0.80 0.00 15.98 0.96 0.00 0.00 0.00 0.00 0.36 18.10
Morrisons, Hatch End 0.86 0.00 2.41 11.99 4.26 9.59 0.00 0.87 0.00 1.08 0.63 31.70
Waitrose, Harrow Weald 0.00 0.00 0.00 7.57 0.00 6.71 0.00 3.46 0.00 4.06 0.45 22.26
Waitrose, South Harrow 0.00 0.00 1.61 0.00 11.72 7.67 4.26 0.00 0.00 0.00 0.52 25.77
Tesco, Pinner Green 6.87 0.36 8.04 3.16 2.13 0.96 0.00 0.87 0.00 0.54 0.47 23.39
Other in LB Harrow 6.44 0.89 12.07 18.93 26.63 26.86 6.81 12.99 4.13 4.33 2.45 122.53
LB Harrow Total 15.04 1.25 34.59 51.12 75.62 77.70 14.47 26.84 5.51 20.30 6.58 329.01
LB Barnet 0.00 0.00 0.00 0.00 0.00 0.96 0.85 1.73 18.58 2.71 n/a 24.83
LB Brent 0.00 0.00 0.00 0.63 0.00 6.71 20.43 48.48 40.61 1.62 n/a 118.48
LB Ealing 0.00 0.00 0.00 0.63 5.33 5.76 45.11 6.93 2.06 0.00 n/a 65.81
LB Hillingdon 21.05 13.17 44.24 0.00 23.43 0.96 4.26 0.00 0.00 0.00 n/a 107.11
Hertsmere 0.00 0.00 0.00 1.26 0.00 0.00 0.00 0.87 0.00 1.35 n/a 3.48
Watford 2.15 1.42 0.80 9.47 1.07 2.88 0.00 0.87 1.38 0.54 n/a 20.57
Outside LB Harrow 4.73 1.96 0.80 0.00 1.07 0.96 0.00 0.87 0.69 0.54 n/a 11.61
Other Sub-Total 27.93 16.55 45.85 11.99 30.89 18.23 70.64 59.73 63.32 6.77 n/a 803.42
Market Share Total 42.96 17.79 80.43 63.11 106.51 95.93 85.11 86.57 68.82 27.07 n/a 1132.43
Source: Table 3B and Table 4B

Table 6B: Convenience Expenditure 2015 £ Million (2007 Prices)
Centre/Facilities Zone 1 Zone 2 Zone 3 Zone 4 Zone 5 Zone 6 Zone 7 Zone 8 Zone 9 Zone 10 % Total
Northwood Ruislip Eastcote Hatch End Rayners Ln Harrow Wembley Kenton Edgware Stanmore Inflow Turnover
Expenditure 2015 45.83 18.88 85.47 67.67 113.72 102.74 91.16 92.83 73.84 28.98
Large Food Store (Over 1,000 sq m net)
Tesco, Station Road Harrow 0.00 0.00 0.85 0.68 6.82 22.60 3.65 3.71 0.00 0.87 0.80 39.99
Sainsbury, Pinner 0.92 0.00 9.40 9.47 9.10 3.08 0.00 0.00 0.00 0.00 0.65 32.62
Sainsbury, Stanmore 0.00 0.00 0.00 0.00 0.00 1.03 0.00 5.57 1.48 10.14 0.37 18.59
Sainsbury, South Harrow 0.00 0.00 0.85 0.00 17.06 1.03 0.00 0.00 0.00 0.00 0.39 19.33
Morrisons, Hatch End 0.92 0.00 2.56 12.86 4.55 10.27 0.00 0.93 0.00 1.16 0.68 33.93
Waitrose, Harrow Weald 0.00 0.00 0.00 8.12 0.00 7.19 0.00 3.71 0.00 4.35 0.48 23.85
Waitrose, South Harrow 0.00 0.00 1.71 0.00 12.51 8.22 4.56 0.00 0.00 0.00 0.55 27.55
Tesco, Pinner Green 7.33 0.38 8.55 3.38 2.27 1.03 0.00 0.93 0.00 0.58 0.50 24.95
Other in LB Harrow 6.87 0.94 12.82 20.30 28.43 28.77 7.29 13.92 4.43 4.64 2.62 131.04
LB Harrow Total 16.04 1.32 36.75 54.81 80.74 83.22 15.50 28.78 5.91 21.74 7.04 351.84
LB Barnet 0.00 0.00 0.00 0.00 0.00 1.03 0.91 1.86 19.94 2.90 n/a 26.63
LB Brent 0.00 0.00 0.00 0.68 0.00 7.19 21.88 51.98 43.57 1.74 n/a 127.03
LB Ealing 0.00 0.00 0.00 0.68 5.69 6.16 48.31 7.43 2.22 0.00 n/a 70.48
LB Hillingdon 22.46 13.97 47.01 0.00 25.02 1.03 4.56 0.00 0.00 0.00 n/a 114.04
Hertsmere 0.00 0.00 0.00 1.35 0.00 0.00 0.00 0.93 0.00 1.45 n/a 3.73
Watford 2.29 1.51 0.85 10.15 1.14 3.08 0.00 0.93 1.48 0.58 n/a 22.01
Outside LB Harrow 5.04 2.08 0.85 0.00 1.14 1.03 0.00 0.93 0.74 0.58 n/a 12.38
Other Sub-Total 29.79 17.56 48.72 12.86 32.98 19.52 75.66 64.05 67.93 7.25 n/a 859.20
Market Share Total 45.83 18.88 85.47 67.67 113.72 102.74 91.16 92.83 73.84 28.98 n/a 1211.04
Source: Table 3B and Table 4B
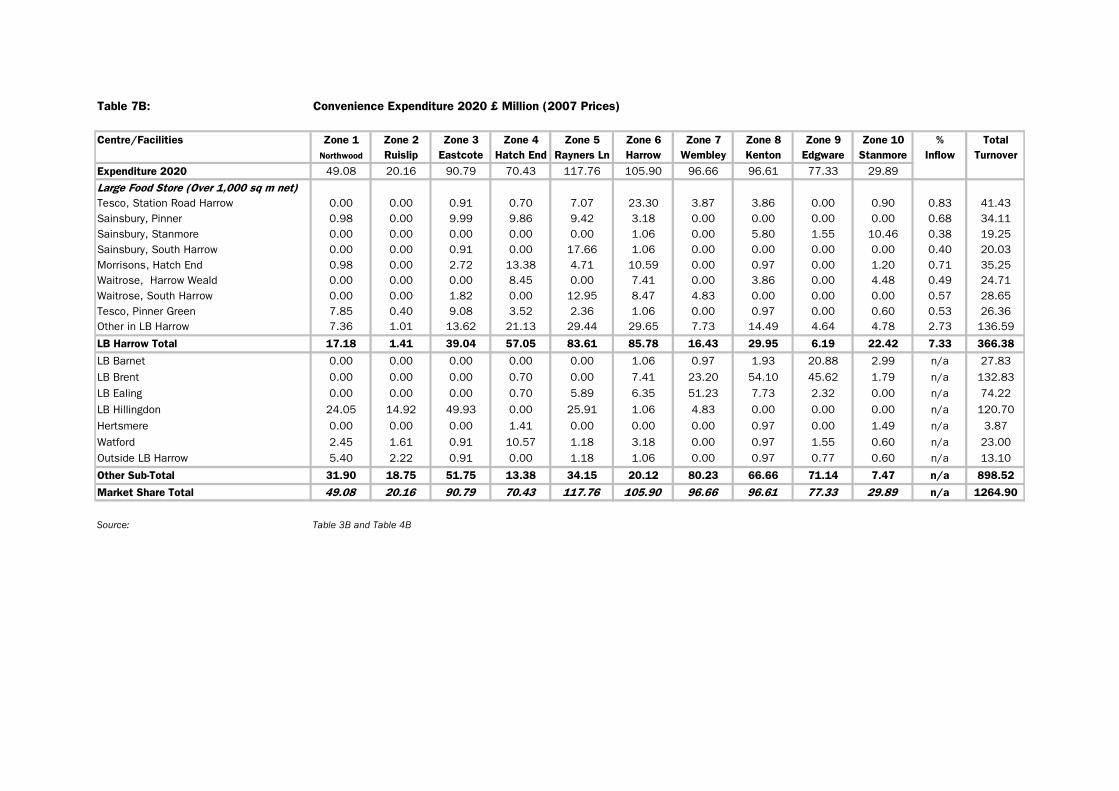
Table 7B: Convenience Expenditure 2020 £ Million (2007 Prices)
Centre/Facilities Zone 1 Zone 2 Zone 3 Zone 4 Zone 5 Zone 6 Zone 7 Zone 8 Zone 9 Zone 10 % Total
Northwood Ruislip Eastcote Hatch End Rayners Ln Harrow Wembley Kenton Edgware Stanmore Inflow Turnover
Expenditure 2020 49.08 20.16 90.79 70.43 117.76 105.90 96.66 96.61 77.33 29.89
Large Food Store (Over 1,000 sq m net)
Tesco, Station Road Harrow 0.00 0.00 0.91 0.70 7.07 23.30 3.87 3.86 0.00 0.90 0.83 41.43
Sainsbury, Pinner 0.98 0.00 9.99 9.86 9.42 3.18 0.00 0.00 0.00 0.00 0.68 34.11
Sainsbury, Stanmore 0.00 0.00 0.00 0.00 0.00 1.06 0.00 5.80 1.55 10.46 0.38 19.25
Sainsbury, South Harrow 0.00 0.00 0.91 0.00 17.66 1.06 0.00 0.00 0.00 0.00 0.40 20.03
Morrisons, Hatch End 0.98 0.00 2.72 13.38 4.71 10.59 0.00 0.97 0.00 1.20 0.71 35.25
Waitrose, Harrow Weald 0.00 0.00 0.00 8.45 0.00 7.41 0.00 3.86 0.00 4.48 0.49 24.71
Waitrose, South Harrow 0.00 0.00 1.82 0.00 12.95 8.47 4.83 0.00 0.00 0.00 0.57 28.65
Tesco, Pinner Green 7.85 0.40 9.08 3.52 2.36 1.06 0.00 0.97 0.00 0.60 0.53 26.36
Other in LB Harrow 7.36 1.01 13.62 21.13 29.44 29.65 7.73 14.49 4.64 4.78 2.73 136.59
LB Harrow Total 17.18 1.41 39.04 57.05 83.61 85.78 16.43 29.95 6.19 22.42 7.33 366.38
LB Barnet 0.00 0.00 0.00 0.00 0.00 1.06 0.97 1.93 20.88 2.99 n/a 27.83
LB Brent 0.00 0.00 0.00 0.70 0.00 7.41 23.20 54.10 45.62 1.79 n/a 132.83
LB Ealing 0.00 0.00 0.00 0.70 5.89 6.35 51.23 7.73 2.32 0.00 n/a 74.22
LB Hillingdon 24.05 14.92 49.93 0.00 25.91 1.06 4.83 0.00 0.00 0.00 n/a 120.70
Hertsmere 0.00 0.00 0.00 1.41 0.00 0.00 0.00 0.97 0.00 1.49 n/a 3.87
Watford 2.45 1.61 0.91 10.57 1.18 3.18 0.00 0.97 1.55 0.60 n/a 23.00
Outside LB Harrow 5.40 2.22 0.91 0.00 1.18 1.06 0.00 0.97 0.77 0.60 n/a 13.10
Other Sub-Total 31.90 18.75 51.75 13.38 34.15 20.12 80.23 66.66 71.14 7.47 n/a 898.52
Market Share Total 49.08 20.16 90.79 70.43 117.76 105.90 96.66 96.61 77.33 29.89 n/a 1264.90
Source: Table 3B and Table 4B

Table 8B: Convenience Expenditure 2025 £ Million (2007 Prices)
Centre/Facilities Zone 1 Zone 2 Zone 3 Zone 4 Zone 5 Zone 6 Zone 7 Zone 8 Zone 9 Zone 10 % Total
Northwood Ruislip Eastcote Hatch End Rayners Ln Harrow Wembley Kenton Edgware Stanmore Inflow Turnover
Expenditure 2025 51.78 21.11 94.82 73.25 121.79 109.18 101.54 100.18 80.47 30.81
Large Food Store (Over 1,000 sq m net)
Tesco, Station Road Harrow 0.00 0.00 0.95 0.73 7.31 24.02 4.06 4.01 0.00 0.92 0.86 42.86
Sainsbury, Pinner 1.04 0.00 10.43 10.25 9.74 3.28 0.00 0.00 0.00 0.00 0.71 35.45
Sainsbury, Stanmore 0.00 0.00 0.00 0.00 0.00 1.09 0.00 6.01 1.61 10.78 0.40 19.89
Sainsbury, South Harrow 0.00 0.00 0.95 0.00 18.27 1.09 0.00 0.00 0.00 0.00 0.41 20.72
Morrisons, Hatch End 1.04 0.00 2.84 13.92 4.87 10.92 0.00 1.00 0.00 1.23 0.73 36.55
Waitrose, Harrow Weald 0.00 0.00 0.00 8.79 0.00 7.64 0.00 4.01 0.00 4.62 0.51 25.57
Waitrose, South Harrow 0.00 0.00 1.90 0.00 13.40 8.73 5.08 0.00 0.00 0.00 0.59 29.70
Tesco, Pinner Green 8.29 0.42 9.48 3.66 2.44 1.09 0.00 1.00 0.00 0.62 0.55 27.55
Other in LB Harrow 7.77 1.06 14.22 21.97 30.45 30.57 8.12 15.03 4.83 4.93 2.84 141.78
LB Harrow Total 18.12 1.48 40.77 59.33 86.47 88.43 17.26 31.05 6.44 23.10 7.60 380.07
LB Barnet 0.00 0.00 0.00 0.00 0.00 1.09 1.02 2.00 21.73 3.08 n/a 28.92
LB Brent 0.00 0.00 0.00 0.73 0.00 7.64 24.37 56.10 47.48 1.85 n/a 138.17
LB Ealing 0.00 0.00 0.00 0.73 6.09 6.55 53.81 8.01 2.41 0.00 n/a 77.61
LB Hillingdon 25.37 15.62 52.15 0.00 26.79 1.09 5.08 0.00 0.00 0.00 n/a 126.11
Hertsmere 0.00 0.00 0.00 1.46 0.00 0.00 0.00 1.00 0.00 1.54 n/a 4.01
Watford 2.59 1.69 0.95 10.99 1.22 3.28 0.00 1.00 1.61 0.62 n/a 23.93
Outside LB Harrow 5.70 2.32 0.95 0.00 1.22 1.09 0.00 1.00 0.80 0.62 n/a 13.70
Other Sub-Total 33.66 19.63 54.05 13.92 35.32 20.74 84.28 69.12 74.03 7.70 n/a 934.30
Market Share Total 51.78 21.11 94.82 73.25 121.79 109.18 101.54 100.18 80.47 30.81 n/a 1314.37
Source: Table 3B and Table 4B

Table 9B: Convenience Floorspace Projection 2009 to 2025
Centre 2009 2015 2020 2025
Available Expenditure in LB Harrow £M 329.01 351.84 366.38 380.07
Benchmark Turnover of existing facilities £M 280.65 284.03 288.32 292.67
Benchmark Turnover of commitments £M 37.14 37.59 38.15 38.73
Expenditure Deficit/Surplus £M 11.22 30.22 39.90 48.67
Large Food Stores (80%) 8.97 24.18 31.92 38.93
Small stores/shops (20%) 2.24 6.04 7.98 9.73
Turnover Density of New Floorspace £ per sSq M
Large Food Stores 11,000 11,133 11,301 11,471
Small stores/shops 5,000 5,060 5,137 5,214
New Sales Floorspace Sq M Net
Large Food Stores 816 2,172 2,825 3,394
Small stores/shops 449 1,194 1,554 1,867
LB Harrow Total 1,265 3,366 4,379 5,261
Sources: Tables 4B to 8B


Appendix C
Comparison Retail Assessment

Table 1C: Comparison Goods Expenditure Per Capita (2007 Prices)
Expenditure Per Capita 2009 2015 2020 2025 Growth Growth Growth
2009-2015 2009-2020 2009-2025
1 - Northwood £3,197 £3,800 £4,759 £5,959 18.9% 48.9% 86.4%
2 - Ruislip £3,051 £3,627 £4,542 £5,687 18.9% 48.9% 86.4%
3 - Eastcote £2,949 £3,506 £4,390 £5,497 18.9% 48.9% 86.4%
4 - Hatch End £2,869 £3,411 £4,271 £5,349 18.9% 48.9% 86.4%
5 - Rayners Lane £2,499 £2,972 £3,721 £4,659 18.9% 48.9% 86.4%
6 - Harrow £2,620 £3,115 £3,900 £4,884 18.9% 48.9% 86.4%
7 - Wembley £2,397 £2,850 £3,569 £4,469 18.9% 48.9% 86.4%
8 - Kenton £2,484 £2,953 £3,697 £4,630 18.9% 48.8% 86.4%
9 - Edgware £2,373 £2,822 £3,533 £4,424 18.9% 48.9% 86.4%
10 - Stanmore £2,981 £3,544 £4,437 £5,556 18.9% 48.8% 86.4%
Sources:
Experian local estimates of 2007 comparison goods expenditure per capita
Excluding special froms of trading - 8.1% in 2009, 8.5% in 2010, 8.9% in 2011 and beyond
Experian Business Strategies - forecast annual growth rates for 2007 to 2011 (4.0%,-3.0%,- 1.1% and 1.3%)
Experian Business Strategies - ultra long term growth rate adopted beyond 2011 (4.6% per annum)

Table 2C: Total Available Comparison Goods Expenditure (£M - 2007 Prices)
Catchment Area 2009 2015 2020 2025 Growth Growth Growth
2009-2015 2009-2020 2009-2025
1 - Northwood £71.13 £88.32 £114.38 £145.97 24.2% 60.8% 105.2%
2 - Ruislip £29.59 £36.56 £47.21 £59.75 23.6% 59.6% 102.0%
3 - Eastcote £132.89 £164.47 £211.21 £266.76 23.8% 58.9% 100.7%
4 - Hatch End £101.05 £126.20 £158.83 £199.79 24.9% 57.2% 97.7%
5 - Rayners Lane £162.79 £202.51 £253.43 £317.00 24.4% 55.7% 94.7%
6 - Harrow £150.14 £187.26 £233.48 £291.05 24.7% 55.5% 93.9%
7 - Wembley £125.62 £156.70 £200.91 £255.21 24.7% 59.9% 103.2%
8 - Kenton £132.42 £165.33 £208.01 £260.86 24.9% 57.1% 97.0%
9 - Edgware £102.97 £128.71 £162.91 £205.07 25.0% 58.2% 99.2%
10 - Stanmore £43.74 £54.55 £68.01 £84.77 24.7% 55.5% 93.8%
Total £1,052.32 £1,310.60 £1,658.38 £2,086.25 24.5% 57.6% 98.3%
Sources: Table 1B and Table 2B

Table 3C: Comparison Shopping Penetration Rates 2009
Centre/Facilities Zone 1 Zone 2 Zone 3 Zone 4 Zone 5 Zone 6 Zone 7 Zone 8 Zone 9 Zone 10 %
Northwood Ruislip Eastcote Hatch End Rayners Ln Harrow Wembley Kenton Edgware Stanmore Inflow
Harrow Town Centre 7% 2% 12% 19% 32% 49% 33% 28% 9% 11% 5%
Other LB Harrow 16% 9% 10% 21% 14% 13% 3% 13% 6% 18% 5%
LB Harrow Total 23% 11% 22% 40% 46% 62% 36% 41% 15% 29% n/a
Other
LB Barnet 3% 2% 1% 3% 2% 4% 14% 20% 50% 28% n/a
LB Brent 0% 0% 0% 0% 0% 0% 4% 2% 3% 0% n/a
LB Ealing 2% 1% 2% 1% 4% 4% 22% 11% 9% 5% n/a
LB Hillingdon 14% 45% 41% 6% 21% 6% 5% 3% 2% 0% n/a
Central London/West End 5% 10% 6% 4% 6% 4% 10% 4% 5% 10% n/a
Other London 0% 0% 0% 0% 1% 1% 1% 1% 1% 3% n/a
Watford 39% 15% 16% 37% 10% 13% 2% 12% 8% 17% n/a
All Other 14% 16% 12% 9% 10% 6% 6% 6% 7% 8% n/a
Other Sub-Total 77% 89% 78% 60% 54% 38% 64% 59% 85% 71% n/a
Market Share Total 100% 100% 100% 100% 100% 100% 100% 100% 100% 100% n/a
Source: Market shares based on NEMS Household survey results

Table 4C: Comparison Expenditure 2009 (£ Millions)
Centre/Facilities Zone 1 Zone 2 Zone 3 Zone 4 Zone 5 Zone 6 Zone 7 Zone 8 Zone 9 Zone 10 % Total
Northwood Ruislip Eastcote Hatch End Rayners Ln Harrow Wembley Kenton Edgware Stanmore Inflow Turnover
Expenditure 2009 71.13 29.59 132.89 101.05 162.79 150.14 125.62 132.42 102.97 43.74
Harrow Town Centre 4.98 0.59 15.95 19.20 52.09 73.57 41.45 37.08 9.27 4.81 13.63 272.62
Other LB Harrow 11.38 2.66 13.29 21.22 22.79 19.52 3.77 17.21 6.18 7.87 6.63 132.52
LB Harrow Total 16.36 3.25 29.23 40.42 74.88 93.08 45.22 54.29 15.45 12.68 20.26 405.14
Other
LB Barnet 2.13 0.59 1.33 3.03 3.26 6.01 17.59 26.48 51.49 12.25 n/a 124.15
LB Brent 0.00 0.00 0.00 0.00 0.00 0.00 5.02 2.65 3.09 0.00 n/a 10.76
LB Ealing 1.42 0.30 2.66 1.01 6.51 6.01 27.64 14.57 9.27 2.19 n/a 71.56
LB Hillingdon 9.96 13.31 54.48 6.06 34.19 9.01 6.28 3.97 2.06 0.00 n/a 139.33
Central London/West End 3.56 2.96 7.97 4.04 9.77 6.01 12.56 5.30 5.15 4.37 n/a 61.68
Other London 0.00 0.00 0.00 0.00 1.63 1.50 1.26 1.32 1.03 1.31 n/a 8.05
Watford 27.74 4.44 21.26 37.39 16.28 19.52 2.51 15.89 8.24 7.44 n/a 160.70
All Other 9.96 4.73 15.95 9.09 16.28 9.01 7.54 7.94 7.21 3.50 n/a 91.21
Other Total 54.77 26.33 103.65 60.63 87.91 57.05 80.40 78.13 87.53 31.05 n/a 667.44
Market Share Total 71.13 29.59 132.89 101.05 162.79 150.14 125.62 132.42 102.97 43.74 n/a 1072.58
Source: Tables 1B, 1C to 3C

Table 5C: Comparison Expenditure 2015 (£ Millions)
Centre/Facilities Zone 1 Zone 2 Zone 3 Zone 4 Zone 5 Zone 6 Zone 7 Zone 8 Zone 9 Zone 10 % Total
Northwood Ruislip Eastcote Hatch End Rayners Ln Harrow Wembley Kenton Edgware Stanmore Inflow Turnover
Expenditure 2015 88.32 36.56 164.47 126.20 202.51 187.26 156.70 165.33 128.71 54.55
Harrow Town Centre 6.18 0.73 19.74 23.98 64.80 91.76 51.71 46.29 11.58 6.00 16.99 339.76
Other LB Harrow 14.13 3.29 16.45 26.50 28.35 24.34 4.70 21.49 7.72 9.82 8.25 165.05
LB Harrow Total 20.31 4.02 36.18 50.48 93.15 116.10 56.41 67.78 19.31 15.82 25.24 504.81
Other
LB Barnet 2.65 0.73 1.64 3.79 4.05 7.49 21.94 33.07 64.35 15.27 n/a 154.98
LB Brent 0.00 0.00 0.00 0.00 0.00 0.00 6.27 3.31 3.86 0.00 n/a 13.44
LB Ealing 1.77 0.37 3.29 1.26 8.10 7.49 34.47 18.19 11.58 2.73 n/a 89.24
LB Hillingdon 12.36 16.45 67.43 7.57 42.53 11.24 7.83 4.96 2.57 0.00 n/a 172.95
Central London/West End 4.42 3.66 9.87 5.05 12.15 7.49 15.67 6.61 6.44 5.45 n/a 76.80
Other London 0.00 0.00 0.00 0.00 2.03 1.87 1.57 1.65 1.29 1.64 n/a 10.04
Watford 34.44 5.48 26.31 46.69 20.25 24.34 3.13 19.84 10.30 9.27 n/a 200.07
All Other 12.36 5.85 19.74 11.36 20.25 11.24 9.40 9.92 9.01 4.36 n/a 113.49
Other Total 68.00 32.54 128.29 75.72 109.35 71.16 100.29 97.54 109.40 38.73 n/a 831.02
Market Share Total 88.32 36.56 164.47 126.20 202.51 187.26 156.70 165.33 128.71 54.55 n/a 1335.84
Source: Tables 1B, 1C to 3C

Table 6C: Comparison Expenditure 2020 (£ Millions)
Centre/Facilities Zone 1 Zone 2 Zone 3 Zone 4 Zone 5 Zone 6 Zone 7 Zone 8 Zone 9 Zone 10 % Total
Northwood Ruislip Eastcote Hatch End Rayners Ln Harrow Wembley Kenton Edgware Stanmore Inflow Turnover
Expenditure 2020 114.38 47.21 211.21 158.83 253.43 233.48 200.91 208.01 162.91 68.01
Harrow Town Centre 8.01 0.94 25.35 30.18 81.10 114.40 66.30 58.24 14.66 7.48 21.40 428.07
Other LB Harrow 18.30 4.25 21.12 33.35 35.48 30.35 6.03 27.04 9.77 12.24 10.42 208.36
LB Harrow Total 26.31 5.19 46.47 63.53 116.58 144.76 72.33 85.28 24.44 19.72 31.82 636.43
Other
LB Barnet 3.43 0.94 2.11 4.76 5.07 9.34 28.13 41.60 81.46 19.04 n/a 195.89
LB Brent 0.00 0.00 0.00 0.00 0.00 0.00 8.04 4.16 4.89 0.00 n/a 17.08
LB Ealing 2.29 0.47 4.22 1.59 10.14 9.34 44.20 22.88 14.66 3.40 n/a 113.19
LB Hillingdon 16.01 21.24 86.60 9.53 53.22 14.01 10.05 6.24 3.26 0.00 n/a 220.15
Central London/West End 5.72 4.72 12.67 6.35 15.21 9.34 20.09 8.32 8.15 6.80 n/a 97.37
Other London 0.00 0.00 0.00 0.00 2.53 2.33 2.01 2.08 1.63 2.04 n/a 12.63
Watford 44.61 7.08 33.79 58.77 25.34 30.35 4.02 24.96 13.03 11.56 n/a 253.52
All Other 16.01 7.55 25.35 14.29 25.34 14.01 12.05 12.48 11.40 5.44 n/a 143.94
Other Total 88.07 42.01 164.75 95.30 136.85 88.72 128.59 122.73 138.48 48.29 n/a 1053.77
Market Share Total 114.38 47.21 211.21 158.83 253.43 233.48 200.91 208.01 162.91 68.01 n/a 1690.20
Source: Tables 1B, 1C to 3C

Table 7C: Comparison Expenditure 2025 (£ Millions)
Centre/Facilities Zone 1 Zone 2 Zone 3 Zone 4 Zone 5 Zone 6 Zone 7 Zone 8 Zone 9 Zone 10 % Total
Northwood Ruislip Eastcote Hatch End Rayners Ln Harrow Wembley Kenton Edgware Stanmore Inflow Turnover
Expenditure 2025 145.97 59.75 266.76 199.79 317.00 291.05 255.21 260.86 205.07 84.77
Harrow Town Centre 10.22 1.20 32.01 37.96 101.44 142.62 84.22 73.04 18.46 9.33 26.87 537.35
Other LB Harrow 23.36 5.38 26.68 41.96 44.38 37.84 7.66 33.91 12.30 15.26 13.09 261.80
LB Harrow Total 33.57 6.57 58.69 79.92 145.82 180.45 91.88 106.95 30.76 24.58 39.96 799.16
Other
LB Barnet 4.38 1.20 2.67 5.99 6.34 11.64 35.73 52.17 102.54 23.74 n/a 246.39
LB Brent 0.00 0.00 0.00 0.00 0.00 0.00 10.21 5.22 6.15 0.00 n/a 21.58
LB Ealing 2.92 0.60 5.34 2.00 12.68 11.64 56.15 28.70 18.46 4.24 n/a 142.71
LB Hillingdon 20.44 26.89 109.37 11.99 66.57 17.46 12.76 7.83 4.10 0.00 n/a 277.41
Central London/West End 7.30 5.98 16.01 7.99 19.02 11.64 25.52 10.43 10.25 8.48 n/a 122.62
Other London 0.00 0.00 0.00 0.00 3.17 2.91 2.55 2.61 2.05 2.54 n/a 15.84
Watford 56.93 8.96 42.68 73.92 31.70 37.84 5.10 31.30 16.41 14.41 n/a 319.26
All Other 20.44 9.56 32.01 17.98 31.70 17.46 15.31 15.65 14.35 6.78 n/a 181.25
Other Total 112.40 53.18 208.07 119.87 171.18 110.60 163.34 153.91 174.31 60.19 n/a 1327.05
Market Share Total 145.97 59.75 266.76 199.79 317.00 291.05 255.21 260.86 205.07 84.77 n/a 2126.21
Source: Tables 1B, 1C to 3C
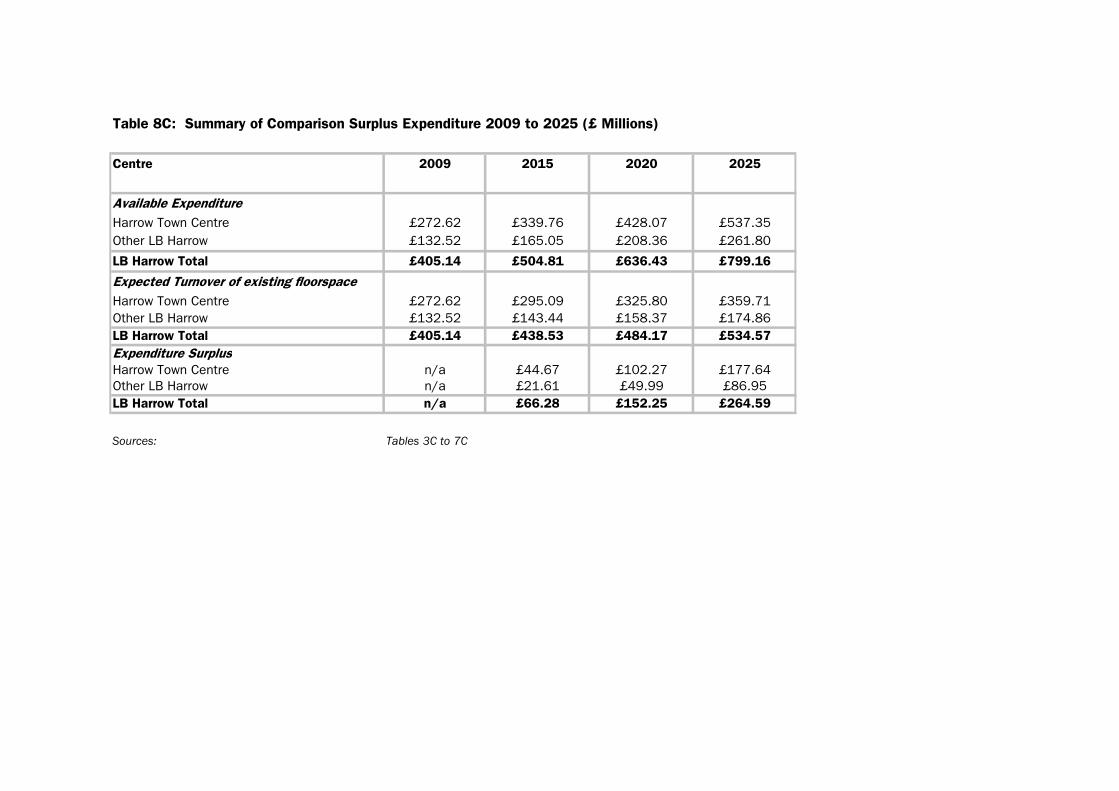
Table 8C: Summary of Comparison Surplus Expenditure 2009 to 2025 (£ Millions)
Centre 2009 2015 2020 2025
Available Expenditure
Harrow Town Centre £272.62 £339.76 £428.07 £537.35
Other LB Harrow £132.52 £165.05 £208.36 £261.80
LB Harrow Total £405.14 £504.81 £636.43 £799.16
Expected Turnover of existing floorspace
Harrow Town Centre £272.62 £295.09 £325.80 £359.71
Other LB Harrow £132.52 £143.44 £158.37 £174.86
LB Harrow Total £405.14 £438.53 £484.17 £534.57
Expenditure Surplus
Harrow Town Centre n/a £44.67 £102.27 £177.64
Other LB Harrow n/a £21.61 £49.99 £86.95
LB Harrow Total n/a £66.28 £152.25 £264.59
Sources: Tables 3C to 7C
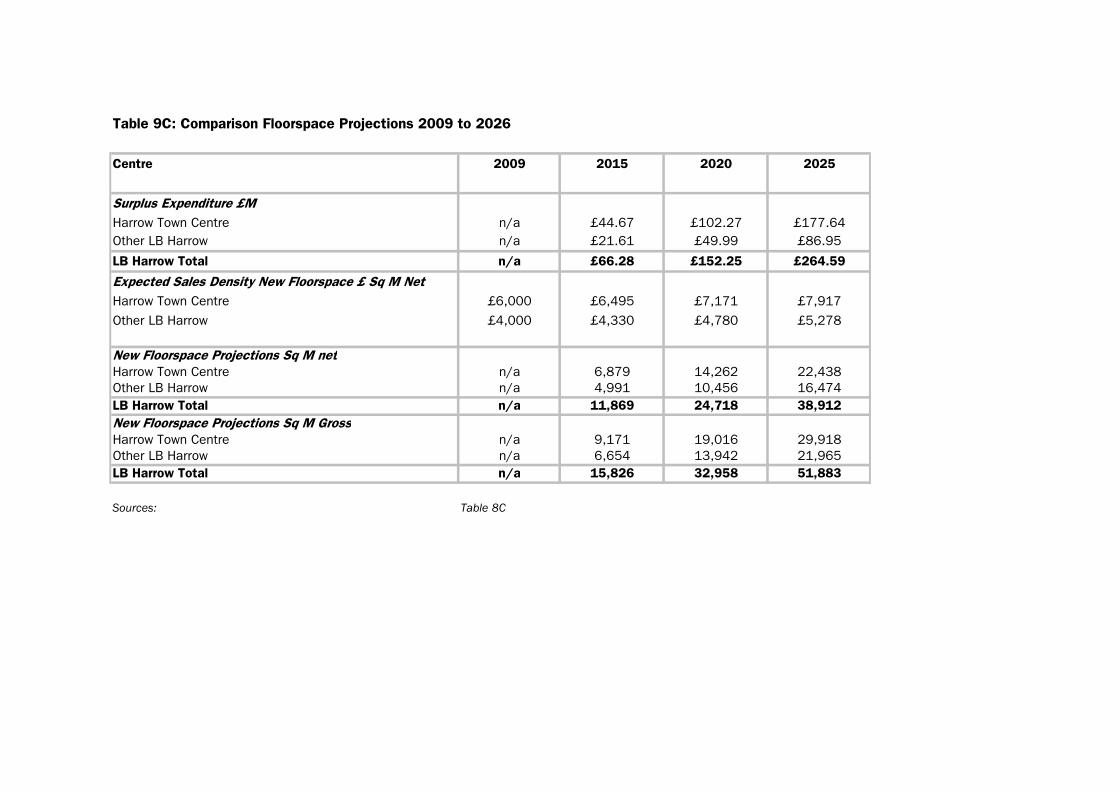
Table 9C: Comparison Floorspace Projections 2009 to 2026
Centre 2009 2015 2020 2025
Surplus Expenditure £M
Harrow Town Centre n/a £44.67 £102.27 £177.64
Other LB Harrow n/a £21.61 £49.99 £86.95
LB Harrow Total n/a £66.28 £152.25 £264.59
Expected Sales Density New Floorspace £ Sq M Net
Harrow Town Centre £6,000 £6,495 £7,171 £7,917
Other LB Harrow £4,000 £4,330 £4,780 £5,278
New Floorspace Projections Sq M net
Harrow Town Centre n/a 6,879 14,262 22,438
Other LB Harrow n/a 4,991 10,456 16,474
LB Harrow Total n/a 11,869 24,718 38,912
New Floorspace Projections Sq M Gross
Harrow Town Centre n/a 9,171 19,016 29,918
Other LB Harrow n/a 6,654 13,942 21,965
LB Harrow Total n/a 15,826 32,958 51,883
Sources: Table 8C

Appendix D
Operator Requirements

ESTATES GAZETTE (EGI) – RETAILER AND LEISURE REQUIREMENTS
(JUNE 2008 TO JUNE 2009)
HARROW
Best Buy
2323 - 5574 sqm General Retail
Best Buy is an American retailer and is the largest consumer electronics retailer in the world.
The retailer has tied up with Carphone Warehouse for its entry into the UK market.
Costcutter
111 - 325 sqm General Retail
Formed in 1986, Costcutter's first expansion outside mainland UK began with Northern Ireland.
In 1990, developments were also pursued in the Republic of Ireland when Costcutter formed a
'strategic alliance' with Barry's of Mallow. Costcutter's development plans will mean that it will
increase its presence on forecourts around the UK.
David Lloyd Leisure
The David Lloyd Leisure Group operates 78 clubs in the UK and a further 10 sites across
Europe. The Group, which is now Europe's largest racquets, health and fitness operator, was
formed on the 1st January 2008 following the acquisition of David Lloyd Leisure Ltd by London
& Regional Properties, owners of Next Generation Clubs. The company was previously owned
by Whitbread until August 2007.
HomeSense
929 - 1394 sqm General Retail
HomeSense comes from the TJX family of brands, well known for offering customers great
brands and value. In the new HomeSense stores, shoppers will find a huge choice of stylish,
top quality homeware at great prices.
IKEA
20000 - sq m Site Area
IKEA was founded by Ingvar Kamprad in 1943 in Sweden. To ensure long-term independence
and security, the IKEA Group is a private group of companies owned by a charitable foundation,
Sitchting INGKA Foundation, which is registered in Holland. It operates on a franchise basis,
with the IKEA Group being the largest franchisee of Inter IKEA Systems B.V., which owns the
IKEA concept. In the UK, IKEA opened its first store in 1987 in Warrington. IKEA also owns
upmarket furniture chain Habitat, which it bought from Sir Terence Conran in 1992.
Jack Wills
139 - 465 sqm General Retail
Jack Wills is a clothing retailer, which sells its products through standalone stores as well as
mail order and internet business. Its clothing offer is 70% womenswear and aimed at 16-25
year olds. Its competitors include White Stuff, Fat Face and Quiksilver.
Julian Graves
46 - 111 sqm General Retail
Julian Graves was launched in 1987 and is a specialist food retailer of dried fruits, nuts,
premium snacks, herbs & spices, confectionery, vitamins & mineral supplements. Baugur sold
the retailer to NBTY Europe in September 2008.

Majestic Wine Warehouse
186 - 465 sqm General Retail
Majestic Wine Warehouse is one of the leading UK retailers of alcoholic drinks, opening its first
warehouse in 1981. It has an annual turnover of more than £175 million. Majestic operates
from over 125 sites in the UK as well as trading as Wine & Beer World in the French channel
ports of Calais, Coquelles and Cherbourg.
Millets
465 - 929 sqm General Retail
Millets, the outdoor sports and equipment chain, is part of the Blacks Leisure group. The
retailer has been in operation for more than a century, selling famous outdoor and travel brands
including Berghaus, Alpine, Eurohike, Coleman and Life Systems.
Peacocks
418 - 697 sqm General Retail
Peacocks is a discount clothing retailer based in Cardiff. Peacocks floated in December 1999.
Its main competitors are Matalan and Primark. Peacocks bought the bonmarche chain in July
2002. Its clothing range is aimed at the 25 - 45 year old customer. Peacocks was established
in 1884. Peacocks currently runs franchises in Turkey, the Middle East, Ukraine and Russia. It
was taken private in 2006 in a £410 million MBO led by chief executive Richard Kirk.
Pets at Home
279 - 1115 sqm General Retail
Pets at Home sells everything you need for your pet, from branded pet foods and accessories
to offering its own in-store veterinary service. The Company was launched in 1991 when
Anthony Preston (chief executive) saw a gap in the market for pet superstores in the UK. In July
2004 Bridgepoint purchased the Company for £230 million.
Phones 4U
28 - 139 sqm General Retail
Phones 4U is one of the UK's leading mobile phone retailers and is a subsidiary of the privately
owned telecommunications company, Caudwell Group. Its first store opened in 1996 and it
grew to 43 outlets within a year. It also launched a store format called 'Phones 4U Extra',
which specialises in gadgets and 'lifestyle' products.
River Island
650 - 1394 sqm General Retail
River Island is part of the Lewis Trust Group, a UK group operating internationally in hotels,
property and finance. It operates a franchise in other countries. As River Island moves back to
profitability in the UK, it is rolling out a new store format which was first trialled in Brent Cross
in 2001.
Starbucks Coffee
Prime/Good Secondary
Starbucks was founded in the US in 1971 and is now one of the leading coffee retailers in the
world. It was not until 1998 that Starbucks Coffee International entered the UK market when it
acquired the 60-unit strong Seattle Coffee Company. Starbucks' mission statement outlines its
objective to establish itself as "the most recognised" brand in the world by expanding its
company-operated retail stores. Martin Coles is chief operating officer. Chief executive is Jim
Donald.

Strada
The Strada brand offers affordable high quality pasta and wood-fired oven pizzas in stylish
surroundings. The chain was purchased from Signature Restaurants in September 2005 for
£60 million. In May 2007, Tragus purchased the chain from Richard Caring for £140 million.
Subway
Prime/Good Secondary
19 - 111 sqm General Retail
General Foods Ltd is trading as Subway. It is a franchise developer of Subway. Subway was
established in 1965 in Connecticut and to date operates over 21,000 units in 73 countries. It
operates on a franchise basis and in 2001, sold around 2,300 franchises globally. Doctor's
Associates Inc (DAI), which is a privately owned company, is the franchiser for Subway. Its
corporate head office is based in the US. In 2005, Entrepreneur Magazine voted Subway "The
World's Number One Franchise".
TK Maxx
Primary
1394 - 3716 sqm General Retail
TK Maxx is part of TJX Companies Inc, one of the world's leading discount retailers. The group
has six operating divisions - TK Maxx in Europe, Winners in Canada, Marshalls, A J Wright,
Homegoods and TJ Maxx in the USA. Its unique concept offers famous label fashion and gifts
for up to 60% less than the high street. With its large store format, the company is seeking to
expand across the UK.
Waitrose
Primary
929 - 3252 sqm General Retail
Waitrose is an upmarket grocer predominantly based within the Southern English heartland. It is
part of the John Lewis Partnership.
WH Smith
232 - sqm General Retail
WH Smith operates within the UK market and also has stores worldwide. The company
currently has three main cores activities: retail, publishing (Hodder Headline) and distribution.
It has also recently launched e-books, which has enabled it to firmly set its sights on multi-
channel retailing.
EDGWARE
HomeSense
929 - 1394 sqm General Retail
HomeSense comes from the TJX family of brands, well known for offering customers great
brands and value. In the new HomeSense stores, shoppers will find a huge choice of stylish,
top quality homeware at great prices.
TK Maxx
Primary
1394 - 3716 sqm General Retail
TK Maxx is part of TJX Companies Inc, one of the world's leading discount retailers. The group
has six operating divisions - TK Maxx in Europe, Winners in Canada, Marshalls, A J Wright,
Homegoods and TJ Maxx in the USA. Its unique concept offers famous label fashion and gifts

for up to 60% less than the high street. With its large store format, the company is seeking
to expand across the UK.
PINNER
Majestic Wine Warehouse
Primary
186 - 465 sqm General Retail
Majestic Wine Warehouse is one of the leading UK retailers of alcoholic drinks, opening its
first warehouse in 1981. It has an annual turnover of more than £175 million. Majestic
operates from over 125 sites in the UK as well as trading as Wine & Beer World in the French
channel ports of Calais, Coquelles and Cherbourg.
STANMORE
Majestic Wine Warehouse
Primary
186 - 465 sqm General Retail
Majestic Wine Warehouse is one of the leading UK retailers of alcoholic drinks, opening its
first warehouse in 1981. It has an annual turnover of more than £175 million. Majestic
operates from over 125 sites in the UK as well as trading as Wine & Beer World in the French
channel ports of Calais, Coquelles and Cherbourg.

Appendix E
Household Survey Results
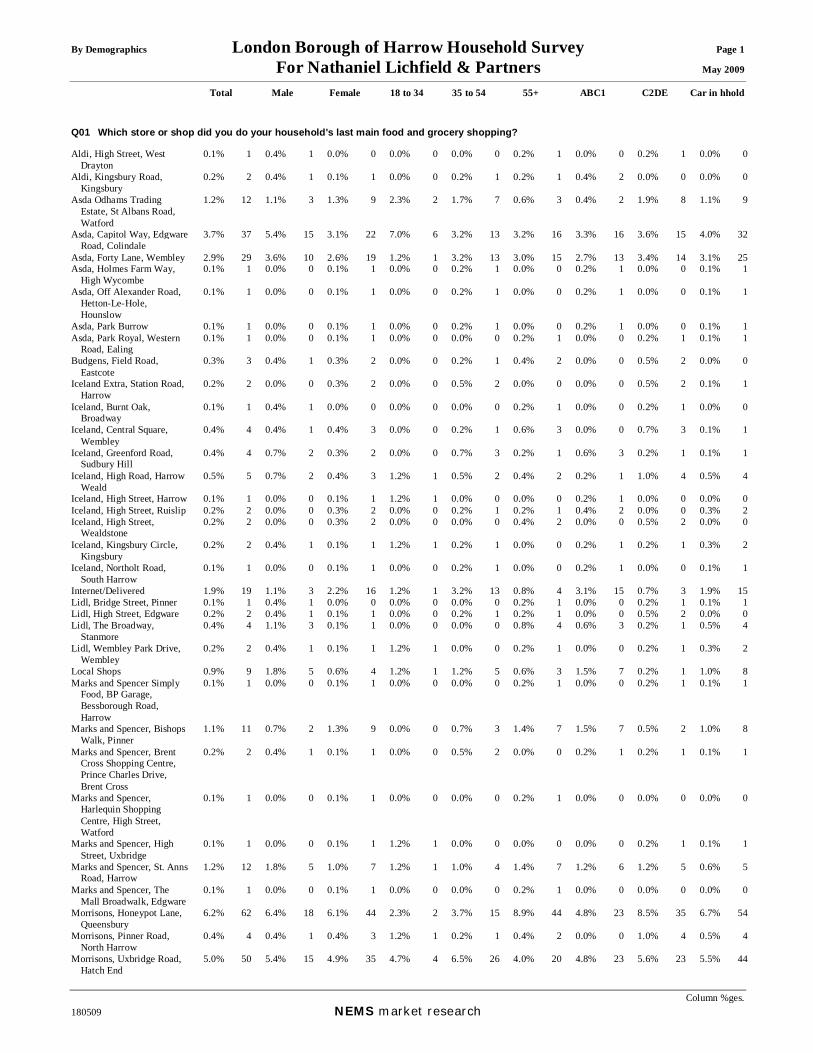
By Demographics London Borough of Harrow Household Survey Page 1 For Nathaniel Lichfield & Partners May 2009
Total Male Female 18 to 34 35 to 54 55+ ABC1 C2DE Car in hhold
Column %ges. 180509 NEMS market research
Q01 Which store or shop did you do your household's last main food and grocery shopping? Aldi, High Street, West
Drayton 0.1% 1 0.4% 1 0.0% 0 0.0% 0 0.0% 0 0.2% 1 0.0% 0 0.2% 1 0.0% 0
Aldi, Kingsbury Road, Kingsbury
0.2% 2 0.4% 1 0.1% 1 0.0% 0 0.2% 1 0.2% 1 0.4% 2 0.0% 0 0.0% 0
Asda Odhams Trading Estate, St Albans Road, Watford
1.2% 12 1.1% 3 1.3% 9 2.3% 2 1.7% 7 0.6% 3 0.4% 2 1.9% 8 1.1% 9
Asda, Capitol Way, Edgware Road, Colindale
3.7% 37 5.4% 15 3.1% 22 7.0% 6 3.2% 13 3.2% 16 3.3% 16 3.6% 15 4.0% 32
Asda, Forty Lane, Wembley 2.9% 29 3.6% 10 2.6% 19 1.2% 1 3.2% 13 3.0% 15 2.7% 13 3.4% 14 3.1% 25Asda, Holmes Farm Way,
High Wycombe 0.1% 1 0.0% 0 0.1% 1 0.0% 0 0.2% 1 0.0% 0 0.2% 1 0.0% 0 0.1% 1
Asda, Off Alexander Road, Hetton-Le-Hole, Hounslow
0.1% 1 0.0% 0 0.1% 1 0.0% 0 0.2% 1 0.0% 0 0.2% 1 0.0% 0 0.1% 1
Asda, Park Burrow 0.1% 1 0.0% 0 0.1% 1 0.0% 0 0.2% 1 0.0% 0 0.2% 1 0.0% 0 0.1% 1Asda, Park Royal, Western
Road, Ealing 0.1% 1 0.0% 0 0.1% 1 0.0% 0 0.0% 0 0.2% 1 0.0% 0 0.2% 1 0.1% 1
Budgens, Field Road, Eastcote
0.3% 3 0.4% 1 0.3% 2 0.0% 0 0.2% 1 0.4% 2 0.0% 0 0.5% 2 0.0% 0
Iceland Extra, Station Road, Harrow
0.2% 2 0.0% 0 0.3% 2 0.0% 0 0.5% 2 0.0% 0 0.0% 0 0.5% 2 0.1% 1
Iceland, Burnt Oak, Broadway
0.1% 1 0.4% 1 0.0% 0 0.0% 0 0.0% 0 0.2% 1 0.0% 0 0.2% 1 0.0% 0
Iceland, Central Square, Wembley
0.4% 4 0.4% 1 0.4% 3 0.0% 0 0.2% 1 0.6% 3 0.0% 0 0.7% 3 0.1% 1
Iceland, Greenford Road, Sudbury Hill
0.4% 4 0.7% 2 0.3% 2 0.0% 0 0.7% 3 0.2% 1 0.6% 3 0.2% 1 0.1% 1
Iceland, High Road, Harrow Weald
0.5% 5 0.7% 2 0.4% 3 1.2% 1 0.5% 2 0.4% 2 0.2% 1 1.0% 4 0.5% 4
Iceland, High Street, Harrow 0.1% 1 0.0% 0 0.1% 1 1.2% 1 0.0% 0 0.0% 0 0.2% 1 0.0% 0 0.0% 0Iceland, High Street, Ruislip 0.2% 2 0.0% 0 0.3% 2 0.0% 0 0.2% 1 0.2% 1 0.4% 2 0.0% 0 0.3% 2Iceland, High Street,
Wealdstone 0.2% 2 0.0% 0 0.3% 2 0.0% 0 0.0% 0 0.4% 2 0.0% 0 0.5% 2 0.0% 0
Iceland, Kingsbury Circle, Kingsbury
0.2% 2 0.4% 1 0.1% 1 1.2% 1 0.2% 1 0.0% 0 0.2% 1 0.2% 1 0.3% 2
Iceland, Northolt Road, South Harrow
0.1% 1 0.0% 0 0.1% 1 0.0% 0 0.2% 1 0.0% 0 0.2% 1 0.0% 0 0.1% 1
Internet/Delivered 1.9% 19 1.1% 3 2.2% 16 1.2% 1 3.2% 13 0.8% 4 3.1% 15 0.7% 3 1.9% 15Lidl, Bridge Street, Pinner 0.1% 1 0.4% 1 0.0% 0 0.0% 0 0.0% 0 0.2% 1 0.0% 0 0.2% 1 0.1% 1Lidl, High Street, Edgware 0.2% 2 0.4% 1 0.1% 1 0.0% 0 0.2% 1 0.2% 1 0.0% 0 0.5% 2 0.0% 0Lidl, The Broadway,
Stanmore 0.4% 4 1.1% 3 0.1% 1 0.0% 0 0.0% 0 0.8% 4 0.6% 3 0.2% 1 0.5% 4
Lidl, Wembley Park Drive, Wembley
0.2% 2 0.4% 1 0.1% 1 1.2% 1 0.0% 0 0.2% 1 0.0% 0 0.2% 1 0.3% 2
Local Shops 0.9% 9 1.8% 5 0.6% 4 1.2% 1 1.2% 5 0.6% 3 1.5% 7 0.2% 1 1.0% 8Marks and Spencer Simply
Food, BP Garage, Bessborough Road, Harrow
0.1% 1 0.0% 0 0.1% 1 0.0% 0 0.0% 0 0.2% 1 0.0% 0 0.2% 1 0.1% 1
Marks and Spencer, Bishops Walk, Pinner
1.1% 11 0.7% 2 1.3% 9 0.0% 0 0.7% 3 1.4% 7 1.5% 7 0.5% 2 1.0% 8
Marks and Spencer, Brent Cross Shopping Centre, Prince Charles Drive, Brent Cross
0.2% 2 0.4% 1 0.1% 1 0.0% 0 0.5% 2 0.0% 0 0.2% 1 0.2% 1 0.1% 1
Marks and Spencer, Harlequin Shopping Centre, High Street, Watford
0.1% 1 0.0% 0 0.1% 1 0.0% 0 0.0% 0 0.2% 1 0.0% 0 0.0% 0 0.0% 0
Marks and Spencer, High Street, Uxbridge
0.1% 1 0.0% 0 0.1% 1 1.2% 1 0.0% 0 0.0% 0 0.0% 0 0.2% 1 0.1% 1
Marks and Spencer, St. Anns Road, Harrow
1.2% 12 1.8% 5 1.0% 7 1.2% 1 1.0% 4 1.4% 7 1.2% 6 1.2% 5 0.6% 5
Marks and Spencer, The Mall Broadwalk, Edgware
0.1% 1 0.0% 0 0.1% 1 0.0% 0 0.0% 0 0.2% 1 0.0% 0 0.0% 0 0.0% 0
Morrisons, Honeypot Lane, Queensbury
6.2% 62 6.4% 18 6.1% 44 2.3% 2 3.7% 15 8.9% 44 4.8% 23 8.5% 35 6.7% 54
Morrisons, Pinner Road, North Harrow
0.4% 4 0.4% 1 0.4% 3 1.2% 1 0.2% 1 0.4% 2 0.0% 0 1.0% 4 0.5% 4
Morrisons, Uxbridge Road, Hatch End
5.0% 50 5.4% 15 4.9% 35 4.7% 4 6.5% 26 4.0% 20 4.8% 23 5.6% 23 5.5% 44
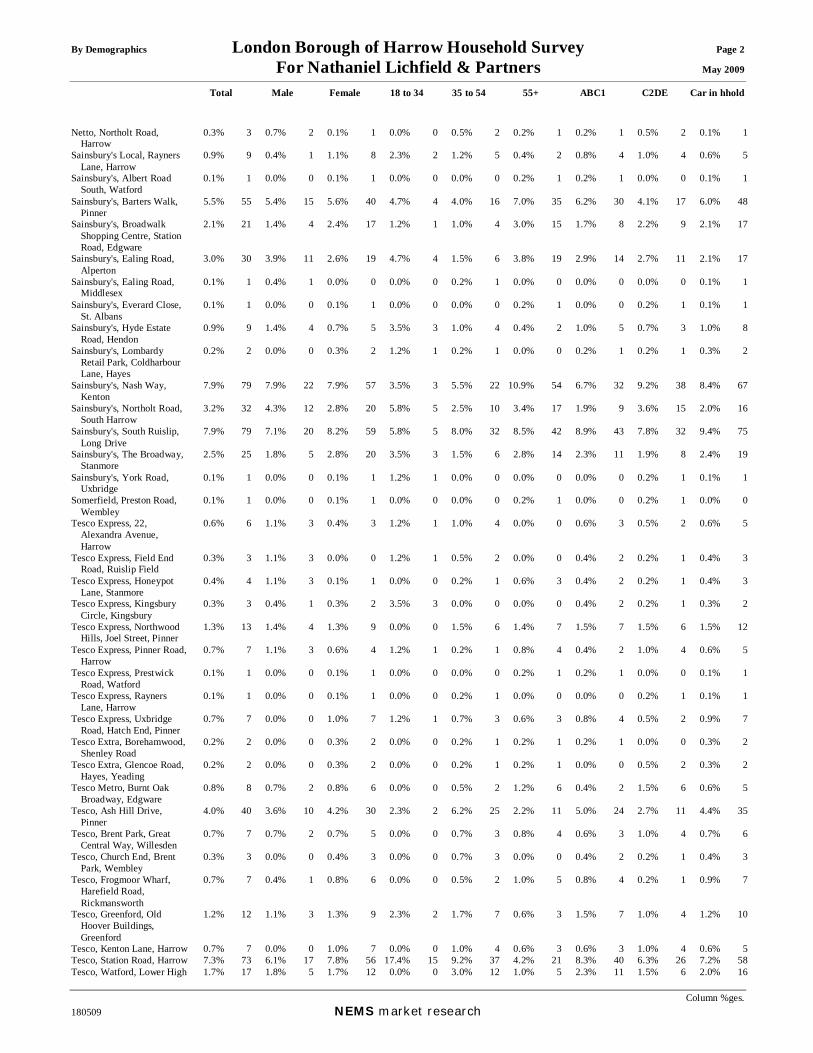
By Demographics London Borough of Harrow Household Survey Page 2 For Nathaniel Lichfield & Partners May 2009
Total Male Female 18 to 34 35 to 54 55+ ABC1 C2DE Car in hhold
Column %ges. 180509 NEMS market research
Netto, Northolt Road, Harrow
0.3% 3 0.7% 2 0.1% 1 0.0% 0 0.5% 2 0.2% 1 0.2% 1 0.5% 2 0.1% 1
Sainsbury's Local, Rayners Lane, Harrow
0.9% 9 0.4% 1 1.1% 8 2.3% 2 1.2% 5 0.4% 2 0.8% 4 1.0% 4 0.6% 5
Sainsbury's, Albert Road South, Watford
0.1% 1 0.0% 0 0.1% 1 0.0% 0 0.0% 0 0.2% 1 0.2% 1 0.0% 0 0.1% 1
Sainsbury's, Barters Walk, Pinner
5.5% 55 5.4% 15 5.6% 40 4.7% 4 4.0% 16 7.0% 35 6.2% 30 4.1% 17 6.0% 48
Sainsbury's, Broadwalk Shopping Centre, Station Road, Edgware
2.1% 21 1.4% 4 2.4% 17 1.2% 1 1.0% 4 3.0% 15 1.7% 8 2.2% 9 2.1% 17
Sainsbury's, Ealing Road, Alperton
3.0% 30 3.9% 11 2.6% 19 4.7% 4 1.5% 6 3.8% 19 2.9% 14 2.7% 11 2.1% 17
Sainsbury's, Ealing Road, Middlesex
0.1% 1 0.4% 1 0.0% 0 0.0% 0 0.2% 1 0.0% 0 0.0% 0 0.0% 0 0.1% 1
Sainsbury's, Everard Close, St. Albans
0.1% 1 0.0% 0 0.1% 1 0.0% 0 0.0% 0 0.2% 1 0.0% 0 0.2% 1 0.1% 1
Sainsbury's, Hyde Estate Road, Hendon
0.9% 9 1.4% 4 0.7% 5 3.5% 3 1.0% 4 0.4% 2 1.0% 5 0.7% 3 1.0% 8
Sainsbury's, Lombardy Retail Park, Coldharbour Lane, Hayes
0.2% 2 0.0% 0 0.3% 2 1.2% 1 0.2% 1 0.0% 0 0.2% 1 0.2% 1 0.3% 2
Sainsbury's, Nash Way, Kenton
7.9% 79 7.9% 22 7.9% 57 3.5% 3 5.5% 22 10.9% 54 6.7% 32 9.2% 38 8.4% 67
Sainsbury's, Northolt Road, South Harrow
3.2% 32 4.3% 12 2.8% 20 5.8% 5 2.5% 10 3.4% 17 1.9% 9 3.6% 15 2.0% 16
Sainsbury's, South Ruislip, Long Drive
7.9% 79 7.1% 20 8.2% 59 5.8% 5 8.0% 32 8.5% 42 8.9% 43 7.8% 32 9.4% 75
Sainsbury's, The Broadway, Stanmore
2.5% 25 1.8% 5 2.8% 20 3.5% 3 1.5% 6 2.8% 14 2.3% 11 1.9% 8 2.4% 19
Sainsbury's, York Road, Uxbridge
0.1% 1 0.0% 0 0.1% 1 1.2% 1 0.0% 0 0.0% 0 0.0% 0 0.2% 1 0.1% 1
Somerfield, Preston Road, Wembley
0.1% 1 0.0% 0 0.1% 1 0.0% 0 0.0% 0 0.2% 1 0.0% 0 0.2% 1 0.0% 0
Tesco Express, 22, Alexandra Avenue, Harrow
0.6% 6 1.1% 3 0.4% 3 1.2% 1 1.0% 4 0.0% 0 0.6% 3 0.5% 2 0.6% 5
Tesco Express, Field End Road, Ruislip Field
0.3% 3 1.1% 3 0.0% 0 1.2% 1 0.5% 2 0.0% 0 0.4% 2 0.2% 1 0.4% 3
Tesco Express, Honeypot Lane, Stanmore
0.4% 4 1.1% 3 0.1% 1 0.0% 0 0.2% 1 0.6% 3 0.4% 2 0.2% 1 0.4% 3
Tesco Express, Kingsbury Circle, Kingsbury
0.3% 3 0.4% 1 0.3% 2 3.5% 3 0.0% 0 0.0% 0 0.4% 2 0.2% 1 0.3% 2
Tesco Express, Northwood Hills, Joel Street, Pinner
1.3% 13 1.4% 4 1.3% 9 0.0% 0 1.5% 6 1.4% 7 1.5% 7 1.5% 6 1.5% 12
Tesco Express, Pinner Road, Harrow
0.7% 7 1.1% 3 0.6% 4 1.2% 1 0.2% 1 0.8% 4 0.4% 2 1.0% 4 0.6% 5
Tesco Express, Prestwick Road, Watford
0.1% 1 0.0% 0 0.1% 1 0.0% 0 0.0% 0 0.2% 1 0.2% 1 0.0% 0 0.1% 1
Tesco Express, Rayners Lane, Harrow
0.1% 1 0.0% 0 0.1% 1 0.0% 0 0.2% 1 0.0% 0 0.0% 0 0.2% 1 0.1% 1
Tesco Express, Uxbridge Road, Hatch End, Pinner
0.7% 7 0.0% 0 1.0% 7 1.2% 1 0.7% 3 0.6% 3 0.8% 4 0.5% 2 0.9% 7
Tesco Extra, Borehamwood, Shenley Road
0.2% 2 0.0% 0 0.3% 2 0.0% 0 0.2% 1 0.2% 1 0.2% 1 0.0% 0 0.3% 2
Tesco Extra, Glencoe Road, Hayes, Yeading
0.2% 2 0.0% 0 0.3% 2 0.0% 0 0.2% 1 0.2% 1 0.0% 0 0.5% 2 0.3% 2
Tesco Metro, Burnt Oak Broadway, Edgware
0.8% 8 0.7% 2 0.8% 6 0.0% 0 0.5% 2 1.2% 6 0.4% 2 1.5% 6 0.6% 5
Tesco, Ash Hill Drive, Pinner
4.0% 40 3.6% 10 4.2% 30 2.3% 2 6.2% 25 2.2% 11 5.0% 24 2.7% 11 4.4% 35
Tesco, Brent Park, Great Central Way, Willesden
0.7% 7 0.7% 2 0.7% 5 0.0% 0 0.7% 3 0.8% 4 0.6% 3 1.0% 4 0.7% 6
Tesco, Church End, Brent Park, Wembley
0.3% 3 0.0% 0 0.4% 3 0.0% 0 0.7% 3 0.0% 0 0.4% 2 0.2% 1 0.4% 3
Tesco, Frogmoor Wharf, Harefield Road, Rickmansworth
0.7% 7 0.4% 1 0.8% 6 0.0% 0 0.5% 2 1.0% 5 0.8% 4 0.2% 1 0.9% 7
Tesco, Greenford, Old Hoover Buildings, Greenford
1.2% 12 1.1% 3 1.3% 9 2.3% 2 1.7% 7 0.6% 3 1.5% 7 1.0% 4 1.2% 10
Tesco, Kenton Lane, Harrow 0.7% 7 0.0% 0 1.0% 7 0.0% 0 1.0% 4 0.6% 3 0.6% 3 1.0% 4 0.6% 5Tesco, Station Road, Harrow 7.3% 73 6.1% 17 7.8% 56 17.4% 15 9.2% 37 4.2% 21 8.3% 40 6.3% 26 7.2% 58Tesco, Watford, Lower High 1.7% 17 1.8% 5 1.7% 12 0.0% 0 3.0% 12 1.0% 5 2.3% 11 1.5% 6 2.0% 16

By Demographics London Borough of Harrow Household Survey Page 3 For Nathaniel Lichfield & Partners May 2009
Total Male Female 18 to 34 35 to 54 55+ ABC1 C2DE Car in hhold
Column %ges. 180509 NEMS market research
Street, Watford Tesco, Wrekin Retail Park,
Arleston, Telford 0.1% 1 0.4% 1 0.0% 0 0.0% 0 0.2% 1 0.0% 0 0.2% 1 0.0% 0 0.1% 1
Waitrose, Brent Cross Shopping Centre, Prince Charles Drive, Brent Cross
0.1% 1 0.0% 0 0.1% 1 0.0% 0 0.0% 0 0.2% 1 0.2% 1 0.0% 0 0.1% 1
Waitrose, Finchley Road, Camden
0.1% 1 0.4% 1 0.0% 0 0.0% 0 0.0% 0 0.2% 1 0.2% 1 0.0% 0 0.0% 0
Waitrose, Green Lane, Northwood
2.5% 25 1.8% 5 2.8% 20 1.2% 1 2.2% 9 2.6% 13 2.7% 13 1.5% 6 2.5% 20
Waitrose, High Road, Harrow Weald
3.4% 34 1.8% 5 4.0% 29 0.0% 0 2.7% 11 4.6% 23 2.3% 11 4.6% 19 2.9% 23
Waitrose, Kingsend, Ruislip 1.8% 18 2.1% 6 1.7% 12 1.2% 1 2.2% 9 1.6% 8 2.3% 11 1.7% 7 2.1% 17Waitrose, Northolt Road,
South Harrow 4.2% 42 3.9% 11 4.3% 31 1.2% 1 5.7% 23 3.6% 18 6.0% 29 2.7% 11 4.4% 35
Waitrose, The Spires Shopping Centre, High Street, Barnet
0.1% 1 0.0% 0 0.1% 1 0.0% 0 0.2% 1 0.0% 0 0.2% 1 0.0% 0 0.1% 1
(Don't do main food shopping / can't remember / refused)
1.1% 11 1.1% 3 1.1% 8 1.2% 1 1.2% 5 1.0% 5 0.8% 4 1.7% 7 0.7% 6
Base: 1000 280 720 86 402 497 481 412 801 Q02 How did you travel to do your last main food shopping trip? Those who travel to do their main food shopping at Q01: Car - driver 61.1% 593 69.0% 189 58.0% 404 57.1% 48 73.7% 283 51.8% 253 69.3% 320 53.5% 215 73.7% 575Car - passenger 15.9% 154 4.7% 13 20.3% 141 11.9% 10 10.7% 41 20.9% 102 12.3% 57 19.9% 80 14.2% 111Bus / Coach 7.8% 76 7.3% 20 8.0% 56 7.1% 6 1.8% 7 12.7% 62 5.2% 24 10.2% 41 3.1% 24Train 0.2% 2 0.0% 0 0.3% 2 1.2% 1 0.0% 0 0.2% 1 0.2% 1 0.2% 1 0.0% 0Tube / Underground 0.3% 3 0.4% 1 0.3% 2 0.0% 0 0.0% 0 0.6% 3 0.4% 2 0.2% 1 0.3% 2Taxi 0.7% 7 0.0% 0 1.0% 7 1.2% 1 0.0% 0 1.2% 6 0.2% 1 0.7% 3 0.0% 0Walk 12.6% 122 15.0% 41 11.6% 81 19.0% 16 11.7% 45 11.9% 58 10.2% 47 14.4% 58 7.7% 60Bicycle 0.5% 5 1.5% 4 0.1% 1 0.0% 0 1.3% 5 0.0% 0 0.9% 4 0.2% 1 0.4% 3Other 0.4% 4 1.1% 3 0.1% 1 0.0% 0 0.3% 1 0.6% 3 0.6% 3 0.2% 1 0.1% 1(Don't know / can't
remember) 0.4% 4 1.1% 3 0.1% 1 2.4% 2 0.5% 2 0.0% 0 0.6% 3 0.2% 1 0.5% 4
Base: 970 274 696 84 384 488 462 402 780
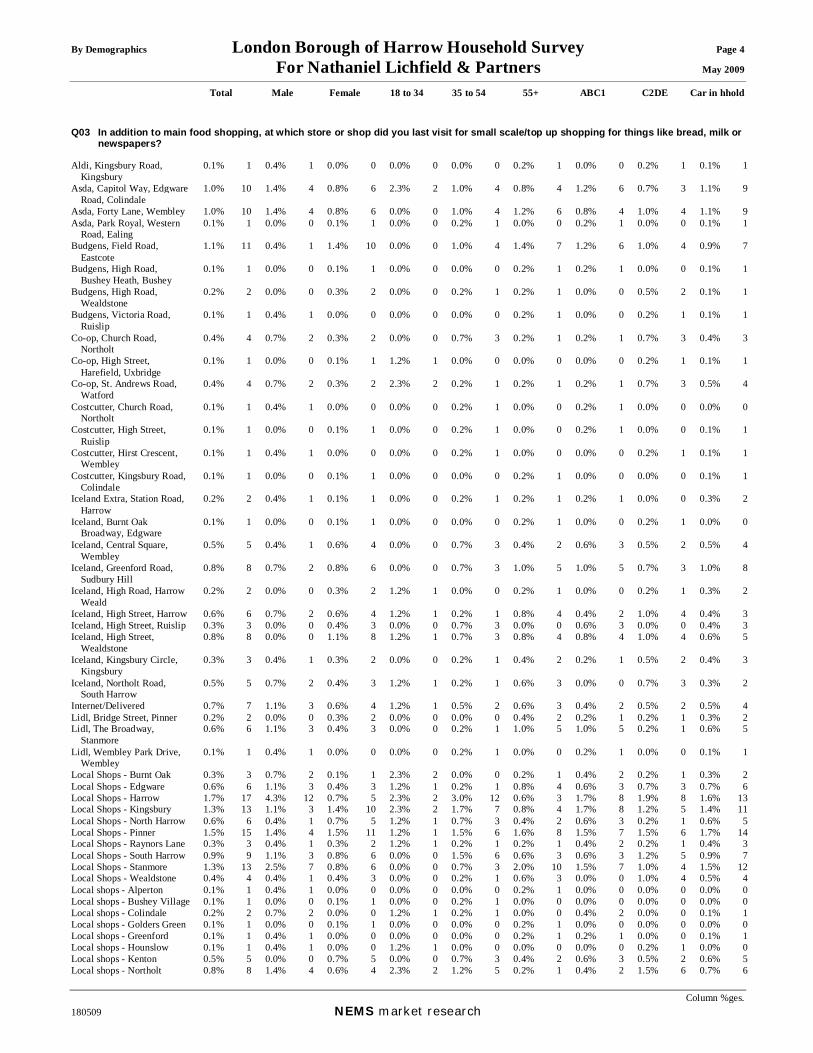
By Demographics London Borough of Harrow Household Survey Page 4 For Nathaniel Lichfield & Partners May 2009
Total Male Female 18 to 34 35 to 54 55+ ABC1 C2DE Car in hhold
Column %ges. 180509 NEMS market research
Q03 In addition to main food shopping, at which store or shop did you last visit for small scale/top up shopping for things like bread, milk or newspapers?
Aldi, Kingsbury Road,
Kingsbury 0.1% 1 0.4% 1 0.0% 0 0.0% 0 0.0% 0 0.2% 1 0.0% 0 0.2% 1 0.1% 1
Asda, Capitol Way, Edgware Road, Colindale
1.0% 10 1.4% 4 0.8% 6 2.3% 2 1.0% 4 0.8% 4 1.2% 6 0.7% 3 1.1% 9
Asda, Forty Lane, Wembley 1.0% 10 1.4% 4 0.8% 6 0.0% 0 1.0% 4 1.2% 6 0.8% 4 1.0% 4 1.1% 9Asda, Park Royal, Western
Road, Ealing 0.1% 1 0.0% 0 0.1% 1 0.0% 0 0.2% 1 0.0% 0 0.2% 1 0.0% 0 0.1% 1
Budgens, Field Road, Eastcote
1.1% 11 0.4% 1 1.4% 10 0.0% 0 1.0% 4 1.4% 7 1.2% 6 1.0% 4 0.9% 7
Budgens, High Road, Bushey Heath, Bushey
0.1% 1 0.0% 0 0.1% 1 0.0% 0 0.0% 0 0.2% 1 0.2% 1 0.0% 0 0.1% 1
Budgens, High Road, Wealdstone
0.2% 2 0.0% 0 0.3% 2 0.0% 0 0.2% 1 0.2% 1 0.0% 0 0.5% 2 0.1% 1
Budgens, Victoria Road, Ruislip
0.1% 1 0.4% 1 0.0% 0 0.0% 0 0.0% 0 0.2% 1 0.0% 0 0.2% 1 0.1% 1
Co-op, Church Road, Northolt
0.4% 4 0.7% 2 0.3% 2 0.0% 0 0.7% 3 0.2% 1 0.2% 1 0.7% 3 0.4% 3
Co-op, High Street, Harefield, Uxbridge
0.1% 1 0.0% 0 0.1% 1 1.2% 1 0.0% 0 0.0% 0 0.0% 0 0.2% 1 0.1% 1
Co-op, St. Andrews Road, Watford
0.4% 4 0.7% 2 0.3% 2 2.3% 2 0.2% 1 0.2% 1 0.2% 1 0.7% 3 0.5% 4
Costcutter, Church Road, Northolt
0.1% 1 0.4% 1 0.0% 0 0.0% 0 0.2% 1 0.0% 0 0.2% 1 0.0% 0 0.0% 0
Costcutter, High Street, Ruislip
0.1% 1 0.0% 0 0.1% 1 0.0% 0 0.2% 1 0.0% 0 0.2% 1 0.0% 0 0.1% 1
Costcutter, Hirst Crescent, Wembley
0.1% 1 0.4% 1 0.0% 0 0.0% 0 0.2% 1 0.0% 0 0.0% 0 0.2% 1 0.1% 1
Costcutter, Kingsbury Road, Colindale
0.1% 1 0.0% 0 0.1% 1 0.0% 0 0.0% 0 0.2% 1 0.0% 0 0.0% 0 0.1% 1
Iceland Extra, Station Road, Harrow
0.2% 2 0.4% 1 0.1% 1 0.0% 0 0.2% 1 0.2% 1 0.2% 1 0.0% 0 0.3% 2
Iceland, Burnt Oak Broadway, Edgware
0.1% 1 0.0% 0 0.1% 1 0.0% 0 0.0% 0 0.2% 1 0.0% 0 0.2% 1 0.0% 0
Iceland, Central Square, Wembley
0.5% 5 0.4% 1 0.6% 4 0.0% 0 0.7% 3 0.4% 2 0.6% 3 0.5% 2 0.5% 4
Iceland, Greenford Road, Sudbury Hill
0.8% 8 0.7% 2 0.8% 6 0.0% 0 0.7% 3 1.0% 5 1.0% 5 0.7% 3 1.0% 8
Iceland, High Road, Harrow Weald
0.2% 2 0.0% 0 0.3% 2 1.2% 1 0.0% 0 0.2% 1 0.0% 0 0.2% 1 0.3% 2
Iceland, High Street, Harrow 0.6% 6 0.7% 2 0.6% 4 1.2% 1 0.2% 1 0.8% 4 0.4% 2 1.0% 4 0.4% 3Iceland, High Street, Ruislip 0.3% 3 0.0% 0 0.4% 3 0.0% 0 0.7% 3 0.0% 0 0.6% 3 0.0% 0 0.4% 3Iceland, High Street,
Wealdstone 0.8% 8 0.0% 0 1.1% 8 1.2% 1 0.7% 3 0.8% 4 0.8% 4 1.0% 4 0.6% 5
Iceland, Kingsbury Circle, Kingsbury
0.3% 3 0.4% 1 0.3% 2 0.0% 0 0.2% 1 0.4% 2 0.2% 1 0.5% 2 0.4% 3
Iceland, Northolt Road, South Harrow
0.5% 5 0.7% 2 0.4% 3 1.2% 1 0.2% 1 0.6% 3 0.0% 0 0.7% 3 0.3% 2
Internet/Delivered 0.7% 7 1.1% 3 0.6% 4 1.2% 1 0.5% 2 0.6% 3 0.4% 2 0.5% 2 0.5% 4Lidl, Bridge Street, Pinner 0.2% 2 0.0% 0 0.3% 2 0.0% 0 0.0% 0 0.4% 2 0.2% 1 0.2% 1 0.3% 2Lidl, The Broadway,
Stanmore 0.6% 6 1.1% 3 0.4% 3 0.0% 0 0.2% 1 1.0% 5 1.0% 5 0.2% 1 0.6% 5
Lidl, Wembley Park Drive, Wembley
0.1% 1 0.4% 1 0.0% 0 0.0% 0 0.2% 1 0.0% 0 0.2% 1 0.0% 0 0.1% 1
Local Shops - Burnt Oak 0.3% 3 0.7% 2 0.1% 1 2.3% 2 0.0% 0 0.2% 1 0.4% 2 0.2% 1 0.3% 2Local Shops - Edgware 0.6% 6 1.1% 3 0.4% 3 1.2% 1 0.2% 1 0.8% 4 0.6% 3 0.7% 3 0.7% 6Local Shops - Harrow 1.7% 17 4.3% 12 0.7% 5 2.3% 2 3.0% 12 0.6% 3 1.7% 8 1.9% 8 1.6% 13Local Shops - Kingsbury 1.3% 13 1.1% 3 1.4% 10 2.3% 2 1.7% 7 0.8% 4 1.7% 8 1.2% 5 1.4% 11Local Shops - North Harrow 0.6% 6 0.4% 1 0.7% 5 1.2% 1 0.7% 3 0.4% 2 0.6% 3 0.2% 1 0.6% 5Local Shops - Pinner 1.5% 15 1.4% 4 1.5% 11 1.2% 1 1.5% 6 1.6% 8 1.5% 7 1.5% 6 1.7% 14Local Shops - Raynors Lane 0.3% 3 0.4% 1 0.3% 2 1.2% 1 0.2% 1 0.2% 1 0.4% 2 0.2% 1 0.4% 3Local Shops - South Harrow 0.9% 9 1.1% 3 0.8% 6 0.0% 0 1.5% 6 0.6% 3 0.6% 3 1.2% 5 0.9% 7Local Shops - Stanmore 1.3% 13 2.5% 7 0.8% 6 0.0% 0 0.7% 3 2.0% 10 1.5% 7 1.0% 4 1.5% 12Local Shops - Wealdstone 0.4% 4 0.4% 1 0.4% 3 0.0% 0 0.2% 1 0.6% 3 0.0% 0 1.0% 4 0.5% 4Local shops - Alperton 0.1% 1 0.4% 1 0.0% 0 0.0% 0 0.0% 0 0.2% 1 0.0% 0 0.0% 0 0.0% 0Local shops - Bushey Village 0.1% 1 0.0% 0 0.1% 1 0.0% 0 0.2% 1 0.0% 0 0.0% 0 0.0% 0 0.0% 0Local shops - Colindale 0.2% 2 0.7% 2 0.0% 0 1.2% 1 0.2% 1 0.0% 0 0.4% 2 0.0% 0 0.1% 1Local shops - Golders Green 0.1% 1 0.0% 0 0.1% 1 0.0% 0 0.0% 0 0.2% 1 0.0% 0 0.0% 0 0.0% 0Local shops - Greenford 0.1% 1 0.4% 1 0.0% 0 0.0% 0 0.0% 0 0.2% 1 0.2% 1 0.0% 0 0.1% 1Local shops - Hounslow 0.1% 1 0.4% 1 0.0% 0 1.2% 1 0.0% 0 0.0% 0 0.0% 0 0.2% 1 0.0% 0Local shops - Kenton 0.5% 5 0.0% 0 0.7% 5 0.0% 0 0.7% 3 0.4% 2 0.6% 3 0.5% 2 0.6% 5Local shops - Northolt 0.8% 8 1.4% 4 0.6% 4 2.3% 2 1.2% 5 0.2% 1 0.4% 2 1.5% 6 0.7% 6

By Demographics London Borough of Harrow Household Survey Page 5 For Nathaniel Lichfield & Partners May 2009
Total Male Female 18 to 34 35 to 54 55+ ABC1 C2DE Car in hhold
Column %ges. 180509 NEMS market research
Local shops - Northwood 0.4% 4 0.4% 1 0.4% 3 1.2% 1 0.5% 2 0.2% 1 0.4% 2 0.5% 2 0.4% 3Local shops - Queensbury,
Ealing 0.2% 2 0.4% 1 0.1% 1 0.0% 0 0.2% 1 0.2% 1 0.2% 1 0.2% 1 0.3% 2
Local shops - Ruislip 0.5% 5 0.7% 2 0.4% 3 2.3% 2 0.5% 2 0.2% 1 0.6% 3 0.5% 2 0.6% 5Local shops - Ruislip Manor,
Hillingdon 0.1% 1 0.0% 0 0.1% 1 0.0% 0 0.2% 1 0.0% 0 0.2% 1 0.0% 0 0.1% 1
Local shops - South Oxney 0.5% 5 0.4% 1 0.6% 4 0.0% 0 0.7% 3 0.4% 2 0.4% 2 0.5% 2 0.5% 4Local shops - Sudbury Hill 0.4% 4 0.7% 2 0.3% 2 2.3% 2 0.2% 1 0.2% 1 0.6% 3 0.2% 1 0.3% 2Local shops - Wembley 0.9% 9 1.4% 4 0.7% 5 0.0% 0 0.5% 2 1.4% 7 0.4% 2 1.5% 6 0.9% 7Londis, East Lane, Wembley 0.1% 1 0.0% 0 0.1% 1 0.0% 0 0.2% 1 0.0% 0 0.0% 0 0.2% 1 0.1% 1Marks and Spencer Simply
Food, BP Garage, Bessborough Road, Harrow
0.6% 6 0.4% 1 0.7% 5 0.0% 0 0.5% 2 0.8% 4 0.8% 4 0.5% 2 0.4% 3
Marks and Spencer Simply Food, Ruislip High Street, Ruislip
0.8% 8 0.4% 1 1.0% 7 0.0% 0 0.7% 3 1.0% 5 1.2% 6 0.2% 1 1.0% 8
Marks and Spencer, Bishops Walk, Pinner
2.1% 21 1.8% 5 2.2% 16 0.0% 0 2.7% 11 1.8% 9 2.5% 12 1.5% 6 2.5% 20
Marks and Spencer, Brent Cross Shopping Centre, Prince Charles Drive, Brent Cross
0.1% 1 0.0% 0 0.1% 1 0.0% 0 0.0% 0 0.0% 0 0.0% 0 0.0% 0 0.1% 1
Marks and Spencer, Broadwalk Shopping Centre, Station Road, Edgware
0.1% 1 0.0% 0 0.1% 1 0.0% 0 0.0% 0 0.2% 1 0.0% 0 0.0% 0 0.0% 0
Marks and Spencer, Colney Fields Shopping Park, London Colney, St. Albans
0.1% 1 0.0% 0 0.1% 1 0.0% 0 0.2% 1 0.0% 0 0.0% 0 0.0% 0 0.1% 1
Marks and Spencer, Harlequin Shopping Centre, High Street, Watford
0.1% 1 0.0% 0 0.1% 1 0.0% 0 0.2% 1 0.0% 0 0.2% 1 0.0% 0 0.1% 1
Marks and Spencer, High Street, Rickmansworth
0.1% 1 0.0% 0 0.1% 1 0.0% 0 0.2% 1 0.0% 0 0.2% 1 0.0% 0 0.1% 1
Marks and Spencer, Long Acre, Covent Garden
0.1% 1 0.0% 0 0.1% 1 0.0% 0 0.2% 1 0.0% 0 0.2% 1 0.0% 0 0.1% 1
Marks and Spencer, Shenley Road, Borehamwood
0.1% 1 0.0% 0 0.1% 1 1.2% 1 0.0% 0 0.0% 0 0.2% 1 0.0% 0 0.0% 0
Marks and Spencer, Simply Food, BP Garage, Northolt Park, Potts Hill
0.2% 2 0.4% 1 0.1% 1 1.2% 1 0.2% 1 0.0% 0 0.4% 2 0.0% 0 0.3% 2
Marks and Spencer, St. Anns Road, Harrow
2.3% 23 0.4% 1 3.1% 22 0.0% 0 1.5% 6 3.4% 17 2.5% 12 2.4% 10 2.0% 16
Marks and Spencer, Sunbury Cross Centre, Staines Road West, Sunbury-on-Thames
0.1% 1 0.0% 0 0.1% 1 0.0% 0 0.2% 1 0.0% 0 0.2% 1 0.0% 0 0.1% 1
Marks and Spencer, The Broadway, Ealing
0.2% 2 0.0% 0 0.3% 2 0.0% 0 0.2% 1 0.2% 1 0.2% 1 0.2% 1 0.3% 2
Morrisons, Honeypot Lane, Queensbury
3.8% 38 4.6% 13 3.5% 25 2.3% 2 3.5% 14 4.4% 22 2.5% 12 5.6% 23 4.2% 34
Morrisons, Pinner Road, North Harrow
0.1% 1 0.0% 0 0.1% 1 0.0% 0 0.0% 0 0.2% 1 0.0% 0 0.2% 1 0.1% 1
Morrisons, Uxbridge Road, Hatch End
2.4% 24 1.4% 4 2.8% 20 0.0% 0 3.2% 13 2.2% 11 2.5% 12 2.2% 9 2.2% 18
Netto, Northolt Road, Harrow
0.1% 1 0.0% 0 0.1% 1 0.0% 0 0.2% 1 0.0% 0 0.0% 0 0.2% 1 0.1% 1
Premier Stores, Court Parade, East Lane, North Wembley
0.1% 1 0.0% 0 0.1% 1 1.2% 1 0.0% 0 0.0% 0 0.2% 1 0.0% 0 0.0% 0
Sainsbury's Local, Rayners Lane, Harrow
0.5% 5 0.0% 0 0.7% 5 1.2% 1 0.5% 2 0.4% 2 0.8% 4 0.2% 1 0.6% 5
Sainsbury's, Barters Walk, Pinner
2.0% 20 1.4% 4 2.2% 16 3.5% 3 1.7% 7 2.0% 10 3.1% 15 0.7% 3 2.4% 19
Sainsbury's, Broadwalk Shopping Centre, Station Road, Edgware
1.6% 16 1.4% 4 1.7% 12 1.2% 1 0.7% 3 2.2% 11 1.5% 7 1.5% 6 1.7% 14
Sainsbury's, Draycott Avenue, Harrow
0.2% 2 0.0% 0 0.3% 2 0.0% 0 0.2% 1 0.2% 1 0.2% 1 0.2% 1 0.3% 2
Sainsbury's, Ealing Road, Alperton
0.8% 8 0.7% 2 0.8% 6 0.0% 0 0.0% 0 1.4% 7 0.8% 4 0.5% 2 0.5% 4

By Demographics London Borough of Harrow Household Survey Page 6 For Nathaniel Lichfield & Partners May 2009
Total Male Female 18 to 34 35 to 54 55+ ABC1 C2DE Car in hhold
Column %ges. 180509 NEMS market research
Sainsbury's, Hyde Estate Road, Hendon
0.4% 4 0.0% 0 0.6% 4 1.2% 1 0.5% 2 0.2% 1 0.2% 1 0.5% 2 0.5% 4
Sainsbury's, Lombardy Retail Park, Coldharbour Lane, Hayes
0.2% 2 0.0% 0 0.3% 2 0.0% 0 0.5% 2 0.0% 0 0.4% 2 0.0% 0 0.3% 2
Sainsbury's, Nash Way, Kenton
3.1% 31 3.6% 10 2.9% 21 1.2% 1 3.2% 13 3.4% 17 2.7% 13 2.9% 12 3.1% 25
Sainsbury's, Northolt Road, South Harrow
1.1% 11 1.1% 3 1.1% 8 1.2% 1 1.5% 6 0.8% 4 0.8% 4 1.5% 6 1.1% 9
Sainsbury's, South Ruislip, Long Drive
1.8% 18 1.8% 5 1.8% 13 0.0% 0 3.2% 13 1.0% 5 2.3% 11 1.7% 7 2.1% 17
Sainsbury's, The Broadway, Stanmore
1.6% 16 0.7% 2 1.9% 14 0.0% 0 1.0% 4 2.0% 10 2.1% 10 1.0% 4 1.4% 11
Somerfield, Carpenters Park, Watford
0.1% 1 0.4% 1 0.0% 0 0.0% 0 0.2% 1 0.0% 0 0.0% 0 0.2% 1 0.1% 1
Somerfield, Pinner Road, North Harrow
0.2% 2 0.0% 0 0.3% 2 0.0% 0 0.0% 0 0.2% 1 0.0% 0 0.5% 2 0.1% 1
Somerfield, Preston Road, Wembley
0.6% 6 1.4% 4 0.3% 2 0.0% 0 0.2% 1 1.0% 5 0.8% 4 0.5% 2 0.5% 4
Spar, Marsh Road, Pinner 0.2% 2 0.0% 0 0.3% 2 1.2% 1 0.2% 1 0.0% 0 0.0% 0 0.5% 2 0.3% 2Tesco Express, 22,
Alexandra Avenue, Harrow
0.4% 4 0.7% 2 0.3% 2 2.3% 2 0.2% 1 0.2% 1 0.4% 2 0.5% 2 0.5% 4
Tesco Express, 386, Alexandra Avenue,Harrow
0.4% 4 0.7% 2 0.3% 2 0.0% 0 0.0% 0 0.8% 4 0.6% 3 0.2% 1 0.3% 2
Tesco Express, Field End Road, Eastcote
1.3% 13 1.4% 4 1.3% 9 0.0% 0 1.7% 7 1.2% 6 1.2% 6 1.2% 5 1.5% 12
Tesco Express, Field End Road, Ruislip Field
0.6% 6 1.1% 3 0.4% 3 0.0% 0 1.0% 4 0.4% 2 0.8% 4 0.2% 1 0.7% 6
Tesco Express, Honeypot Lane, Stanmore
0.2% 2 0.0% 0 0.3% 2 0.0% 0 0.2% 1 0.2% 1 0.4% 2 0.0% 0 0.3% 2
Tesco Express, Kingsbury Circle, Kingsbury
0.3% 3 0.4% 1 0.3% 2 2.3% 2 0.0% 0 0.2% 1 0.6% 3 0.0% 0 0.4% 3
Tesco Express, Northwood Hills, Joel Street, Pinner
0.5% 5 0.7% 2 0.4% 3 0.0% 0 1.0% 4 0.2% 1 0.4% 2 0.7% 3 0.6% 5
Tesco Express, Park Way, Ruislip
0.3% 3 0.7% 2 0.1% 1 1.2% 1 0.2% 1 0.2% 1 0.4% 2 0.2% 1 0.4% 3
Tesco Express, Pinner Road, Harrow
1.0% 10 0.7% 2 1.1% 8 2.3% 2 1.2% 5 0.4% 2 1.2% 6 1.0% 4 1.0% 8
Tesco Express, Prestwick Road, Watford
0.2% 2 0.4% 1 0.1% 1 0.0% 0 0.5% 2 0.0% 0 0.0% 0 0.5% 2 0.3% 2
Tesco Express, The Parade, Haven Green, Ealing
0.3% 3 0.4% 1 0.3% 2 0.0% 0 0.7% 3 0.0% 0 0.4% 2 0.2% 1 0.4% 3
Tesco Express, Uxbridge Road, Hatch End, Pinner
0.8% 8 1.1% 3 0.7% 5 1.2% 1 1.2% 5 0.4% 2 1.2% 6 0.5% 2 1.0% 8
Tesco Extra, Glencoe Road, Hayes, Yeading
0.1% 1 0.0% 0 0.1% 1 0.0% 0 0.2% 1 0.0% 0 0.0% 0 0.2% 1 0.1% 1
Tesco Metro, Burnt Oak Broadway, Edgware
0.4% 4 0.4% 1 0.4% 3 0.0% 0 0.0% 0 0.8% 4 0.0% 0 1.0% 4 0.4% 3
Tesco, Ash Hill Drive, Pinner
1.7% 17 1.4% 4 1.8% 13 0.0% 0 1.7% 7 1.8% 9 1.9% 9 1.5% 6 1.7% 14
Tesco, Brent Park, Great Central Way, Willesden
0.2% 2 0.7% 2 0.0% 0 0.0% 0 0.2% 1 0.2% 1 0.4% 2 0.0% 0 0.3% 2
Tesco, Frogmoor Wharf, Harefield Road, Rickmansworth
0.5% 5 0.0% 0 0.7% 5 0.0% 0 1.0% 4 0.2% 1 1.0% 5 0.0% 0 0.6% 5
Tesco, Greenford, Old Hoover Buildings, Greenford
0.2% 2 0.0% 0 0.3% 2 1.2% 1 0.2% 1 0.0% 0 0.4% 2 0.0% 0 0.3% 2
Tesco, High Street, Feltham 0.1% 1 0.0% 0 0.1% 1 1.2% 1 0.0% 0 0.0% 0 0.0% 0 0.2% 1 0.1% 1Tesco, Kenton Lane, Harrow 2.0% 20 1.1% 3 2.4% 17 2.3% 2 2.7% 11 1.4% 7 2.1% 10 1.9% 8 2.0% 16Tesco, Long Lane,
Southwark 0.1% 1 0.4% 1 0.0% 0 0.0% 0 0.2% 1 0.0% 0 0.0% 0 0.2% 1 0.1% 1
Tesco, Station Road, Harrow 2.1% 21 1.4% 4 2.4% 17 5.8% 5 3.5% 14 0.4% 2 3.3% 16 1.0% 4 2.1% 17Tesco, Watford, Lower High
Street, Watford 0.7% 7 0.7% 2 0.7% 5 2.3% 2 0.5% 2 0.6% 3 0.6% 3 0.7% 3 0.9% 7
Waitrose, Brent Cross Shopping Centre, Prince Charles Drive, Brent Cross
0.2% 2 0.4% 1 0.1% 1 0.0% 0 0.0% 0 0.4% 2 0.0% 0 0.5% 2 0.1% 1
Waitrose, Green Lane, Northwood
2.2% 22 2.5% 7 2.1% 15 1.2% 1 2.0% 8 2.4% 12 2.7% 13 1.2% 5 2.6% 21
Waitrose, High Road, Harrow Weald
2.4% 24 1.8% 5 2.6% 19 1.2% 1 1.5% 6 3.2% 16 1.7% 8 3.2% 13 2.7% 22
Waitrose, Kingsend, Ruislip 1.3% 13 1.1% 3 1.4% 10 0.0% 0 1.5% 6 1.2% 6 1.7% 8 1.0% 4 1.5% 12

By Demographics London Borough of Harrow Household Survey Page 7 For Nathaniel Lichfield & Partners May 2009
Total Male Female 18 to 34 35 to 54 55+ ABC1 C2DE Car in hhold
Column %ges. 180509 NEMS market research
Waitrose, Northolt Road, South Harrow
2.7% 27 2.9% 8 2.6% 19 1.2% 1 4.2% 17 1.8% 9 4.2% 20 1.5% 6 2.9% 23
Waitrose, The Spires Shopping Centre, High Street, Barnet
0.1% 1 0.0% 0 0.1% 1 0.0% 0 0.2% 1 0.0% 0 0.2% 1 0.0% 0 0.0% 0
(Don't do top-up shopping / can't remember / refused)
23.9% 239 23.2% 65 24.2% 174 24.4% 21 17.9% 72 29.0% 144 18.3% 88 28.6% 118 20.5% 164
Base: 1000 280 720 86 402 497 481 412 801 Q04 Where do you do most of your household's non-food shopping? Alperton 0.2% 2 0.4% 1 0.1% 1 1.2% 1 0.0% 0 0.2% 1 0.2% 1 0.2% 1 0.1% 1Bournemouth 0.1% 1 0.0% 0 0.1% 1 0.0% 0 0.2% 1 0.0% 0 0.0% 0 0.2% 1 0.1% 1Brent Cross 5.8% 58 6.1% 17 5.7% 41 4.7% 4 5.7% 23 5.8% 29 6.9% 33 3.2% 13 6.5% 52Burnt Oak 0.2% 2 0.4% 1 0.1% 1 0.0% 0 0.2% 1 0.2% 1 0.2% 1 0.2% 1 0.1% 1Bushey, Hertfordshire 0.1% 1 0.0% 0 0.1% 1 0.0% 0 0.0% 0 0.2% 1 0.0% 0 0.2% 1 0.1% 1Central London/ West End 4.2% 42 4.6% 13 4.0% 29 10.5% 9 2.2% 9 4.8% 24 4.6% 22 3.2% 13 4.0% 32Colindale 0.8% 8 1.1% 3 0.7% 5 3.5% 3 0.7% 3 0.2% 1 1.0% 5 0.7% 3 0.7% 6Ealing 0.1% 1 0.0% 0 0.1% 1 0.0% 0 0.2% 1 0.0% 0 0.2% 1 0.0% 0 0.1% 1Eastcote 0.8% 8 1.4% 4 0.6% 4 0.0% 0 0.7% 3 1.0% 5 0.8% 4 0.7% 3 0.6% 5Edgware 3.9% 39 5.0% 14 3.5% 25 3.5% 3 1.5% 6 5.8% 29 2.7% 13 5.6% 23 3.5% 28Enfield 0.1% 1 0.4% 1 0.0% 0 0.0% 0 0.0% 0 0.2% 1 0.0% 0 0.2% 1 0.0% 0Greenford 0.2% 2 0.0% 0 0.3% 2 1.2% 1 0.2% 1 0.0% 0 0.0% 0 0.5% 2 0.3% 2Gunwharf Quays,
Portsmouth 0.1% 1 0.0% 0 0.1% 1 1.2% 1 0.0% 0 0.0% 0 0.0% 0 0.2% 1 0.1% 1
Harrow 35.8% 358 35.4% 99 36.0% 259 45.3% 39 36.1% 145 33.8% 168 34.5% 166 37.9% 156 33.7% 270Harrow Weald 0.1% 1 0.0% 0 0.1% 1 0.0% 0 0.0% 0 0.2% 1 0.0% 0 0.0% 0 0.1% 1Hatch End 0.2% 2 0.0% 0 0.3% 2 0.0% 0 0.2% 1 0.2% 1 0.2% 1 0.2% 1 0.1% 1Hatfield, Hertfordshire 0.1% 1 0.0% 0 0.1% 1 0.0% 0 0.2% 1 0.0% 0 0.2% 1 0.0% 0 0.1% 1Hayes 0.1% 1 0.4% 1 0.0% 0 0.0% 0 0.2% 1 0.0% 0 0.0% 0 0.2% 1 0.1% 1Hemel Hempstead,
Hertfordshire 0.1% 1 0.0% 0 0.1% 1 0.0% 0 0.2% 1 0.0% 0 0.0% 0 0.2% 1 0.1% 1
Hendon, Middlesex 0.1% 1 0.4% 1 0.0% 0 0.0% 0 0.2% 1 0.0% 0 0.0% 0 0.2% 1 0.1% 1High Wycombe,
Buckinghamshire 0.1% 1 0.0% 0 0.1% 1 0.0% 0 0.0% 0 0.2% 1 0.0% 0 0.0% 0 0.1% 1
Internet / Delivered 2.0% 20 2.9% 8 1.7% 12 0.0% 0 2.0% 8 2.2% 11 2.7% 13 1.2% 5 1.6% 13Kenton 0.5% 5 0.7% 2 0.4% 3 0.0% 0 0.7% 3 0.4% 2 0.4% 2 0.5% 2 0.4% 3Kingsbury 1.1% 11 1.8% 5 0.8% 6 2.3% 2 1.0% 4 1.0% 5 1.0% 5 0.7% 3 1.1% 9London Colney, St. Albans 0.2% 2 0.0% 0 0.3% 2 0.0% 0 0.2% 1 0.2% 1 0.2% 1 0.2% 1 0.3% 2Manchester 0.1% 1 0.4% 1 0.0% 0 0.0% 0 0.0% 0 0.2% 1 0.2% 1 0.0% 0 0.1% 1Middlesex 0.1% 1 0.0% 0 0.1% 1 0.0% 0 0.2% 1 0.0% 0 0.0% 0 0.2% 1 0.1% 1Milton Keynes 0.1% 1 0.0% 0 0.1% 1 0.0% 0 0.0% 0 0.2% 1 0.2% 1 0.0% 0 0.0% 0North Harrow 0.1% 1 0.4% 1 0.0% 0 0.0% 0 0.0% 0 0.2% 1 0.0% 0 0.2% 1 0.1% 1Northolt 0.2% 2 0.4% 1 0.1% 1 0.0% 0 0.5% 2 0.0% 0 0.2% 1 0.2% 1 0.1% 1Northwood 0.3% 3 0.0% 0 0.4% 3 0.0% 0 0.2% 1 0.4% 2 0.4% 2 0.0% 0 0.3% 2Pinner 3.2% 32 2.9% 8 3.3% 24 1.2% 1 3.0% 12 3.4% 17 3.3% 16 2.2% 9 2.9% 23Rayners Lane 0.3% 3 0.4% 1 0.3% 2 0.0% 0 0.2% 1 0.4% 2 0.2% 1 0.5% 2 0.1% 1Rickmansworth 0.2% 2 0.0% 0 0.3% 2 0.0% 0 0.0% 0 0.4% 2 0.2% 1 0.0% 0 0.3% 2Ruislip 1.7% 17 1.1% 3 1.9% 14 0.0% 0 2.2% 9 1.6% 8 1.7% 8 1.5% 6 2.1% 17South Harrow 1.7% 17 1.4% 4 1.8% 13 1.2% 1 1.2% 5 2.2% 11 0.6% 3 2.9% 12 1.2% 10South Oxney 0.1% 1 0.0% 0 0.1% 1 0.0% 0 0.0% 0 0.2% 1 0.2% 1 0.0% 0 0.1% 1Southampton 0.1% 1 0.0% 0 0.1% 1 0.0% 0 0.0% 0 0.2% 1 0.0% 0 0.2% 1 0.1% 1Stanmore 1.3% 13 1.8% 5 1.1% 8 1.2% 1 0.5% 2 1.8% 9 1.0% 5 1.7% 7 1.4% 11Uxbridge 4.3% 43 1.8% 5 5.3% 38 2.3% 2 4.7% 19 4.2% 21 5.4% 26 3.9% 16 4.9% 39Watford 17.2% 172 13.9% 39 18.5% 133 12.8% 11 23.6% 95 13.3% 66 20.4% 98 14.3% 59 20.4% 163Wealdstone 0.3% 3 0.4% 1 0.3% 2 0.0% 0 0.0% 0 0.6% 3 0.0% 0 0.7% 3 0.1% 1Wembley 2.8% 28 4.3% 12 2.2% 16 3.5% 3 2.7% 11 2.8% 14 2.3% 11 3.4% 14 2.7% 22Westfield / White City 0.2% 2 0.0% 0 0.3% 2 0.0% 0 0.5% 2 0.0% 0 0.4% 2 0.0% 0 0.3% 2Windsor, Berkshire 0.1% 1 0.4% 1 0.0% 0 0.0% 0 0.0% 0 0.2% 1 0.2% 1 0.0% 0 0.1% 1Yeading 0.1% 1 0.4% 1 0.0% 0 0.0% 0 0.2% 1 0.0% 0 0.2% 1 0.0% 0 0.1% 1(Don't know / varies) 8.5% 85 9.6% 27 8.1% 58 4.7% 4 6.7% 27 10.9% 54 6.9% 33 11.2% 46 8.1% 65
Base: 1000 280 720 86 402 497 481 412 801
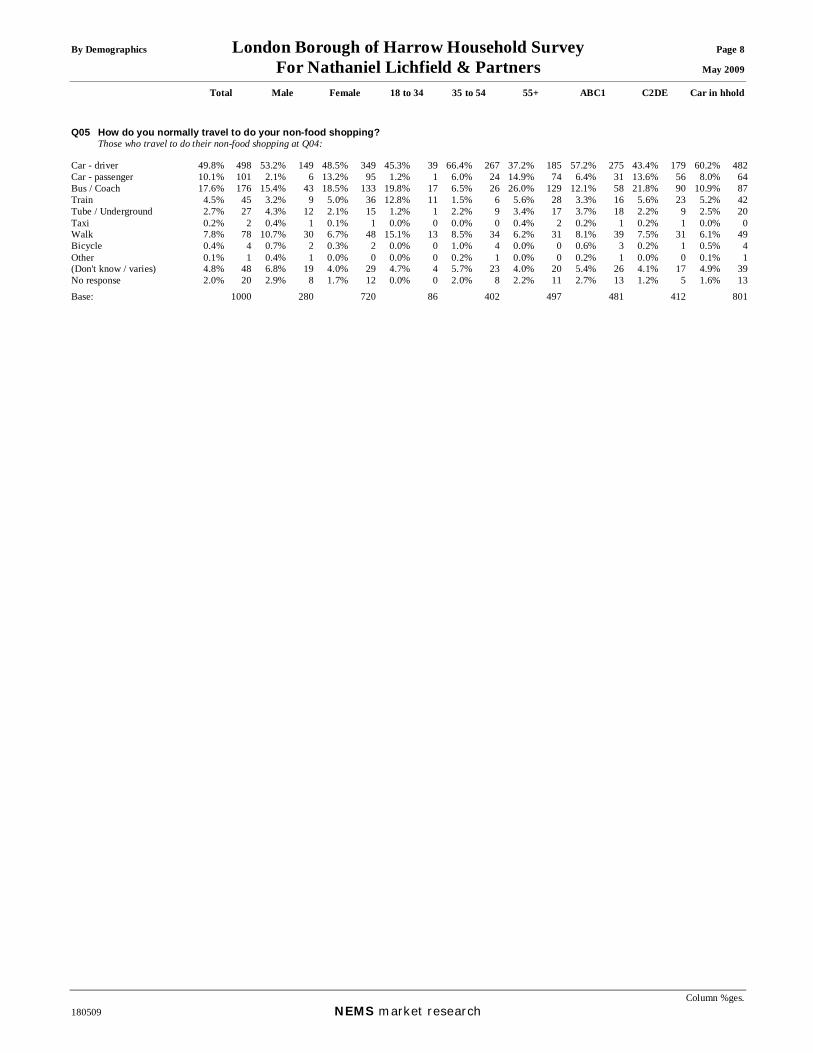
By Demographics London Borough of Harrow Household Survey Page 8 For Nathaniel Lichfield & Partners May 2009
Total Male Female 18 to 34 35 to 54 55+ ABC1 C2DE Car in hhold
Column %ges. 180509 NEMS market research
Q05 How do you normally travel to do your non-food shopping? Those who travel to do their non-food shopping at Q04: Car - driver 49.8% 498 53.2% 149 48.5% 349 45.3% 39 66.4% 267 37.2% 185 57.2% 275 43.4% 179 60.2% 482Car - passenger 10.1% 101 2.1% 6 13.2% 95 1.2% 1 6.0% 24 14.9% 74 6.4% 31 13.6% 56 8.0% 64Bus / Coach 17.6% 176 15.4% 43 18.5% 133 19.8% 17 6.5% 26 26.0% 129 12.1% 58 21.8% 90 10.9% 87Train 4.5% 45 3.2% 9 5.0% 36 12.8% 11 1.5% 6 5.6% 28 3.3% 16 5.6% 23 5.2% 42Tube / Underground 2.7% 27 4.3% 12 2.1% 15 1.2% 1 2.2% 9 3.4% 17 3.7% 18 2.2% 9 2.5% 20Taxi 0.2% 2 0.4% 1 0.1% 1 0.0% 0 0.0% 0 0.4% 2 0.2% 1 0.2% 1 0.0% 0Walk 7.8% 78 10.7% 30 6.7% 48 15.1% 13 8.5% 34 6.2% 31 8.1% 39 7.5% 31 6.1% 49Bicycle 0.4% 4 0.7% 2 0.3% 2 0.0% 0 1.0% 4 0.0% 0 0.6% 3 0.2% 1 0.5% 4Other 0.1% 1 0.4% 1 0.0% 0 0.0% 0 0.2% 1 0.0% 0 0.2% 1 0.0% 0 0.1% 1(Don't know / varies) 4.8% 48 6.8% 19 4.0% 29 4.7% 4 5.7% 23 4.0% 20 5.4% 26 4.1% 17 4.9% 39No response 2.0% 20 2.9% 8 1.7% 12 0.0% 0 2.0% 8 2.2% 11 2.7% 13 1.2% 5 1.6% 13
Base: 1000 280 720 86 402 497 481 412 801

By Demographics London Borough of Harrow Household Survey Page 9 For Nathaniel Lichfield & Partners May 2009
Total Male Female 18 to 34 35 to 54 55+ ABC1 C2DE Car in hhold
Column %ges. 180509 NEMS market research
Q06 At which location did your household last buy clothes and shoes? Aberdeen 0.1% 1 0.4% 1 0.0% 0 0.0% 0 0.0% 0 0.2% 1 0.2% 1 0.0% 0 0.1% 1Abroad 0.8% 8 1.4% 4 0.6% 4 2.3% 2 0.2% 1 1.0% 5 1.0% 5 0.7% 3 1.0% 8Alperton 0.1% 1 0.0% 0 0.1% 1 0.0% 0 0.0% 0 0.0% 0 0.0% 0 0.0% 0 0.0% 0Amersham,
Buckinghamshire 0.1% 1 0.0% 0 0.1% 1 0.0% 0 0.0% 0 0.2% 1 0.0% 0 0.2% 1 0.1% 1
Ashford, Kent 0.1% 1 0.0% 0 0.1% 1 0.0% 0 0.0% 0 0.2% 1 0.0% 0 0.2% 1 0.1% 1Bicester, Oxfordshire 0.2% 2 0.7% 2 0.0% 0 0.0% 0 0.5% 2 0.0% 0 0.2% 1 0.2% 1 0.3% 2Bournemouth 0.1% 1 0.0% 0 0.1% 1 0.0% 0 0.2% 1 0.0% 0 0.0% 0 0.2% 1 0.1% 1Brent Cross 7.6% 76 9.3% 26 6.9% 50 8.1% 7 6.5% 26 8.0% 40 8.3% 40 5.8% 24 8.1% 65Brighton 0.1% 1 0.4% 1 0.0% 0 1.2% 1 0.0% 0 0.0% 0 0.0% 0 0.2% 1 0.1% 1Bristol 0.1% 1 0.0% 0 0.1% 1 0.0% 0 0.2% 1 0.0% 0 0.2% 1 0.0% 0 0.1% 1Broadway, Worcestershire 0.1% 1 0.0% 0 0.1% 1 0.0% 0 0.0% 0 0.2% 1 0.0% 0 0.0% 0 0.0% 0Burnt Oak 0.2% 2 0.4% 1 0.1% 1 0.0% 0 0.0% 0 0.4% 2 0.0% 0 0.2% 1 0.3% 2Camberley 0.1% 1 0.0% 0 0.1% 1 0.0% 0 0.2% 1 0.0% 0 0.0% 0 0.2% 1 0.0% 0Central London / West End 7.4% 74 8.6% 24 6.9% 50 17.4% 15 5.5% 22 7.4% 37 9.1% 44 4.9% 20 7.6% 61Clacton-on-Sea, Essex 0.2% 2 0.4% 1 0.1% 1 0.0% 0 0.0% 0 0.4% 2 0.0% 0 0.2% 1 0.0% 0Colchester 0.1% 1 0.0% 0 0.1% 1 0.0% 0 0.2% 1 0.0% 0 0.2% 1 0.0% 0 0.1% 1Colindale 0.3% 3 0.0% 0 0.4% 3 2.3% 2 0.2% 1 0.0% 0 0.2% 1 0.5% 2 0.4% 3Cricklewood 0.1% 1 0.4% 1 0.0% 0 0.0% 0 0.2% 1 0.0% 0 0.2% 1 0.0% 0 0.1% 1Derby 0.1% 1 0.0% 0 0.1% 1 0.0% 0 0.0% 0 0.2% 1 0.2% 1 0.0% 0 0.1% 1Ealing 0.3% 3 0.7% 2 0.1% 1 0.0% 0 0.5% 2 0.2% 1 0.0% 0 0.7% 3 0.3% 2Eastbourne 0.1% 1 0.4% 1 0.0% 0 0.0% 0 0.2% 1 0.0% 0 0.2% 1 0.0% 0 0.1% 1Eastcote 0.2% 2 0.4% 1 0.1% 1 0.0% 0 0.0% 0 0.4% 2 0.2% 1 0.2% 1 0.3% 2Edgware 1.9% 19 2.1% 6 1.8% 13 2.3% 2 1.5% 6 2.2% 11 1.2% 6 3.2% 13 1.6% 13Gerrards Cross 0.1% 1 0.0% 0 0.1% 1 0.0% 0 0.2% 1 0.0% 0 0.2% 1 0.0% 0 0.1% 1Golders Green 0.2% 2 0.4% 1 0.1% 1 0.0% 0 0.0% 0 0.4% 2 0.2% 1 0.2% 1 0.3% 2Greenford 0.6% 6 1.4% 4 0.3% 2 0.0% 0 1.0% 4 0.4% 2 0.6% 3 0.5% 2 0.7% 6Harlesden 0.1% 1 0.4% 1 0.0% 0 0.0% 0 0.0% 0 0.2% 1 0.0% 0 0.2% 1 0.0% 0Harrow 36.5% 365 31.1% 87 38.6% 278 41.9% 36 40.5% 163 32.6% 162 36.4% 175 37.1% 153 35.5% 284Hatfield, Hertfordshire 0.1% 1 0.0% 0 0.1% 1 0.0% 0 0.0% 0 0.2% 1 0.0% 0 0.0% 0 0.1% 1Hayes 0.1% 1 0.0% 0 0.1% 1 0.0% 0 0.0% 0 0.2% 1 0.2% 1 0.0% 0 0.0% 0High Wycombe,
Buckinghamshire 0.1% 1 0.0% 0 0.1% 1 0.0% 0 0.0% 0 0.2% 1 0.0% 0 0.2% 1 0.1% 1
Hitchin, Hertfordshire 0.2% 2 0.0% 0 0.3% 2 0.0% 0 0.0% 0 0.4% 2 0.0% 0 0.5% 2 0.1% 1Hounslow 0.1% 1 0.0% 0 0.1% 1 1.2% 1 0.0% 0 0.0% 0 0.0% 0 0.2% 1 0.0% 0Internet / Delivered 6.3% 63 7.9% 22 5.7% 41 2.3% 2 4.0% 16 8.7% 43 6.0% 29 6.6% 27 5.5% 44Kensington 0.1% 1 0.4% 1 0.0% 0 0.0% 0 0.2% 1 0.0% 0 0.2% 1 0.0% 0 0.1% 1Kenton 0.1% 1 0.4% 1 0.0% 0 0.0% 0 0.0% 0 0.2% 1 0.2% 1 0.0% 0 0.1% 1Kingsbury 0.3% 3 0.4% 1 0.3% 2 1.2% 1 0.0% 0 0.4% 2 0.4% 2 0.2% 1 0.4% 3London Colney, St. Albans 0.3% 3 0.0% 0 0.4% 3 0.0% 0 0.2% 1 0.4% 2 0.4% 2 0.0% 0 0.4% 3Middlesex 0.1% 1 0.0% 0 0.1% 1 0.0% 0 0.2% 1 0.0% 0 0.0% 0 0.2% 1 0.1% 1Milton Keynes 0.2% 2 0.4% 1 0.1% 1 0.0% 0 0.2% 1 0.2% 1 0.2% 1 0.2% 1 0.1% 1Norfolk 0.1% 1 0.0% 0 0.1% 1 0.0% 0 0.2% 1 0.0% 0 0.2% 1 0.0% 0 0.1% 1North Finchley 0.1% 1 0.0% 0 0.1% 1 0.0% 0 0.0% 0 0.2% 1 0.0% 0 0.2% 1 0.1% 1North Harrow 0.1% 1 0.0% 0 0.1% 1 0.0% 0 0.0% 0 0.2% 1 0.2% 1 0.0% 0 0.1% 1Oxbridge 0.2% 2 0.0% 0 0.3% 2 0.0% 0 0.5% 2 0.0% 0 0.4% 2 0.0% 0 0.3% 2Pinner 0.6% 6 1.1% 3 0.4% 3 0.0% 0 0.0% 0 1.2% 6 0.2% 1 0.5% 2 0.4% 3Portsmouth 0.1% 1 0.4% 1 0.0% 0 0.0% 0 0.0% 0 0.2% 1 0.2% 1 0.0% 0 0.1% 1Rayners Lane 0.4% 4 0.7% 2 0.3% 2 0.0% 0 0.5% 2 0.4% 2 0.4% 2 0.5% 2 0.5% 4Reading, Berkshire 0.1% 1 0.4% 1 0.0% 0 0.0% 0 0.2% 1 0.0% 0 0.0% 0 0.2% 1 0.1% 1Richmond, Surrey 0.1% 1 0.4% 1 0.0% 0 1.2% 1 0.0% 0 0.0% 0 0.2% 1 0.0% 0 0.1% 1Rickmansworth 0.1% 1 0.0% 0 0.1% 1 0.0% 0 0.0% 0 0.2% 1 0.0% 0 0.2% 1 0.1% 1Ruislip 1.0% 10 1.8% 5 0.7% 5 0.0% 0 1.5% 6 0.8% 4 0.6% 3 1.5% 6 0.9% 7Scotland 0.1% 1 0.0% 0 0.1% 1 0.0% 0 0.2% 1 0.0% 0 0.2% 1 0.0% 0 0.1% 1Shrewsbury, Shropshire 0.1% 1 0.0% 0 0.1% 1 0.0% 0 0.0% 0 0.2% 1 0.2% 1 0.0% 0 0.0% 0South Harrow 0.4% 4 0.4% 1 0.4% 3 0.0% 0 0.2% 1 0.6% 3 0.2% 1 0.2% 1 0.1% 1Southall 0.2% 2 0.4% 1 0.1% 1 1.2% 1 0.2% 1 0.0% 0 0.0% 0 0.2% 1 0.3% 2Southampton 0.1% 1 0.0% 0 0.1% 1 0.0% 0 0.0% 0 0.2% 1 0.0% 0 0.2% 1 0.1% 1St. Albans 0.3% 3 1.1% 3 0.0% 0 0.0% 0 0.5% 2 0.2% 1 0.4% 2 0.2% 1 0.4% 3Stafford 0.1% 1 0.4% 1 0.0% 0 0.0% 0 0.2% 1 0.0% 0 0.0% 0 0.2% 1 0.0% 0Stanmore 0.4% 4 0.7% 2 0.3% 2 0.0% 0 0.2% 1 0.6% 3 0.2% 1 0.7% 3 0.4% 3Swansea 0.1% 1 0.0% 0 0.1% 1 0.0% 0 0.2% 1 0.0% 0 0.2% 1 0.0% 0 0.1% 1Telford, Shropshire 0.1% 1 0.4% 1 0.0% 0 0.0% 0 0.2% 1 0.0% 0 0.2% 1 0.0% 0 0.1% 1Uxbridge 5.6% 56 3.2% 9 6.5% 47 5.8% 5 6.5% 26 5.0% 25 6.7% 32 4.9% 20 6.2% 50Watford 16.1% 161 13.2% 37 17.2% 124 8.1% 7 20.4% 82 14.1% 70 17.5% 84 14.8% 61 18.6% 149Wealdstone 0.1% 1 0.0% 0 0.1% 1 0.0% 0 0.2% 1 0.0% 0 0.2% 1 0.0% 0 0.1% 1Wembley 0.8% 8 0.7% 2 0.8% 6 1.2% 1 0.7% 3 0.8% 4 0.2% 1 1.5% 6 0.7% 6Westfield / White City 1.0% 10 0.4% 1 1.3% 9 0.0% 0 1.7% 7 0.6% 3 1.0% 5 1.2% 5 1.2% 10Wimbledon 0.1% 1 0.4% 1 0.0% 0 0.0% 0 0.0% 0 0.2% 1 0.2% 1 0.0% 0 0.0% 0Worthing, West Sussex 0.1% 1 0.0% 0 0.1% 1 0.0% 0 0.0% 0 0.2% 1 0.0% 0 0.0% 0 0.0% 0(Don't buy these goods) 1.6% 16 3.2% 9 1.0% 7 1.2% 1 0.0% 0 2.8% 14 0.8% 4 2.7% 11 1.1% 9(Don't know / can't 3.9% 39 3.2% 9 4.2% 30 1.2% 1 2.0% 8 5.6% 28 2.5% 12 5.6% 23 2.7% 22

By Demographics London Borough of Harrow Household Survey Page 10 For Nathaniel Lichfield & Partners May 2009
Total Male Female 18 to 34 35 to 54 55+ ABC1 C2DE Car in hhold
Column %ges. 180509 NEMS market research
remember) Base: 1000 280 720 86 402 497 481 412 801
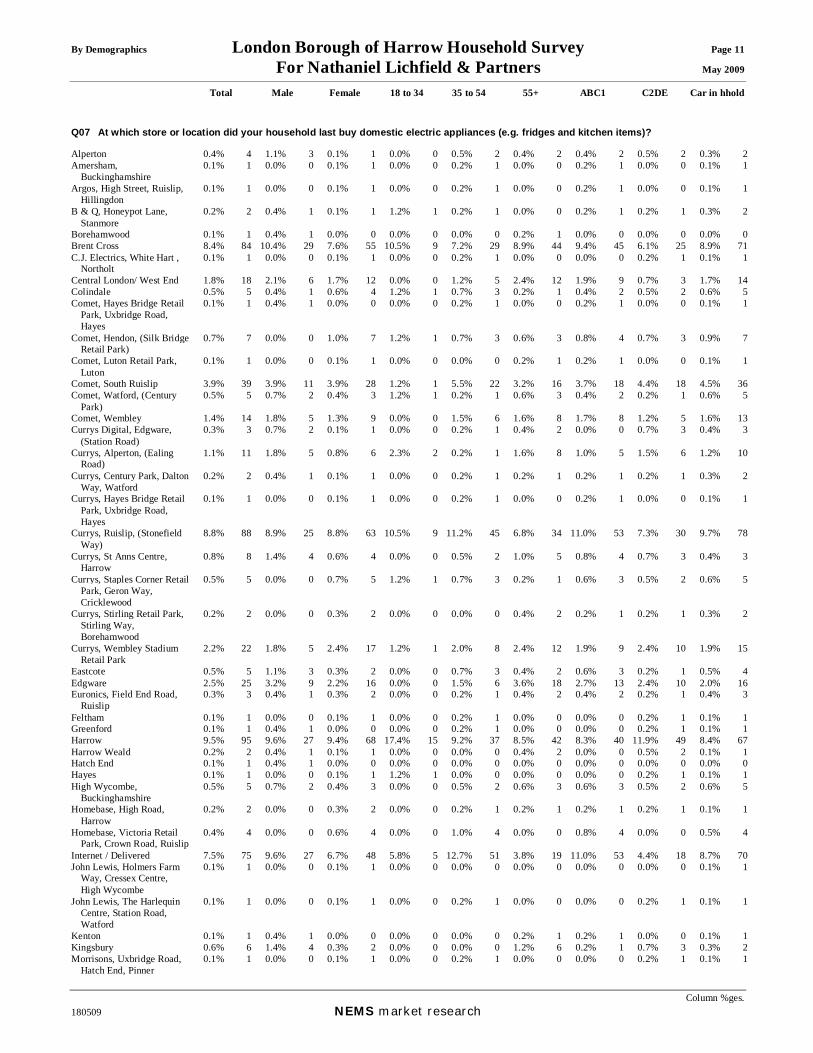
By Demographics London Borough of Harrow Household Survey Page 11 For Nathaniel Lichfield & Partners May 2009
Total Male Female 18 to 34 35 to 54 55+ ABC1 C2DE Car in hhold
Column %ges. 180509 NEMS market research
Q07 At which store or location did your household last buy domestic electric appliances (e.g. fridges and kitchen items)? Alperton 0.4% 4 1.1% 3 0.1% 1 0.0% 0 0.5% 2 0.4% 2 0.4% 2 0.5% 2 0.3% 2Amersham,
Buckinghamshire 0.1% 1 0.0% 0 0.1% 1 0.0% 0 0.2% 1 0.0% 0 0.2% 1 0.0% 0 0.1% 1
Argos, High Street, Ruislip, Hillingdon
0.1% 1 0.0% 0 0.1% 1 0.0% 0 0.2% 1 0.0% 0 0.2% 1 0.0% 0 0.1% 1
B & Q, Honeypot Lane, Stanmore
0.2% 2 0.4% 1 0.1% 1 1.2% 1 0.2% 1 0.0% 0 0.2% 1 0.2% 1 0.3% 2
Borehamwood 0.1% 1 0.4% 1 0.0% 0 0.0% 0 0.0% 0 0.2% 1 0.0% 0 0.0% 0 0.0% 0Brent Cross 8.4% 84 10.4% 29 7.6% 55 10.5% 9 7.2% 29 8.9% 44 9.4% 45 6.1% 25 8.9% 71C.J. Electrics, White Hart ,
Northolt 0.1% 1 0.0% 0 0.1% 1 0.0% 0 0.2% 1 0.0% 0 0.0% 0 0.2% 1 0.1% 1
Central London/ West End 1.8% 18 2.1% 6 1.7% 12 0.0% 0 1.2% 5 2.4% 12 1.9% 9 0.7% 3 1.7% 14Colindale 0.5% 5 0.4% 1 0.6% 4 1.2% 1 0.7% 3 0.2% 1 0.4% 2 0.5% 2 0.6% 5Comet, Hayes Bridge Retail
Park, Uxbridge Road, Hayes
0.1% 1 0.4% 1 0.0% 0 0.0% 0 0.2% 1 0.0% 0 0.2% 1 0.0% 0 0.1% 1
Comet, Hendon, (Silk Bridge Retail Park)
0.7% 7 0.0% 0 1.0% 7 1.2% 1 0.7% 3 0.6% 3 0.8% 4 0.7% 3 0.9% 7
Comet, Luton Retail Park, Luton
0.1% 1 0.0% 0 0.1% 1 0.0% 0 0.0% 0 0.2% 1 0.2% 1 0.0% 0 0.1% 1
Comet, South Ruislip 3.9% 39 3.9% 11 3.9% 28 1.2% 1 5.5% 22 3.2% 16 3.7% 18 4.4% 18 4.5% 36Comet, Watford, (Century
Park) 0.5% 5 0.7% 2 0.4% 3 1.2% 1 0.2% 1 0.6% 3 0.4% 2 0.2% 1 0.6% 5
Comet, Wembley 1.4% 14 1.8% 5 1.3% 9 0.0% 0 1.5% 6 1.6% 8 1.7% 8 1.2% 5 1.6% 13Currys Digital, Edgware,
(Station Road) 0.3% 3 0.7% 2 0.1% 1 0.0% 0 0.2% 1 0.4% 2 0.0% 0 0.7% 3 0.4% 3
Currys, Alperton, (Ealing Road)
1.1% 11 1.8% 5 0.8% 6 2.3% 2 0.2% 1 1.6% 8 1.0% 5 1.5% 6 1.2% 10
Currys, Century Park, Dalton Way, Watford
0.2% 2 0.4% 1 0.1% 1 0.0% 0 0.2% 1 0.2% 1 0.2% 1 0.2% 1 0.3% 2
Currys, Hayes Bridge Retail Park, Uxbridge Road, Hayes
0.1% 1 0.0% 0 0.1% 1 0.0% 0 0.2% 1 0.0% 0 0.2% 1 0.0% 0 0.1% 1
Currys, Ruislip, (Stonefield Way)
8.8% 88 8.9% 25 8.8% 63 10.5% 9 11.2% 45 6.8% 34 11.0% 53 7.3% 30 9.7% 78
Currys, St Anns Centre, Harrow
0.8% 8 1.4% 4 0.6% 4 0.0% 0 0.5% 2 1.0% 5 0.8% 4 0.7% 3 0.4% 3
Currys, Staples Corner Retail Park, Geron Way, Cricklewood
0.5% 5 0.0% 0 0.7% 5 1.2% 1 0.7% 3 0.2% 1 0.6% 3 0.5% 2 0.6% 5
Currys, Stirling Retail Park, Stirling Way, Borehamwood
0.2% 2 0.0% 0 0.3% 2 0.0% 0 0.0% 0 0.4% 2 0.2% 1 0.2% 1 0.3% 2
Currys, Wembley Stadium Retail Park
2.2% 22 1.8% 5 2.4% 17 1.2% 1 2.0% 8 2.4% 12 1.9% 9 2.4% 10 1.9% 15
Eastcote 0.5% 5 1.1% 3 0.3% 2 0.0% 0 0.7% 3 0.4% 2 0.6% 3 0.2% 1 0.5% 4Edgware 2.5% 25 3.2% 9 2.2% 16 0.0% 0 1.5% 6 3.6% 18 2.7% 13 2.4% 10 2.0% 16Euronics, Field End Road,
Ruislip 0.3% 3 0.4% 1 0.3% 2 0.0% 0 0.2% 1 0.4% 2 0.4% 2 0.2% 1 0.4% 3
Feltham 0.1% 1 0.0% 0 0.1% 1 0.0% 0 0.2% 1 0.0% 0 0.0% 0 0.2% 1 0.1% 1Greenford 0.1% 1 0.4% 1 0.0% 0 0.0% 0 0.2% 1 0.0% 0 0.0% 0 0.2% 1 0.1% 1Harrow 9.5% 95 9.6% 27 9.4% 68 17.4% 15 9.2% 37 8.5% 42 8.3% 40 11.9% 49 8.4% 67Harrow Weald 0.2% 2 0.4% 1 0.1% 1 0.0% 0 0.0% 0 0.4% 2 0.0% 0 0.5% 2 0.1% 1Hatch End 0.1% 1 0.4% 1 0.0% 0 0.0% 0 0.0% 0 0.0% 0 0.0% 0 0.0% 0 0.0% 0Hayes 0.1% 1 0.0% 0 0.1% 1 1.2% 1 0.0% 0 0.0% 0 0.0% 0 0.2% 1 0.1% 1High Wycombe,
Buckinghamshire 0.5% 5 0.7% 2 0.4% 3 0.0% 0 0.5% 2 0.6% 3 0.6% 3 0.5% 2 0.6% 5
Homebase, High Road, Harrow
0.2% 2 0.0% 0 0.3% 2 0.0% 0 0.2% 1 0.2% 1 0.2% 1 0.2% 1 0.1% 1
Homebase, Victoria Retail Park, Crown Road, Ruislip
0.4% 4 0.0% 0 0.6% 4 0.0% 0 1.0% 4 0.0% 0 0.8% 4 0.0% 0 0.5% 4
Internet / Delivered 7.5% 75 9.6% 27 6.7% 48 5.8% 5 12.7% 51 3.8% 19 11.0% 53 4.4% 18 8.7% 70John Lewis, Holmers Farm
Way, Cressex Centre, High Wycombe
0.1% 1 0.0% 0 0.1% 1 0.0% 0 0.0% 0 0.0% 0 0.0% 0 0.0% 0 0.1% 1
John Lewis, The Harlequin Centre, Station Road, Watford
0.1% 1 0.0% 0 0.1% 1 0.0% 0 0.2% 1 0.0% 0 0.0% 0 0.2% 1 0.1% 1
Kenton 0.1% 1 0.4% 1 0.0% 0 0.0% 0 0.0% 0 0.2% 1 0.2% 1 0.0% 0 0.1% 1Kingsbury 0.6% 6 1.4% 4 0.3% 2 0.0% 0 0.0% 0 1.2% 6 0.2% 1 0.7% 3 0.3% 2Morrisons, Uxbridge Road,
Hatch End, Pinner 0.1% 1 0.0% 0 0.1% 1 0.0% 0 0.2% 1 0.0% 0 0.0% 0 0.2% 1 0.1% 1

By Demographics London Borough of Harrow Household Survey Page 12 For Nathaniel Lichfield & Partners May 2009
Total Male Female 18 to 34 35 to 54 55+ ABC1 C2DE Car in hhold
Column %ges. 180509 NEMS market research
Northolt 0.1% 1 0.4% 1 0.0% 0 0.0% 0 0.2% 1 0.0% 0 0.0% 0 0.2% 1 0.1% 1Northwood 0.2% 2 0.4% 1 0.1% 1 1.2% 1 0.0% 0 0.2% 1 0.0% 0 0.5% 2 0.1% 1Pinner 0.1% 1 0.0% 0 0.1% 1 0.0% 0 0.0% 0 0.2% 1 0.2% 1 0.0% 0 0.1% 1Rayners Lane 0.7% 7 0.4% 1 0.8% 6 0.0% 0 0.7% 3 0.8% 4 0.4% 2 1.2% 5 0.3% 2Ruislip 1.6% 16 1.1% 3 1.8% 13 1.2% 1 2.0% 8 1.4% 7 1.9% 9 1.5% 6 2.0% 16South Harrow 0.6% 6 0.7% 2 0.6% 4 0.0% 0 0.0% 0 1.2% 6 0.2% 1 0.7% 3 0.3% 2South Ruislip 0.9% 9 1.4% 4 0.7% 5 0.0% 0 1.0% 4 1.0% 5 0.8% 4 1.2% 5 1.0% 8Stanmore 0.6% 6 0.7% 2 0.6% 4 0.0% 0 0.7% 3 0.6% 3 1.0% 5 0.2% 1 0.7% 6Staples Corner Retail Park,
Geron Way, Cricklewood 0.1% 1 0.0% 0 0.1% 1 0.0% 0 0.2% 1 0.0% 0 0.0% 0 0.2% 1 0.1% 1
Sudbury Hill 0.1% 1 0.4% 1 0.0% 0 0.0% 0 0.0% 0 0.2% 1 0.0% 0 0.2% 1 0.1% 1Swindon 0.1% 1 0.4% 1 0.0% 0 0.0% 0 0.0% 0 0.2% 1 0.2% 1 0.0% 0 0.1% 1Tesco Extra, Osterley Park,
Syon Lane, Isleworth 0.1% 1 0.0% 0 0.1% 1 1.2% 1 0.0% 0 0.0% 0 0.0% 0 0.2% 1 0.1% 1
Uxbridge 0.3% 3 0.0% 0 0.4% 3 0.0% 0 0.5% 2 0.2% 1 0.6% 3 0.0% 0 0.4% 3Victoria Retail Park, Crown
Road, Hillingdon, Ruislip 0.3% 3 0.0% 0 0.4% 3 1.2% 1 0.5% 2 0.0% 0 0.4% 2 0.2% 1 0.4% 3
Watford 13.9% 139 9.3% 26 15.7% 113 12.8% 11 16.2% 65 12.5% 62 15.2% 73 12.1% 50 15.6% 125Wealdstone 1.2% 12 1.4% 4 1.1% 8 0.0% 0 0.5% 2 2.0% 10 0.8% 4 1.9% 8 0.9% 7Wembley 1.1% 11 0.7% 2 1.3% 9 0.0% 0 1.5% 6 1.0% 5 1.2% 6 1.2% 5 1.0% 8Willesden 0.1% 1 0.4% 1 0.0% 0 0.0% 0 0.2% 1 0.0% 0 0.2% 1 0.0% 0 0.0% 0Wimbledon 0.1% 1 0.4% 1 0.0% 0 0.0% 0 0.0% 0 0.2% 1 0.2% 1 0.0% 0 0.1% 1Worthing, West Sussex 0.1% 1 0.0% 0 0.1% 1 0.0% 0 0.0% 0 0.2% 1 0.0% 0 0.2% 1 0.0% 0Yeading 0.2% 2 0.4% 1 0.1% 1 0.0% 0 0.5% 2 0.0% 0 0.4% 2 0.0% 0 0.3% 2(Don't buy these goods) 11.5% 115 7.5% 21 13.1% 94 16.3% 14 5.7% 23 15.1% 75 8.3% 40 12.9% 53 9.9% 79(Don't know / can't
remember) 10.4% 104 10.4% 29 10.4% 75 10.5% 9 8.0% 32 12.3% 61 6.9% 33 14.3% 59 9.1% 73
Base: 1000 280 720 86 402 497 481 412 801
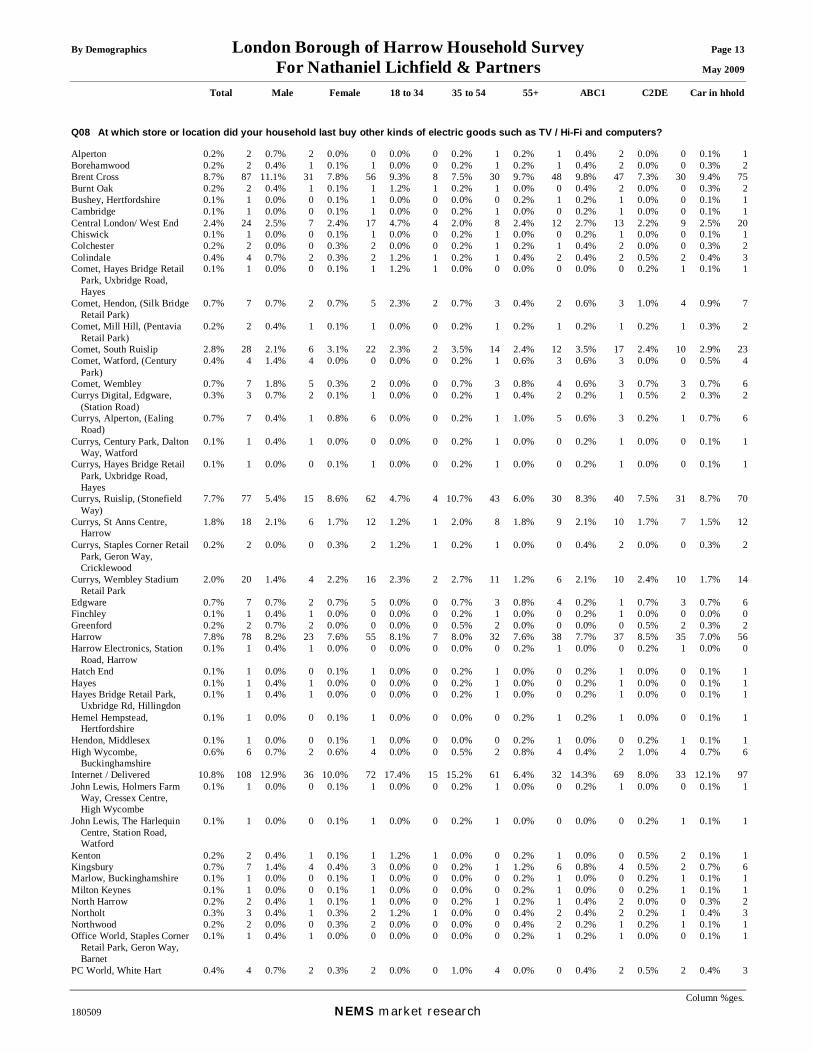
By Demographics London Borough of Harrow Household Survey Page 13 For Nathaniel Lichfield & Partners May 2009
Total Male Female 18 to 34 35 to 54 55+ ABC1 C2DE Car in hhold
Column %ges. 180509 NEMS market research
Q08 At which store or location did your household last buy other kinds of electric goods such as TV / Hi-Fi and computers? Alperton 0.2% 2 0.7% 2 0.0% 0 0.0% 0 0.2% 1 0.2% 1 0.4% 2 0.0% 0 0.1% 1Borehamwood 0.2% 2 0.4% 1 0.1% 1 0.0% 0 0.2% 1 0.2% 1 0.4% 2 0.0% 0 0.3% 2Brent Cross 8.7% 87 11.1% 31 7.8% 56 9.3% 8 7.5% 30 9.7% 48 9.8% 47 7.3% 30 9.4% 75Burnt Oak 0.2% 2 0.4% 1 0.1% 1 1.2% 1 0.2% 1 0.0% 0 0.4% 2 0.0% 0 0.3% 2Bushey, Hertfordshire 0.1% 1 0.0% 0 0.1% 1 0.0% 0 0.0% 0 0.2% 1 0.2% 1 0.0% 0 0.1% 1Cambridge 0.1% 1 0.0% 0 0.1% 1 0.0% 0 0.2% 1 0.0% 0 0.2% 1 0.0% 0 0.1% 1Central London/ West End 2.4% 24 2.5% 7 2.4% 17 4.7% 4 2.0% 8 2.4% 12 2.7% 13 2.2% 9 2.5% 20Chiswick 0.1% 1 0.0% 0 0.1% 1 0.0% 0 0.2% 1 0.0% 0 0.2% 1 0.0% 0 0.1% 1Colchester 0.2% 2 0.0% 0 0.3% 2 0.0% 0 0.2% 1 0.2% 1 0.4% 2 0.0% 0 0.3% 2Colindale 0.4% 4 0.7% 2 0.3% 2 1.2% 1 0.2% 1 0.4% 2 0.4% 2 0.5% 2 0.4% 3Comet, Hayes Bridge Retail
Park, Uxbridge Road, Hayes
0.1% 1 0.0% 0 0.1% 1 1.2% 1 0.0% 0 0.0% 0 0.0% 0 0.2% 1 0.1% 1
Comet, Hendon, (Silk Bridge Retail Park)
0.7% 7 0.7% 2 0.7% 5 2.3% 2 0.7% 3 0.4% 2 0.6% 3 1.0% 4 0.9% 7
Comet, Mill Hill, (Pentavia Retail Park)
0.2% 2 0.4% 1 0.1% 1 0.0% 0 0.2% 1 0.2% 1 0.2% 1 0.2% 1 0.3% 2
Comet, South Ruislip 2.8% 28 2.1% 6 3.1% 22 2.3% 2 3.5% 14 2.4% 12 3.5% 17 2.4% 10 2.9% 23Comet, Watford, (Century
Park) 0.4% 4 1.4% 4 0.0% 0 0.0% 0 0.2% 1 0.6% 3 0.6% 3 0.0% 0 0.5% 4
Comet, Wembley 0.7% 7 1.8% 5 0.3% 2 0.0% 0 0.7% 3 0.8% 4 0.6% 3 0.7% 3 0.7% 6Currys Digital, Edgware,
(Station Road) 0.3% 3 0.7% 2 0.1% 1 0.0% 0 0.2% 1 0.4% 2 0.2% 1 0.5% 2 0.3% 2
Currys, Alperton, (Ealing Road)
0.7% 7 0.4% 1 0.8% 6 0.0% 0 0.2% 1 1.0% 5 0.6% 3 0.2% 1 0.7% 6
Currys, Century Park, Dalton Way, Watford
0.1% 1 0.4% 1 0.0% 0 0.0% 0 0.2% 1 0.0% 0 0.2% 1 0.0% 0 0.1% 1
Currys, Hayes Bridge Retail Park, Uxbridge Road, Hayes
0.1% 1 0.0% 0 0.1% 1 0.0% 0 0.2% 1 0.0% 0 0.2% 1 0.0% 0 0.1% 1
Currys, Ruislip, (Stonefield Way)
7.7% 77 5.4% 15 8.6% 62 4.7% 4 10.7% 43 6.0% 30 8.3% 40 7.5% 31 8.7% 70
Currys, St Anns Centre, Harrow
1.8% 18 2.1% 6 1.7% 12 1.2% 1 2.0% 8 1.8% 9 2.1% 10 1.7% 7 1.5% 12
Currys, Staples Corner Retail Park, Geron Way, Cricklewood
0.2% 2 0.0% 0 0.3% 2 1.2% 1 0.2% 1 0.0% 0 0.4% 2 0.0% 0 0.3% 2
Currys, Wembley Stadium Retail Park
2.0% 20 1.4% 4 2.2% 16 2.3% 2 2.7% 11 1.2% 6 2.1% 10 2.4% 10 1.7% 14
Edgware 0.7% 7 0.7% 2 0.7% 5 0.0% 0 0.7% 3 0.8% 4 0.2% 1 0.7% 3 0.7% 6Finchley 0.1% 1 0.4% 1 0.0% 0 0.0% 0 0.2% 1 0.0% 0 0.2% 1 0.0% 0 0.0% 0Greenford 0.2% 2 0.7% 2 0.0% 0 0.0% 0 0.5% 2 0.0% 0 0.0% 0 0.5% 2 0.3% 2Harrow 7.8% 78 8.2% 23 7.6% 55 8.1% 7 8.0% 32 7.6% 38 7.7% 37 8.5% 35 7.0% 56Harrow Electronics, Station
Road, Harrow 0.1% 1 0.4% 1 0.0% 0 0.0% 0 0.0% 0 0.2% 1 0.0% 0 0.2% 1 0.0% 0
Hatch End 0.1% 1 0.0% 0 0.1% 1 0.0% 0 0.2% 1 0.0% 0 0.2% 1 0.0% 0 0.1% 1Hayes 0.1% 1 0.4% 1 0.0% 0 0.0% 0 0.2% 1 0.0% 0 0.2% 1 0.0% 0 0.1% 1Hayes Bridge Retail Park,
Uxbridge Rd, Hillingdon 0.1% 1 0.4% 1 0.0% 0 0.0% 0 0.2% 1 0.0% 0 0.2% 1 0.0% 0 0.1% 1
Hemel Hempstead, Hertfordshire
0.1% 1 0.0% 0 0.1% 1 0.0% 0 0.0% 0 0.2% 1 0.2% 1 0.0% 0 0.1% 1
Hendon, Middlesex 0.1% 1 0.0% 0 0.1% 1 0.0% 0 0.0% 0 0.2% 1 0.0% 0 0.2% 1 0.1% 1High Wycombe,
Buckinghamshire 0.6% 6 0.7% 2 0.6% 4 0.0% 0 0.5% 2 0.8% 4 0.4% 2 1.0% 4 0.7% 6
Internet / Delivered 10.8% 108 12.9% 36 10.0% 72 17.4% 15 15.2% 61 6.4% 32 14.3% 69 8.0% 33 12.1% 97John Lewis, Holmers Farm
Way, Cressex Centre, High Wycombe
0.1% 1 0.0% 0 0.1% 1 0.0% 0 0.2% 1 0.0% 0 0.2% 1 0.0% 0 0.1% 1
John Lewis, The Harlequin Centre, Station Road, Watford
0.1% 1 0.0% 0 0.1% 1 0.0% 0 0.2% 1 0.0% 0 0.0% 0 0.2% 1 0.1% 1
Kenton 0.2% 2 0.4% 1 0.1% 1 1.2% 1 0.0% 0 0.2% 1 0.0% 0 0.5% 2 0.1% 1Kingsbury 0.7% 7 1.4% 4 0.4% 3 0.0% 0 0.2% 1 1.2% 6 0.8% 4 0.5% 2 0.7% 6Marlow, Buckinghamshire 0.1% 1 0.0% 0 0.1% 1 0.0% 0 0.0% 0 0.2% 1 0.0% 0 0.2% 1 0.1% 1Milton Keynes 0.1% 1 0.0% 0 0.1% 1 0.0% 0 0.0% 0 0.2% 1 0.0% 0 0.2% 1 0.1% 1North Harrow 0.2% 2 0.4% 1 0.1% 1 0.0% 0 0.2% 1 0.2% 1 0.4% 2 0.0% 0 0.3% 2Northolt 0.3% 3 0.4% 1 0.3% 2 1.2% 1 0.0% 0 0.4% 2 0.4% 2 0.2% 1 0.4% 3Northwood 0.2% 2 0.0% 0 0.3% 2 0.0% 0 0.0% 0 0.4% 2 0.2% 1 0.2% 1 0.1% 1Office World, Staples Corner
Retail Park, Geron Way, Barnet
0.1% 1 0.4% 1 0.0% 0 0.0% 0 0.0% 0 0.2% 1 0.2% 1 0.0% 0 0.1% 1
PC World, White Hart 0.4% 4 0.7% 2 0.3% 2 0.0% 0 1.0% 4 0.0% 0 0.4% 2 0.5% 2 0.4% 3

By Demographics London Borough of Harrow Household Survey Page 14 For Nathaniel Lichfield & Partners May 2009
Total Male Female 18 to 34 35 to 54 55+ ABC1 C2DE Car in hhold
Column %ges. 180509 NEMS market research
Roundabout, Northolt Pinner 1.3% 13 0.7% 2 1.5% 11 0.0% 0 1.7% 7 1.0% 5 1.2% 6 0.5% 2 1.5% 12Queensbury 0.1% 1 0.4% 1 0.0% 0 0.0% 0 0.0% 0 0.2% 1 0.2% 1 0.0% 0 0.1% 1Rayners Lane 0.7% 7 1.1% 3 0.6% 4 0.0% 0 0.5% 2 1.0% 5 0.8% 4 0.7% 3 0.6% 5Reading, Berkshire 0.1% 1 0.4% 1 0.0% 0 0.0% 0 0.2% 1 0.0% 0 0.0% 0 0.2% 1 0.1% 1Ruislip 0.6% 6 0.7% 2 0.6% 4 0.0% 0 1.2% 5 0.2% 1 1.0% 5 0.2% 1 0.6% 5South Harrow 0.4% 4 0.4% 1 0.4% 3 0.0% 0 0.5% 2 0.4% 2 0.2% 1 0.7% 3 0.3% 2South Oxney 0.1% 1 0.4% 1 0.0% 0 0.0% 0 0.2% 1 0.0% 0 0.0% 0 0.2% 1 0.1% 1South Ruislip 0.5% 5 1.1% 3 0.3% 2 0.0% 0 0.2% 1 0.8% 4 0.2% 1 1.0% 4 0.6% 5Stafford 0.1% 1 0.4% 1 0.0% 0 0.0% 0 0.2% 1 0.0% 0 0.0% 0 0.2% 1 0.0% 0Stanmore 0.2% 2 0.7% 2 0.0% 0 1.2% 1 0.2% 1 0.0% 0 0.2% 1 0.2% 1 0.3% 2Staples Corner Retail Park,
Geron Way, Cricklewood 0.2% 2 0.0% 0 0.3% 2 0.0% 0 0.5% 2 0.0% 0 0.2% 1 0.2% 1 0.3% 2
Swindon 0.1% 1 0.4% 1 0.0% 0 0.0% 0 0.0% 0 0.2% 1 0.0% 0 0.0% 0 0.0% 0Tesco, Frogmoor Wharf,
Harefield Road, Rickmansworth
0.1% 1 0.0% 0 0.1% 1 0.0% 0 0.2% 1 0.0% 0 0.2% 1 0.0% 0 0.1% 1
Tesco, Glencoe Road, Hayes 0.1% 1 0.0% 0 0.1% 1 0.0% 0 0.2% 1 0.0% 0 0.0% 0 0.2% 1 0.1% 1Uxbridge 0.3% 3 0.4% 1 0.3% 2 0.0% 0 0.5% 2 0.2% 1 0.4% 2 0.2% 1 0.4% 3Victoria Retail Park, Crown
Road, Hillingdon, Ruislip 0.1% 1 0.0% 0 0.1% 1 1.2% 1 0.0% 0 0.0% 0 0.0% 0 0.2% 1 0.1% 1
Watford 14.6% 146 12.5% 35 15.4% 111 12.8% 11 17.4% 70 13.1% 65 15.6% 75 14.3% 59 16.9% 135Wealdstone 0.3% 3 0.4% 1 0.3% 2 0.0% 0 0.2% 1 0.4% 2 0.2% 1 0.5% 2 0.1% 1Wembley 0.8% 8 0.7% 2 0.8% 6 2.3% 2 0.5% 2 0.8% 4 0.6% 3 1.2% 5 0.6% 5Westfield / White City 0.2% 2 0.0% 0 0.3% 2 0.0% 0 0.5% 2 0.0% 0 0.4% 2 0.0% 0 0.3% 2Yeading 0.2% 2 0.4% 1 0.1% 1 0.0% 0 0.5% 2 0.0% 0 0.2% 1 0.2% 1 0.3% 2(Don't buy these goods) 16.2% 162 12.9% 36 17.5% 126 16.3% 14 6.5% 26 23.1% 115 8.9% 43 19.4% 80 12.4% 99(Don't know / can't
remember) 9.0% 90 5.7% 16 10.3% 74 7.0% 6 6.5% 26 11.1% 55 7.9% 38 10.4% 43 7.9% 63
Base: 1000 280 720 86 402 497 481 412 801

By Demographics London Borough of Harrow Household Survey Page 15 For Nathaniel Lichfield & Partners May 2009
Total Male Female 18 to 34 35 to 54 55+ ABC1 C2DE Car in hhold
Column %ges. 180509 NEMS market research
Q09 Which store or location did your household last buy furniture, soft furnishings and floor-coverings? Abroad 0.3% 3 0.4% 1 0.3% 2 1.2% 1 0.2% 1 0.2% 1 0.6% 3 0.0% 0 0.4% 3Allied Carpets, Edgware
Road, Paddington 0.1% 1 0.0% 0 0.1% 1 0.0% 0 0.0% 0 0.2% 1 0.2% 1 0.0% 0 0.1% 1
Allied Carpets, Pinner Road, Harrow
0.1% 1 0.0% 0 0.1% 1 0.0% 0 0.2% 1 0.0% 0 0.2% 1 0.0% 0 0.1% 1
Allied Carpets, South Ruislip, (Victoria Road)
0.3% 3 0.0% 0 0.4% 3 0.0% 0 0.7% 3 0.0% 0 0.4% 2 0.2% 1 0.4% 3
Allied Carpets, Wembley, (The Junction Wembley Retail Park)
0.2% 2 0.4% 1 0.1% 1 1.2% 1 0.0% 0 0.2% 1 0.2% 1 0.2% 1 0.3% 2
Alperton 0.2% 2 0.7% 2 0.0% 0 0.0% 0 0.2% 1 0.2% 1 0.2% 1 0.2% 1 0.3% 2Asda, Edgware Road,
Colindale 0.1% 1 0.4% 1 0.0% 0 1.2% 1 0.0% 0 0.0% 0 0.2% 1 0.0% 0 0.0% 0
B & Q, Cricklewood 0.1% 1 0.0% 0 0.1% 1 0.0% 0 0.2% 1 0.0% 0 0.2% 1 0.0% 0 0.1% 1B & Q, Queensbury 0.1% 1 0.4% 1 0.0% 0 0.0% 0 0.2% 1 0.0% 0 0.2% 1 0.0% 0 0.1% 1B & Q, Western Avenue,
Greenford 0.1% 1 0.4% 1 0.0% 0 0.0% 0 0.2% 1 0.0% 0 0.2% 1 0.0% 0 0.1% 1
Birmingham 0.1% 1 0.0% 0 0.1% 1 0.0% 0 0.2% 1 0.0% 0 0.2% 1 0.0% 0 0.1% 1Brent Cross 4.4% 44 2.9% 8 5.0% 36 3.5% 3 4.7% 19 4.4% 22 4.6% 22 3.6% 15 5.2% 42Burnt Oak 0.1% 1 0.4% 1 0.0% 0 0.0% 0 0.2% 1 0.0% 0 0.2% 1 0.0% 0 0.0% 0Carpet Right, Colindale,
(Edgware Road) 0.3% 3 0.4% 1 0.3% 2 0.0% 0 0.0% 0 0.6% 3 0.2% 1 0.2% 1 0.3% 2
Carpet Right, Harrow, (Station Road)
0.5% 5 0.4% 1 0.6% 4 0.0% 0 0.7% 3 0.4% 2 0.6% 3 0.5% 2 0.5% 4
Carpet Right, Ruislip, Victoria Road
1.2% 12 0.4% 1 1.5% 11 2.3% 2 0.7% 3 1.2% 6 1.2% 6 1.2% 5 1.1% 9
Carpet Right, Stanmore, (The Broadway)
0.2% 2 0.0% 0 0.3% 2 0.0% 0 0.2% 1 0.2% 1 0.0% 0 0.5% 2 0.1% 1
Carpet Right, Wembley 0.2% 2 0.7% 2 0.0% 0 0.0% 0 0.0% 0 0.4% 2 0.2% 1 0.2% 1 0.1% 1Central London/ West End 3.2% 32 2.5% 7 3.5% 25 3.5% 3 2.7% 11 3.6% 18 4.6% 22 1.9% 8 3.5% 28Colindale 0.3% 3 0.4% 1 0.3% 2 0.0% 0 0.5% 2 0.2% 1 0.4% 2 0.2% 1 0.4% 3DFS, Brent Cross 0.5% 5 0.0% 0 0.7% 5 0.0% 0 0.7% 3 0.4% 2 0.2% 1 1.0% 4 0.5% 4DFS, South Ruislip,
(Victoria Retail Park) 3.5% 35 1.4% 4 4.3% 31 7.0% 6 6.2% 25 0.8% 4 3.7% 18 3.4% 14 3.9% 31
DFS, Watford, (Colne Valley Retail Park)
0.8% 8 0.7% 2 0.8% 6 1.2% 1 1.0% 4 0.6% 3 1.5% 7 0.2% 1 0.9% 7
Dreams, Hayes Bridge Retail Park, Uxbridge Road, Hayes
0.1% 1 0.4% 1 0.0% 0 0.0% 0 0.2% 1 0.0% 0 0.0% 0 0.2% 1 0.1% 1
Dunelm Mill, Northolt Road, Harrow
0.1% 1 0.4% 1 0.0% 0 0.0% 0 0.2% 1 0.0% 0 0.2% 1 0.0% 0 0.1% 1
Ealing 0.1% 1 0.0% 0 0.1% 1 0.0% 0 0.2% 1 0.0% 0 0.2% 1 0.0% 0 0.1% 1Eastcote 0.2% 2 0.4% 1 0.1% 1 0.0% 0 0.0% 0 0.4% 2 0.4% 2 0.0% 0 0.1% 1Edgware 0.5% 5 0.4% 1 0.6% 4 1.2% 1 0.0% 0 0.8% 4 0.2% 1 1.0% 4 0.6% 5Enfield 0.1% 1 0.0% 0 0.1% 1 0.0% 0 0.0% 0 0.2% 1 0.0% 0 0.0% 0 0.1% 1Exeter 0.1% 1 0.0% 0 0.1% 1 0.0% 0 0.0% 0 0.2% 1 0.2% 1 0.0% 0 0.1% 1Furniture Village, Ruislip
Retail Park, (Victoria Rd) 1.3% 13 1.8% 5 1.1% 8 0.0% 0 1.5% 6 1.4% 7 1.0% 5 1.7% 7 1.4% 11
Harrow 7.0% 70 9.3% 26 6.1% 44 14.0% 12 6.2% 25 6.6% 33 5.8% 28 9.0% 37 6.2% 50Harrow Weald 0.2% 2 0.0% 0 0.3% 2 1.2% 1 0.2% 1 0.0% 0 0.2% 1 0.0% 0 0.3% 2Harveys, Colne Valley Retail
Park, Lower High Street, Watford
0.1% 1 0.0% 0 0.1% 1 1.2% 1 0.0% 0 0.0% 0 0.2% 1 0.0% 0 0.1% 1
Harveys, Edgware Road, Colindale
0.1% 1 0.0% 0 0.1% 1 0.0% 0 0.0% 0 0.2% 1 0.2% 1 0.0% 0 0.1% 1
Hatch End 0.2% 2 0.4% 1 0.1% 1 1.2% 1 0.2% 1 0.0% 0 0.4% 2 0.0% 0 0.3% 2Hayes 0.2% 2 0.4% 1 0.1% 1 0.0% 0 0.0% 0 0.4% 2 0.2% 1 0.2% 1 0.3% 2High Wycombe,
Buckinghamshire 0.7% 7 0.7% 2 0.7% 5 0.0% 0 0.7% 3 0.8% 4 1.0% 5 0.2% 1 0.9% 7
Homebase, High Road, Harrow
0.1% 1 0.4% 1 0.0% 0 0.0% 0 0.2% 1 0.0% 0 0.0% 0 0.2% 1 0.1% 1
Homebase, Victoria Retail Park, Crown Road, Ruislip
0.2% 2 0.4% 1 0.1% 1 0.0% 0 0.5% 2 0.0% 0 0.4% 2 0.0% 0 0.3% 2
Hyde 0.1% 1 0.0% 0 0.1% 1 0.0% 0 0.2% 1 0.0% 0 0.0% 0 0.2% 1 0.1% 1Ikea, Drury Way, Neasden 0.1% 1 0.0% 0 0.1% 1 1.2% 1 0.0% 0 0.0% 0 0.2% 1 0.0% 0 0.0% 0Ikea, Wembley 2.7% 27 3.2% 9 2.5% 18 7.0% 6 3.7% 15 1.2% 6 2.7% 13 3.4% 14 2.9% 23Internet / Delivered 3.5% 35 5.0% 14 2.9% 21 2.3% 2 5.0% 20 2.4% 12 4.4% 21 2.9% 12 3.2% 26John Lewis, Holmers Farm
Way, Cressex Centre, High Wycombe
0.2% 2 0.0% 0 0.3% 2 0.0% 0 0.2% 1 0.0% 0 0.2% 1 0.0% 0 0.3% 2
Kenton 0.2% 2 0.0% 0 0.3% 2 0.0% 0 0.5% 2 0.0% 0 0.2% 1 0.2% 1 0.1% 1Kingsbury 0.4% 4 0.4% 1 0.4% 3 1.2% 1 0.5% 2 0.2% 1 0.6% 3 0.2% 1 0.5% 4

By Demographics London Borough of Harrow Household Survey Page 16 For Nathaniel Lichfield & Partners May 2009
Total Male Female 18 to 34 35 to 54 55+ ABC1 C2DE Car in hhold
Column %ges. 180509 NEMS market research
Land of Leather, Victoria Road, South Ruislip
0.1% 1 0.0% 0 0.1% 1 0.0% 0 0.2% 1 0.0% 0 0.2% 1 0.0% 0 0.1% 1
London Colney, St. Albans 0.3% 3 0.0% 0 0.4% 3 0.0% 0 0.7% 3 0.0% 0 0.4% 2 0.2% 1 0.4% 3MFI, Edgware Road,
Colindale 0.1% 1 0.4% 1 0.0% 0 1.2% 1 0.0% 0 0.0% 0 0.2% 1 0.0% 0 0.1% 1
Middlesex 0.1% 1 0.0% 0 0.1% 1 0.0% 0 0.0% 0 0.2% 1 0.2% 1 0.0% 0 0.1% 1North Finchley 0.1% 1 0.0% 0 0.1% 1 0.0% 0 0.2% 1 0.0% 0 0.2% 1 0.0% 0 0.1% 1North Harrow 0.8% 8 1.4% 4 0.6% 4 0.0% 0 1.0% 4 0.8% 4 1.0% 5 0.7% 3 0.9% 7Northolt 0.3% 3 0.4% 1 0.3% 2 0.0% 0 0.5% 2 0.2% 1 0.6% 3 0.0% 0 0.4% 3Northwood 0.1% 1 0.0% 0 0.1% 1 0.0% 0 0.0% 0 0.2% 1 0.0% 0 0.0% 0 0.1% 1Pinner 1.8% 18 2.5% 7 1.5% 11 0.0% 0 1.5% 6 2.4% 12 2.1% 10 1.5% 6 2.0% 16Rayners Lane 0.2% 2 0.4% 1 0.1% 1 0.0% 0 0.0% 0 0.4% 2 0.0% 0 0.2% 1 0.1% 1Ruislip 2.7% 27 1.4% 4 3.2% 23 1.2% 1 3.0% 12 2.8% 14 3.3% 16 2.2% 9 3.2% 26Slough 0.1% 1 0.0% 0 0.1% 1 0.0% 0 0.0% 0 0.2% 1 0.0% 0 0.2% 1 0.1% 1South Harrow 1.2% 12 0.4% 1 1.5% 11 0.0% 0 1.5% 6 1.2% 6 1.2% 6 1.2% 5 1.4% 11South Oxney 0.2% 2 0.7% 2 0.0% 0 0.0% 0 0.5% 2 0.0% 0 0.0% 0 0.5% 2 0.3% 2South Ruislip 1.4% 14 1.4% 4 1.4% 10 1.2% 1 1.7% 7 1.2% 6 1.2% 6 1.9% 8 1.6% 13Southall 0.1% 1 0.4% 1 0.0% 0 0.0% 0 0.2% 1 0.0% 0 0.2% 1 0.0% 0 0.1% 1Stanmore 0.4% 4 0.4% 1 0.4% 3 0.0% 0 0.0% 0 0.6% 3 0.4% 2 0.2% 1 0.4% 3Staples Corner Retail Park,
Geron Way, Cricklewood 0.1% 1 0.4% 1 0.0% 0 0.0% 0 0.2% 1 0.0% 0 0.2% 1 0.0% 0 0.1% 1
Uxbridge 0.4% 4 0.0% 0 0.6% 4 0.0% 0 0.5% 2 0.4% 2 0.6% 3 0.2% 1 0.3% 2Watford 10.6% 106 9.3% 26 11.1% 80 5.8% 5 12.2% 49 10.5% 52 12.5% 60 8.7% 36 12.5% 100Wealdstone 0.4% 4 0.4% 1 0.4% 3 1.2% 1 0.5% 2 0.2% 1 0.6% 3 0.2% 1 0.3% 2Wembley 2.7% 27 2.9% 8 2.6% 19 3.5% 3 4.0% 16 1.6% 8 4.2% 20 1.5% 6 3.1% 25Westfield / White City 0.3% 3 0.0% 0 0.4% 3 0.0% 0 0.7% 3 0.0% 0 0.6% 3 0.0% 0 0.4% 3Wickes, Alperton 0.3% 3 0.7% 2 0.1% 1 1.2% 1 0.5% 2 0.0% 0 0.4% 2 0.2% 1 0.4% 3Willesden 0.1% 1 0.4% 1 0.0% 0 0.0% 0 0.2% 1 0.0% 0 0.2% 1 0.0% 0 0.1% 1Windsor, Berkshire 0.1% 1 0.4% 1 0.0% 0 0.0% 0 0.0% 0 0.2% 1 0.2% 1 0.0% 0 0.1% 1Yeading 0.1% 1 0.0% 0 0.1% 1 0.0% 0 0.0% 0 0.2% 1 0.2% 1 0.0% 0 0.1% 1(Don't buy these goods) 23.9% 239 25.0% 70 23.5% 169 23.3% 20 16.7% 67 29.0% 144 15.4% 74 29.6% 122 19.6% 157(Don't know / can't
remember) 15.6% 156 15.4% 43 15.7% 113 10.5% 9 12.2% 49 19.1% 95 13.9% 67 17.0% 70 14.7% 118
Base: 1000 280 720 86 402 497 481 412 801

By Demographics London Borough of Harrow Household Survey Page 17 For Nathaniel Lichfield & Partners May 2009
Total Male Female 18 to 34 35 to 54 55+ ABC1 C2DE Car in hhold
Column %ges. 180509 NEMS market research
Q10 Which store or location did your household last buy DIY / hardware and garden items? Alperton 0.4% 4 0.7% 2 0.3% 2 1.2% 1 0.0% 0 0.6% 3 0.4% 2 0.2% 1 0.4% 3Argos, High Street, Ruislip,
Hillingdon 0.1% 1 0.0% 0 0.1% 1 0.0% 0 0.0% 0 0.2% 1 0.0% 0 0.2% 1 0.1% 1
Asda, Edgware Road, Colindale
0.1% 1 0.4% 1 0.0% 0 1.2% 1 0.0% 0 0.0% 0 0.2% 1 0.0% 0 0.0% 0
B&Q, Acton 1.6% 16 2.1% 6 1.4% 10 2.3% 2 1.7% 7 1.4% 7 1.0% 5 2.4% 10 2.0% 16B&Q, Cricklewood 0.3% 3 0.0% 0 0.4% 3 0.0% 0 0.5% 2 0.2% 1 0.4% 2 0.0% 0 0.4% 3B&Q, Stanmore, Honeypot
Lane 12.0% 120 13.6% 38 11.4% 82 5.8% 5 11.9% 48 12.7% 63 11.4% 55 12.1% 50 13.2% 106
B&Q, Watford 7.1% 71 5.7% 16 7.6% 55 0.0% 0 9.0% 36 6.8% 34 7.9% 38 7.0% 29 8.4% 67B&Q, Yeading, Hayes 2.9% 29 4.3% 12 2.4% 17 1.2% 1 4.0% 16 2.2% 11 2.1% 10 4.1% 17 3.1% 25Brent Cross 0.7% 7 0.7% 2 0.7% 5 0.0% 0 0.7% 3 0.8% 4 0.8% 4 0.2% 1 0.9% 7Bucks Hill 0.1% 1 0.0% 0 0.1% 1 0.0% 0 0.0% 0 0.2% 1 0.0% 0 0.2% 1 0.1% 1Burnt Oak 0.1% 1 0.0% 0 0.1% 1 0.0% 0 0.2% 1 0.0% 0 0.0% 0 0.2% 1 0.1% 1Bushey, Hertfordshire 0.2% 2 0.0% 0 0.3% 2 0.0% 0 0.0% 0 0.4% 2 0.2% 1 0.2% 1 0.3% 2Carpenter Park 0.2% 2 0.4% 1 0.1% 1 0.0% 0 0.2% 1 0.2% 1 0.4% 2 0.0% 0 0.3% 2Central London/ West End 0.2% 2 0.4% 1 0.1% 1 0.0% 0 0.2% 1 0.2% 1 0.4% 2 0.0% 0 0.3% 2Chalfont St. Giles,
Buckinghamshire 0.1% 1 0.0% 0 0.1% 1 0.0% 0 0.0% 0 0.2% 1 0.2% 1 0.0% 0 0.1% 1
Chenies Garden Centre, Rickmansworth
0.1% 1 0.0% 0 0.1% 1 0.0% 0 0.2% 1 0.0% 0 0.2% 1 0.0% 0 0.1% 1
Chorleywood, Rickmansworth
0.2% 2 0.7% 2 0.0% 0 0.0% 0 0.5% 2 0.0% 0 0.4% 2 0.0% 0 0.3% 2
Colindale 0.7% 7 1.8% 5 0.3% 2 2.3% 2 0.7% 3 0.4% 2 1.2% 6 0.2% 1 0.7% 6Ducks Hill Garden Centre,
Duck's Hill Road, Ruislip 0.3% 3 0.4% 1 0.3% 2 1.2% 1 0.2% 1 0.2% 1 0.6% 3 0.0% 0 0.4% 3
Ealing 0.1% 1 0.0% 0 0.1% 1 0.0% 0 0.2% 1 0.0% 0 0.2% 1 0.0% 0 0.1% 1Eastcote 0.3% 3 0.7% 2 0.1% 1 1.2% 1 0.0% 0 0.4% 2 0.2% 1 0.2% 1 0.4% 3Edgware 0.5% 5 1.1% 3 0.3% 2 0.0% 0 0.2% 1 0.8% 4 0.4% 2 0.7% 3 0.5% 4Ely, Cambridgeshire 0.1% 1 0.4% 1 0.0% 0 0.0% 0 0.0% 0 0.2% 1 0.2% 1 0.0% 0 0.1% 1Enfield 0.1% 1 0.4% 1 0.0% 0 0.0% 0 0.0% 0 0.2% 1 0.0% 0 0.2% 1 0.1% 1Harrow 4.8% 48 3.9% 11 5.1% 37 9.3% 8 4.7% 19 4.2% 21 5.0% 24 4.4% 18 4.4% 35Harrow Weald 0.2% 2 0.0% 0 0.3% 2 0.0% 0 0.2% 1 0.2% 1 0.4% 2 0.0% 0 0.3% 2Hatch End 0.2% 2 0.4% 1 0.1% 1 0.0% 0 0.5% 2 0.0% 0 0.4% 2 0.0% 0 0.3% 2Homebase, Colindale 1.0% 10 0.7% 2 1.1% 8 2.3% 2 1.0% 4 0.8% 4 1.5% 7 0.5% 2 1.2% 10Homebase, Hendon 1.3% 13 2.5% 7 0.8% 6 2.3% 2 1.2% 5 1.2% 6 1.2% 6 1.5% 6 1.4% 11Homebase, High Road,
Harrow Weald 11.1% 111 8.2% 23 12.2% 88 11.6% 10 13.7% 55 8.9% 44 12.3% 59 10.0% 41 11.9% 95
Homebase, Ruislip, Victoria Retail Park
15.0% 150 12.5% 35 16.0% 115 17.4% 15 19.2% 77 11.7% 58 16.8% 81 13.8% 57 17.2% 138
Homebase, Wembley 0.1% 1 0.0% 0 0.1% 1 0.0% 0 0.2% 1 0.0% 0 0.2% 1 0.0% 0 0.1% 1Hounslow 0.1% 1 0.0% 0 0.1% 1 1.2% 1 0.0% 0 0.0% 0 0.2% 1 0.0% 0 0.1% 1Internet / Delivered 0.9% 9 1.1% 3 0.8% 6 2.3% 2 1.0% 4 0.6% 3 1.7% 8 0.2% 1 0.7% 6Kingsbury 0.7% 7 1.1% 3 0.6% 4 0.0% 0 0.7% 3 0.8% 4 0.8% 4 0.5% 2 0.6% 5London Colney, St. Albans 0.1% 1 0.0% 0 0.1% 1 0.0% 0 0.0% 0 0.2% 1 0.2% 1 0.0% 0 0.1% 1Neasden 0.1% 1 0.0% 0 0.1% 1 0.0% 0 0.0% 0 0.2% 1 0.0% 0 0.2% 1 0.0% 0North Harrow 0.2% 2 0.0% 0 0.3% 2 0.0% 0 0.5% 2 0.0% 0 0.4% 2 0.0% 0 0.3% 2Northwood 0.1% 1 0.0% 0 0.1% 1 0.0% 0 0.0% 0 0.2% 1 0.0% 0 0.2% 1 0.0% 0Osterley 0.1% 1 0.0% 0 0.1% 1 0.0% 0 0.2% 1 0.0% 0 0.2% 1 0.0% 0 0.1% 1Pinner 0.5% 5 0.7% 2 0.4% 3 0.0% 0 0.0% 0 1.0% 5 0.2% 1 0.7% 3 0.4% 3Queensbury 0.3% 3 0.0% 0 0.4% 3 0.0% 0 0.5% 2 0.2% 1 0.2% 1 0.5% 2 0.4% 3Rayners Lane 0.3% 3 1.1% 3 0.0% 0 0.0% 0 0.2% 1 0.4% 2 0.6% 3 0.0% 0 0.4% 3Rivers Retail Park, Mustard
Mill Road, Staines 0.1% 1 0.0% 0 0.1% 1 1.2% 1 0.0% 0 0.0% 0 0.0% 0 0.2% 1 0.1% 1
Robert Dyas Station Road, Harrow
0.1% 1 0.0% 0 0.1% 1 0.0% 0 0.0% 0 0.2% 1 0.2% 1 0.0% 0 0.1% 1
Ruislip 1.7% 17 1.4% 4 1.8% 13 0.0% 0 2.7% 11 1.2% 6 2.7% 13 0.5% 2 1.6% 13Sevenoaks 0.1% 1 0.0% 0 0.1% 1 0.0% 0 0.0% 0 0.2% 1 0.2% 1 0.0% 0 0.1% 1South Harrow 0.5% 5 0.4% 1 0.6% 4 0.0% 0 0.2% 1 0.8% 4 0.2% 1 0.7% 3 0.3% 2South Oxney 1.7% 17 2.9% 8 1.3% 9 1.2% 1 1.2% 5 2.2% 11 1.9% 9 1.5% 6 2.0% 16St. Albans 0.1% 1 0.0% 0 0.1% 1 0.0% 0 0.0% 0 0.2% 1 0.2% 1 0.0% 0 0.1% 1Stanmore 1.3% 13 1.8% 5 1.1% 8 0.0% 0 0.7% 3 2.0% 10 1.5% 7 1.2% 5 1.6% 13Sudbury Hill 0.1% 1 0.0% 0 0.1% 1 1.2% 1 0.0% 0 0.0% 0 0.2% 1 0.0% 0 0.0% 0Uxbridge 0.1% 1 0.0% 0 0.1% 1 0.0% 0 0.0% 0 0.2% 1 0.0% 0 0.2% 1 0.1% 1Watford 2.9% 29 2.9% 8 2.9% 21 3.5% 3 4.2% 17 1.8% 9 3.7% 18 1.9% 8 3.2% 26Wealdstone 0.4% 4 0.7% 2 0.3% 2 0.0% 0 0.7% 3 0.2% 1 0.2% 1 0.7% 3 0.5% 4Wembley 1.2% 12 2.5% 7 0.7% 5 2.3% 2 0.5% 2 1.6% 8 1.9% 9 0.7% 3 0.9% 7Whittington 0.1% 1 0.0% 0 0.1% 1 0.0% 0 0.0% 0 0.2% 1 0.0% 0 0.2% 1 0.0% 0Wickes, Station Road,
Harrow 0.2% 2 0.7% 2 0.0% 0 0.0% 0 0.5% 2 0.0% 0 0.2% 1 0.2% 1 0.3% 2
Wickes, Victoria Road, Ruislip
0.7% 7 1.4% 4 0.4% 3 2.3% 2 1.2% 5 0.0% 0 0.8% 4 0.7% 3 0.6% 5
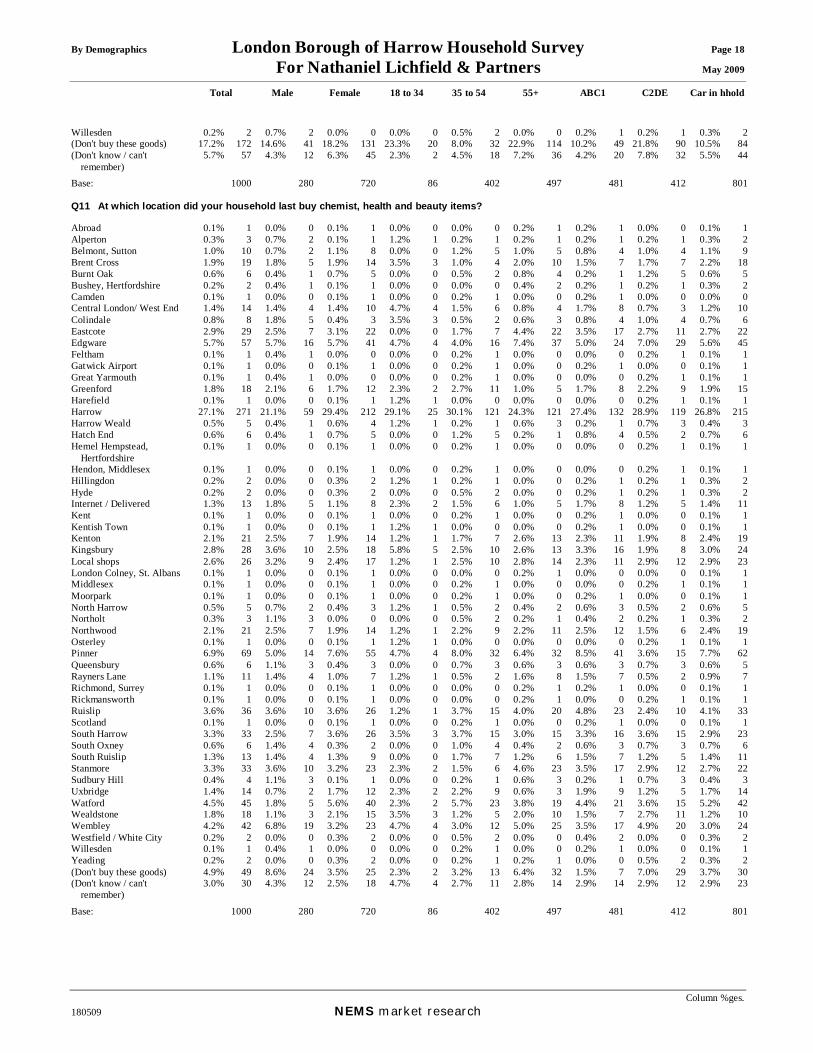
By Demographics London Borough of Harrow Household Survey Page 18 For Nathaniel Lichfield & Partners May 2009
Total Male Female 18 to 34 35 to 54 55+ ABC1 C2DE Car in hhold
Column %ges. 180509 NEMS market research
Willesden 0.2% 2 0.7% 2 0.0% 0 0.0% 0 0.5% 2 0.0% 0 0.2% 1 0.2% 1 0.3% 2(Don't buy these goods) 17.2% 172 14.6% 41 18.2% 131 23.3% 20 8.0% 32 22.9% 114 10.2% 49 21.8% 90 10.5% 84(Don't know / can't
remember) 5.7% 57 4.3% 12 6.3% 45 2.3% 2 4.5% 18 7.2% 36 4.2% 20 7.8% 32 5.5% 44
Base: 1000 280 720 86 402 497 481 412 801 Q11 At which location did your household last buy chemist, health and beauty items? Abroad 0.1% 1 0.0% 0 0.1% 1 0.0% 0 0.0% 0 0.2% 1 0.2% 1 0.0% 0 0.1% 1Alperton 0.3% 3 0.7% 2 0.1% 1 1.2% 1 0.2% 1 0.2% 1 0.2% 1 0.2% 1 0.3% 2Belmont, Sutton 1.0% 10 0.7% 2 1.1% 8 0.0% 0 1.2% 5 1.0% 5 0.8% 4 1.0% 4 1.1% 9Brent Cross 1.9% 19 1.8% 5 1.9% 14 3.5% 3 1.0% 4 2.0% 10 1.5% 7 1.7% 7 2.2% 18Burnt Oak 0.6% 6 0.4% 1 0.7% 5 0.0% 0 0.5% 2 0.8% 4 0.2% 1 1.2% 5 0.6% 5Bushey, Hertfordshire 0.2% 2 0.4% 1 0.1% 1 0.0% 0 0.0% 0 0.4% 2 0.2% 1 0.2% 1 0.3% 2Camden 0.1% 1 0.0% 0 0.1% 1 0.0% 0 0.2% 1 0.0% 0 0.2% 1 0.0% 0 0.0% 0Central London/ West End 1.4% 14 1.4% 4 1.4% 10 4.7% 4 1.5% 6 0.8% 4 1.7% 8 0.7% 3 1.2% 10Colindale 0.8% 8 1.8% 5 0.4% 3 3.5% 3 0.5% 2 0.6% 3 0.8% 4 1.0% 4 0.7% 6Eastcote 2.9% 29 2.5% 7 3.1% 22 0.0% 0 1.7% 7 4.4% 22 3.5% 17 2.7% 11 2.7% 22Edgware 5.7% 57 5.7% 16 5.7% 41 4.7% 4 4.0% 16 7.4% 37 5.0% 24 7.0% 29 5.6% 45Feltham 0.1% 1 0.4% 1 0.0% 0 0.0% 0 0.2% 1 0.0% 0 0.0% 0 0.2% 1 0.1% 1Gatwick Airport 0.1% 1 0.0% 0 0.1% 1 0.0% 0 0.2% 1 0.0% 0 0.2% 1 0.0% 0 0.1% 1Great Yarmouth 0.1% 1 0.4% 1 0.0% 0 0.0% 0 0.2% 1 0.0% 0 0.0% 0 0.2% 1 0.1% 1Greenford 1.8% 18 2.1% 6 1.7% 12 2.3% 2 2.7% 11 1.0% 5 1.7% 8 2.2% 9 1.9% 15Harefield 0.1% 1 0.0% 0 0.1% 1 1.2% 1 0.0% 0 0.0% 0 0.0% 0 0.2% 1 0.1% 1Harrow 27.1% 271 21.1% 59 29.4% 212 29.1% 25 30.1% 121 24.3% 121 27.4% 132 28.9% 119 26.8% 215Harrow Weald 0.5% 5 0.4% 1 0.6% 4 1.2% 1 0.2% 1 0.6% 3 0.2% 1 0.7% 3 0.4% 3Hatch End 0.6% 6 0.4% 1 0.7% 5 0.0% 0 1.2% 5 0.2% 1 0.8% 4 0.5% 2 0.7% 6Hemel Hempstead,
Hertfordshire 0.1% 1 0.0% 0 0.1% 1 0.0% 0 0.2% 1 0.0% 0 0.0% 0 0.2% 1 0.1% 1
Hendon, Middlesex 0.1% 1 0.0% 0 0.1% 1 0.0% 0 0.2% 1 0.0% 0 0.0% 0 0.2% 1 0.1% 1Hillingdon 0.2% 2 0.0% 0 0.3% 2 1.2% 1 0.2% 1 0.0% 0 0.2% 1 0.2% 1 0.3% 2Hyde 0.2% 2 0.0% 0 0.3% 2 0.0% 0 0.5% 2 0.0% 0 0.2% 1 0.2% 1 0.3% 2Internet / Delivered 1.3% 13 1.8% 5 1.1% 8 2.3% 2 1.5% 6 1.0% 5 1.7% 8 1.2% 5 1.4% 11Kent 0.1% 1 0.0% 0 0.1% 1 0.0% 0 0.2% 1 0.0% 0 0.2% 1 0.0% 0 0.1% 1Kentish Town 0.1% 1 0.0% 0 0.1% 1 1.2% 1 0.0% 0 0.0% 0 0.2% 1 0.0% 0 0.1% 1Kenton 2.1% 21 2.5% 7 1.9% 14 1.2% 1 1.7% 7 2.6% 13 2.3% 11 1.9% 8 2.4% 19Kingsbury 2.8% 28 3.6% 10 2.5% 18 5.8% 5 2.5% 10 2.6% 13 3.3% 16 1.9% 8 3.0% 24Local shops 2.6% 26 3.2% 9 2.4% 17 1.2% 1 2.5% 10 2.8% 14 2.3% 11 2.9% 12 2.9% 23London Colney, St. Albans 0.1% 1 0.0% 0 0.1% 1 0.0% 0 0.0% 0 0.2% 1 0.0% 0 0.0% 0 0.1% 1Middlesex 0.1% 1 0.0% 0 0.1% 1 0.0% 0 0.2% 1 0.0% 0 0.0% 0 0.2% 1 0.1% 1Moorpark 0.1% 1 0.0% 0 0.1% 1 0.0% 0 0.2% 1 0.0% 0 0.2% 1 0.0% 0 0.1% 1North Harrow 0.5% 5 0.7% 2 0.4% 3 1.2% 1 0.5% 2 0.4% 2 0.6% 3 0.5% 2 0.6% 5Northolt 0.3% 3 1.1% 3 0.0% 0 0.0% 0 0.5% 2 0.2% 1 0.4% 2 0.2% 1 0.3% 2Northwood 2.1% 21 2.5% 7 1.9% 14 1.2% 1 2.2% 9 2.2% 11 2.5% 12 1.5% 6 2.4% 19Osterley 0.1% 1 0.0% 0 0.1% 1 1.2% 1 0.0% 0 0.0% 0 0.0% 0 0.2% 1 0.1% 1Pinner 6.9% 69 5.0% 14 7.6% 55 4.7% 4 8.0% 32 6.4% 32 8.5% 41 3.6% 15 7.7% 62Queensbury 0.6% 6 1.1% 3 0.4% 3 0.0% 0 0.7% 3 0.6% 3 0.6% 3 0.7% 3 0.6% 5Rayners Lane 1.1% 11 1.4% 4 1.0% 7 1.2% 1 0.5% 2 1.6% 8 1.5% 7 0.5% 2 0.9% 7Richmond, Surrey 0.1% 1 0.0% 0 0.1% 1 0.0% 0 0.0% 0 0.2% 1 0.2% 1 0.0% 0 0.1% 1Rickmansworth 0.1% 1 0.0% 0 0.1% 1 0.0% 0 0.0% 0 0.2% 1 0.0% 0 0.2% 1 0.1% 1Ruislip 3.6% 36 3.6% 10 3.6% 26 1.2% 1 3.7% 15 4.0% 20 4.8% 23 2.4% 10 4.1% 33Scotland 0.1% 1 0.0% 0 0.1% 1 0.0% 0 0.2% 1 0.0% 0 0.2% 1 0.0% 0 0.1% 1South Harrow 3.3% 33 2.5% 7 3.6% 26 3.5% 3 3.7% 15 3.0% 15 3.3% 16 3.6% 15 2.9% 23South Oxney 0.6% 6 1.4% 4 0.3% 2 0.0% 0 1.0% 4 0.4% 2 0.6% 3 0.7% 3 0.7% 6South Ruislip 1.3% 13 1.4% 4 1.3% 9 0.0% 0 1.7% 7 1.2% 6 1.5% 7 1.2% 5 1.4% 11Stanmore 3.3% 33 3.6% 10 3.2% 23 2.3% 2 1.5% 6 4.6% 23 3.5% 17 2.9% 12 2.7% 22Sudbury Hill 0.4% 4 1.1% 3 0.1% 1 0.0% 0 0.2% 1 0.6% 3 0.2% 1 0.7% 3 0.4% 3Uxbridge 1.4% 14 0.7% 2 1.7% 12 2.3% 2 2.2% 9 0.6% 3 1.9% 9 1.2% 5 1.7% 14Watford 4.5% 45 1.8% 5 5.6% 40 2.3% 2 5.7% 23 3.8% 19 4.4% 21 3.6% 15 5.2% 42Wealdstone 1.8% 18 1.1% 3 2.1% 15 3.5% 3 1.2% 5 2.0% 10 1.5% 7 2.7% 11 1.2% 10Wembley 4.2% 42 6.8% 19 3.2% 23 4.7% 4 3.0% 12 5.0% 25 3.5% 17 4.9% 20 3.0% 24Westfield / White City 0.2% 2 0.0% 0 0.3% 2 0.0% 0 0.5% 2 0.0% 0 0.4% 2 0.0% 0 0.3% 2Willesden 0.1% 1 0.4% 1 0.0% 0 0.0% 0 0.2% 1 0.0% 0 0.2% 1 0.0% 0 0.1% 1Yeading 0.2% 2 0.0% 0 0.3% 2 0.0% 0 0.2% 1 0.2% 1 0.0% 0 0.5% 2 0.3% 2(Don't buy these goods) 4.9% 49 8.6% 24 3.5% 25 2.3% 2 3.2% 13 6.4% 32 1.5% 7 7.0% 29 3.7% 30(Don't know / can't
remember) 3.0% 30 4.3% 12 2.5% 18 4.7% 4 2.7% 11 2.8% 14 2.9% 14 2.9% 12 2.9% 23
Base: 1000 280 720 86 402 497 481 412 801
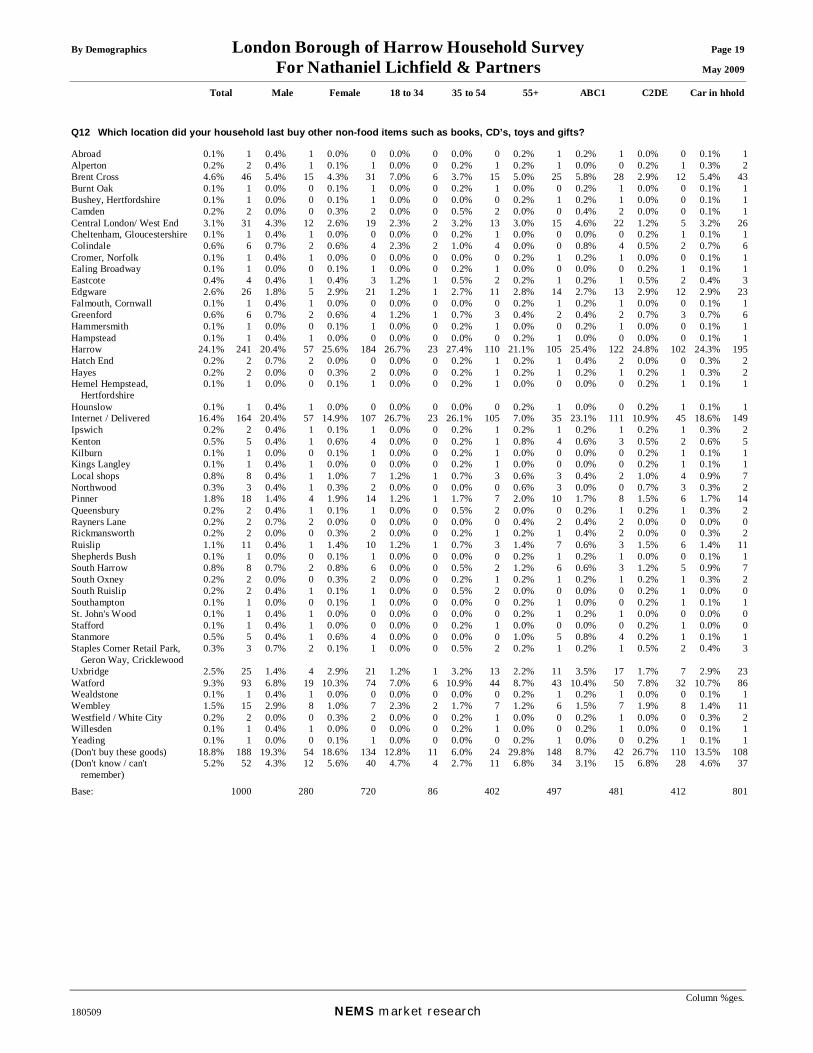
By Demographics London Borough of Harrow Household Survey Page 19 For Nathaniel Lichfield & Partners May 2009
Total Male Female 18 to 34 35 to 54 55+ ABC1 C2DE Car in hhold
Column %ges. 180509 NEMS market research
Q12 Which location did your household last buy other non-food items such as books, CD’s, toys and gifts? Abroad 0.1% 1 0.4% 1 0.0% 0 0.0% 0 0.0% 0 0.2% 1 0.2% 1 0.0% 0 0.1% 1Alperton 0.2% 2 0.4% 1 0.1% 1 0.0% 0 0.2% 1 0.2% 1 0.0% 0 0.2% 1 0.3% 2Brent Cross 4.6% 46 5.4% 15 4.3% 31 7.0% 6 3.7% 15 5.0% 25 5.8% 28 2.9% 12 5.4% 43Burnt Oak 0.1% 1 0.0% 0 0.1% 1 0.0% 0 0.2% 1 0.0% 0 0.2% 1 0.0% 0 0.1% 1Bushey, Hertfordshire 0.1% 1 0.0% 0 0.1% 1 0.0% 0 0.0% 0 0.2% 1 0.2% 1 0.0% 0 0.1% 1Camden 0.2% 2 0.0% 0 0.3% 2 0.0% 0 0.5% 2 0.0% 0 0.4% 2 0.0% 0 0.1% 1Central London/ West End 3.1% 31 4.3% 12 2.6% 19 2.3% 2 3.2% 13 3.0% 15 4.6% 22 1.2% 5 3.2% 26Cheltenham, Gloucestershire 0.1% 1 0.4% 1 0.0% 0 0.0% 0 0.2% 1 0.0% 0 0.0% 0 0.2% 1 0.1% 1Colindale 0.6% 6 0.7% 2 0.6% 4 2.3% 2 1.0% 4 0.0% 0 0.8% 4 0.5% 2 0.7% 6Cromer, Norfolk 0.1% 1 0.4% 1 0.0% 0 0.0% 0 0.0% 0 0.2% 1 0.2% 1 0.0% 0 0.1% 1Ealing Broadway 0.1% 1 0.0% 0 0.1% 1 0.0% 0 0.2% 1 0.0% 0 0.0% 0 0.2% 1 0.1% 1Eastcote 0.4% 4 0.4% 1 0.4% 3 1.2% 1 0.5% 2 0.2% 1 0.2% 1 0.5% 2 0.4% 3Edgware 2.6% 26 1.8% 5 2.9% 21 1.2% 1 2.7% 11 2.8% 14 2.7% 13 2.9% 12 2.9% 23Falmouth, Cornwall 0.1% 1 0.4% 1 0.0% 0 0.0% 0 0.0% 0 0.2% 1 0.2% 1 0.0% 0 0.1% 1Greenford 0.6% 6 0.7% 2 0.6% 4 1.2% 1 0.7% 3 0.4% 2 0.4% 2 0.7% 3 0.7% 6Hammersmith 0.1% 1 0.0% 0 0.1% 1 0.0% 0 0.2% 1 0.0% 0 0.2% 1 0.0% 0 0.1% 1Hampstead 0.1% 1 0.4% 1 0.0% 0 0.0% 0 0.0% 0 0.2% 1 0.0% 0 0.0% 0 0.1% 1Harrow 24.1% 241 20.4% 57 25.6% 184 26.7% 23 27.4% 110 21.1% 105 25.4% 122 24.8% 102 24.3% 195Hatch End 0.2% 2 0.7% 2 0.0% 0 0.0% 0 0.2% 1 0.2% 1 0.4% 2 0.0% 0 0.3% 2Hayes 0.2% 2 0.0% 0 0.3% 2 0.0% 0 0.2% 1 0.2% 1 0.2% 1 0.2% 1 0.3% 2Hemel Hempstead,
Hertfordshire 0.1% 1 0.0% 0 0.1% 1 0.0% 0 0.2% 1 0.0% 0 0.0% 0 0.2% 1 0.1% 1
Hounslow 0.1% 1 0.4% 1 0.0% 0 0.0% 0 0.0% 0 0.2% 1 0.0% 0 0.2% 1 0.1% 1Internet / Delivered 16.4% 164 20.4% 57 14.9% 107 26.7% 23 26.1% 105 7.0% 35 23.1% 111 10.9% 45 18.6% 149Ipswich 0.2% 2 0.4% 1 0.1% 1 0.0% 0 0.2% 1 0.2% 1 0.2% 1 0.2% 1 0.3% 2Kenton 0.5% 5 0.4% 1 0.6% 4 0.0% 0 0.2% 1 0.8% 4 0.6% 3 0.5% 2 0.6% 5Kilburn 0.1% 1 0.0% 0 0.1% 1 0.0% 0 0.2% 1 0.0% 0 0.0% 0 0.2% 1 0.1% 1Kings Langley 0.1% 1 0.4% 1 0.0% 0 0.0% 0 0.2% 1 0.0% 0 0.0% 0 0.2% 1 0.1% 1Local shops 0.8% 8 0.4% 1 1.0% 7 1.2% 1 0.7% 3 0.6% 3 0.4% 2 1.0% 4 0.9% 7Northwood 0.3% 3 0.4% 1 0.3% 2 0.0% 0 0.0% 0 0.6% 3 0.0% 0 0.7% 3 0.3% 2Pinner 1.8% 18 1.4% 4 1.9% 14 1.2% 1 1.7% 7 2.0% 10 1.7% 8 1.5% 6 1.7% 14Queensbury 0.2% 2 0.4% 1 0.1% 1 0.0% 0 0.5% 2 0.0% 0 0.2% 1 0.2% 1 0.3% 2Rayners Lane 0.2% 2 0.7% 2 0.0% 0 0.0% 0 0.0% 0 0.4% 2 0.4% 2 0.0% 0 0.0% 0Rickmansworth 0.2% 2 0.0% 0 0.3% 2 0.0% 0 0.2% 1 0.2% 1 0.4% 2 0.0% 0 0.3% 2Ruislip 1.1% 11 0.4% 1 1.4% 10 1.2% 1 0.7% 3 1.4% 7 0.6% 3 1.5% 6 1.4% 11Shepherds Bush 0.1% 1 0.0% 0 0.1% 1 0.0% 0 0.0% 0 0.2% 1 0.2% 1 0.0% 0 0.1% 1South Harrow 0.8% 8 0.7% 2 0.8% 6 0.0% 0 0.5% 2 1.2% 6 0.6% 3 1.2% 5 0.9% 7South Oxney 0.2% 2 0.0% 0 0.3% 2 0.0% 0 0.2% 1 0.2% 1 0.2% 1 0.2% 1 0.3% 2South Ruislip 0.2% 2 0.4% 1 0.1% 1 0.0% 0 0.5% 2 0.0% 0 0.0% 0 0.2% 1 0.0% 0Southampton 0.1% 1 0.0% 0 0.1% 1 0.0% 0 0.0% 0 0.2% 1 0.0% 0 0.2% 1 0.1% 1St. John's Wood 0.1% 1 0.4% 1 0.0% 0 0.0% 0 0.0% 0 0.2% 1 0.2% 1 0.0% 0 0.0% 0Stafford 0.1% 1 0.4% 1 0.0% 0 0.0% 0 0.2% 1 0.0% 0 0.0% 0 0.2% 1 0.0% 0Stanmore 0.5% 5 0.4% 1 0.6% 4 0.0% 0 0.0% 0 1.0% 5 0.8% 4 0.2% 1 0.1% 1Staples Corner Retail Park,
Geron Way, Cricklewood 0.3% 3 0.7% 2 0.1% 1 0.0% 0 0.5% 2 0.2% 1 0.2% 1 0.5% 2 0.4% 3
Uxbridge 2.5% 25 1.4% 4 2.9% 21 1.2% 1 3.2% 13 2.2% 11 3.5% 17 1.7% 7 2.9% 23Watford 9.3% 93 6.8% 19 10.3% 74 7.0% 6 10.9% 44 8.7% 43 10.4% 50 7.8% 32 10.7% 86Wealdstone 0.1% 1 0.4% 1 0.0% 0 0.0% 0 0.0% 0 0.2% 1 0.2% 1 0.0% 0 0.1% 1Wembley 1.5% 15 2.9% 8 1.0% 7 2.3% 2 1.7% 7 1.2% 6 1.5% 7 1.9% 8 1.4% 11Westfield / White City 0.2% 2 0.0% 0 0.3% 2 0.0% 0 0.2% 1 0.0% 0 0.2% 1 0.0% 0 0.3% 2Willesden 0.1% 1 0.4% 1 0.0% 0 0.0% 0 0.2% 1 0.0% 0 0.2% 1 0.0% 0 0.1% 1Yeading 0.1% 1 0.0% 0 0.1% 1 0.0% 0 0.0% 0 0.2% 1 0.0% 0 0.2% 1 0.1% 1(Don't buy these goods) 18.8% 188 19.3% 54 18.6% 134 12.8% 11 6.0% 24 29.8% 148 8.7% 42 26.7% 110 13.5% 108(Don't know / can't
remember) 5.2% 52 4.3% 12 5.6% 40 4.7% 4 2.7% 11 6.8% 34 3.1% 15 6.8% 28 4.6% 37
Base: 1000 280 720 86 402 497 481 412 801
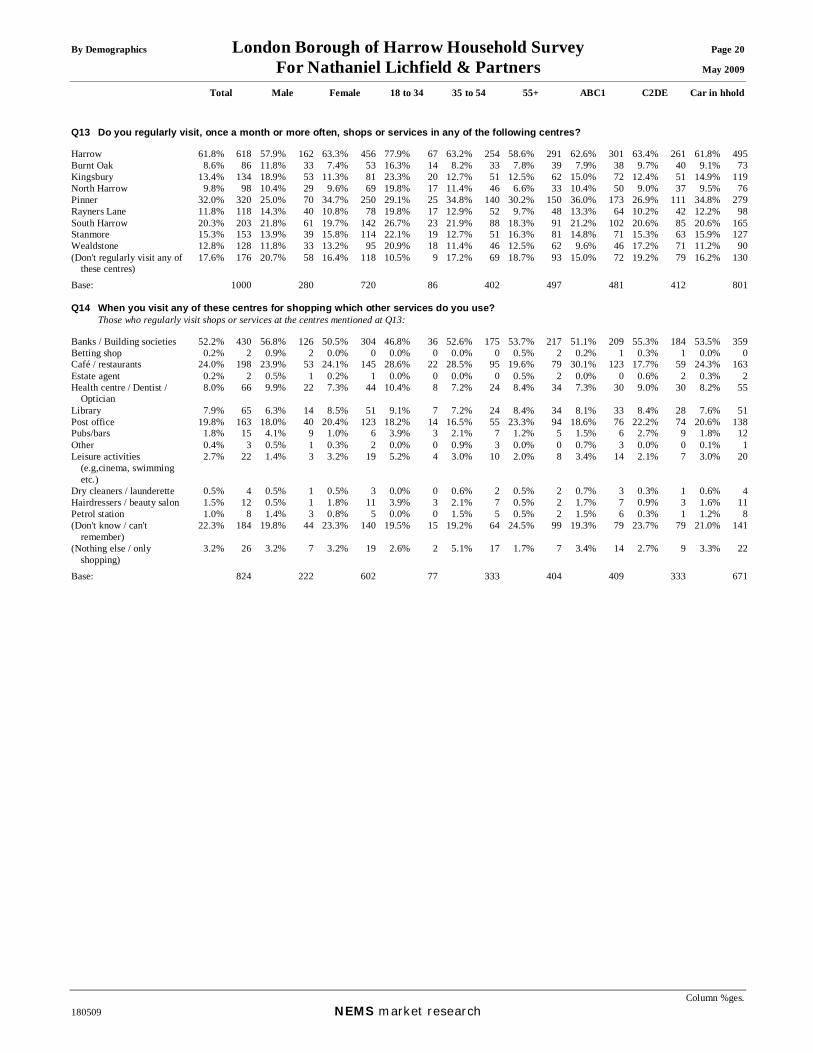
By Demographics London Borough of Harrow Household Survey Page 20 For Nathaniel Lichfield & Partners May 2009
Total Male Female 18 to 34 35 to 54 55+ ABC1 C2DE Car in hhold
Column %ges. 180509 NEMS market research
Q13 Do you regularly visit, once a month or more often, shops or services in any of the following centres? Harrow 61.8% 618 57.9% 162 63.3% 456 77.9% 67 63.2% 254 58.6% 291 62.6% 301 63.4% 261 61.8% 495Burnt Oak 8.6% 86 11.8% 33 7.4% 53 16.3% 14 8.2% 33 7.8% 39 7.9% 38 9.7% 40 9.1% 73Kingsbury 13.4% 134 18.9% 53 11.3% 81 23.3% 20 12.7% 51 12.5% 62 15.0% 72 12.4% 51 14.9% 119North Harrow 9.8% 98 10.4% 29 9.6% 69 19.8% 17 11.4% 46 6.6% 33 10.4% 50 9.0% 37 9.5% 76Pinner 32.0% 320 25.0% 70 34.7% 250 29.1% 25 34.8% 140 30.2% 150 36.0% 173 26.9% 111 34.8% 279Rayners Lane 11.8% 118 14.3% 40 10.8% 78 19.8% 17 12.9% 52 9.7% 48 13.3% 64 10.2% 42 12.2% 98South Harrow 20.3% 203 21.8% 61 19.7% 142 26.7% 23 21.9% 88 18.3% 91 21.2% 102 20.6% 85 20.6% 165Stanmore 15.3% 153 13.9% 39 15.8% 114 22.1% 19 12.7% 51 16.3% 81 14.8% 71 15.3% 63 15.9% 127Wealdstone 12.8% 128 11.8% 33 13.2% 95 20.9% 18 11.4% 46 12.5% 62 9.6% 46 17.2% 71 11.2% 90(Don't regularly visit any of
these centres) 17.6% 176 20.7% 58 16.4% 118 10.5% 9 17.2% 69 18.7% 93 15.0% 72 19.2% 79 16.2% 130
Base: 1000 280 720 86 402 497 481 412 801 Q14 When you visit any of these centres for shopping which other services do you use? Those who regularly visit shops or services at the centres mentioned at Q13: Banks / Building societies 52.2% 430 56.8% 126 50.5% 304 46.8% 36 52.6% 175 53.7% 217 51.1% 209 55.3% 184 53.5% 359Betting shop 0.2% 2 0.9% 2 0.0% 0 0.0% 0 0.0% 0 0.5% 2 0.2% 1 0.3% 1 0.0% 0Café / restaurants 24.0% 198 23.9% 53 24.1% 145 28.6% 22 28.5% 95 19.6% 79 30.1% 123 17.7% 59 24.3% 163Estate agent 0.2% 2 0.5% 1 0.2% 1 0.0% 0 0.0% 0 0.5% 2 0.0% 0 0.6% 2 0.3% 2Health centre / Dentist /
Optician 8.0% 66 9.9% 22 7.3% 44 10.4% 8 7.2% 24 8.4% 34 7.3% 30 9.0% 30 8.2% 55
Library 7.9% 65 6.3% 14 8.5% 51 9.1% 7 7.2% 24 8.4% 34 8.1% 33 8.4% 28 7.6% 51Post office 19.8% 163 18.0% 40 20.4% 123 18.2% 14 16.5% 55 23.3% 94 18.6% 76 22.2% 74 20.6% 138Pubs/bars 1.8% 15 4.1% 9 1.0% 6 3.9% 3 2.1% 7 1.2% 5 1.5% 6 2.7% 9 1.8% 12Other 0.4% 3 0.5% 1 0.3% 2 0.0% 0 0.9% 3 0.0% 0 0.7% 3 0.0% 0 0.1% 1Leisure activities
(e.g,cinema, swimming etc.)
2.7% 22 1.4% 3 3.2% 19 5.2% 4 3.0% 10 2.0% 8 3.4% 14 2.1% 7 3.0% 20
Dry cleaners / launderette 0.5% 4 0.5% 1 0.5% 3 0.0% 0 0.6% 2 0.5% 2 0.7% 3 0.3% 1 0.6% 4Hairdressers / beauty salon 1.5% 12 0.5% 1 1.8% 11 3.9% 3 2.1% 7 0.5% 2 1.7% 7 0.9% 3 1.6% 11Petrol station 1.0% 8 1.4% 3 0.8% 5 0.0% 0 1.5% 5 0.5% 2 1.5% 6 0.3% 1 1.2% 8(Don't know / can't
remember) 22.3% 184 19.8% 44 23.3% 140 19.5% 15 19.2% 64 24.5% 99 19.3% 79 23.7% 79 21.0% 141
(Nothing else / only shopping)
3.2% 26 3.2% 7 3.2% 19 2.6% 2 5.1% 17 1.7% 7 3.4% 14 2.7% 9 3.3% 22
Base: 824 222 602 77 333 404 409 333 671

By Demographics London Borough of Harrow Household Survey Page 21 For Nathaniel Lichfield & Partners May 2009
Total Male Female 18 to 34 35 to 54 55+ ABC1 C2DE Car in hhold
Column %ges. 180509 NEMS market research
Q15 What if anything would make you shop more often in Harrow town centre? Those who regularly visit shops or services at the centres mentioned at Q13: Better accessibility (i.e.
improve traffic flow / public transport links)
0.7% 6 0.0% 0 1.0% 6 1.3% 1 0.9% 3 0.5% 2 1.0% 4 0.6% 2 0.6% 4
Better choice of cafes / restaurants
1.0% 8 0.5% 1 1.2% 7 0.0% 0 1.5% 5 0.7% 3 1.5% 6 0.6% 2 1.0% 7
Better choice of clothing shops
3.3% 27 1.8% 4 3.8% 23 6.5% 5 3.9% 13 2.2% 9 3.4% 14 3.3% 11 3.3% 22
Better choice of shops in general
11.0% 91 8.1% 18 12.1% 73 18.2% 14 12.9% 43 8.4% 34 13.2% 54 9.9% 33 11.6% 78
Better choice of specialist shops (e.g. craft shops, haberdashers etc.)
1.0% 8 0.5% 1 1.2% 7 1.3% 1 0.9% 3 1.0% 4 0.2% 1 2.1% 7 1.0% 7
Better leisure facilities (e.g. Cinema)
0.5% 4 0.9% 2 0.3% 2 1.3% 1 0.3% 1 0.5% 2 0.2% 1 0.9% 3 0.4% 3
Better maintenance / cleanliness
5.9% 49 4.1% 9 6.6% 40 3.9% 3 6.9% 23 5.7% 23 8.8% 36 3.3% 11 6.6% 44
Better quality shops 3.8% 31 1.8% 4 4.5% 27 1.3% 1 3.3% 11 4.7% 19 4.4% 18 3.6% 12 4.2% 28Better safety / More police /
CCTV 4.1% 34 4.5% 10 4.0% 24 0.0% 0 5.4% 18 4.0% 16 4.2% 17 4.5% 15 4.8% 32
Better street market 0.5% 4 0.9% 2 0.3% 2 0.0% 0 0.6% 2 0.5% 2 0.5% 2 0.6% 2 0.6% 4Cheaper / free car parking 8.0% 66 13.5% 30 6.0% 36 6.5% 5 12.3% 41 5.0% 20 11.5% 47 4.8% 16 9.7% 65Escalator or lift at the tube
station 0.1% 1 0.5% 1 0.0% 0 0.0% 0 0.0% 0 0.2% 1 0.2% 1 0.0% 0 0.0% 0
Improve the appearance / atmosphere
0.4% 3 0.0% 0 0.5% 3 0.0% 0 0.6% 2 0.2% 1 0.7% 3 0.0% 0 0.3% 2
Improved bus services 1.7% 14 2.3% 5 1.5% 9 0.0% 0 1.8% 6 2.0% 8 1.7% 7 1.5% 5 1.8% 12Indoor shopping centre 0.2% 2 0.0% 0 0.3% 2 1.3% 1 0.3% 1 0.0% 0 0.5% 2 0.0% 0 0.3% 2Less busy 0.2% 2 0.5% 1 0.2% 1 1.3% 1 0.3% 1 0.0% 0 0.2% 1 0.3% 1 0.1% 1Less food shops 0.1% 1 0.0% 0 0.2% 1 0.0% 0 0.3% 1 0.0% 0 0.0% 0 0.3% 1 0.1% 1Longer opening hours / late-
night shopping 0.4% 3 0.0% 0 0.5% 3 1.3% 1 0.3% 1 0.2% 1 0.5% 2 0.3% 1 0.4% 3
Lower prices / cheaper stores 0.2% 2 0.9% 2 0.0% 0 0.0% 0 0.3% 1 0.2% 1 0.2% 1 0.3% 1 0.1% 1More / better public toilet
facilities 0.2% 2 0.0% 0 0.3% 2 0.0% 0 0.0% 0 0.5% 2 0.0% 0 0.6% 2 0.3% 2
More bicycle-friendly 0.2% 2 0.9% 2 0.0% 0 0.0% 0 0.6% 2 0.0% 0 0.5% 2 0.0% 0 0.1% 1More car parking 6.7% 55 8.6% 19 6.0% 36 3.9% 3 9.6% 32 4.7% 19 10.3% 42 2.7% 9 7.9% 53More cost effective produce 0.5% 4 0.9% 2 0.3% 2 1.3% 1 0.9% 3 0.0% 0 0.5% 2 0.6% 2 0.6% 4More disabled parking
spaces 0.2% 2 0.0% 0 0.3% 2 0.0% 0 0.0% 0 0.2% 1 0.2% 1 0.0% 0 0.3% 2
More food supermarkets 2.1% 17 0.5% 1 2.7% 16 0.0% 0 2.4% 8 2.2% 9 1.7% 7 2.7% 9 1.8% 12More large shops 3.5% 29 2.7% 6 3.8% 23 5.2% 4 3.6% 12 3.2% 13 5.4% 22 1.8% 6 3.7% 25More seating / street
furniture 0.4% 3 0.0% 0 0.5% 3 0.0% 0 0.0% 0 0.7% 3 0.5% 2 0.3% 1 0.4% 3
More traffic free areas / pedestrianisation
0.5% 4 1.4% 3 0.2% 1 0.0% 0 0.6% 2 0.5% 2 0.7% 3 0.3% 1 0.6% 4
Nothing 53.4% 440 53.2% 118 53.5% 322 57.1% 44 42.9% 143 61.1% 247 44.7% 183 60.4% 201 49.0% 329Open another department
store (e.g. John Lewis) 1.0% 8 0.5% 1 1.2% 7 0.0% 0 1.5% 5 0.7% 3 1.0% 4 0.6% 2 1.2% 8
Open the closed shops 0.1% 1 0.0% 0 0.2% 1 0.0% 0 0.3% 1 0.0% 0 0.2% 1 0.0% 0 0.0% 0Rid the town of gangs of
youths 0.2% 2 0.0% 0 0.3% 2 0.0% 0 0.3% 1 0.2% 1 0.0% 0 0.6% 2 0.3% 2
Stop illegal street sellers 0.2% 2 0.5% 1 0.2% 1 0.0% 0 0.6% 2 0.0% 0 0.0% 0 0.6% 2 0.3% 2(Don’t know / never shopped
there before) 5.0% 41 4.1% 9 5.3% 32 1.3% 1 3.6% 12 6.2% 25 3.9% 16 5.7% 19 5.8% 39
Base: 824 222 602 77 333 404 409 333 671
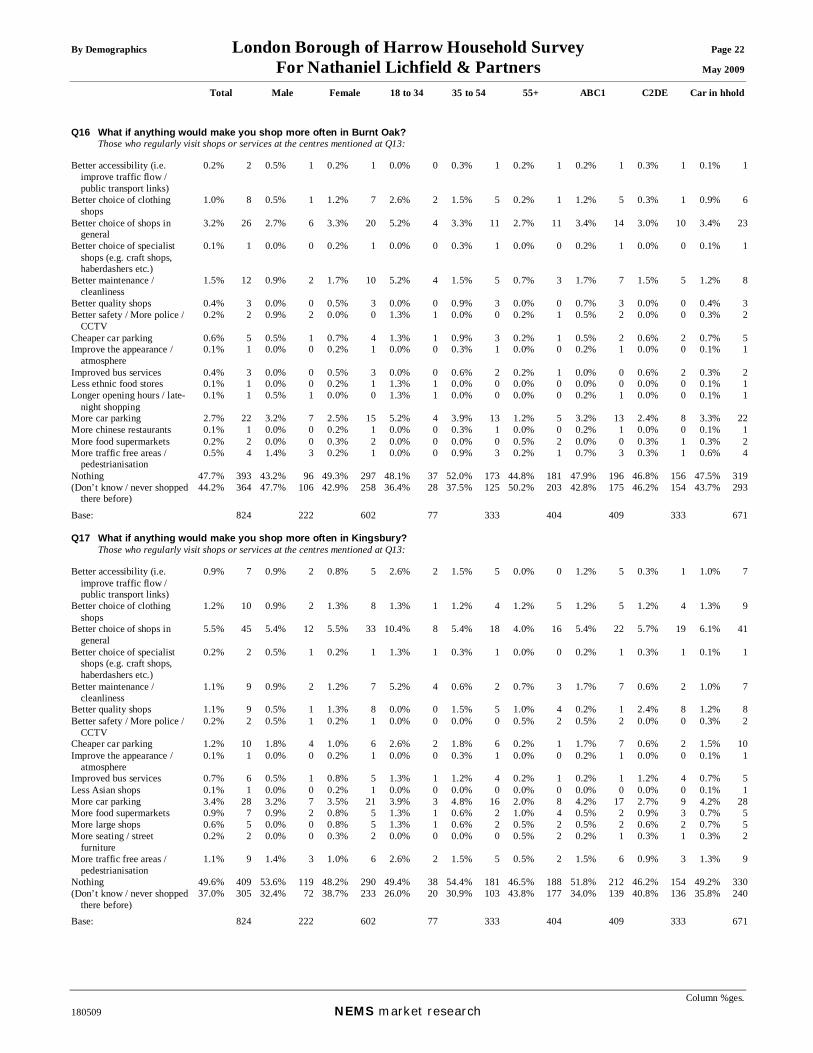
By Demographics London Borough of Harrow Household Survey Page 22 For Nathaniel Lichfield & Partners May 2009
Total Male Female 18 to 34 35 to 54 55+ ABC1 C2DE Car in hhold
Column %ges. 180509 NEMS market research
Q16 What if anything would make you shop more often in Burnt Oak? Those who regularly visit shops or services at the centres mentioned at Q13: Better accessibility (i.e.
improve traffic flow / public transport links)
0.2% 2 0.5% 1 0.2% 1 0.0% 0 0.3% 1 0.2% 1 0.2% 1 0.3% 1 0.1% 1
Better choice of clothing shops
1.0% 8 0.5% 1 1.2% 7 2.6% 2 1.5% 5 0.2% 1 1.2% 5 0.3% 1 0.9% 6
Better choice of shops in general
3.2% 26 2.7% 6 3.3% 20 5.2% 4 3.3% 11 2.7% 11 3.4% 14 3.0% 10 3.4% 23
Better choice of specialist shops (e.g. craft shops, haberdashers etc.)
0.1% 1 0.0% 0 0.2% 1 0.0% 0 0.3% 1 0.0% 0 0.2% 1 0.0% 0 0.1% 1
Better maintenance / cleanliness
1.5% 12 0.9% 2 1.7% 10 5.2% 4 1.5% 5 0.7% 3 1.7% 7 1.5% 5 1.2% 8
Better quality shops 0.4% 3 0.0% 0 0.5% 3 0.0% 0 0.9% 3 0.0% 0 0.7% 3 0.0% 0 0.4% 3Better safety / More police /
CCTV 0.2% 2 0.9% 2 0.0% 0 1.3% 1 0.0% 0 0.2% 1 0.5% 2 0.0% 0 0.3% 2
Cheaper car parking 0.6% 5 0.5% 1 0.7% 4 1.3% 1 0.9% 3 0.2% 1 0.5% 2 0.6% 2 0.7% 5Improve the appearance /
atmosphere 0.1% 1 0.0% 0 0.2% 1 0.0% 0 0.3% 1 0.0% 0 0.2% 1 0.0% 0 0.1% 1
Improved bus services 0.4% 3 0.0% 0 0.5% 3 0.0% 0 0.6% 2 0.2% 1 0.0% 0 0.6% 2 0.3% 2Less ethnic food stores 0.1% 1 0.0% 0 0.2% 1 1.3% 1 0.0% 0 0.0% 0 0.0% 0 0.0% 0 0.1% 1Longer opening hours / late-
night shopping 0.1% 1 0.5% 1 0.0% 0 1.3% 1 0.0% 0 0.0% 0 0.2% 1 0.0% 0 0.1% 1
More car parking 2.7% 22 3.2% 7 2.5% 15 5.2% 4 3.9% 13 1.2% 5 3.2% 13 2.4% 8 3.3% 22More chinese restaurants 0.1% 1 0.0% 0 0.2% 1 0.0% 0 0.3% 1 0.0% 0 0.2% 1 0.0% 0 0.1% 1More food supermarkets 0.2% 2 0.0% 0 0.3% 2 0.0% 0 0.0% 0 0.5% 2 0.0% 0 0.3% 1 0.3% 2More traffic free areas /
pedestrianisation 0.5% 4 1.4% 3 0.2% 1 0.0% 0 0.9% 3 0.2% 1 0.7% 3 0.3% 1 0.6% 4
Nothing 47.7% 393 43.2% 96 49.3% 297 48.1% 37 52.0% 173 44.8% 181 47.9% 196 46.8% 156 47.5% 319(Don’t know / never shopped
there before) 44.2% 364 47.7% 106 42.9% 258 36.4% 28 37.5% 125 50.2% 203 42.8% 175 46.2% 154 43.7% 293
Base: 824 222 602 77 333 404 409 333 671 Q17 What if anything would make you shop more often in Kingsbury? Those who regularly visit shops or services at the centres mentioned at Q13: Better accessibility (i.e.
improve traffic flow / public transport links)
0.9% 7 0.9% 2 0.8% 5 2.6% 2 1.5% 5 0.0% 0 1.2% 5 0.3% 1 1.0% 7
Better choice of clothing shops
1.2% 10 0.9% 2 1.3% 8 1.3% 1 1.2% 4 1.2% 5 1.2% 5 1.2% 4 1.3% 9
Better choice of shops in general
5.5% 45 5.4% 12 5.5% 33 10.4% 8 5.4% 18 4.0% 16 5.4% 22 5.7% 19 6.1% 41
Better choice of specialist shops (e.g. craft shops, haberdashers etc.)
0.2% 2 0.5% 1 0.2% 1 1.3% 1 0.3% 1 0.0% 0 0.2% 1 0.3% 1 0.1% 1
Better maintenance / cleanliness
1.1% 9 0.9% 2 1.2% 7 5.2% 4 0.6% 2 0.7% 3 1.7% 7 0.6% 2 1.0% 7
Better quality shops 1.1% 9 0.5% 1 1.3% 8 0.0% 0 1.5% 5 1.0% 4 0.2% 1 2.4% 8 1.2% 8Better safety / More police /
CCTV 0.2% 2 0.5% 1 0.2% 1 0.0% 0 0.0% 0 0.5% 2 0.5% 2 0.0% 0 0.3% 2
Cheaper car parking 1.2% 10 1.8% 4 1.0% 6 2.6% 2 1.8% 6 0.2% 1 1.7% 7 0.6% 2 1.5% 10Improve the appearance /
atmosphere 0.1% 1 0.0% 0 0.2% 1 0.0% 0 0.3% 1 0.0% 0 0.2% 1 0.0% 0 0.1% 1
Improved bus services 0.7% 6 0.5% 1 0.8% 5 1.3% 1 1.2% 4 0.2% 1 0.2% 1 1.2% 4 0.7% 5Less Asian shops 0.1% 1 0.0% 0 0.2% 1 0.0% 0 0.0% 0 0.0% 0 0.0% 0 0.0% 0 0.1% 1More car parking 3.4% 28 3.2% 7 3.5% 21 3.9% 3 4.8% 16 2.0% 8 4.2% 17 2.7% 9 4.2% 28More food supermarkets 0.9% 7 0.9% 2 0.8% 5 1.3% 1 0.6% 2 1.0% 4 0.5% 2 0.9% 3 0.7% 5More large shops 0.6% 5 0.0% 0 0.8% 5 1.3% 1 0.6% 2 0.5% 2 0.5% 2 0.6% 2 0.7% 5More seating / street
furniture 0.2% 2 0.0% 0 0.3% 2 0.0% 0 0.0% 0 0.5% 2 0.2% 1 0.3% 1 0.3% 2
More traffic free areas / pedestrianisation
1.1% 9 1.4% 3 1.0% 6 2.6% 2 1.5% 5 0.5% 2 1.5% 6 0.9% 3 1.3% 9
Nothing 49.6% 409 53.6% 119 48.2% 290 49.4% 38 54.4% 181 46.5% 188 51.8% 212 46.2% 154 49.2% 330(Don’t know / never shopped
there before) 37.0% 305 32.4% 72 38.7% 233 26.0% 20 30.9% 103 43.8% 177 34.0% 139 40.8% 136 35.8% 240
Base: 824 222 602 77 333 404 409 333 671
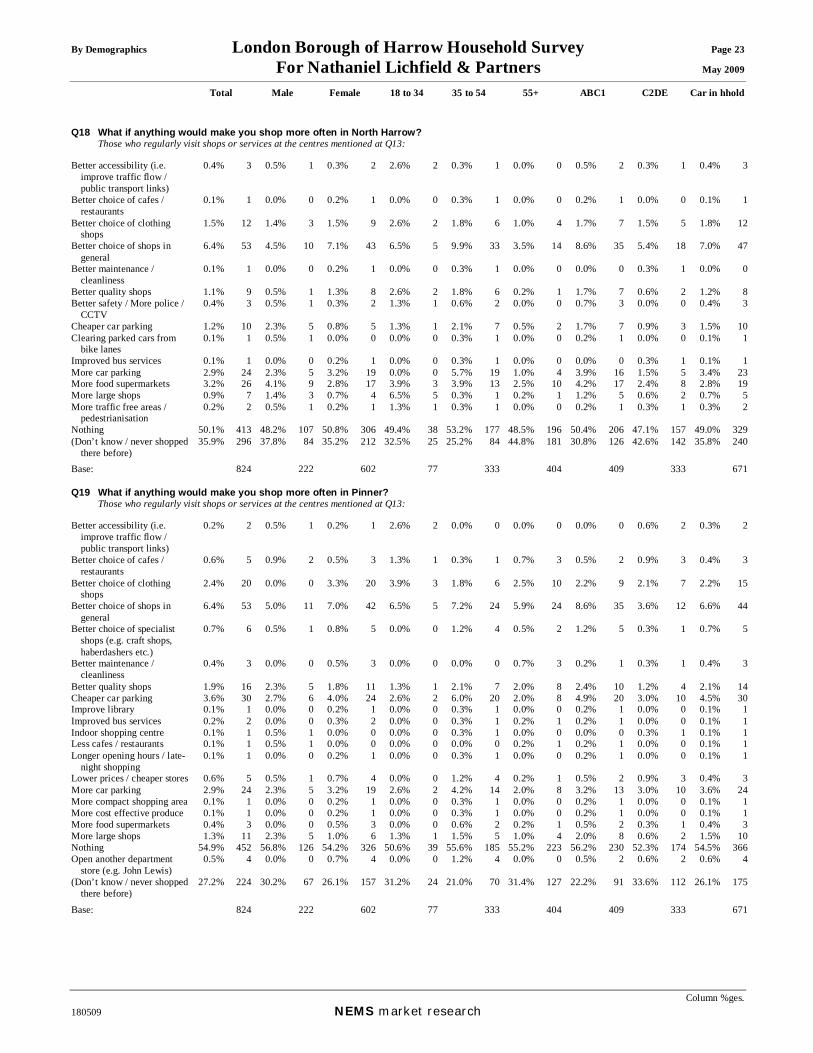
By Demographics London Borough of Harrow Household Survey Page 23 For Nathaniel Lichfield & Partners May 2009
Total Male Female 18 to 34 35 to 54 55+ ABC1 C2DE Car in hhold
Column %ges. 180509 NEMS market research
Q18 What if anything would make you shop more often in North Harrow? Those who regularly visit shops or services at the centres mentioned at Q13: Better accessibility (i.e.
improve traffic flow / public transport links)
0.4% 3 0.5% 1 0.3% 2 2.6% 2 0.3% 1 0.0% 0 0.5% 2 0.3% 1 0.4% 3
Better choice of cafes / restaurants
0.1% 1 0.0% 0 0.2% 1 0.0% 0 0.3% 1 0.0% 0 0.2% 1 0.0% 0 0.1% 1
Better choice of clothing shops
1.5% 12 1.4% 3 1.5% 9 2.6% 2 1.8% 6 1.0% 4 1.7% 7 1.5% 5 1.8% 12
Better choice of shops in general
6.4% 53 4.5% 10 7.1% 43 6.5% 5 9.9% 33 3.5% 14 8.6% 35 5.4% 18 7.0% 47
Better maintenance / cleanliness
0.1% 1 0.0% 0 0.2% 1 0.0% 0 0.3% 1 0.0% 0 0.0% 0 0.3% 1 0.0% 0
Better quality shops 1.1% 9 0.5% 1 1.3% 8 2.6% 2 1.8% 6 0.2% 1 1.7% 7 0.6% 2 1.2% 8Better safety / More police /
CCTV 0.4% 3 0.5% 1 0.3% 2 1.3% 1 0.6% 2 0.0% 0 0.7% 3 0.0% 0 0.4% 3
Cheaper car parking 1.2% 10 2.3% 5 0.8% 5 1.3% 1 2.1% 7 0.5% 2 1.7% 7 0.9% 3 1.5% 10Clearing parked cars from
bike lanes 0.1% 1 0.5% 1 0.0% 0 0.0% 0 0.3% 1 0.0% 0 0.2% 1 0.0% 0 0.1% 1
Improved bus services 0.1% 1 0.0% 0 0.2% 1 0.0% 0 0.3% 1 0.0% 0 0.0% 0 0.3% 1 0.1% 1More car parking 2.9% 24 2.3% 5 3.2% 19 0.0% 0 5.7% 19 1.0% 4 3.9% 16 1.5% 5 3.4% 23More food supermarkets 3.2% 26 4.1% 9 2.8% 17 3.9% 3 3.9% 13 2.5% 10 4.2% 17 2.4% 8 2.8% 19More large shops 0.9% 7 1.4% 3 0.7% 4 6.5% 5 0.3% 1 0.2% 1 1.2% 5 0.6% 2 0.7% 5More traffic free areas /
pedestrianisation 0.2% 2 0.5% 1 0.2% 1 1.3% 1 0.3% 1 0.0% 0 0.2% 1 0.3% 1 0.3% 2
Nothing 50.1% 413 48.2% 107 50.8% 306 49.4% 38 53.2% 177 48.5% 196 50.4% 206 47.1% 157 49.0% 329(Don’t know / never shopped
there before) 35.9% 296 37.8% 84 35.2% 212 32.5% 25 25.2% 84 44.8% 181 30.8% 126 42.6% 142 35.8% 240
Base: 824 222 602 77 333 404 409 333 671 Q19 What if anything would make you shop more often in Pinner? Those who regularly visit shops or services at the centres mentioned at Q13: Better accessibility (i.e.
improve traffic flow / public transport links)
0.2% 2 0.5% 1 0.2% 1 2.6% 2 0.0% 0 0.0% 0 0.0% 0 0.6% 2 0.3% 2
Better choice of cafes / restaurants
0.6% 5 0.9% 2 0.5% 3 1.3% 1 0.3% 1 0.7% 3 0.5% 2 0.9% 3 0.4% 3
Better choice of clothing shops
2.4% 20 0.0% 0 3.3% 20 3.9% 3 1.8% 6 2.5% 10 2.2% 9 2.1% 7 2.2% 15
Better choice of shops in general
6.4% 53 5.0% 11 7.0% 42 6.5% 5 7.2% 24 5.9% 24 8.6% 35 3.6% 12 6.6% 44
Better choice of specialist shops (e.g. craft shops, haberdashers etc.)
0.7% 6 0.5% 1 0.8% 5 0.0% 0 1.2% 4 0.5% 2 1.2% 5 0.3% 1 0.7% 5
Better maintenance / cleanliness
0.4% 3 0.0% 0 0.5% 3 0.0% 0 0.0% 0 0.7% 3 0.2% 1 0.3% 1 0.4% 3
Better quality shops 1.9% 16 2.3% 5 1.8% 11 1.3% 1 2.1% 7 2.0% 8 2.4% 10 1.2% 4 2.1% 14Cheaper car parking 3.6% 30 2.7% 6 4.0% 24 2.6% 2 6.0% 20 2.0% 8 4.9% 20 3.0% 10 4.5% 30Improve library 0.1% 1 0.0% 0 0.2% 1 0.0% 0 0.3% 1 0.0% 0 0.2% 1 0.0% 0 0.1% 1Improved bus services 0.2% 2 0.0% 0 0.3% 2 0.0% 0 0.3% 1 0.2% 1 0.2% 1 0.0% 0 0.1% 1Indoor shopping centre 0.1% 1 0.5% 1 0.0% 0 0.0% 0 0.3% 1 0.0% 0 0.0% 0 0.3% 1 0.1% 1Less cafes / restaurants 0.1% 1 0.5% 1 0.0% 0 0.0% 0 0.0% 0 0.2% 1 0.2% 1 0.0% 0 0.1% 1Longer opening hours / late-
night shopping 0.1% 1 0.0% 0 0.2% 1 0.0% 0 0.3% 1 0.0% 0 0.2% 1 0.0% 0 0.1% 1
Lower prices / cheaper stores 0.6% 5 0.5% 1 0.7% 4 0.0% 0 1.2% 4 0.2% 1 0.5% 2 0.9% 3 0.4% 3More car parking 2.9% 24 2.3% 5 3.2% 19 2.6% 2 4.2% 14 2.0% 8 3.2% 13 3.0% 10 3.6% 24More compact shopping area 0.1% 1 0.0% 0 0.2% 1 0.0% 0 0.3% 1 0.0% 0 0.2% 1 0.0% 0 0.1% 1More cost effective produce 0.1% 1 0.0% 0 0.2% 1 0.0% 0 0.3% 1 0.0% 0 0.2% 1 0.0% 0 0.1% 1More food supermarkets 0.4% 3 0.0% 0 0.5% 3 0.0% 0 0.6% 2 0.2% 1 0.5% 2 0.3% 1 0.4% 3More large shops 1.3% 11 2.3% 5 1.0% 6 1.3% 1 1.5% 5 1.0% 4 2.0% 8 0.6% 2 1.5% 10Nothing 54.9% 452 56.8% 126 54.2% 326 50.6% 39 55.6% 185 55.2% 223 56.2% 230 52.3% 174 54.5% 366Open another department
store (e.g. John Lewis) 0.5% 4 0.0% 0 0.7% 4 0.0% 0 1.2% 4 0.0% 0 0.5% 2 0.6% 2 0.6% 4
(Don’t know / never shopped there before)
27.2% 224 30.2% 67 26.1% 157 31.2% 24 21.0% 70 31.4% 127 22.2% 91 33.6% 112 26.1% 175
Base: 824 222 602 77 333 404 409 333 671

By Demographics London Borough of Harrow Household Survey Page 24 For Nathaniel Lichfield & Partners May 2009
Total Male Female 18 to 34 35 to 54 55+ ABC1 C2DE Car in hhold
Column %ges. 180509 NEMS market research
Q20 What if anything would make you shop more often in Rayners Lane? Those who regularly visit shops or services at the centres mentioned at Q13: Better accessibility (i.e.
improve traffic flow / public transport links)
0.2% 2 0.0% 0 0.3% 2 0.0% 0 0.0% 0 0.5% 2 0.2% 1 0.3% 1 0.3% 2
Better bank facilities 0.1% 1 0.5% 1 0.0% 0 0.0% 0 0.3% 1 0.0% 0 0.2% 1 0.0% 0 0.1% 1Better choice of cafes /
restaurants 0.1% 1 0.0% 0 0.2% 1 0.0% 0 0.0% 0 0.2% 1 0.2% 1 0.0% 0 0.1% 1
Better choice of clothing shops
1.0% 8 0.5% 1 1.2% 7 2.6% 2 0.9% 3 0.7% 3 1.5% 6 0.3% 1 0.9% 6
Better choice of shops in general
6.3% 52 7.2% 16 6.0% 36 6.5% 5 8.7% 29 4.5% 18 9.3% 38 4.2% 14 7.0% 47
Better choice of specialist shops (e.g. craft shops, haberdashers etc.)
0.1% 1 0.0% 0 0.2% 1 0.0% 0 0.3% 1 0.0% 0 0.2% 1 0.0% 0 0.1% 1
Better maintenance / cleanliness
0.6% 5 0.5% 1 0.7% 4 3.9% 3 0.0% 0 0.5% 2 1.0% 4 0.3% 1 0.6% 4
Better quality shops 0.6% 5 1.4% 3 0.3% 2 1.3% 1 1.2% 4 0.0% 0 0.7% 3 0.6% 2 0.7% 5Better safety / More police /
CCTV 0.5% 4 0.5% 1 0.5% 3 1.3% 1 0.9% 3 0.0% 0 0.7% 3 0.3% 1 0.6% 4
Cheaper car parking 2.1% 17 3.2% 7 1.7% 10 0.0% 0 3.6% 12 1.2% 5 2.9% 12 1.5% 5 2.5% 17Improve the appearance /
atmosphere 0.1% 1 0.0% 0 0.2% 1 0.0% 0 0.3% 1 0.0% 0 0.0% 0 0.3% 1 0.1% 1
More activites for children 0.1% 1 0.0% 0 0.2% 1 0.0% 0 0.3% 1 0.0% 0 0.2% 1 0.0% 0 0.1% 1More car parking 4.2% 35 3.2% 7 4.7% 28 2.6% 2 6.3% 21 3.0% 12 4.4% 18 4.5% 15 5.1% 34More food supermarkets 1.3% 11 1.8% 4 1.2% 7 2.6% 2 0.9% 3 1.5% 6 1.5% 6 1.2% 4 1.0% 7More large shops 0.2% 2 0.5% 1 0.2% 1 2.6% 2 0.0% 0 0.0% 0 0.5% 2 0.0% 0 0.3% 2More traffic free areas /
pedestrianisation 0.4% 3 0.0% 0 0.5% 3 2.6% 2 0.3% 1 0.0% 0 0.5% 2 0.3% 1 0.4% 3
Nothing 50.6% 417 51.8% 115 50.2% 302 49.4% 38 53.5% 178 48.5% 196 53.5% 219 43.5% 145 49.6% 333Open another department
store (e.g. John Lewis) 0.4% 3 0.0% 0 0.5% 3 0.0% 0 0.6% 2 0.2% 1 0.5% 2 0.3% 1 0.4% 3
(Don’t know / never shopped there before)
36.0% 297 35.1% 78 36.4% 219 31.2% 24 27.6% 92 43.6% 176 29.3% 120 45.6% 152 35.6% 239
Base: 824 222 602 77 333 404 409 333 671
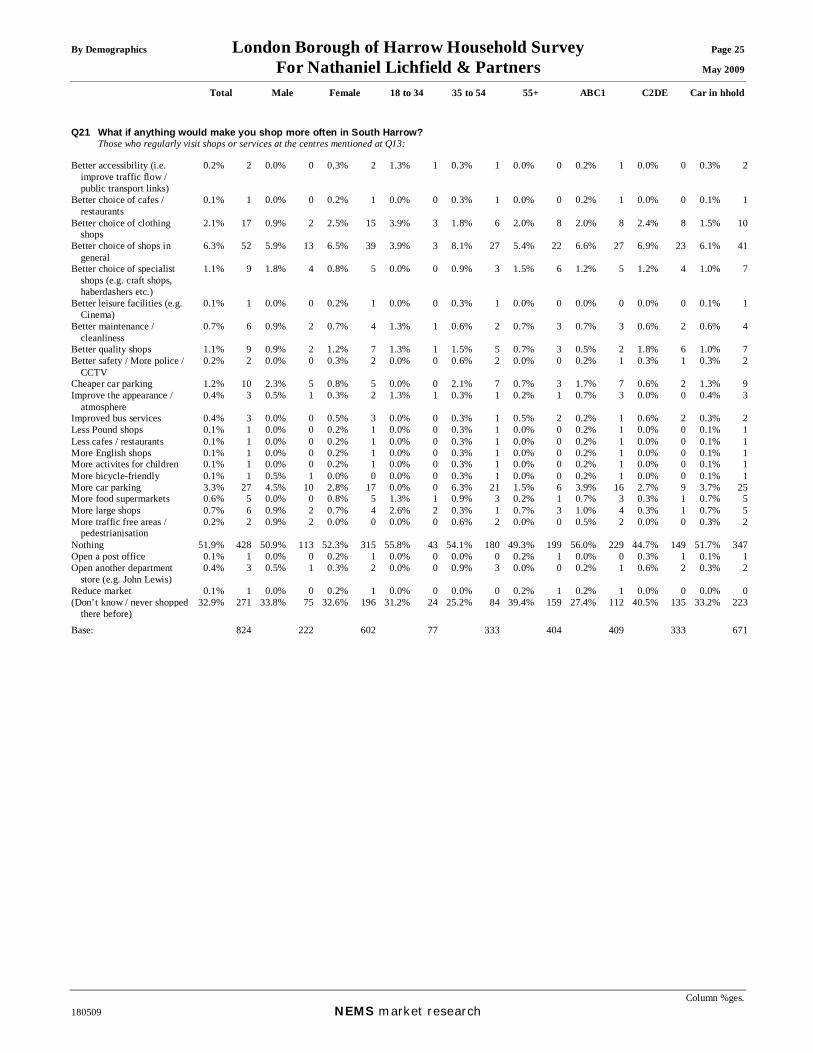
By Demographics London Borough of Harrow Household Survey Page 25 For Nathaniel Lichfield & Partners May 2009
Total Male Female 18 to 34 35 to 54 55+ ABC1 C2DE Car in hhold
Column %ges. 180509 NEMS market research
Q21 What if anything would make you shop more often in South Harrow? Those who regularly visit shops or services at the centres mentioned at Q13: Better accessibility (i.e.
improve traffic flow / public transport links)
0.2% 2 0.0% 0 0.3% 2 1.3% 1 0.3% 1 0.0% 0 0.2% 1 0.0% 0 0.3% 2
Better choice of cafes / restaurants
0.1% 1 0.0% 0 0.2% 1 0.0% 0 0.3% 1 0.0% 0 0.2% 1 0.0% 0 0.1% 1
Better choice of clothing shops
2.1% 17 0.9% 2 2.5% 15 3.9% 3 1.8% 6 2.0% 8 2.0% 8 2.4% 8 1.5% 10
Better choice of shops in general
6.3% 52 5.9% 13 6.5% 39 3.9% 3 8.1% 27 5.4% 22 6.6% 27 6.9% 23 6.1% 41
Better choice of specialist shops (e.g. craft shops, haberdashers etc.)
1.1% 9 1.8% 4 0.8% 5 0.0% 0 0.9% 3 1.5% 6 1.2% 5 1.2% 4 1.0% 7
Better leisure facilities (e.g. Cinema)
0.1% 1 0.0% 0 0.2% 1 0.0% 0 0.3% 1 0.0% 0 0.0% 0 0.0% 0 0.1% 1
Better maintenance / cleanliness
0.7% 6 0.9% 2 0.7% 4 1.3% 1 0.6% 2 0.7% 3 0.7% 3 0.6% 2 0.6% 4
Better quality shops 1.1% 9 0.9% 2 1.2% 7 1.3% 1 1.5% 5 0.7% 3 0.5% 2 1.8% 6 1.0% 7Better safety / More police /
CCTV 0.2% 2 0.0% 0 0.3% 2 0.0% 0 0.6% 2 0.0% 0 0.2% 1 0.3% 1 0.3% 2
Cheaper car parking 1.2% 10 2.3% 5 0.8% 5 0.0% 0 2.1% 7 0.7% 3 1.7% 7 0.6% 2 1.3% 9Improve the appearance /
atmosphere 0.4% 3 0.5% 1 0.3% 2 1.3% 1 0.3% 1 0.2% 1 0.7% 3 0.0% 0 0.4% 3
Improved bus services 0.4% 3 0.0% 0 0.5% 3 0.0% 0 0.3% 1 0.5% 2 0.2% 1 0.6% 2 0.3% 2Less Pound shops 0.1% 1 0.0% 0 0.2% 1 0.0% 0 0.3% 1 0.0% 0 0.2% 1 0.0% 0 0.1% 1Less cafes / restaurants 0.1% 1 0.0% 0 0.2% 1 0.0% 0 0.3% 1 0.0% 0 0.2% 1 0.0% 0 0.1% 1More English shops 0.1% 1 0.0% 0 0.2% 1 0.0% 0 0.3% 1 0.0% 0 0.2% 1 0.0% 0 0.1% 1More activites for children 0.1% 1 0.0% 0 0.2% 1 0.0% 0 0.3% 1 0.0% 0 0.2% 1 0.0% 0 0.1% 1More bicycle-friendly 0.1% 1 0.5% 1 0.0% 0 0.0% 0 0.3% 1 0.0% 0 0.2% 1 0.0% 0 0.1% 1More car parking 3.3% 27 4.5% 10 2.8% 17 0.0% 0 6.3% 21 1.5% 6 3.9% 16 2.7% 9 3.7% 25More food supermarkets 0.6% 5 0.0% 0 0.8% 5 1.3% 1 0.9% 3 0.2% 1 0.7% 3 0.3% 1 0.7% 5More large shops 0.7% 6 0.9% 2 0.7% 4 2.6% 2 0.3% 1 0.7% 3 1.0% 4 0.3% 1 0.7% 5More traffic free areas /
pedestrianisation 0.2% 2 0.9% 2 0.0% 0 0.0% 0 0.6% 2 0.0% 0 0.5% 2 0.0% 0 0.3% 2
Nothing 51.9% 428 50.9% 113 52.3% 315 55.8% 43 54.1% 180 49.3% 199 56.0% 229 44.7% 149 51.7% 347Open a post office 0.1% 1 0.0% 0 0.2% 1 0.0% 0 0.0% 0 0.2% 1 0.0% 0 0.3% 1 0.1% 1Open another department
store (e.g. John Lewis) 0.4% 3 0.5% 1 0.3% 2 0.0% 0 0.9% 3 0.0% 0 0.2% 1 0.6% 2 0.3% 2
Reduce market 0.1% 1 0.0% 0 0.2% 1 0.0% 0 0.0% 0 0.2% 1 0.2% 1 0.0% 0 0.0% 0(Don’t know / never shopped
there before) 32.9% 271 33.8% 75 32.6% 196 31.2% 24 25.2% 84 39.4% 159 27.4% 112 40.5% 135 33.2% 223
Base: 824 222 602 77 333 404 409 333 671
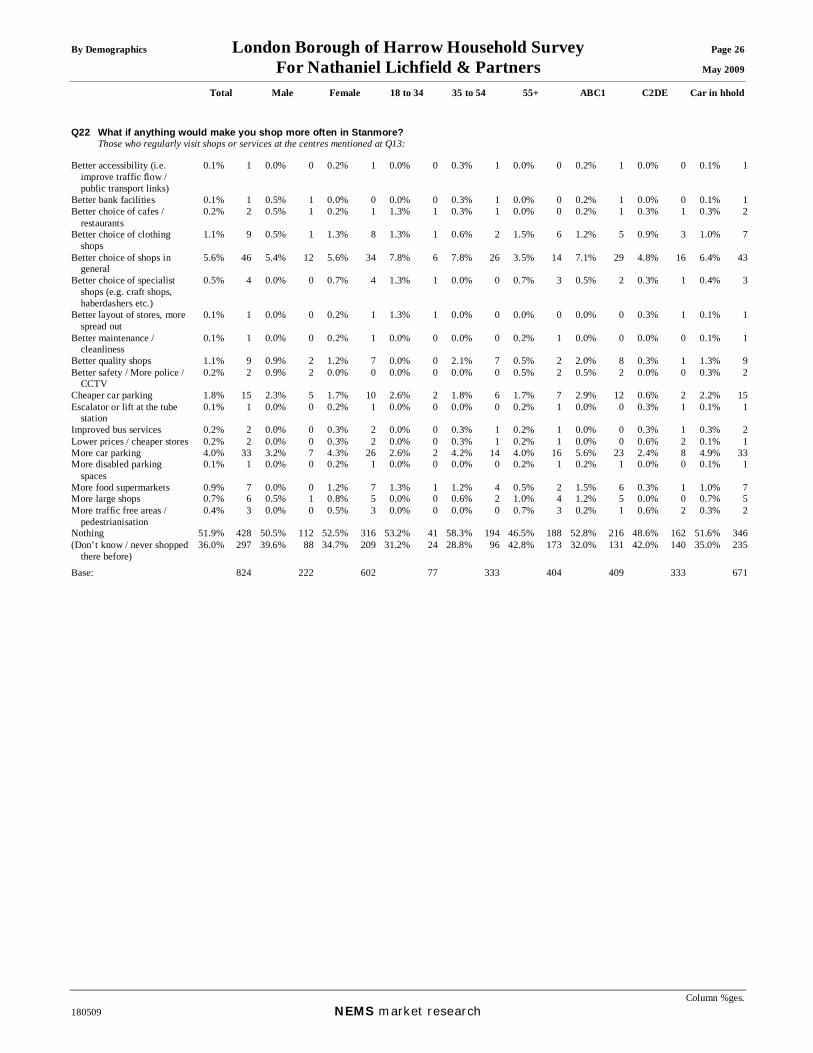
By Demographics London Borough of Harrow Household Survey Page 26 For Nathaniel Lichfield & Partners May 2009
Total Male Female 18 to 34 35 to 54 55+ ABC1 C2DE Car in hhold
Column %ges. 180509 NEMS market research
Q22 What if anything would make you shop more often in Stanmore? Those who regularly visit shops or services at the centres mentioned at Q13: Better accessibility (i.e.
improve traffic flow / public transport links)
0.1% 1 0.0% 0 0.2% 1 0.0% 0 0.3% 1 0.0% 0 0.2% 1 0.0% 0 0.1% 1
Better bank facilities 0.1% 1 0.5% 1 0.0% 0 0.0% 0 0.3% 1 0.0% 0 0.2% 1 0.0% 0 0.1% 1Better choice of cafes /
restaurants 0.2% 2 0.5% 1 0.2% 1 1.3% 1 0.3% 1 0.0% 0 0.2% 1 0.3% 1 0.3% 2
Better choice of clothing shops
1.1% 9 0.5% 1 1.3% 8 1.3% 1 0.6% 2 1.5% 6 1.2% 5 0.9% 3 1.0% 7
Better choice of shops in general
5.6% 46 5.4% 12 5.6% 34 7.8% 6 7.8% 26 3.5% 14 7.1% 29 4.8% 16 6.4% 43
Better choice of specialist shops (e.g. craft shops, haberdashers etc.)
0.5% 4 0.0% 0 0.7% 4 1.3% 1 0.0% 0 0.7% 3 0.5% 2 0.3% 1 0.4% 3
Better layout of stores, more spread out
0.1% 1 0.0% 0 0.2% 1 1.3% 1 0.0% 0 0.0% 0 0.0% 0 0.3% 1 0.1% 1
Better maintenance / cleanliness
0.1% 1 0.0% 0 0.2% 1 0.0% 0 0.0% 0 0.2% 1 0.0% 0 0.0% 0 0.1% 1
Better quality shops 1.1% 9 0.9% 2 1.2% 7 0.0% 0 2.1% 7 0.5% 2 2.0% 8 0.3% 1 1.3% 9Better safety / More police /
CCTV 0.2% 2 0.9% 2 0.0% 0 0.0% 0 0.0% 0 0.5% 2 0.5% 2 0.0% 0 0.3% 2
Cheaper car parking 1.8% 15 2.3% 5 1.7% 10 2.6% 2 1.8% 6 1.7% 7 2.9% 12 0.6% 2 2.2% 15Escalator or lift at the tube
station 0.1% 1 0.0% 0 0.2% 1 0.0% 0 0.0% 0 0.2% 1 0.0% 0 0.3% 1 0.1% 1
Improved bus services 0.2% 2 0.0% 0 0.3% 2 0.0% 0 0.3% 1 0.2% 1 0.0% 0 0.3% 1 0.3% 2Lower prices / cheaper stores 0.2% 2 0.0% 0 0.3% 2 0.0% 0 0.3% 1 0.2% 1 0.0% 0 0.6% 2 0.1% 1More car parking 4.0% 33 3.2% 7 4.3% 26 2.6% 2 4.2% 14 4.0% 16 5.6% 23 2.4% 8 4.9% 33More disabled parking
spaces 0.1% 1 0.0% 0 0.2% 1 0.0% 0 0.0% 0 0.2% 1 0.2% 1 0.0% 0 0.1% 1
More food supermarkets 0.9% 7 0.0% 0 1.2% 7 1.3% 1 1.2% 4 0.5% 2 1.5% 6 0.3% 1 1.0% 7More large shops 0.7% 6 0.5% 1 0.8% 5 0.0% 0 0.6% 2 1.0% 4 1.2% 5 0.0% 0 0.7% 5More traffic free areas /
pedestrianisation 0.4% 3 0.0% 0 0.5% 3 0.0% 0 0.0% 0 0.7% 3 0.2% 1 0.6% 2 0.3% 2
Nothing 51.9% 428 50.5% 112 52.5% 316 53.2% 41 58.3% 194 46.5% 188 52.8% 216 48.6% 162 51.6% 346(Don’t know / never shopped
there before) 36.0% 297 39.6% 88 34.7% 209 31.2% 24 28.8% 96 42.8% 173 32.0% 131 42.0% 140 35.0% 235
Base: 824 222 602 77 333 404 409 333 671

By Demographics London Borough of Harrow Household Survey Page 27 For Nathaniel Lichfield & Partners May 2009
Total Male Female 18 to 34 35 to 54 55+ ABC1 C2DE Car in hhold
Column %ges. 180509 NEMS market research
Q23 What if anything would make you shop more often in Wealdstone? Those who regularly visit shops or services at the centres mentioned at Q13: Better accessibility (i.e.
improve traffic flow / public transport links)
0.2% 2 0.5% 1 0.2% 1 1.3% 1 0.3% 1 0.0% 0 0.2% 1 0.3% 1 0.3% 2
Better choice of cafes / restaurants
0.2% 2 0.0% 0 0.3% 2 0.0% 0 0.0% 0 0.5% 2 0.0% 0 0.3% 1 0.3% 2
Better choice of clothing shops
1.0% 8 0.0% 0 1.3% 8 2.6% 2 1.2% 4 0.5% 2 1.0% 4 0.9% 3 1.2% 8
Better choice of shops in general
6.2% 51 5.4% 12 6.5% 39 9.1% 7 7.8% 26 4.2% 17 6.8% 28 6.0% 20 6.7% 45
Better choice of specialist shops (e.g. craft shops, haberdashers etc.)
0.5% 4 0.5% 1 0.5% 3 0.0% 0 0.6% 2 0.5% 2 0.2% 1 0.9% 3 0.0% 0
Better maintenance / cleanliness
1.8% 15 1.8% 4 1.8% 11 5.2% 4 2.1% 7 1.0% 4 1.5% 6 2.4% 8 1.3% 9
Better quality shops 1.5% 12 0.5% 1 1.8% 11 1.3% 1 1.8% 6 1.2% 5 1.5% 6 1.8% 6 1.3% 9Better safety / More police /
CCTV 1.1% 9 1.4% 3 1.0% 6 5.2% 4 0.9% 3 0.5% 2 1.5% 6 0.9% 3 1.2% 8
Better street market 0.2% 2 0.0% 0 0.3% 2 0.0% 0 0.6% 2 0.0% 0 0.5% 2 0.0% 0 0.3% 2Cheaper car parking 1.3% 11 1.8% 4 1.2% 7 0.0% 0 2.7% 9 0.5% 2 2.0% 8 0.9% 3 1.6% 11Improve the appearance /
atmosphere 0.4% 3 0.5% 1 0.3% 2 1.3% 1 0.6% 2 0.0% 0 0.5% 2 0.3% 1 0.4% 3
Improved bus services 0.1% 1 0.0% 0 0.2% 1 0.0% 0 0.0% 0 0.2% 1 0.0% 0 0.0% 0 0.0% 0Less take away shops 0.1% 1 0.0% 0 0.2% 1 1.3% 1 0.0% 0 0.0% 0 0.0% 0 0.0% 0 0.1% 1More car parking 2.2% 18 2.7% 6 2.0% 12 0.0% 0 2.7% 9 2.2% 9 3.2% 13 1.5% 5 2.7% 18More food supermarkets 2.5% 21 1.8% 4 2.8% 17 1.3% 1 2.4% 8 3.0% 12 1.7% 7 3.6% 12 1.9% 13More large shops 0.7% 6 0.0% 0 1.0% 6 0.0% 0 0.6% 2 0.7% 3 0.7% 3 0.6% 2 0.9% 6Nothing 49.0% 404 46.8% 104 49.8% 300 53.2% 41 52.0% 173 46.0% 186 51.6% 211 43.2% 144 47.8% 321(Don’t know / never shopped
there before) 38.0% 313 40.5% 90 37.0% 223 27.3% 21 31.5% 105 45.1% 182 35.0% 143 43.5% 145 38.9% 261
Base: 824 222 602 77 333 404 409 333 671 Q24 Are you aware of major proposals to expand shopping facilities at Brent Cross? Those who regularly visit shops or services at the centres mentioned at Q13: Yes 13.0% 107 19.4% 43 10.6% 64 15.6% 12 11.1% 37 13.9% 56 12.7% 52 12.9% 43 13.6% 91No 86.5% 713 80.2% 178 88.9% 535 84.4% 65 88.6% 295 85.6% 346 87.0% 356 86.8% 289 86.1% 578(Don't know) 0.5% 4 0.5% 1 0.5% 3 0.0% 0 0.3% 1 0.5% 2 0.2% 1 0.3% 1 0.3% 2Base: 824 222 602 77 333 404 409 333 671 Q25 Do you think you will regularly shop in Brent Cross when these developments are complete? Those who were aware of major proposals to expand shopping facilities at Brent Cross at Q24 Yes 52.3% 56 48.8% 21 54.7% 35 50.0% 6 62.2% 23 46.4% 26 67.3% 35 32.6% 14 58.2% 53No 37.4% 40 44.2% 19 32.8% 21 25.0% 3 35.1% 13 41.1% 23 23.1% 12 53.5% 23 31.9% 29(Don't know) 10.3% 11 7.0% 3 12.5% 8 25.0% 3 2.7% 1 12.5% 7 9.6% 5 14.0% 6 9.9% 9
Base: 107 43 64 12 37 56 52 43 91 GEN Gender of respondent: Male 28.0% 280 100.0% 280 0.0% 0 37.2% 32 28.6% 115 26.2% 130 30.6% 147 27.2% 112 28.7% 230Female 72.0% 720 0.0% 0 100.0% 720 62.8% 54 71.4% 287 73.8% 367 69.4% 334 72.8% 300 71.3% 571
Base: 1000 280 720 86 402 497 481 412 801 AGE How old are you ? 18-24 3.0% 30 4.3% 12 2.5% 18 34.9% 30 0.0% 0 0.0% 0 1.9% 9 3.6% 15 3.0% 2425-34 5.6% 56 7.1% 20 5.0% 36 65.1% 56 0.0% 0 0.0% 0 6.2% 30 5.6% 23 5.9% 4735-44 16.2% 162 13.9% 39 17.1% 123 0.0% 0 40.3% 162 0.0% 0 22.9% 110 10.2% 42 18.1% 14545-54 24.0% 240 27.1% 76 22.8% 164 0.0% 0 59.7% 240 0.0% 0 32.2% 155 17.5% 72 26.8% 21555-64 14.7% 147 13.9% 39 15.0% 108 0.0% 0 0.0% 0 29.6% 147 14.6% 70 15.0% 62 16.7% 13465+ 35.0% 350 32.5% 91 36.0% 259 0.0% 0 0.0% 0 70.4% 350 22.0% 106 47.8% 197 28.6% 229(Refused) 1.5% 15 1.1% 3 1.7% 12 0.0% 0 0.0% 0 0.0% 0 0.2% 1 0.2% 1 0.9% 7
Base: 1000 280 720 86 402 497 481 412 801

By Demographics London Borough of Harrow Household Survey Page 28 For Nathaniel Lichfield & Partners May 2009
Total Male Female 18 to 34 35 to 54 55+ ABC1 C2DE Car in hhold
Column %ges. 180509 NEMS market research
CAR How many cars are there normally available for use in the household? None 18.0% 180 15.4% 43 19.0% 137 17.4% 15 9.0% 36 25.8% 128 11.2% 54 25.2% 104 0.0% 01 46.6% 466 48.2% 135 46.0% 331 45.3% 39 39.3% 158 53.1% 264 41.8% 201 52.4% 216 58.2% 4662 25.3% 253 26.4% 74 24.9% 179 25.6% 22 34.8% 140 17.9% 89 34.7% 167 17.5% 72 31.6% 2533 or more 8.2% 82 7.5% 21 8.5% 61 11.6% 10 15.4% 62 2.0% 10 12.3% 59 4.6% 19 10.2% 82(Don't know) 0.0% 0 0.0% 0 0.0% 0 0.0% 0 0.0% 0 0.0% 0 0.0% 0 0.0% 0 0.0% 0(Refused) 1.9% 19 2.5% 7 1.7% 12 0.0% 0 1.5% 6 1.2% 6 0.0% 0 0.2% 1 0.0% 0
Base: 1000 280 720 86 402 497 481 412 801 ETH Finally, just for the purposes of the survey and to make sure we speak to a representative cross section of the community, please could
you tell me which of the following best describes your ethnic origin? British 67.0% 670 65.4% 183 67.6% 487 27.9% 24 65.7% 264 75.7% 376 67.2% 323 70.1% 289 66.7% 534Irish 3.9% 39 2.1% 6 4.6% 33 2.3% 2 2.0% 8 5.8% 29 2.9% 14 5.1% 21 3.6% 29Any other white background 4.0% 40 4.3% 12 3.9% 28 7.0% 6 3.0% 12 4.4% 22 3.3% 16 4.1% 17 4.5% 36White & Black Caribbean 2.0% 20 1.4% 4 2.2% 16 7.0% 6 1.7% 7 1.2% 6 2.1% 10 1.7% 7 1.9% 15White & Black African 0.8% 8 0.4% 1 1.0% 7 1.2% 1 0.7% 3 0.8% 4 0.2% 1 1.7% 7 0.7% 6White & Asian 2.3% 23 2.9% 8 2.1% 15 8.1% 7 3.2% 13 0.6% 3 2.9% 14 1.5% 6 2.9% 23Any other mixed background 1.2% 12 1.8% 5 1.0% 7 2.3% 2 1.7% 7 0.6% 3 1.5% 7 1.0% 4 1.4% 11Indian 9.2% 92 11.1% 31 8.5% 61 24.4% 21 10.7% 43 5.4% 27 11.2% 54 8.0% 33 10.6% 85Pakistani 1.2% 12 1.4% 4 1.1% 8 2.3% 2 2.0% 8 0.4% 2 1.5% 7 1.0% 4 1.5% 12Bangladeshi 0.3% 3 0.4% 1 0.3% 2 0.0% 0 0.5% 2 0.2% 1 0.2% 1 0.2% 1 0.4% 3Any other Asian or Asian
British 2.5% 25 1.8% 5 2.8% 20 11.6% 10 3.0% 12 0.6% 3 3.5% 17 1.5% 6 2.4% 19
Caribbean 0.6% 6 1.1% 3 0.4% 3 0.0% 0 0.7% 3 0.6% 3 0.6% 3 0.7% 3 0.6% 5African 0.6% 6 0.7% 2 0.6% 4 3.5% 3 0.0% 0 0.6% 3 0.4% 2 0.5% 2 0.5% 4Any other Black background 0.4% 4 0.4% 1 0.4% 3 0.0% 0 0.5% 2 0.4% 2 0.4% 2 0.5% 2 0.4% 3Chinese 0.4% 4 0.0% 0 0.6% 4 1.2% 1 0.7% 3 0.0% 0 0.8% 4 0.0% 0 0.5% 4Other ethnic group 0.0% 0 0.0% 0 0.0% 0 0.0% 0 0.0% 0 0.0% 0 0.0% 0 0.0% 0 0.0% 0(Refused) 3.6% 36 5.0% 14 3.1% 22 1.2% 1 3.7% 15 2.6% 13 1.2% 6 2.4% 10 1.5% 12
Base: 1000 280 720 86 402 497 481 412 801 SEG Socio-economic Grouping A 3.5% 35 3.9% 11 3.3% 24 1.2% 1 4.7% 19 3.0% 15 7.3% 35 0.0% 0 3.9% 31B 18.6% 186 19.3% 54 18.3% 132 15.1% 13 30.1% 121 10.5% 52 38.7% 186 0.0% 0 22.0% 176C1 26.0% 260 29.3% 82 24.7% 178 29.1% 25 31.1% 125 21.9% 109 54.1% 260 0.0% 0 27.5% 220C2 15.5% 155 21.8% 61 13.1% 94 23.3% 20 18.9% 76 11.9% 59 0.0% 0 37.6% 155 17.9% 143D 5.9% 59 6.8% 19 5.6% 40 16.3% 14 6.7% 27 3.6% 18 0.0% 0 14.3% 59 5.1% 41E 19.8% 198 11.4% 32 23.1% 166 4.7% 4 2.7% 11 36.6% 182 0.0% 0 48.1% 198 15.4% 123(Refused) 10.7% 107 7.5% 21 11.9% 86 10.5% 9 5.7% 23 12.5% 62 0.0% 0 0.0% 0 8.4% 67
Base: 1000 280 720 86 402 497 481 412 801
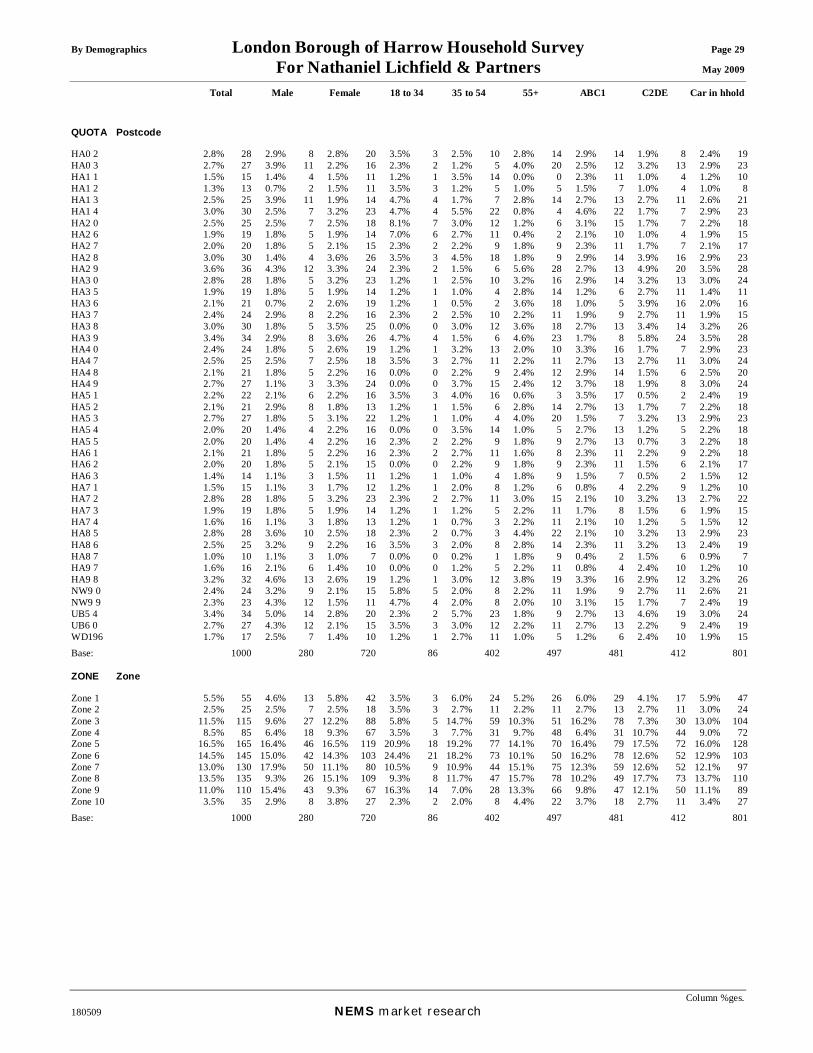
By Demographics London Borough of Harrow Household Survey Page 29 For Nathaniel Lichfield & Partners May 2009
Total Male Female 18 to 34 35 to 54 55+ ABC1 C2DE Car in hhold
Column %ges. 180509 NEMS market research
QUOTA Postcode HA0 2 2.8% 28 2.9% 8 2.8% 20 3.5% 3 2.5% 10 2.8% 14 2.9% 14 1.9% 8 2.4% 19HA0 3 2.7% 27 3.9% 11 2.2% 16 2.3% 2 1.2% 5 4.0% 20 2.5% 12 3.2% 13 2.9% 23HA1 1 1.5% 15 1.4% 4 1.5% 11 1.2% 1 3.5% 14 0.0% 0 2.3% 11 1.0% 4 1.2% 10HA1 2 1.3% 13 0.7% 2 1.5% 11 3.5% 3 1.2% 5 1.0% 5 1.5% 7 1.0% 4 1.0% 8HA1 3 2.5% 25 3.9% 11 1.9% 14 4.7% 4 1.7% 7 2.8% 14 2.7% 13 2.7% 11 2.6% 21HA1 4 3.0% 30 2.5% 7 3.2% 23 4.7% 4 5.5% 22 0.8% 4 4.6% 22 1.7% 7 2.9% 23HA2 0 2.5% 25 2.5% 7 2.5% 18 8.1% 7 3.0% 12 1.2% 6 3.1% 15 1.7% 7 2.2% 18HA2 6 1.9% 19 1.8% 5 1.9% 14 7.0% 6 2.7% 11 0.4% 2 2.1% 10 1.0% 4 1.9% 15HA2 7 2.0% 20 1.8% 5 2.1% 15 2.3% 2 2.2% 9 1.8% 9 2.3% 11 1.7% 7 2.1% 17HA2 8 3.0% 30 1.4% 4 3.6% 26 3.5% 3 4.5% 18 1.8% 9 2.9% 14 3.9% 16 2.9% 23HA2 9 3.6% 36 4.3% 12 3.3% 24 2.3% 2 1.5% 6 5.6% 28 2.7% 13 4.9% 20 3.5% 28HA3 0 2.8% 28 1.8% 5 3.2% 23 1.2% 1 2.5% 10 3.2% 16 2.9% 14 3.2% 13 3.0% 24HA3 5 1.9% 19 1.8% 5 1.9% 14 1.2% 1 1.0% 4 2.8% 14 1.2% 6 2.7% 11 1.4% 11HA3 6 2.1% 21 0.7% 2 2.6% 19 1.2% 1 0.5% 2 3.6% 18 1.0% 5 3.9% 16 2.0% 16HA3 7 2.4% 24 2.9% 8 2.2% 16 2.3% 2 2.5% 10 2.2% 11 1.9% 9 2.7% 11 1.9% 15HA3 8 3.0% 30 1.8% 5 3.5% 25 0.0% 0 3.0% 12 3.6% 18 2.7% 13 3.4% 14 3.2% 26HA3 9 3.4% 34 2.9% 8 3.6% 26 4.7% 4 1.5% 6 4.6% 23 1.7% 8 5.8% 24 3.5% 28HA4 0 2.4% 24 1.8% 5 2.6% 19 1.2% 1 3.2% 13 2.0% 10 3.3% 16 1.7% 7 2.9% 23HA4 7 2.5% 25 2.5% 7 2.5% 18 3.5% 3 2.7% 11 2.2% 11 2.7% 13 2.7% 11 3.0% 24HA4 8 2.1% 21 1.8% 5 2.2% 16 0.0% 0 2.2% 9 2.4% 12 2.9% 14 1.5% 6 2.5% 20HA4 9 2.7% 27 1.1% 3 3.3% 24 0.0% 0 3.7% 15 2.4% 12 3.7% 18 1.9% 8 3.0% 24HA5 1 2.2% 22 2.1% 6 2.2% 16 3.5% 3 4.0% 16 0.6% 3 3.5% 17 0.5% 2 2.4% 19HA5 2 2.1% 21 2.9% 8 1.8% 13 1.2% 1 1.5% 6 2.8% 14 2.7% 13 1.7% 7 2.2% 18HA5 3 2.7% 27 1.8% 5 3.1% 22 1.2% 1 1.0% 4 4.0% 20 1.5% 7 3.2% 13 2.9% 23HA5 4 2.0% 20 1.4% 4 2.2% 16 0.0% 0 3.5% 14 1.0% 5 2.7% 13 1.2% 5 2.2% 18HA5 5 2.0% 20 1.4% 4 2.2% 16 2.3% 2 2.2% 9 1.8% 9 2.7% 13 0.7% 3 2.2% 18HA6 1 2.1% 21 1.8% 5 2.2% 16 2.3% 2 2.7% 11 1.6% 8 2.3% 11 2.2% 9 2.2% 18HA6 2 2.0% 20 1.8% 5 2.1% 15 0.0% 0 2.2% 9 1.8% 9 2.3% 11 1.5% 6 2.1% 17HA6 3 1.4% 14 1.1% 3 1.5% 11 1.2% 1 1.0% 4 1.8% 9 1.5% 7 0.5% 2 1.5% 12HA7 1 1.5% 15 1.1% 3 1.7% 12 1.2% 1 2.0% 8 1.2% 6 0.8% 4 2.2% 9 1.2% 10HA7 2 2.8% 28 1.8% 5 3.2% 23 2.3% 2 2.7% 11 3.0% 15 2.1% 10 3.2% 13 2.7% 22HA7 3 1.9% 19 1.8% 5 1.9% 14 1.2% 1 1.2% 5 2.2% 11 1.7% 8 1.5% 6 1.9% 15HA7 4 1.6% 16 1.1% 3 1.8% 13 1.2% 1 0.7% 3 2.2% 11 2.1% 10 1.2% 5 1.5% 12HA8 5 2.8% 28 3.6% 10 2.5% 18 2.3% 2 0.7% 3 4.4% 22 2.1% 10 3.2% 13 2.9% 23HA8 6 2.5% 25 3.2% 9 2.2% 16 3.5% 3 2.0% 8 2.8% 14 2.3% 11 3.2% 13 2.4% 19HA8 7 1.0% 10 1.1% 3 1.0% 7 0.0% 0 0.2% 1 1.8% 9 0.4% 2 1.5% 6 0.9% 7HA9 7 1.6% 16 2.1% 6 1.4% 10 0.0% 0 1.2% 5 2.2% 11 0.8% 4 2.4% 10 1.2% 10HA9 8 3.2% 32 4.6% 13 2.6% 19 1.2% 1 3.0% 12 3.8% 19 3.3% 16 2.9% 12 3.2% 26NW9 0 2.4% 24 3.2% 9 2.1% 15 5.8% 5 2.0% 8 2.2% 11 1.9% 9 2.7% 11 2.6% 21NW9 9 2.3% 23 4.3% 12 1.5% 11 4.7% 4 2.0% 8 2.0% 10 3.1% 15 1.7% 7 2.4% 19UB5 4 3.4% 34 5.0% 14 2.8% 20 2.3% 2 5.7% 23 1.8% 9 2.7% 13 4.6% 19 3.0% 24UB6 0 2.7% 27 4.3% 12 2.1% 15 3.5% 3 3.0% 12 2.2% 11 2.7% 13 2.2% 9 2.4% 19WD196 1.7% 17 2.5% 7 1.4% 10 1.2% 1 2.7% 11 1.0% 5 1.2% 6 2.4% 10 1.9% 15
Base: 1000 280 720 86 402 497 481 412 801 ZONE Zone Zone 1 5.5% 55 4.6% 13 5.8% 42 3.5% 3 6.0% 24 5.2% 26 6.0% 29 4.1% 17 5.9% 47Zone 2 2.5% 25 2.5% 7 2.5% 18 3.5% 3 2.7% 11 2.2% 11 2.7% 13 2.7% 11 3.0% 24Zone 3 11.5% 115 9.6% 27 12.2% 88 5.8% 5 14.7% 59 10.3% 51 16.2% 78 7.3% 30 13.0% 104Zone 4 8.5% 85 6.4% 18 9.3% 67 3.5% 3 7.7% 31 9.7% 48 6.4% 31 10.7% 44 9.0% 72Zone 5 16.5% 165 16.4% 46 16.5% 119 20.9% 18 19.2% 77 14.1% 70 16.4% 79 17.5% 72 16.0% 128Zone 6 14.5% 145 15.0% 42 14.3% 103 24.4% 21 18.2% 73 10.1% 50 16.2% 78 12.6% 52 12.9% 103Zone 7 13.0% 130 17.9% 50 11.1% 80 10.5% 9 10.9% 44 15.1% 75 12.3% 59 12.6% 52 12.1% 97Zone 8 13.5% 135 9.3% 26 15.1% 109 9.3% 8 11.7% 47 15.7% 78 10.2% 49 17.7% 73 13.7% 110Zone 9 11.0% 110 15.4% 43 9.3% 67 16.3% 14 7.0% 28 13.3% 66 9.8% 47 12.1% 50 11.1% 89Zone 10 3.5% 35 2.9% 8 3.8% 27 2.3% 2 2.0% 8 4.4% 22 3.7% 18 2.7% 11 3.4% 27
Base: 1000 280 720 86 402 497 481 412 801

By Zone London Borough of Harrow Household Survey Page 30 For Nathaniel Lichfield & Partners May 2009
Total Zone 1 Zone 2 Zone 3 Zone 4 Zone 5 Zone 6 Zone 7 Zone 8 Zone 9 Zone 10
180509 NEMS market research
Q01 Which store or shop did you do your household's last main food and grocery shopping? Aldi, High Street, West
Drayton 0.1% 1 0.0% 0 0.0% 0 0.0% 0 0.0% 0 0.0% 0 0.7% 1 0.0% 0 0.0% 0 0.0% 0 0.0% 0
Aldi, Kingsbury Road, Kingsbury
0.2% 2 0.0% 0 0.0% 0 0.0% 0 0.0% 0 0.0% 0 0.0% 0 0.0% 0 0.0% 0 1.8% 2 0.0% 0
Asda Odhams Trading Estate, St Albans Road, Watford
1.2% 12 0.0% 0 0.0% 0 0.0% 0 5.9% 5 0.6% 1 2.8% 4 0.0% 0 0.0% 0 1.8% 2 0.0% 0
Asda, Capitol Way, Edgware Road, Colindale
3.7% 37 0.0% 0 0.0% 0 0.0% 0 0.0% 0 0.0% 0 1.4% 2 0.8% 1 5.2% 7 24.5% 27 0.0% 0
Asda, Forty Lane, Wembley 2.9% 29 0.0% 0 0.0% 0 0.0% 0 1.2% 1 0.0% 0 2.1% 3 16.2% 21 2.2% 3 0.9% 1 0.0% 0Asda, Holmes Farm Way,
High Wycombe 0.1% 1 0.0% 0 0.0% 0 0.0% 0 0.0% 0 0.6% 1 0.0% 0 0.0% 0 0.0% 0 0.0% 0 0.0% 0
Asda, Off Alexander Road, Hetton-Le-Hole, Hounslow
0.1% 1 0.0% 0 0.0% 0 0.0% 0 0.0% 0 0.6% 1 0.0% 0 0.0% 0 0.0% 0 0.0% 0 0.0% 0
Asda, Park Burrow 0.1% 1 0.0% 0 0.0% 0 0.0% 0 0.0% 0 0.6% 1 0.0% 0 0.0% 0 0.0% 0 0.0% 0 0.0% 0Asda, Park Royal, Western
Road, Ealing 0.1% 1 0.0% 0 0.0% 0 0.0% 0 0.0% 0 0.6% 1 0.0% 0 0.0% 0 0.0% 0 0.0% 0 0.0% 0
Budgens, Field Road, Eastcote
0.3% 3 0.0% 0 0.0% 0 2.6% 3 0.0% 0 0.0% 0 0.0% 0 0.0% 0 0.0% 0 0.0% 0 0.0% 0
Iceland Extra, Station Road, Harrow
0.2% 2 0.0% 0 0.0% 0 0.0% 0 0.0% 0 0.6% 1 0.7% 1 0.0% 0 0.0% 0 0.0% 0 0.0% 0
Iceland, Burnt Oak, Broadway
0.1% 1 0.0% 0 0.0% 0 0.0% 0 0.0% 0 0.0% 0 0.0% 0 0.0% 0 0.0% 0 0.9% 1 0.0% 0
Iceland, Central Square, Wembley
0.4% 4 0.0% 0 0.0% 0 0.0% 0 0.0% 0 0.0% 0 0.0% 0 3.1% 4 0.0% 0 0.0% 0 0.0% 0
Iceland, Greenford Road, Sudbury Hill
0.4% 4 0.0% 0 0.0% 0 0.0% 0 0.0% 0 0.0% 0 0.7% 1 2.3% 3 0.0% 0 0.0% 0 0.0% 0
Iceland, High Road, Harrow Weald
0.5% 5 0.0% 0 0.0% 0 0.0% 0 2.4% 2 0.0% 0 0.7% 1 0.0% 0 0.0% 0 0.0% 0 5.7% 2
Iceland, High Street, Harrow 0.1% 1 0.0% 0 0.0% 0 0.0% 0 0.0% 0 0.6% 1 0.0% 0 0.0% 0 0.0% 0 0.0% 0 0.0% 0Iceland, High Street, Ruislip 0.2% 2 0.0% 0 4.0% 1 0.9% 1 0.0% 0 0.0% 0 0.0% 0 0.0% 0 0.0% 0 0.0% 0 0.0% 0Iceland, High Street,
Wealdstone 0.2% 2 0.0% 0 0.0% 0 0.0% 0 0.0% 0 0.0% 0 0.7% 1 0.0% 0 0.7% 1 0.0% 0 0.0% 0
Iceland, Kingsbury Circle, Kingsbury
0.2% 2 0.0% 0 0.0% 0 0.0% 0 0.0% 0 0.0% 0 0.0% 0 0.0% 0 0.7% 1 0.9% 1 0.0% 0
Iceland, Northolt Road, South Harrow
0.1% 1 0.0% 0 0.0% 0 0.0% 0 0.0% 0 0.6% 1 0.0% 0 0.0% 0 0.0% 0 0.0% 0 0.0% 0
Internet/Delivered 1.9% 19 3.6% 2 0.0% 0 2.6% 3 1.2% 1 1.2% 2 3.4% 5 1.5% 2 1.5% 2 0.9% 1 2.9% 1Lidl, Bridge Street, Pinner 0.1% 1 1.8% 1 0.0% 0 0.0% 0 0.0% 0 0.0% 0 0.0% 0 0.0% 0 0.0% 0 0.0% 0 0.0% 0Lidl, High Street, Edgware 0.2% 2 0.0% 0 0.0% 0 0.0% 0 0.0% 0 0.0% 0 0.0% 0 0.0% 0 0.7% 1 0.9% 1 0.0% 0Lidl, The Broadway,
Stanmore 0.4% 4 0.0% 0 0.0% 0 0.9% 1 1.2% 1 0.0% 0 0.0% 0 0.0% 0 0.7% 1 0.0% 0 2.9% 1
Lidl, Wembley Park Drive, Wembley
0.2% 2 0.0% 0 0.0% 0 0.0% 0 0.0% 0 0.0% 0 0.7% 1 0.8% 1 0.0% 0 0.0% 0 0.0% 0
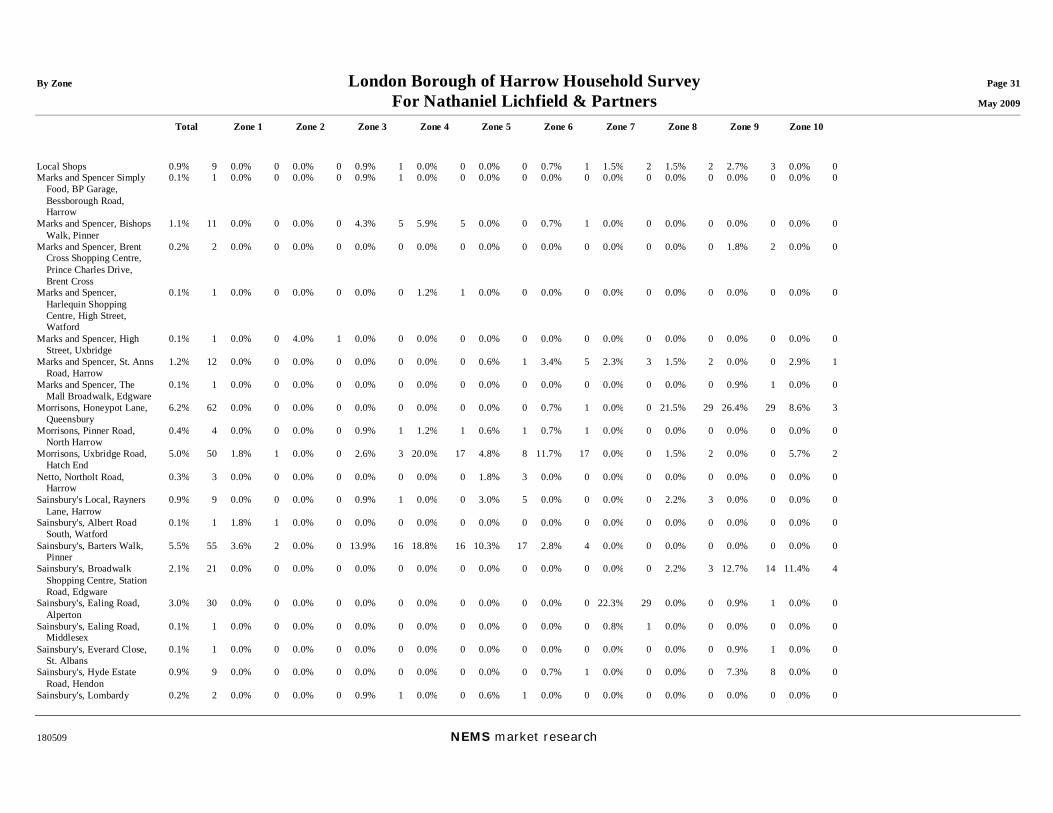
By Zone London Borough of Harrow Household Survey Page 31 For Nathaniel Lichfield & Partners May 2009
Total Zone 1 Zone 2 Zone 3 Zone 4 Zone 5 Zone 6 Zone 7 Zone 8 Zone 9 Zone 10
180509 NEMS market research
Local Shops 0.9% 9 0.0% 0 0.0% 0 0.9% 1 0.0% 0 0.0% 0 0.7% 1 1.5% 2 1.5% 2 2.7% 3 0.0% 0Marks and Spencer Simply
Food, BP Garage, Bessborough Road, Harrow
0.1% 1 0.0% 0 0.0% 0 0.9% 1 0.0% 0 0.0% 0 0.0% 0 0.0% 0 0.0% 0 0.0% 0 0.0% 0
Marks and Spencer, Bishops Walk, Pinner
1.1% 11 0.0% 0 0.0% 0 4.3% 5 5.9% 5 0.0% 0 0.7% 1 0.0% 0 0.0% 0 0.0% 0 0.0% 0
Marks and Spencer, Brent Cross Shopping Centre, Prince Charles Drive, Brent Cross
0.2% 2 0.0% 0 0.0% 0 0.0% 0 0.0% 0 0.0% 0 0.0% 0 0.0% 0 0.0% 0 1.8% 2 0.0% 0
Marks and Spencer, Harlequin Shopping Centre, High Street, Watford
0.1% 1 0.0% 0 0.0% 0 0.0% 0 1.2% 1 0.0% 0 0.0% 0 0.0% 0 0.0% 0 0.0% 0 0.0% 0
Marks and Spencer, High Street, Uxbridge
0.1% 1 0.0% 0 4.0% 1 0.0% 0 0.0% 0 0.0% 0 0.0% 0 0.0% 0 0.0% 0 0.0% 0 0.0% 0
Marks and Spencer, St. Anns Road, Harrow
1.2% 12 0.0% 0 0.0% 0 0.0% 0 0.0% 0 0.6% 1 3.4% 5 2.3% 3 1.5% 2 0.0% 0 2.9% 1
Marks and Spencer, The Mall Broadwalk, Edgware
0.1% 1 0.0% 0 0.0% 0 0.0% 0 0.0% 0 0.0% 0 0.0% 0 0.0% 0 0.0% 0 0.9% 1 0.0% 0
Morrisons, Honeypot Lane, Queensbury
6.2% 62 0.0% 0 0.0% 0 0.0% 0 0.0% 0 0.0% 0 0.7% 1 0.0% 0 21.5% 29 26.4% 29 8.6% 3
Morrisons, Pinner Road, North Harrow
0.4% 4 0.0% 0 0.0% 0 0.9% 1 1.2% 1 0.6% 1 0.7% 1 0.0% 0 0.0% 0 0.0% 0 0.0% 0
Morrisons, Uxbridge Road, Hatch End
5.0% 50 1.8% 1 0.0% 0 2.6% 3 20.0% 17 4.8% 8 11.7% 17 0.0% 0 1.5% 2 0.0% 0 5.7% 2
Netto, Northolt Road, Harrow
0.3% 3 0.0% 0 0.0% 0 0.0% 0 0.0% 0 1.8% 3 0.0% 0 0.0% 0 0.0% 0 0.0% 0 0.0% 0
Sainsbury's Local, Rayners Lane, Harrow
0.9% 9 0.0% 0 0.0% 0 0.9% 1 0.0% 0 3.0% 5 0.0% 0 0.0% 0 2.2% 3 0.0% 0 0.0% 0
Sainsbury's, Albert Road South, Watford
0.1% 1 1.8% 1 0.0% 0 0.0% 0 0.0% 0 0.0% 0 0.0% 0 0.0% 0 0.0% 0 0.0% 0 0.0% 0
Sainsbury's, Barters Walk, Pinner
5.5% 55 3.6% 2 0.0% 0 13.9% 16 18.8% 16 10.3% 17 2.8% 4 0.0% 0 0.0% 0 0.0% 0 0.0% 0
Sainsbury's, Broadwalk Shopping Centre, Station Road, Edgware
2.1% 21 0.0% 0 0.0% 0 0.0% 0 0.0% 0 0.0% 0 0.0% 0 0.0% 0 2.2% 3 12.7% 14 11.4% 4
Sainsbury's, Ealing Road, Alperton
3.0% 30 0.0% 0 0.0% 0 0.0% 0 0.0% 0 0.0% 0 0.0% 0 22.3% 29 0.0% 0 0.9% 1 0.0% 0
Sainsbury's, Ealing Road, Middlesex
0.1% 1 0.0% 0 0.0% 0 0.0% 0 0.0% 0 0.0% 0 0.0% 0 0.8% 1 0.0% 0 0.0% 0 0.0% 0
Sainsbury's, Everard Close, St. Albans
0.1% 1 0.0% 0 0.0% 0 0.0% 0 0.0% 0 0.0% 0 0.0% 0 0.0% 0 0.0% 0 0.9% 1 0.0% 0
Sainsbury's, Hyde Estate Road, Hendon
0.9% 9 0.0% 0 0.0% 0 0.0% 0 0.0% 0 0.0% 0 0.7% 1 0.0% 0 0.0% 0 7.3% 8 0.0% 0
Sainsbury's, Lombardy 0.2% 2 0.0% 0 0.0% 0 0.9% 1 0.0% 0 0.6% 1 0.0% 0 0.0% 0 0.0% 0 0.0% 0 0.0% 0

By Zone London Borough of Harrow Household Survey Page 32 For Nathaniel Lichfield & Partners May 2009
Total Zone 1 Zone 2 Zone 3 Zone 4 Zone 5 Zone 6 Zone 7 Zone 8 Zone 9 Zone 10
180509 NEMS market research
Retail Park, Coldharbour Lane, Hayes
Sainsbury's, Nash Way, Kenton
7.9% 79 0.0% 0 0.0% 0 0.0% 0 1.2% 1 0.0% 0 5.5% 8 20.0% 26 31.9% 43 0.9% 1 0.0% 0
Sainsbury's, Northolt Road, South Harrow
3.2% 32 0.0% 0 0.0% 0 0.9% 1 0.0% 0 18.2% 30 0.7% 1 0.0% 0 0.0% 0 0.0% 0 0.0% 0
Sainsbury's, South Ruislip, Long Drive
7.9% 79 3.6% 2 28.0% 7 33.0% 38 0.0% 0 18.2% 30 0.7% 1 0.8% 1 0.0% 0 0.0% 0 0.0% 0
Sainsbury's, The Broadway, Stanmore
2.5% 25 0.0% 0 0.0% 0 0.0% 0 0.0% 0 0.0% 0 1.4% 2 0.0% 0 7.4% 10 1.8% 2 31.4% 11
Sainsbury's, York Road, Uxbridge
0.1% 1 0.0% 0 0.0% 0 0.9% 1 0.0% 0 0.0% 0 0.0% 0 0.0% 0 0.0% 0 0.0% 0 0.0% 0
Somerfield, Preston Road, Wembley
0.1% 1 0.0% 0 0.0% 0 0.0% 0 0.0% 0 0.0% 0 0.0% 0 0.8% 1 0.0% 0 0.0% 0 0.0% 0
Tesco Express, 22, Alexandra Avenue, Harrow
0.6% 6 0.0% 0 0.0% 0 0.0% 0 0.0% 0 0.0% 0 2.8% 4 0.8% 1 0.7% 1 0.0% 0 0.0% 0
Tesco Express, Field End Road, Ruislip Field
0.3% 3 0.0% 0 4.0% 1 1.7% 2 0.0% 0 0.0% 0 0.0% 0 0.0% 0 0.0% 0 0.0% 0 0.0% 0
Tesco Express, Honeypot Lane, Stanmore
0.4% 4 0.0% 0 0.0% 0 0.0% 0 0.0% 0 0.6% 1 0.0% 0 0.0% 0 2.2% 3 0.0% 0 0.0% 0
Tesco Express, Kingsbury Circle, Kingsbury
0.3% 3 0.0% 0 0.0% 0 0.0% 0 0.0% 0 0.0% 0 0.0% 0 0.0% 0 0.7% 1 1.8% 2 0.0% 0
Tesco Express, Northwood Hills, Joel Street, Pinner
1.3% 13 7.3% 4 4.0% 1 1.7% 2 5.9% 5 0.6% 1 0.0% 0 0.0% 0 0.0% 0 0.0% 0 0.0% 0
Tesco Express, Pinner Road, Harrow
0.7% 7 0.0% 0 0.0% 0 0.9% 1 2.4% 2 0.6% 1 2.1% 3 0.0% 0 0.0% 0 0.0% 0 0.0% 0
Tesco Express, Prestwick Road, Watford
0.1% 1 0.0% 0 0.0% 0 0.0% 0 1.2% 1 0.0% 0 0.0% 0 0.0% 0 0.0% 0 0.0% 0 0.0% 0
Tesco Express, Rayners Lane, Harrow
0.1% 1 0.0% 0 0.0% 0 0.0% 0 0.0% 0 0.6% 1 0.0% 0 0.0% 0 0.0% 0 0.0% 0 0.0% 0
Tesco Express, Uxbridge Road, Hatch End, Pinner
0.7% 7 1.8% 1 4.0% 1 1.7% 2 2.4% 2 0.6% 1 0.0% 0 0.0% 0 0.0% 0 0.0% 0 0.0% 0
Tesco Extra, Borehamwood, Shenley Road
0.2% 2 0.0% 0 0.0% 0 0.0% 0 0.0% 0 0.0% 0 0.0% 0 0.0% 0 0.7% 1 0.0% 0 2.9% 1
Tesco Extra, Glencoe Road, Hayes, Yeading
0.2% 2 0.0% 0 0.0% 0 0.0% 0 0.0% 0 1.2% 2 0.0% 0 0.0% 0 0.0% 0 0.0% 0 0.0% 0
Tesco Metro, Burnt Oak Broadway, Edgware
0.8% 8 0.0% 0 0.0% 0 0.0% 0 0.0% 0 0.0% 0 0.7% 1 0.0% 0 0.7% 1 5.5% 6 0.0% 0
Tesco, Ash Hill Drive, Pinner
4.0% 40 21.8% 12 0.0% 0 12.2% 14 7.1% 6 2.4% 4 1.4% 2 0.0% 0 0.7% 1 0.0% 0 2.9% 1
Tesco, Brent Park, Great Central Way, Willesden
0.7% 7 0.0% 0 0.0% 0 0.0% 0 0.0% 0 0.6% 1 0.0% 0 4.6% 6 0.0% 0 0.0% 0 0.0% 0
Tesco, Church End, Brent Park, Wembley
0.3% 3 0.0% 0 0.0% 0 0.0% 0 0.0% 0 0.0% 0 0.0% 0 2.3% 3 0.0% 0 0.0% 0 0.0% 0
Tesco, Frogmoor Wharf, Harefield Road,
0.7% 7 10.9% 6 4.0% 1 0.0% 0 0.0% 0 0.0% 0 0.0% 0 0.0% 0 0.0% 0 0.0% 0 0.0% 0

By Zone London Borough of Harrow Household Survey Page 33 For Nathaniel Lichfield & Partners May 2009
Total Zone 1 Zone 2 Zone 3 Zone 4 Zone 5 Zone 6 Zone 7 Zone 8 Zone 9 Zone 10
180509 NEMS market research
Rickmansworth Tesco, Greenford, Old
Hoover Buildings, Greenford
1.2% 12 0.0% 0 0.0% 0 0.0% 0 0.0% 0 3.0% 5 0.7% 1 4.6% 6 0.0% 0 0.0% 0 0.0% 0
Tesco, Kenton Lane, Harrow 0.7% 7 0.0% 0 0.0% 0 0.0% 0 0.0% 0 1.2% 2 2.1% 3 0.0% 0 0.7% 1 0.9% 1 0.0% 0Tesco, Station Road, Harrow 7.3% 73 0.0% 0 0.0% 0 0.9% 1 1.2% 1 8.5% 14 28.3% 41 6.2% 8 5.2% 7 0.0% 0 2.9% 1Tesco, Watford, Lower High
Street, Watford 1.7% 17 3.6% 2 12.0% 3 0.9% 1 7.1% 6 1.2% 2 0.0% 0 0.0% 0 0.7% 1 0.9% 1 2.9% 1
Tesco, Wrekin Retail Park, Arleston, Telford
0.1% 1 0.0% 0 4.0% 1 0.0% 0 0.0% 0 0.0% 0 0.0% 0 0.0% 0 0.0% 0 0.0% 0 0.0% 0
Waitrose, Brent Cross Shopping Centre, Prince Charles Drive, Brent Cross
0.1% 1 0.0% 0 0.0% 0 0.0% 0 0.0% 0 0.0% 0 0.0% 0 0.0% 0 0.0% 0 0.9% 1 0.0% 0
Waitrose, Finchley Road, Camden
0.1% 1 0.0% 0 0.0% 0 0.0% 0 0.0% 0 0.0% 0 0.0% 0 0.0% 0 0.7% 1 0.0% 0 0.0% 0
Waitrose, Green Lane, Northwood
2.5% 25 38.2% 21 0.0% 0 2.6% 3 0.0% 0 0.6% 1 0.0% 0 0.0% 0 0.0% 0 0.0% 0 0.0% 0
Waitrose, High Road, Harrow Weald
3.4% 34 0.0% 0 0.0% 0 0.0% 0 12.9% 11 0.6% 1 7.6% 11 0.0% 0 3.7% 5 0.0% 0 17.1% 6
Waitrose, Kingsend, Ruislip 1.8% 18 0.0% 0 32.0% 8 8.7% 10 0.0% 0 0.0% 0 0.0% 0 0.0% 0 0.0% 0 0.0% 0 0.0% 0Waitrose, Northolt Road,
South Harrow 4.2% 42 0.0% 0 0.0% 0 1.7% 2 0.0% 0 10.3% 17 11.0% 16 5.4% 7 0.0% 0 0.0% 0 0.0% 0
Waitrose, The Spires Shopping Centre, High Street, Barnet
0.1% 1 0.0% 0 0.0% 0 0.0% 0 0.0% 0 0.0% 0 0.0% 0 0.8% 1 0.0% 0 0.0% 0 0.0% 0
(Don't do main food shopping / can't remember / refused)
1.1% 11 0.0% 0 0.0% 0 0.0% 0 0.0% 0 3.0% 5 0.0% 0 2.3% 3 1.5% 2 0.9% 1 0.0% 0
Base: 1000 55 25 115 85 165 145 130 135 110 35 Q02 How did you travel to do your last main food shopping trip? Those who travel to do their main food shopping at Q01: Car - driver 61.1% 593 67.9% 36 68.0% 17 65.2% 73 67.9% 57 58.9% 93 51.4% 72 60.0% 75 64.1% 84 61.1% 66 58.8% 20Car - passenger 15.9% 154 15.1% 8 12.0% 3 16.1% 18 8.3% 7 18.4% 29 18.6% 26 16.0% 20 12.2% 16 15.7% 17 29.4% 10Bus / Coach 7.8% 76 3.8% 2 8.0% 2 3.6% 4 4.8% 4 9.5% 15 8.6% 12 14.4% 18 9.2% 12 6.5% 7 0.0% 0Train 0.2% 2 0.0% 0 0.0% 0 0.0% 0 0.0% 0 0.0% 0 0.0% 0 1.6% 2 0.0% 0 0.0% 0 0.0% 0Tube / Underground 0.3% 3 0.0% 0 0.0% 0 0.9% 1 0.0% 0 0.6% 1 0.0% 0 0.0% 0 0.8% 1 0.0% 0 0.0% 0Taxi 0.7% 7 0.0% 0 0.0% 0 0.0% 0 0.0% 0 0.6% 1 0.0% 0 1.6% 2 2.3% 3 0.0% 0 2.9% 1Walk 12.6% 122 13.2% 7 4.0% 1 11.6% 13 19.0% 16 10.8% 17 19.3% 27 4.0% 5 11.5% 15 16.7% 18 8.8% 3Bicycle 0.5% 5 0.0% 0 0.0% 0 1.8% 2 0.0% 0 0.6% 1 0.7% 1 0.8% 1 0.0% 0 0.0% 0 0.0% 0Other 0.4% 4 0.0% 0 0.0% 0 0.9% 1 0.0% 0 0.6% 1 0.0% 0 1.6% 2 0.0% 0 0.0% 0 0.0% 0(Don't know / can't
remember) 0.4% 4 0.0% 0 8.0% 2 0.0% 0 0.0% 0 0.0% 0 1.4% 2 0.0% 0 0.0% 0 0.0% 0 0.0% 0
Base: 970 53 25 112 84 158 140 125 131 108 34

By Zone London Borough of Harrow Household Survey Page 34 For Nathaniel Lichfield & Partners May 2009
Total Zone 1 Zone 2 Zone 3 Zone 4 Zone 5 Zone 6 Zone 7 Zone 8 Zone 9 Zone 10
180509 NEMS market research
Q03 In addition to main food shopping, at which store or shop did you last visit for small scale/top up shopping for things like bread, milk or newspapers? Aldi, Kingsbury Road,
Kingsbury 0.1% 1 0.0% 0 0.0% 0 0.0% 0 0.0% 0 0.0% 0 0.0% 0 0.0% 0 0.0% 0 0.9% 1 0.0% 0
Asda, Capitol Way, Edgware Road, Colindale
1.0% 10 0.0% 0 0.0% 0 0.0% 0 0.0% 0 0.0% 0 0.0% 0 0.0% 0 0.7% 1 8.2% 9 0.0% 0
Asda, Forty Lane, Wembley 1.0% 10 0.0% 0 0.0% 0 0.0% 0 0.0% 0 0.0% 0 0.0% 0 6.9% 9 0.7% 1 0.0% 0 0.0% 0Asda, Park Royal, Western
Road, Ealing 0.1% 1 0.0% 0 0.0% 0 0.0% 0 0.0% 0 0.6% 1 0.0% 0 0.0% 0 0.0% 0 0.0% 0 0.0% 0
Budgens, Field Road, Eastcote
1.1% 11 0.0% 0 0.0% 0 9.6% 11 0.0% 0 0.0% 0 0.0% 0 0.0% 0 0.0% 0 0.0% 0 0.0% 0
Budgens, High Road, Bushey Heath, Bushey
0.1% 1 0.0% 0 0.0% 0 0.0% 0 0.0% 0 0.0% 0 0.0% 0 0.0% 0 0.0% 0 0.0% 0 2.9% 1
Budgens, High Road, Wealdstone
0.2% 2 0.0% 0 0.0% 0 0.0% 0 0.0% 0 0.0% 0 0.7% 1 0.0% 0 0.7% 1 0.0% 0 0.0% 0
Budgens, Victoria Road, Ruislip
0.1% 1 0.0% 0 0.0% 0 0.9% 1 0.0% 0 0.0% 0 0.0% 0 0.0% 0 0.0% 0 0.0% 0 0.0% 0
Co-op, Church Road, Northolt
0.4% 4 0.0% 0 0.0% 0 0.0% 0 0.0% 0 1.8% 3 0.0% 0 0.8% 1 0.0% 0 0.0% 0 0.0% 0
Co-op, High Street, Harefield, Uxbridge
0.1% 1 0.0% 0 0.0% 0 0.9% 1 0.0% 0 0.0% 0 0.0% 0 0.0% 0 0.0% 0 0.0% 0 0.0% 0
Co-op, St. Andrews Road, Watford
0.4% 4 0.0% 0 0.0% 0 0.0% 0 3.5% 3 0.0% 0 0.7% 1 0.0% 0 0.0% 0 0.0% 0 0.0% 0
Costcutter, Church Road, Northolt
0.1% 1 0.0% 0 0.0% 0 0.0% 0 0.0% 0 0.6% 1 0.0% 0 0.0% 0 0.0% 0 0.0% 0 0.0% 0
Costcutter, High Street, Ruislip
0.1% 1 0.0% 0 0.0% 0 0.9% 1 0.0% 0 0.0% 0 0.0% 0 0.0% 0 0.0% 0 0.0% 0 0.0% 0
Costcutter, Hirst Crescent, Wembley
0.1% 1 0.0% 0 0.0% 0 0.0% 0 0.0% 0 0.0% 0 0.0% 0 0.8% 1 0.0% 0 0.0% 0 0.0% 0
Costcutter, Kingsbury Road, Colindale
0.1% 1 0.0% 0 0.0% 0 0.0% 0 0.0% 0 0.0% 0 0.0% 0 0.0% 0 0.0% 0 0.9% 1 0.0% 0
Iceland Extra, Station Road, Harrow
0.2% 2 0.0% 0 0.0% 0 0.0% 0 0.0% 0 1.2% 2 0.0% 0 0.0% 0 0.0% 0 0.0% 0 0.0% 0
Iceland, Burnt Oak Broadway, Edgware
0.1% 1 0.0% 0 0.0% 0 0.0% 0 0.0% 0 0.0% 0 0.0% 0 0.0% 0 0.0% 0 0.9% 1 0.0% 0
Iceland, Central Square, Wembley
0.5% 5 0.0% 0 0.0% 0 0.0% 0 0.0% 0 0.0% 0 0.0% 0 3.8% 5 0.0% 0 0.0% 0 0.0% 0
Iceland, Greenford Road, Sudbury Hill
0.8% 8 0.0% 0 0.0% 0 0.0% 0 0.0% 0 0.0% 0 1.4% 2 4.6% 6 0.0% 0 0.0% 0 0.0% 0
Iceland, High Road, Harrow Weald
0.2% 2 0.0% 0 0.0% 0 0.0% 0 1.2% 1 0.0% 0 0.7% 1 0.0% 0 0.0% 0 0.0% 0 0.0% 0
Iceland, High Street, Harrow 0.6% 6 0.0% 0 0.0% 0 0.0% 0 0.0% 0 0.0% 0 4.1% 6 0.0% 0 0.0% 0 0.0% 0 0.0% 0Iceland, High Street, Ruislip 0.3% 3 0.0% 0 4.0% 1 1.7% 2 0.0% 0 0.0% 0 0.0% 0 0.0% 0 0.0% 0 0.0% 0 0.0% 0Iceland, High Street,
Wealdstone 0.8% 8 0.0% 0 0.0% 0 0.0% 0 0.0% 0 0.6% 1 3.4% 5 0.0% 0 1.5% 2 0.0% 0 0.0% 0
Iceland, Kingsbury Circle, Kingsbury
0.3% 3 0.0% 0 0.0% 0 0.0% 0 0.0% 0 0.0% 0 0.0% 0 0.0% 0 0.7% 1 1.8% 2 0.0% 0
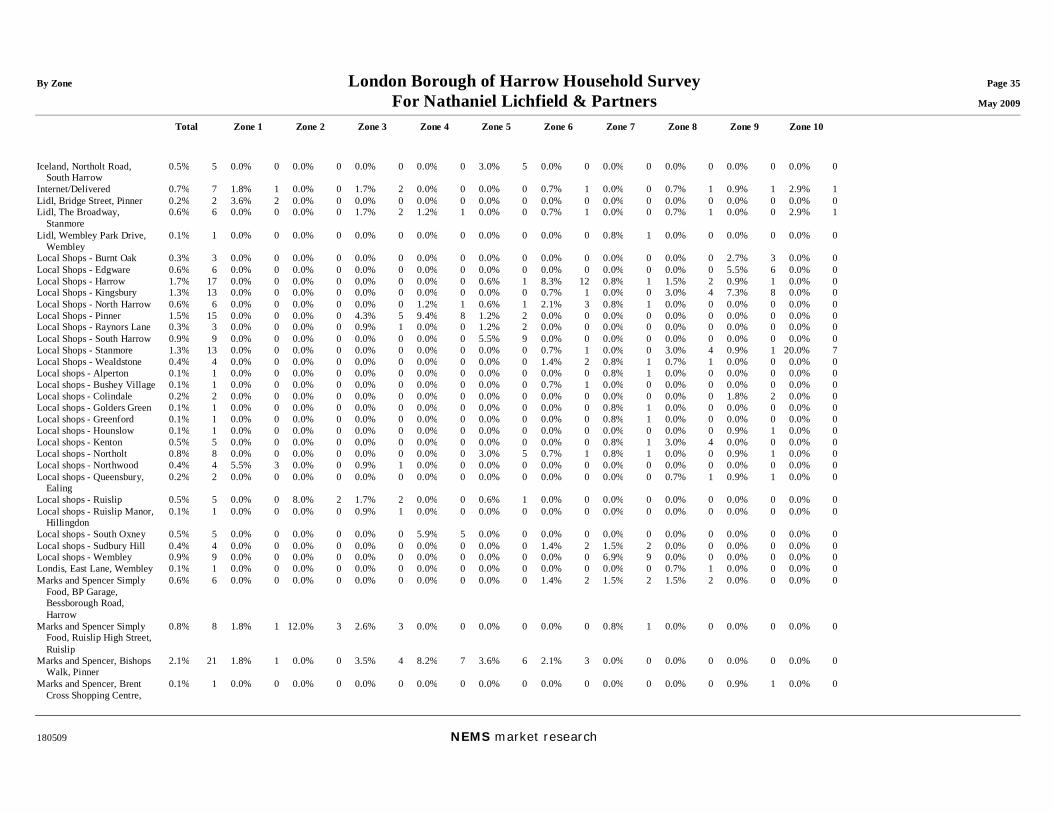
By Zone London Borough of Harrow Household Survey Page 35 For Nathaniel Lichfield & Partners May 2009
Total Zone 1 Zone 2 Zone 3 Zone 4 Zone 5 Zone 6 Zone 7 Zone 8 Zone 9 Zone 10
180509 NEMS market research
Iceland, Northolt Road, South Harrow
0.5% 5 0.0% 0 0.0% 0 0.0% 0 0.0% 0 3.0% 5 0.0% 0 0.0% 0 0.0% 0 0.0% 0 0.0% 0
Internet/Delivered 0.7% 7 1.8% 1 0.0% 0 1.7% 2 0.0% 0 0.0% 0 0.7% 1 0.0% 0 0.7% 1 0.9% 1 2.9% 1Lidl, Bridge Street, Pinner 0.2% 2 3.6% 2 0.0% 0 0.0% 0 0.0% 0 0.0% 0 0.0% 0 0.0% 0 0.0% 0 0.0% 0 0.0% 0Lidl, The Broadway,
Stanmore 0.6% 6 0.0% 0 0.0% 0 1.7% 2 1.2% 1 0.0% 0 0.7% 1 0.0% 0 0.7% 1 0.0% 0 2.9% 1
Lidl, Wembley Park Drive, Wembley
0.1% 1 0.0% 0 0.0% 0 0.0% 0 0.0% 0 0.0% 0 0.0% 0 0.8% 1 0.0% 0 0.0% 0 0.0% 0
Local Shops - Burnt Oak 0.3% 3 0.0% 0 0.0% 0 0.0% 0 0.0% 0 0.0% 0 0.0% 0 0.0% 0 0.0% 0 2.7% 3 0.0% 0Local Shops - Edgware 0.6% 6 0.0% 0 0.0% 0 0.0% 0 0.0% 0 0.0% 0 0.0% 0 0.0% 0 0.0% 0 5.5% 6 0.0% 0Local Shops - Harrow 1.7% 17 0.0% 0 0.0% 0 0.0% 0 0.0% 0 0.6% 1 8.3% 12 0.8% 1 1.5% 2 0.9% 1 0.0% 0Local Shops - Kingsbury 1.3% 13 0.0% 0 0.0% 0 0.0% 0 0.0% 0 0.0% 0 0.7% 1 0.0% 0 3.0% 4 7.3% 8 0.0% 0Local Shops - North Harrow 0.6% 6 0.0% 0 0.0% 0 0.0% 0 1.2% 1 0.6% 1 2.1% 3 0.8% 1 0.0% 0 0.0% 0 0.0% 0Local Shops - Pinner 1.5% 15 0.0% 0 0.0% 0 4.3% 5 9.4% 8 1.2% 2 0.0% 0 0.0% 0 0.0% 0 0.0% 0 0.0% 0Local Shops - Raynors Lane 0.3% 3 0.0% 0 0.0% 0 0.9% 1 0.0% 0 1.2% 2 0.0% 0 0.0% 0 0.0% 0 0.0% 0 0.0% 0Local Shops - South Harrow 0.9% 9 0.0% 0 0.0% 0 0.0% 0 0.0% 0 5.5% 9 0.0% 0 0.0% 0 0.0% 0 0.0% 0 0.0% 0Local Shops - Stanmore 1.3% 13 0.0% 0 0.0% 0 0.0% 0 0.0% 0 0.0% 0 0.7% 1 0.0% 0 3.0% 4 0.9% 1 20.0% 7Local Shops - Wealdstone 0.4% 4 0.0% 0 0.0% 0 0.0% 0 0.0% 0 0.0% 0 1.4% 2 0.8% 1 0.7% 1 0.0% 0 0.0% 0Local shops - Alperton 0.1% 1 0.0% 0 0.0% 0 0.0% 0 0.0% 0 0.0% 0 0.0% 0 0.8% 1 0.0% 0 0.0% 0 0.0% 0Local shops - Bushey Village 0.1% 1 0.0% 0 0.0% 0 0.0% 0 0.0% 0 0.0% 0 0.7% 1 0.0% 0 0.0% 0 0.0% 0 0.0% 0Local shops - Colindale 0.2% 2 0.0% 0 0.0% 0 0.0% 0 0.0% 0 0.0% 0 0.0% 0 0.0% 0 0.0% 0 1.8% 2 0.0% 0Local shops - Golders Green 0.1% 1 0.0% 0 0.0% 0 0.0% 0 0.0% 0 0.0% 0 0.0% 0 0.8% 1 0.0% 0 0.0% 0 0.0% 0Local shops - Greenford 0.1% 1 0.0% 0 0.0% 0 0.0% 0 0.0% 0 0.0% 0 0.0% 0 0.8% 1 0.0% 0 0.0% 0 0.0% 0Local shops - Hounslow 0.1% 1 0.0% 0 0.0% 0 0.0% 0 0.0% 0 0.0% 0 0.0% 0 0.0% 0 0.0% 0 0.9% 1 0.0% 0Local shops - Kenton 0.5% 5 0.0% 0 0.0% 0 0.0% 0 0.0% 0 0.0% 0 0.0% 0 0.8% 1 3.0% 4 0.0% 0 0.0% 0Local shops - Northolt 0.8% 8 0.0% 0 0.0% 0 0.0% 0 0.0% 0 3.0% 5 0.7% 1 0.8% 1 0.0% 0 0.9% 1 0.0% 0Local shops - Northwood 0.4% 4 5.5% 3 0.0% 0 0.9% 1 0.0% 0 0.0% 0 0.0% 0 0.0% 0 0.0% 0 0.0% 0 0.0% 0Local shops - Queensbury,
Ealing 0.2% 2 0.0% 0 0.0% 0 0.0% 0 0.0% 0 0.0% 0 0.0% 0 0.0% 0 0.7% 1 0.9% 1 0.0% 0
Local shops - Ruislip 0.5% 5 0.0% 0 8.0% 2 1.7% 2 0.0% 0 0.6% 1 0.0% 0 0.0% 0 0.0% 0 0.0% 0 0.0% 0Local shops - Ruislip Manor,
Hillingdon 0.1% 1 0.0% 0 0.0% 0 0.9% 1 0.0% 0 0.0% 0 0.0% 0 0.0% 0 0.0% 0 0.0% 0 0.0% 0
Local shops - South Oxney 0.5% 5 0.0% 0 0.0% 0 0.0% 0 5.9% 5 0.0% 0 0.0% 0 0.0% 0 0.0% 0 0.0% 0 0.0% 0Local shops - Sudbury Hill 0.4% 4 0.0% 0 0.0% 0 0.0% 0 0.0% 0 0.0% 0 1.4% 2 1.5% 2 0.0% 0 0.0% 0 0.0% 0Local shops - Wembley 0.9% 9 0.0% 0 0.0% 0 0.0% 0 0.0% 0 0.0% 0 0.0% 0 6.9% 9 0.0% 0 0.0% 0 0.0% 0Londis, East Lane, Wembley 0.1% 1 0.0% 0 0.0% 0 0.0% 0 0.0% 0 0.0% 0 0.0% 0 0.0% 0 0.7% 1 0.0% 0 0.0% 0Marks and Spencer Simply
Food, BP Garage, Bessborough Road, Harrow
0.6% 6 0.0% 0 0.0% 0 0.0% 0 0.0% 0 0.0% 0 1.4% 2 1.5% 2 1.5% 2 0.0% 0 0.0% 0
Marks and Spencer Simply Food, Ruislip High Street, Ruislip
0.8% 8 1.8% 1 12.0% 3 2.6% 3 0.0% 0 0.0% 0 0.0% 0 0.8% 1 0.0% 0 0.0% 0 0.0% 0
Marks and Spencer, Bishops Walk, Pinner
2.1% 21 1.8% 1 0.0% 0 3.5% 4 8.2% 7 3.6% 6 2.1% 3 0.0% 0 0.0% 0 0.0% 0 0.0% 0
Marks and Spencer, Brent Cross Shopping Centre,
0.1% 1 0.0% 0 0.0% 0 0.0% 0 0.0% 0 0.0% 0 0.0% 0 0.0% 0 0.0% 0 0.9% 1 0.0% 0

By Zone London Borough of Harrow Household Survey Page 36 For Nathaniel Lichfield & Partners May 2009
Total Zone 1 Zone 2 Zone 3 Zone 4 Zone 5 Zone 6 Zone 7 Zone 8 Zone 9 Zone 10
180509 NEMS market research
Prince Charles Drive, Brent Cross
Marks and Spencer, Broadwalk Shopping Centre, Station Road, Edgware
0.1% 1 0.0% 0 0.0% 0 0.0% 0 0.0% 0 0.0% 0 0.0% 0 0.0% 0 0.0% 0 0.9% 1 0.0% 0
Marks and Spencer, Colney Fields Shopping Park, London Colney, St. Albans
0.1% 1 0.0% 0 0.0% 0 0.0% 0 0.0% 0 0.0% 0 0.0% 0 0.0% 0 0.7% 1 0.0% 0 0.0% 0
Marks and Spencer, Harlequin Shopping Centre, High Street, Watford
0.1% 1 0.0% 0 0.0% 0 0.9% 1 0.0% 0 0.0% 0 0.0% 0 0.0% 0 0.0% 0 0.0% 0 0.0% 0
Marks and Spencer, High Street, Rickmansworth
0.1% 1 1.8% 1 0.0% 0 0.0% 0 0.0% 0 0.0% 0 0.0% 0 0.0% 0 0.0% 0 0.0% 0 0.0% 0
Marks and Spencer, Long Acre, Covent Garden
0.1% 1 0.0% 0 0.0% 0 0.0% 0 0.0% 0 0.0% 0 0.7% 1 0.0% 0 0.0% 0 0.0% 0 0.0% 0
Marks and Spencer, Shenley Road, Borehamwood
0.1% 1 0.0% 0 0.0% 0 0.0% 0 0.0% 0 0.0% 0 0.0% 0 0.0% 0 0.0% 0 0.0% 0 2.9% 1
Marks and Spencer, Simply Food, BP Garage, Northolt Park, Potts Hill
0.2% 2 0.0% 0 0.0% 0 0.0% 0 0.0% 0 0.6% 1 0.7% 1 0.0% 0 0.0% 0 0.0% 0 0.0% 0
Marks and Spencer, St. Anns Road, Harrow
2.3% 23 0.0% 0 0.0% 0 0.0% 0 0.0% 0 2.4% 4 6.9% 10 4.6% 6 2.2% 3 0.0% 0 0.0% 0
Marks and Spencer, Sunbury Cross Centre, Staines Road West, Sunbury-on-Thames
0.1% 1 0.0% 0 0.0% 0 0.0% 0 0.0% 0 0.0% 0 0.7% 1 0.0% 0 0.0% 0 0.0% 0 0.0% 0
Marks and Spencer, The Broadway, Ealing
0.2% 2 0.0% 0 0.0% 0 0.0% 0 0.0% 0 0.0% 0 0.0% 0 0.8% 1 0.0% 0 0.9% 1 0.0% 0
Morrisons, Honeypot Lane, Queensbury
3.8% 38 0.0% 0 0.0% 0 0.0% 0 1.2% 1 0.0% 0 0.0% 0 0.0% 0 14.8% 20 15.5% 17 0.0% 0
Morrisons, Pinner Road, North Harrow
0.1% 1 0.0% 0 0.0% 0 0.0% 0 1.2% 1 0.0% 0 0.0% 0 0.0% 0 0.0% 0 0.0% 0 0.0% 0
Morrisons, Uxbridge Road, Hatch End
2.4% 24 1.8% 1 0.0% 0 1.7% 2 14.1% 12 0.6% 1 4.8% 7 0.0% 0 0.7% 1 0.0% 0 0.0% 0
Netto, Northolt Road, Harrow
0.1% 1 0.0% 0 0.0% 0 0.0% 0 0.0% 0 0.6% 1 0.0% 0 0.0% 0 0.0% 0 0.0% 0 0.0% 0
Premier Stores, Court Parade, East Lane, North Wembley
0.1% 1 0.0% 0 0.0% 0 0.0% 0 0.0% 0 0.6% 1 0.0% 0 0.0% 0 0.0% 0 0.0% 0 0.0% 0
Sainsbury's Local, Rayners Lane, Harrow
0.5% 5 0.0% 0 0.0% 0 0.9% 1 0.0% 0 1.8% 3 0.0% 0 0.0% 0 0.7% 1 0.0% 0 0.0% 0
Sainsbury's, Barters Walk, Pinner
2.0% 20 0.0% 0 0.0% 0 7.0% 8 3.5% 3 2.4% 4 2.8% 4 0.0% 0 0.7% 1 0.0% 0 0.0% 0
Sainsbury's, Broadwalk 1.6% 16 0.0% 0 0.0% 0 0.0% 0 0.0% 0 0.0% 0 0.7% 1 0.0% 0 1.5% 2 10.9% 12 2.9% 1

By Zone London Borough of Harrow Household Survey Page 37 For Nathaniel Lichfield & Partners May 2009
Total Zone 1 Zone 2 Zone 3 Zone 4 Zone 5 Zone 6 Zone 7 Zone 8 Zone 9 Zone 10
180509 NEMS market research
Shopping Centre, Station Road, Edgware
Sainsbury's, Draycott Avenue, Harrow
0.2% 2 0.0% 0 0.0% 0 0.0% 0 0.0% 0 0.0% 0 0.0% 0 0.0% 0 1.5% 2 0.0% 0 0.0% 0
Sainsbury's, Ealing Road, Alperton
0.8% 8 0.0% 0 0.0% 0 0.0% 0 0.0% 0 0.0% 0 0.0% 0 6.2% 8 0.0% 0 0.0% 0 0.0% 0
Sainsbury's, Hyde Estate Road, Hendon
0.4% 4 0.0% 0 0.0% 0 0.0% 0 0.0% 0 0.0% 0 0.0% 0 0.0% 0 0.0% 0 3.6% 4 0.0% 0
Sainsbury's, Lombardy Retail Park, Coldharbour Lane, Hayes
0.2% 2 0.0% 0 4.0% 1 0.9% 1 0.0% 0 0.0% 0 0.0% 0 0.0% 0 0.0% 0 0.0% 0 0.0% 0
Sainsbury's, Nash Way, Kenton
3.1% 31 0.0% 0 0.0% 0 0.0% 0 1.2% 1 0.0% 0 3.4% 5 6.9% 9 11.9% 16 0.0% 0 0.0% 0
Sainsbury's, Northolt Road, South Harrow
1.1% 11 0.0% 0 0.0% 0 0.9% 1 0.0% 0 5.5% 9 0.7% 1 0.0% 0 0.0% 0 0.0% 0 0.0% 0
Sainsbury's, South Ruislip, Long Drive
1.8% 18 0.0% 0 4.0% 1 7.0% 8 0.0% 0 4.8% 8 0.0% 0 0.8% 1 0.0% 0 0.0% 0 0.0% 0
Sainsbury's, The Broadway, Stanmore
1.6% 16 0.0% 0 0.0% 0 0.0% 0 0.0% 0 0.0% 0 0.0% 0 0.0% 0 3.0% 4 0.9% 1 31.4% 11
Somerfield, Carpenters Park, Watford
0.1% 1 0.0% 0 0.0% 0 0.0% 0 1.2% 1 0.0% 0 0.0% 0 0.0% 0 0.0% 0 0.0% 0 0.0% 0
Somerfield, Pinner Road, North Harrow
0.2% 2 0.0% 0 0.0% 0 0.0% 0 0.0% 0 0.0% 0 0.0% 0 0.0% 0 1.5% 2 0.0% 0 0.0% 0
Somerfield, Preston Road, Wembley
0.6% 6 0.0% 0 0.0% 0 0.0% 0 0.0% 0 0.0% 0 0.0% 0 3.8% 5 0.7% 1 0.0% 0 0.0% 0
Spar, Marsh Road, Pinner 0.2% 2 0.0% 0 0.0% 0 0.0% 0 0.0% 0 0.6% 1 0.7% 1 0.0% 0 0.0% 0 0.0% 0 0.0% 0Tesco Express, 22,
Alexandra Avenue, Harrow
0.4% 4 0.0% 0 0.0% 0 0.0% 0 0.0% 0 1.2% 2 1.4% 2 0.0% 0 0.0% 0 0.0% 0 0.0% 0
Tesco Express, 386, Alexandra Avenue,Harrow
0.4% 4 0.0% 0 0.0% 0 0.0% 0 0.0% 0 2.4% 4 0.0% 0 0.0% 0 0.0% 0 0.0% 0 0.0% 0
Tesco Express, Field End Road, Eastcote
1.3% 13 0.0% 0 0.0% 0 5.2% 6 0.0% 0 3.6% 6 0.0% 0 0.0% 0 0.7% 1 0.0% 0 0.0% 0
Tesco Express, Field End Road, Ruislip Field
0.6% 6 0.0% 0 0.0% 0 5.2% 6 0.0% 0 0.0% 0 0.0% 0 0.0% 0 0.0% 0 0.0% 0 0.0% 0
Tesco Express, Honeypot Lane, Stanmore
0.2% 2 0.0% 0 0.0% 0 0.0% 0 0.0% 0 0.6% 1 0.0% 0 0.0% 0 0.0% 0 0.0% 0 2.9% 1
Tesco Express, Kingsbury Circle, Kingsbury
0.3% 3 0.0% 0 0.0% 0 0.0% 0 0.0% 0 0.0% 0 0.0% 0 0.0% 0 1.5% 2 0.9% 1 0.0% 0
Tesco Express, Northwood Hills, Joel Street, Pinner
0.5% 5 5.5% 3 0.0% 0 1.7% 2 0.0% 0 0.0% 0 0.0% 0 0.0% 0 0.0% 0 0.0% 0 0.0% 0
Tesco Express, Park Way, Ruislip
0.3% 3 0.0% 0 4.0% 1 1.7% 2 0.0% 0 0.0% 0 0.0% 0 0.0% 0 0.0% 0 0.0% 0 0.0% 0
Tesco Express, Pinner Road, Harrow
1.0% 10 0.0% 0 0.0% 0 0.9% 1 2.4% 2 1.8% 3 2.1% 3 0.0% 0 0.7% 1 0.0% 0 0.0% 0
Tesco Express, Prestwick Road, Watford
0.2% 2 0.0% 0 0.0% 0 0.0% 0 2.4% 2 0.0% 0 0.0% 0 0.0% 0 0.0% 0 0.0% 0 0.0% 0

By Zone London Borough of Harrow Household Survey Page 38 For Nathaniel Lichfield & Partners May 2009
Total Zone 1 Zone 2 Zone 3 Zone 4 Zone 5 Zone 6 Zone 7 Zone 8 Zone 9 Zone 10
180509 NEMS market research
Tesco Express, The Parade, Haven Green, Ealing
0.3% 3 0.0% 0 0.0% 0 0.0% 0 0.0% 0 0.0% 0 0.0% 0 2.3% 3 0.0% 0 0.0% 0 0.0% 0
Tesco Express, Uxbridge Road, Hatch End, Pinner
0.8% 8 1.8% 1 0.0% 0 0.9% 1 7.1% 6 0.0% 0 0.0% 0 0.0% 0 0.0% 0 0.0% 0 0.0% 0
Tesco Extra, Glencoe Road, Hayes, Yeading
0.1% 1 0.0% 0 0.0% 0 0.0% 0 0.0% 0 0.6% 1 0.0% 0 0.0% 0 0.0% 0 0.0% 0 0.0% 0
Tesco Metro, Burnt Oak Broadway, Edgware
0.4% 4 0.0% 0 0.0% 0 0.0% 0 0.0% 0 0.0% 0 0.0% 0 0.0% 0 0.0% 0 3.6% 4 0.0% 0
Tesco, Ash Hill Drive, Pinner
1.7% 17 5.5% 3 4.0% 1 7.0% 8 1.2% 1 1.2% 2 0.7% 1 0.8% 1 0.0% 0 0.0% 0 0.0% 0
Tesco, Brent Park, Great Central Way, Willesden
0.2% 2 0.0% 0 0.0% 0 0.0% 0 0.0% 0 0.0% 0 0.0% 0 1.5% 2 0.0% 0 0.0% 0 0.0% 0
Tesco, Frogmoor Wharf, Harefield Road, Rickmansworth
0.5% 5 5.5% 3 8.0% 2 0.0% 0 0.0% 0 0.0% 0 0.0% 0 0.0% 0 0.0% 0 0.0% 0 0.0% 0
Tesco, Greenford, Old Hoover Buildings, Greenford
0.2% 2 0.0% 0 0.0% 0 0.0% 0 0.0% 0 1.2% 2 0.0% 0 0.0% 0 0.0% 0 0.0% 0 0.0% 0
Tesco, High Street, Feltham 0.1% 1 0.0% 0 0.0% 0 0.0% 0 0.0% 0 0.6% 1 0.0% 0 0.0% 0 0.0% 0 0.0% 0 0.0% 0Tesco, Kenton Lane, Harrow 2.0% 20 0.0% 0 0.0% 0 0.0% 0 0.0% 0 0.0% 0 3.4% 5 0.0% 0 11.1% 15 0.0% 0 0.0% 0Tesco, Long Lane,
Southwark 0.1% 1 0.0% 0 4.0% 1 0.0% 0 0.0% 0 0.0% 0 0.0% 0 0.0% 0 0.0% 0 0.0% 0 0.0% 0
Tesco, Station Road, Harrow 2.1% 21 0.0% 0 0.0% 0 0.0% 0 0.0% 0 1.2% 2 10.3% 15 0.0% 0 1.5% 2 0.9% 1 2.9% 1Tesco, Watford, Lower High
Street, Watford 0.7% 7 1.8% 1 0.0% 0 0.9% 1 3.5% 3 0.0% 0 0.7% 1 0.8% 1 0.0% 0 0.0% 0 0.0% 0
Waitrose, Brent Cross Shopping Centre, Prince Charles Drive, Brent Cross
0.2% 2 0.0% 0 0.0% 0 0.0% 0 0.0% 0 0.0% 0 0.0% 0 0.0% 0 0.7% 1 0.9% 1 0.0% 0
Waitrose, Green Lane, Northwood
2.2% 22 40.0% 22 0.0% 0 0.0% 0 0.0% 0 0.0% 0 0.0% 0 0.0% 0 0.0% 0 0.0% 0 0.0% 0
Waitrose, High Road, Harrow Weald
2.4% 24 0.0% 0 0.0% 0 0.0% 0 9.4% 8 0.0% 0 6.2% 9 0.0% 0 3.0% 4 0.0% 0 8.6% 3
Waitrose, Kingsend, Ruislip 1.3% 13 0.0% 0 12.0% 3 7.8% 9 1.2% 1 0.0% 0 0.0% 0 0.0% 0 0.0% 0 0.0% 0 0.0% 0Waitrose, Northolt Road,
South Harrow 2.7% 27 0.0% 0 0.0% 0 3.5% 4 0.0% 0 10.3% 17 2.1% 3 2.3% 3 0.0% 0 0.0% 0 0.0% 0
Waitrose, The Spires Shopping Centre, High Street, Barnet
0.1% 1 0.0% 0 0.0% 0 0.0% 0 0.0% 0 0.0% 0 0.0% 0 0.0% 0 0.7% 1 0.0% 0 0.0% 0
(Don't do top-up shopping / can't remember / refused)
23.9% 239 21.8% 12 36.0% 9 13.9% 16 20.0% 17 30.9% 51 19.3% 28 34.6% 45 20.0% 27 24.5% 27 20.0% 7
Base: 1000 55 25 115 85 165 145 130 135 110 35

By Zone London Borough of Harrow Household Survey Page 39 For Nathaniel Lichfield & Partners May 2009
Total Zone 1 Zone 2 Zone 3 Zone 4 Zone 5 Zone 6 Zone 7 Zone 8 Zone 9 Zone 10
180509 NEMS market research
Q04 Where do you do most of your household's non-food shopping? Brent Cross 5.8% 58 1.8% 1 0.0% 0 0.0% 0 2.4% 2 0.0% 0 1.4% 2 11.5% 15 8.1% 11 19.1% 21 17.1% 6Burnt Oak 0.2% 2 0.0% 0 0.0% 0 0.9% 1 0.0% 0 0.0% 0 0.0% 0 0.0% 0 0.0% 0 0.9% 1 0.0% 0Central London/ West End 4.2% 42 3.6% 2 20.0% 5 1.7% 2 1.2% 1 3.6% 6 5.5% 8 4.6% 6 2.2% 3 6.4% 7 5.7% 2Edgware 3.9% 39 0.0% 0 0.0% 0 0.0% 0 0.0% 0 0.0% 0 0.7% 1 0.0% 0 2.2% 3 28.2% 31 11.4% 4Harrow 35.8% 358 5.5% 3 0.0% 0 18.3% 21 25.9% 22 52.7% 87 57.9% 84 47.7% 62 46.7% 63 10.0% 11 14.3% 5Kingsbury 1.1% 11 0.0% 0 0.0% 0 0.0% 0 0.0% 0 0.0% 0 0.0% 0 0.0% 0 4.4% 6 4.5% 5 0.0% 0North Harrow 0.1% 1 0.0% 0 0.0% 0 0.0% 0 1.2% 1 0.0% 0 0.0% 0 0.0% 0 0.0% 0 0.0% 0 0.0% 0Pinner 3.2% 32 5.5% 3 0.0% 0 3.5% 4 12.9% 11 5.5% 9 1.4% 2 0.0% 0 0.7% 1 0.0% 0 5.7% 2Rayners Lane 0.3% 3 0.0% 0 0.0% 0 0.0% 0 0.0% 0 1.8% 3 0.0% 0 0.0% 0 0.0% 0 0.0% 0 0.0% 0South Harrow 1.7% 17 0.0% 0 0.0% 0 0.0% 0 1.2% 1 9.1% 15 0.0% 0 0.8% 1 0.0% 0 0.0% 0 0.0% 0Stanmore 1.3% 13 0.0% 0 0.0% 0 0.0% 0 0.0% 0 0.0% 0 0.0% 0 0.0% 0 5.2% 7 1.8% 2 11.4% 4Uxbridge 4.3% 43 5.5% 3 36.0% 9 20.9% 24 0.0% 0 3.0% 5 0.7% 1 0.8% 1 0.0% 0 0.0% 0 0.0% 0Watford 17.2% 172 60.0% 33 24.0% 6 26.1% 30 37.6% 32 8.5% 14 16.6% 24 3.1% 4 8.9% 12 10.0% 11 17.1% 6Wealdstone 0.3% 3 0.0% 0 0.0% 0 0.0% 0 0.0% 0 0.0% 0 0.0% 0 0.0% 0 2.2% 3 0.0% 0 0.0% 0Wembley 2.8% 28 0.0% 0 0.0% 0 0.0% 0 0.0% 0 0.6% 1 2.8% 4 13.8% 18 3.0% 4 0.9% 1 0.0% 0Westfield / White City 0.2% 2 0.0% 0 0.0% 0 1.7% 2 0.0% 0 0.0% 0 0.0% 0 0.0% 0 0.0% 0 0.0% 0 0.0% 0Internet / Delivered 2.0% 20 0.0% 0 0.0% 0 2.6% 3 1.2% 1 2.4% 4 1.4% 2 3.1% 4 0.7% 1 2.7% 3 5.7% 2Other 0.0% 0 0.0% 0 0.0% 0 0.0% 0 0.0% 0 0.0% 0 0.0% 0 0.0% 0 0.0% 0 0.0% 0 0.0% 0Aberdeen 0.0% 0 0.0% 0 0.0% 0 0.0% 0 0.0% 0 0.0% 0 0.0% 0 0.0% 0 0.0% 0 0.0% 0 0.0% 0Abroad 0.0% 0 0.0% 0 0.0% 0 0.0% 0 0.0% 0 0.0% 0 0.0% 0 0.0% 0 0.0% 0 0.0% 0 0.0% 0Allied Carpets, Edgware
Road, Paddington 0.0% 0 0.0% 0 0.0% 0 0.0% 0 0.0% 0 0.0% 0 0.0% 0 0.0% 0 0.0% 0 0.0% 0 0.0% 0
Alperton 0.2% 2 0.0% 0 0.0% 0 0.0% 0 0.0% 0 0.0% 0 0.0% 0 1.5% 2 0.0% 0 0.0% 0 0.0% 0Amersham,
Buckinghamshire 0.0% 0 0.0% 0 0.0% 0 0.0% 0 0.0% 0 0.0% 0 0.0% 0 0.0% 0 0.0% 0 0.0% 0 0.0% 0
Argos, High Street, Ruislip, Hillingdon
0.0% 0 0.0% 0 0.0% 0 0.0% 0 0.0% 0 0.0% 0 0.0% 0 0.0% 0 0.0% 0 0.0% 0 0.0% 0
Asda, Edgware Road, Colindale
0.0% 0 0.0% 0 0.0% 0 0.0% 0 0.0% 0 0.0% 0 0.0% 0 0.0% 0 0.0% 0 0.0% 0 0.0% 0
Ashford, Kent 0.0% 0 0.0% 0 0.0% 0 0.0% 0 0.0% 0 0.0% 0 0.0% 0 0.0% 0 0.0% 0 0.0% 0 0.0% 0B & Q, Cricklewood 0.0% 0 0.0% 0 0.0% 0 0.0% 0 0.0% 0 0.0% 0 0.0% 0 0.0% 0 0.0% 0 0.0% 0 0.0% 0B & Q, Honeypot Lane,
Stanmore 0.0% 0 0.0% 0 0.0% 0 0.0% 0 0.0% 0 0.0% 0 0.0% 0 0.0% 0 0.0% 0 0.0% 0 0.0% 0
B & Q, Queensbury 0.0% 0 0.0% 0 0.0% 0 0.0% 0 0.0% 0 0.0% 0 0.0% 0 0.0% 0 0.0% 0 0.0% 0 0.0% 0B & Q, Western Avenue,
Greenford 0.0% 0 0.0% 0 0.0% 0 0.0% 0 0.0% 0 0.0% 0 0.0% 0 0.0% 0 0.0% 0 0.0% 0 0.0% 0
Belmont, Sutton 0.0% 0 0.0% 0 0.0% 0 0.0% 0 0.0% 0 0.0% 0 0.0% 0 0.0% 0 0.0% 0 0.0% 0 0.0% 0Bicester, Oxfodshire 0.0% 0 0.0% 0 0.0% 0 0.0% 0 0.0% 0 0.0% 0 0.0% 0 0.0% 0 0.0% 0 0.0% 0 0.0% 0Birmingham 0.0% 0 0.0% 0 0.0% 0 0.0% 0 0.0% 0 0.0% 0 0.0% 0 0.0% 0 0.0% 0 0.0% 0 0.0% 0Borehamwood 0.0% 0 0.0% 0 0.0% 0 0.0% 0 0.0% 0 0.0% 0 0.0% 0 0.0% 0 0.0% 0 0.0% 0 0.0% 0Bournemouth 0.1% 1 0.0% 0 0.0% 0 0.0% 0 1.2% 1 0.0% 0 0.0% 0 0.0% 0 0.0% 0 0.0% 0 0.0% 0Brighton 0.0% 0 0.0% 0 0.0% 0 0.0% 0 0.0% 0 0.0% 0 0.0% 0 0.0% 0 0.0% 0 0.0% 0 0.0% 0Bristol 0.0% 0 0.0% 0 0.0% 0 0.0% 0 0.0% 0 0.0% 0 0.0% 0 0.0% 0 0.0% 0 0.0% 0 0.0% 0Broadway, Worcestershire 0.0% 0 0.0% 0 0.0% 0 0.0% 0 0.0% 0 0.0% 0 0.0% 0 0.0% 0 0.0% 0 0.0% 0 0.0% 0Bucks Hill 0.0% 0 0.0% 0 0.0% 0 0.0% 0 0.0% 0 0.0% 0 0.0% 0 0.0% 0 0.0% 0 0.0% 0 0.0% 0

By Zone London Borough of Harrow Household Survey Page 40 For Nathaniel Lichfield & Partners May 2009
Total Zone 1 Zone 2 Zone 3 Zone 4 Zone 5 Zone 6 Zone 7 Zone 8 Zone 9 Zone 10
180509 NEMS market research
Bushey, Hertfordshire 0.1% 1 0.0% 0 0.0% 0 0.0% 0 1.2% 1 0.0% 0 0.0% 0 0.0% 0 0.0% 0 0.0% 0 0.0% 0C.J. Electrics, White Hart ,
Northolt 0.0% 0 0.0% 0 0.0% 0 0.0% 0 0.0% 0 0.0% 0 0.0% 0 0.0% 0 0.0% 0 0.0% 0 0.0% 0
Camberley 0.0% 0 0.0% 0 0.0% 0 0.0% 0 0.0% 0 0.0% 0 0.0% 0 0.0% 0 0.0% 0 0.0% 0 0.0% 0Cambridge 0.0% 0 0.0% 0 0.0% 0 0.0% 0 0.0% 0 0.0% 0 0.0% 0 0.0% 0 0.0% 0 0.0% 0 0.0% 0Camden 0.0% 0 0.0% 0 0.0% 0 0.0% 0 0.0% 0 0.0% 0 0.0% 0 0.0% 0 0.0% 0 0.0% 0 0.0% 0Carpenter Park 0.0% 0 0.0% 0 0.0% 0 0.0% 0 0.0% 0 0.0% 0 0.0% 0 0.0% 0 0.0% 0 0.0% 0 0.0% 0Chalfont St. Giles,
Buckinghamshire 0.0% 0 0.0% 0 0.0% 0 0.0% 0 0.0% 0 0.0% 0 0.0% 0 0.0% 0 0.0% 0 0.0% 0 0.0% 0
Cheltenham, Gloucestershire 0.0% 0 0.0% 0 0.0% 0 0.0% 0 0.0% 0 0.0% 0 0.0% 0 0.0% 0 0.0% 0 0.0% 0 0.0% 0Chenies Garden Centre,
Rickmansworth 0.0% 0 0.0% 0 0.0% 0 0.0% 0 0.0% 0 0.0% 0 0.0% 0 0.0% 0 0.0% 0 0.0% 0 0.0% 0
Chiswick 0.0% 0 0.0% 0 0.0% 0 0.0% 0 0.0% 0 0.0% 0 0.0% 0 0.0% 0 0.0% 0 0.0% 0 0.0% 0Chorleywood,
Rickmansworth 0.0% 0 0.0% 0 0.0% 0 0.0% 0 0.0% 0 0.0% 0 0.0% 0 0.0% 0 0.0% 0 0.0% 0 0.0% 0
Clacton-on-Sea, Essex 0.0% 0 0.0% 0 0.0% 0 0.0% 0 0.0% 0 0.0% 0 0.0% 0 0.0% 0 0.0% 0 0.0% 0 0.0% 0Colchester 0.0% 0 0.0% 0 0.0% 0 0.0% 0 0.0% 0 0.0% 0 0.0% 0 0.0% 0 0.0% 0 0.0% 0 0.0% 0Colindale 0.8% 8 0.0% 0 0.0% 0 0.0% 0 0.0% 0 0.0% 0 0.7% 1 0.0% 0 0.7% 1 5.5% 6 0.0% 0Comet, Hayes Bridge Retail
Park, Uxbridge Road, Hayes
0.0% 0 0.0% 0 0.0% 0 0.0% 0 0.0% 0 0.0% 0 0.0% 0 0.0% 0 0.0% 0 0.0% 0 0.0% 0
Comet, Luton Retail Park, Luton
0.0% 0 0.0% 0 0.0% 0 0.0% 0 0.0% 0 0.0% 0 0.0% 0 0.0% 0 0.0% 0 0.0% 0 0.0% 0
Cricklewood 0.0% 0 0.0% 0 0.0% 0 0.0% 0 0.0% 0 0.0% 0 0.0% 0 0.0% 0 0.0% 0 0.0% 0 0.0% 0Cromer, Norfolk 0.0% 0 0.0% 0 0.0% 0 0.0% 0 0.0% 0 0.0% 0 0.0% 0 0.0% 0 0.0% 0 0.0% 0 0.0% 0Currys, Century Park, Dalton
Way, Watford 0.0% 0 0.0% 0 0.0% 0 0.0% 0 0.0% 0 0.0% 0 0.0% 0 0.0% 0 0.0% 0 0.0% 0 0.0% 0
Currys, Hayes Bridge Retail Park, Uxbridge Road, Hayes
0.0% 0 0.0% 0 0.0% 0 0.0% 0 0.0% 0 0.0% 0 0.0% 0 0.0% 0 0.0% 0 0.0% 0 0.0% 0
Currys, Staples Corner Retail Park, Geron Way, Cricklewood
0.0% 0 0.0% 0 0.0% 0 0.0% 0 0.0% 0 0.0% 0 0.0% 0 0.0% 0 0.0% 0 0.0% 0 0.0% 0
Currys, Stirling Retail Park, Stirling Way, Borehamwood
0.0% 0 0.0% 0 0.0% 0 0.0% 0 0.0% 0 0.0% 0 0.0% 0 0.0% 0 0.0% 0 0.0% 0 0.0% 0
Derby 0.0% 0 0.0% 0 0.0% 0 0.0% 0 0.0% 0 0.0% 0 0.0% 0 0.0% 0 0.0% 0 0.0% 0 0.0% 0Dreams, Hayes Bridge Retail
Park, Uxbridge Road, Hayes
0.0% 0 0.0% 0 0.0% 0 0.0% 0 0.0% 0 0.0% 0 0.0% 0 0.0% 0 0.0% 0 0.0% 0 0.0% 0
Ducks Hill Garden Centre, Duck's Hill Road, Ruislip
0.0% 0 0.0% 0 0.0% 0 0.0% 0 0.0% 0 0.0% 0 0.0% 0 0.0% 0 0.0% 0 0.0% 0 0.0% 0
Dunelm Mill, Northolt Road, Harrow
0.0% 0 0.0% 0 0.0% 0 0.0% 0 0.0% 0 0.0% 0 0.0% 0 0.0% 0 0.0% 0 0.0% 0 0.0% 0
Ealing 0.1% 1 0.0% 0 0.0% 0 0.0% 0 0.0% 0 0.0% 0 0.0% 0 0.8% 1 0.0% 0 0.0% 0 0.0% 0Ealing Broadway 0.0% 0 0.0% 0 0.0% 0 0.0% 0 0.0% 0 0.0% 0 0.0% 0 0.0% 0 0.0% 0 0.0% 0 0.0% 0Eastbourne 0.0% 0 0.0% 0 0.0% 0 0.0% 0 0.0% 0 0.0% 0 0.0% 0 0.0% 0 0.0% 0 0.0% 0 0.0% 0

By Zone London Borough of Harrow Household Survey Page 41 For Nathaniel Lichfield & Partners May 2009
Total Zone 1 Zone 2 Zone 3 Zone 4 Zone 5 Zone 6 Zone 7 Zone 8 Zone 9 Zone 10
180509 NEMS market research
Eastcote 0.8% 8 0.0% 0 0.0% 0 7.0% 8 0.0% 0 0.0% 0 0.0% 0 0.0% 0 0.0% 0 0.0% 0 0.0% 0Ely, Cambridgeshire 0.0% 0 0.0% 0 0.0% 0 0.0% 0 0.0% 0 0.0% 0 0.0% 0 0.0% 0 0.0% 0 0.0% 0 0.0% 0Enfield 0.1% 1 0.0% 0 0.0% 0 0.0% 0 0.0% 0 0.0% 0 0.7% 1 0.0% 0 0.0% 0 0.0% 0 0.0% 0Euronics, Field End Road,
Ruislip 0.0% 0 0.0% 0 0.0% 0 0.0% 0 0.0% 0 0.0% 0 0.0% 0 0.0% 0 0.0% 0 0.0% 0 0.0% 0
Exeter 0.0% 0 0.0% 0 0.0% 0 0.0% 0 0.0% 0 0.0% 0 0.0% 0 0.0% 0 0.0% 0 0.0% 0 0.0% 0Falmouth, Cornwall 0.0% 0 0.0% 0 0.0% 0 0.0% 0 0.0% 0 0.0% 0 0.0% 0 0.0% 0 0.0% 0 0.0% 0 0.0% 0Feltham 0.0% 0 0.0% 0 0.0% 0 0.0% 0 0.0% 0 0.0% 0 0.0% 0 0.0% 0 0.0% 0 0.0% 0 0.0% 0Finchley 0.0% 0 0.0% 0 0.0% 0 0.0% 0 0.0% 0 0.0% 0 0.0% 0 0.0% 0 0.0% 0 0.0% 0 0.0% 0Gatwick Airport 0.0% 0 0.0% 0 0.0% 0 0.0% 0 0.0% 0 0.0% 0 0.0% 0 0.0% 0 0.0% 0 0.0% 0 0.0% 0Gerrards Cross 0.0% 0 0.0% 0 0.0% 0 0.0% 0 0.0% 0 0.0% 0 0.0% 0 0.0% 0 0.0% 0 0.0% 0 0.0% 0Golders Green 0.0% 0 0.0% 0 0.0% 0 0.0% 0 0.0% 0 0.0% 0 0.0% 0 0.0% 0 0.0% 0 0.0% 0 0.0% 0Great Yarmouth 0.0% 0 0.0% 0 0.0% 0 0.0% 0 0.0% 0 0.0% 0 0.0% 0 0.0% 0 0.0% 0 0.0% 0 0.0% 0Greenford 0.2% 2 0.0% 0 0.0% 0 0.0% 0 0.0% 0 0.6% 1 0.7% 1 0.0% 0 0.0% 0 0.0% 0 0.0% 0Gunwharf Quays,
Portsmouth 0.1% 1 0.0% 0 0.0% 0 0.0% 0 0.0% 0 0.6% 1 0.0% 0 0.0% 0 0.0% 0 0.0% 0 0.0% 0
Hammersmith 0.0% 0 0.0% 0 0.0% 0 0.0% 0 0.0% 0 0.0% 0 0.0% 0 0.0% 0 0.0% 0 0.0% 0 0.0% 0Hampstead 0.0% 0 0.0% 0 0.0% 0 0.0% 0 0.0% 0 0.0% 0 0.0% 0 0.0% 0 0.0% 0 0.0% 0 0.0% 0Harefield 0.0% 0 0.0% 0 0.0% 0 0.0% 0 0.0% 0 0.0% 0 0.0% 0 0.0% 0 0.0% 0 0.0% 0 0.0% 0Harlesden 0.0% 0 0.0% 0 0.0% 0 0.0% 0 0.0% 0 0.0% 0 0.0% 0 0.0% 0 0.0% 0 0.0% 0 0.0% 0Harrow Electronics, Station
Road, Harrow 0.0% 0 0.0% 0 0.0% 0 0.0% 0 0.0% 0 0.0% 0 0.0% 0 0.0% 0 0.0% 0 0.0% 0 0.0% 0
Harrow Weald 0.1% 1 0.0% 0 0.0% 0 0.0% 0 0.0% 0 0.0% 0 0.7% 1 0.0% 0 0.0% 0 0.0% 0 0.0% 0Harveys, Colne Valley Retail
Park, Lower High Street, Watford
0.0% 0 0.0% 0 0.0% 0 0.0% 0 0.0% 0 0.0% 0 0.0% 0 0.0% 0 0.0% 0 0.0% 0 0.0% 0
Hatch End 0.2% 2 0.0% 0 0.0% 0 0.0% 0 2.4% 2 0.0% 0 0.0% 0 0.0% 0 0.0% 0 0.0% 0 0.0% 0Hatfield, Hertfordshire 0.1% 1 0.0% 0 0.0% 0 0.0% 0 1.2% 1 0.0% 0 0.0% 0 0.0% 0 0.0% 0 0.0% 0 0.0% 0Hayes 0.1% 1 0.0% 0 0.0% 0 0.0% 0 0.0% 0 0.0% 0 0.0% 0 0.8% 1 0.0% 0 0.0% 0 0.0% 0Hayes Bridge Retail Park,
Uxbridge Rd, Hillingdon 0.0% 0 0.0% 0 0.0% 0 0.0% 0 0.0% 0 0.0% 0 0.0% 0 0.0% 0 0.0% 0 0.0% 0 0.0% 0
Hemel Hempstead, Hertfordshire
0.1% 1 0.0% 0 0.0% 0 0.0% 0 0.0% 0 0.0% 0 0.0% 0 0.0% 0 0.7% 1 0.0% 0 0.0% 0
Hendon, Middlesex 0.1% 1 0.0% 0 0.0% 0 0.0% 0 0.0% 0 0.6% 1 0.0% 0 0.0% 0 0.0% 0 0.0% 0 0.0% 0High Wycombe,
Buckinghamshire 0.1% 1 0.0% 0 0.0% 0 0.0% 0 0.0% 0 0.0% 0 0.0% 0 0.8% 1 0.0% 0 0.0% 0 0.0% 0
Hillingdon 0.0% 0 0.0% 0 0.0% 0 0.0% 0 0.0% 0 0.0% 0 0.0% 0 0.0% 0 0.0% 0 0.0% 0 0.0% 0Hitchin, Hertfordshire 0.0% 0 0.0% 0 0.0% 0 0.0% 0 0.0% 0 0.0% 0 0.0% 0 0.0% 0 0.0% 0 0.0% 0 0.0% 0Homebase, Colindale 0.0% 0 0.0% 0 0.0% 0 0.0% 0 0.0% 0 0.0% 0 0.0% 0 0.0% 0 0.0% 0 0.0% 0 0.0% 0Homebase, High Road,
Harrow 0.0% 0 0.0% 0 0.0% 0 0.0% 0 0.0% 0 0.0% 0 0.0% 0 0.0% 0 0.0% 0 0.0% 0 0.0% 0
Homebase, Victoria Retail Park, Crown Road, Ruislip
0.0% 0 0.0% 0 0.0% 0 0.0% 0 0.0% 0 0.0% 0 0.0% 0 0.0% 0 0.0% 0 0.0% 0 0.0% 0
Homebase, Wembley 0.0% 0 0.0% 0 0.0% 0 0.0% 0 0.0% 0 0.0% 0 0.0% 0 0.0% 0 0.0% 0 0.0% 0 0.0% 0Hounslow 0.0% 0 0.0% 0 0.0% 0 0.0% 0 0.0% 0 0.0% 0 0.0% 0 0.0% 0 0.0% 0 0.0% 0 0.0% 0Hyde 0.0% 0 0.0% 0 0.0% 0 0.0% 0 0.0% 0 0.0% 0 0.0% 0 0.0% 0 0.0% 0 0.0% 0 0.0% 0Ikea, Drury Way, Neasden 0.0% 0 0.0% 0 0.0% 0 0.0% 0 0.0% 0 0.0% 0 0.0% 0 0.0% 0 0.0% 0 0.0% 0 0.0% 0

By Zone London Borough of Harrow Household Survey Page 42 For Nathaniel Lichfield & Partners May 2009
Total Zone 1 Zone 2 Zone 3 Zone 4 Zone 5 Zone 6 Zone 7 Zone 8 Zone 9 Zone 10
180509 NEMS market research
Ipswich 0.0% 0 0.0% 0 0.0% 0 0.0% 0 0.0% 0 0.0% 0 0.0% 0 0.0% 0 0.0% 0 0.0% 0 0.0% 0John Lewis, Holmers Farm
Way, Cressex Centre, High Wycombe
0.0% 0 0.0% 0 0.0% 0 0.0% 0 0.0% 0 0.0% 0 0.0% 0 0.0% 0 0.0% 0 0.0% 0 0.0% 0
John Lewis, The Harlequin Centre, Station Road, Watford
0.0% 0 0.0% 0 0.0% 0 0.0% 0 0.0% 0 0.0% 0 0.0% 0 0.0% 0 0.0% 0 0.0% 0 0.0% 0
Kensington 0.0% 0 0.0% 0 0.0% 0 0.0% 0 0.0% 0 0.0% 0 0.0% 0 0.0% 0 0.0% 0 0.0% 0 0.0% 0Kent 0.0% 0 0.0% 0 0.0% 0 0.0% 0 0.0% 0 0.0% 0 0.0% 0 0.0% 0 0.0% 0 0.0% 0 0.0% 0Kentish Town 0.0% 0 0.0% 0 0.0% 0 0.0% 0 0.0% 0 0.0% 0 0.0% 0 0.0% 0 0.0% 0 0.0% 0 0.0% 0Kenton 0.5% 5 0.0% 0 0.0% 0 0.0% 0 0.0% 0 0.0% 0 0.0% 0 1.5% 2 2.2% 3 0.0% 0 0.0% 0Kilburn 0.0% 0 0.0% 0 0.0% 0 0.0% 0 0.0% 0 0.0% 0 0.0% 0 0.0% 0 0.0% 0 0.0% 0 0.0% 0Kings Langley 0.0% 0 0.0% 0 0.0% 0 0.0% 0 0.0% 0 0.0% 0 0.0% 0 0.0% 0 0.0% 0 0.0% 0 0.0% 0Land of Leather, Victoria
Road, South Ruislip 0.0% 0 0.0% 0 0.0% 0 0.0% 0 0.0% 0 0.0% 0 0.0% 0 0.0% 0 0.0% 0 0.0% 0 0.0% 0
London Colney, St. Albans 0.2% 2 0.0% 0 0.0% 0 0.0% 0 0.0% 0 0.0% 0 0.0% 0 0.0% 0 1.5% 2 0.0% 0 0.0% 0Manchester 0.1% 1 0.0% 0 0.0% 0 0.9% 1 0.0% 0 0.0% 0 0.0% 0 0.0% 0 0.0% 0 0.0% 0 0.0% 0Marlow, Buckinghamshire 0.0% 0 0.0% 0 0.0% 0 0.0% 0 0.0% 0 0.0% 0 0.0% 0 0.0% 0 0.0% 0 0.0% 0 0.0% 0MFI, Edgware Road,
Colindale 0.0% 0 0.0% 0 0.0% 0 0.0% 0 0.0% 0 0.0% 0 0.0% 0 0.0% 0 0.0% 0 0.0% 0 0.0% 0
Middlesex 0.1% 1 0.0% 0 0.0% 0 0.0% 0 0.0% 0 0.6% 1 0.0% 0 0.0% 0 0.0% 0 0.0% 0 0.0% 0Milton Keynes 0.1% 1 0.0% 0 0.0% 0 0.0% 0 0.0% 0 0.0% 0 0.0% 0 0.0% 0 0.0% 0 0.0% 0 2.9% 1Moorpark 0.0% 0 0.0% 0 0.0% 0 0.0% 0 0.0% 0 0.0% 0 0.0% 0 0.0% 0 0.0% 0 0.0% 0 0.0% 0Morrisons, Uxbridge Road,
Hatch End, Pinner 0.0% 0 0.0% 0 0.0% 0 0.0% 0 0.0% 0 0.0% 0 0.0% 0 0.0% 0 0.0% 0 0.0% 0 0.0% 0
Neasden 0.0% 0 0.0% 0 0.0% 0 0.0% 0 0.0% 0 0.0% 0 0.0% 0 0.0% 0 0.0% 0 0.0% 0 0.0% 0Norfolk 0.0% 0 0.0% 0 0.0% 0 0.0% 0 0.0% 0 0.0% 0 0.0% 0 0.0% 0 0.0% 0 0.0% 0 0.0% 0North Finchley 0.0% 0 0.0% 0 0.0% 0 0.0% 0 0.0% 0 0.0% 0 0.0% 0 0.0% 0 0.0% 0 0.0% 0 0.0% 0Northolt 0.2% 2 0.0% 0 0.0% 0 0.0% 0 0.0% 0 1.2% 2 0.0% 0 0.0% 0 0.0% 0 0.0% 0 0.0% 0Northwood 0.3% 3 5.5% 3 0.0% 0 0.0% 0 0.0% 0 0.0% 0 0.0% 0 0.0% 0 0.0% 0 0.0% 0 0.0% 0Office World, Staples Corner
Retail Park, Geron Way, Barnet
0.0% 0 0.0% 0 0.0% 0 0.0% 0 0.0% 0 0.0% 0 0.0% 0 0.0% 0 0.0% 0 0.0% 0 0.0% 0
Osterley 0.0% 0 0.0% 0 0.0% 0 0.0% 0 0.0% 0 0.0% 0 0.0% 0 0.0% 0 0.0% 0 0.0% 0 0.0% 0Oxbridge 0.0% 0 0.0% 0 0.0% 0 0.0% 0 0.0% 0 0.0% 0 0.0% 0 0.0% 0 0.0% 0 0.0% 0 0.0% 0PC World, White Hart
Roundabout, Northolt 0.0% 0 0.0% 0 0.0% 0 0.0% 0 0.0% 0 0.0% 0 0.0% 0 0.0% 0 0.0% 0 0.0% 0 0.0% 0
Portsmouth 0.0% 0 0.0% 0 0.0% 0 0.0% 0 0.0% 0 0.0% 0 0.0% 0 0.0% 0 0.0% 0 0.0% 0 0.0% 0Queensbury 0.0% 0 0.0% 0 0.0% 0 0.0% 0 0.0% 0 0.0% 0 0.0% 0 0.0% 0 0.0% 0 0.0% 0 0.0% 0Reading, Berkshire 0.0% 0 0.0% 0 0.0% 0 0.0% 0 0.0% 0 0.0% 0 0.0% 0 0.0% 0 0.0% 0 0.0% 0 0.0% 0Richmond, Surrey 0.0% 0 0.0% 0 0.0% 0 0.0% 0 0.0% 0 0.0% 0 0.0% 0 0.0% 0 0.0% 0 0.0% 0 0.0% 0Rickmansworth 0.2% 2 3.6% 2 0.0% 0 0.0% 0 0.0% 0 0.0% 0 0.0% 0 0.0% 0 0.0% 0 0.0% 0 0.0% 0Rivers Retail Park, Mustard
Mill Road, Staines 0.0% 0 0.0% 0 0.0% 0 0.0% 0 0.0% 0 0.0% 0 0.0% 0 0.0% 0 0.0% 0 0.0% 0 0.0% 0
Robert Dyers Station Road, Harrow
0.0% 0 0.0% 0 0.0% 0 0.0% 0 0.0% 0 0.0% 0 0.0% 0 0.0% 0 0.0% 0 0.0% 0 0.0% 0
Ruislip 1.7% 17 1.8% 1 12.0% 3 9.6% 11 0.0% 0 1.2% 2 0.0% 0 0.0% 0 0.0% 0 0.0% 0 0.0% 0

By Zone London Borough of Harrow Household Survey Page 43 For Nathaniel Lichfield & Partners May 2009
Total Zone 1 Zone 2 Zone 3 Zone 4 Zone 5 Zone 6 Zone 7 Zone 8 Zone 9 Zone 10
180509 NEMS market research
Scotland 0.0% 0 0.0% 0 0.0% 0 0.0% 0 0.0% 0 0.0% 0 0.0% 0 0.0% 0 0.0% 0 0.0% 0 0.0% 0Sevenoaks 0.0% 0 0.0% 0 0.0% 0 0.0% 0 0.0% 0 0.0% 0 0.0% 0 0.0% 0 0.0% 0 0.0% 0 0.0% 0Shepherds Bush 0.0% 0 0.0% 0 0.0% 0 0.0% 0 0.0% 0 0.0% 0 0.0% 0 0.0% 0 0.0% 0 0.0% 0 0.0% 0Shrewsbury, Shropshire 0.0% 0 0.0% 0 0.0% 0 0.0% 0 0.0% 0 0.0% 0 0.0% 0 0.0% 0 0.0% 0 0.0% 0 0.0% 0Slough 0.0% 0 0.0% 0 0.0% 0 0.0% 0 0.0% 0 0.0% 0 0.0% 0 0.0% 0 0.0% 0 0.0% 0 0.0% 0South Oxney 0.1% 1 0.0% 0 0.0% 0 0.0% 0 1.2% 1 0.0% 0 0.0% 0 0.0% 0 0.0% 0 0.0% 0 0.0% 0South Ruislip 0.0% 0 0.0% 0 0.0% 0 0.0% 0 0.0% 0 0.0% 0 0.0% 0 0.0% 0 0.0% 0 0.0% 0 0.0% 0Southall 0.0% 0 0.0% 0 0.0% 0 0.0% 0 0.0% 0 0.0% 0 0.0% 0 0.0% 0 0.0% 0 0.0% 0 0.0% 0Southampton 0.1% 1 0.0% 0 0.0% 0 0.0% 0 0.0% 0 0.6% 1 0.0% 0 0.0% 0 0.0% 0 0.0% 0 0.0% 0St. Albans 0.0% 0 0.0% 0 0.0% 0 0.0% 0 0.0% 0 0.0% 0 0.0% 0 0.0% 0 0.0% 0 0.0% 0 0.0% 0St. John's Wood 0.0% 0 0.0% 0 0.0% 0 0.0% 0 0.0% 0 0.0% 0 0.0% 0 0.0% 0 0.0% 0 0.0% 0 0.0% 0Stafford 0.0% 0 0.0% 0 0.0% 0 0.0% 0 0.0% 0 0.0% 0 0.0% 0 0.0% 0 0.0% 0 0.0% 0 0.0% 0Staples Corner Retail Park,
Geron Way, Cricklewood 0.0% 0 0.0% 0 0.0% 0 0.0% 0 0.0% 0 0.0% 0 0.0% 0 0.0% 0 0.0% 0 0.0% 0 0.0% 0
Sudbury Hill 0.0% 0 0.0% 0 0.0% 0 0.0% 0 0.0% 0 0.0% 0 0.0% 0 0.0% 0 0.0% 0 0.0% 0 0.0% 0Swansea 0.0% 0 0.0% 0 0.0% 0 0.0% 0 0.0% 0 0.0% 0 0.0% 0 0.0% 0 0.0% 0 0.0% 0 0.0% 0Swindon 0.0% 0 0.0% 0 0.0% 0 0.0% 0 0.0% 0 0.0% 0 0.0% 0 0.0% 0 0.0% 0 0.0% 0 0.0% 0Telford, Shropshire 0.0% 0 0.0% 0 0.0% 0 0.0% 0 0.0% 0 0.0% 0 0.0% 0 0.0% 0 0.0% 0 0.0% 0 0.0% 0Tesco Extra, Osterley Park,
Syon Lane, Isleworth 0.0% 0 0.0% 0 0.0% 0 0.0% 0 0.0% 0 0.0% 0 0.0% 0 0.0% 0 0.0% 0 0.0% 0 0.0% 0
Tesco, Frogmoor Wharf, Harefield Road, Rickmansworth
0.0% 0 0.0% 0 0.0% 0 0.0% 0 0.0% 0 0.0% 0 0.0% 0 0.0% 0 0.0% 0 0.0% 0 0.0% 0
Tesco, Glencoe Road, Hayes 0.0% 0 0.0% 0 0.0% 0 0.0% 0 0.0% 0 0.0% 0 0.0% 0 0.0% 0 0.0% 0 0.0% 0 0.0% 0Victoria Retail Park, Crown
Road, Hillingdon, Ruislip 0.0% 0 0.0% 0 0.0% 0 0.0% 0 0.0% 0 0.0% 0 0.0% 0 0.0% 0 0.0% 0 0.0% 0 0.0% 0
Whittington 0.0% 0 0.0% 0 0.0% 0 0.0% 0 0.0% 0 0.0% 0 0.0% 0 0.0% 0 0.0% 0 0.0% 0 0.0% 0Wickes, Alperton 0.0% 0 0.0% 0 0.0% 0 0.0% 0 0.0% 0 0.0% 0 0.0% 0 0.0% 0 0.0% 0 0.0% 0 0.0% 0Wickes, Station Road,
Harrow 0.0% 0 0.0% 0 0.0% 0 0.0% 0 0.0% 0 0.0% 0 0.0% 0 0.0% 0 0.0% 0 0.0% 0 0.0% 0
Wickes, Victoria Road, Ruislip
0.0% 0 0.0% 0 0.0% 0 0.0% 0 0.0% 0 0.0% 0 0.0% 0 0.0% 0 0.0% 0 0.0% 0 0.0% 0
Willesden 0.0% 0 0.0% 0 0.0% 0 0.0% 0 0.0% 0 0.0% 0 0.0% 0 0.0% 0 0.0% 0 0.0% 0 0.0% 0Wimbledon 0.0% 0 0.0% 0 0.0% 0 0.0% 0 0.0% 0 0.0% 0 0.0% 0 0.0% 0 0.0% 0 0.0% 0 0.0% 0Windsor, Berkshire 0.1% 1 0.0% 0 0.0% 0 0.9% 1 0.0% 0 0.0% 0 0.0% 0 0.0% 0 0.0% 0 0.0% 0 0.0% 0Worthing, West Sussex 0.0% 0 0.0% 0 0.0% 0 0.0% 0 0.0% 0 0.0% 0 0.0% 0 0.0% 0 0.0% 0 0.0% 0 0.0% 0Yeading 0.1% 1 0.0% 0 0.0% 0 0.0% 0 0.0% 0 0.6% 1 0.0% 0 0.0% 0 0.0% 0 0.0% 0 0.0% 0Comet, Hendon, (Silk Bridge
Retail Park) 0.0% 0 0.0% 0 0.0% 0 0.0% 0 0.0% 0 0.0% 0 0.0% 0 0.0% 0 0.0% 0 0.0% 0 0.0% 0
Comet, Mill Hill, (Pentavia Retail Park)
0.0% 0 0.0% 0 0.0% 0 0.0% 0 0.0% 0 0.0% 0 0.0% 0 0.0% 0 0.0% 0 0.0% 0 0.0% 0
Comet, South Ruislip 0.0% 0 0.0% 0 0.0% 0 0.0% 0 0.0% 0 0.0% 0 0.0% 0 0.0% 0 0.0% 0 0.0% 0 0.0% 0Comet, Watford, (Century
Park) 0.0% 0 0.0% 0 0.0% 0 0.0% 0 0.0% 0 0.0% 0 0.0% 0 0.0% 0 0.0% 0 0.0% 0 0.0% 0
Comet, Wembley 0.0% 0 0.0% 0 0.0% 0 0.0% 0 0.0% 0 0.0% 0 0.0% 0 0.0% 0 0.0% 0 0.0% 0 0.0% 0Currys Digital, Edgware,
(Station Road) 0.0% 0 0.0% 0 0.0% 0 0.0% 0 0.0% 0 0.0% 0 0.0% 0 0.0% 0 0.0% 0 0.0% 0 0.0% 0

By Zone London Borough of Harrow Household Survey Page 44 For Nathaniel Lichfield & Partners May 2009
Total Zone 1 Zone 2 Zone 3 Zone 4 Zone 5 Zone 6 Zone 7 Zone 8 Zone 9 Zone 10
180509 NEMS market research
Currys, Alperton, (Ealing Road)
0.0% 0 0.0% 0 0.0% 0 0.0% 0 0.0% 0 0.0% 0 0.0% 0 0.0% 0 0.0% 0 0.0% 0 0.0% 0
Currys, Ruislip, (Stonefield Way)
0.0% 0 0.0% 0 0.0% 0 0.0% 0 0.0% 0 0.0% 0 0.0% 0 0.0% 0 0.0% 0 0.0% 0 0.0% 0
Currys, St Anns Centre, Harrow
0.0% 0 0.0% 0 0.0% 0 0.0% 0 0.0% 0 0.0% 0 0.0% 0 0.0% 0 0.0% 0 0.0% 0 0.0% 0
Currys, Wembley Stadium Retail Park
0.0% 0 0.0% 0 0.0% 0 0.0% 0 0.0% 0 0.0% 0 0.0% 0 0.0% 0 0.0% 0 0.0% 0 0.0% 0
Allied Carpets, Pinner Road, Harrow
0.0% 0 0.0% 0 0.0% 0 0.0% 0 0.0% 0 0.0% 0 0.0% 0 0.0% 0 0.0% 0 0.0% 0 0.0% 0
Allied Carpets, South Ruislip, (Victoria Road)
0.0% 0 0.0% 0 0.0% 0 0.0% 0 0.0% 0 0.0% 0 0.0% 0 0.0% 0 0.0% 0 0.0% 0 0.0% 0
Allied Carpets, Wembley, (The Junction Wembley Retail Park)
0.0% 0 0.0% 0 0.0% 0 0.0% 0 0.0% 0 0.0% 0 0.0% 0 0.0% 0 0.0% 0 0.0% 0 0.0% 0
Carpet Right, Colindale, (Edgware Road)
0.0% 0 0.0% 0 0.0% 0 0.0% 0 0.0% 0 0.0% 0 0.0% 0 0.0% 0 0.0% 0 0.0% 0 0.0% 0
Carpet Right, Harrow, (Station Road)
0.0% 0 0.0% 0 0.0% 0 0.0% 0 0.0% 0 0.0% 0 0.0% 0 0.0% 0 0.0% 0 0.0% 0 0.0% 0
Carpet Right, Hayes, Springfield Road
0.0% 0 0.0% 0 0.0% 0 0.0% 0 0.0% 0 0.0% 0 0.0% 0 0.0% 0 0.0% 0 0.0% 0 0.0% 0
Carpet Right, Ruislip, Victoria Road
0.0% 0 0.0% 0 0.0% 0 0.0% 0 0.0% 0 0.0% 0 0.0% 0 0.0% 0 0.0% 0 0.0% 0 0.0% 0
Carpet Right, Stanmore, (The Broadway)
0.0% 0 0.0% 0 0.0% 0 0.0% 0 0.0% 0 0.0% 0 0.0% 0 0.0% 0 0.0% 0 0.0% 0 0.0% 0
Carpet Right, Wembley 0.0% 0 0.0% 0 0.0% 0 0.0% 0 0.0% 0 0.0% 0 0.0% 0 0.0% 0 0.0% 0 0.0% 0 0.0% 0DFS, Brent Cross 0.0% 0 0.0% 0 0.0% 0 0.0% 0 0.0% 0 0.0% 0 0.0% 0 0.0% 0 0.0% 0 0.0% 0 0.0% 0DFS, South Ruislip,
(Victoria Retail Park) 0.0% 0 0.0% 0 0.0% 0 0.0% 0 0.0% 0 0.0% 0 0.0% 0 0.0% 0 0.0% 0 0.0% 0 0.0% 0
DFS, Watford, (Colne Valley Retail Park)
0.0% 0 0.0% 0 0.0% 0 0.0% 0 0.0% 0 0.0% 0 0.0% 0 0.0% 0 0.0% 0 0.0% 0 0.0% 0
Furniture Village, Ruislip Retail Park, (Victoria Rd)
0.0% 0 0.0% 0 0.0% 0 0.0% 0 0.0% 0 0.0% 0 0.0% 0 0.0% 0 0.0% 0 0.0% 0 0.0% 0
Harveys, Edgware Road, Colindale
0.0% 0 0.0% 0 0.0% 0 0.0% 0 0.0% 0 0.0% 0 0.0% 0 0.0% 0 0.0% 0 0.0% 0 0.0% 0
Ikea, Wembley 0.0% 0 0.0% 0 0.0% 0 0.0% 0 0.0% 0 0.0% 0 0.0% 0 0.0% 0 0.0% 0 0.0% 0 0.0% 0B&Q, Acton 0.0% 0 0.0% 0 0.0% 0 0.0% 0 0.0% 0 0.0% 0 0.0% 0 0.0% 0 0.0% 0 0.0% 0 0.0% 0B&Q, Watford 0.0% 0 0.0% 0 0.0% 0 0.0% 0 0.0% 0 0.0% 0 0.0% 0 0.0% 0 0.0% 0 0.0% 0 0.0% 0B&Q, Yeading, Hayes 0.0% 0 0.0% 0 0.0% 0 0.0% 0 0.0% 0 0.0% 0 0.0% 0 0.0% 0 0.0% 0 0.0% 0 0.0% 0Homebase, Hendon 0.0% 0 0.0% 0 0.0% 0 0.0% 0 0.0% 0 0.0% 0 0.0% 0 0.0% 0 0.0% 0 0.0% 0 0.0% 0(Don't buy these goods) 0.0% 0 0.0% 0 0.0% 0 0.0% 0 0.0% 0 0.0% 0 0.0% 0 0.0% 0 0.0% 0 0.0% 0 0.0% 0Local shops 0.0% 0 0.0% 0 0.0% 0 0.0% 0 0.0% 0 0.0% 0 0.0% 0 0.0% 0 0.0% 0 0.0% 0 0.0% 0(Don't know / varies) 8.5% 85 7.3% 4 8.0% 2 6.1% 7 9.4% 8 6.7% 11 9.0% 13 9.2% 12 10.4% 14 10.0% 11 8.6% 3
Base: 1000 55 25 115 85 165 145 130 135 110 35

By Zone London Borough of Harrow Household Survey Page 45 For Nathaniel Lichfield & Partners May 2009
Total Zone 1 Zone 2 Zone 3 Zone 4 Zone 5 Zone 6 Zone 7 Zone 8 Zone 9 Zone 10
180509 NEMS market research
Q05 How do you normally travel to do your non-food shopping? Those who travel to do their non-food shopping at Q04: Car - driver 49.8% 498 67.3% 37 48.0% 12 58.3% 67 67.1% 57 52.1% 86 34.5% 50 41.5% 54 48.9% 66 47.3% 52 48.6% 17Car - passenger 10.1% 101 12.7% 7 4.0% 1 7.8% 9 8.2% 7 9.7% 16 12.4% 18 8.5% 11 8.9% 12 11.8% 13 20.0% 7Bus / Coach 17.6% 176 10.9% 6 8.0% 2 6.1% 7 14.1% 12 17.6% 29 18.6% 27 26.2% 34 25.9% 35 18.2% 20 11.4% 4Train 4.5% 45 5.5% 3 16.0% 4 8.7% 10 4.7% 4 4.2% 7 4.1% 6 3.8% 5 4.4% 6 0.0% 0 0.0% 0Tube / Underground 2.7% 27 0.0% 0 8.0% 2 5.2% 6 0.0% 0 1.8% 3 2.8% 4 2.3% 3 1.5% 2 5.5% 6 2.9% 1Taxi 0.2% 2 0.0% 0 0.0% 0 0.0% 0 0.0% 0 0.0% 0 0.0% 0 0.8% 1 0.7% 1 0.0% 0 0.0% 0Walk 7.8% 78 0.0% 0 8.0% 2 6.1% 7 2.4% 2 7.3% 12 19.3% 28 6.2% 8 5.2% 7 10.0% 11 2.9% 1Bicycle 0.4% 4 0.0% 0 0.0% 0 0.9% 1 0.0% 0 0.0% 0 1.4% 2 0.8% 1 0.0% 0 0.0% 0 0.0% 0Other 0.1% 1 0.0% 0 0.0% 0 0.9% 1 0.0% 0 0.0% 0 0.0% 0 0.0% 0 0.0% 0 0.0% 0 0.0% 0(Don't know / varies) 4.8% 48 3.6% 2 8.0% 2 3.5% 4 2.4% 2 4.8% 8 5.5% 8 6.9% 9 3.7% 5 4.5% 5 8.6% 3No response 2.0% 20 0.0% 0 0.0% 0 2.6% 3 1.2% 1 2.4% 4 1.4% 2 3.1% 4 0.7% 1 2.7% 3 5.7% 2
Base: 1000 55 25 115 85 165 145 130 135 110 35

By Zone London Borough of Harrow Household Survey Page 46 For Nathaniel Lichfield & Partners May 2009
Total Zone 1 Zone 2 Zone 3 Zone 4 Zone 5 Zone 6 Zone 7 Zone 8 Zone 9 Zone 10
180509 NEMS market research
Q06 At which location did your household last buy clothes and shoes? Aberdeen 0.1% 1 0.0% 0 0.0% 0 0.0% 0 0.0% 0 0.6% 1 0.0% 0 0.0% 0 0.0% 0 0.0% 0 0.0% 0Abroad 0.8% 8 0.0% 0 0.0% 0 1.7% 2 0.0% 0 0.6% 1 0.0% 0 1.5% 2 1.5% 2 0.0% 0 2.9% 1Alperton 0.1% 1 0.0% 0 0.0% 0 0.0% 0 0.0% 0 0.0% 0 0.0% 0 0.8% 1 0.0% 0 0.0% 0 0.0% 0Amersham,
Buckinghamshire 0.1% 1 1.8% 1 0.0% 0 0.0% 0 0.0% 0 0.0% 0 0.0% 0 0.0% 0 0.0% 0 0.0% 0 0.0% 0
Ashford, Kent 0.1% 1 0.0% 0 0.0% 0 0.0% 0 0.0% 0 0.6% 1 0.0% 0 0.0% 0 0.0% 0 0.0% 0 0.0% 0Bicester, Oxfordshire 0.2% 2 1.8% 1 0.0% 0 0.9% 1 0.0% 0 0.0% 0 0.0% 0 0.0% 0 0.0% 0 0.0% 0 0.0% 0Bournemouth 0.1% 1 0.0% 0 0.0% 0 0.0% 0 1.2% 1 0.0% 0 0.0% 0 0.0% 0 0.0% 0 0.0% 0 0.0% 0Brent Cross 7.6% 76 1.8% 1 4.0% 1 0.9% 1 3.5% 3 0.6% 1 2.1% 3 13.8% 18 10.4% 14 22.7% 25 25.7% 9Brighton 0.1% 1 0.0% 0 0.0% 0 0.0% 0 0.0% 0 0.0% 0 0.0% 0 0.0% 0 0.0% 0 0.9% 1 0.0% 0Bristol 0.1% 1 1.8% 1 0.0% 0 0.0% 0 0.0% 0 0.0% 0 0.0% 0 0.0% 0 0.0% 0 0.0% 0 0.0% 0Broadway, Worcestershire 0.1% 1 0.0% 0 0.0% 0 0.0% 0 0.0% 0 0.0% 0 0.0% 0 0.8% 1 0.0% 0 0.0% 0 0.0% 0Burnt Oak 0.2% 2 0.0% 0 0.0% 0 0.0% 0 0.0% 0 0.0% 0 0.0% 0 0.0% 0 0.0% 0 1.8% 2 0.0% 0Camberley 0.1% 1 0.0% 0 0.0% 0 0.0% 0 0.0% 0 0.6% 1 0.0% 0 0.0% 0 0.0% 0 0.0% 0 0.0% 0Central London / West End 7.4% 74 7.3% 4 16.0% 4 8.7% 10 5.9% 5 8.5% 14 4.8% 7 9.2% 12 5.2% 7 5.5% 6 14.3% 5Clacton-on-Sea, Essex 0.2% 2 0.0% 0 0.0% 0 0.0% 0 1.2% 1 0.0% 0 0.0% 0 0.0% 0 0.0% 0 0.9% 1 0.0% 0Colchester 0.1% 1 0.0% 0 0.0% 0 0.0% 0 1.2% 1 0.0% 0 0.0% 0 0.0% 0 0.0% 0 0.0% 0 0.0% 0Colindale 0.3% 3 0.0% 0 0.0% 0 0.0% 0 0.0% 0 0.0% 0 0.0% 0 0.0% 0 0.7% 1 1.8% 2 0.0% 0Cricklewood 0.1% 1 0.0% 0 0.0% 0 0.0% 0 0.0% 0 0.0% 0 0.0% 0 0.0% 0 0.0% 0 0.9% 1 0.0% 0Derby 0.1% 1 0.0% 0 0.0% 0 0.9% 1 0.0% 0 0.0% 0 0.0% 0 0.0% 0 0.0% 0 0.0% 0 0.0% 0Ealing 0.3% 3 0.0% 0 0.0% 0 0.0% 0 0.0% 0 1.2% 2 0.0% 0 0.8% 1 0.0% 0 0.0% 0 0.0% 0Eastbourne 0.1% 1 0.0% 0 0.0% 0 0.9% 1 0.0% 0 0.0% 0 0.0% 0 0.0% 0 0.0% 0 0.0% 0 0.0% 0Eastcote 0.2% 2 0.0% 0 0.0% 0 0.9% 1 1.2% 1 0.0% 0 0.0% 0 0.0% 0 0.0% 0 0.0% 0 0.0% 0Edgware 1.9% 19 0.0% 0 0.0% 0 0.0% 0 0.0% 0 0.0% 0 0.0% 0 0.0% 0 3.0% 4 12.7% 14 2.9% 1Gerrards Cross 0.1% 1 0.0% 0 0.0% 0 0.0% 0 0.0% 0 0.0% 0 0.7% 1 0.0% 0 0.0% 0 0.0% 0 0.0% 0Golders Green 0.2% 2 0.0% 0 0.0% 0 0.0% 0 0.0% 0 0.0% 0 0.0% 0 0.0% 0 0.7% 1 0.0% 0 2.9% 1Greenford 0.6% 6 0.0% 0 0.0% 0 0.9% 1 0.0% 0 1.2% 2 0.0% 0 2.3% 3 0.0% 0 0.0% 0 0.0% 0Harlesden 0.1% 1 0.0% 0 0.0% 0 0.0% 0 0.0% 0 0.0% 0 0.7% 1 0.0% 0 0.0% 0 0.0% 0 0.0% 0Harrow 36.5% 365 10.9% 6 0.0% 0 23.5% 27 28.2% 24 50.3% 83 62.1% 90 43.8% 57 43.0% 58 13.6% 15 14.3% 5Hatfield, Hertfordshire 0.1% 1 0.0% 0 0.0% 0 0.9% 1 0.0% 0 0.0% 0 0.0% 0 0.0% 0 0.0% 0 0.0% 0 0.0% 0Hayes 0.1% 1 0.0% 0 0.0% 0 0.9% 1 0.0% 0 0.0% 0 0.0% 0 0.0% 0 0.0% 0 0.0% 0 0.0% 0High Wycombe,
Buckinghamshire 0.1% 1 0.0% 0 0.0% 0 0.0% 0 0.0% 0 0.6% 1 0.0% 0 0.0% 0 0.0% 0 0.0% 0 0.0% 0
Hitchin, Hertfordshire 0.2% 2 1.8% 1 0.0% 0 0.0% 0 0.0% 0 0.0% 0 0.0% 0 0.0% 0 0.7% 1 0.0% 0 0.0% 0Hounslow 0.1% 1 0.0% 0 0.0% 0 0.0% 0 0.0% 0 0.6% 1 0.0% 0 0.0% 0 0.0% 0 0.0% 0 0.0% 0Internet / Delivered 6.3% 63 3.6% 2 4.0% 1 3.5% 4 7.1% 6 6.7% 11 6.2% 9 9.2% 12 3.7% 5 7.3% 8 14.3% 5Kensington 0.1% 1 0.0% 0 0.0% 0 0.9% 1 0.0% 0 0.0% 0 0.0% 0 0.0% 0 0.0% 0 0.0% 0 0.0% 0Kenton 0.1% 1 0.0% 0 0.0% 0 0.0% 0 0.0% 0 0.0% 0 0.0% 0 0.0% 0 0.7% 1 0.0% 0 0.0% 0Kingsbury 0.3% 3 0.0% 0 0.0% 0 0.0% 0 0.0% 0 0.0% 0 0.0% 0 0.0% 0 2.2% 3 0.0% 0 0.0% 0London Colney, St. Albans 0.3% 3 0.0% 0 0.0% 0 0.0% 0 1.2% 1 0.0% 0 0.0% 0 0.0% 0 0.0% 0 0.9% 1 2.9% 1Middlesex 0.1% 1 0.0% 0 0.0% 0 0.0% 0 0.0% 0 0.6% 1 0.0% 0 0.0% 0 0.0% 0 0.0% 0 0.0% 0Milton Keynes 0.2% 2 0.0% 0 0.0% 0 0.0% 0 0.0% 0 0.6% 1 0.0% 0 0.0% 0 0.0% 0 0.0% 0 2.9% 1Norfolk 0.1% 1 0.0% 0 0.0% 0 0.0% 0 0.0% 0 0.0% 0 0.0% 0 0.0% 0 0.0% 0 0.9% 1 0.0% 0North Finchley 0.1% 1 0.0% 0 0.0% 0 0.0% 0 0.0% 0 0.0% 0 0.0% 0 0.0% 0 0.0% 0 0.9% 1 0.0% 0North Harrow 0.1% 1 0.0% 0 0.0% 0 0.0% 0 1.2% 1 0.0% 0 0.0% 0 0.0% 0 0.0% 0 0.0% 0 0.0% 0

By Zone London Borough of Harrow Household Survey Page 47 For Nathaniel Lichfield & Partners May 2009
Total Zone 1 Zone 2 Zone 3 Zone 4 Zone 5 Zone 6 Zone 7 Zone 8 Zone 9 Zone 10
180509 NEMS market research
Oxbridge 0.2% 2 0.0% 0 0.0% 0 1.7% 2 0.0% 0 0.0% 0 0.0% 0 0.0% 0 0.0% 0 0.0% 0 0.0% 0Pinner 0.6% 6 0.0% 0 0.0% 0 1.7% 2 1.2% 1 1.2% 2 0.0% 0 0.0% 0 0.7% 1 0.0% 0 0.0% 0Portsmouth 0.1% 1 0.0% 0 0.0% 0 0.9% 1 0.0% 0 0.0% 0 0.0% 0 0.0% 0 0.0% 0 0.0% 0 0.0% 0Rayners Lane 0.4% 4 0.0% 0 0.0% 0 0.0% 0 1.2% 1 1.8% 3 0.0% 0 0.0% 0 0.0% 0 0.0% 0 0.0% 0Reading, Berkshire 0.1% 1 0.0% 0 0.0% 0 0.0% 0 0.0% 0 0.6% 1 0.0% 0 0.0% 0 0.0% 0 0.0% 0 0.0% 0Richmond, Surrey 0.1% 1 0.0% 0 0.0% 0 0.0% 0 0.0% 0 0.6% 1 0.0% 0 0.0% 0 0.0% 0 0.0% 0 0.0% 0Rickmansworth 0.1% 1 1.8% 1 0.0% 0 0.0% 0 0.0% 0 0.0% 0 0.0% 0 0.0% 0 0.0% 0 0.0% 0 0.0% 0Ruislip 1.0% 10 0.0% 0 8.0% 2 5.2% 6 0.0% 0 0.0% 0 1.4% 2 0.0% 0 0.0% 0 0.0% 0 0.0% 0Scotland 0.1% 1 0.0% 0 0.0% 0 0.0% 0 0.0% 0 0.0% 0 0.0% 0 0.0% 0 0.7% 1 0.0% 0 0.0% 0Shrewsbury, Shropshire 0.1% 1 0.0% 0 0.0% 0 0.0% 0 0.0% 0 0.0% 0 0.7% 1 0.0% 0 0.0% 0 0.0% 0 0.0% 0South Harrow 0.4% 4 0.0% 0 0.0% 0 0.0% 0 0.0% 0 2.4% 4 0.0% 0 0.0% 0 0.0% 0 0.0% 0 0.0% 0Southall 0.2% 2 0.0% 0 0.0% 0 0.0% 0 0.0% 0 0.0% 0 0.7% 1 0.8% 1 0.0% 0 0.0% 0 0.0% 0Southampton 0.1% 1 0.0% 0 0.0% 0 0.0% 0 0.0% 0 0.6% 1 0.0% 0 0.0% 0 0.0% 0 0.0% 0 0.0% 0St. Albans 0.3% 3 1.8% 1 0.0% 0 0.0% 0 1.2% 1 0.0% 0 0.0% 0 0.0% 0 0.0% 0 0.9% 1 0.0% 0Stafford 0.1% 1 0.0% 0 0.0% 0 0.0% 0 0.0% 0 0.0% 0 0.7% 1 0.0% 0 0.0% 0 0.0% 0 0.0% 0Stanmore 0.4% 4 0.0% 0 0.0% 0 0.0% 0 0.0% 0 0.0% 0 0.7% 1 0.0% 0 2.2% 3 0.0% 0 0.0% 0Swansea 0.1% 1 0.0% 0 0.0% 0 0.0% 0 0.0% 0 0.6% 1 0.0% 0 0.0% 0 0.0% 0 0.0% 0 0.0% 0Telford, Shropshire 0.1% 1 0.0% 0 4.0% 1 0.0% 0 0.0% 0 0.0% 0 0.0% 0 0.0% 0 0.0% 0 0.0% 0 0.0% 0Uxbridge 5.6% 56 3.6% 2 40.0% 10 22.6% 26 1.2% 1 4.8% 8 1.4% 2 2.3% 3 2.2% 3 0.9% 1 0.0% 0Watford 16.1% 161 47.3% 26 24.0% 6 19.1% 22 40.0% 34 9.1% 15 12.4% 18 3.8% 5 12.6% 17 11.8% 13 14.3% 5Wealdstone 0.1% 1 0.0% 0 0.0% 0 0.9% 1 0.0% 0 0.0% 0 0.0% 0 0.0% 0 0.0% 0 0.0% 0 0.0% 0Wembley 0.8% 8 0.0% 0 0.0% 0 0.0% 0 0.0% 0 0.0% 0 0.7% 1 3.1% 4 2.2% 3 0.0% 0 0.0% 0Westfield / White City 1.0% 10 3.6% 2 0.0% 0 1.7% 2 1.2% 1 1.2% 2 0.0% 0 0.8% 1 1.5% 2 0.0% 0 0.0% 0Wimbledon 0.1% 1 0.0% 0 0.0% 0 0.0% 0 0.0% 0 0.6% 1 0.0% 0 0.0% 0 0.0% 0 0.0% 0 0.0% 0Worthing, West Sussex 0.1% 1 0.0% 0 0.0% 0 0.0% 0 0.0% 0 0.0% 0 0.0% 0 0.0% 0 0.0% 0 0.9% 1 0.0% 0(Don't buy these goods) 1.6% 16 3.6% 2 0.0% 0 0.0% 0 0.0% 0 1.2% 2 1.4% 2 2.3% 3 3.0% 4 2.7% 3 0.0% 0(Don't know / can't
remember) 3.9% 39 7.3% 4 0.0% 0 0.9% 1 2.4% 2 1.8% 3 3.4% 5 4.6% 6 3.0% 4 11.8% 13 2.9% 1
Base: 1000 55 25 115 85 165 145 130 135 110 35
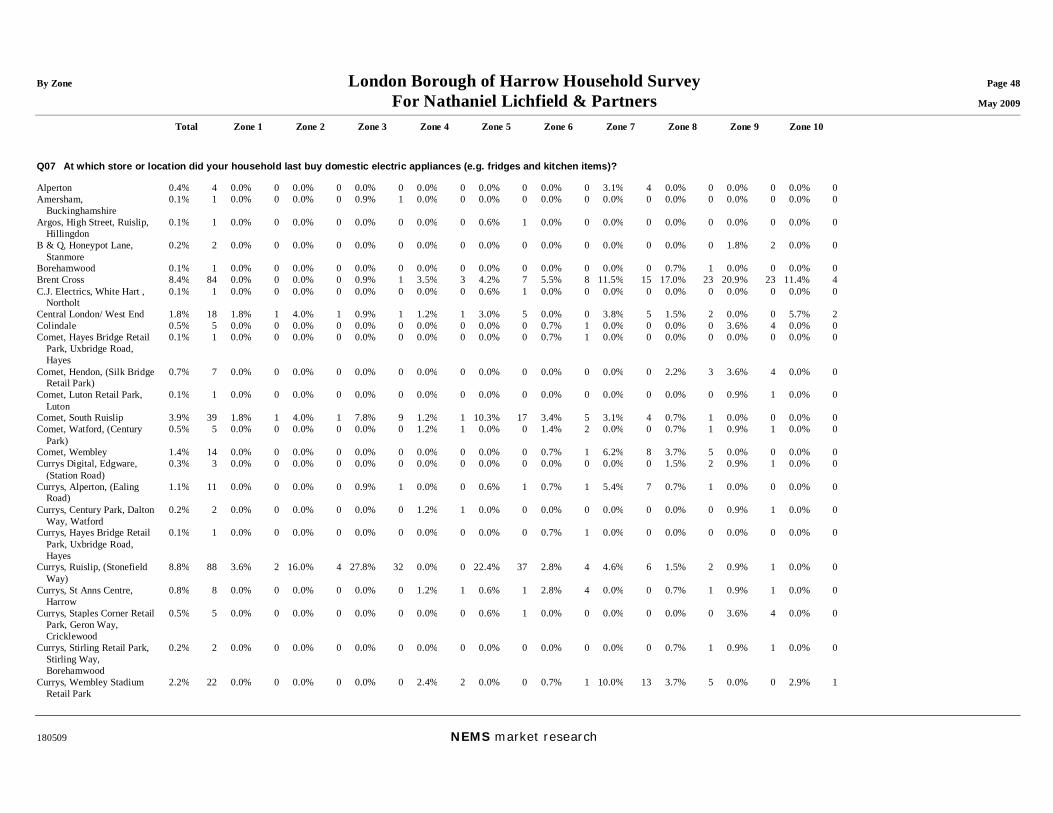
By Zone London Borough of Harrow Household Survey Page 48 For Nathaniel Lichfield & Partners May 2009
Total Zone 1 Zone 2 Zone 3 Zone 4 Zone 5 Zone 6 Zone 7 Zone 8 Zone 9 Zone 10
180509 NEMS market research
Q07 At which store or location did your household last buy domestic electric appliances (e.g. fridges and kitchen items)? Alperton 0.4% 4 0.0% 0 0.0% 0 0.0% 0 0.0% 0 0.0% 0 0.0% 0 3.1% 4 0.0% 0 0.0% 0 0.0% 0Amersham,
Buckinghamshire 0.1% 1 0.0% 0 0.0% 0 0.9% 1 0.0% 0 0.0% 0 0.0% 0 0.0% 0 0.0% 0 0.0% 0 0.0% 0
Argos, High Street, Ruislip, Hillingdon
0.1% 1 0.0% 0 0.0% 0 0.0% 0 0.0% 0 0.6% 1 0.0% 0 0.0% 0 0.0% 0 0.0% 0 0.0% 0
B & Q, Honeypot Lane, Stanmore
0.2% 2 0.0% 0 0.0% 0 0.0% 0 0.0% 0 0.0% 0 0.0% 0 0.0% 0 0.0% 0 1.8% 2 0.0% 0
Borehamwood 0.1% 1 0.0% 0 0.0% 0 0.0% 0 0.0% 0 0.0% 0 0.0% 0 0.0% 0 0.7% 1 0.0% 0 0.0% 0Brent Cross 8.4% 84 0.0% 0 0.0% 0 0.9% 1 3.5% 3 4.2% 7 5.5% 8 11.5% 15 17.0% 23 20.9% 23 11.4% 4C.J. Electrics, White Hart ,
Northolt 0.1% 1 0.0% 0 0.0% 0 0.0% 0 0.0% 0 0.6% 1 0.0% 0 0.0% 0 0.0% 0 0.0% 0 0.0% 0
Central London/ West End 1.8% 18 1.8% 1 4.0% 1 0.9% 1 1.2% 1 3.0% 5 0.0% 0 3.8% 5 1.5% 2 0.0% 0 5.7% 2Colindale 0.5% 5 0.0% 0 0.0% 0 0.0% 0 0.0% 0 0.0% 0 0.7% 1 0.0% 0 0.0% 0 3.6% 4 0.0% 0Comet, Hayes Bridge Retail
Park, Uxbridge Road, Hayes
0.1% 1 0.0% 0 0.0% 0 0.0% 0 0.0% 0 0.0% 0 0.7% 1 0.0% 0 0.0% 0 0.0% 0 0.0% 0
Comet, Hendon, (Silk Bridge Retail Park)
0.7% 7 0.0% 0 0.0% 0 0.0% 0 0.0% 0 0.0% 0 0.0% 0 0.0% 0 2.2% 3 3.6% 4 0.0% 0
Comet, Luton Retail Park, Luton
0.1% 1 0.0% 0 0.0% 0 0.0% 0 0.0% 0 0.0% 0 0.0% 0 0.0% 0 0.0% 0 0.9% 1 0.0% 0
Comet, South Ruislip 3.9% 39 1.8% 1 4.0% 1 7.8% 9 1.2% 1 10.3% 17 3.4% 5 3.1% 4 0.7% 1 0.0% 0 0.0% 0Comet, Watford, (Century
Park) 0.5% 5 0.0% 0 0.0% 0 0.0% 0 1.2% 1 0.0% 0 1.4% 2 0.0% 0 0.7% 1 0.9% 1 0.0% 0
Comet, Wembley 1.4% 14 0.0% 0 0.0% 0 0.0% 0 0.0% 0 0.0% 0 0.7% 1 6.2% 8 3.7% 5 0.0% 0 0.0% 0Currys Digital, Edgware,
(Station Road) 0.3% 3 0.0% 0 0.0% 0 0.0% 0 0.0% 0 0.0% 0 0.0% 0 0.0% 0 1.5% 2 0.9% 1 0.0% 0
Currys, Alperton, (Ealing Road)
1.1% 11 0.0% 0 0.0% 0 0.9% 1 0.0% 0 0.6% 1 0.7% 1 5.4% 7 0.7% 1 0.0% 0 0.0% 0
Currys, Century Park, Dalton Way, Watford
0.2% 2 0.0% 0 0.0% 0 0.0% 0 1.2% 1 0.0% 0 0.0% 0 0.0% 0 0.0% 0 0.9% 1 0.0% 0
Currys, Hayes Bridge Retail Park, Uxbridge Road, Hayes
0.1% 1 0.0% 0 0.0% 0 0.0% 0 0.0% 0 0.0% 0 0.7% 1 0.0% 0 0.0% 0 0.0% 0 0.0% 0
Currys, Ruislip, (Stonefield Way)
8.8% 88 3.6% 2 16.0% 4 27.8% 32 0.0% 0 22.4% 37 2.8% 4 4.6% 6 1.5% 2 0.9% 1 0.0% 0
Currys, St Anns Centre, Harrow
0.8% 8 0.0% 0 0.0% 0 0.0% 0 1.2% 1 0.6% 1 2.8% 4 0.0% 0 0.7% 1 0.9% 1 0.0% 0
Currys, Staples Corner Retail Park, Geron Way, Cricklewood
0.5% 5 0.0% 0 0.0% 0 0.0% 0 0.0% 0 0.6% 1 0.0% 0 0.0% 0 0.0% 0 3.6% 4 0.0% 0
Currys, Stirling Retail Park, Stirling Way, Borehamwood
0.2% 2 0.0% 0 0.0% 0 0.0% 0 0.0% 0 0.0% 0 0.0% 0 0.0% 0 0.7% 1 0.9% 1 0.0% 0
Currys, Wembley Stadium Retail Park
2.2% 22 0.0% 0 0.0% 0 0.0% 0 2.4% 2 0.0% 0 0.7% 1 10.0% 13 3.7% 5 0.0% 0 2.9% 1

By Zone London Borough of Harrow Household Survey Page 49 For Nathaniel Lichfield & Partners May 2009
Total Zone 1 Zone 2 Zone 3 Zone 4 Zone 5 Zone 6 Zone 7 Zone 8 Zone 9 Zone 10
180509 NEMS market research
Eastcote 0.5% 5 0.0% 0 0.0% 0 3.5% 4 0.0% 0 0.6% 1 0.0% 0 0.0% 0 0.0% 0 0.0% 0 0.0% 0Edgware 2.5% 25 0.0% 0 0.0% 0 0.0% 0 0.0% 0 0.0% 0 0.0% 0 0.0% 0 3.0% 4 13.6% 15 17.1% 6Euronics, Field End Road,
Ruislip 0.3% 3 1.8% 1 0.0% 0 0.9% 1 0.0% 0 0.6% 1 0.0% 0 0.0% 0 0.0% 0 0.0% 0 0.0% 0
Feltham 0.1% 1 0.0% 0 0.0% 0 0.0% 0 0.0% 0 0.6% 1 0.0% 0 0.0% 0 0.0% 0 0.0% 0 0.0% 0Greenford 0.1% 1 0.0% 0 0.0% 0 0.0% 0 0.0% 0 0.0% 0 0.0% 0 0.8% 1 0.0% 0 0.0% 0 0.0% 0Harrow 9.5% 95 5.5% 3 4.0% 1 1.7% 2 10.6% 9 12.1% 20 22.8% 33 6.9% 9 10.4% 14 0.9% 1 8.6% 3Harrow Weald 0.2% 2 0.0% 0 0.0% 0 0.0% 0 0.0% 0 0.0% 0 0.7% 1 0.0% 0 0.0% 0 0.0% 0 2.9% 1Hatch End 0.1% 1 0.0% 0 0.0% 0 0.0% 0 1.2% 1 0.0% 0 0.0% 0 0.0% 0 0.0% 0 0.0% 0 0.0% 0Hayes 0.1% 1 0.0% 0 0.0% 0 0.9% 1 0.0% 0 0.0% 0 0.0% 0 0.0% 0 0.0% 0 0.0% 0 0.0% 0High Wycombe,
Buckinghamshire 0.5% 5 0.0% 0 12.0% 3 1.7% 2 0.0% 0 0.0% 0 0.0% 0 0.0% 0 0.0% 0 0.0% 0 0.0% 0
Homebase, High Road, Harrow
0.2% 2 0.0% 0 0.0% 0 0.0% 0 0.0% 0 0.6% 1 0.0% 0 0.0% 0 0.7% 1 0.0% 0 0.0% 0
Homebase, Victoria Retail Park, Crown Road, Ruislip
0.4% 4 1.8% 1 0.0% 0 2.6% 3 0.0% 0 0.0% 0 0.0% 0 0.0% 0 0.0% 0 0.0% 0 0.0% 0
Internet / Delivered 7.5% 75 3.6% 2 16.0% 4 6.1% 7 9.4% 8 8.5% 14 7.6% 11 5.4% 7 11.1% 15 4.5% 5 5.7% 2John Lewis, Holmers Farm
Way, Cressex Centre, High Wycombe
0.1% 1 1.8% 1 0.0% 0 0.0% 0 0.0% 0 0.0% 0 0.0% 0 0.0% 0 0.0% 0 0.0% 0 0.0% 0
John Lewis, The Harlequin Centre, Station Road, Watford
0.1% 1 0.0% 0 0.0% 0 0.0% 0 0.0% 0 0.6% 1 0.0% 0 0.0% 0 0.0% 0 0.0% 0 0.0% 0
Kenton 0.1% 1 0.0% 0 0.0% 0 0.0% 0 0.0% 0 0.0% 0 0.0% 0 0.8% 1 0.0% 0 0.0% 0 0.0% 0Kingsbury 0.6% 6 0.0% 0 0.0% 0 0.0% 0 0.0% 0 0.0% 0 0.0% 0 0.0% 0 1.5% 2 3.6% 4 0.0% 0Morrisons, Uxbridge Road,
Hatch End, Pinner 0.1% 1 0.0% 0 0.0% 0 0.0% 0 1.2% 1 0.0% 0 0.0% 0 0.0% 0 0.0% 0 0.0% 0 0.0% 0
Northolt 0.1% 1 0.0% 0 0.0% 0 0.0% 0 0.0% 0 0.6% 1 0.0% 0 0.0% 0 0.0% 0 0.0% 0 0.0% 0Northwood 0.2% 2 1.8% 1 0.0% 0 0.0% 0 0.0% 0 0.0% 0 0.0% 0 0.8% 1 0.0% 0 0.0% 0 0.0% 0Pinner 0.1% 1 0.0% 0 0.0% 0 0.0% 0 0.0% 0 0.0% 0 0.7% 1 0.0% 0 0.0% 0 0.0% 0 0.0% 0Rayners Lane 0.7% 7 0.0% 0 0.0% 0 0.0% 0 2.4% 2 3.0% 5 0.0% 0 0.0% 0 0.0% 0 0.0% 0 0.0% 0Ruislip 1.6% 16 5.5% 3 4.0% 1 5.2% 6 2.4% 2 0.6% 1 0.7% 1 0.8% 1 0.7% 1 0.0% 0 0.0% 0South Harrow 0.6% 6 0.0% 0 0.0% 0 0.0% 0 0.0% 0 1.8% 3 0.7% 1 0.0% 0 0.7% 1 0.0% 0 2.9% 1South Ruislip 0.9% 9 1.8% 1 8.0% 2 3.5% 4 0.0% 0 1.2% 2 0.0% 0 0.0% 0 0.0% 0 0.0% 0 0.0% 0Stanmore 0.6% 6 0.0% 0 0.0% 0 0.0% 0 0.0% 0 0.0% 0 0.7% 1 0.0% 0 1.5% 2 0.0% 0 8.6% 3Staples Corner Retail Park,
Geron Way, Cricklewood 0.1% 1 0.0% 0 0.0% 0 0.0% 0 0.0% 0 0.0% 0 0.0% 0 0.0% 0 0.0% 0 0.9% 1 0.0% 0
Sudbury Hill 0.1% 1 0.0% 0 0.0% 0 0.0% 0 0.0% 0 0.0% 0 0.7% 1 0.0% 0 0.0% 0 0.0% 0 0.0% 0Swindon 0.1% 1 0.0% 0 0.0% 0 0.0% 0 0.0% 0 0.0% 0 0.0% 0 0.8% 1 0.0% 0 0.0% 0 0.0% 0Tesco Extra, Osterley Park,
Syon Lane, Isleworth 0.1% 1 0.0% 0 0.0% 0 0.0% 0 0.0% 0 0.6% 1 0.0% 0 0.0% 0 0.0% 0 0.0% 0 0.0% 0
Uxbridge 0.3% 3 0.0% 0 4.0% 1 1.7% 2 0.0% 0 0.0% 0 0.0% 0 0.0% 0 0.0% 0 0.0% 0 0.0% 0Victoria Retail Park, Crown
Road, Hillingdon, Ruislip 0.3% 3 0.0% 0 0.0% 0 0.9% 1 0.0% 0 0.0% 0 1.4% 2 0.0% 0 0.0% 0 0.0% 0 0.0% 0
Watford 13.9% 139 43.6% 24 12.0% 3 14.8% 17 40.0% 34 7.3% 12 18.6% 27 3.8% 5 8.1% 11 1.8% 2 11.4% 4Wealdstone 1.2% 12 0.0% 0 0.0% 0 0.0% 0 3.5% 3 0.0% 0 2.8% 4 0.0% 0 3.0% 4 0.9% 1 0.0% 0Wembley 1.1% 11 0.0% 0 4.0% 1 0.0% 0 0.0% 0 0.0% 0 0.0% 0 6.2% 8 0.7% 1 0.9% 1 0.0% 0

By Zone London Borough of Harrow Household Survey Page 50 For Nathaniel Lichfield & Partners May 2009
Total Zone 1 Zone 2 Zone 3 Zone 4 Zone 5 Zone 6 Zone 7 Zone 8 Zone 9 Zone 10
180509 NEMS market research
Willesden 0.1% 1 0.0% 0 0.0% 0 0.0% 0 0.0% 0 0.0% 0 0.7% 1 0.0% 0 0.0% 0 0.0% 0 0.0% 0Wimbledon 0.1% 1 0.0% 0 0.0% 0 0.0% 0 0.0% 0 0.0% 0 0.0% 0 0.8% 1 0.0% 0 0.0% 0 0.0% 0Worthing, West Sussex 0.1% 1 0.0% 0 0.0% 0 0.0% 0 0.0% 0 0.0% 0 0.7% 1 0.0% 0 0.0% 0 0.0% 0 0.0% 0Yeading 0.2% 2 0.0% 0 0.0% 0 0.9% 1 0.0% 0 0.0% 0 0.0% 0 0.8% 1 0.0% 0 0.0% 0 0.0% 0(Don't buy these goods) 11.5% 115 10.9% 6 8.0% 2 7.0% 8 12.9% 11 10.9% 18 9.7% 14 16.2% 21 12.6% 17 11.8% 13 14.3% 5(Don't know / can't
remember) 10.4% 104 14.5% 8 4.0% 1 9.6% 11 4.7% 4 7.3% 12 11.7% 17 8.5% 11 10.4% 14 20.9% 23 8.6% 3
Base: 1000 55 25 115 85 165 145 130 135 110 35

By Zone London Borough of Harrow Household Survey Page 51 For Nathaniel Lichfield & Partners May 2009
Total Zone 1 Zone 2 Zone 3 Zone 4 Zone 5 Zone 6 Zone 7 Zone 8 Zone 9 Zone 10
180509 NEMS market research
Q08 At which store or location did your household last buy other kinds of electric goods such as TV / Hi-Fi and computers? Alperton 0.2% 2 0.0% 0 0.0% 0 0.0% 0 0.0% 0 0.0% 0 0.0% 0 1.5% 2 0.0% 0 0.0% 0 0.0% 0Borehamwood 0.2% 2 0.0% 0 0.0% 0 0.0% 0 0.0% 0 0.0% 0 0.0% 0 0.0% 0 0.7% 1 0.9% 1 0.0% 0Brent Cross 8.7% 87 1.8% 1 0.0% 0 0.0% 0 1.2% 1 1.8% 3 4.8% 7 16.2% 21 17.8% 24 21.8% 24 17.1% 6Burnt Oak 0.2% 2 0.0% 0 0.0% 0 0.0% 0 0.0% 0 0.6% 1 0.0% 0 0.0% 0 0.0% 0 0.9% 1 0.0% 0Bushey, Hertfordshire 0.1% 1 0.0% 0 0.0% 0 0.0% 0 0.0% 0 0.0% 0 0.0% 0 0.0% 0 0.0% 0 0.0% 0 2.9% 1Cambridge 0.1% 1 0.0% 0 0.0% 0 0.0% 0 0.0% 0 0.6% 1 0.0% 0 0.0% 0 0.0% 0 0.0% 0 0.0% 0Central London/ West End 2.4% 24 0.0% 0 4.0% 1 1.7% 2 1.2% 1 5.5% 9 3.4% 5 2.3% 3 1.5% 2 0.0% 0 2.9% 1Chiswick 0.1% 1 0.0% 0 0.0% 0 0.0% 0 0.0% 0 0.6% 1 0.0% 0 0.0% 0 0.0% 0 0.0% 0 0.0% 0Colchester 0.2% 2 0.0% 0 0.0% 0 0.9% 1 1.2% 1 0.0% 0 0.0% 0 0.0% 0 0.0% 0 0.0% 0 0.0% 0Colindale 0.4% 4 0.0% 0 0.0% 0 0.0% 0 0.0% 0 0.0% 0 0.0% 0 0.0% 0 0.0% 0 3.6% 4 0.0% 0Comet, Hayes Bridge Retail
Park, Uxbridge Road, Hayes
0.1% 1 0.0% 0 0.0% 0 0.9% 1 0.0% 0 0.0% 0 0.0% 0 0.0% 0 0.0% 0 0.0% 0 0.0% 0
Comet, Hendon, (Silk Bridge Retail Park)
0.7% 7 0.0% 0 0.0% 0 0.0% 0 0.0% 0 0.0% 0 0.7% 1 0.0% 0 1.5% 2 3.6% 4 0.0% 0
Comet, Mill Hill, (Pentavia Retail Park)
0.2% 2 0.0% 0 0.0% 0 0.0% 0 0.0% 0 0.0% 0 0.0% 0 0.0% 0 0.0% 0 1.8% 2 0.0% 0
Comet, South Ruislip 2.8% 28 0.0% 0 12.0% 3 4.3% 5 1.2% 1 7.3% 12 2.1% 3 2.3% 3 0.7% 1 0.0% 0 0.0% 0Comet, Watford, (Century
Park) 0.4% 4 0.0% 0 0.0% 0 1.7% 2 0.0% 0 0.0% 0 1.4% 2 0.0% 0 0.0% 0 0.0% 0 0.0% 0
Comet, Wembley 0.7% 7 0.0% 0 0.0% 0 0.0% 0 0.0% 0 0.0% 0 0.0% 0 3.1% 4 0.7% 1 1.8% 2 0.0% 0Currys Digital, Edgware,
(Station Road) 0.3% 3 0.0% 0 0.0% 0 0.0% 0 0.0% 0 0.0% 0 0.0% 0 0.0% 0 1.5% 2 0.9% 1 0.0% 0
Currys, Alperton, (Ealing Road)
0.7% 7 0.0% 0 0.0% 0 0.0% 0 0.0% 0 0.6% 1 0.0% 0 2.3% 3 2.2% 3 0.0% 0 0.0% 0
Currys, Century Park, Dalton Way, Watford
0.1% 1 1.8% 1 0.0% 0 0.0% 0 0.0% 0 0.0% 0 0.0% 0 0.0% 0 0.0% 0 0.0% 0 0.0% 0
Currys, Hayes Bridge Retail Park, Uxbridge Road, Hayes
0.1% 1 0.0% 0 0.0% 0 0.0% 0 0.0% 0 0.0% 0 0.0% 0 0.8% 1 0.0% 0 0.0% 0 0.0% 0
Currys, Ruislip, (Stonefield Way)
7.7% 77 1.8% 1 16.0% 4 23.5% 27 4.7% 4 18.2% 30 3.4% 5 3.1% 4 1.5% 2 0.0% 0 0.0% 0
Currys, St Anns Centre, Harrow
1.8% 18 0.0% 0 0.0% 0 0.0% 0 2.4% 2 1.2% 2 5.5% 8 1.5% 2 2.2% 3 0.9% 1 0.0% 0
Currys, Staples Corner Retail Park, Geron Way, Cricklewood
0.2% 2 0.0% 0 0.0% 0 0.0% 0 0.0% 0 0.0% 0 0.0% 0 0.0% 0 0.0% 0 1.8% 2 0.0% 0
Currys, Wembley Stadium Retail Park
2.0% 20 1.8% 1 0.0% 0 0.0% 0 2.4% 2 0.0% 0 0.7% 1 6.2% 8 5.2% 7 0.9% 1 0.0% 0
Edgware 0.7% 7 0.0% 0 0.0% 0 0.0% 0 0.0% 0 0.0% 0 0.0% 0 0.8% 1 0.7% 1 4.5% 5 0.0% 0Finchley 0.1% 1 0.0% 0 0.0% 0 0.0% 0 0.0% 0 0.6% 1 0.0% 0 0.0% 0 0.0% 0 0.0% 0 0.0% 0Greenford 0.2% 2 0.0% 0 0.0% 0 0.0% 0 0.0% 0 0.6% 1 0.0% 0 0.8% 1 0.0% 0 0.0% 0 0.0% 0Harrow 7.8% 78 1.8% 1 4.0% 1 3.5% 4 4.7% 4 7.3% 12 17.2% 25 12.3% 16 8.1% 11 2.7% 3 2.9% 1Harrow Electronics, Station
Road, Harrow 0.1% 1 0.0% 0 0.0% 0 0.0% 0 0.0% 0 0.0% 0 0.7% 1 0.0% 0 0.0% 0 0.0% 0 0.0% 0

By Zone London Borough of Harrow Household Survey Page 52 For Nathaniel Lichfield & Partners May 2009
Total Zone 1 Zone 2 Zone 3 Zone 4 Zone 5 Zone 6 Zone 7 Zone 8 Zone 9 Zone 10
180509 NEMS market research
Hatch End 0.1% 1 0.0% 0 0.0% 0 0.0% 0 1.2% 1 0.0% 0 0.0% 0 0.0% 0 0.0% 0 0.0% 0 0.0% 0Hayes 0.1% 1 0.0% 0 0.0% 0 0.9% 1 0.0% 0 0.0% 0 0.0% 0 0.0% 0 0.0% 0 0.0% 0 0.0% 0Hayes Bridge Retail Park,
Uxbridge Rd, Hillingdon 0.1% 1 0.0% 0 4.0% 1 0.0% 0 0.0% 0 0.0% 0 0.0% 0 0.0% 0 0.0% 0 0.0% 0 0.0% 0
Hemel Hempstead, Hertfordshire
0.1% 1 0.0% 0 0.0% 0 0.0% 0 0.0% 0 0.0% 0 0.0% 0 0.0% 0 0.7% 1 0.0% 0 0.0% 0
Hendon, Middlesex 0.1% 1 0.0% 0 0.0% 0 0.0% 0 0.0% 0 0.0% 0 0.0% 0 0.8% 1 0.0% 0 0.0% 0 0.0% 0High Wycombe,
Buckinghamshire 0.6% 6 0.0% 0 4.0% 1 3.5% 4 0.0% 0 0.0% 0 0.0% 0 0.0% 0 0.0% 0 0.9% 1 0.0% 0
Internet / Delivered 10.8% 108 9.1% 5 16.0% 4 11.3% 13 7.1% 6 9.7% 16 17.2% 25 7.7% 10 12.6% 17 8.2% 9 8.6% 3John Lewis, Holmers Farm
Way, Cressex Centre, High Wycombe
0.1% 1 0.0% 0 4.0% 1 0.0% 0 0.0% 0 0.0% 0 0.0% 0 0.0% 0 0.0% 0 0.0% 0 0.0% 0
John Lewis, The Harlequin Centre, Station Road, Watford
0.1% 1 0.0% 0 0.0% 0 0.0% 0 0.0% 0 0.6% 1 0.0% 0 0.0% 0 0.0% 0 0.0% 0 0.0% 0
Kenton 0.2% 2 0.0% 0 0.0% 0 0.0% 0 0.0% 0 0.0% 0 0.0% 0 0.0% 0 0.7% 1 0.9% 1 0.0% 0Kingsbury 0.7% 7 0.0% 0 0.0% 0 0.0% 0 0.0% 0 0.0% 0 0.0% 0 0.0% 0 1.5% 2 4.5% 5 0.0% 0Marlow, Buckinghamshire 0.1% 1 0.0% 0 0.0% 0 0.0% 0 0.0% 0 0.0% 0 0.0% 0 0.0% 0 0.0% 0 0.9% 1 0.0% 0Milton Keynes 0.1% 1 0.0% 0 0.0% 0 0.0% 0 0.0% 0 0.6% 1 0.0% 0 0.0% 0 0.0% 0 0.0% 0 0.0% 0North Harrow 0.2% 2 0.0% 0 0.0% 0 0.0% 0 0.0% 0 0.6% 1 0.0% 0 0.8% 1 0.0% 0 0.0% 0 0.0% 0Northolt 0.3% 3 0.0% 0 0.0% 0 1.7% 2 0.0% 0 0.0% 0 0.0% 0 0.8% 1 0.0% 0 0.0% 0 0.0% 0Northwood 0.2% 2 3.6% 2 0.0% 0 0.0% 0 0.0% 0 0.0% 0 0.0% 0 0.0% 0 0.0% 0 0.0% 0 0.0% 0Office World, Staples Corner
Retail Park, Geron Way, Barnet
0.1% 1 0.0% 0 0.0% 0 0.0% 0 0.0% 0 0.0% 0 0.0% 0 0.0% 0 0.0% 0 0.9% 1 0.0% 0
PC World, White Hart Roundabout, Northolt
0.4% 4 0.0% 0 0.0% 0 0.9% 1 0.0% 0 1.2% 2 0.7% 1 0.0% 0 0.0% 0 0.0% 0 0.0% 0
Pinner 1.3% 13 5.5% 3 4.0% 1 2.6% 3 5.9% 5 0.0% 0 0.7% 1 0.0% 0 0.0% 0 0.0% 0 0.0% 0Queensbury 0.1% 1 0.0% 0 0.0% 0 0.0% 0 0.0% 0 0.0% 0 0.0% 0 0.0% 0 0.0% 0 0.9% 1 0.0% 0Rayners Lane 0.7% 7 0.0% 0 0.0% 0 0.0% 0 0.0% 0 3.6% 6 0.7% 1 0.0% 0 0.0% 0 0.0% 0 0.0% 0Reading, Berkshire 0.1% 1 0.0% 0 0.0% 0 0.0% 0 1.2% 1 0.0% 0 0.0% 0 0.0% 0 0.0% 0 0.0% 0 0.0% 0Ruislip 0.6% 6 1.8% 1 0.0% 0 0.9% 1 0.0% 0 1.8% 3 0.7% 1 0.0% 0 0.0% 0 0.0% 0 0.0% 0South Harrow 0.4% 4 0.0% 0 4.0% 1 0.0% 0 0.0% 0 1.2% 2 0.7% 1 0.0% 0 0.0% 0 0.0% 0 0.0% 0South Oxney 0.1% 1 0.0% 0 0.0% 0 0.0% 0 1.2% 1 0.0% 0 0.0% 0 0.0% 0 0.0% 0 0.0% 0 0.0% 0South Ruislip 0.5% 5 1.8% 1 0.0% 0 0.9% 1 0.0% 0 1.8% 3 0.0% 0 0.0% 0 0.0% 0 0.0% 0 0.0% 0Stafford 0.1% 1 0.0% 0 0.0% 0 0.0% 0 0.0% 0 0.0% 0 0.7% 1 0.0% 0 0.0% 0 0.0% 0 0.0% 0Stanmore 0.2% 2 0.0% 0 0.0% 0 0.0% 0 0.0% 0 0.0% 0 0.0% 0 0.0% 0 0.7% 1 0.0% 0 2.9% 1Staples Corner Retail Park,
Geron Way, Cricklewood 0.2% 2 0.0% 0 0.0% 0 0.0% 0 0.0% 0 0.0% 0 0.0% 0 0.0% 0 0.7% 1 0.9% 1 0.0% 0
Swindon 0.1% 1 0.0% 0 0.0% 0 0.0% 0 0.0% 0 0.0% 0 0.0% 0 0.0% 0 0.7% 1 0.0% 0 0.0% 0Tesco, Frogmoor Wharf,
Harefield Road, Rickmansworth
0.1% 1 1.8% 1 0.0% 0 0.0% 0 0.0% 0 0.0% 0 0.0% 0 0.0% 0 0.0% 0 0.0% 0 0.0% 0
Tesco, Glencoe Road, Hayes 0.1% 1 0.0% 0 0.0% 0 0.0% 0 0.0% 0 0.6% 1 0.0% 0 0.0% 0 0.0% 0 0.0% 0 0.0% 0Uxbridge 0.3% 3 0.0% 0 4.0% 1 1.7% 2 0.0% 0 0.0% 0 0.0% 0 0.0% 0 0.0% 0 0.0% 0 0.0% 0Victoria Retail Park, Crown 0.1% 1 0.0% 0 0.0% 0 0.0% 0 0.0% 0 0.0% 0 0.7% 1 0.0% 0 0.0% 0 0.0% 0 0.0% 0

By Zone London Borough of Harrow Household Survey Page 53 For Nathaniel Lichfield & Partners May 2009
Total Zone 1 Zone 2 Zone 3 Zone 4 Zone 5 Zone 6 Zone 7 Zone 8 Zone 9 Zone 10
180509 NEMS market research
Road, Hillingdon, Ruislip Watford 14.6% 146 34.5% 19 16.0% 4 18.3% 21 40.0% 34 8.5% 14 14.5% 21 1.5% 2 15.6% 21 2.7% 3 20.0% 7Wealdstone 0.3% 3 0.0% 0 0.0% 0 0.9% 1 0.0% 0 0.0% 0 0.7% 1 0.0% 0 0.7% 1 0.0% 0 0.0% 0Wembley 0.8% 8 0.0% 0 0.0% 0 0.0% 0 0.0% 0 0.6% 1 0.0% 0 4.6% 6 0.7% 1 0.0% 0 0.0% 0Westfield / White City 0.2% 2 0.0% 0 0.0% 0 1.7% 2 0.0% 0 0.0% 0 0.0% 0 0.0% 0 0.0% 0 0.0% 0 0.0% 0Yeading 0.2% 2 0.0% 0 0.0% 0 0.0% 0 0.0% 0 0.0% 0 0.0% 0 1.5% 2 0.0% 0 0.0% 0 0.0% 0(Don't buy these goods) 16.2% 162 14.5% 8 4.0% 1 13.9% 16 18.8% 16 15.2% 25 13.1% 19 21.5% 28 11.1% 15 20.9% 23 31.4% 11(Don't know / can't
remember) 9.0% 90 18.2% 10 4.0% 1 4.3% 5 5.9% 5 9.1% 15 9.7% 14 7.7% 10 9.6% 13 11.8% 13 11.4% 4
Base: 1000 55 25 115 85 165 145 130 135 110 35
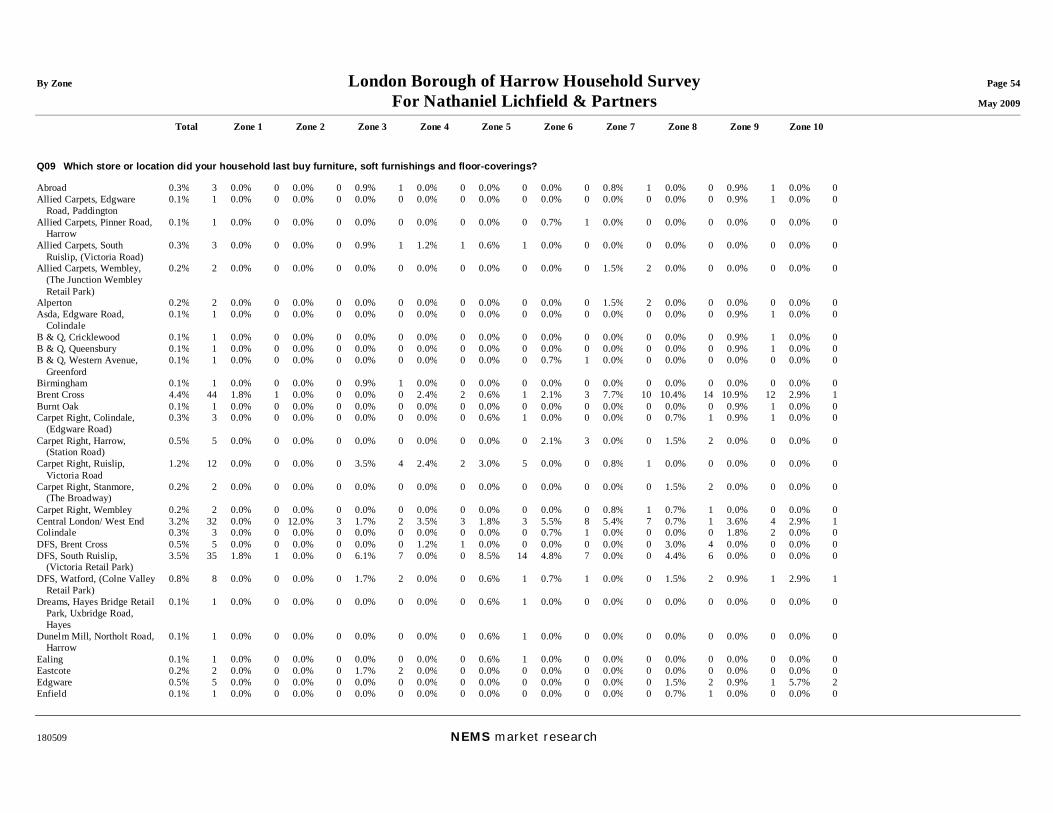
By Zone London Borough of Harrow Household Survey Page 54 For Nathaniel Lichfield & Partners May 2009
Total Zone 1 Zone 2 Zone 3 Zone 4 Zone 5 Zone 6 Zone 7 Zone 8 Zone 9 Zone 10
180509 NEMS market research
Q09 Which store or location did your household last buy furniture, soft furnishings and floor-coverings? Abroad 0.3% 3 0.0% 0 0.0% 0 0.9% 1 0.0% 0 0.0% 0 0.0% 0 0.8% 1 0.0% 0 0.9% 1 0.0% 0Allied Carpets, Edgware
Road, Paddington 0.1% 1 0.0% 0 0.0% 0 0.0% 0 0.0% 0 0.0% 0 0.0% 0 0.0% 0 0.0% 0 0.9% 1 0.0% 0
Allied Carpets, Pinner Road, Harrow
0.1% 1 0.0% 0 0.0% 0 0.0% 0 0.0% 0 0.0% 0 0.7% 1 0.0% 0 0.0% 0 0.0% 0 0.0% 0
Allied Carpets, South Ruislip, (Victoria Road)
0.3% 3 0.0% 0 0.0% 0 0.9% 1 1.2% 1 0.6% 1 0.0% 0 0.0% 0 0.0% 0 0.0% 0 0.0% 0
Allied Carpets, Wembley, (The Junction Wembley Retail Park)
0.2% 2 0.0% 0 0.0% 0 0.0% 0 0.0% 0 0.0% 0 0.0% 0 1.5% 2 0.0% 0 0.0% 0 0.0% 0
Alperton 0.2% 2 0.0% 0 0.0% 0 0.0% 0 0.0% 0 0.0% 0 0.0% 0 1.5% 2 0.0% 0 0.0% 0 0.0% 0Asda, Edgware Road,
Colindale 0.1% 1 0.0% 0 0.0% 0 0.0% 0 0.0% 0 0.0% 0 0.0% 0 0.0% 0 0.0% 0 0.9% 1 0.0% 0
B & Q, Cricklewood 0.1% 1 0.0% 0 0.0% 0 0.0% 0 0.0% 0 0.0% 0 0.0% 0 0.0% 0 0.0% 0 0.9% 1 0.0% 0B & Q, Queensbury 0.1% 1 0.0% 0 0.0% 0 0.0% 0 0.0% 0 0.0% 0 0.0% 0 0.0% 0 0.0% 0 0.9% 1 0.0% 0B & Q, Western Avenue,
Greenford 0.1% 1 0.0% 0 0.0% 0 0.0% 0 0.0% 0 0.0% 0 0.7% 1 0.0% 0 0.0% 0 0.0% 0 0.0% 0
Birmingham 0.1% 1 0.0% 0 0.0% 0 0.9% 1 0.0% 0 0.0% 0 0.0% 0 0.0% 0 0.0% 0 0.0% 0 0.0% 0Brent Cross 4.4% 44 1.8% 1 0.0% 0 0.0% 0 2.4% 2 0.6% 1 2.1% 3 7.7% 10 10.4% 14 10.9% 12 2.9% 1Burnt Oak 0.1% 1 0.0% 0 0.0% 0 0.0% 0 0.0% 0 0.0% 0 0.0% 0 0.0% 0 0.0% 0 0.9% 1 0.0% 0Carpet Right, Colindale,
(Edgware Road) 0.3% 3 0.0% 0 0.0% 0 0.0% 0 0.0% 0 0.6% 1 0.0% 0 0.0% 0 0.7% 1 0.9% 1 0.0% 0
Carpet Right, Harrow, (Station Road)
0.5% 5 0.0% 0 0.0% 0 0.0% 0 0.0% 0 0.0% 0 2.1% 3 0.0% 0 1.5% 2 0.0% 0 0.0% 0
Carpet Right, Ruislip, Victoria Road
1.2% 12 0.0% 0 0.0% 0 3.5% 4 2.4% 2 3.0% 5 0.0% 0 0.8% 1 0.0% 0 0.0% 0 0.0% 0
Carpet Right, Stanmore, (The Broadway)
0.2% 2 0.0% 0 0.0% 0 0.0% 0 0.0% 0 0.0% 0 0.0% 0 0.0% 0 1.5% 2 0.0% 0 0.0% 0
Carpet Right, Wembley 0.2% 2 0.0% 0 0.0% 0 0.0% 0 0.0% 0 0.0% 0 0.0% 0 0.8% 1 0.7% 1 0.0% 0 0.0% 0Central London/ West End 3.2% 32 0.0% 0 12.0% 3 1.7% 2 3.5% 3 1.8% 3 5.5% 8 5.4% 7 0.7% 1 3.6% 4 2.9% 1Colindale 0.3% 3 0.0% 0 0.0% 0 0.0% 0 0.0% 0 0.0% 0 0.7% 1 0.0% 0 0.0% 0 1.8% 2 0.0% 0DFS, Brent Cross 0.5% 5 0.0% 0 0.0% 0 0.0% 0 1.2% 1 0.0% 0 0.0% 0 0.0% 0 3.0% 4 0.0% 0 0.0% 0DFS, South Ruislip,
(Victoria Retail Park) 3.5% 35 1.8% 1 0.0% 0 6.1% 7 0.0% 0 8.5% 14 4.8% 7 0.0% 0 4.4% 6 0.0% 0 0.0% 0
DFS, Watford, (Colne Valley Retail Park)
0.8% 8 0.0% 0 0.0% 0 1.7% 2 0.0% 0 0.6% 1 0.7% 1 0.0% 0 1.5% 2 0.9% 1 2.9% 1
Dreams, Hayes Bridge Retail Park, Uxbridge Road, Hayes
0.1% 1 0.0% 0 0.0% 0 0.0% 0 0.0% 0 0.6% 1 0.0% 0 0.0% 0 0.0% 0 0.0% 0 0.0% 0
Dunelm Mill, Northolt Road, Harrow
0.1% 1 0.0% 0 0.0% 0 0.0% 0 0.0% 0 0.6% 1 0.0% 0 0.0% 0 0.0% 0 0.0% 0 0.0% 0
Ealing 0.1% 1 0.0% 0 0.0% 0 0.0% 0 0.0% 0 0.6% 1 0.0% 0 0.0% 0 0.0% 0 0.0% 0 0.0% 0Eastcote 0.2% 2 0.0% 0 0.0% 0 1.7% 2 0.0% 0 0.0% 0 0.0% 0 0.0% 0 0.0% 0 0.0% 0 0.0% 0Edgware 0.5% 5 0.0% 0 0.0% 0 0.0% 0 0.0% 0 0.0% 0 0.0% 0 0.0% 0 1.5% 2 0.9% 1 5.7% 2Enfield 0.1% 1 0.0% 0 0.0% 0 0.0% 0 0.0% 0 0.0% 0 0.0% 0 0.0% 0 0.7% 1 0.0% 0 0.0% 0

By Zone London Borough of Harrow Household Survey Page 55 For Nathaniel Lichfield & Partners May 2009
Total Zone 1 Zone 2 Zone 3 Zone 4 Zone 5 Zone 6 Zone 7 Zone 8 Zone 9 Zone 10
180509 NEMS market research
Exeter 0.1% 1 0.0% 0 0.0% 0 0.0% 0 0.0% 0 0.0% 0 0.7% 1 0.0% 0 0.0% 0 0.0% 0 0.0% 0Furniture Village, Ruislip
Retail Park, (Victoria Rd) 1.3% 13 1.8% 1 0.0% 0 2.6% 3 1.2% 1 3.0% 5 0.7% 1 0.8% 1 0.0% 0 0.9% 1 0.0% 0
Harrow 7.0% 70 1.8% 1 0.0% 0 3.5% 4 4.7% 4 9.1% 15 16.6% 24 10.0% 13 4.4% 6 2.7% 3 0.0% 0Harrow Weald 0.2% 2 0.0% 0 0.0% 0 0.0% 0 0.0% 0 0.0% 0 0.7% 1 0.0% 0 0.7% 1 0.0% 0 0.0% 0Harveys, Colne Valley Retail
Park, Lower High Street, Watford
0.1% 1 0.0% 0 0.0% 0 0.0% 0 0.0% 0 0.0% 0 0.7% 1 0.0% 0 0.0% 0 0.0% 0 0.0% 0
Harveys, Edgware Road, Colindale
0.1% 1 0.0% 0 0.0% 0 0.0% 0 0.0% 0 0.0% 0 0.0% 0 0.0% 0 0.7% 1 0.0% 0 0.0% 0
Hatch End 0.2% 2 0.0% 0 0.0% 0 0.0% 0 1.2% 1 0.6% 1 0.0% 0 0.0% 0 0.0% 0 0.0% 0 0.0% 0Hayes 0.2% 2 0.0% 0 0.0% 0 1.7% 2 0.0% 0 0.0% 0 0.0% 0 0.0% 0 0.0% 0 0.0% 0 0.0% 0High Wycombe,
Buckinghamshire 0.7% 7 0.0% 0 8.0% 2 2.6% 3 0.0% 0 0.6% 1 0.0% 0 0.8% 1 0.0% 0 0.0% 0 0.0% 0
Homebase, High Road, Harrow
0.1% 1 0.0% 0 0.0% 0 0.0% 0 0.0% 0 0.0% 0 0.0% 0 0.0% 0 0.7% 1 0.0% 0 0.0% 0
Homebase, Victoria Retail Park, Crown Road, Ruislip
0.2% 2 0.0% 0 0.0% 0 1.7% 2 0.0% 0 0.0% 0 0.0% 0 0.0% 0 0.0% 0 0.0% 0 0.0% 0
Hyde 0.1% 1 0.0% 0 0.0% 0 0.0% 0 0.0% 0 0.0% 0 0.0% 0 0.0% 0 0.0% 0 0.9% 1 0.0% 0Ikea, Drury Way, Neasden 0.1% 1 0.0% 0 0.0% 0 0.0% 0 0.0% 0 0.0% 0 0.0% 0 0.8% 1 0.0% 0 0.0% 0 0.0% 0Ikea, Wembley 2.7% 27 1.8% 1 4.0% 1 1.7% 2 1.2% 1 3.0% 5 2.8% 4 3.8% 5 2.2% 3 4.5% 5 0.0% 0Internet / Delivered 3.5% 35 3.6% 2 4.0% 1 4.3% 5 1.2% 1 4.2% 7 4.8% 7 3.8% 5 3.7% 5 0.9% 1 2.9% 1John Lewis, Holmers Farm
Way, Cressex Centre, High Wycombe
0.2% 2 1.8% 1 4.0% 1 0.0% 0 0.0% 0 0.0% 0 0.0% 0 0.0% 0 0.0% 0 0.0% 0 0.0% 0
Kenton 0.2% 2 0.0% 0 0.0% 0 0.0% 0 0.0% 0 0.0% 0 0.7% 1 0.0% 0 0.7% 1 0.0% 0 0.0% 0Kingsbury 0.4% 4 0.0% 0 0.0% 0 0.0% 0 0.0% 0 0.0% 0 0.7% 1 0.0% 0 0.7% 1 1.8% 2 0.0% 0Land of Leather, Victoria
Road, South Ruislip 0.1% 1 0.0% 0 0.0% 0 0.9% 1 0.0% 0 0.0% 0 0.0% 0 0.0% 0 0.0% 0 0.0% 0 0.0% 0
London Colney, St. Albans 0.3% 3 1.8% 1 0.0% 0 0.0% 0 0.0% 0 0.0% 0 0.7% 1 0.0% 0 0.7% 1 0.0% 0 0.0% 0MFI, Edgware Road,
Colindale 0.1% 1 0.0% 0 0.0% 0 0.0% 0 0.0% 0 0.0% 0 0.0% 0 0.0% 0 0.0% 0 0.9% 1 0.0% 0
Middlesex 0.1% 1 1.8% 1 0.0% 0 0.0% 0 0.0% 0 0.0% 0 0.0% 0 0.0% 0 0.0% 0 0.0% 0 0.0% 0North Finchley 0.1% 1 0.0% 0 0.0% 0 0.9% 1 0.0% 0 0.0% 0 0.0% 0 0.0% 0 0.0% 0 0.0% 0 0.0% 0North Harrow 0.8% 8 0.0% 0 0.0% 0 0.0% 0 1.2% 1 1.8% 3 2.8% 4 0.0% 0 0.0% 0 0.0% 0 0.0% 0Northolt 0.3% 3 0.0% 0 0.0% 0 0.0% 0 0.0% 0 0.6% 1 0.0% 0 1.5% 2 0.0% 0 0.0% 0 0.0% 0Northwood 0.1% 1 1.8% 1 0.0% 0 0.0% 0 0.0% 0 0.0% 0 0.0% 0 0.0% 0 0.0% 0 0.0% 0 0.0% 0Pinner 1.8% 18 5.5% 3 4.0% 1 3.5% 4 8.2% 7 0.6% 1 0.0% 0 0.0% 0 1.5% 2 0.0% 0 0.0% 0Rayners Lane 0.2% 2 0.0% 0 0.0% 0 0.0% 0 0.0% 0 1.2% 2 0.0% 0 0.0% 0 0.0% 0 0.0% 0 0.0% 0Ruislip 2.7% 27 9.1% 5 20.0% 5 5.2% 6 1.2% 1 1.2% 2 1.4% 2 2.3% 3 1.5% 2 0.9% 1 0.0% 0Slough 0.1% 1 0.0% 0 0.0% 0 0.0% 0 0.0% 0 0.0% 0 0.0% 0 0.8% 1 0.0% 0 0.0% 0 0.0% 0South Harrow 1.2% 12 3.6% 2 0.0% 0 0.0% 0 0.0% 0 3.0% 5 0.7% 1 2.3% 3 0.7% 1 0.0% 0 0.0% 0South Oxney 0.2% 2 0.0% 0 0.0% 0 0.0% 0 2.4% 2 0.0% 0 0.0% 0 0.0% 0 0.0% 0 0.0% 0 0.0% 0South Ruislip 1.4% 14 0.0% 0 8.0% 2 5.2% 6 0.0% 0 3.0% 5 0.7% 1 0.0% 0 0.0% 0 0.0% 0 0.0% 0Southall 0.1% 1 0.0% 0 0.0% 0 0.0% 0 0.0% 0 0.0% 0 0.0% 0 0.8% 1 0.0% 0 0.0% 0 0.0% 0Stanmore 0.4% 4 0.0% 0 0.0% 0 0.0% 0 0.0% 0 0.0% 0 0.0% 0 0.0% 0 0.0% 0 0.9% 1 8.6% 3Staples Corner Retail Park, 0.1% 1 0.0% 0 0.0% 0 0.0% 0 0.0% 0 0.0% 0 0.0% 0 0.0% 0 0.0% 0 0.9% 1 0.0% 0
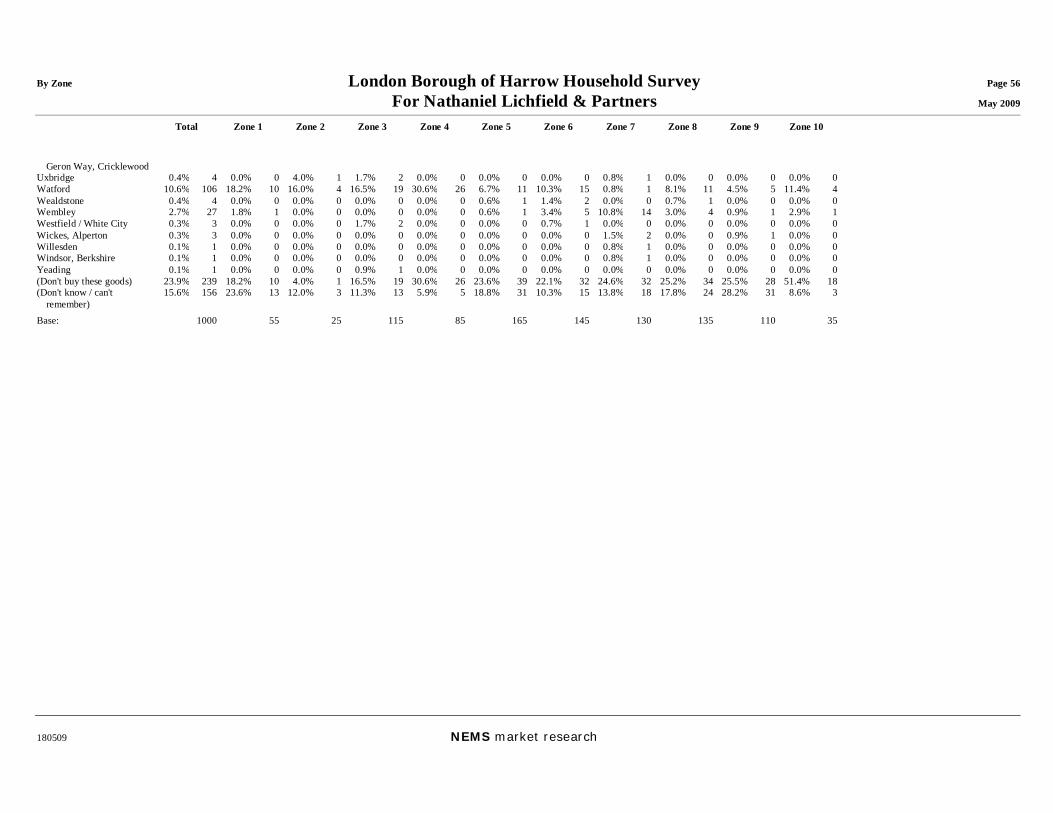
By Zone London Borough of Harrow Household Survey Page 56 For Nathaniel Lichfield & Partners May 2009
Total Zone 1 Zone 2 Zone 3 Zone 4 Zone 5 Zone 6 Zone 7 Zone 8 Zone 9 Zone 10
180509 NEMS market research
Geron Way, Cricklewood Uxbridge 0.4% 4 0.0% 0 4.0% 1 1.7% 2 0.0% 0 0.0% 0 0.0% 0 0.8% 1 0.0% 0 0.0% 0 0.0% 0Watford 10.6% 106 18.2% 10 16.0% 4 16.5% 19 30.6% 26 6.7% 11 10.3% 15 0.8% 1 8.1% 11 4.5% 5 11.4% 4Wealdstone 0.4% 4 0.0% 0 0.0% 0 0.0% 0 0.0% 0 0.6% 1 1.4% 2 0.0% 0 0.7% 1 0.0% 0 0.0% 0Wembley 2.7% 27 1.8% 1 0.0% 0 0.0% 0 0.0% 0 0.6% 1 3.4% 5 10.8% 14 3.0% 4 0.9% 1 2.9% 1Westfield / White City 0.3% 3 0.0% 0 0.0% 0 1.7% 2 0.0% 0 0.0% 0 0.7% 1 0.0% 0 0.0% 0 0.0% 0 0.0% 0Wickes, Alperton 0.3% 3 0.0% 0 0.0% 0 0.0% 0 0.0% 0 0.0% 0 0.0% 0 1.5% 2 0.0% 0 0.9% 1 0.0% 0Willesden 0.1% 1 0.0% 0 0.0% 0 0.0% 0 0.0% 0 0.0% 0 0.0% 0 0.8% 1 0.0% 0 0.0% 0 0.0% 0Windsor, Berkshire 0.1% 1 0.0% 0 0.0% 0 0.0% 0 0.0% 0 0.0% 0 0.0% 0 0.8% 1 0.0% 0 0.0% 0 0.0% 0Yeading 0.1% 1 0.0% 0 0.0% 0 0.9% 1 0.0% 0 0.0% 0 0.0% 0 0.0% 0 0.0% 0 0.0% 0 0.0% 0(Don't buy these goods) 23.9% 239 18.2% 10 4.0% 1 16.5% 19 30.6% 26 23.6% 39 22.1% 32 24.6% 32 25.2% 34 25.5% 28 51.4% 18(Don't know / can't
remember) 15.6% 156 23.6% 13 12.0% 3 11.3% 13 5.9% 5 18.8% 31 10.3% 15 13.8% 18 17.8% 24 28.2% 31 8.6% 3
Base: 1000 55 25 115 85 165 145 130 135 110 35
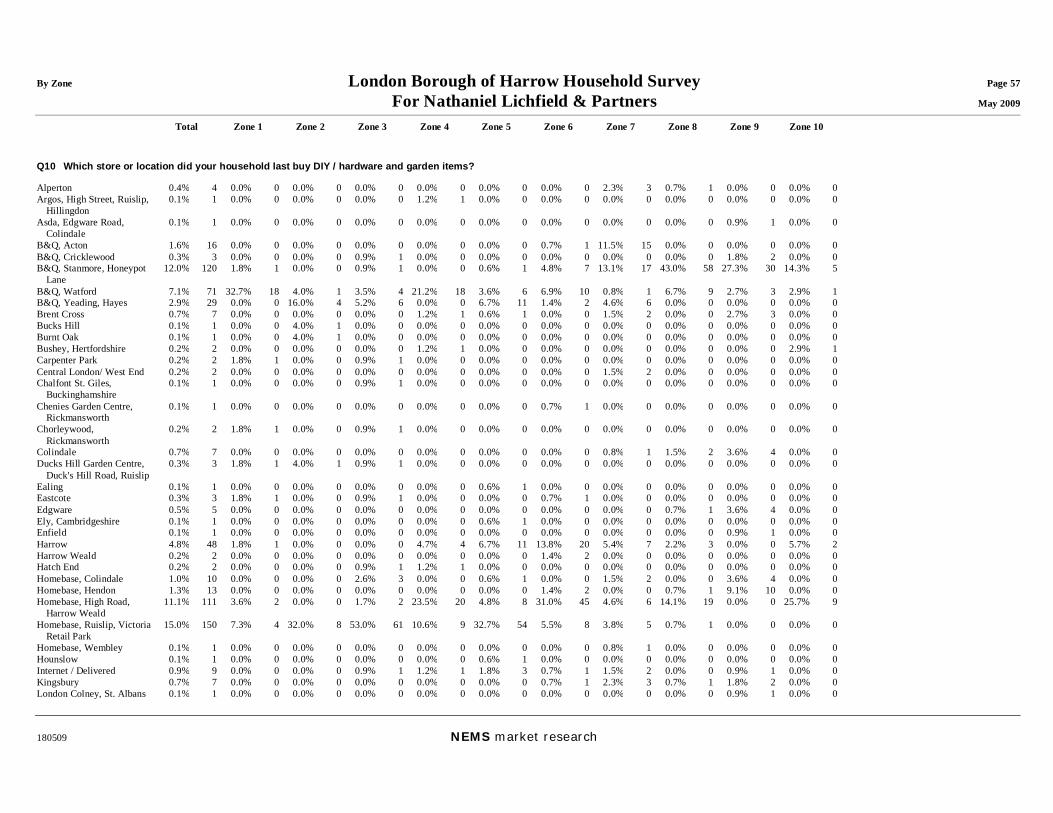
By Zone London Borough of Harrow Household Survey Page 57 For Nathaniel Lichfield & Partners May 2009
Total Zone 1 Zone 2 Zone 3 Zone 4 Zone 5 Zone 6 Zone 7 Zone 8 Zone 9 Zone 10
180509 NEMS market research
Q10 Which store or location did your household last buy DIY / hardware and garden items? Alperton 0.4% 4 0.0% 0 0.0% 0 0.0% 0 0.0% 0 0.0% 0 0.0% 0 2.3% 3 0.7% 1 0.0% 0 0.0% 0Argos, High Street, Ruislip,
Hillingdon 0.1% 1 0.0% 0 0.0% 0 0.0% 0 1.2% 1 0.0% 0 0.0% 0 0.0% 0 0.0% 0 0.0% 0 0.0% 0
Asda, Edgware Road, Colindale
0.1% 1 0.0% 0 0.0% 0 0.0% 0 0.0% 0 0.0% 0 0.0% 0 0.0% 0 0.0% 0 0.9% 1 0.0% 0
B&Q, Acton 1.6% 16 0.0% 0 0.0% 0 0.0% 0 0.0% 0 0.0% 0 0.7% 1 11.5% 15 0.0% 0 0.0% 0 0.0% 0B&Q, Cricklewood 0.3% 3 0.0% 0 0.0% 0 0.9% 1 0.0% 0 0.0% 0 0.0% 0 0.0% 0 0.0% 0 1.8% 2 0.0% 0B&Q, Stanmore, Honeypot
Lane 12.0% 120 1.8% 1 0.0% 0 0.9% 1 0.0% 0 0.6% 1 4.8% 7 13.1% 17 43.0% 58 27.3% 30 14.3% 5
B&Q, Watford 7.1% 71 32.7% 18 4.0% 1 3.5% 4 21.2% 18 3.6% 6 6.9% 10 0.8% 1 6.7% 9 2.7% 3 2.9% 1B&Q, Yeading, Hayes 2.9% 29 0.0% 0 16.0% 4 5.2% 6 0.0% 0 6.7% 11 1.4% 2 4.6% 6 0.0% 0 0.0% 0 0.0% 0Brent Cross 0.7% 7 0.0% 0 0.0% 0 0.0% 0 1.2% 1 0.6% 1 0.0% 0 1.5% 2 0.0% 0 2.7% 3 0.0% 0Bucks Hill 0.1% 1 0.0% 0 4.0% 1 0.0% 0 0.0% 0 0.0% 0 0.0% 0 0.0% 0 0.0% 0 0.0% 0 0.0% 0Burnt Oak 0.1% 1 0.0% 0 4.0% 1 0.0% 0 0.0% 0 0.0% 0 0.0% 0 0.0% 0 0.0% 0 0.0% 0 0.0% 0Bushey, Hertfordshire 0.2% 2 0.0% 0 0.0% 0 0.0% 0 1.2% 1 0.0% 0 0.0% 0 0.0% 0 0.0% 0 0.0% 0 2.9% 1Carpenter Park 0.2% 2 1.8% 1 0.0% 0 0.9% 1 0.0% 0 0.0% 0 0.0% 0 0.0% 0 0.0% 0 0.0% 0 0.0% 0Central London/ West End 0.2% 2 0.0% 0 0.0% 0 0.0% 0 0.0% 0 0.0% 0 0.0% 0 1.5% 2 0.0% 0 0.0% 0 0.0% 0Chalfont St. Giles,
Buckinghamshire 0.1% 1 0.0% 0 0.0% 0 0.9% 1 0.0% 0 0.0% 0 0.0% 0 0.0% 0 0.0% 0 0.0% 0 0.0% 0
Chenies Garden Centre, Rickmansworth
0.1% 1 0.0% 0 0.0% 0 0.0% 0 0.0% 0 0.0% 0 0.7% 1 0.0% 0 0.0% 0 0.0% 0 0.0% 0
Chorleywood, Rickmansworth
0.2% 2 1.8% 1 0.0% 0 0.9% 1 0.0% 0 0.0% 0 0.0% 0 0.0% 0 0.0% 0 0.0% 0 0.0% 0
Colindale 0.7% 7 0.0% 0 0.0% 0 0.0% 0 0.0% 0 0.0% 0 0.0% 0 0.8% 1 1.5% 2 3.6% 4 0.0% 0Ducks Hill Garden Centre,
Duck's Hill Road, Ruislip 0.3% 3 1.8% 1 4.0% 1 0.9% 1 0.0% 0 0.0% 0 0.0% 0 0.0% 0 0.0% 0 0.0% 0 0.0% 0
Ealing 0.1% 1 0.0% 0 0.0% 0 0.0% 0 0.0% 0 0.6% 1 0.0% 0 0.0% 0 0.0% 0 0.0% 0 0.0% 0Eastcote 0.3% 3 1.8% 1 0.0% 0 0.9% 1 0.0% 0 0.0% 0 0.7% 1 0.0% 0 0.0% 0 0.0% 0 0.0% 0Edgware 0.5% 5 0.0% 0 0.0% 0 0.0% 0 0.0% 0 0.0% 0 0.0% 0 0.0% 0 0.7% 1 3.6% 4 0.0% 0Ely, Cambridgeshire 0.1% 1 0.0% 0 0.0% 0 0.0% 0 0.0% 0 0.6% 1 0.0% 0 0.0% 0 0.0% 0 0.0% 0 0.0% 0Enfield 0.1% 1 0.0% 0 0.0% 0 0.0% 0 0.0% 0 0.0% 0 0.0% 0 0.0% 0 0.0% 0 0.9% 1 0.0% 0Harrow 4.8% 48 1.8% 1 0.0% 0 0.0% 0 4.7% 4 6.7% 11 13.8% 20 5.4% 7 2.2% 3 0.0% 0 5.7% 2Harrow Weald 0.2% 2 0.0% 0 0.0% 0 0.0% 0 0.0% 0 0.0% 0 1.4% 2 0.0% 0 0.0% 0 0.0% 0 0.0% 0Hatch End 0.2% 2 0.0% 0 0.0% 0 0.9% 1 1.2% 1 0.0% 0 0.0% 0 0.0% 0 0.0% 0 0.0% 0 0.0% 0Homebase, Colindale 1.0% 10 0.0% 0 0.0% 0 2.6% 3 0.0% 0 0.6% 1 0.0% 0 1.5% 2 0.0% 0 3.6% 4 0.0% 0Homebase, Hendon 1.3% 13 0.0% 0 0.0% 0 0.0% 0 0.0% 0 0.0% 0 1.4% 2 0.0% 0 0.7% 1 9.1% 10 0.0% 0Homebase, High Road,
Harrow Weald 11.1% 111 3.6% 2 0.0% 0 1.7% 2 23.5% 20 4.8% 8 31.0% 45 4.6% 6 14.1% 19 0.0% 0 25.7% 9
Homebase, Ruislip, Victoria Retail Park
15.0% 150 7.3% 4 32.0% 8 53.0% 61 10.6% 9 32.7% 54 5.5% 8 3.8% 5 0.7% 1 0.0% 0 0.0% 0
Homebase, Wembley 0.1% 1 0.0% 0 0.0% 0 0.0% 0 0.0% 0 0.0% 0 0.0% 0 0.8% 1 0.0% 0 0.0% 0 0.0% 0Hounslow 0.1% 1 0.0% 0 0.0% 0 0.0% 0 0.0% 0 0.6% 1 0.0% 0 0.0% 0 0.0% 0 0.0% 0 0.0% 0Internet / Delivered 0.9% 9 0.0% 0 0.0% 0 0.9% 1 1.2% 1 1.8% 3 0.7% 1 1.5% 2 0.0% 0 0.9% 1 0.0% 0Kingsbury 0.7% 7 0.0% 0 0.0% 0 0.0% 0 0.0% 0 0.0% 0 0.7% 1 2.3% 3 0.7% 1 1.8% 2 0.0% 0London Colney, St. Albans 0.1% 1 0.0% 0 0.0% 0 0.0% 0 0.0% 0 0.0% 0 0.0% 0 0.0% 0 0.0% 0 0.9% 1 0.0% 0

By Zone London Borough of Harrow Household Survey Page 58 For Nathaniel Lichfield & Partners May 2009
Total Zone 1 Zone 2 Zone 3 Zone 4 Zone 5 Zone 6 Zone 7 Zone 8 Zone 9 Zone 10
180509 NEMS market research
Neasden 0.1% 1 0.0% 0 0.0% 0 0.0% 0 0.0% 0 0.0% 0 0.0% 0 0.8% 1 0.0% 0 0.0% 0 0.0% 0North Harrow 0.2% 2 1.8% 1 0.0% 0 0.9% 1 0.0% 0 0.0% 0 0.0% 0 0.0% 0 0.0% 0 0.0% 0 0.0% 0Northwood 0.1% 1 1.8% 1 0.0% 0 0.0% 0 0.0% 0 0.0% 0 0.0% 0 0.0% 0 0.0% 0 0.0% 0 0.0% 0Osterley 0.1% 1 0.0% 0 0.0% 0 0.0% 0 0.0% 0 0.6% 1 0.0% 0 0.0% 0 0.0% 0 0.0% 0 0.0% 0Pinner 0.5% 5 0.0% 0 0.0% 0 0.0% 0 2.4% 2 1.2% 2 0.7% 1 0.0% 0 0.0% 0 0.0% 0 0.0% 0Queensbury 0.3% 3 0.0% 0 0.0% 0 0.0% 0 0.0% 0 0.0% 0 0.0% 0 0.0% 0 0.0% 0 2.7% 3 0.0% 0Rayners Lane 0.3% 3 0.0% 0 0.0% 0 0.0% 0 0.0% 0 1.2% 2 0.7% 1 0.0% 0 0.0% 0 0.0% 0 0.0% 0Rivers Retail Park, Mustard
Mill Road, Staines 0.1% 1 0.0% 0 0.0% 0 0.0% 0 0.0% 0 0.6% 1 0.0% 0 0.0% 0 0.0% 0 0.0% 0 0.0% 0
Robert Dyas Station Road, Harrow
0.1% 1 0.0% 0 0.0% 0 0.0% 0 0.0% 0 0.0% 0 0.7% 1 0.0% 0 0.0% 0 0.0% 0 0.0% 0
Ruislip 1.7% 17 5.5% 3 20.0% 5 2.6% 3 0.0% 0 1.2% 2 1.4% 2 1.5% 2 0.0% 0 0.0% 0 0.0% 0Sevenoaks 0.1% 1 0.0% 0 0.0% 0 0.9% 1 0.0% 0 0.0% 0 0.0% 0 0.0% 0 0.0% 0 0.0% 0 0.0% 0South Harrow 0.5% 5 0.0% 0 0.0% 0 0.0% 0 0.0% 0 3.0% 5 0.0% 0 0.0% 0 0.0% 0 0.0% 0 0.0% 0South Oxney 1.7% 17 0.0% 0 0.0% 0 4.3% 5 2.4% 2 4.8% 8 0.0% 0 1.5% 2 0.0% 0 0.0% 0 0.0% 0St. Albans 0.1% 1 0.0% 0 0.0% 0 0.0% 0 0.0% 0 0.0% 0 0.0% 0 0.0% 0 0.0% 0 0.0% 0 2.9% 1Stanmore 1.3% 13 0.0% 0 0.0% 0 0.0% 0 2.4% 2 0.6% 1 1.4% 2 0.0% 0 3.7% 5 0.9% 1 5.7% 2Sudbury Hill 0.1% 1 0.0% 0 0.0% 0 0.0% 0 0.0% 0 0.6% 1 0.0% 0 0.0% 0 0.0% 0 0.0% 0 0.0% 0Uxbridge 0.1% 1 1.8% 1 0.0% 0 0.0% 0 0.0% 0 0.0% 0 0.0% 0 0.0% 0 0.0% 0 0.0% 0 0.0% 0Watford 2.9% 29 14.5% 8 4.0% 1 3.5% 4 7.1% 6 1.2% 2 3.4% 5 0.0% 0 2.2% 3 0.0% 0 0.0% 0Wealdstone 0.4% 4 1.8% 1 0.0% 0 0.0% 0 0.0% 0 0.0% 0 0.7% 1 0.0% 0 0.0% 0 0.9% 1 2.9% 1Wembley 1.2% 12 0.0% 0 0.0% 0 0.9% 1 0.0% 0 0.0% 0 0.7% 1 6.9% 9 0.0% 0 0.9% 1 0.0% 0Whittington 0.1% 1 0.0% 0 0.0% 0 0.0% 0 0.0% 0 0.6% 1 0.0% 0 0.0% 0 0.0% 0 0.0% 0 0.0% 0Wickes, Station Road,
Harrow 0.2% 2 0.0% 0 0.0% 0 0.0% 0 0.0% 0 0.0% 0 0.0% 0 1.5% 2 0.0% 0 0.0% 0 0.0% 0
Wickes, Victoria Road, Ruislip
0.7% 7 0.0% 0 4.0% 1 0.9% 1 0.0% 0 1.8% 3 0.0% 0 0.0% 0 0.0% 0 1.8% 2 0.0% 0
Willesden 0.2% 2 0.0% 0 0.0% 0 0.0% 0 0.0% 0 0.0% 0 0.0% 0 1.5% 2 0.0% 0 0.0% 0 0.0% 0(Don't buy these goods) 17.2% 172 12.7% 7 4.0% 1 6.1% 7 20.0% 17 16.4% 27 17.2% 25 24.6% 32 13.3% 18 22.7% 25 37.1% 13(Don't know / can't
remember) 5.7% 57 5.5% 3 4.0% 1 6.1% 7 0.0% 0 6.1% 10 3.4% 5 5.4% 7 9.6% 13 10.0% 11 0.0% 0
Base: 1000 55 25 115 85 165 145 130 135 110 35

By Zone London Borough of Harrow Household Survey Page 59 For Nathaniel Lichfield & Partners May 2009
Total Zone 1 Zone 2 Zone 3 Zone 4 Zone 5 Zone 6 Zone 7 Zone 8 Zone 9 Zone 10
180509 NEMS market research
Q11 At which location did your household last buy chemist, health and beauty items? Abroad 0.1% 1 0.0% 0 0.0% 0 0.0% 0 0.0% 0 0.0% 0 0.0% 0 0.0% 0 0.7% 1 0.0% 0 0.0% 0Alperton 0.3% 3 0.0% 0 0.0% 0 0.0% 0 0.0% 0 0.6% 1 0.0% 0 1.5% 2 0.0% 0 0.0% 0 0.0% 0Belmont, Sutton 1.0% 10 0.0% 0 0.0% 0 0.0% 0 0.0% 0 0.0% 0 2.8% 4 0.0% 0 4.4% 6 0.0% 0 0.0% 0Brent Cross 1.9% 19 0.0% 0 0.0% 0 0.0% 0 1.2% 1 0.0% 0 0.7% 1 3.1% 4 3.0% 4 7.3% 8 2.9% 1Burnt Oak 0.6% 6 0.0% 0 4.0% 1 0.9% 1 0.0% 0 0.0% 0 0.0% 0 0.0% 0 0.0% 0 3.6% 4 0.0% 0Bushey, Hertfordshire 0.2% 2 0.0% 0 0.0% 0 0.0% 0 0.0% 0 0.0% 0 0.0% 0 0.0% 0 0.7% 1 0.0% 0 2.9% 1Camden 0.1% 1 0.0% 0 0.0% 0 0.0% 0 0.0% 0 0.0% 0 0.0% 0 0.0% 0 0.7% 1 0.0% 0 0.0% 0Central London/ West End 1.4% 14 3.6% 2 4.0% 1 0.0% 0 1.2% 1 0.6% 1 1.4% 2 3.8% 5 0.0% 0 1.8% 2 0.0% 0Colindale 0.8% 8 0.0% 0 0.0% 0 0.0% 0 0.0% 0 0.0% 0 0.0% 0 0.0% 0 0.0% 0 7.3% 8 0.0% 0Eastcote 2.9% 29 0.0% 0 0.0% 0 22.6% 26 0.0% 0 1.8% 3 0.0% 0 0.0% 0 0.0% 0 0.0% 0 0.0% 0Edgware 5.7% 57 0.0% 0 0.0% 0 0.0% 0 1.2% 1 0.6% 1 0.7% 1 0.0% 0 6.7% 9 37.3% 41 11.4% 4Feltham 0.1% 1 0.0% 0 0.0% 0 0.0% 0 0.0% 0 0.0% 0 0.0% 0 0.8% 1 0.0% 0 0.0% 0 0.0% 0Gatwick Airport 0.1% 1 0.0% 0 0.0% 0 0.0% 0 0.0% 0 0.6% 1 0.0% 0 0.0% 0 0.0% 0 0.0% 0 0.0% 0Great Yarmouth 0.1% 1 0.0% 0 0.0% 0 0.0% 0 0.0% 0 0.6% 1 0.0% 0 0.0% 0 0.0% 0 0.0% 0 0.0% 0Greenford 1.8% 18 0.0% 0 0.0% 0 0.0% 0 0.0% 0 3.6% 6 2.1% 3 6.9% 9 0.0% 0 0.0% 0 0.0% 0Harefield 0.1% 1 0.0% 0 0.0% 0 0.9% 1 0.0% 0 0.0% 0 0.0% 0 0.0% 0 0.0% 0 0.0% 0 0.0% 0Harrow 27.1% 271 3.6% 2 0.0% 0 6.1% 7 25.9% 22 33.9% 56 66.9% 97 34.6% 45 26.7% 36 1.8% 2 11.4% 4Harrow Weald 0.5% 5 0.0% 0 0.0% 0 0.0% 0 0.0% 0 0.0% 0 2.8% 4 0.0% 0 0.7% 1 0.0% 0 0.0% 0Hatch End 0.6% 6 0.0% 0 0.0% 0 0.0% 0 7.1% 6 0.0% 0 0.0% 0 0.0% 0 0.0% 0 0.0% 0 0.0% 0Hemel Hempstead,
Hertfordshire 0.1% 1 0.0% 0 0.0% 0 0.0% 0 0.0% 0 0.0% 0 0.0% 0 0.0% 0 0.7% 1 0.0% 0 0.0% 0
Hendon, Middlesex 0.1% 1 0.0% 0 0.0% 0 0.0% 0 0.0% 0 0.0% 0 0.0% 0 0.0% 0 0.0% 0 0.9% 1 0.0% 0Hillingdon 0.2% 2 0.0% 0 0.0% 0 1.7% 2 0.0% 0 0.0% 0 0.0% 0 0.0% 0 0.0% 0 0.0% 0 0.0% 0Hyde 0.2% 2 0.0% 0 4.0% 1 0.0% 0 0.0% 0 0.0% 0 0.0% 0 0.0% 0 0.0% 0 0.9% 1 0.0% 0Internet / Delivered 1.3% 13 3.6% 2 0.0% 0 0.9% 1 1.2% 1 1.8% 3 1.4% 2 0.0% 0 0.0% 0 2.7% 3 2.9% 1Kent 0.1% 1 0.0% 0 0.0% 0 0.0% 0 0.0% 0 0.0% 0 0.0% 0 0.0% 0 0.7% 1 0.0% 0 0.0% 0Kentish Town 0.1% 1 0.0% 0 0.0% 0 0.0% 0 0.0% 0 0.0% 0 0.7% 1 0.0% 0 0.0% 0 0.0% 0 0.0% 0Kenton 2.1% 21 0.0% 0 0.0% 0 0.0% 0 0.0% 0 0.0% 0 0.0% 0 3.1% 4 12.6% 17 0.0% 0 0.0% 0Kingsbury 2.8% 28 0.0% 0 0.0% 0 0.0% 0 0.0% 0 0.0% 0 0.0% 0 0.8% 1 7.4% 10 15.5% 17 0.0% 0Local shops 2.6% 26 18.2% 10 4.0% 1 3.5% 4 1.2% 1 0.6% 1 0.0% 0 3.1% 4 3.7% 5 0.0% 0 0.0% 0London Colney, St. Albans 0.1% 1 0.0% 0 0.0% 0 0.0% 0 0.0% 0 0.0% 0 0.0% 0 0.0% 0 0.0% 0 0.9% 1 0.0% 0Middlesex 0.1% 1 0.0% 0 0.0% 0 0.0% 0 0.0% 0 0.6% 1 0.0% 0 0.0% 0 0.0% 0 0.0% 0 0.0% 0Moorpark 0.1% 1 0.0% 0 0.0% 0 0.9% 1 0.0% 0 0.0% 0 0.0% 0 0.0% 0 0.0% 0 0.0% 0 0.0% 0North Harrow 0.5% 5 0.0% 0 0.0% 0 0.0% 0 0.0% 0 1.8% 3 1.4% 2 0.0% 0 0.0% 0 0.0% 0 0.0% 0Northolt 0.3% 3 0.0% 0 0.0% 0 0.0% 0 0.0% 0 1.8% 3 0.0% 0 0.0% 0 0.0% 0 0.0% 0 0.0% 0Northwood 2.1% 21 36.4% 20 0.0% 0 0.9% 1 0.0% 0 0.0% 0 0.0% 0 0.0% 0 0.0% 0 0.0% 0 0.0% 0Osterley 0.1% 1 0.0% 0 0.0% 0 0.0% 0 0.0% 0 0.6% 1 0.0% 0 0.0% 0 0.0% 0 0.0% 0 0.0% 0Pinner 6.9% 69 5.5% 3 0.0% 0 17.4% 20 31.8% 27 9.7% 16 0.7% 1 0.0% 0 1.5% 2 0.0% 0 0.0% 0Queensbury 0.6% 6 0.0% 0 0.0% 0 0.0% 0 0.0% 0 0.0% 0 0.0% 0 0.0% 0 0.7% 1 4.5% 5 0.0% 0Rayners Lane 1.1% 11 0.0% 0 0.0% 0 0.9% 1 0.0% 0 5.5% 9 0.0% 0 0.0% 0 0.7% 1 0.0% 0 0.0% 0Richmond, Surrey 0.1% 1 1.8% 1 0.0% 0 0.0% 0 0.0% 0 0.0% 0 0.0% 0 0.0% 0 0.0% 0 0.0% 0 0.0% 0Rickmansworth 0.1% 1 1.8% 1 0.0% 0 0.0% 0 0.0% 0 0.0% 0 0.0% 0 0.0% 0 0.0% 0 0.0% 0 0.0% 0Ruislip 3.6% 36 1.8% 1 64.0% 16 16.5% 19 0.0% 0 0.0% 0 0.0% 0 0.0% 0 0.0% 0 0.0% 0 0.0% 0Scotland 0.1% 1 0.0% 0 0.0% 0 0.0% 0 0.0% 0 0.0% 0 0.0% 0 0.0% 0 0.7% 1 0.0% 0 0.0% 0South Harrow 3.3% 33 0.0% 0 0.0% 0 0.9% 1 0.0% 0 17.0% 28 2.1% 3 0.8% 1 0.0% 0 0.0% 0 0.0% 0
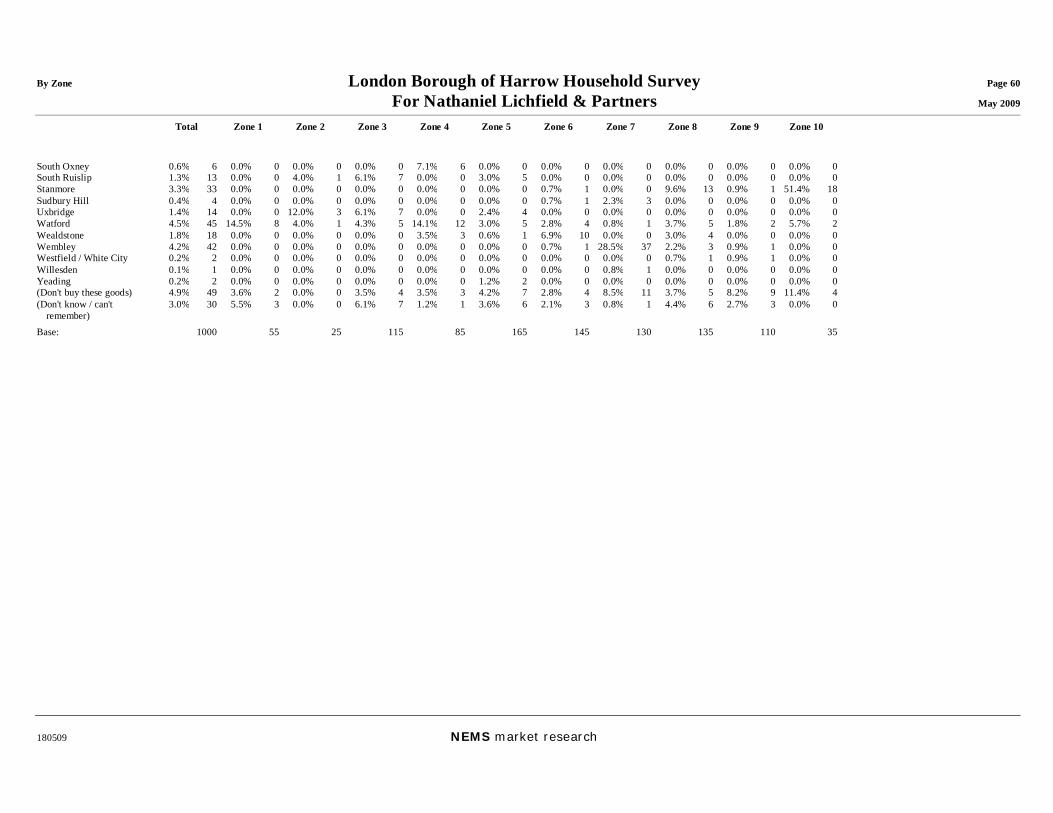
By Zone London Borough of Harrow Household Survey Page 60 For Nathaniel Lichfield & Partners May 2009
Total Zone 1 Zone 2 Zone 3 Zone 4 Zone 5 Zone 6 Zone 7 Zone 8 Zone 9 Zone 10
180509 NEMS market research
South Oxney 0.6% 6 0.0% 0 0.0% 0 0.0% 0 7.1% 6 0.0% 0 0.0% 0 0.0% 0 0.0% 0 0.0% 0 0.0% 0South Ruislip 1.3% 13 0.0% 0 4.0% 1 6.1% 7 0.0% 0 3.0% 5 0.0% 0 0.0% 0 0.0% 0 0.0% 0 0.0% 0Stanmore 3.3% 33 0.0% 0 0.0% 0 0.0% 0 0.0% 0 0.0% 0 0.7% 1 0.0% 0 9.6% 13 0.9% 1 51.4% 18Sudbury Hill 0.4% 4 0.0% 0 0.0% 0 0.0% 0 0.0% 0 0.0% 0 0.7% 1 2.3% 3 0.0% 0 0.0% 0 0.0% 0Uxbridge 1.4% 14 0.0% 0 12.0% 3 6.1% 7 0.0% 0 2.4% 4 0.0% 0 0.0% 0 0.0% 0 0.0% 0 0.0% 0Watford 4.5% 45 14.5% 8 4.0% 1 4.3% 5 14.1% 12 3.0% 5 2.8% 4 0.8% 1 3.7% 5 1.8% 2 5.7% 2Wealdstone 1.8% 18 0.0% 0 0.0% 0 0.0% 0 3.5% 3 0.6% 1 6.9% 10 0.0% 0 3.0% 4 0.0% 0 0.0% 0Wembley 4.2% 42 0.0% 0 0.0% 0 0.0% 0 0.0% 0 0.0% 0 0.7% 1 28.5% 37 2.2% 3 0.9% 1 0.0% 0Westfield / White City 0.2% 2 0.0% 0 0.0% 0 0.0% 0 0.0% 0 0.0% 0 0.0% 0 0.0% 0 0.7% 1 0.9% 1 0.0% 0Willesden 0.1% 1 0.0% 0 0.0% 0 0.0% 0 0.0% 0 0.0% 0 0.0% 0 0.8% 1 0.0% 0 0.0% 0 0.0% 0Yeading 0.2% 2 0.0% 0 0.0% 0 0.0% 0 0.0% 0 1.2% 2 0.0% 0 0.0% 0 0.0% 0 0.0% 0 0.0% 0(Don't buy these goods) 4.9% 49 3.6% 2 0.0% 0 3.5% 4 3.5% 3 4.2% 7 2.8% 4 8.5% 11 3.7% 5 8.2% 9 11.4% 4(Don't know / can't
remember) 3.0% 30 5.5% 3 0.0% 0 6.1% 7 1.2% 1 3.6% 6 2.1% 3 0.8% 1 4.4% 6 2.7% 3 0.0% 0
Base: 1000 55 25 115 85 165 145 130 135 110 35
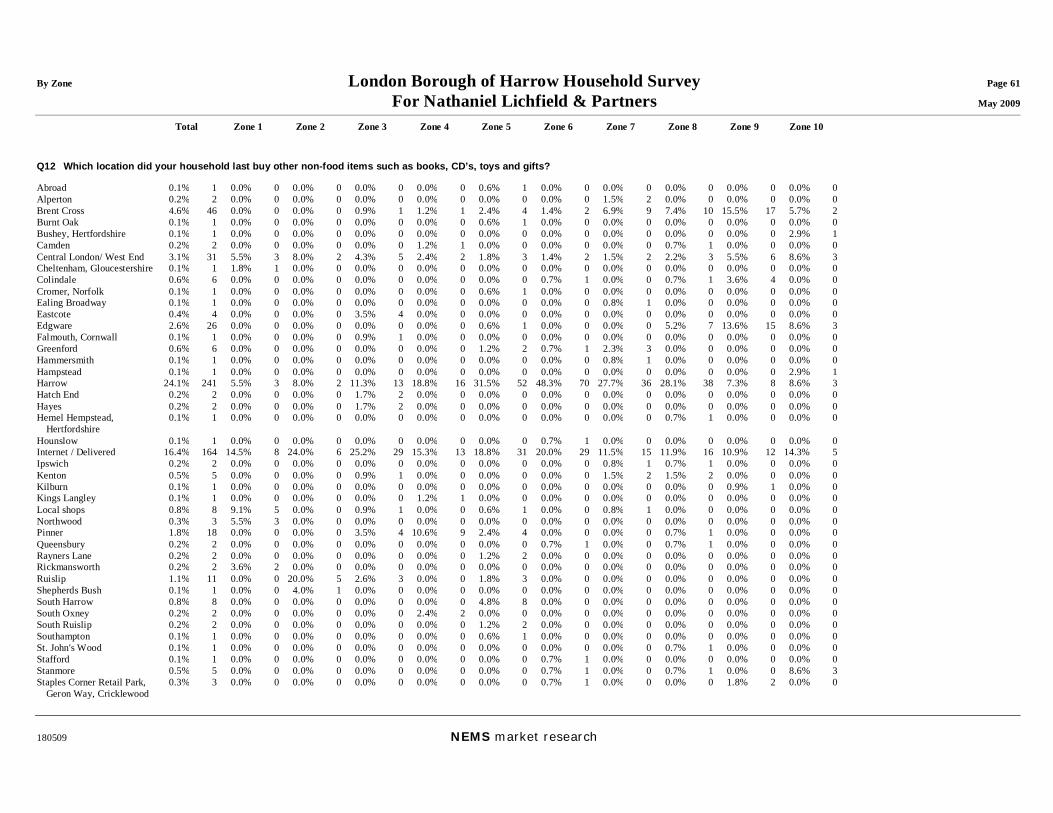
By Zone London Borough of Harrow Household Survey Page 61 For Nathaniel Lichfield & Partners May 2009
Total Zone 1 Zone 2 Zone 3 Zone 4 Zone 5 Zone 6 Zone 7 Zone 8 Zone 9 Zone 10
180509 NEMS market research
Q12 Which location did your household last buy other non-food items such as books, CD’s, toys and gifts? Abroad 0.1% 1 0.0% 0 0.0% 0 0.0% 0 0.0% 0 0.6% 1 0.0% 0 0.0% 0 0.0% 0 0.0% 0 0.0% 0Alperton 0.2% 2 0.0% 0 0.0% 0 0.0% 0 0.0% 0 0.0% 0 0.0% 0 1.5% 2 0.0% 0 0.0% 0 0.0% 0Brent Cross 4.6% 46 0.0% 0 0.0% 0 0.9% 1 1.2% 1 2.4% 4 1.4% 2 6.9% 9 7.4% 10 15.5% 17 5.7% 2Burnt Oak 0.1% 1 0.0% 0 0.0% 0 0.0% 0 0.0% 0 0.6% 1 0.0% 0 0.0% 0 0.0% 0 0.0% 0 0.0% 0Bushey, Hertfordshire 0.1% 1 0.0% 0 0.0% 0 0.0% 0 0.0% 0 0.0% 0 0.0% 0 0.0% 0 0.0% 0 0.0% 0 2.9% 1Camden 0.2% 2 0.0% 0 0.0% 0 0.0% 0 1.2% 1 0.0% 0 0.0% 0 0.0% 0 0.7% 1 0.0% 0 0.0% 0Central London/ West End 3.1% 31 5.5% 3 8.0% 2 4.3% 5 2.4% 2 1.8% 3 1.4% 2 1.5% 2 2.2% 3 5.5% 6 8.6% 3Cheltenham, Gloucestershire 0.1% 1 1.8% 1 0.0% 0 0.0% 0 0.0% 0 0.0% 0 0.0% 0 0.0% 0 0.0% 0 0.0% 0 0.0% 0Colindale 0.6% 6 0.0% 0 0.0% 0 0.0% 0 0.0% 0 0.0% 0 0.7% 1 0.0% 0 0.7% 1 3.6% 4 0.0% 0Cromer, Norfolk 0.1% 1 0.0% 0 0.0% 0 0.0% 0 0.0% 0 0.6% 1 0.0% 0 0.0% 0 0.0% 0 0.0% 0 0.0% 0Ealing Broadway 0.1% 1 0.0% 0 0.0% 0 0.0% 0 0.0% 0 0.0% 0 0.0% 0 0.8% 1 0.0% 0 0.0% 0 0.0% 0Eastcote 0.4% 4 0.0% 0 0.0% 0 3.5% 4 0.0% 0 0.0% 0 0.0% 0 0.0% 0 0.0% 0 0.0% 0 0.0% 0Edgware 2.6% 26 0.0% 0 0.0% 0 0.0% 0 0.0% 0 0.6% 1 0.0% 0 0.0% 0 5.2% 7 13.6% 15 8.6% 3Falmouth, Cornwall 0.1% 1 0.0% 0 0.0% 0 0.9% 1 0.0% 0 0.0% 0 0.0% 0 0.0% 0 0.0% 0 0.0% 0 0.0% 0Greenford 0.6% 6 0.0% 0 0.0% 0 0.0% 0 0.0% 0 1.2% 2 0.7% 1 2.3% 3 0.0% 0 0.0% 0 0.0% 0Hammersmith 0.1% 1 0.0% 0 0.0% 0 0.0% 0 0.0% 0 0.0% 0 0.0% 0 0.8% 1 0.0% 0 0.0% 0 0.0% 0Hampstead 0.1% 1 0.0% 0 0.0% 0 0.0% 0 0.0% 0 0.0% 0 0.0% 0 0.0% 0 0.0% 0 0.0% 0 2.9% 1Harrow 24.1% 241 5.5% 3 8.0% 2 11.3% 13 18.8% 16 31.5% 52 48.3% 70 27.7% 36 28.1% 38 7.3% 8 8.6% 3Hatch End 0.2% 2 0.0% 0 0.0% 0 1.7% 2 0.0% 0 0.0% 0 0.0% 0 0.0% 0 0.0% 0 0.0% 0 0.0% 0Hayes 0.2% 2 0.0% 0 0.0% 0 1.7% 2 0.0% 0 0.0% 0 0.0% 0 0.0% 0 0.0% 0 0.0% 0 0.0% 0Hemel Hempstead,
Hertfordshire 0.1% 1 0.0% 0 0.0% 0 0.0% 0 0.0% 0 0.0% 0 0.0% 0 0.0% 0 0.7% 1 0.0% 0 0.0% 0
Hounslow 0.1% 1 0.0% 0 0.0% 0 0.0% 0 0.0% 0 0.0% 0 0.7% 1 0.0% 0 0.0% 0 0.0% 0 0.0% 0Internet / Delivered 16.4% 164 14.5% 8 24.0% 6 25.2% 29 15.3% 13 18.8% 31 20.0% 29 11.5% 15 11.9% 16 10.9% 12 14.3% 5Ipswich 0.2% 2 0.0% 0 0.0% 0 0.0% 0 0.0% 0 0.0% 0 0.0% 0 0.8% 1 0.7% 1 0.0% 0 0.0% 0Kenton 0.5% 5 0.0% 0 0.0% 0 0.9% 1 0.0% 0 0.0% 0 0.0% 0 1.5% 2 1.5% 2 0.0% 0 0.0% 0Kilburn 0.1% 1 0.0% 0 0.0% 0 0.0% 0 0.0% 0 0.0% 0 0.0% 0 0.0% 0 0.0% 0 0.9% 1 0.0% 0Kings Langley 0.1% 1 0.0% 0 0.0% 0 0.0% 0 1.2% 1 0.0% 0 0.0% 0 0.0% 0 0.0% 0 0.0% 0 0.0% 0Local shops 0.8% 8 9.1% 5 0.0% 0 0.9% 1 0.0% 0 0.6% 1 0.0% 0 0.8% 1 0.0% 0 0.0% 0 0.0% 0Northwood 0.3% 3 5.5% 3 0.0% 0 0.0% 0 0.0% 0 0.0% 0 0.0% 0 0.0% 0 0.0% 0 0.0% 0 0.0% 0Pinner 1.8% 18 0.0% 0 0.0% 0 3.5% 4 10.6% 9 2.4% 4 0.0% 0 0.0% 0 0.7% 1 0.0% 0 0.0% 0Queensbury 0.2% 2 0.0% 0 0.0% 0 0.0% 0 0.0% 0 0.0% 0 0.7% 1 0.0% 0 0.7% 1 0.0% 0 0.0% 0Rayners Lane 0.2% 2 0.0% 0 0.0% 0 0.0% 0 0.0% 0 1.2% 2 0.0% 0 0.0% 0 0.0% 0 0.0% 0 0.0% 0Rickmansworth 0.2% 2 3.6% 2 0.0% 0 0.0% 0 0.0% 0 0.0% 0 0.0% 0 0.0% 0 0.0% 0 0.0% 0 0.0% 0Ruislip 1.1% 11 0.0% 0 20.0% 5 2.6% 3 0.0% 0 1.8% 3 0.0% 0 0.0% 0 0.0% 0 0.0% 0 0.0% 0Shepherds Bush 0.1% 1 0.0% 0 4.0% 1 0.0% 0 0.0% 0 0.0% 0 0.0% 0 0.0% 0 0.0% 0 0.0% 0 0.0% 0South Harrow 0.8% 8 0.0% 0 0.0% 0 0.0% 0 0.0% 0 4.8% 8 0.0% 0 0.0% 0 0.0% 0 0.0% 0 0.0% 0South Oxney 0.2% 2 0.0% 0 0.0% 0 0.0% 0 2.4% 2 0.0% 0 0.0% 0 0.0% 0 0.0% 0 0.0% 0 0.0% 0South Ruislip 0.2% 2 0.0% 0 0.0% 0 0.0% 0 0.0% 0 1.2% 2 0.0% 0 0.0% 0 0.0% 0 0.0% 0 0.0% 0Southampton 0.1% 1 0.0% 0 0.0% 0 0.0% 0 0.0% 0 0.6% 1 0.0% 0 0.0% 0 0.0% 0 0.0% 0 0.0% 0St. John's Wood 0.1% 1 0.0% 0 0.0% 0 0.0% 0 0.0% 0 0.0% 0 0.0% 0 0.0% 0 0.7% 1 0.0% 0 0.0% 0Stafford 0.1% 1 0.0% 0 0.0% 0 0.0% 0 0.0% 0 0.0% 0 0.7% 1 0.0% 0 0.0% 0 0.0% 0 0.0% 0Stanmore 0.5% 5 0.0% 0 0.0% 0 0.0% 0 0.0% 0 0.0% 0 0.7% 1 0.0% 0 0.7% 1 0.0% 0 8.6% 3Staples Corner Retail Park,
Geron Way, Cricklewood 0.3% 3 0.0% 0 0.0% 0 0.0% 0 0.0% 0 0.0% 0 0.7% 1 0.0% 0 0.0% 0 1.8% 2 0.0% 0
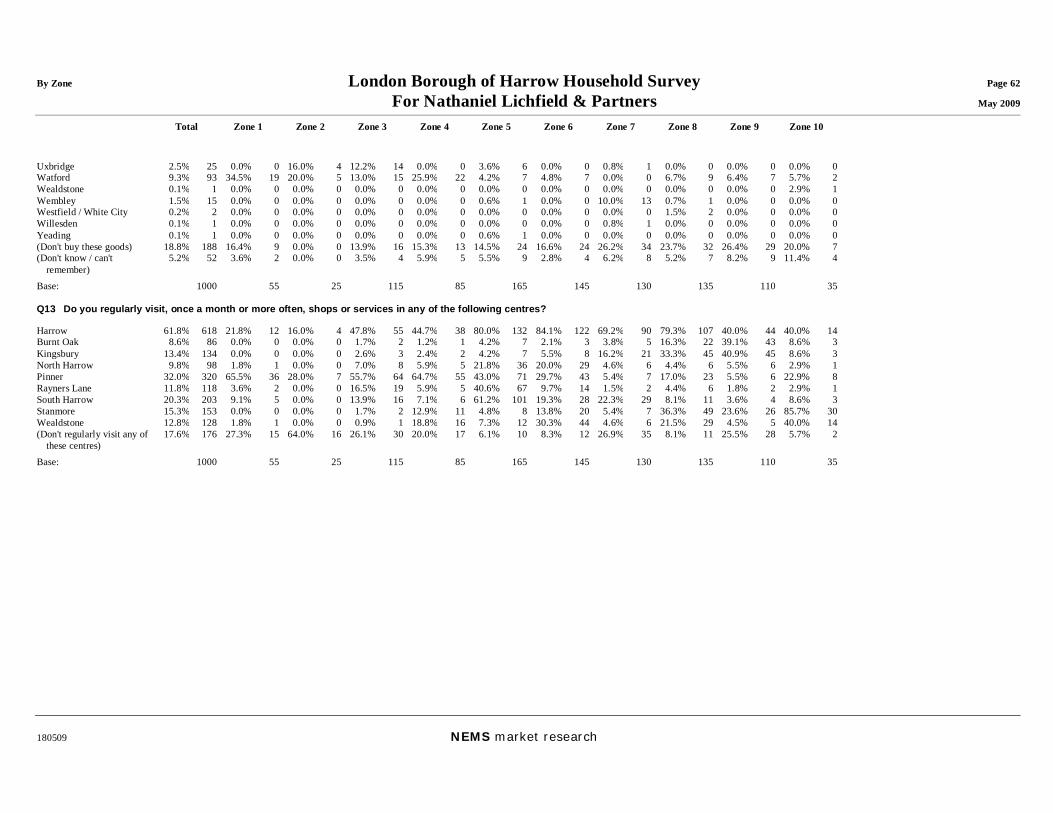
By Zone London Borough of Harrow Household Survey Page 62 For Nathaniel Lichfield & Partners May 2009
Total Zone 1 Zone 2 Zone 3 Zone 4 Zone 5 Zone 6 Zone 7 Zone 8 Zone 9 Zone 10
180509 NEMS market research
Uxbridge 2.5% 25 0.0% 0 16.0% 4 12.2% 14 0.0% 0 3.6% 6 0.0% 0 0.8% 1 0.0% 0 0.0% 0 0.0% 0Watford 9.3% 93 34.5% 19 20.0% 5 13.0% 15 25.9% 22 4.2% 7 4.8% 7 0.0% 0 6.7% 9 6.4% 7 5.7% 2Wealdstone 0.1% 1 0.0% 0 0.0% 0 0.0% 0 0.0% 0 0.0% 0 0.0% 0 0.0% 0 0.0% 0 0.0% 0 2.9% 1Wembley 1.5% 15 0.0% 0 0.0% 0 0.0% 0 0.0% 0 0.6% 1 0.0% 0 10.0% 13 0.7% 1 0.0% 0 0.0% 0Westfield / White City 0.2% 2 0.0% 0 0.0% 0 0.0% 0 0.0% 0 0.0% 0 0.0% 0 0.0% 0 1.5% 2 0.0% 0 0.0% 0Willesden 0.1% 1 0.0% 0 0.0% 0 0.0% 0 0.0% 0 0.0% 0 0.0% 0 0.8% 1 0.0% 0 0.0% 0 0.0% 0Yeading 0.1% 1 0.0% 0 0.0% 0 0.0% 0 0.0% 0 0.6% 1 0.0% 0 0.0% 0 0.0% 0 0.0% 0 0.0% 0(Don't buy these goods) 18.8% 188 16.4% 9 0.0% 0 13.9% 16 15.3% 13 14.5% 24 16.6% 24 26.2% 34 23.7% 32 26.4% 29 20.0% 7(Don't know / can't
remember) 5.2% 52 3.6% 2 0.0% 0 3.5% 4 5.9% 5 5.5% 9 2.8% 4 6.2% 8 5.2% 7 8.2% 9 11.4% 4
Base: 1000 55 25 115 85 165 145 130 135 110 35 Q13 Do you regularly visit, once a month or more often, shops or services in any of the following centres? Harrow 61.8% 618 21.8% 12 16.0% 4 47.8% 55 44.7% 38 80.0% 132 84.1% 122 69.2% 90 79.3% 107 40.0% 44 40.0% 14Burnt Oak 8.6% 86 0.0% 0 0.0% 0 1.7% 2 1.2% 1 4.2% 7 2.1% 3 3.8% 5 16.3% 22 39.1% 43 8.6% 3Kingsbury 13.4% 134 0.0% 0 0.0% 0 2.6% 3 2.4% 2 4.2% 7 5.5% 8 16.2% 21 33.3% 45 40.9% 45 8.6% 3North Harrow 9.8% 98 1.8% 1 0.0% 0 7.0% 8 5.9% 5 21.8% 36 20.0% 29 4.6% 6 4.4% 6 5.5% 6 2.9% 1Pinner 32.0% 320 65.5% 36 28.0% 7 55.7% 64 64.7% 55 43.0% 71 29.7% 43 5.4% 7 17.0% 23 5.5% 6 22.9% 8Rayners Lane 11.8% 118 3.6% 2 0.0% 0 16.5% 19 5.9% 5 40.6% 67 9.7% 14 1.5% 2 4.4% 6 1.8% 2 2.9% 1South Harrow 20.3% 203 9.1% 5 0.0% 0 13.9% 16 7.1% 6 61.2% 101 19.3% 28 22.3% 29 8.1% 11 3.6% 4 8.6% 3Stanmore 15.3% 153 0.0% 0 0.0% 0 1.7% 2 12.9% 11 4.8% 8 13.8% 20 5.4% 7 36.3% 49 23.6% 26 85.7% 30Wealdstone 12.8% 128 1.8% 1 0.0% 0 0.9% 1 18.8% 16 7.3% 12 30.3% 44 4.6% 6 21.5% 29 4.5% 5 40.0% 14(Don't regularly visit any of
these centres) 17.6% 176 27.3% 15 64.0% 16 26.1% 30 20.0% 17 6.1% 10 8.3% 12 26.9% 35 8.1% 11 25.5% 28 5.7% 2
Base: 1000 55 25 115 85 165 145 130 135 110 35

By Zone London Borough of Harrow Household Survey Page 63 For Nathaniel Lichfield & Partners May 2009
Total Zone 1 Zone 2 Zone 3 Zone 4 Zone 5 Zone 6 Zone 7 Zone 8 Zone 9 Zone 10
180509 NEMS market research
Q14 When you visit any of these centres for shopping which other services do you use? Those who regularly visit shops or services at the centres mentioned at Q13: Banks / Building societies 52.2% 430 25.0% 10 22.2% 2 36.5% 31 61.8% 42 52.9% 82 63.2% 84 50.5% 48 55.6% 69 51.2% 42 60.6% 20Betting shop 0.2% 2 0.0% 0 0.0% 0 0.0% 0 0.0% 0 0.0% 0 0.0% 0 0.0% 0 0.0% 0 2.4% 2 0.0% 0Café / restaurants 24.0% 198 32.5% 13 11.1% 1 29.4% 25 29.4% 20 21.9% 34 21.1% 28 22.1% 21 24.2% 30 22.0% 18 24.2% 8Estate agent 0.2% 2 0.0% 0 0.0% 0 0.0% 0 1.5% 1 0.0% 0 0.0% 0 0.0% 0 0.0% 0 1.2% 1 0.0% 0Health centre / Dentist /
Optician 8.0% 66 12.5% 5 0.0% 0 5.9% 5 19.1% 13 9.0% 14 12.8% 17 3.2% 3 4.0% 5 4.9% 4 0.0% 0
Library 7.9% 65 0.0% 0 11.1% 1 4.7% 4 10.3% 7 7.1% 11 9.8% 13 1.1% 1 13.7% 17 9.8% 8 9.1% 3Post office 19.8% 163 5.0% 2 22.2% 2 14.1% 12 30.9% 21 13.5% 21 24.8% 33 13.7% 13 29.8% 37 18.3% 15 21.2% 7Pubs/bars 1.8% 15 7.5% 3 0.0% 0 1.2% 1 1.5% 1 1.3% 2 2.3% 3 1.1% 1 1.6% 2 2.4% 2 0.0% 0Other 0.4% 3 0.0% 0 0.0% 0 0.0% 0 0.0% 0 0.6% 1 0.8% 1 0.0% 0 0.8% 1 0.0% 0 0.0% 0Leisure activities
(e.g,cinema, swimming etc.)
2.7% 22 2.5% 1 0.0% 0 5.9% 5 1.5% 1 3.2% 5 0.8% 1 4.2% 4 2.4% 3 1.2% 1 3.0% 1
Dry cleaners / launderette 0.5% 4 5.0% 2 0.0% 0 0.0% 0 0.0% 0 0.0% 0 0.0% 0 0.0% 0 0.0% 0 2.4% 2 0.0% 0Hairdressers / beauty salon 1.5% 12 2.5% 1 0.0% 0 0.0% 0 1.5% 1 3.2% 5 1.5% 2 0.0% 0 0.8% 1 2.4% 2 0.0% 0Petrol station 1.0% 8 0.0% 0 0.0% 0 3.5% 3 0.0% 0 0.0% 0 0.8% 1 0.0% 0 0.0% 0 1.2% 1 9.1% 3(Don't know / can't
remember) 22.3% 184 25.0% 10 22.2% 2 30.6% 26 25.0% 17 21.3% 33 18.8% 25 29.5% 28 14.5% 18 20.7% 17 24.2% 8
(Nothing else / only shopping)
3.2% 26 15.0% 6 22.2% 2 5.9% 5 0.0% 0 3.9% 6 0.8% 1 1.1% 1 3.2% 4 1.2% 1 0.0% 0
Base: 824 40 9 85 68 155 133 95 124 82 33

By Zone London Borough of Harrow Household Survey Page 64 For Nathaniel Lichfield & Partners May 2009
Total Zone 1 Zone 2 Zone 3 Zone 4 Zone 5 Zone 6 Zone 7 Zone 8 Zone 9 Zone 10
180509 NEMS market research
Q15 What if anything would make you shop more often in Harrow town centre? Those who regularly visit shops or services at the centres mentioned at Q13: Better accessibility (i.e.
improve traffic flow / public transport links)
0.7% 6 2.5% 1 0.0% 0 1.2% 1 1.5% 1 0.0% 0 0.0% 0 2.1% 2 0.0% 0 1.2% 1 0.0% 0
Better choice of cafes / restaurants
1.0% 8 0.0% 0 0.0% 0 1.2% 1 0.0% 0 1.3% 2 3.0% 4 1.1% 1 0.0% 0 0.0% 0 0.0% 0
Better choice of clothing shops
3.3% 27 0.0% 0 0.0% 0 1.2% 1 7.4% 5 3.9% 6 3.8% 5 4.2% 4 3.2% 4 2.4% 2 0.0% 0
Better choice of shops in general
11.0% 91 0.0% 0 11.1% 1 10.6% 9 8.8% 6 14.2% 22 16.5% 22 8.4% 8 12.9% 16 7.3% 6 3.0% 1
Better choice of specialist shops (e.g. craft shops, haberdashers etc.)
1.0% 8 0.0% 0 0.0% 0 0.0% 0 0.0% 0 0.6% 1 3.8% 5 0.0% 0 1.6% 2 0.0% 0 0.0% 0
Better leisure facilities (e.g. Cinema)
0.5% 4 0.0% 0 0.0% 0 0.0% 0 0.0% 0 0.6% 1 0.8% 1 1.1% 1 0.8% 1 0.0% 0 0.0% 0
Better maintenance / cleanliness
5.9% 49 5.0% 2 0.0% 0 9.4% 8 14.7% 10 5.2% 8 5.3% 7 1.1% 1 8.1% 10 1.2% 1 6.1% 2
Better quality shops 3.8% 31 5.0% 2 0.0% 0 3.5% 3 7.4% 5 1.9% 3 5.3% 7 2.1% 2 6.5% 8 1.2% 1 0.0% 0Better safety / More police /
CCTV 4.1% 34 7.5% 3 0.0% 0 4.7% 4 7.4% 5 3.2% 5 2.3% 3 1.1% 1 4.0% 5 7.3% 6 6.1% 2
Better street market 0.5% 4 0.0% 0 0.0% 0 0.0% 0 2.9% 2 0.6% 1 0.0% 0 0.0% 0 0.8% 1 0.0% 0 0.0% 0Cheaper / free car parking 8.0% 66 7.5% 3 11.1% 1 9.4% 8 0.0% 0 7.1% 11 3.0% 4 11.6% 11 13.7% 17 8.5% 7 12.1% 4Escalator or lift at the tube
station 0.1% 1 0.0% 0 0.0% 0 0.0% 0 0.0% 0 0.0% 0 0.0% 0 0.0% 0 0.8% 1 0.0% 0 0.0% 0
Improve the appearance / atmosphere
0.4% 3 0.0% 0 0.0% 0 1.2% 1 0.0% 0 0.0% 0 0.8% 1 0.0% 0 0.8% 1 0.0% 0 0.0% 0
Improved bus services 1.7% 14 0.0% 0 0.0% 0 1.2% 1 0.0% 0 1.3% 2 0.8% 1 3.2% 3 1.6% 2 4.9% 4 3.0% 1Indoor shopping centre 0.2% 2 0.0% 0 0.0% 0 0.0% 0 0.0% 0 0.0% 0 1.5% 2 0.0% 0 0.0% 0 0.0% 0 0.0% 0Less busy 0.2% 2 0.0% 0 0.0% 0 0.0% 0 0.0% 0 0.0% 0 1.5% 2 0.0% 0 0.0% 0 0.0% 0 0.0% 0Less food shops 0.1% 1 0.0% 0 0.0% 0 0.0% 0 0.0% 0 0.6% 1 0.0% 0 0.0% 0 0.0% 0 0.0% 0 0.0% 0Longer opening hours / late-
night shopping 0.4% 3 0.0% 0 0.0% 0 1.2% 1 0.0% 0 0.0% 0 0.8% 1 0.0% 0 0.8% 1 0.0% 0 0.0% 0
Lower prices / cheaper stores 0.2% 2 0.0% 0 0.0% 0 0.0% 0 0.0% 0 0.0% 0 1.5% 2 0.0% 0 0.0% 0 0.0% 0 0.0% 0More / better public toilet
facilities 0.2% 2 0.0% 0 0.0% 0 0.0% 0 0.0% 0 0.0% 0 0.8% 1 0.0% 0 0.8% 1 0.0% 0 0.0% 0
More bicycle-friendly 0.2% 2 0.0% 0 0.0% 0 1.2% 1 0.0% 0 0.6% 1 0.0% 0 0.0% 0 0.0% 0 0.0% 0 0.0% 0More car parking 6.7% 55 5.0% 2 11.1% 1 7.1% 6 8.8% 6 3.2% 5 3.0% 4 8.4% 8 8.1% 10 12.2% 10 9.1% 3More cost effective produce 0.5% 4 2.5% 1 0.0% 0 1.2% 1 0.0% 0 0.6% 1 0.0% 0 1.1% 1 0.0% 0 0.0% 0 0.0% 0More disabled parking
spaces 0.2% 2 0.0% 0 0.0% 0 0.0% 0 0.0% 0 0.0% 0 0.0% 0 0.0% 0 0.0% 0 2.4% 2 0.0% 0
More food supermarkets 2.1% 17 0.0% 0 0.0% 0 1.2% 1 1.5% 1 3.2% 5 3.8% 5 1.1% 1 1.6% 2 2.4% 2 0.0% 0More large shops 3.5% 29 2.5% 1 0.0% 0 3.5% 3 5.9% 4 3.2% 5 9.0% 12 2.1% 2 0.8% 1 0.0% 0 3.0% 1More seating / street
furniture 0.4% 3 0.0% 0 0.0% 0 0.0% 0 0.0% 0 0.0% 0 0.8% 1 0.0% 0 0.8% 1 1.2% 1 0.0% 0
More traffic free areas / 0.5% 4 0.0% 0 0.0% 0 0.0% 0 1.5% 1 0.6% 1 0.0% 0 0.0% 0 0.8% 1 1.2% 1 0.0% 0
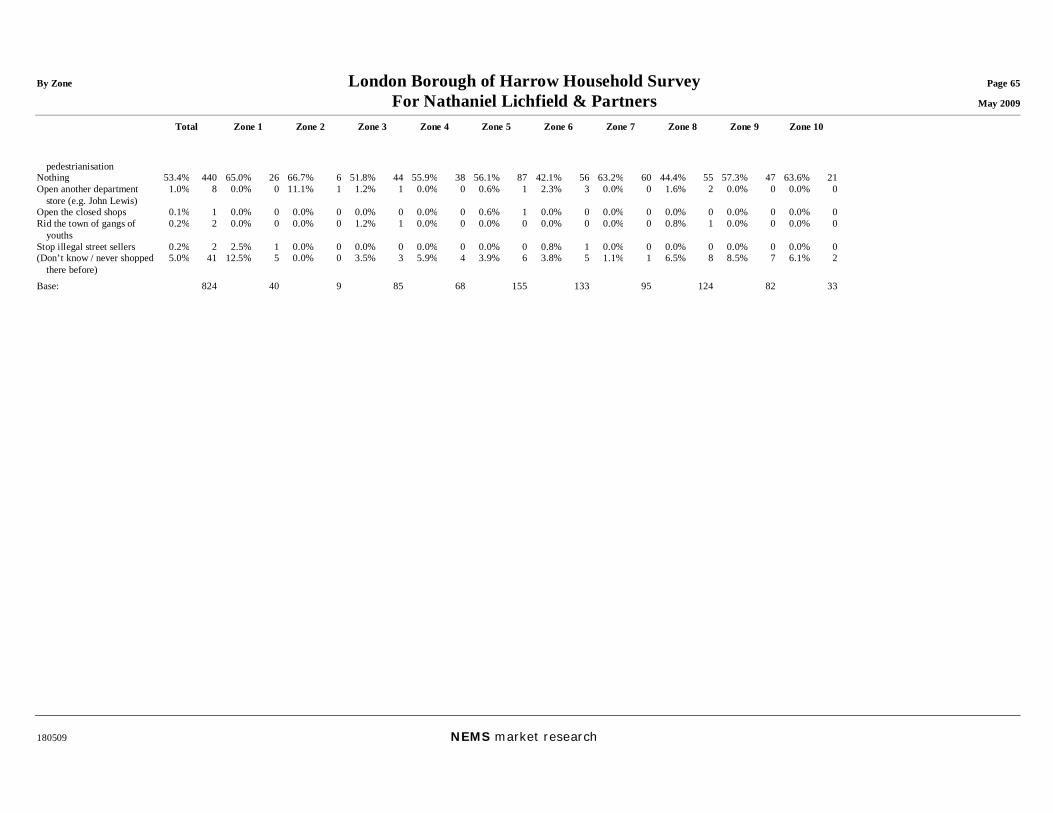
By Zone London Borough of Harrow Household Survey Page 65 For Nathaniel Lichfield & Partners May 2009
Total Zone 1 Zone 2 Zone 3 Zone 4 Zone 5 Zone 6 Zone 7 Zone 8 Zone 9 Zone 10
180509 NEMS market research
pedestrianisation Nothing 53.4% 440 65.0% 26 66.7% 6 51.8% 44 55.9% 38 56.1% 87 42.1% 56 63.2% 60 44.4% 55 57.3% 47 63.6% 21Open another department
store (e.g. John Lewis) 1.0% 8 0.0% 0 11.1% 1 1.2% 1 0.0% 0 0.6% 1 2.3% 3 0.0% 0 1.6% 2 0.0% 0 0.0% 0
Open the closed shops 0.1% 1 0.0% 0 0.0% 0 0.0% 0 0.0% 0 0.6% 1 0.0% 0 0.0% 0 0.0% 0 0.0% 0 0.0% 0Rid the town of gangs of
youths 0.2% 2 0.0% 0 0.0% 0 1.2% 1 0.0% 0 0.0% 0 0.0% 0 0.0% 0 0.8% 1 0.0% 0 0.0% 0
Stop illegal street sellers 0.2% 2 2.5% 1 0.0% 0 0.0% 0 0.0% 0 0.0% 0 0.8% 1 0.0% 0 0.0% 0 0.0% 0 0.0% 0(Don’t know / never shopped
there before) 5.0% 41 12.5% 5 0.0% 0 3.5% 3 5.9% 4 3.9% 6 3.8% 5 1.1% 1 6.5% 8 8.5% 7 6.1% 2
Base: 824 40 9 85 68 155 133 95 124 82 33

By Zone London Borough of Harrow Household Survey Page 66 For Nathaniel Lichfield & Partners May 2009
Total Zone 1 Zone 2 Zone 3 Zone 4 Zone 5 Zone 6 Zone 7 Zone 8 Zone 9 Zone 10
180509 NEMS market research
Q16 What if anything would make you shop more often in Burnt Oak? Those who regularly visit shops or services at the centres mentioned at Q13: Better accessibility (i.e.
improve traffic flow / public transport links)
0.2% 2 0.0% 0 0.0% 0 1.2% 1 0.0% 0 0.0% 0 0.8% 1 0.0% 0 0.0% 0 0.0% 0 0.0% 0
Better choice of clothing shops
1.0% 8 0.0% 0 0.0% 0 0.0% 0 0.0% 0 0.6% 1 0.0% 0 0.0% 0 1.6% 2 6.1% 5 0.0% 0
Better choice of shops in general
3.2% 26 0.0% 0 0.0% 0 0.0% 0 0.0% 0 0.6% 1 0.0% 0 4.2% 4 6.5% 8 13.4% 11 6.1% 2
Better choice of specialist shops (e.g. craft shops, haberdashers etc.)
0.1% 1 0.0% 0 0.0% 0 0.0% 0 0.0% 0 0.6% 1 0.0% 0 0.0% 0 0.0% 0 0.0% 0 0.0% 0
Better maintenance / cleanliness
1.5% 12 0.0% 0 0.0% 0 0.0% 0 0.0% 0 0.6% 1 0.0% 0 1.1% 1 4.0% 5 6.1% 5 0.0% 0
Better quality shops 0.4% 3 0.0% 0 0.0% 0 0.0% 0 0.0% 0 0.0% 0 0.0% 0 0.0% 0 0.0% 0 3.7% 3 0.0% 0Better safety / More police /
CCTV 0.2% 2 0.0% 0 0.0% 0 0.0% 0 0.0% 0 0.0% 0 0.0% 0 0.0% 0 0.8% 1 1.2% 1 0.0% 0
Cheaper car parking 0.6% 5 0.0% 0 0.0% 0 1.2% 1 1.5% 1 0.0% 0 0.0% 0 1.1% 1 0.0% 0 2.4% 2 0.0% 0Improve the appearance /
atmosphere 0.1% 1 0.0% 0 0.0% 0 0.0% 0 0.0% 0 0.0% 0 0.0% 0 0.0% 0 0.0% 0 1.2% 1 0.0% 0
Improved bus services 0.4% 3 0.0% 0 0.0% 0 0.0% 0 0.0% 0 0.6% 1 0.0% 0 0.0% 0 0.8% 1 1.2% 1 0.0% 0Less ethnic food stores 0.1% 1 0.0% 0 0.0% 0 0.0% 0 0.0% 0 0.0% 0 0.0% 0 0.0% 0 0.8% 1 0.0% 0 0.0% 0Longer opening hours / late-
night shopping 0.1% 1 0.0% 0 0.0% 0 0.0% 0 0.0% 0 0.0% 0 0.0% 0 0.0% 0 0.0% 0 1.2% 1 0.0% 0
More car parking 2.7% 22 0.0% 0 0.0% 0 1.2% 1 2.9% 2 0.0% 0 0.0% 0 1.1% 1 8.9% 11 6.1% 5 6.1% 2More chinese restaurants 0.1% 1 0.0% 0 0.0% 0 0.0% 0 0.0% 0 0.6% 1 0.0% 0 0.0% 0 0.0% 0 0.0% 0 0.0% 0More food supermarkets 0.2% 2 0.0% 0 0.0% 0 0.0% 0 0.0% 0 0.0% 0 0.0% 0 0.0% 0 0.0% 0 2.4% 2 0.0% 0More traffic free areas /
pedestrianisation 0.5% 4 0.0% 0 0.0% 0 2.4% 2 0.0% 0 0.0% 0 0.0% 0 0.0% 0 0.0% 0 2.4% 2 0.0% 0
Nothing 47.7% 393 47.5% 19 55.6% 5 42.4% 36 47.1% 32 50.3% 78 51.1% 68 48.4% 46 41.9% 52 42.7% 35 66.7% 22(Don’t know / never shopped
there before) 44.2% 364 52.5% 21 44.4% 4 55.3% 47 51.5% 35 45.8% 71 48.1% 64 45.3% 43 42.7% 53 23.2% 19 21.2% 7
Base: 824 40 9 85 68 155 133 95 124 82 33

By Zone London Borough of Harrow Household Survey Page 67 For Nathaniel Lichfield & Partners May 2009
Total Zone 1 Zone 2 Zone 3 Zone 4 Zone 5 Zone 6 Zone 7 Zone 8 Zone 9 Zone 10
180509 NEMS market research
Q17 What if anything would make you shop more often in Kingsbury? Those who regularly visit shops or services at the centres mentioned at Q13: Better accessibility (i.e.
improve traffic flow / public transport links)
0.9% 7 0.0% 0 0.0% 0 1.2% 1 0.0% 0 0.0% 0 0.8% 1 1.1% 1 3.2% 4 0.0% 0 0.0% 0
Better choice of clothing shops
1.2% 10 0.0% 0 0.0% 0 1.2% 1 0.0% 0 0.6% 1 0.0% 0 0.0% 0 4.0% 5 3.7% 3 0.0% 0
Better choice of shops in general
5.5% 45 0.0% 0 0.0% 0 0.0% 0 1.5% 1 1.3% 2 2.3% 3 5.3% 5 18.5% 23 11.0% 9 6.1% 2
Better choice of specialist shops (e.g. craft shops, haberdashers etc.)
0.2% 2 0.0% 0 0.0% 0 1.2% 1 0.0% 0 0.6% 1 0.0% 0 0.0% 0 0.0% 0 0.0% 0 0.0% 0
Better maintenance / cleanliness
1.1% 9 0.0% 0 0.0% 0 0.0% 0 0.0% 0 0.6% 1 0.8% 1 0.0% 0 4.8% 6 1.2% 1 0.0% 0
Better quality shops 1.1% 9 0.0% 0 0.0% 0 0.0% 0 0.0% 0 0.0% 0 0.0% 0 2.1% 2 3.2% 4 3.7% 3 0.0% 0Better safety / More police /
CCTV 0.2% 2 0.0% 0 0.0% 0 0.0% 0 0.0% 0 0.0% 0 0.8% 1 0.0% 0 0.0% 0 1.2% 1 0.0% 0
Cheaper car parking 1.2% 10 0.0% 0 0.0% 0 1.2% 1 2.9% 2 0.0% 0 0.8% 1 0.0% 0 2.4% 3 3.7% 3 0.0% 0Improve the appearance /
atmosphere 0.1% 1 0.0% 0 0.0% 0 0.0% 0 0.0% 0 0.0% 0 0.0% 0 0.0% 0 0.0% 0 1.2% 1 0.0% 0
Improved bus services 0.7% 6 0.0% 0 0.0% 0 0.0% 0 0.0% 0 0.0% 0 0.8% 1 2.1% 2 0.8% 1 1.2% 1 3.0% 1Less Asian shops 0.1% 1 0.0% 0 0.0% 0 0.0% 0 0.0% 0 0.0% 0 0.0% 0 0.0% 0 0.0% 0 1.2% 1 0.0% 0More car parking 3.4% 28 0.0% 0 0.0% 0 1.2% 1 4.4% 3 0.6% 1 1.5% 2 1.1% 1 8.9% 11 8.5% 7 6.1% 2More food supermarkets 0.9% 7 0.0% 0 0.0% 0 0.0% 0 0.0% 0 0.0% 0 0.0% 0 2.1% 2 1.6% 2 2.4% 2 3.0% 1More large shops 0.6% 5 0.0% 0 0.0% 0 0.0% 0 0.0% 0 0.0% 0 0.0% 0 2.1% 2 1.6% 2 1.2% 1 0.0% 0More seating / street
furniture 0.2% 2 0.0% 0 0.0% 0 0.0% 0 0.0% 0 0.0% 0 0.8% 1 0.0% 0 0.8% 1 0.0% 0 0.0% 0
More traffic free areas / pedestrianisation
1.1% 9 0.0% 0 0.0% 0 0.0% 0 0.0% 0 0.0% 0 0.8% 1 1.1% 1 2.4% 3 3.7% 3 3.0% 1
Nothing 49.6% 409 57.5% 23 66.7% 6 43.5% 37 52.9% 36 54.2% 84 54.9% 73 46.3% 44 37.9% 47 50.0% 41 54.5% 18(Don’t know / never shopped
there before) 37.0% 305 42.5% 17 33.3% 3 54.1% 46 42.6% 29 43.2% 67 38.3% 51 40.0% 38 23.4% 29 19.5% 16 27.3% 9
Base: 824 40 9 85 68 155 133 95 124 82 33

By Zone London Borough of Harrow Household Survey Page 68 For Nathaniel Lichfield & Partners May 2009
Total Zone 1 Zone 2 Zone 3 Zone 4 Zone 5 Zone 6 Zone 7 Zone 8 Zone 9 Zone 10
180509 NEMS market research
Q18 What if anything would make you shop more often in North Harrow? Those who regularly visit shops or services at the centres mentioned at Q13: Better accessibility (i.e.
improve traffic flow / public transport links)
0.4% 3 0.0% 0 0.0% 0 0.0% 0 0.0% 0 0.6% 1 0.8% 1 0.0% 0 0.8% 1 0.0% 0 0.0% 0
Better choice of cafes / restaurants
0.1% 1 0.0% 0 0.0% 0 0.0% 0 0.0% 0 0.0% 0 0.8% 1 0.0% 0 0.0% 0 0.0% 0 0.0% 0
Better choice of clothing shops
1.5% 12 0.0% 0 0.0% 0 1.2% 1 1.5% 1 5.2% 8 0.8% 1 0.0% 0 0.8% 1 0.0% 0 0.0% 0
Better choice of shops in general
6.4% 53 7.5% 3 0.0% 0 4.7% 4 7.4% 5 13.5% 21 6.0% 8 5.3% 5 5.6% 7 0.0% 0 0.0% 0
Better maintenance / cleanliness
0.1% 1 0.0% 0 0.0% 0 0.0% 0 0.0% 0 0.0% 0 0.0% 0 0.0% 0 0.8% 1 0.0% 0 0.0% 0
Better quality shops 1.1% 9 0.0% 0 0.0% 0 0.0% 0 1.5% 1 2.6% 4 1.5% 2 1.1% 1 0.0% 0 1.2% 1 0.0% 0Better safety / More police /
CCTV 0.4% 3 2.5% 1 0.0% 0 0.0% 0 0.0% 0 0.6% 1 0.0% 0 0.0% 0 0.8% 1 0.0% 0 0.0% 0
Cheaper car parking 1.2% 10 2.5% 1 0.0% 0 3.5% 3 4.4% 3 0.6% 1 0.8% 1 0.0% 0 0.8% 1 0.0% 0 0.0% 0Clearing parked cars from
bike lanes 0.1% 1 0.0% 0 0.0% 0 1.2% 1 0.0% 0 0.0% 0 0.0% 0 0.0% 0 0.0% 0 0.0% 0 0.0% 0
Improved bus services 0.1% 1 0.0% 0 0.0% 0 0.0% 0 0.0% 0 0.0% 0 0.0% 0 0.0% 0 0.0% 0 1.2% 1 0.0% 0More car parking 2.9% 24 5.0% 2 0.0% 0 4.7% 4 5.9% 4 3.2% 5 3.8% 5 1.1% 1 1.6% 2 1.2% 1 0.0% 0More food supermarkets 3.2% 26 0.0% 0 0.0% 0 2.4% 2 1.5% 1 5.8% 9 9.8% 13 0.0% 0 0.8% 1 0.0% 0 0.0% 0More large shops 0.9% 7 0.0% 0 0.0% 0 0.0% 0 2.9% 2 0.6% 1 2.3% 3 1.1% 1 0.0% 0 0.0% 0 0.0% 0More traffic free areas /
pedestrianisation 0.2% 2 0.0% 0 0.0% 0 1.2% 1 0.0% 0 0.0% 0 0.8% 1 0.0% 0 0.0% 0 0.0% 0 0.0% 0
Nothing 50.1% 413 52.5% 21 66.7% 6 48.2% 41 57.4% 39 52.3% 81 51.1% 68 51.6% 49 41.1% 51 45.1% 37 60.6% 20(Don’t know / never shopped
there before) 35.9% 296 35.0% 14 33.3% 3 37.6% 32 27.9% 19 22.6% 35 28.6% 38 41.1% 39 49.2% 61 51.2% 42 39.4% 13
Base: 824 40 9 85 68 155 133 95 124 82 33

By Zone London Borough of Harrow Household Survey Page 69 For Nathaniel Lichfield & Partners May 2009
Total Zone 1 Zone 2 Zone 3 Zone 4 Zone 5 Zone 6 Zone 7 Zone 8 Zone 9 Zone 10
180509 NEMS market research
Q19 What if anything would make you shop more often in Pinner? Those who regularly visit shops or services at the centres mentioned at Q13: Better accessibility (i.e.
improve traffic flow / public transport links)
0.2% 2 0.0% 0 0.0% 0 0.0% 0 0.0% 0 0.0% 0 0.0% 0 0.0% 0 0.0% 0 2.4% 2 0.0% 0
Better choice of cafes / restaurants
0.6% 5 0.0% 0 0.0% 0 0.0% 0 1.5% 1 1.3% 2 0.8% 1 0.0% 0 0.8% 1 0.0% 0 0.0% 0
Better choice of clothing shops
2.4% 20 5.0% 2 0.0% 0 5.9% 5 8.8% 6 3.2% 5 0.0% 0 0.0% 0 1.6% 2 0.0% 0 0.0% 0
Better choice of shops in general
6.4% 53 15.0% 6 11.1% 1 10.6% 9 20.6% 14 7.7% 12 4.5% 6 4.2% 4 0.8% 1 0.0% 0 0.0% 0
Better choice of specialist shops (e.g. craft shops, haberdashers etc.)
0.7% 6 2.5% 1 0.0% 0 2.4% 2 0.0% 0 0.6% 1 0.8% 1 0.0% 0 0.0% 0 0.0% 0 3.0% 1
Better maintenance / cleanliness
0.4% 3 0.0% 0 0.0% 0 0.0% 0 1.5% 1 0.0% 0 0.8% 1 0.0% 0 0.0% 0 0.0% 0 3.0% 1
Better quality shops 1.9% 16 2.5% 1 0.0% 0 1.2% 1 8.8% 6 4.5% 7 0.0% 0 0.0% 0 0.0% 0 1.2% 1 0.0% 0Cheaper car parking 3.6% 30 7.5% 3 0.0% 0 10.6% 9 13.2% 9 2.6% 4 1.5% 2 0.0% 0 1.6% 2 1.2% 1 0.0% 0Improve library 0.1% 1 0.0% 0 0.0% 0 1.2% 1 0.0% 0 0.0% 0 0.0% 0 0.0% 0 0.0% 0 0.0% 0 0.0% 0Improved bus services 0.2% 2 0.0% 0 0.0% 0 1.2% 1 0.0% 0 0.0% 0 0.0% 0 0.0% 0 0.8% 1 0.0% 0 0.0% 0Indoor shopping centre 0.1% 1 0.0% 0 0.0% 0 0.0% 0 0.0% 0 0.0% 0 0.8% 1 0.0% 0 0.0% 0 0.0% 0 0.0% 0Less cafes / restaurants 0.1% 1 0.0% 0 0.0% 0 1.2% 1 0.0% 0 0.0% 0 0.0% 0 0.0% 0 0.0% 0 0.0% 0 0.0% 0Longer opening hours / late-
night shopping 0.1% 1 0.0% 0 0.0% 0 0.0% 0 0.0% 0 0.0% 0 0.8% 1 0.0% 0 0.0% 0 0.0% 0 0.0% 0
Lower prices / cheaper stores 0.6% 5 0.0% 0 0.0% 0 2.4% 2 0.0% 0 0.6% 1 1.5% 2 0.0% 0 0.0% 0 0.0% 0 0.0% 0More car parking 2.9% 24 2.5% 1 11.1% 1 4.7% 4 10.3% 7 1.9% 3 1.5% 2 3.2% 3 2.4% 3 0.0% 0 0.0% 0More compact shopping area 0.1% 1 0.0% 0 0.0% 0 0.0% 0 0.0% 0 0.6% 1 0.0% 0 0.0% 0 0.0% 0 0.0% 0 0.0% 0More cost effective produce 0.1% 1 0.0% 0 0.0% 0 1.2% 1 0.0% 0 0.0% 0 0.0% 0 0.0% 0 0.0% 0 0.0% 0 0.0% 0More food supermarkets 0.4% 3 0.0% 0 11.1% 1 1.2% 1 0.0% 0 0.0% 0 0.0% 0 0.0% 0 0.8% 1 0.0% 0 0.0% 0More large shops 1.3% 11 2.5% 1 0.0% 0 3.5% 3 0.0% 0 2.6% 4 0.8% 1 1.1% 1 0.0% 0 0.0% 0 3.0% 1Nothing 54.9% 452 60.0% 24 66.7% 6 51.8% 44 50.0% 34 60.0% 93 63.2% 84 51.6% 49 46.8% 58 46.3% 38 66.7% 22Open another department
store (e.g. John Lewis) 0.5% 4 0.0% 0 0.0% 0 0.0% 0 0.0% 0 0.6% 1 1.5% 2 1.1% 1 0.0% 0 0.0% 0 0.0% 0
(Don’t know / never shopped there before)
27.2% 224 10.0% 4 0.0% 0 12.9% 11 8.8% 6 18.7% 29 23.3% 31 38.9% 37 46.0% 57 50.0% 41 24.2% 8
Base: 824 40 9 85 68 155 133 95 124 82 33

By Zone London Borough of Harrow Household Survey Page 70 For Nathaniel Lichfield & Partners May 2009
Total Zone 1 Zone 2 Zone 3 Zone 4 Zone 5 Zone 6 Zone 7 Zone 8 Zone 9 Zone 10
180509 NEMS market research
Q20 What if anything would make you shop more often in Rayners Lane? Those who regularly visit shops or services at the centres mentioned at Q13: Better accessibility (i.e.
improve traffic flow / public transport links)
0.2% 2 0.0% 0 0.0% 0 0.0% 0 0.0% 0 0.6% 1 0.0% 0 0.0% 0 0.8% 1 0.0% 0 0.0% 0
Better bank facilities 0.1% 1 0.0% 0 0.0% 0 0.0% 0 0.0% 0 0.6% 1 0.0% 0 0.0% 0 0.0% 0 0.0% 0 0.0% 0Better choice of cafes /
restaurants 0.1% 1 0.0% 0 0.0% 0 0.0% 0 0.0% 0 0.6% 1 0.0% 0 0.0% 0 0.0% 0 0.0% 0 0.0% 0
Better choice of clothing shops
1.0% 8 0.0% 0 0.0% 0 2.4% 2 1.5% 1 3.2% 5 0.0% 0 0.0% 0 0.0% 0 0.0% 0 0.0% 0
Better choice of shops in general
6.3% 52 5.0% 2 0.0% 0 10.6% 9 2.9% 2 15.5% 24 6.0% 8 3.2% 3 3.2% 4 0.0% 0 0.0% 0
Better choice of specialist shops (e.g. craft shops, haberdashers etc.)
0.1% 1 0.0% 0 0.0% 0 1.2% 1 0.0% 0 0.0% 0 0.0% 0 0.0% 0 0.0% 0 0.0% 0 0.0% 0
Better maintenance / cleanliness
0.6% 5 0.0% 0 0.0% 0 0.0% 0 0.0% 0 1.3% 2 0.8% 1 0.0% 0 1.6% 2 0.0% 0 0.0% 0
Better quality shops 0.6% 5 0.0% 0 0.0% 0 1.2% 1 1.5% 1 1.3% 2 0.8% 1 0.0% 0 0.0% 0 0.0% 0 0.0% 0Better safety / More police /
CCTV 0.5% 4 2.5% 1 0.0% 0 0.0% 0 0.0% 0 0.6% 1 0.0% 0 0.0% 0 1.6% 2 0.0% 0 0.0% 0
Cheaper car parking 2.1% 17 5.0% 2 0.0% 0 7.1% 6 4.4% 3 3.2% 5 0.0% 0 0.0% 0 0.8% 1 0.0% 0 0.0% 0Improve the appearance /
atmosphere 0.1% 1 0.0% 0 0.0% 0 0.0% 0 0.0% 0 0.6% 1 0.0% 0 0.0% 0 0.0% 0 0.0% 0 0.0% 0
More activites for children 0.1% 1 0.0% 0 0.0% 0 0.0% 0 0.0% 0 0.6% 1 0.0% 0 0.0% 0 0.0% 0 0.0% 0 0.0% 0More car parking 4.2% 35 5.0% 2 0.0% 0 7.1% 6 5.9% 4 8.4% 13 3.0% 4 1.1% 1 3.2% 4 1.2% 1 0.0% 0More food supermarkets 1.3% 11 0.0% 0 0.0% 0 1.2% 1 0.0% 0 3.2% 5 3.8% 5 0.0% 0 0.0% 0 0.0% 0 0.0% 0More large shops 0.2% 2 0.0% 0 0.0% 0 0.0% 0 1.5% 1 0.0% 0 0.8% 1 0.0% 0 0.0% 0 0.0% 0 0.0% 0More traffic free areas /
pedestrianisation 0.4% 3 0.0% 0 0.0% 0 2.4% 2 0.0% 0 0.0% 0 0.8% 1 0.0% 0 0.0% 0 0.0% 0 0.0% 0
Nothing 50.6% 417 52.5% 21 77.8% 7 48.2% 41 63.2% 43 47.7% 74 58.6% 78 46.3% 44 40.3% 50 42.7% 35 72.7% 24Open another department
store (e.g. John Lewis) 0.4% 3 0.0% 0 0.0% 0 0.0% 0 0.0% 0 0.6% 1 0.8% 1 0.0% 0 0.8% 1 0.0% 0 0.0% 0
(Don’t know / never shopped there before)
36.0% 297 40.0% 16 22.2% 2 29.4% 25 27.9% 19 20.6% 32 27.8% 37 49.5% 47 51.6% 64 56.1% 46 27.3% 9
Base: 824 40 9 85 68 155 133 95 124 82 33
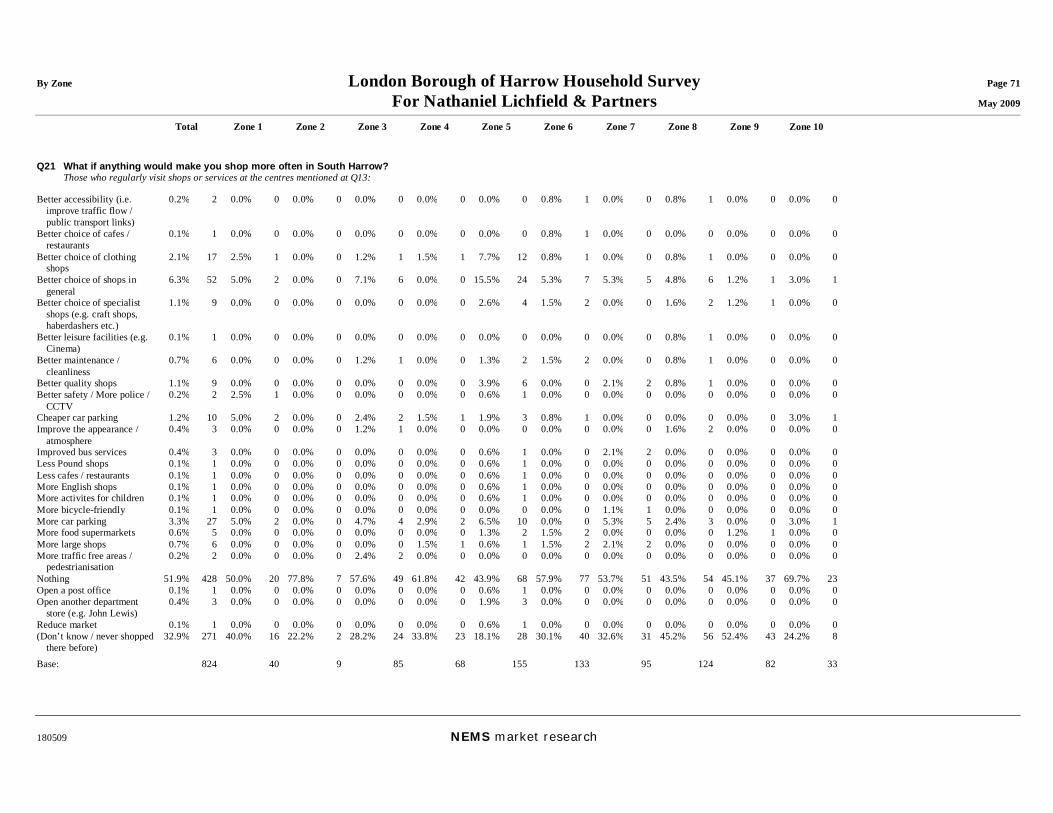
By Zone London Borough of Harrow Household Survey Page 71 For Nathaniel Lichfield & Partners May 2009
Total Zone 1 Zone 2 Zone 3 Zone 4 Zone 5 Zone 6 Zone 7 Zone 8 Zone 9 Zone 10
180509 NEMS market research
Q21 What if anything would make you shop more often in South Harrow? Those who regularly visit shops or services at the centres mentioned at Q13: Better accessibility (i.e.
improve traffic flow / public transport links)
0.2% 2 0.0% 0 0.0% 0 0.0% 0 0.0% 0 0.0% 0 0.8% 1 0.0% 0 0.8% 1 0.0% 0 0.0% 0
Better choice of cafes / restaurants
0.1% 1 0.0% 0 0.0% 0 0.0% 0 0.0% 0 0.0% 0 0.8% 1 0.0% 0 0.0% 0 0.0% 0 0.0% 0
Better choice of clothing shops
2.1% 17 2.5% 1 0.0% 0 1.2% 1 1.5% 1 7.7% 12 0.8% 1 0.0% 0 0.8% 1 0.0% 0 0.0% 0
Better choice of shops in general
6.3% 52 5.0% 2 0.0% 0 7.1% 6 0.0% 0 15.5% 24 5.3% 7 5.3% 5 4.8% 6 1.2% 1 3.0% 1
Better choice of specialist shops (e.g. craft shops, haberdashers etc.)
1.1% 9 0.0% 0 0.0% 0 0.0% 0 0.0% 0 2.6% 4 1.5% 2 0.0% 0 1.6% 2 1.2% 1 0.0% 0
Better leisure facilities (e.g. Cinema)
0.1% 1 0.0% 0 0.0% 0 0.0% 0 0.0% 0 0.0% 0 0.0% 0 0.0% 0 0.8% 1 0.0% 0 0.0% 0
Better maintenance / cleanliness
0.7% 6 0.0% 0 0.0% 0 1.2% 1 0.0% 0 1.3% 2 1.5% 2 0.0% 0 0.8% 1 0.0% 0 0.0% 0
Better quality shops 1.1% 9 0.0% 0 0.0% 0 0.0% 0 0.0% 0 3.9% 6 0.0% 0 2.1% 2 0.8% 1 0.0% 0 0.0% 0Better safety / More police /
CCTV 0.2% 2 2.5% 1 0.0% 0 0.0% 0 0.0% 0 0.6% 1 0.0% 0 0.0% 0 0.0% 0 0.0% 0 0.0% 0
Cheaper car parking 1.2% 10 5.0% 2 0.0% 0 2.4% 2 1.5% 1 1.9% 3 0.8% 1 0.0% 0 0.0% 0 0.0% 0 3.0% 1Improve the appearance /
atmosphere 0.4% 3 0.0% 0 0.0% 0 1.2% 1 0.0% 0 0.0% 0 0.0% 0 0.0% 0 1.6% 2 0.0% 0 0.0% 0
Improved bus services 0.4% 3 0.0% 0 0.0% 0 0.0% 0 0.0% 0 0.6% 1 0.0% 0 2.1% 2 0.0% 0 0.0% 0 0.0% 0Less Pound shops 0.1% 1 0.0% 0 0.0% 0 0.0% 0 0.0% 0 0.6% 1 0.0% 0 0.0% 0 0.0% 0 0.0% 0 0.0% 0Less cafes / restaurants 0.1% 1 0.0% 0 0.0% 0 0.0% 0 0.0% 0 0.6% 1 0.0% 0 0.0% 0 0.0% 0 0.0% 0 0.0% 0More English shops 0.1% 1 0.0% 0 0.0% 0 0.0% 0 0.0% 0 0.6% 1 0.0% 0 0.0% 0 0.0% 0 0.0% 0 0.0% 0More activites for children 0.1% 1 0.0% 0 0.0% 0 0.0% 0 0.0% 0 0.6% 1 0.0% 0 0.0% 0 0.0% 0 0.0% 0 0.0% 0More bicycle-friendly 0.1% 1 0.0% 0 0.0% 0 0.0% 0 0.0% 0 0.0% 0 0.0% 0 1.1% 1 0.0% 0 0.0% 0 0.0% 0More car parking 3.3% 27 5.0% 2 0.0% 0 4.7% 4 2.9% 2 6.5% 10 0.0% 0 5.3% 5 2.4% 3 0.0% 0 3.0% 1More food supermarkets 0.6% 5 0.0% 0 0.0% 0 0.0% 0 0.0% 0 1.3% 2 1.5% 2 0.0% 0 0.0% 0 1.2% 1 0.0% 0More large shops 0.7% 6 0.0% 0 0.0% 0 0.0% 0 1.5% 1 0.6% 1 1.5% 2 2.1% 2 0.0% 0 0.0% 0 0.0% 0More traffic free areas /
pedestrianisation 0.2% 2 0.0% 0 0.0% 0 2.4% 2 0.0% 0 0.0% 0 0.0% 0 0.0% 0 0.0% 0 0.0% 0 0.0% 0
Nothing 51.9% 428 50.0% 20 77.8% 7 57.6% 49 61.8% 42 43.9% 68 57.9% 77 53.7% 51 43.5% 54 45.1% 37 69.7% 23Open a post office 0.1% 1 0.0% 0 0.0% 0 0.0% 0 0.0% 0 0.6% 1 0.0% 0 0.0% 0 0.0% 0 0.0% 0 0.0% 0Open another department
store (e.g. John Lewis) 0.4% 3 0.0% 0 0.0% 0 0.0% 0 0.0% 0 1.9% 3 0.0% 0 0.0% 0 0.0% 0 0.0% 0 0.0% 0
Reduce market 0.1% 1 0.0% 0 0.0% 0 0.0% 0 0.0% 0 0.6% 1 0.0% 0 0.0% 0 0.0% 0 0.0% 0 0.0% 0(Don’t know / never shopped
there before) 32.9% 271 40.0% 16 22.2% 2 28.2% 24 33.8% 23 18.1% 28 30.1% 40 32.6% 31 45.2% 56 52.4% 43 24.2% 8
Base: 824 40 9 85 68 155 133 95 124 82 33

By Zone London Borough of Harrow Household Survey Page 72 For Nathaniel Lichfield & Partners May 2009
Total Zone 1 Zone 2 Zone 3 Zone 4 Zone 5 Zone 6 Zone 7 Zone 8 Zone 9 Zone 10
180509 NEMS market research
Q22 What if anything would make you shop more often in Stanmore? Those who regularly visit shops or services at the centres mentioned at Q13: Better accessibility (i.e.
improve traffic flow / public transport links)
0.1% 1 0.0% 0 0.0% 0 0.0% 0 0.0% 0 0.0% 0 0.8% 1 0.0% 0 0.0% 0 0.0% 0 0.0% 0
Better bank facilities 0.1% 1 0.0% 0 0.0% 0 0.0% 0 0.0% 0 0.6% 1 0.0% 0 0.0% 0 0.0% 0 0.0% 0 0.0% 0Better choice of cafes /
restaurants 0.2% 2 0.0% 0 0.0% 0 1.2% 1 0.0% 0 0.0% 0 0.0% 0 0.0% 0 0.0% 0 1.2% 1 0.0% 0
Better choice of clothing shops
1.1% 9 0.0% 0 0.0% 0 0.0% 0 5.9% 4 0.0% 0 0.0% 0 0.0% 0 0.8% 1 2.4% 2 6.1% 2
Better choice of shops in general
5.6% 46 5.0% 2 0.0% 0 1.2% 1 4.4% 3 1.9% 3 5.3% 7 3.2% 3 10.5% 13 9.8% 8 18.2% 6
Better choice of specialist shops (e.g. craft shops, haberdashers etc.)
0.5% 4 0.0% 0 0.0% 0 0.0% 0 0.0% 0 0.0% 0 0.0% 0 0.0% 0 0.8% 1 0.0% 0 9.1% 3
Better layout of stores, more spread out
0.1% 1 0.0% 0 0.0% 0 0.0% 0 0.0% 0 0.0% 0 0.0% 0 0.0% 0 0.0% 0 1.2% 1 0.0% 0
Better maintenance / cleanliness
0.1% 1 0.0% 0 0.0% 0 0.0% 0 1.5% 1 0.0% 0 0.0% 0 0.0% 0 0.0% 0 0.0% 0 0.0% 0
Better quality shops 1.1% 9 0.0% 0 0.0% 0 0.0% 0 1.5% 1 0.6% 1 1.5% 2 0.0% 0 0.8% 1 2.4% 2 6.1% 2Better safety / More police /
CCTV 0.2% 2 0.0% 0 0.0% 0 0.0% 0 0.0% 0 0.0% 0 0.0% 0 0.0% 0 0.8% 1 1.2% 1 0.0% 0
Cheaper car parking 1.8% 15 2.5% 1 0.0% 0 2.4% 2 1.5% 1 1.3% 2 0.0% 0 0.0% 0 4.0% 5 2.4% 2 6.1% 2Escalator or lift at the tube
station 0.1% 1 0.0% 0 0.0% 0 0.0% 0 0.0% 0 0.0% 0 0.0% 0 0.0% 0 0.0% 0 0.0% 0 3.0% 1
Improved bus services 0.2% 2 0.0% 0 0.0% 0 0.0% 0 0.0% 0 0.0% 0 0.0% 0 0.0% 0 0.8% 1 1.2% 1 0.0% 0Lower prices / cheaper stores 0.2% 2 0.0% 0 0.0% 0 0.0% 0 0.0% 0 0.0% 0 0.0% 0 1.1% 1 0.0% 0 1.2% 1 0.0% 0More car parking 4.0% 33 5.0% 2 0.0% 0 2.4% 2 4.4% 3 0.6% 1 1.5% 2 1.1% 1 8.1% 10 8.5% 7 15.2% 5More disabled parking
spaces 0.1% 1 0.0% 0 0.0% 0 0.0% 0 0.0% 0 0.0% 0 0.0% 0 0.0% 0 0.0% 0 1.2% 1 0.0% 0
More food supermarkets 0.9% 7 0.0% 0 0.0% 0 0.0% 0 0.0% 0 0.0% 0 0.8% 1 0.0% 0 1.6% 2 2.4% 2 6.1% 2More large shops 0.7% 6 0.0% 0 0.0% 0 1.2% 1 1.5% 1 0.0% 0 0.8% 1 1.1% 1 0.0% 0 0.0% 0 6.1% 2More traffic free areas /
pedestrianisation 0.4% 3 0.0% 0 0.0% 0 0.0% 0 0.0% 0 0.0% 0 0.0% 0 0.0% 0 0.8% 1 2.4% 2 0.0% 0
Nothing 51.9% 428 52.5% 21 66.7% 6 52.9% 45 67.6% 46 47.7% 74 63.2% 84 42.1% 40 51.6% 64 39.0% 32 48.5% 16(Don’t know / never shopped
there before) 36.0% 297 40.0% 16 33.3% 3 41.2% 35 20.6% 14 49.7% 77 29.3% 39 51.6% 49 27.4% 34 36.6% 30 0.0% 0
Base: 824 40 9 85 68 155 133 95 124 82 33

By Zone London Borough of Harrow Household Survey Page 73 For Nathaniel Lichfield & Partners May 2009
Total Zone 1 Zone 2 Zone 3 Zone 4 Zone 5 Zone 6 Zone 7 Zone 8 Zone 9 Zone 10
180509 NEMS market research
Q23 What if anything would make you shop more often in Wealdstone? Those who regularly visit shops or services at the centres mentioned at Q13: Better accessibility (i.e.
improve traffic flow / public transport links)
0.2% 2 0.0% 0 0.0% 0 0.0% 0 0.0% 0 0.6% 1 0.0% 0 0.0% 0 0.0% 0 0.0% 0 3.0% 1
Better choice of cafes / restaurants
0.2% 2 0.0% 0 0.0% 0 0.0% 0 0.0% 0 0.0% 0 0.8% 1 0.0% 0 0.8% 1 0.0% 0 0.0% 0
Better choice of clothing shops
1.0% 8 0.0% 0 0.0% 0 0.0% 0 1.5% 1 0.6% 1 1.5% 2 0.0% 0 0.8% 1 2.4% 2 3.0% 1
Better choice of shops in general
6.2% 51 5.0% 2 0.0% 0 1.2% 1 7.4% 5 5.2% 8 9.8% 13 3.2% 3 11.3% 14 3.7% 3 6.1% 2
Better choice of specialist shops (e.g. craft shops, haberdashers etc.)
0.5% 4 0.0% 0 0.0% 0 0.0% 0 0.0% 0 0.0% 0 2.3% 3 0.0% 0 0.8% 1 0.0% 0 0.0% 0
Better maintenance / cleanliness
1.8% 15 0.0% 0 0.0% 0 0.0% 0 1.5% 1 0.6% 1 5.3% 7 0.0% 0 4.8% 6 0.0% 0 0.0% 0
Better quality shops 1.5% 12 0.0% 0 0.0% 0 0.0% 0 1.5% 1 0.6% 1 3.0% 4 0.0% 0 3.2% 4 1.2% 1 3.0% 1Better safety / More police /
CCTV 1.1% 9 2.5% 1 0.0% 0 1.2% 1 0.0% 0 0.0% 0 2.3% 3 0.0% 0 2.4% 3 1.2% 1 0.0% 0
Better street market 0.2% 2 0.0% 0 0.0% 0 0.0% 0 1.5% 1 0.0% 0 0.8% 1 0.0% 0 0.0% 0 0.0% 0 0.0% 0Cheaper car parking 1.3% 11 5.0% 2 0.0% 0 3.5% 3 2.9% 2 0.0% 0 0.8% 1 0.0% 0 2.4% 3 0.0% 0 0.0% 0Improve the appearance /
atmosphere 0.4% 3 0.0% 0 0.0% 0 0.0% 0 0.0% 0 0.0% 0 1.5% 2 0.0% 0 0.8% 1 0.0% 0 0.0% 0
Improved bus services 0.1% 1 0.0% 0 0.0% 0 0.0% 0 1.5% 1 0.0% 0 0.0% 0 0.0% 0 0.0% 0 0.0% 0 0.0% 0Less take away shops 0.1% 1 0.0% 0 0.0% 0 0.0% 0 0.0% 0 0.0% 0 0.0% 0 0.0% 0 0.8% 1 0.0% 0 0.0% 0More car parking 2.2% 18 5.0% 2 0.0% 0 4.7% 4 4.4% 3 1.9% 3 0.0% 0 0.0% 0 3.2% 4 1.2% 1 3.0% 1More food supermarkets 2.5% 21 0.0% 0 0.0% 0 0.0% 0 5.9% 4 0.0% 0 7.5% 10 1.1% 1 4.0% 5 1.2% 1 0.0% 0More large shops 0.7% 6 0.0% 0 0.0% 0 0.0% 0 2.9% 2 0.0% 0 3.0% 4 0.0% 0 0.0% 0 0.0% 0 0.0% 0Nothing 49.0% 404 50.0% 20 66.7% 6 48.2% 41 58.8% 40 50.3% 78 51.9% 69 46.3% 44 37.9% 47 43.9% 36 69.7% 23(Don’t know / never shopped
there before) 38.0% 313 42.5% 17 33.3% 3 44.7% 38 26.5% 18 42.6% 66 22.6% 30 49.5% 47 38.7% 48 50.0% 41 15.2% 5
Base: 824 40 9 85 68 155 133 95 124 82 33 Q24 Are you aware of major proposals to expand shopping facilities at Brent Cross? Those who regularly visit shops or services at the centres mentioned at Q13: Yes 13.0% 107 7.5% 3 22.2% 2 4.7% 4 10.3% 7 5.8% 9 9.8% 13 23.2% 22 15.3% 19 31.7% 26 6.1% 2No 86.5% 713 90.0% 36 77.8% 7 94.1% 80 89.7% 61 94.2% 146 90.2% 120 76.8% 73 83.9% 104 68.3% 56 90.9% 30(Don't know) 0.5% 4 2.5% 1 0.0% 0 1.2% 1 0.0% 0 0.0% 0 0.0% 0 0.0% 0 0.8% 1 0.0% 0 3.0% 1Base: 824 40 9 85 68 155 133 95 124 82 33

By Zone London Borough of Harrow Household Survey Page 74 For Nathaniel Lichfield & Partners May 2009
Total Zone 1 Zone 2 Zone 3 Zone 4 Zone 5 Zone 6 Zone 7 Zone 8 Zone 9 Zone 10
180509 NEMS market research
Q25 Do you think you will regularly shop in Brent Cross when these developments are complete? Those who were aware of major proposals to expand shopping facilities at Brent Cross at Q24 Yes 52.3% 56 0.0% 0 0.0% 0 25.0% 1 42.9% 3 55.6% 5 15.4% 2 63.6% 14 68.4% 13 61.5% 16 100.0% 2No 37.4% 40 100.0% 3 50.0% 1 75.0% 3 28.6% 2 44.4% 4 76.9% 10 27.3% 6 21.1% 4 26.9% 7 0.0% 0(Don't know) 10.3% 11 0.0% 0 50.0% 1 0.0% 0 28.6% 2 0.0% 0 7.7% 1 9.1% 2 10.5% 2 11.5% 3 0.0% 0
Base: 107 3 2 4 7 9 13 22 19 26 2 GEN Gender of respondent: Male 28.0% 280 23.6% 13 28.0% 7 23.5% 27 21.2% 18 27.9% 46 29.0% 42 38.5% 50 19.3% 26 39.1% 43 22.9% 8Female 72.0% 720 76.4% 42 72.0% 18 76.5% 88 78.8% 67 72.1% 119 71.0% 103 61.5% 80 80.7% 109 60.9% 67 77.1% 27
Base: 1000 55 25 115 85 165 145 130 135 110 35 AGE How old are you ? 18-24 3.0% 30 1.8% 1 8.0% 2 1.7% 2 0.0% 0 3.0% 5 6.2% 9 3.1% 4 1.5% 2 4.5% 5 0.0% 025-34 5.6% 56 3.6% 2 4.0% 1 2.6% 3 3.5% 3 7.9% 13 8.3% 12 3.8% 5 4.4% 6 8.2% 9 5.7% 235-44 16.2% 162 9.1% 5 8.0% 2 20.9% 24 11.8% 10 21.2% 35 20.7% 30 16.2% 21 11.9% 16 13.6% 15 11.4% 445-54 24.0% 240 34.5% 19 36.0% 9 30.4% 35 24.7% 21 25.5% 42 29.7% 43 17.7% 23 23.0% 31 11.8% 13 11.4% 455-64 14.7% 147 12.7% 7 16.0% 4 11.3% 13 14.1% 12 18.2% 30 7.6% 11 17.7% 23 23.0% 31 13.6% 15 2.9% 165+ 35.0% 350 34.5% 19 28.0% 7 33.0% 38 42.4% 36 24.2% 40 26.9% 39 40.0% 52 34.8% 47 46.4% 51 60.0% 21(Refused) 1.5% 15 3.6% 2 0.0% 0 0.0% 0 3.5% 3 0.0% 0 0.7% 1 1.5% 2 1.5% 2 1.8% 2 8.6% 3
Base: 1000 55 25 115 85 165 145 130 135 110 35 CAR How many cars are there normally available for use in the household? None 18.0% 180 10.9% 6 4.0% 1 8.7% 10 14.1% 12 20.6% 34 26.9% 39 22.3% 29 17.8% 24 17.3% 19 17.1% 61 46.6% 466 40.0% 22 52.0% 13 48.7% 56 54.1% 46 42.4% 70 43.4% 63 48.5% 63 43.0% 58 51.8% 57 51.4% 182 25.3% 253 34.5% 19 40.0% 10 27.0% 31 22.4% 19 25.5% 42 21.4% 31 22.3% 29 29.6% 40 20.9% 23 25.7% 93 or more 8.2% 82 10.9% 6 4.0% 1 14.8% 17 8.2% 7 9.7% 16 6.2% 9 3.8% 5 8.9% 12 8.2% 9 0.0% 0(Don't know) 0.0% 0 0.0% 0 0.0% 0 0.0% 0 0.0% 0 0.0% 0 0.0% 0 0.0% 0 0.0% 0 0.0% 0 0.0% 0(Refused) 1.9% 19 3.6% 2 0.0% 0 0.9% 1 1.2% 1 1.8% 3 2.1% 3 3.1% 4 0.7% 1 1.8% 2 5.7% 2
Base: 1000 55 25 115 85 165 145 130 135 110 35

By Zone London Borough of Harrow Household Survey Page 75 For Nathaniel Lichfield & Partners May 2009
Total Zone 1 Zone 2 Zone 3 Zone 4 Zone 5 Zone 6 Zone 7 Zone 8 Zone 9 Zone 10
180509 NEMS market research
ETH Finally, just for the purposes of the survey and to make sure we speak to a representative cross section of the community, please could you tell me which of the following best describes your ethnic origin?
British 67.0% 670 80.0% 44 96.0% 24 86.1% 99 81.2% 69 60.6% 100 65.5% 95 57.7% 75 61.5% 83 50.0% 55 74.3% 26Irish 3.9% 39 0.0% 0 0.0% 0 0.0% 0 2.4% 2 6.7% 11 3.4% 5 1.5% 2 5.2% 7 10.9% 12 0.0% 0Any other white background 4.0% 40 3.6% 2 4.0% 1 3.5% 4 0.0% 0 3.6% 6 2.8% 4 4.6% 6 5.2% 7 7.3% 8 5.7% 2White & Black Caribbean 2.0% 20 0.0% 0 0.0% 0 0.9% 1 1.2% 1 3.6% 6 2.8% 4 0.8% 1 3.0% 4 2.7% 3 0.0% 0White & Black African 0.8% 8 0.0% 0 0.0% 0 0.0% 0 1.2% 1 1.8% 3 0.0% 0 0.8% 1 0.0% 0 2.7% 3 0.0% 0White & Asian 2.3% 23 1.8% 1 0.0% 0 0.9% 1 3.5% 3 1.8% 3 5.5% 8 3.1% 4 0.0% 0 1.8% 2 2.9% 1Any other mixed background 1.2% 12 3.6% 2 0.0% 0 0.9% 1 0.0% 0 1.8% 3 0.7% 1 1.5% 2 2.2% 3 0.0% 0 0.0% 0Indian 9.2% 92 0.0% 0 0.0% 0 2.6% 3 7.1% 6 8.5% 14 9.7% 14 11.5% 15 15.6% 21 16.4% 18 2.9% 1Pakistani 1.2% 12 3.6% 2 0.0% 0 0.0% 0 0.0% 0 0.0% 0 1.4% 2 3.8% 5 0.0% 0 2.7% 3 0.0% 0Bangladeshi 0.3% 3 0.0% 0 0.0% 0 0.0% 0 0.0% 0 1.2% 2 0.0% 0 0.8% 1 0.0% 0 0.0% 0 0.0% 0Any other Asian or Asian
British 2.5% 25 0.0% 0 0.0% 0 2.6% 3 2.4% 2 3.6% 6 2.8% 4 4.6% 6 2.2% 3 0.9% 1 0.0% 0
Caribbean 0.6% 6 0.0% 0 0.0% 0 0.0% 0 0.0% 0 1.2% 2 1.4% 2 1.5% 2 0.0% 0 0.0% 0 0.0% 0African 0.6% 6 0.0% 0 0.0% 0 0.0% 0 0.0% 0 0.6% 1 0.7% 1 1.5% 2 0.7% 1 0.9% 1 0.0% 0Any other Black background 0.4% 4 0.0% 0 0.0% 0 0.0% 0 0.0% 0 0.0% 0 0.7% 1 1.5% 2 0.0% 0 0.9% 1 0.0% 0Chinese 0.4% 4 3.6% 2 0.0% 0 0.9% 1 0.0% 0 0.6% 1 0.0% 0 0.0% 0 0.0% 0 0.0% 0 0.0% 0Other ethnic group 0.0% 0 0.0% 0 0.0% 0 0.0% 0 0.0% 0 0.0% 0 0.0% 0 0.0% 0 0.0% 0 0.0% 0 0.0% 0(Refused) 3.6% 36 3.6% 2 0.0% 0 1.7% 2 1.2% 1 4.2% 7 2.8% 4 4.6% 6 4.4% 6 2.7% 3 14.3% 5
Base: 1000 55 25 115 85 165 145 130 135 110 35 SEG Socio-economic Grouping A 3.5% 35 14.5% 8 8.0% 2 3.5% 4 2.4% 2 3.6% 6 4.1% 6 1.5% 2 2.2% 3 1.8% 2 0.0% 0B 18.6% 186 27.3% 15 12.0% 3 29.6% 34 16.5% 14 14.5% 24 24.1% 35 17.7% 23 14.1% 19 11.8% 13 17.1% 6C1 26.0% 260 10.9% 6 32.0% 8 34.8% 40 17.6% 15 29.7% 49 25.5% 37 26.2% 34 20.0% 27 29.1% 32 34.3% 12C2 15.5% 155 7.3% 4 32.0% 8 12.2% 14 16.5% 14 15.8% 26 15.2% 22 15.4% 20 17.8% 24 17.3% 19 11.4% 4D 5.9% 59 3.6% 2 0.0% 0 1.7% 2 1.2% 1 9.7% 16 9.7% 14 6.2% 8 7.4% 10 5.5% 6 0.0% 0E 19.8% 198 20.0% 11 12.0% 3 12.2% 14 34.1% 29 18.2% 30 11.0% 16 18.5% 24 28.9% 39 22.7% 25 20.0% 7(Refused) 10.7% 107 16.4% 9 4.0% 1 6.1% 7 11.8% 10 8.5% 14 10.3% 15 14.6% 19 9.6% 13 11.8% 13 17.1% 6
Base: 1000 55 25 115 85 165 145 130 135 110 35
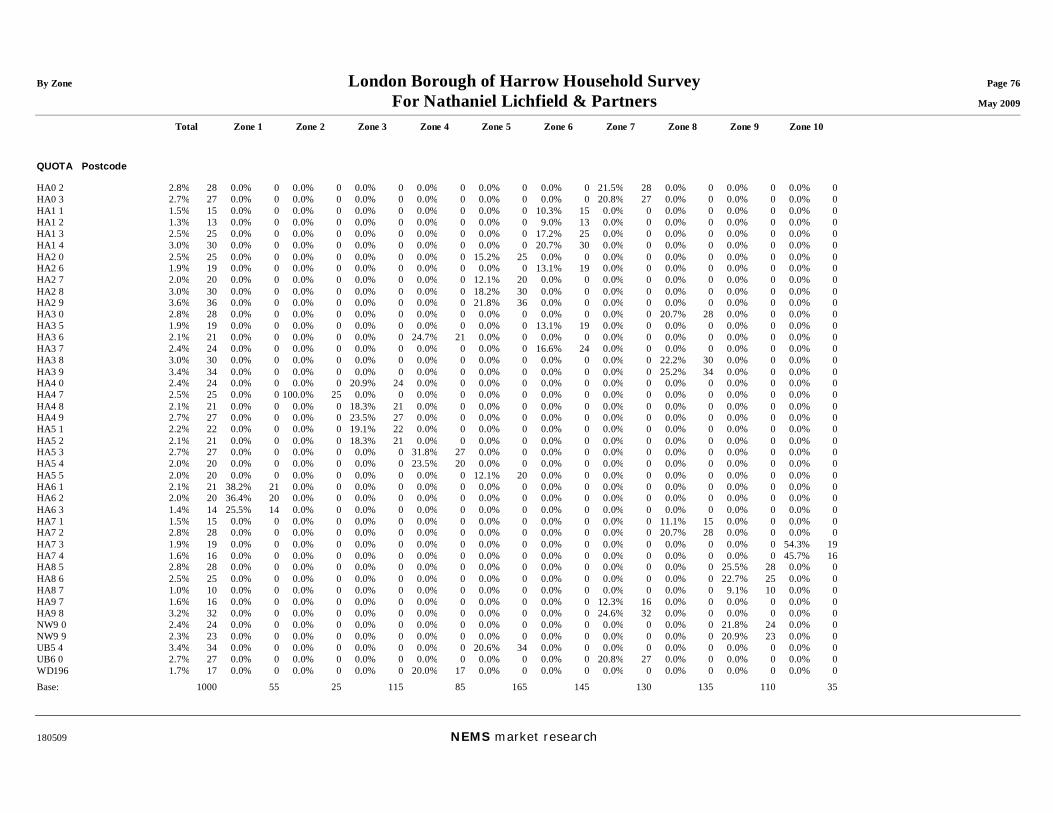
By Zone London Borough of Harrow Household Survey Page 76 For Nathaniel Lichfield & Partners May 2009
Total Zone 1 Zone 2 Zone 3 Zone 4 Zone 5 Zone 6 Zone 7 Zone 8 Zone 9 Zone 10
180509 NEMS market research
QUOTA Postcode HA0 2 2.8% 28 0.0% 0 0.0% 0 0.0% 0 0.0% 0 0.0% 0 0.0% 0 21.5% 28 0.0% 0 0.0% 0 0.0% 0HA0 3 2.7% 27 0.0% 0 0.0% 0 0.0% 0 0.0% 0 0.0% 0 0.0% 0 20.8% 27 0.0% 0 0.0% 0 0.0% 0HA1 1 1.5% 15 0.0% 0 0.0% 0 0.0% 0 0.0% 0 0.0% 0 10.3% 15 0.0% 0 0.0% 0 0.0% 0 0.0% 0HA1 2 1.3% 13 0.0% 0 0.0% 0 0.0% 0 0.0% 0 0.0% 0 9.0% 13 0.0% 0 0.0% 0 0.0% 0 0.0% 0HA1 3 2.5% 25 0.0% 0 0.0% 0 0.0% 0 0.0% 0 0.0% 0 17.2% 25 0.0% 0 0.0% 0 0.0% 0 0.0% 0HA1 4 3.0% 30 0.0% 0 0.0% 0 0.0% 0 0.0% 0 0.0% 0 20.7% 30 0.0% 0 0.0% 0 0.0% 0 0.0% 0HA2 0 2.5% 25 0.0% 0 0.0% 0 0.0% 0 0.0% 0 15.2% 25 0.0% 0 0.0% 0 0.0% 0 0.0% 0 0.0% 0HA2 6 1.9% 19 0.0% 0 0.0% 0 0.0% 0 0.0% 0 0.0% 0 13.1% 19 0.0% 0 0.0% 0 0.0% 0 0.0% 0HA2 7 2.0% 20 0.0% 0 0.0% 0 0.0% 0 0.0% 0 12.1% 20 0.0% 0 0.0% 0 0.0% 0 0.0% 0 0.0% 0HA2 8 3.0% 30 0.0% 0 0.0% 0 0.0% 0 0.0% 0 18.2% 30 0.0% 0 0.0% 0 0.0% 0 0.0% 0 0.0% 0HA2 9 3.6% 36 0.0% 0 0.0% 0 0.0% 0 0.0% 0 21.8% 36 0.0% 0 0.0% 0 0.0% 0 0.0% 0 0.0% 0HA3 0 2.8% 28 0.0% 0 0.0% 0 0.0% 0 0.0% 0 0.0% 0 0.0% 0 0.0% 0 20.7% 28 0.0% 0 0.0% 0HA3 5 1.9% 19 0.0% 0 0.0% 0 0.0% 0 0.0% 0 0.0% 0 13.1% 19 0.0% 0 0.0% 0 0.0% 0 0.0% 0HA3 6 2.1% 21 0.0% 0 0.0% 0 0.0% 0 24.7% 21 0.0% 0 0.0% 0 0.0% 0 0.0% 0 0.0% 0 0.0% 0HA3 7 2.4% 24 0.0% 0 0.0% 0 0.0% 0 0.0% 0 0.0% 0 16.6% 24 0.0% 0 0.0% 0 0.0% 0 0.0% 0HA3 8 3.0% 30 0.0% 0 0.0% 0 0.0% 0 0.0% 0 0.0% 0 0.0% 0 0.0% 0 22.2% 30 0.0% 0 0.0% 0HA3 9 3.4% 34 0.0% 0 0.0% 0 0.0% 0 0.0% 0 0.0% 0 0.0% 0 0.0% 0 25.2% 34 0.0% 0 0.0% 0HA4 0 2.4% 24 0.0% 0 0.0% 0 20.9% 24 0.0% 0 0.0% 0 0.0% 0 0.0% 0 0.0% 0 0.0% 0 0.0% 0HA4 7 2.5% 25 0.0% 0 100.0% 25 0.0% 0 0.0% 0 0.0% 0 0.0% 0 0.0% 0 0.0% 0 0.0% 0 0.0% 0HA4 8 2.1% 21 0.0% 0 0.0% 0 18.3% 21 0.0% 0 0.0% 0 0.0% 0 0.0% 0 0.0% 0 0.0% 0 0.0% 0HA4 9 2.7% 27 0.0% 0 0.0% 0 23.5% 27 0.0% 0 0.0% 0 0.0% 0 0.0% 0 0.0% 0 0.0% 0 0.0% 0HA5 1 2.2% 22 0.0% 0 0.0% 0 19.1% 22 0.0% 0 0.0% 0 0.0% 0 0.0% 0 0.0% 0 0.0% 0 0.0% 0HA5 2 2.1% 21 0.0% 0 0.0% 0 18.3% 21 0.0% 0 0.0% 0 0.0% 0 0.0% 0 0.0% 0 0.0% 0 0.0% 0HA5 3 2.7% 27 0.0% 0 0.0% 0 0.0% 0 31.8% 27 0.0% 0 0.0% 0 0.0% 0 0.0% 0 0.0% 0 0.0% 0HA5 4 2.0% 20 0.0% 0 0.0% 0 0.0% 0 23.5% 20 0.0% 0 0.0% 0 0.0% 0 0.0% 0 0.0% 0 0.0% 0HA5 5 2.0% 20 0.0% 0 0.0% 0 0.0% 0 0.0% 0 12.1% 20 0.0% 0 0.0% 0 0.0% 0 0.0% 0 0.0% 0HA6 1 2.1% 21 38.2% 21 0.0% 0 0.0% 0 0.0% 0 0.0% 0 0.0% 0 0.0% 0 0.0% 0 0.0% 0 0.0% 0HA6 2 2.0% 20 36.4% 20 0.0% 0 0.0% 0 0.0% 0 0.0% 0 0.0% 0 0.0% 0 0.0% 0 0.0% 0 0.0% 0HA6 3 1.4% 14 25.5% 14 0.0% 0 0.0% 0 0.0% 0 0.0% 0 0.0% 0 0.0% 0 0.0% 0 0.0% 0 0.0% 0HA7 1 1.5% 15 0.0% 0 0.0% 0 0.0% 0 0.0% 0 0.0% 0 0.0% 0 0.0% 0 11.1% 15 0.0% 0 0.0% 0HA7 2 2.8% 28 0.0% 0 0.0% 0 0.0% 0 0.0% 0 0.0% 0 0.0% 0 0.0% 0 20.7% 28 0.0% 0 0.0% 0HA7 3 1.9% 19 0.0% 0 0.0% 0 0.0% 0 0.0% 0 0.0% 0 0.0% 0 0.0% 0 0.0% 0 0.0% 0 54.3% 19HA7 4 1.6% 16 0.0% 0 0.0% 0 0.0% 0 0.0% 0 0.0% 0 0.0% 0 0.0% 0 0.0% 0 0.0% 0 45.7% 16HA8 5 2.8% 28 0.0% 0 0.0% 0 0.0% 0 0.0% 0 0.0% 0 0.0% 0 0.0% 0 0.0% 0 25.5% 28 0.0% 0HA8 6 2.5% 25 0.0% 0 0.0% 0 0.0% 0 0.0% 0 0.0% 0 0.0% 0 0.0% 0 0.0% 0 22.7% 25 0.0% 0HA8 7 1.0% 10 0.0% 0 0.0% 0 0.0% 0 0.0% 0 0.0% 0 0.0% 0 0.0% 0 0.0% 0 9.1% 10 0.0% 0HA9 7 1.6% 16 0.0% 0 0.0% 0 0.0% 0 0.0% 0 0.0% 0 0.0% 0 12.3% 16 0.0% 0 0.0% 0 0.0% 0HA9 8 3.2% 32 0.0% 0 0.0% 0 0.0% 0 0.0% 0 0.0% 0 0.0% 0 24.6% 32 0.0% 0 0.0% 0 0.0% 0NW9 0 2.4% 24 0.0% 0 0.0% 0 0.0% 0 0.0% 0 0.0% 0 0.0% 0 0.0% 0 0.0% 0 21.8% 24 0.0% 0NW9 9 2.3% 23 0.0% 0 0.0% 0 0.0% 0 0.0% 0 0.0% 0 0.0% 0 0.0% 0 0.0% 0 20.9% 23 0.0% 0UB5 4 3.4% 34 0.0% 0 0.0% 0 0.0% 0 0.0% 0 20.6% 34 0.0% 0 0.0% 0 0.0% 0 0.0% 0 0.0% 0UB6 0 2.7% 27 0.0% 0 0.0% 0 0.0% 0 0.0% 0 0.0% 0 0.0% 0 20.8% 27 0.0% 0 0.0% 0 0.0% 0WD196 1.7% 17 0.0% 0 0.0% 0 0.0% 0 20.0% 17 0.0% 0 0.0% 0 0.0% 0 0.0% 0 0.0% 0 0.0% 0
Base: 1000 55 25 115 85 165 145 130 135 110 35
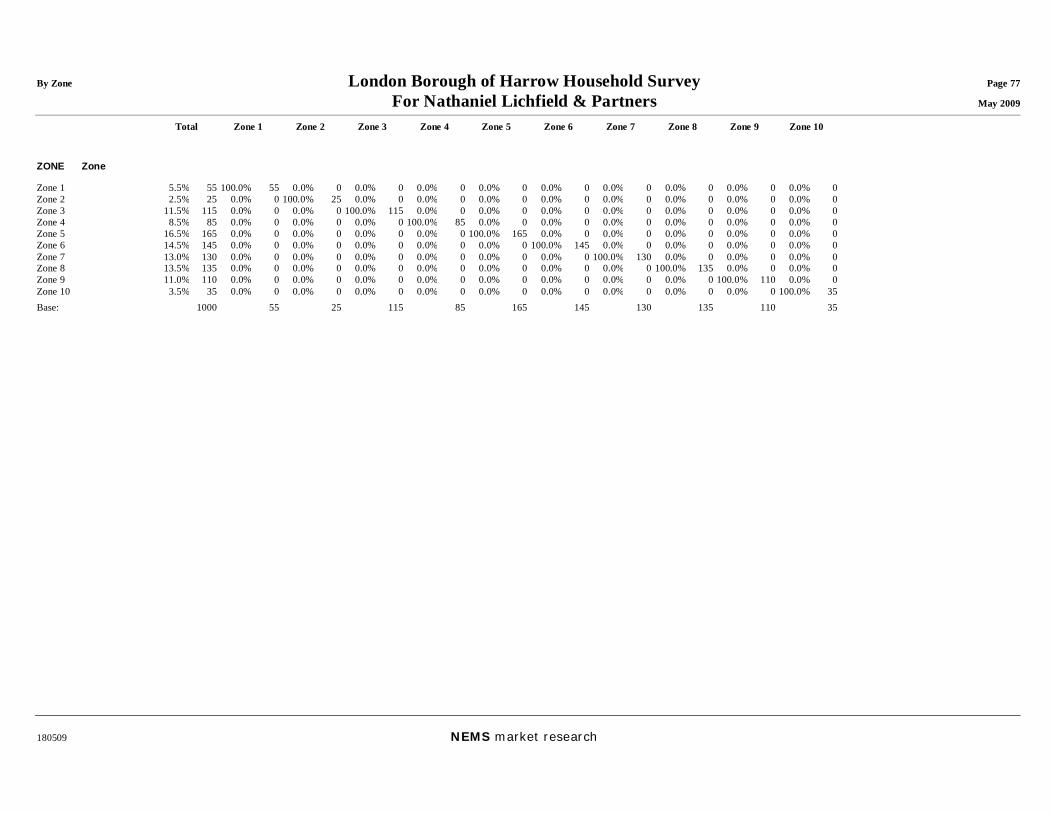
By Zone London Borough of Harrow Household Survey Page 77 For Nathaniel Lichfield & Partners May 2009
Total Zone 1 Zone 2 Zone 3 Zone 4 Zone 5 Zone 6 Zone 7 Zone 8 Zone 9 Zone 10
180509 NEMS market research
ZONE Zone Zone 1 5.5% 55 100.0% 55 0.0% 0 0.0% 0 0.0% 0 0.0% 0 0.0% 0 0.0% 0 0.0% 0 0.0% 0 0.0% 0Zone 2 2.5% 25 0.0% 0 100.0% 25 0.0% 0 0.0% 0 0.0% 0 0.0% 0 0.0% 0 0.0% 0 0.0% 0 0.0% 0Zone 3 11.5% 115 0.0% 0 0.0% 0 100.0% 115 0.0% 0 0.0% 0 0.0% 0 0.0% 0 0.0% 0 0.0% 0 0.0% 0Zone 4 8.5% 85 0.0% 0 0.0% 0 0.0% 0 100.0% 85 0.0% 0 0.0% 0 0.0% 0 0.0% 0 0.0% 0 0.0% 0Zone 5 16.5% 165 0.0% 0 0.0% 0 0.0% 0 0.0% 0 100.0% 165 0.0% 0 0.0% 0 0.0% 0 0.0% 0 0.0% 0Zone 6 14.5% 145 0.0% 0 0.0% 0 0.0% 0 0.0% 0 0.0% 0 100.0% 145 0.0% 0 0.0% 0 0.0% 0 0.0% 0Zone 7 13.0% 130 0.0% 0 0.0% 0 0.0% 0 0.0% 0 0.0% 0 0.0% 0 100.0% 130 0.0% 0 0.0% 0 0.0% 0Zone 8 13.5% 135 0.0% 0 0.0% 0 0.0% 0 0.0% 0 0.0% 0 0.0% 0 0.0% 0 100.0% 135 0.0% 0 0.0% 0Zone 9 11.0% 110 0.0% 0 0.0% 0 0.0% 0 0.0% 0 0.0% 0 0.0% 0 0.0% 0 0.0% 0 100.0% 110 0.0% 0Zone 10 3.5% 35 0.0% 0 0.0% 0 0.0% 0 0.0% 0 0.0% 0 0.0% 0 0.0% 0 0.0% 0 0.0% 0 100.0% 35Base: 1000 55 25 115 85 165 145 130 135 110 35

Appendix F
Evaluation of Potential Development Sites
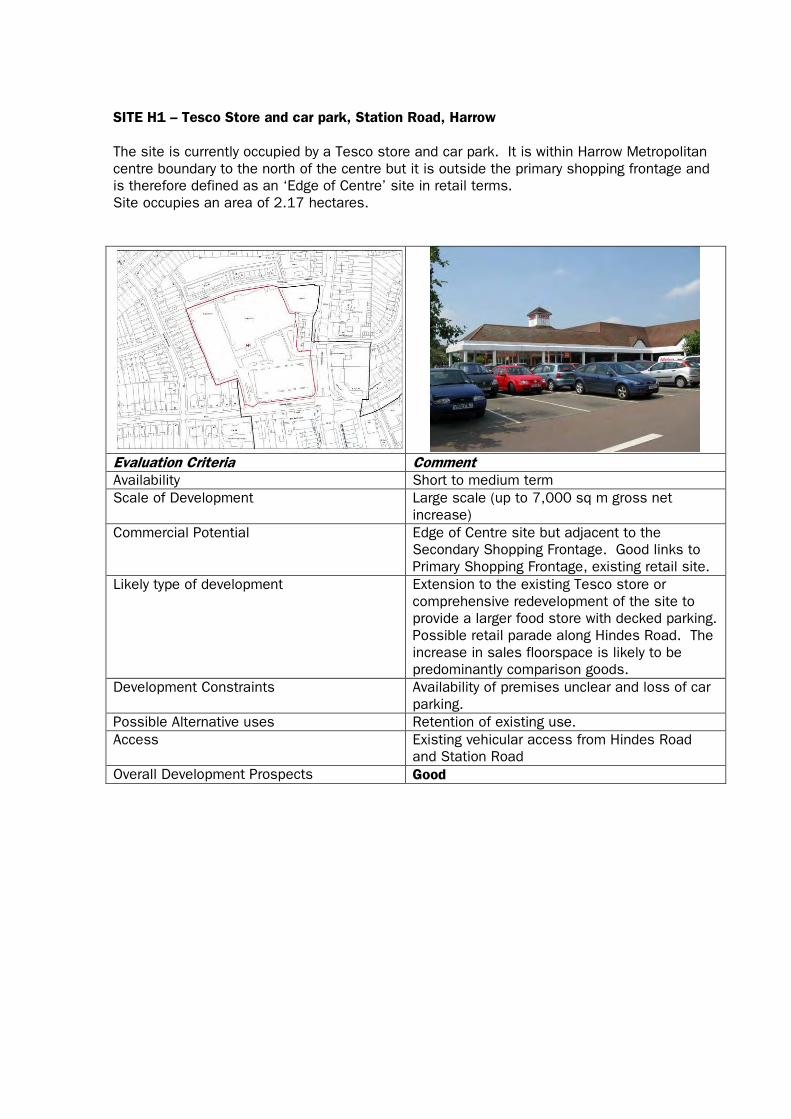
SITE H1 – Tesco Store and car park, Station Road, Harrow
The site is currently occupied by a Tesco store and car park. It is within Harrow Metropolitan
centre boundary to the north of the centre but it is outside the primary shopping frontage and
is therefore defined as an ‘Edge of Centre’ site in retail terms.
Site occupies an area of 2.17 hectares.
Evaluation Criteria Comment
Availability Short to medium term
Scale of Development Large scale (up to 7,000 sq m gross net
increase)
Commercial Potential Edge of Centre site but adjacent to the
Secondary Shopping Frontage. Good links to
Primary Shopping Frontage, existing retail site.
Likely type of development Extension to the existing Tesco store or
comprehensive redevelopment of the site to
provide a larger food store with decked parking.
Possible retail parade along Hindes Road. The
increase in sales floorspace is likely to be
predominantly comparison goods.
Development Constraints Availability of premises unclear and loss of car
parking.
Possible Alternative uses Retention of existing use.
Access Existing vehicular access from Hindes Road
and Station Road
Overall Development Prospects Good
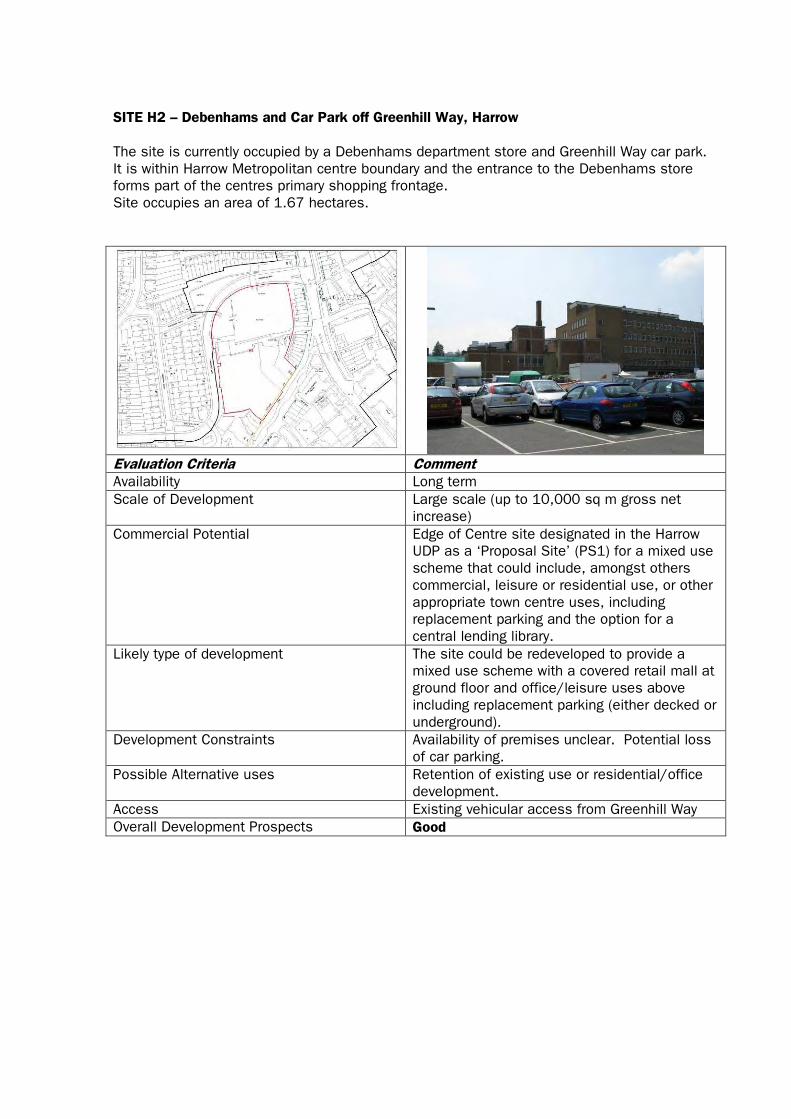
SITE H2 – Debenhams and Car Park off Greenhill Way, Harrow
The site is currently occupied by a Debenhams department store and Greenhill Way car park.
It is within Harrow Metropolitan centre boundary and the entrance to the Debenhams store
forms part of the centres primary shopping frontage.
Site occupies an area of 1.67 hectares.
Evaluation Criteria Comment
Availability Long term
Scale of Development Large scale (up to 10,000 sq m gross net
increase)
Commercial Potential Edge of Centre site designated in the Harrow
UDP as a ‘Proposal Site’ (PS1) for a mixed use
scheme that could include, amongst others
commercial, leisure or residential use, or other
appropriate town centre uses, including
replacement parking and the option for a
central lending library.
Likely type of development The site could be redeveloped to provide a
mixed use scheme with a covered retail mall at
ground floor and office/leisure uses above
including replacement parking (either decked or
underground).
Development Constraints Availability of premises unclear. Potential loss
of car parking.
Possible Alternative uses Retention of existing use or residential/office
development.
Access Existing vehicular access from Greenhill Way
Overall Development Prospects Good

SITE H3 – Offices and car parking on Lyons Road, Harrow
The site is currently occupied by two office buildings, one four storey office and one six storey
office. The offices are both on stilts with car parking on the ground floor. The site is within
Harrow Metropolitan centre boundary, but it is outside the primary shopping frontage and is
therefore an ‘Edge of Centre’ site in retail terms.
Site occupies an area of 0.93 hectares.
Evaluation Criteria Comment
Availability Medium to long term
Scale of Development Large scale (up to 5,000 sq m gross)
Commercial Potential Edge of Centre site with potential retail
frontage onto Lyon Road. Relatively good links
through to the Primary Shopping Frontage
however the car park/offices to the west of
Lyons Road act as a barrier.
Likely type of development The site could be redeveloped to provide a
comprehensive mixed use scheme with new
retail uses at ground floor and
residential/office/leisure uses above or several
large format retail uses such as retail
warehousing or a food retailer.
Development Constraints Availability of premises unclear, high density
use exists on site.
Possible Alternative uses Retention of existing use or residential
development.
Access Existing vehicular access from Lyons Road
Overall Development Prospects Reasonable/Poor

SITE H4 – Havelock Place, Harrow
The site is currently occupied by Havelock Place which provides access to one of the service
areas for the St Ann’s Centre. It also includes several buildings including Fitz Health Club.
The site is within Harrow Metropolitan centre boundary and is part of the Primary Shopping
Frontage. The closure of Havelock Place is a long standing Council objective to enable
complete pedestrianisation of St Ann’s Road and the intention is to provide a new access off
College Road.
Site occupies an area of 0.6 hectares.
Evaluation Criteria Comment
Availability Medium to long term
Scale of Development Large scale (up to 5,000 sq m gross at
multiple levels)
Commercial Potential Edge of Centre site allocated in the Harrow
UDP as a ‘Potential Site’ (PS 9) for a mixed use
scheme for retail, leisure or commercial use,
including an element of residential.
Likely type of development Redevelopment of site to provide retail at
ground floor and first floor level with one to two
storeys of office/residential above. Havelock
Place to be closed so that an uninterrupted
retail frontage can be provided along St Ann’s
Road. New access provided from College Road
(knocking through the existing Pizza Express
unit)
Development Constraints Availability of premises unclear and providing
new access.
Possible Alternative uses Retention of existing uses and service area.
Access New access off College Road or alternatively
Station Road.
Overall Development Prospects Reasonable

SITE H5 –Station Site/South side of College Road, Harrow
The site is currently occupied by several office buildings with retail units at ground level, a
vacant office building, Harrow public transport interchange and Harrow Baptist Church.
The site is within Harrow Metropolitan centre boundary but outside the primary shopping
frontage and is therefore an ‘Edge of Centre’ site in retail terms. Some of the site is part of
the centres Secondary Shopping Frontage.
Site occupies an area of 1.56 hectares.
Evaluation Criteria Comment
Availability Medium to long term
Scale of Development Large scale (up to 10,000 sq m gross)
Commercial Potential Edge of Centre site allocated in the Harrow
UDP as a ‘Proposal Site’ (PS 6) for public
transport improvements and mixed use
development for office, education, civic,
residential, leisure and retail use and open
space.
Likely type of development Comprehensive redevelopment of the site to
provide a mixed use development surrounding
the improved public transport hub. Retail at
ground floor level and a mix of office, leisure
and residential above.
Development Constraints Availability of premises unclear.
Possible Alternative uses Retention of existing use or part redevelopment
for residential/office development.
Access Existing vehicular access from College Road
Overall Development Prospects Good
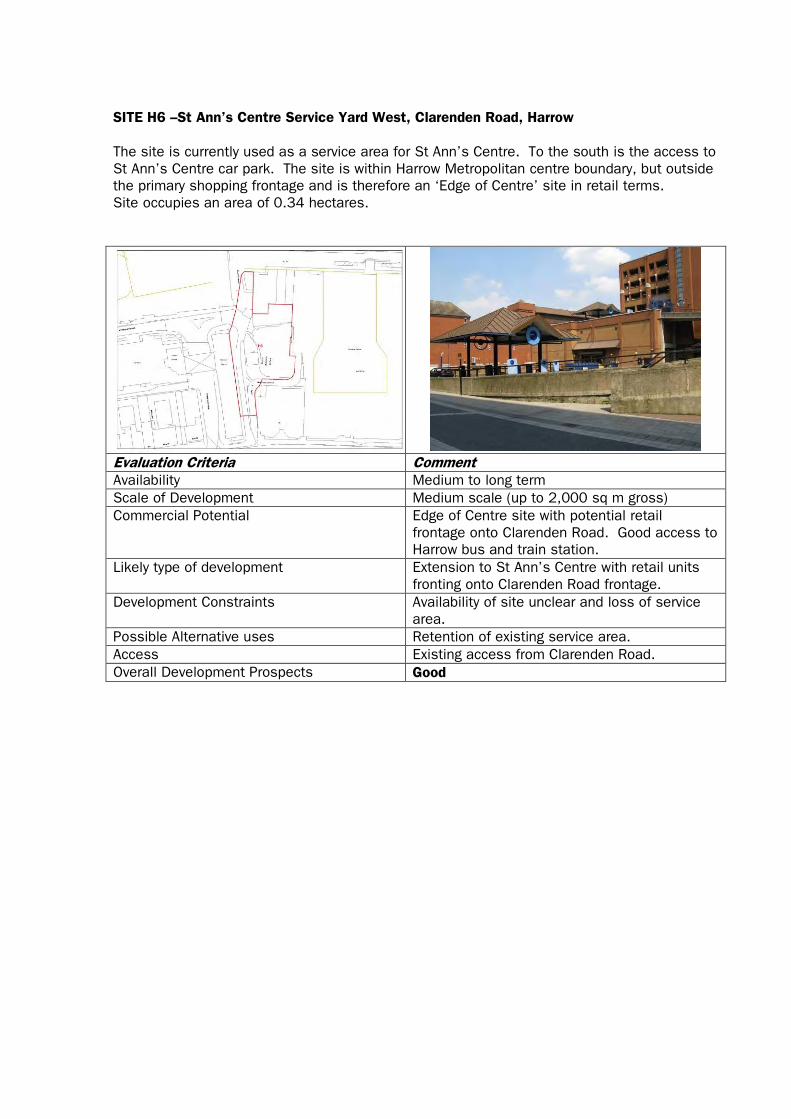
SITE H6 –St Ann’s Centre Service Yard West, Clarenden Road, Harrow
The site is currently used as a service area for St Ann’s Centre. To the south is the access to
St Ann’s Centre car park. The site is within Harrow Metropolitan centre boundary, but outside
the primary shopping frontage and is therefore an ‘Edge of Centre’ site in retail terms.
Site occupies an area of 0.34 hectares.
Evaluation Criteria Comment
Availability Medium to long term
Scale of Development Medium scale (up to 2,000 sq m gross)
Commercial Potential Edge of Centre site with potential retail
frontage onto Clarenden Road. Good access to
Harrow bus and train station.
Likely type of development Extension to St Ann’s Centre with retail units
fronting onto Clarenden Road frontage.
Development Constraints Availability of site unclear and loss of service
area.
Possible Alternative uses Retention of existing service area.
Access Existing access from Clarenden Road.
Overall Development Prospects Good
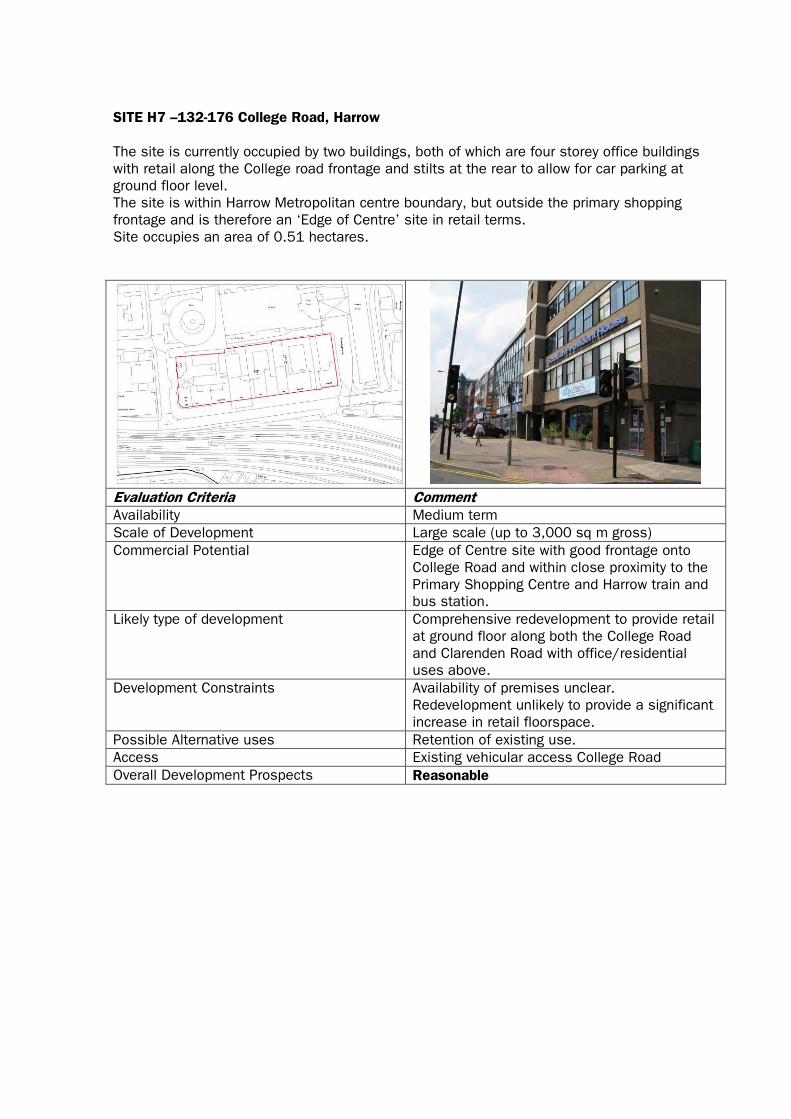
SITE H7 –132-176 College Road, Harrow
The site is currently occupied by two buildings, both of which are four storey office buildings
with retail along the College road frontage and stilts at the rear to allow for car parking at
ground floor level.
The site is within Harrow Metropolitan centre boundary, but outside the primary shopping
frontage and is therefore an ‘Edge of Centre’ site in retail terms.
Site occupies an area of 0.51 hectares.
Evaluation Criteria Comment
Availability Medium term
Scale of Development Large scale (up to 3,000 sq m gross)
Commercial Potential Edge of Centre site with good frontage onto
College Road and within close proximity to the
Primary Shopping Centre and Harrow train and
bus station.
Likely type of development Comprehensive redevelopment to provide retail
at ground floor along both the College Road
and Clarenden Road with office/residential
uses above.
Development Constraints Availability of premises unclear.
Redevelopment unlikely to provide a significant
increase in retail floorspace.
Possible Alternative uses Retention of existing use.
Access Existing vehicular access College Road
Overall Development Prospects Reasonable

SITE W1 – Corner of Canning Road and George Gange Way, Wealdstone
An Edge of Centre site to the east of Wealdstone town centre on the junction of Canning Road
and George Gange Way, currently occupied by Rabi Motors.
Site occupies an area of 450 sq m.
Evaluation Criteria Comment
Availability Short to Medium term
Scale of Development Small scale (up to 300 sq m gross)
Commercial Potential Edge of Centre site with potential retail frontage
onto George Gange Way.
Likely type of development Retail/other Class A units with
residential/offices above.
Development Constraints Availability of premises unclear and busy road is
a barrier between the site and the primary
shopping frontages.
Possible Alternative uses Retention of existing use or residential/office
development.
Access Existing vehicular access from Canning Road
and George Gange Way.
Overall Development Prospects Reasonable/Poor

SITE W2 – Land to north of Canning Road, Wealdstone
Land including Construction Solutions Ltd to the north of Canning Road. Within Wealdstone
District Centre, as designated in the UDP, but is not within the Primary Shopping Frontage and
therefore could be designated as an ‘Edge of Centre’ site in retail terms.
Site occupies an area of 0.13 hectare.
Evaluation Criteria Comment
Availability Short to Medium term
Scale of Development Small scale (up to 800 sq m gross)
Commercial Potential Edge of Centre site with potential retail
frontage onto Canning Road and good links
with primary and secondary shopping frontages.
Likely type of development A mixed use scheme to include residential and
retail development or a large format retail use
such as a retail warehouse or food retailer.
Development Constraints Availability of premises unclear.
Possible Alternative uses Retention of existing use or residential/office
development.
Access Existing vehicular access from Canning Road
and George Gange Way.
Overall Development Prospects Good

SITE W3 – Peel House Car Park and hall to south of Canning Road, Wealdstone
The site includes Peel House car park and hall to the south of Canning Road and west of
George Gange Way. The site is within Wealdstone District Centre, as designated in the UDP,
but is not within the Primary Shopping Frontage, and therefore could be an ‘Edge of Centre’
site in retail terms.
Site occupies an area of 0.39 hectares.
Evaluation Criteria Comment
Availability Medium to Long term
Scale of Development Medium scale (up to 2,000 sq m gross)
Commercial Potential Edge of Centre site located on a busy main
road but with good access to the primary
shopping frontage.
Likely type of development A mixed use scheme to include residential and
retail development or a large format retail use
such as a retail warehouse or food retailer with
decked car parking.
Development Constraints Availability of premises unclear and loss of car
parking.
Possible Alternative uses Retention of existing car park or
residential/office development.
Access Existing vehicular access from Canning Road
and Gladstone Way
Overall Development Prospects Reasonable/Poor

SITE W4 – Land to south of Palmerston Road and west of George Gange Way, Wealdstone
The site includes Dellers Car Care to the south of Palmerston Road and west of George
Gange Way. The site is within Wealdstone District Centre, as designated in the UDP, but is
not within the Primary Shopping Frontage and therefore is an ‘Edge of Centre’ site in retail
terms.
Site occupies an area of 0.27 hectares.
Evaluation Criteria Comment
Availability Medium to Long term
Scale of Development Small scale (up to 1,000 sq m gross)
Commercial Potential Edge of Centre site with good links to the town
centre.
Likely type of development Large format retail use such as a retail
warehouse unit or a discount food store.
Alternatively a commercial leisure use could be
provided such as a health and fitness facility.
Development Constraints Availability of premises unclear and limited
retail frontage on Palmerston Road. George
Gange Way is a busy road which would restrict
retail frontage along the eastern boundary of
the site.
Possible Alternative uses Retention of existing use or residential/office
development.
Access Existing vehicular access from Palmerston
Road.
Overall Development Prospects Good

SITE W5 – Land to south of Palmerston Road and east of George Gange Way, Wealdstone
The site includes Nationwide Autocentre and area to the rear on the junction of Palmerston
Road and George Gange Way. The site is outside the district centre and is therefore an ‘Edge
of Centre’ site in retail terms.
Site occupies an area of 0.27 hectares.
Evaluation Criteria Comment
Availability Medium to Long term
Scale of Development Small scale (up to 1,000 sq m gross)
Commercial Potential Edge of Centre site but with reasonable links to
the town centre.
Likely type of development Large format retail use such as a retail
warehouse unit or a discount food store.
Alternatively a commercial leisure use could be
provided such as a health and fitness facility.
Development Constraints Availability of premises unclear and busy road
is a barrier between the site and the primary
shopping frontages.
Possible Alternative uses Retention of existing use or residential/office
development.
Access Existing vehicular access from Palmerston
Road.
Overall Development Prospects Reasonable

SITE W6 – Harrow & Wealdstone Car Park, Ellen Web Drive, Wealdstone
Harrow and Wealdstone Car Park on Ellen Web Drive in Wealdstone is within Wealdstone
District Centre, as designated in the UDP, but is not within the Primary Shopping Frontage and
therefore is an ‘Edge of Centre’ site in retail terms.
Site occupies an area of 0.3 hectares.
Evaluation Criteria Comment
Availability Short term
Scale of Development Small scale (up to 1,000 sq m gross)
Commercial Potential Edge of Centre site but with reasonable links to
the primary shopping frontage.
Likely type of development A mixed use scheme to include residential and
retail development or a large format retail use
such as a retail warehouse or food retailer.
Development Constraints Loss of existing car parking, long narrow site.
Possible Alternative uses Retention of existing use or residential/office
development.
Access Existing vehicular access from Ellen Webb
Drive.
Overall Development Prospects Poor
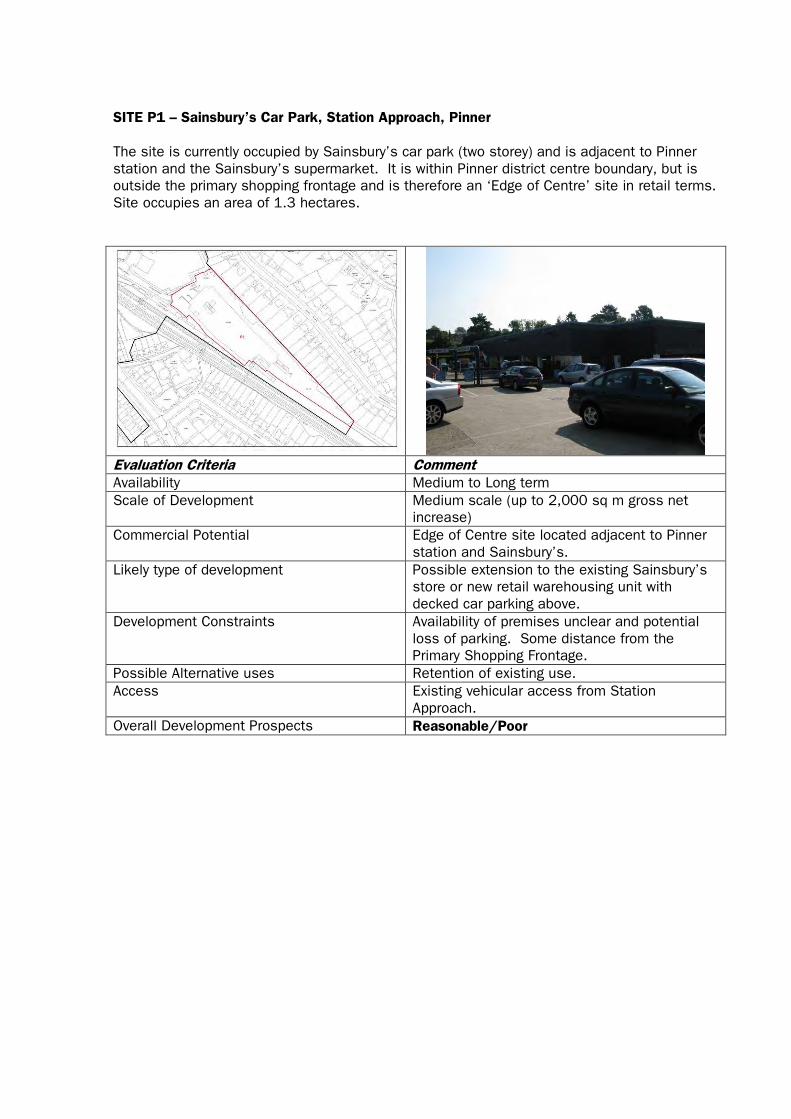
SITE P1 – Sainsbury’s Car Park, Station Approach, Pinner
The site is currently occupied by Sainsbury’s car park (two storey) and is adjacent to Pinner
station and the Sainsbury’s supermarket. It is within Pinner district centre boundary, but is
outside the primary shopping frontage and is therefore an ‘Edge of Centre’ site in retail terms.
Site occupies an area of 1.3 hectares.
Evaluation Criteria Comment
Availability Medium to Long term
Scale of Development Medium scale (up to 2,000 sq m gross net
increase)
Commercial Potential Edge of Centre site located adjacent to Pinner
station and Sainsbury’s.
Likely type of development Possible extension to the existing Sainsbury’s
store or new retail warehousing unit with
decked car parking above.
Development Constraints Availability of premises unclear and potential
loss of parking. Some distance from the
Primary Shopping Frontage.
Possible Alternative uses Retention of existing use.
Access Existing vehicular access from Station
Approach.
Overall Development Prospects Reasonable/Poor

SITE P2 – Land between High Street and Love Lane (Bishops Walk/Beaumont Mews),
Pinner
The site is currently occupied by small retail units (Beaumont Mews) and a service area/car
parking. The site is adjacent to the Marks and Spencer Simply Food store. It is within Pinner
district centre boundary and the units form part of the Primary Shopping Frontage.
Site occupies an area of 0.31 hectares.
Evaluation Criteria Comment
Availability Medium to Long term
Scale of Development Medium scale (up to 1,500 sq m gross net
increase)
Commercial Potential Within the town centre with part of the site
on a Primary Shopping Frontage.
Likely type of development Redevelopment to provide mixed use
scheme with retail at ground floor and
two/three stories of residential/office
above.
Development Constraints Part of the site is the existing service area
for units on Bridge St. Loss of parking.
Poor access to the site – no main retail
frontage. Availability of premises unclear.
Part of the flood plain.
Possible Alternative uses Retention of existing use or
residential/office development.
Access Existing vehicular access from Love Lane.
Overall Development Prospects Reasonable

SITE P3 – Marks &Spencer Car Park off Love Lane, Pinner
The site is currently occupied by a Marks & Spencer car park. It is within Pinner district
centre boundary, but is outside the primary shopping frontage and is therefore defined as an
‘Edge of Centre’ site in retail terms.
Site occupies an area of 0.51 hectares.
Evaluation Criteria Comment
Availability Short to medium term
Scale of Development Medium scale (up to 1,500 sq m gross)
Commercial Potential Edge of Centre site adjacent to the existing
Marks & Spencer store.
Likely type of development Large format retail use such as a retail
warehouse unit or a food store. Alternatively a
commercial leisure use could be provided such
as a health and fitness facility.
Development Constraints Availability of premises unclear and loss of
existing car parking. Site is on the flood plain.
Possible Alternative uses Retention of existing use or residential/office
development.
Access Existing vehicular access off Love Lane.
Overall Development Prospects Poor

SITE RL1 – Units south of Tube Station on Alexandra Avenue, Rayners Lane
The site includes five single storey units and land at rear on Alexandra Avenue to the south of
Rayners Lane tube station. The site is within Rayners Lane District Centre, as designated in
the UDP, and is within the Primary Shopping Frontage.
Site occupies an area of 0.11 hectares.
Evaluation Criteria Comment
Availability Short to medium term
Scale of Development Small scale (up to 500 sq m gross)
Commercial Potential Site is within the Rayners Lane Primary
Shopping Frontage adjacent to the tube station.
Likely type of development Redevelopment to provide mixed use scheme
with retail at ground floor and two/three stories
of residential/office above.
Development Constraints Availability of premises unclear.
Possible Alternative uses Retention of existing use.
Access Existing vehicular access from Alexandra
Avenue.
Overall Development Prospects Good

SITE RL2 – Harrow West Conservative Association and Hallmark Cars, Village Way, Rayners
Lane
The site is located just outside Rayners Lane District Centre and is therefore an ‘Edge of
Centre’ site. Current uses on the site include Harrow West Conservative Association inc.
Curves Fitness and Hallmark Cars.
Site occupies an area of 0.19 hectares.
Evaluation Criteria Comment
Availability Medium term
Scale of Development Small scale (up to 1,000 sq m gross)
Commercial Potential Edge of Centre site with good frontage onto
Village Way and adjacent to Secondary
Shopping Frontage.
Likely type of development The site could be re-developed to form several
retail units at ground floor with 2/3 storeys of
residential and office uses above or for a single
retailer such as a discount food retailers with
residential/offices uses above.
Development Constraints Availability of premises unclear.
Possible Alternative uses Retention of existing use or residential
development.
Access Existing vehicular access from Village Way.
Overall Development Prospects Good

SITE RL3 – Rayners Lane Car Park and former Pub, Village Way East, Rayners Lane
The site is located within Rayners Lane District Centre, but is not within the Primary Shopping
Frontage and is therefore an ‘Edge of Centre’ site in retail terms. Site is currently used as
Rayners Lane car park and includes the former Rayners Pub.
Site occupies an area of 0.38 hectares.
Evaluation Criteria Comment
Availability Short term
Scale of Development Medium scale (up to 2,000 sq m gross)
Commercial Potential Edge of Centre site with good frontage onto
Village Way East and Imperial Drive.
Likely type of development The site could be redeveloped to provide a
comprehensive mixed use scheme with new
retail uses at ground floor and
residential/office/leisure uses above or several
large format retail uses such as retail
warehousing or a food retailer.
Development Constraints Availability of premises unclear loss of main car
park within the centre.
Possible Alternative uses Retention and formalisation of existing use or
residential/office development.
Access Existing vehicular access from Village Way East
or new access from Imperial Drive.
Overall Development Prospects Good

SITE NH1 – Cambridge Road Car Park and North Harrow Home Guard Club, Off Pinner Road,
North Harrow
The site is located between Cambridge Road and Pinner Road within North Harrow district
centre. It is within the defined centre boundary but is not within the Primary Shopping
Frontage and is therefore defined as an ‘Edge of Centre’ site in retail terms. Site is currently
used as Cambridge Road car park, North Harrow Home Guard Club, Harrow Gateway and St
John’s Ambulance.
Site occupies an area of 0.8 hectares.
Evaluation Criteria Comment
Availability Medium term
Scale of Development Medium scale (up to 2,500 sq m gross)
Commercial Potential Edge of Centre site with access through to
Primary Shopping Frontage, albeit limited.
Likely type of development Large format retail use such as a retail
warehouse unit or a food store. Alternatively a
commercial leisure use could be provided such
as a health and fitness facility.
Development Constraints Availability of premises unclear, poor access
and no retail frontage. The site is also on a
flood plain. Loss of car parking.
Possible Alternative uses Retention of existing use and parking or
residential development.
Access Existing vehicular access Pinner Road and
Cambridge Road.
Overall Development Prospects Reasonable/Poor

SITE NH2 – North Harrow Methodist Church, Pinner Road, North Harrow
The site is currently occupied by North Harrow Methodist Church. It is just outside the North
Harrow district centre boundary to the north of the centre and is an ‘Edge of Centre’ site.
Site occupies an area of 0.34 hectares.
Evaluation Criteria Comment
Availability Medium term
Scale of Development Medium scale (up to 2,000 sq m gross)
Commercial Potential Edge of Centre site with good retail frontage
onto George V Avenue and within close
proximity to the Secondary Shopping Frontage.
Likely type of development The site could be re-developed to form several
retail units at ground floor with 2/3 storeys of
residential and office uses above or for a single
retailer such as a discount food retailers with
residential/offices uses above.
Development Constraints Availability of premises unclear.
Possible Alternative uses Retention of existing use or residential/office
development.
Access Existing vehicular access from George V
Avenue.
Overall Development Prospects Reasonable
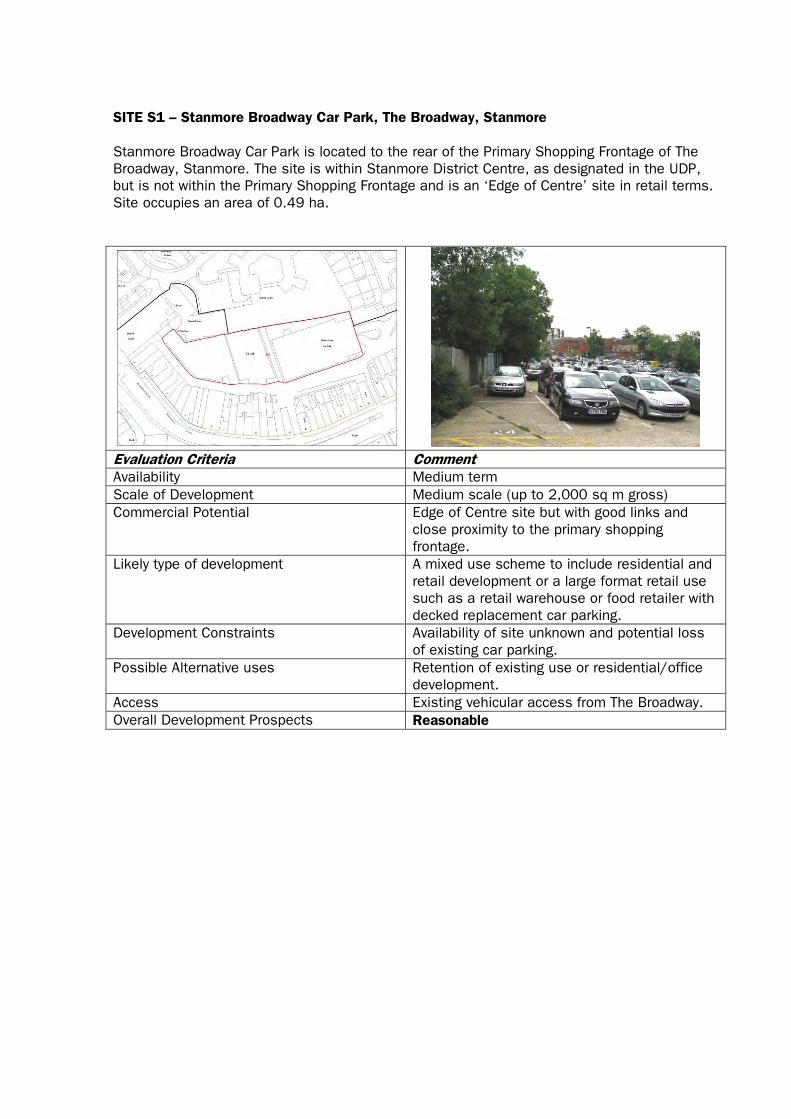
SITE S1 – Stanmore Broadway Car Park, The Broadway, Stanmore
Stanmore Broadway Car Park is located to the rear of the Primary Shopping Frontage of The
Broadway, Stanmore. The site is within Stanmore District Centre, as designated in the UDP,
but is not within the Primary Shopping Frontage and is an ‘Edge of Centre’ site in retail terms.
Site occupies an area of 0.49 ha.
Evaluation Criteria Comment
Availability Medium term
Scale of Development Medium scale (up to 2,000 sq m gross)
Commercial Potential Edge of Centre site but with good links and
close proximity to the primary shopping
frontage.
Likely type of development A mixed use scheme to include residential and
retail development or a large format retail use
such as a retail warehouse or food retailer with
decked replacement car parking.
Development Constraints Availability of site unknown and potential loss
of existing car parking.
Possible Alternative uses Retention of existing use or residential/office
development.
Access Existing vehicular access from The Broadway.
Overall Development Prospects Reasonable
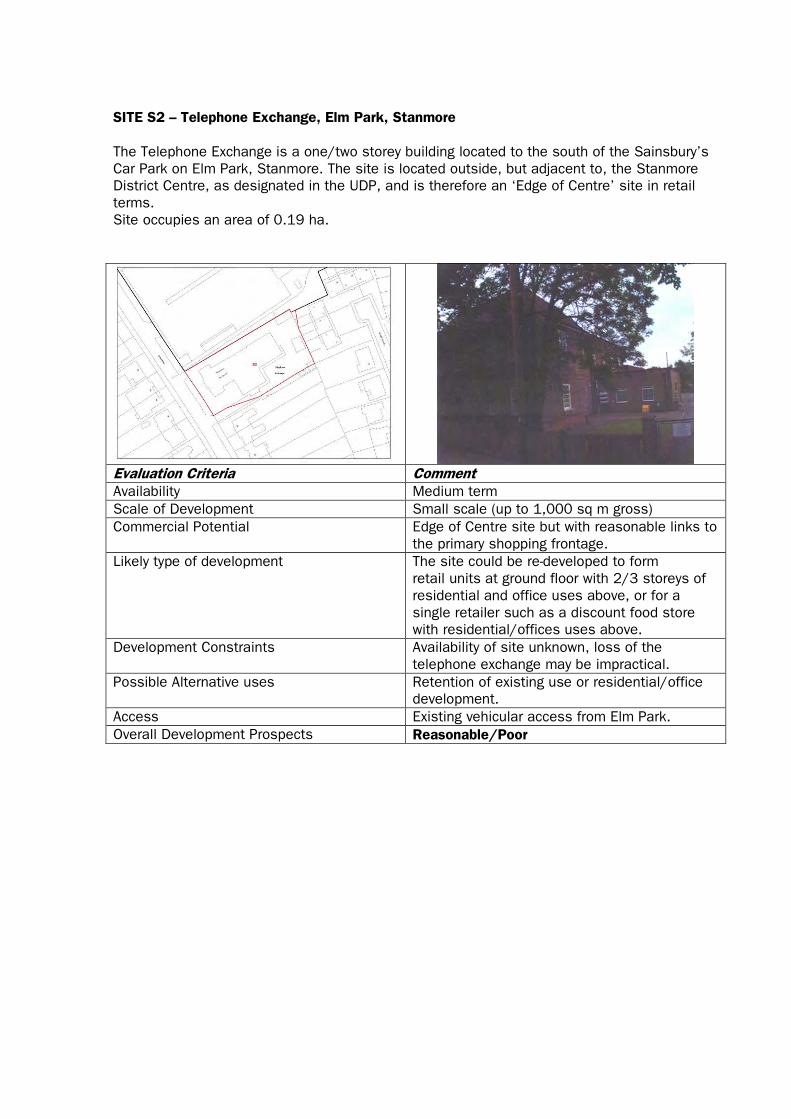
SITE S2 – Telephone Exchange, Elm Park, Stanmore
The Telephone Exchange is a one/two storey building located to the south of the Sainsbury’s
Car Park on Elm Park, Stanmore. The site is located outside, but adjacent to, the Stanmore
District Centre, as designated in the UDP, and is therefore an ‘Edge of Centre’ site in retail
terms.
Site occupies an area of 0.19 ha.
Evaluation Criteria Comment
Availability Medium term
Scale of Development Small scale (up to 1,000 sq m gross)
Commercial Potential Edge of Centre site but with reasonable links to
the primary shopping frontage.
Likely type of development The site could be re-developed to form
retail units at ground floor with 2/3 storeys of
residential and office uses above, or for a
single retailer such as a discount food store
with residential/offices uses above.
Development Constraints Availability of site unknown, loss of the
telephone exchange may be impractical.
Possible Alternative uses Retention of existing use or residential/office
development.
Access Existing vehicular access from Elm Park.
Overall Development Prospects Reasonable/Poor
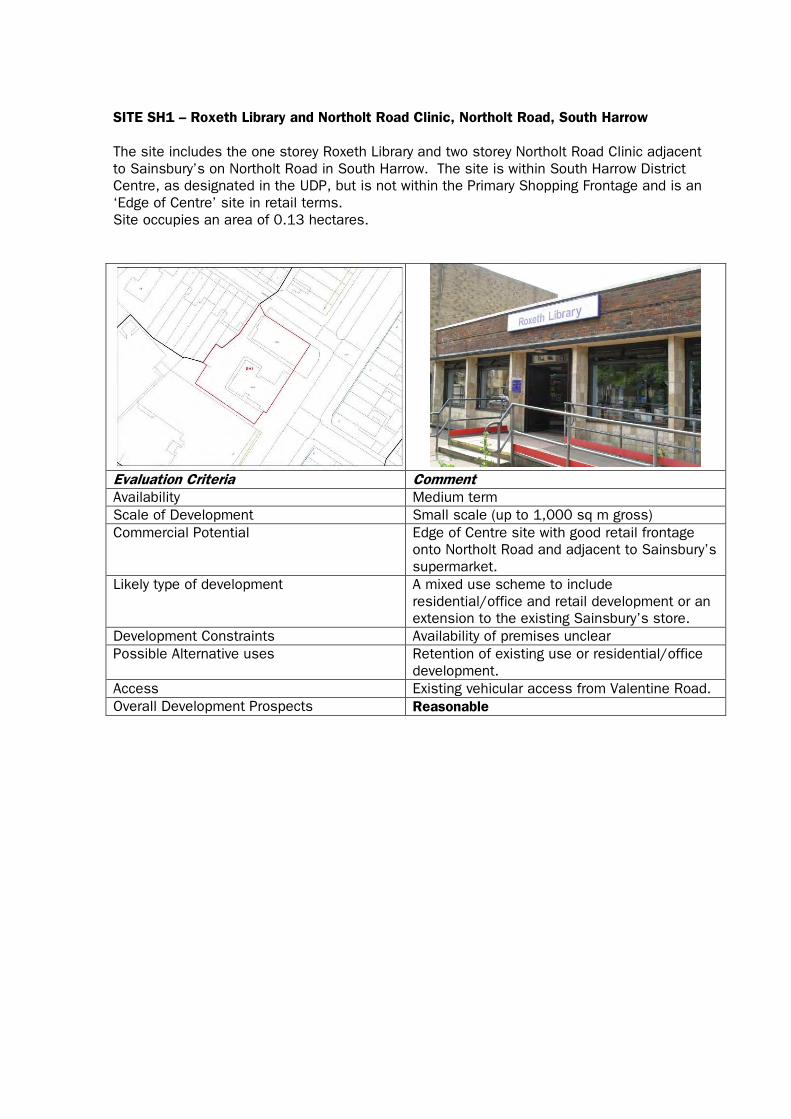
SITE SH1 – Roxeth Library and Northolt Road Clinic, Northolt Road, South Harrow
The site includes the one storey Roxeth Library and two storey Northolt Road Clinic adjacent
to Sainsbury’s on Northolt Road in South Harrow. The site is within South Harrow District
Centre, as designated in the UDP, but is not within the Primary Shopping Frontage and is an
‘Edge of Centre’ site in retail terms.
Site occupies an area of 0.13 hectares.
Evaluation Criteria Comment
Availability Medium term
Scale of Development Small scale (up to 1,000 sq m gross)
Commercial Potential Edge of Centre site with good retail frontage
onto Northolt Road and adjacent to Sainsbury’s
supermarket.
Likely type of development A mixed use scheme to include
residential/office and retail development or an
extension to the existing Sainsbury’s store.
Development Constraints Availability of premises unclear
Possible Alternative uses Retention of existing use or residential/office
development.
Access Existing vehicular access from Valentine Road.
Overall Development Prospects Reasonable
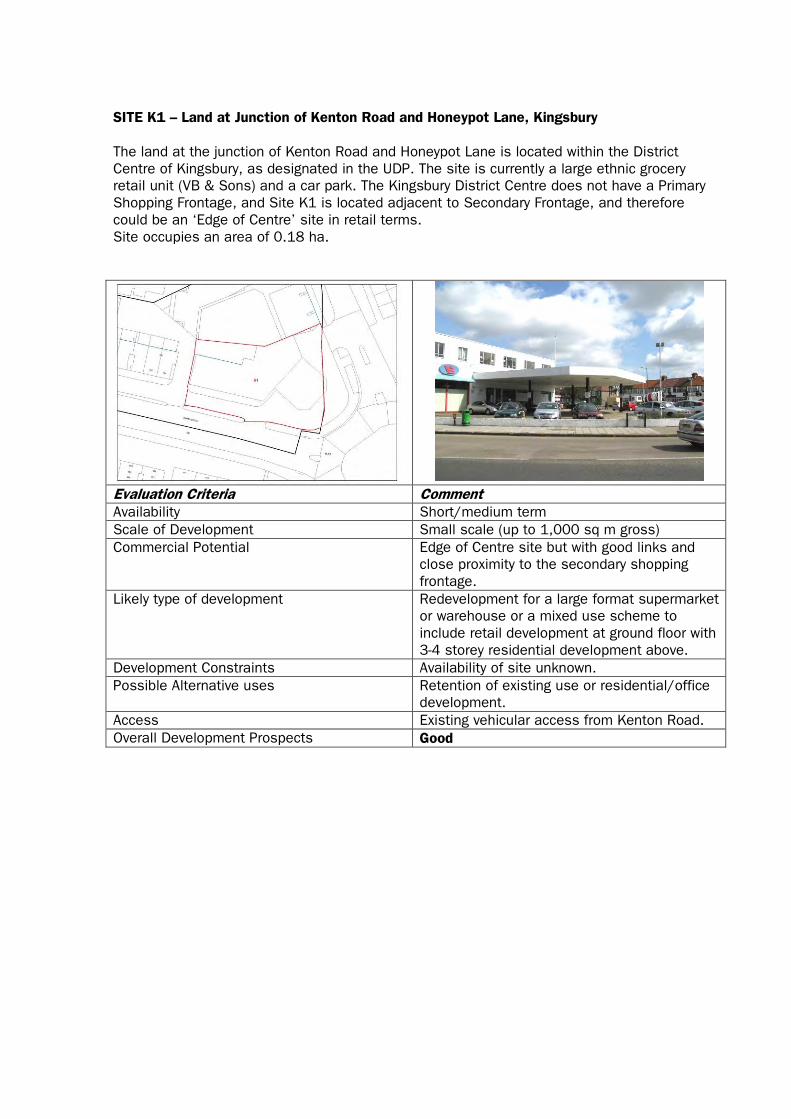
SITE K1 – Land at Junction of Kenton Road and Honeypot Lane, Kingsbury
The land at the junction of Kenton Road and Honeypot Lane is located within the District
Centre of Kingsbury, as designated in the UDP. The site is currently a large ethnic grocery
retail unit (VB & Sons) and a car park. The Kingsbury District Centre does not have a Primary
Shopping Frontage, and Site K1 is located adjacent to Secondary Frontage, and therefore
could be an ‘Edge of Centre’ site in retail terms.
Site occupies an area of 0.18 ha.
Evaluation Criteria Comment
Availability Short/medium term
Scale of Development Small scale (up to 1,000 sq m gross)
Commercial Potential Edge of Centre site but with good links and
close proximity to the secondary shopping
frontage.
Likely type of development Redevelopment for a large format supermarket
or warehouse or a mixed use scheme to
include retail development at ground floor with
3-4 storey residential development above.
Development Constraints Availability of site unknown.
Possible Alternative uses Retention of existing use or residential/office
development.
Access Existing vehicular access from Kenton Road.
Overall Development Prospects Good