
Retail Market Study - mlive
40
Retail Market Study Downtown Jackson, Michigan
Transcript of Retail Market Study - mlive
Retail Market Study Downtown Jackson, Michigan


TABLE OF CONTENTS INTRODUCTION .................................................................................................................. 3 Executive Summary ............................................................................................................. 3 Background .......................................................................................................................... 4 Methodology ......................................................................................................................... 5 Trade Area ........................................................................................................................... 7 Demographic Characteristics ............................................................................................... 9 Tapestry Lifestyles ............................................................................................................... 10 Employment Base ................................................................................................................ 13 TRADE AREA CHARACTERISTICS ................................................................................... 16 Location ................................................................................................................................ 16 Access .................................................................................................................................. 17 Other Shopping Areas .......................................................................................................... 17 SUMMARY OF FINDINGS .................................................................................................... 19 2018 & 2023 Supportable Retail Table ................................................................................. 20 Retail Category Definitions ................................................................................................... 21 Shopping Center Definitions ................................................................................................. 24 Rationale ............................................................................................................................... 25 Limits of Study ....................................................................................................................... 25 APPENDIX ............................................................................................................................ 27 Exhibit A: Primary Trade Area Business Summary .............................................................. 27 Exhibit B: Primary Trade Area Community Profile ................................................................ 29 Exhibit C: Primary Trade Area Housing Profile .................................................................... 35 Exhibit D: Primary Trade Area Dominant Tapestry Map and Descriptions ........................... 37


Downtown Jackson Market Study 3. Gibbs Planning Group, Inc. 12 January 2018
INTRODUCTION
Figure 1: Aerial photo of downtown Jackson. Downtown Jackson’s primary trade area can presently support an additional 108,400 sf of retail and restaurant development. Executive Summary This study finds that the downtown Jackson primary trade area can presently support up to 108,400 additional square feet (sf) of retail and restaurant development, generating almost $31.9 million in new sales. By 2023, income growth and continued economic development in the primary trade area could increase the estimated retail sales to just shy of $33.5 million. The demand could partially be absorbed by nearby businesses and/or with the opening of 35 to 50 new restaurants and stores. Additional development in downtown Jackson can provide needed goods and services for the existing surrounding consumer base of nearby residents, students, workers and visitors. Furthermore, bolstering the critical mass of retailers and restaurants downtown can increase the share of sales captured in the study area and improve the quality of life for the surrounding community. The leading categories of supportable retail growth are restaurants, grocery stores, apparel and shoe stores, department store merchandise, pharmacy and sporting goods. This study further finds that the downtown Jackson primary trade area has a population of 140,400 persons, increasing under current trends to 141,400 persons by 2023. Median household income in the primary trade area is $48,400, which is lower than state and national averages, and is expected to grow to $52,900 by 2023. Housing favors owner-occupied units, which comprise 61.8 percent of all housing, compared to 26.2 percent renter-occupied households; the vacancy rate is 12.0 percent. The primary trade area has a labor base of 70,800 employees.
W. Glick Hwy.
S. C
ooper Street
W. Franklin Street.
1st S
treet
Michigan Avenue

4. Downtown Jackson Market Study Gibbs Planning Group, Inc.
12 January 2018
Table 1: 2018 Additional Supportable Retail
Retail Category Est. 2018 Supportable SF
Est. 2018 Retail Sales
Number of Stores
Retail Apparel Stores 9,300 sf $2,557,500 4-5 Beer, Wine & Liquor Stores 2,100 sf $640,500 1 Book & Music Stores 1,400 sf $315,000 1 Department Store Merchandise 11,600 sf $3,422,000 4-5 Florists 1,100 sf $236,500 1 Furniture Stores 2,100 sf $535,500 1 Grocery Stores 19,500 sf $6,337,500 1-2 Hardware Stores 1,700 sf $408,000 1 Home Furnishings Stores 3,400 sf $884,000 1-2 Jewelry Stores 1,900 sf $627,000 1 Lawn & Garden Supply Stores 800 sf $176,000 1 Miscellaneous Store Retailers 10,100 sf $2,575,500 4 – 6 Office Supplies & Gift Stores 1,400 sf $371,000 1 Pharmacy 6,000 sf $1,830,000 1-2 Shoe Stores 2,000 sf $560,000 1-2 Specialty Food Stores 3,100 sf $914,500 1-2 Sporting Goods & Hobby Stores 3,700 sf $925,000 1-2 Retailer Totals 81,200 sf $23,315,500 26-36
Restaurants
Bars, Breweries & Pubs 5,200 sf $1,508,000 1-2 Full-Service Restaurants 7,900 sf $2,528,000 2-3 Limited-Service Restaurants 9,000 sf $2,970,000 3-4 Specialty Food Stores 5,100 sf $1,555,500 3-5 Restaurant Totals 27,200 sf $8,561,500 9-14
Retail & Restaurant Totals 108,400 sf $31,877,000 35-50
Table 1: The leading supportable retail categories are grocery stores, department store merchandise, and miscellaneous store retailers. Background Gibbs Planning Group, Inc. (GPG) has been retained by the Jackson Anchor Initiative to conduct a retail feasibility analysis as the first step in a comprehensive investigation of how to stimulate retail growth in downtown Jackson.
GPG addressed the following issues in this study:
• What is the existing and planned retail market in the study and trade area?
• What is the primary trade area for downtown Jackson, Michigan?
• What are the population, demographic and lifestyle characteristics in the primary trade area, currently and projected for 2023?
• What is the current and projected growth for retail expenditures in the primary trade area, now and for the next five years?

Downtown Jackson Market Study 5. Gibbs Planning Group, Inc. 12 January 2018
• How much additional retail square footage is supportable in the downtown Jackson’s primary trade area, Michigan study area, and what retail uses should be encouraged? What sales volumes can development achieve in or near the study area?
Figure 2: Downtown Jackson is located approximately 35 miles south of Lansing and 35 miles west of Ann Arbor. Methodology To address the above issues, GPG defined a trade area that would serve the retail in the study area based on geographic and topographic considerations, traffic access/flow in the area, relative retail strengths and weaknesses of the competition, concentrations of daytime employment and the retail gravitation in the market, as well as our experience defining trade areas for similar markets. Population, consumer expenditure and demographic characteristics of trade area residents were collected by census tracts from the U.S. Bureau of the Census, U.S. Bureau of Labor Statistics and Esri (Environmental Systems Research Institute). Finally, based on the projected consumer expenditure capture (demand) in the primary trade area of the gross consumer expenditure by retail category, less the current existing retail sales (supply) by retail category, GPG projects the potential net consumer expenditure (gap) available to support existing and new development. The projected net consumer expenditure capture is based on household expenditure and demographic characteristics of the primary trade area, existing and planned retail competition, traffic and retail gravitational patterns and GPG’s qualitative assessment of downtown Jackson. Net potential captured consumer expenditure (gap) is equated to potential retail development square footage, with the help of retail sales per square foot data

6. Downtown Jackson Market Study Gibbs Planning Group, Inc.
12 January 2018
provided by Dollars and Cents of Shopping Centers (Urban Land Institute and International Council of Shopping Centers), qualitatively adjusted to fit the urbanism and demographics of the study area.
Figure 3: Numerous retail stores and restaurants have recently opened in downtown Jackson, which has helped spur the area’s revitalization. For the purposes of this study, GPG has assumed the following:
• Other major community retail centers may be planned or proposed, but only the existing retail is considered for this study. The quality of the existing retail trade in the study area is projected to remain constant. Gains in future average retail sales per sf reflect higher sales per sf in newly developed retail and selected increases in sales per sf by individual retail categories.
• No major regional retail centers will be developed within the trade area of this analysis through 2023 for the purposes of this study.
• The region’s economy will continue at normal or above normal ranges of employment, inflation, retail demand and growth.
• The study area is properly zoned to support infill and redevelopment projects with current and innovative standards, and the existing infrastructure (water, sewer, arterial roadways, etc.) can support additional commercial development.
• Annual population growth for the primary trade area is estimated to be 0.14 percent throughout the five-year period of this study.
• Employment distribution is projected to remain constant, without a spike or decline in employment by NAICS categories.
• The projected lease and vacancy rate model is based on our proprietary econometric model of the relationship between changes in employment and changes in vacancy and lease rates. Data was gathered from the U.S. Census Bureau, Esri, CBRE and local brokerage services.
• Any new construction in the study area will be planned, designed, built and managed to the best practices of the American Institute of Architects, American Planning Association, American Society of Landscape Architects, Congress for New Urbanism, International Council of Shopping Centers and The Urban Land Institute.

Downtown Jackson Market Study 7. Gibbs Planning Group, Inc. 12 January 2018
• Parking for new development projects or businesses will meet or exceed the industry standards.
• Visibility of any new retail is also assumed very good, with signage as required to assure easy visibility of the retailers.
• Infill or redevelopment projects in the study area will open with sustainable amounts of retail and anchor tenants, at planned intervals and per industry standards.
Trade Area
Figure 4 Downtown Jackson’s primary trade area encompasses 482 square miles with convenient access to I-94 and US Highway 127. Based on GPG’s site evaluation, the existing retail hubs, population clusters, highway access, and the retail gravitation in the market, as well as our experience defining trade areas for similar communities throughout the United States, it was determined that consumers in the primary trade area generate demand to support a variety of retailers. This potential will continue to increase over the next five years, sustained by on-site residential development and average annual household income growth of 2.5 percent.

8. Downtown Jackson Market Study Gibbs Planning Group, Inc.
12 January 2018
The primary trade area is the consumer market where the study area has a significant competitive advantage because of access, design, lack of quality competition and traffic and commute patterns. This competitive advantage equates to a potential windfall in the capture of consumer expenditure by the retailers in the study area. GPG defined a primary trade area by topography, vehicular access, strength of retail competition and residential growth patterns instead of standardized “drive-times.” Consumers inside the primary trade area will account for up to 60 to 70 percent of the total sales captured by retailers in downtown Jackson.
Figure 5: The primary and secondary trade area map of downtown Jackson. The secondary trade area is shown above outlined in green. Secondary trade area residents can conveniently reach the study area, but it will not be their preferred shopping destination. The following borders approximately delineate the primary trade area:
North – West Bellevue Street South – Vicary Road East – Wolf Lake Road West – North Gibbs Road
The secondary or community-oriented trade area (Figure 5) extends in all directions to include residents and workers who because of convenient access may in the future generate expenditure for downtown Jackson retailers. The boundaries of the secondary or community-oriented trade

Downtown Jackson Market Study 9. Gibbs Planning Group, Inc. 12 January 2018
area extend north to East Five Point Highway and Coy Road, east to North Dancer Road and North Jackson Street, south to Lime Creek Road, and west to 16 ½ Mile Road. Residents who live in the secondary, but not the primary, trade area will shop at downtown Jackson retailers frequently, but the area will not be their primary shopping destination. Consumer expenditure by these residents will account for 10 to 20 percent of retail sales. Demographic Characteristics Using data from Esri (Environmental Systems Research Institute) and the U.S. Census Bureau, GPG obtained the most recent population and demographic characteristics (2017), and those projected for 2023 for the defined trade area, as well as regional and statewide statistics.
Table 2: Demographic Comparisons
Characteristics Primary Trade Area
Secondary Trade Area Michigan USA
2017 Population 140,400 305,600 10,024,800 327,514,300
2022 Population 141,400 307,500 10,131,000 341,323,600
2017-22 Projected Annual Growth Rate 0.14% 0.12% 0.21% 0.83%
2017 Households 53,600 117,400 3,940,000 123,158,900
2022 Households 54,200 118,400 3,986,500 128,069,400 2017-22 Projected Annual HH Growth Rate 0.22% 0.17% 0.23% 0.79%
Persons Per Household 2017 2.44 2.49 2.49 2.48
Median Age 40.5 41.9 40.1 38.2
2017 Median Household Income $48,400 $51,400 $52,100 $56,100
2017 Average Household Income $62,500 $65,700 $71,400 $80,700
2022 Median Household Income $52,100 $55,200 $56,400 $62,300
2022 Average Household Income $70,800 $74,500 $80,600 $91,600
% Households w. incomes $75,000+ 28.5% 30.9% 33.6% 34.0%
% Bachelor’s Degree or higher 20.9% 21.8% 28.3% 28.7% Table 2: This side-by-side table compares and contrasts the primary trade area demographic statistics with those of the secondary trade area, Michigan and the USA. The primary trade area has an estimated 2018 population of 140,400 persons, which will increase at an annual rate of 0.14 percent to 141,400 by 2023. This population growth rate is less than the growth rates projected for the state and nation, but slightly greater than that for the secondary trade area. The number of households in the primary trade area will slightly increase from 53,600 to 54,200, holding 2.4 persons per household. Median household income is $48,400 and is expected to increase to $52,100 by 2023. Average household income in the primary trade area is $62,500, while 28.5 percent of households earn over $75,000 per year – lower than state and national figures. Displaying lower levels of education than the state, 20.9 percent of residents over the age of 25 have earned a bachelor’s degree or higher, compared to 28.3 percent for Michigan. The median age is slightly older than the state at 40.5. The secondary trade area demonstrates a lower growth rate in households than that for the primary trade area, state and nation. There are 305,600 residents increasing by 0.12 percent

10. Downtown Jackson Market Study Gibbs Planning Group, Inc.
12 January 2018
annually to 307,500 by 2023. This growth rate is slightly lower than the annual growth rate for the primary trade area, and notably lower than that for the state and nation. The number of households is 117,400, increasing to 118,400 by 2023. Median household income in the area is $51,400 and the average household income is $65,700, both of which are higher than the primary trade area. Median household incomes are expected to increase to $55,200 by 2023, while average household incomes will have grown by 13.4 percent to $74,500. Educational attainment of a bachelor’s degree or higher is at 21.8 percent and 30.9 percent of households earn more than $75,000 annually. The median age is 41.9. Approximately 88.0 percent of primary trade area homes are occupied, and the median home value is estimated to be $129,600. Of all households, 61.8 percent are owner-occupied, a number that has decreased 7.1 percent since 2010 and is expected to continue downward to 61.2 percent by 2023. Renter-occupied households have increased from 24.9 percent in 2010 to 26.3 percent in 2018; this statistic is projected to basically be the same, at 26.2 percent, by 2023. The vacancy rate has stayed constant, at 12.0 percent, from 2010 through 2018, and is expected to trend just slightly upwards to 12.6 percent by 2023. The percentage of housing units valued at over $200,000 is expected to increase from 27.2 percent to 40 percent – coinciding with an increase in the median home value to $171,400 by 2023.
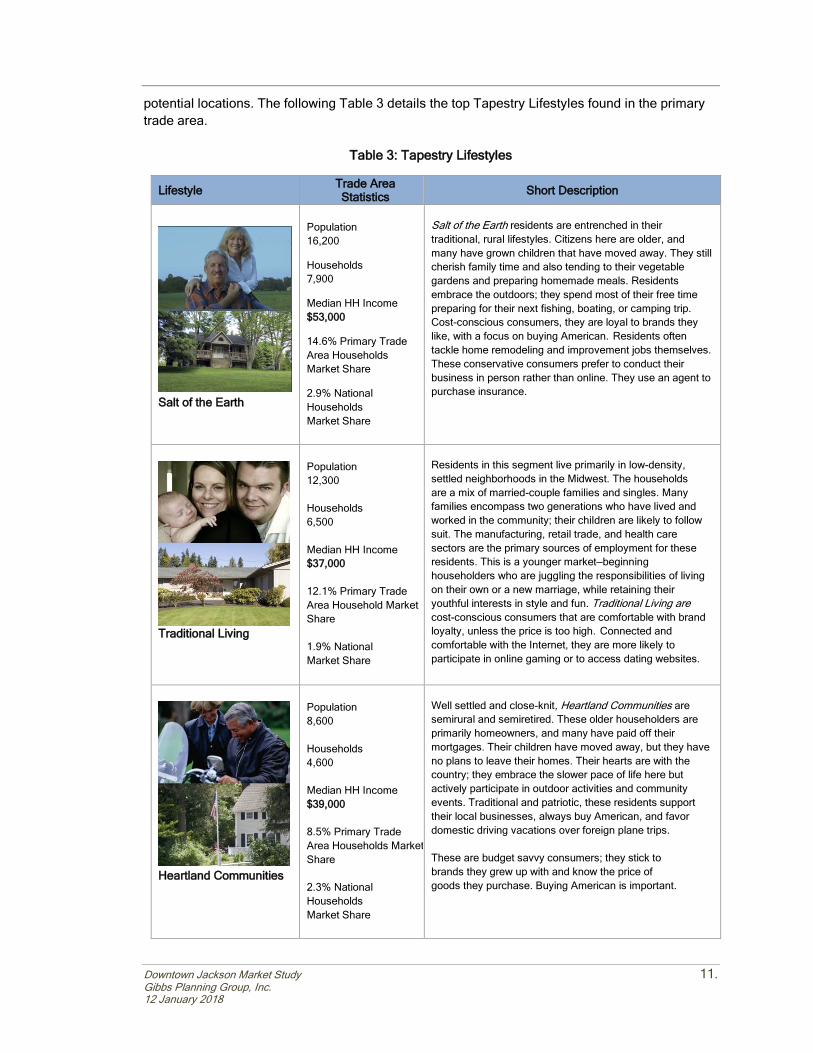
Figure 6: The relative proportions of the top twenty Tapestry Lifestyle segments found in the primary trade area. Tapestry Lifestyles Esri has developed Tapestry Lifestyles, which is an attempt to create 65 classifications, or lifestyle segments, that help determine purchasing patterns. These segments are broken down to the U.S. Census Block Group level and used by many national retailers to help determine future
Downtown Jackson Market Study 11. Gibbs Planning Group, Inc. 12 January 2018
potential locations. The following Table 3 details the top Tapestry Lifestyles found in the primary trade area.
Table 3: Tapestry Lifestyles
Lifestyle Trade Area Statistics Short Description
Salt of the Earth
Population 16,200
Households 7,900
Median HH Income $53,000
14.6% Primary Trade Area Households Market Share
2.9% National Households Market Share
Salt of the Earth residents are entrenched in their traditional, rural lifestyles. Citizens here are older, and many have grown children that have moved away. They still cherish family time and also tending to their vegetable gardens and preparing homemade meals. Residents embrace the outdoors; they spend most of their free time preparing for their next fishing, boating, or camping trip. Cost-conscious consumers, they are loyal to brands they like, with a focus on buying American. Residents often tackle home remodeling and improvement jobs themselves. These conservative consumers prefer to conduct their business in person rather than online. They use an agent to purchase insurance.
Traditional Living
Population 12,300 Households 6,500 Median HH Income $37,000 12.1% Primary Trade Area Household Market Share 1.9% National Market Share
Residents in this segment live primarily in low-density, settled neighborhoods in the Midwest. The households are a mix of married-couple families and singles. Many families encompass two generations who have lived and worked in the community; their children are likely to follow suit. The manufacturing, retail trade, and health care sectors are the primary sources of employment for these residents. This is a younger market—beginning householders who are juggling the responsibilities of living on their own or a new marriage, while retaining their youthful interests in style and fun. Traditional Living are cost-conscious consumers that are comfortable with brand loyalty, unless the price is too high. Connected and comfortable with the Internet, they are more likely to participate in online gaming or to access dating websites.
Heartland Communities
Population 8,600 Households 4,600 Median HH Income $39,000 8.5% Primary Trade Area Households Market Share 2.3% National Households Market Share
Well settled and close-knit, Heartland Communities are semirural and semiretired. These older householders are primarily homeowners, and many have paid off their mortgages. Their children have moved away, but they have no plans to leave their homes. Their hearts are with the country; they embrace the slower pace of life here but actively participate in outdoor activities and community events. Traditional and patriotic, these residents support their local businesses, always buy American, and favor domestic driving vacations over foreign plane trips. These are budget savvy consumers; they stick to brands they grew up with and know the price of goods they purchase. Buying American is important.

12. Downtown Jackson Market Study Gibbs Planning Group, Inc.
12 January 2018
Lifestyle Trade Area Statistics Short Description
Rustbelt Traditions
Population 8,600 Households 4,500 Median HH Income $49,000 8.4% Primary Trade Area Households Market Share 2.2% National Market Share
The backbone of older industrial cities in states surrounding the Great Lakes, Rustbelt Traditions residents are a mix of married-couple families and singles living in older developments of single-family homes. While varied, the work force is primarily white collar, with a higher concentration of skilled workers in manufacturing, retail trade, and health care. Rustbelt Traditions represents a large market of stable, hard-working consumers with modest incomes but above average net worth. Family oriented, they value time spent at home. Most have lived, worked, and played in the same area for years. Residents take advantage of convenience stores for fueling up and picking up incidentals. Watching television is a common pastime; many households have more than four TVs. Rustbelt Traditions are connected to electronics. Favorite family restaurants include Applebee’s, Outback Steakhouse, and Texas Roadhouse.
Green Acres
Population 9,100 Households 4,200 Median HH Income $72,000 7.9% Primary Trade Area Households Market Share 3.2% National Households Market Share
The Green Acres lifestyle features country living and self-reliance. They are avid do-it-yourselfers, maintaining and remodeling their homes, with all the necessary power tools to accomplish the jobs. Gardening, especially growing vegetables, is also a priority, again with the right tools, tillers, tractors and riding mowers. Outdoor living also features a variety of sports: hunting and fishing, motorcycling, hiking and camping, and even golf. Self-described conservatives, residents of Green Acres remain pessimistic about the near future yet are heavily invested in it. The purchasing choices of Green Acres residents reflect their country life, as they prefer vehicles such as trucks, SUVs, ATVs and motorcycles. They are cautious consumers and focus on quality and durability.
Table 3: The top five Tapestry Lifestyle groups profiled above portray a wide range of demographic groups in a more rural setting. The primary trade area’s most prominent lifestyle group is “Salt of the Earth,” which represents 14.6 percent of households. Concentrated in the Midwest, this group lives mostly in rural settings. The average household size is 2.58, and married couples are the dominant household type. This group primarily lives in affordable single-family owner-occupied homes. They tend to tackle home remodeling and improvement projects themselves. Due to their rural setting, Salt of the Earth households overwhelmingly own two vehicles to cover their long commutes. Forty-two percent of Salt of the Earth residents have only a high school diploma. They are significantly above the national percentage of home ownership; 83.7 percent own a home compared to 63.6 percent in the US. The median household income of $53,000 is just slightly above the U.S. median of $51,000. Their median net worth is $134,000, substantially more than the US median of $71,000. In terms of occupation, office and administrative support employs the most workers in this group, followed by production and sales.

Downtown Jackson Market Study 13. Gibbs Planning Group, Inc. 12 January 2018
Salt of the Earth residents are cost-conscious consumers who tend to be loyal to American brands. They are the last to buy the latest and greatest products, and prefer to conduct business in person rather than online
Figure 7: Health care and utilities employment are prevalent in the primary trade area due to the headquarters of Consumers Energy (left; 2,400 employees) and Henry Ford Allegiance Health (right; 3,260 employees). Employment Base The employment picture found in the primary trade area reflects a concentrated services and retail sector foundation, comprising 58.6 percent of total employment. Compared to the secondary trade area, the percentage of employees in the primary trade area engaged in manufacturing is low and the utility sector is strikingly large.
Table 4: Employment Comparison by Sector (SIC)
Sector Primary Trade Area
Secondary Trade Area Michigan USA
Agriculture and Mining 0.6% 1.2% 1.3% 1.5% Construction 2.7% 3.1% 3.3% 4.1% Manufacturing 8.3% 12.7% 12.2% 8.6% Transportation 1.8% 1.9% 2.5% 3.0% Communication 0.3% 0.3% 0.7% 1.0% Utility 7.8% 4.7% 0.5% 0.7% Wholesale Trade 6.4% 4.9% 4.5% 4.5% Retail Trade 19.1% 18.6% 22.5% 20.7% Finance, Insurance & Real Estate 6.1% 4.8% 5.5% 6.6% Services 39.5% 40.4% 41.5% 42.4% Government 7.5% 6.8% 5.3% 6.7% Unclassified 0.0% 0.6% 0.2% 0.0%
Table 4: Services and Retail Trade comprise the bulk of primary trade area employment. As shown in Table 4 above, the services sector accounts for the majority of employment (39.5 percent) in the primary trade area. However, this proportion is lower than that for the secondary trade area and state. Within the services sector, a large percentage (17.3 percent of total employment in the primary trade area) work in health services, compared to 15.2 percent who work in health services in the secondary trade area and only 11.6 percent in the state.
14. Downtown Jackson Market Study Gibbs Planning Group, Inc.
12 January 2018
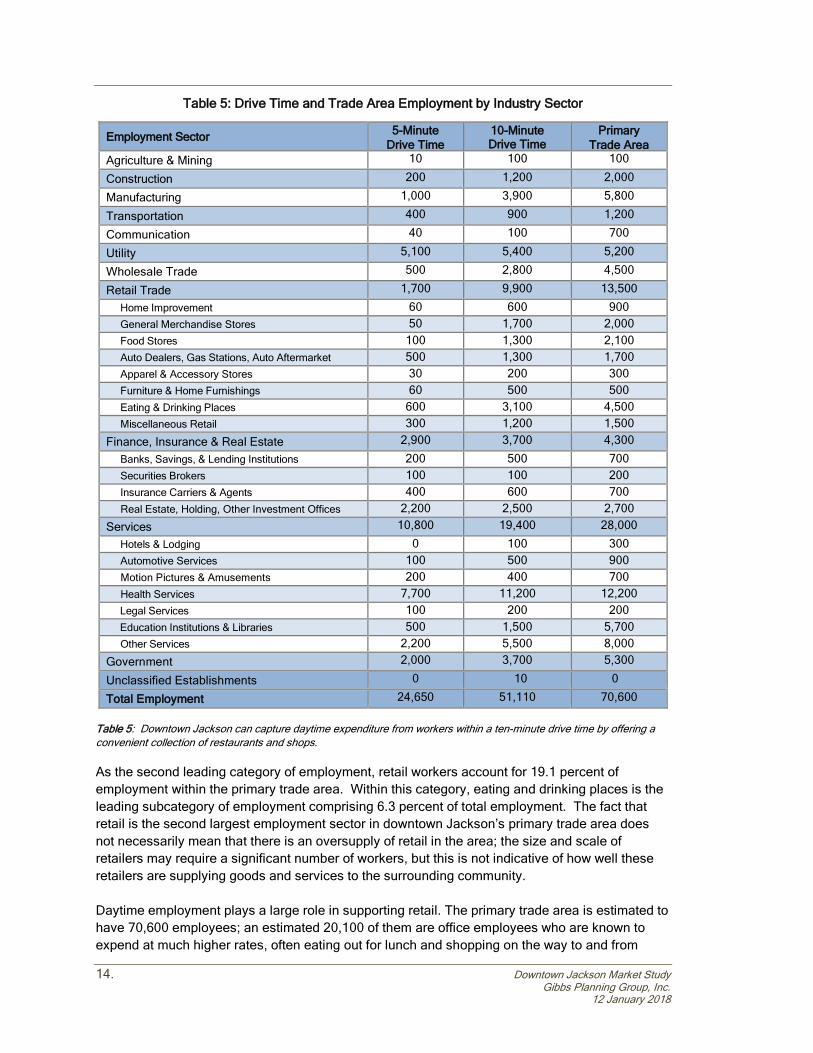
Table 5: Drive Time and Trade Area Employment by Industry Sector
Table 5: Downtown Jackson can capture daytime expenditure from workers within a ten-minute drive time by offering a convenient collection of restaurants and shops. As the second leading category of employment, retail workers account for 19.1 percent of employment within the primary trade area. Within this category, eating and drinking places is the leading subcategory of employment comprising 6.3 percent of total employment. The fact that retail is the second largest employment sector in downtown Jackson’s primary trade area does not necessarily mean that there is an oversupply of retail in the area; the size and scale of retailers may require a significant number of workers, but this is not indicative of how well these retailers are supplying goods and services to the surrounding community. Daytime employment plays a large role in supporting retail. The primary trade area is estimated to have 70,600 employees; an estimated 20,100 of them are office employees who are known to expend at much higher rates, often eating out for lunch and shopping on the way to and from
Employment Sector 5-Minute Drive Time
10-Minute Drive Time
Primary Trade Area
Agriculture & Mining 10 100 100
Construction 200 1,200 2,000
Manufacturing 1,000 3,900 5,800
Transportation 400 900 1,200
Communication 40 100 700
Utility 5,100 5,400 5,200
Wholesale Trade 500 2,800 4,500
Retail Trade 1,700 9,900 13,500
Home Improvement 60 600 900 General Merchandise Stores 50 1,700 2,000 Food Stores 100 1,300 2,100 Auto Dealers, Gas Stations, Auto Aftermarket 500 1,300 1,700 Apparel & Accessory Stores 30 200 300 Furniture & Home Furnishings 60 500 500 Eating & Drinking Places 600 3,100 4,500 Miscellaneous Retail 300 1,200 1,500 Finance, Insurance & Real Estate 2,900 3,700 4,300 Banks, Savings, & Lending Institutions 200 500 700 Securities Brokers 100 100 200 Insurance Carriers & Agents 400 600 700 Real Estate, Holding, Other Investment Offices 2,200 2,500 2,700 Services 10,800 19,400 28,000 Hotels & Lodging 0 100 300 Automotive Services 100 500 900 Motion Pictures & Amusements 200 400 700 Health Services 7,700 11,200 12,200 Legal Services 100 200 200 Education Institutions & Libraries 500 1,500 5,700 Other Services 2,200 5,500 8,000 Government 2,000 3,700 5,300
Unclassified Establishments 0 10 0
Total Employment 24,650 51,110 70,600

Downtown Jackson Market Study 15. Gibbs Planning Group, Inc. 12 January 2018
work. The mix of employees throughout the ten-minute drive time varies from the primary trade area most noticeably in the services industry sector, with an additional 8,600 employees in the primary trade area compared to the ten-minute drive time area. Services, retail and utility employ the most people by industry inside the ten-minute drivetime with 19,400, 9,900 and 5,400 jobs, respectively. With 24,650 workers within a five-minute drive time, there appears to be many captive daytime consumers close to the study area,
Table 6: Ten Minute Drive-Time Worker Expenditure
Category Weekly Expenditure
Annual Expenditure
Office Worker
Expenditure
Non-Office Worker
Expenditure
Total Expenditure
14,850 36,260
Prepared Food & Beverage
Limited & Full-Service Restaurants $40 $2,300 $34,155,000 $83,398,000 $117,553,000
Drinking Places $20 $900 $13,365,000 $32,634,000 $45,999,000 Retail Goods
General Merchandise, Apparel, Home
Furnishings, Electronics
$70 $3,600 $53,460,000 $130,536,000 $183,996,000
Grocery $30 $1,600 $23,760,000 $58,016,000 $81,776,000 Convenience Items $20 $1,000 $14,850,000 $36,260,000 $51,110,000
Total $180 $9,400 $139,590.000 $340,844,000 $480,434,000 Table 6: Employees within ten minutes of the study site expend over $480.4 million dollars annually. Consumer expenditure from daytime employment compliments that captured in the evenings and on weekends by households in the trade area. “Office Worker Retail Spending in a Digital Age,” published by the International Council of Shopping Centers in 2012, provides insight into the impact of office worker employment. Weekly office worker expenditure, adjusted for 2018 dollars, is estimated at $180. Weekly non-office worker expenditure is estimated at 37 percent of office workers. Non-office workers are estimated to have slightly less disposable income, to have multiple work locations including at home, and typically are on the road more during their workweek. Retail purchases (general merchandise, apparel, home furnishings, electronics, grocery and convenience items) make up the majority of the office worker dollars, at $120 per week. Restaurant expenditures (full service, limited service and drinking places) account for the balance at $40 per week. Annualized, each office worker expends $9,400 before, during and after work. The annual impact of over 51,000 workers within ten minutes of downtown Jackson is $480.4 million. This expenditure breaks down to include $163.6 million in prepared food and beverage establishments, $81.8 million in grocery purchases, $184.0 million in retail sales and $51.1 million in convenience items. Catering to the daytime worker crowd with fast-casual restaurants, convenient on-street parking and extended evening hours may increase the worker expenditure captured by study area retailers.

16. Downtown Jackson Market Study Gibbs Planning Group, Inc.
12 January 2018
TRADE AREA CHARACTERISTICS
Figure 8: The city of Jackson is the county seat of Jackson County, and Jackson’s primary trade area features a plethora of picturesque golf courses. Location The primary trade area, which measures 482 square miles, is located in south central Michigan. From downtown Jackson, it stretches north for approximately 14 miles, east for 10 miles, west for 13 miles, and south for 12 miles. These boundaries are approximately 20 miles south of Lansing, 25 miles east of Battle Creek, and 25 miles west of Ann Arbor. With the exception of the city of Jackson, the primary trade area is largely rural and encompasses a number of small towns. The area’s many golf courses draw many tourists to the area. In fact, the primary trade area has one of the highest number of golf courses per capita in the country. It is also home to several institutions of higher education such as Jackson College (formerly Jackson Community College), Baker College, and Spring Arbor University.
Table 7: Traffic Counts
Location Traffic Count
I-94 & Lansing Avenue 60,600 I-94 & Hawkins Road 50,500 I-94 & Blackman Road 30,100 US-127 & Page Avenue 28,800 US-127 & Wetherby Road 19,500 E. Michigan Avenue & Park Avenue 18,700 Spring Arbor Road & Arbor Hills Road 17,300 W. Michigan Avenue & 4th Street 16,800 Cooper Street & North Street 14,800 W. Louis Glick Highway. & Jackson St. 11,600 W. Washington Avenue & Mechanic St. 9,400
Table 7: The traffic chart shows the heaviest traffic on I-94, to the north of the study area (Source: www.michigan.gov/mdot/)

Downtown Jackson Market Study 17. Gibbs Planning Group, Inc. 12 January 2018
Access Regional linkage is strong in the primary trade area. I-94 (running east-west), which is approximately two miles north of the study area, connects the primary trade area to Ann Arbor to the east and Battle Creek to the west. US-127 (running north-south), which is approximately three miles east of the study area, connects the primary trade area to Lansing to the north. Furthermore, there is a dense network of roads surrounding downtown Jackson that makes the study site easily accessible. In particular, significant traffic enters downtown Jackson from the north via Cooper Street and North Francis Street, east via East Michigan Avenue, south via South Cooper Street, and west via West Michigan Avenue. Traffic volumes seen in Table 7 confirm the routes with the best access: the main commuting routes of I-94 and US-127. With convenient road capacity, existing and future retailers will be exposed to a significant number of consumers; however, appropriate signage is necessary to guide patrons to their ultimate shopping destination. Other Shopping Areas
Table 8: Shopping Center Competition
Table 8 & Figure 9: Map of the competing regional and community shopping centers, as well as big box stores.
Retail Center Name Shopping Center Type Retail Size (sf)
Distance to Downtown
Jackson Crossing Regional Center 674,000 sf 1.7 miles
Westwood Mall Regional Center 510,000 sf 1.2 miles
Merchant’s Crossing Community Center 110,000 sf 1.4 miles
Meijer Big Box Store 245,000 sf 2.7 miles
Menards Big Box Store 195,000 sf 3.0 miles

18. Downtown Jackson Market Study Gibbs Planning Group, Inc.
12 January 2018
Figure 10: Celebration of Paka Plaza’s grand opening in November 1961 (pictured on left), and current photo of Jackson Crossing (pictured on right). Jackson Crossing What is now known as Jackson Crossing, was first introduced as Paka Plaza which opened in 1961. Originally, it was an outdoor strip mall with only 34 stores. Its original tenants included Kroger, W.T. Grant, and Woolworth. In 1973, after the opening of Jackson’s first enclosed mall (Westwood Mall), Paka Plaza’s open-air walkway between stores became enclosed. The shopping center experienced substantial growth and by its 25th anniversary in 1975 had expanded to 43 stores. In 1990, Ramco-Gershenson Inc. bought Paka Plaza and renamed it Jackson Crossing. Ramco-Gershenson undertook a $25 million project to revamp the shopping center, which more than doubled its square footage. Today, Jackson Crossing contains 674,000 SF of retail space and has over 60 stores and a 10-screen movie theater. Its current anchor tenants include Sears, Target, Kohl’s, Toys “R” Us, Best Buy, TJ Maxx and Bed Bath & Beyond. Other popular destination tenants include MC Sports (which was newly expanded in 2016), Bath & Body Works, Famous Footwear, Children’s Place, and Claire Boutique
Figure 11: When it opened in 1972, Westwood Mall became Jackson’s first enclosed shopping center. Westwood Mall Westwood Mall opened in 1972 and was developed by Forbes-Cohen. When it opened, the mall’s anchor tenants were J.W. Knapp Company and Montgomery Ward. However, in 1980, the J.W. Knapp store sold to JC Penney. Then in 1993, Elder-Beerman was added as a third anchor tenant. Several stores closed in the mall in the late 2000s, including Gap, Ritz Camera and Crown & Carriage Gifts (an original tenant). However, even after these closings, the mall retained an occupancy rate that exceeded the national average. Today, the Westwood Mall has 510,000

Downtown Jackson Market Study 19. Gibbs Planning Group, Inc. 12 January 2018
sf of retail space and features over 50 stores with anchor tenants JC Penney, Walmart and Younkers. It is owned and managed by Rouse Properties, a division of General Growth Properties.
Figure 12: In terms of square footage, Kroger and Big Lots are Merchant Crossing’s largest tenants. Merchant’s Crossing Merchant’s Crossing was developed by MI-Abrams Industries in 1974. This 110,000 SF shopping center is situated directly south of Jackson Crossing and less than one mile north of the Westwood Mall. It is anchored by Kroger, Big Lots, and Family Dollar. In 2005, MI-Abrams Industries sold Merchant’s Crossing for $7.4 million, and the shopping center is now owned and managed by BCWood Properties. Large Format Retailers In addition to its shopping centers, the city of Jackson has two notable stand-alone large format retailers – a Meijer and a Menards. The Meijer is located at 2777 Airport Road and has approximately 245,000 SF of retail space. The Menards is located at 3588 Page Avenue and contains approximately 195,000 SF of retail space. SUMMARY of FINDINGS This study finds that downtown Jackson’s primary trade area is presently supportable with up to 108,400 additional square feet (sf) of retail and restaurant development, generating nearly $31.9 million in new sales. The new retail can potentially capture up to $33.5 million by 2023. This retail development could include:
• Corner Stores: One to two corner stores at 1,500 to 2,500 sf, located at neighborhood entries to support connectivity between the adjacent neighborhoods and downtown. Locating the corner store(s) along the busiest entryway from the major local road provides the best access to these store types.
• Convenience Centers: One to two 15,000 to 20,000 sf convenience centers located along a primary corridor. Setting a center like this as close to residents as possible provides it with greater economic success. They can be located in the first floor of a mixed-use building as long as they can be seen from the primary road. These centers can include a wide range of retailers such as apparel, bakeries or butchers, electronics, florists, financial services, pharmacy, a full-service restaurant and office supplies.

20. Downtown Jackson Market Study Gibbs Planning Group, Inc.
12 January 2018
• Neighborhood Center: One 75,000 to 100,000 sf neighborhood center anchored by grocery. The remainder of the gross leasable area would include apparel, gifts, jewelry, shoes, sporting goods, furniture and home furnishings, electronics and a number of full- and limited-service restaurants.
These retail centers could be developed as conventional shopping centers or most likely as filled vacancies, infill or mixed-use redevelopment into the current walkable downtown. A detailed examination of the supportable sf of retail uses is found in the following Table 9:
Table 9: 2018 & 2023 Supportable Retail Table
Downtown Jackson Primary Trade Area
Table 9: Sales stated in constant 2018 dollars.
Retail CategoryEstimated
Supportable SF
2018Sales/SF
2018 EstimatedRetail Sales
2023Sales/SF
2023 EstimatedRetail Sales
No. ofStores
Retailers
Apparel Stores 9,300 $275 $2,557,500 $290 $2,697,000 4 - 5
Beer, Wine & Liquor Stores 2,100 $305 $640,500 $320 $672,000 1
Book & Music Stores 1,400 $225 $315,000 $235 $329,000 1
Department Store Merchandise 11,600 $295 $3,422,000 $310 $3,596,000 4 - 5
Florists 1,100 $215 $236,500 $225 $247,500 1
Furniture Stores 2,100 $255 $535,500 $270 $567,000 1
Grocery Stores 19,500 $325 $6,337,500 $340 $6,630,000 1 - 2
Hardware 1,700 $240 $408,000 $250 $425,000 1
Home Furnishings Stores 3,400 $260 $884,000 $275 $935,000 1 - 2
Jewelry Stores 1,900 $330 $627,000 $345 $655,500 1
Lawn & Garden Supply Stores 800 $220 $176,000 $230 $184,000 1
Miscellaneous Store Retailers 10,100 $255 $2,575,500 $270 $2,727,000 4 - 6
Office Supplies & Gift Stores 1,400 $265 $371,000 $280 $392,000 1
Pharmacy 6,000 $305 $1,830,000 $320 $1,920,000 1 - 2
Shoe Stores 2,000 $280 $560,000 $295 $590,000 1 - 2
Specialty Food Stores 3,100 $295 $914,500 $310 $961,000 1 - 2
Sporting Goods & Hobby Stores 3,700 $250 $925,000 $265 $980,500 1 - 2
Retailer Totals 81,200 $270 $23,315,500 $284 $24,508,500 26 - 36
Restaurants
Bars, Breweries & Pubs 5,200 $290 $1,508,000 $305 $1,586,000 1 - 2
Full-Service Restaurants 7,900 $320 $2,528,000 $335 $2,646,500 2 - 3
Limited-Service Eating Places 9,000 $330 $2,970,000 $345 $3,105,000 3 - 4
Special Food Services 5,100 $305 $1,555,500 $320 $1,632,000 3 - 5
Restaurant Totals 27,200 $311 $8,561,500 $326 $8,969,500 9 - 14
Retailer & Restaurant Totals 108,400 $278 $31,877,000 $292 $33,478,000 35 - 50

Downtown Jackson Market Study 21. Gibbs Planning Group, Inc. 12 January 2018
The demographics of the primary trade area show a population base of 140,400, which will increase to 141,400 by 2023, at an annual growth rate of 0.14 percent. The persons per household is 2.44, and median age is 40.5 years old. Median household income of $48,400 in the primary trade area is lower than state and national averages. The average household income is $62,500 demonstrating a positive effect on spending potential from the top wage earners in the area. Educational attainment is lower than state and national levels as 20.9 percent of residents over the age of 25 have earned a bachelor’s degree or higher. Employment in the primary trade area favors the services sector (39.5 percent), while other strong sectors include retail (19.1 percent) and manufacturing (8.3 percent). There are over 51,000 employees within a 10-minute drive of the study area and 24,650 employees within a five-minute drive. These daytime consumers expend over $480.4 million annually before, after or during the workday. The trade area’s most prominent lifestyle group is “Salt of the Earth,” which represents 14.6 percent of households. Concentrated in the Midwest, this group lives mostly in rural areas, and are households with one or two vehicles. The median household income of $53,000 is slightly above the U.S. median. The median net worth is $134,000, substantially more than the US median of $71,000. In terms of occupation, office and administrative support employs the most workers in this group, followed by production and sales. Consumers in this lifestyle group are cost-conscious and tend to buy American brands. They are the last to buy the latest and greatest products, and prefer to conduct business in person rather than online. This group considers spending time with family to be their top priority. Lastly, they try to eat healthy, and track the nutrition and ingredients in the food they purchase. Retail Category Definitions Retail categories in the Supportable Retail Table correspond to the North American Industry Classification System (NAICS), the standard used by Federal statistical agencies in classifying business establishments for the purpose of collecting, analyzing, and publishing statistical data related to the U.S. business economy. The following NAICS codes and definitions are provided by the U.S. Census Bureau:
Retail Auto Supply Stores (4411): establishments known as automotive supply stores primarily engaged in retailing new, used, and/or rebuilt automotive parts and accessories, automotive supply stores that are primarily engaged in both retailing automotive parts and accessories and repairing automobiles; establishments primarily engaged in retailing and installing automotive accessories; and establishments primarily engaged in retailing new and/or used tires and tubes or retailing new tires in combination with automotive repair services.
Furniture Stores (4421): establishments primarily engaged in retailing new furniture, such as household furniture (e.g., baby furniture box springs and mattresses) and outdoor furniture; office furniture (except those sold in combination with office supplies and equipment); and/or furniture sold in combination with major appliances, home electronics, home furnishings and/or floor coverings. Home Furnishings Stores (4422): establishments primarily engaged in retailing new home furnishings (except furniture).

22. Downtown Jackson Market Study Gibbs Planning Group, Inc.
12 January 2018
Electronics and Appliance Stores (4431): establishments primarily engaged in retailing the following new products: household-type appliances (refrigerator, dishwasher, oven), cameras, computers/software, televisions and other electronic goods.
Hardware Stores (4441): establishments primarily engaged in retailing new building materials and supplies (lumber, plumbing, electrical, tools, housewares, hardware, paint, and wallpaper). Lawn and Garden Supply Stores (4442): establishments primarily engaged in retailing new lawn and garden equipment and supplies. (Nursery, farm and garden products, outdoor power equipment).
Grocery Stores (4451): establishments primarily engaged in retailing a general line of food products (canned/frozen food, fruits and vegetables, meat, fish, poultry, milk, bread, eggs, soda). Specialty Food Stores (4452): establishments primarily engaged in retailing specialized lines of food (meat, fish/seafood, fruits/vegetables, baked goods, candy, nuts, confections, popcorn, ice cream, items not made on the premises). Beer, Wine, and Liquor Stores (4453): establishments primarily engaged in retailing packaged alcoholic beverages, such as ale, beer, wine and liquor.
Health & Personal Care Stores (4461): establishments primarily engaged in retailing health and personal care products (pharmacies/drug stores, first aid, beauty products, household supplies, candy, prepackaged snacks, optical goods, vitamins/supplements).
Clothing stores (4481): men’s and boys’ clothing stores; women’s and girls’ clothing stores; children’s and infants’ clothing stores; family clothing stores; clothing accessories stores. Shoe Stores (4482): Shoes (men’s, women’s, child/infant, athletic). Jewelry Stores (4483): Jewelry, luggage, and leather goods (silverware, watches, clocks, handbags, briefcases, belts, gloves).
Sporting Goods Stores (4511): establishments primarily engaged in retailing new sporting goods (fitness equipment, bikes, camping, uniforms and footwear). Book & Music Stores (4512): establishments primarily engaged in retailing new books, newspapers, magazines, and prerecorded audio and video media.
Department Stores (4521): establishments known as department stores primarily engaged in retailing a wide range of the following new products with no one merchandise line predominating: apparel; furniture; appliances and home furnishings; and selected additional items, such as paint, hardware, toiletries, cosmetics, photographic equipment, jewelry, toys and sporting goods. Merchandise lines are normally arranged in separate departments.

Downtown Jackson Market Study 23. Gibbs Planning Group, Inc. 12 January 2018
General Merchandise Stores (4529): establishments primarily engaged in retailing new goods in general merchandise stores (except department stores) (warehouse clubs, supercenters, apparel, auto parts, dry goods, hardware, groceries, housewares, no line predominating). Florists (4531): establishments known as florists primarily engaged in retailing cut flowers, floral arrangements, and potted plants purchased from others. These establishments usually prepare the arrangements they sell. Office Supplies & Gift Stores (4532): establishments primarily engaged in one or more of the following: (1) retailing new stationery, school supplies, and office supplies; (2) retailing a combination of new office equipment, furniture, and supplies; (3) retailing new office equipment, furniture, and supplies in combination with retailing new computers; and (4) retailing new gifts, novelty merchandise, souvenirs, greeting cards, seasonal and holiday decorations and curios. Miscellaneous Retailers (4539): establishments primarily engaged in retailing new miscellaneous specialty store merchandise (except motor vehicle and parts dealers; furniture and home furnishings stores; consumer-type electronics and appliance stores; building material and garden equipment and supplies dealers; food and beverage stores; health and personal care stores; gasoline stations; clothing and clothing accessories stores; sporting goods, hobby, book, and music stores; general merchandise stores; florists; office supplies, stationery, and gift stores; and used merchandise stores). Pet supplies, art dealers, manufactured home dealers, tobacco/cigar stores,
Restaurants Full-Service Restaurants (7221): establishments primarily engaged in providing food services to patrons who order and are served while seated (i.e., waiter/waitress service) and pay after eating. Establishments that provide these types of food services to patrons with any combination of other services, such as carryout services are classified in this industry. Limited-Service Restaurants (7222): establishments primarily engaged in providing food services where patrons generally order or select items and pay before eating. Most establishments do not have waiter/waitress service, but some provide limited service, such as cooking to order (i.e., per special request), bringing food to seated customers, or providing off-site delivery (cafeterias, snack/ juice bar, ice cream/soft serve shops, cookie shops, popcorn shops, donut shops, coffee shops, bagel shops). Special Food Services (7223): establishments primarily engaged in providing one of the following food services (2) a location designated by the customer; or (3) from motorized vehicles or non-motorized carts.
• Food Service Contractors: Establishments may be engaged in providing food services at institutional, governmental, commercial, or industrial locations of others based (cafeteria, restaurant, and fast food eating-place) on contractual arrangements with these types of organizations for a specified period of time. Management staff is always provided by the food services contractor.
• Caterers: providing single event-based food services. These establishments generally have equipment and vehicles to transport meals and snacks to events and/or prepare food at an off-premise site. Banquet halls with catering

24. Downtown Jackson Market Study Gibbs Planning Group, Inc.
12 January 2018
staff are included in this industry. Examples of events catered by establishments in this industry are graduation parties, wedding receptions, business or retirement luncheons and trade shows.
• Mobile Food Services: establishments primarily engaged in preparing and serving meals and snacks for immediate consumption from motorized vehicles or non-motorized carts. The establishment is the central location from which the caterer route is serviced, not each vehicle, or cart. Included in this industry are establishments primarily engaged in providing food services from vehicles, such as hot dog carts and ice cream trucks.
Drinking Places (Alcoholic Beverages) (7224): establishments primarily engaged in preparing and serving alcoholic beverages for immediate consumption (bars, taverns, nightclubs).
Shopping Center Definitions This study utilizes the shopping centers typologies defined by the International Council of Shopping Centers (ICSC) as follows:
• Convenience Centers: Convenience centers are 30,000 sf or less, unanchored, and generally will service a trade area of up to one mile. These centers include banking, carryout foods, florists, mail centers, small restaurants, small food markets, and professional services such as real estate and financial consulting. The centers typically include six to eight businesses.
• Neighborhood Centers: Neighborhood centers are anchored with a full-sized supermarket and typically range from 60,000 to 100,000 sf. They service a trade area of two to three miles and can include apparel, banks, carryout food, hardware, mail centers, restaurants, sporting goods and professional services such as financial consulting and real estate.
• Community Centers: Community centers typically range from 150,000 to 300,000 sf and are almost always anchored with a full-sized department store. They also include junior anchor retailers selling books, crafts, shoes, and sporting goods. Community centers often include large home improvement stores and medium-sized discount apparel stores. Their service area is typically five to seven miles in suburban locations.
• Lifestyle Centers: Lifestyle centers average 150,000 to 200,000 sf and feature popular apparel, book, and home furnishing stores, as well as cinemas and a wide selection of themed restaurants. The centers are frequently planned as walkable areas with main streets. Recently, lifestyle centers have included large anchors such as department stores, public libraries, and supermarkets. These centers typically have a trade area of four to six miles when developed in suburban settings. Lifestyle centers that include civic, employment, and residential buildings along with the retail land use are defined as ‘town centers.’
• Regional Centers: Regional centers average trade areas of eight to 12 miles and are anchored with multiple department stores. The centers can range from 800,000 to 1,500,000 sf, and often include cinemas along with 200,000 sf of national brand fashion.

Downtown Jackson Market Study 25. Gibbs Planning Group, Inc. 12 January 2018
Rationale The rationale for the findings in this study follows:
• Underserving retail: Despite two rather outdated regional malls within downtown Jackson’s primary trade area, current retail is underserving the population represented by $31.9 million in sales that could be captured by new or existing retailers.
• Expansive trade areas; The primary trade area is 482 square miles, and its secondary trade area is 2,284 miles. Obviously, the ability to draw consumers from such a vast distance is a major advantage for retailers. Furthermore, the city of Jackson is the county seat of Jackson County, and its distance from other populous cities provides a captive audience for retailers.
Favorable regional access: The primary trade area is well connected by numerous
highways, particularly I-94 and US-127. Limits of Study The findings of this study represent GPG’s best estimates for the amounts and types of retail projects that should be supportable in the study area. Every reasonable effort has been made to ensure that the data contained in this study reflect the most accurate and timely information possible and are believed to be reliable. This study is based on estimates, assumptions, and other information developed by GPG independent research effort, general knowledge of the industry, and consultations with the client and its representatives. This study is designed as objective third-party research and GPG does not recommend that any or all of the supportable retail be developed in the study area. No responsibility is assumed for inaccuracies in reporting by the client, its agent and representatives or in any other data source used in preparing or presenting this study. This report is based on information that was current as of January 12, 2018 and GPG has not undertaken any update of its research effort since such date. This report may contain prospective financial information, estimates, or opinions that represent GPG’s view of reasonable expectations at a particular time, but such information, estimates, or opinions are not offered as predictions or assurances that a particular level of income or profit will be achieved, that particular events will occur, or that a particular price will be offered or accepted. The actual amounts of supportable retail could be significantly higher or lower depending on multiple market and not market variables including the type, design and quality of the new development. It is plausible that a walkable town center, with well-designed buildings and public realm, could draw visitors from beyond this study’s estimated trade area boundaries and considerably outperform the site’s location and limited market potential. This would require an extraordinary development team and retailer mix unique to the market, including anchor retailers. On the other hand, a poorly implemented commercial center or badly managed businesses could underperform the location. Actual results achieved during the period covered by our prospective financial analysis may vary from those described in our report, and the variations may be material. Therefore, no warranty or representation is made by GPG that any of the projected values or results contained in this study will be achieved.

26. Downtown Jackson Market Study Gibbs Planning Group, Inc.
12 January 2018
This study should not be the sole basis for programming, planning, designing, financing, or development of any commercial center. This study is for the use of The Jackson Anchor Initiative for general planning purposes only, and is void for other site locations or developers.
-- END OF ANALYSIS –

Downtown Jackson Market Study 27. Gibbs Planning Group, Inc. 12 January 2018
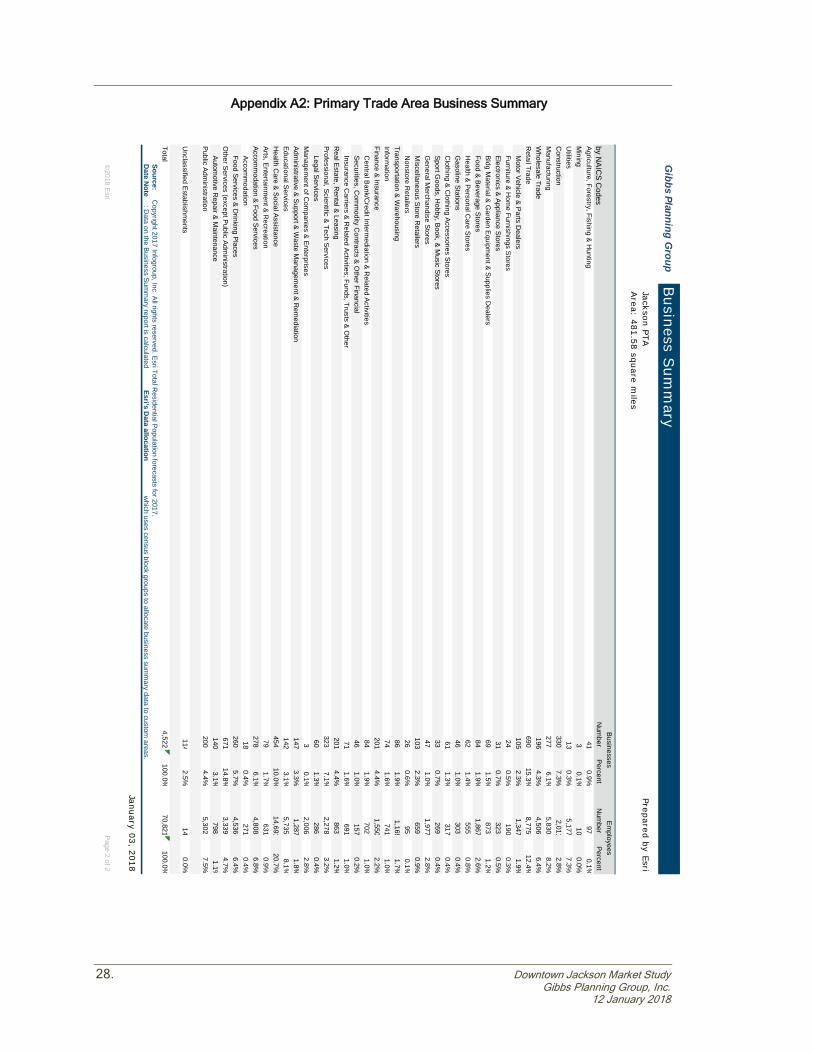
Appendix A1: Primary Trade Area Business Summary
Gibbs Planning G
roup
©2018 Esri
Page 1 of 2
January 03, 2018
Source: C
opyright 2017 Infogroup, Inc. All rights reserved. Esri Total Residential Population forecasts for 2017.
Date N
ote: D
ata on the Business Summ
ary report is calculated Esri’s D
ata allocation w
hich uses census block groups to allocate business summ
ary data to custom areas.
Totals4,522
100.0%70,821
100.0%
Unclassified Establishm
ents115
2.5%16
0.0%
Governm
ent199
4.4%5,290
7.5%
3.1%5,742
8.1%O
ther Services1,032
22.8%7,865
11.1%139
Education Institutions & Libraries
7.2%12,237
17.3%Legal Services
461.0%
2030.3%
326H
ealth Services
3.6%912
1.3%M
otion Pictures & Amusem
ents101
2.2%743
1.0%164
Automotive Services
40.4%27,972
39.5%H
otels & Lodging18
0.4%271
0.4%1,825
Services Summ
ary
3.6%2,770
3.9%161
Real Estate, H
olding, Other Investm
ent Offices
1.0%157
0.2%Insurance C
arriers & Agents71
1.6%691
1.0%46
Securities Brokers
8.0%4,318
6.1%Banks, Savings & Lending Institutions
831.8%
7001.0%
361Finance, Insurance, R
eal Estate Summ
ary
5.4%1,647
2.3%243
Miscellaneous R
etail
1.2%502
0.7%Eating & D
rinking Places255
5.6%4,482
6.3%53
Furniture & Hom
e Furnishings
3.3%1,650
2.3%Apparel & Accessory Stores
501.1%
2750.4%
151Auto D
ealers, Gas Stations, Auto Afterm
arket
1.0%1,977
2.8%Food Stores
912.0%
2,1033.0%
47G
eneral Merchandise Stores
21.2%13,509
19.1%H
ome Im
provement
691.5%
8741.2%
960R
etail Trade Summ
ary
4.4%4,518
6.4%200
Wholesale Trade
0.6%211
0.3%U
tility25
0.6%5,500
7.8%29
Com
munication
5.8%5,913
8.3%Transportation
1202.7%
1,2471.8%
264M
anufacturing
2.6%429
0.6%C
onstruction309
6.8%1,897
2.7%116
Agriculture & Mining
Employees
by SIC C
odesN
umber
PercentN
umber
PercentBusinesses
140,398Em
ployee/Residential Population R
atio (per 100 Residents)
50Total R
esidential Population:
4,522Total Em
ployees:70,821
Total Businesses:D
ata for all businesses in area
Jackson PTAPrepared by Esri
Area: 481.58 square m
iles
Business S
umm
ary
28. Downtown Jackson Market Study Gibbs Planning Group, Inc.
12 January 2018
Appendix A2: Primary Trade Area Business Summary
G
ibbs Planning Group
©2018 Esri
Page 2 of 2
January 03, 2018
Source: C
opyright 2017 Infogroup, Inc. All rights reserved. Esri Total Residential Population forecasts for 2017.
Date N
ote: D
ata on the Business Summ
ary report is calculated Esri’s D
ata allocation w
hich uses census block groups to allocate business summ
ary data to custom areas.
Total4,522
100.0%70,821
100.0%
Unclassified Establishm
ents114
2.5%14
0.0%
3.1%798
1.1%Public Adm
inistration200
4.4%5,302
7.5%140
Automotive R
epair & Maintenance
5.7%4,536
6.4%O
ther Services (except Public Administration)
67114.8%
3,3394.7%
260Food Services & D
rinking Places
6.1%4,808
6.8%Accom
modation
180.4%
2710.4%
278Accom
modation & Food Services
10.0%14,691
20.7%Arts, Entertainm
ent & Recreation
791.7%
6310.9%
454H
ealth Care & Social Assistance
3.3%1,287
1.8%Educational Services
1423.1%
5,7358.1%
147Adm
inistrative & Support & Waste M
anagement & R
emediation
1.3%286
0.4%M
anagement of C
ompanies & Enterprises
30.1%
2,0062.8%
60Legal Services
4.4%863
1.2%Professional, Scientific & Tech Services
3237.1%
2,2783.2%
201R
eal Estate, Rental & Leasing
1.0%157
0.2%Insurance C
arriers & Related Activities; Funds, Trusts & O
ther 71
1.6%691
1.0%46
Securities, Com
modity C
ontracts & Other Financial
4.4%1,550
2.2%C
entral Bank/Credit Interm
ediation & Related Activities
841.9%
7021.0%
201Finance & Insurance
1.9%1,169
1.7%Inform
ation74
1.6%741
1.0%86
Transportation & Warehousing
2.3%659
0.9%N
onstore Retailers
260.6%
950.1%
103M
iscellaneous Store Retailers
0.7%269
0.4%G
eneral Merchandise Stores
471.0%
1,9772.8%
33Sport G
oods, Hobby, Book, & M
usic Stores
1.0%303
0.4%C
lothing & Clothing Accessories Stores
611.3%
3170.4%
46G
asoline Stations
1.9%1,867
2.6%H
ealth & Personal Care Stores
621.4%
5550.8%
84Food & Beverage Stores
0.7%323
0.5%Bldg M
aterial & Garden Equipm
ent & Supplies Dealers
691.5%
8731.2%
31Electronics & Appliance Stores
2.3%1,347
1.9%Furniture & H
ome Furnishings Stores
240.5%
1900.3%
105M
otor Vehicle & Parts Dealers
4.3%4,506
6.4%R
etail Trade690
15.3%8,775
12.4%196
Wholesale Trade
7.3%2,011
2.8%M
anufacturing277
6.1%5,830
8.2%330
Construction
0.1%10
0.0%U
tilities13
0.3%5,177
7.3%3
Mining
PercentN
umber
PercentAgriculture, Forestry, Fishing & H
unting41
0.9%97
0.1%N
umber
by NAIC
S Codes
BusinessesEm
ployees
Jackson PTAPrepared by Esri
Area: 481.58 square m
iles
Business S
umm
ary

Downtown Jackson Market Study 29. Gibbs Planning Group, Inc. 12 January 2018
Appendix B1: Primary Trade Area Community Profile
Gibbs Planning Group Community Profile
Population Summary 2000 Total Population 139,076
Jackson PTA Prepared by EsriArea: 481.58 square miles
2022 Total Population 141,4452017 Group Quarters 9,245
2017 Total Population 140,3982010 Total Population 139,742
Residents 74,999Workers 59,893
2017 Total Daytime Population 134,8922017-2022 Annual Rate 0.15%
2010 Average Household Size 2.462010 Households 52,821
2000 Average Household Size 2.54
Household Summary2000 Households 51,035
2022 Average Household Size 2.442022 Households 54,248
2017 Average Household Size 2.442017 Households 53,643
2017 Families 35,1662010 Average Family Size 2.98
2010 Families 35,1422017-2022 Annual Rate 0.22%
2017-2022 Annual Rate 0.09%2022 Average Family Size 2.97
2022 Families 35,3312017 Average Family Size 2.97
Vacant Housing Units 6.5%Renter Occupied Housing Units 23.2%Owner Occupied Housing Units 70.3%
Housing Unit Summary2000 Housing Units 54,572
Vacant Housing Units 12.0%Renter Occupied Housing Units 24.9%Owner Occupied Housing Units 63.2%
2010 Housing Units 59,997
Vacant Housing Units 12.0%Renter Occupied Housing Units 26.3%Owner Occupied Housing Units 61.8%
2017 Housing Units 60,936
Vacant Housing Units 12.6%Renter Occupied Housing Units 26.2%Owner Occupied Housing Units 61.2%
2022 Housing Units 62,099
Median Home Value2017 $129,615
2022 $52,066
Median Household Income2017 $48,354
2022 $27,789
Per Capita Income2017 $24,541
2022 $171,379
Data Note: Household population includes persons not residing in group quarters. Average Household Size is the household population divided by total households. Persons in families include the householder and persons related to the householder by birth, marriage, or adoption. Per Capita Income represents the income received by all persons aged 15 years and over divided by the total population.
Source: U.S. Census Bureau, Census 2010 Summary File 1. Esri forecasts for 2017 and 2022 Esri converted Census 2000 data into 2010 geography.
2022 41.32017 40.5
Median Age2010 39.2
Page 1 of 7©2018 Esri
January 03, 2018
30. Downtown Jackson Market Study Gibbs Planning Group, Inc.
12 January 2018
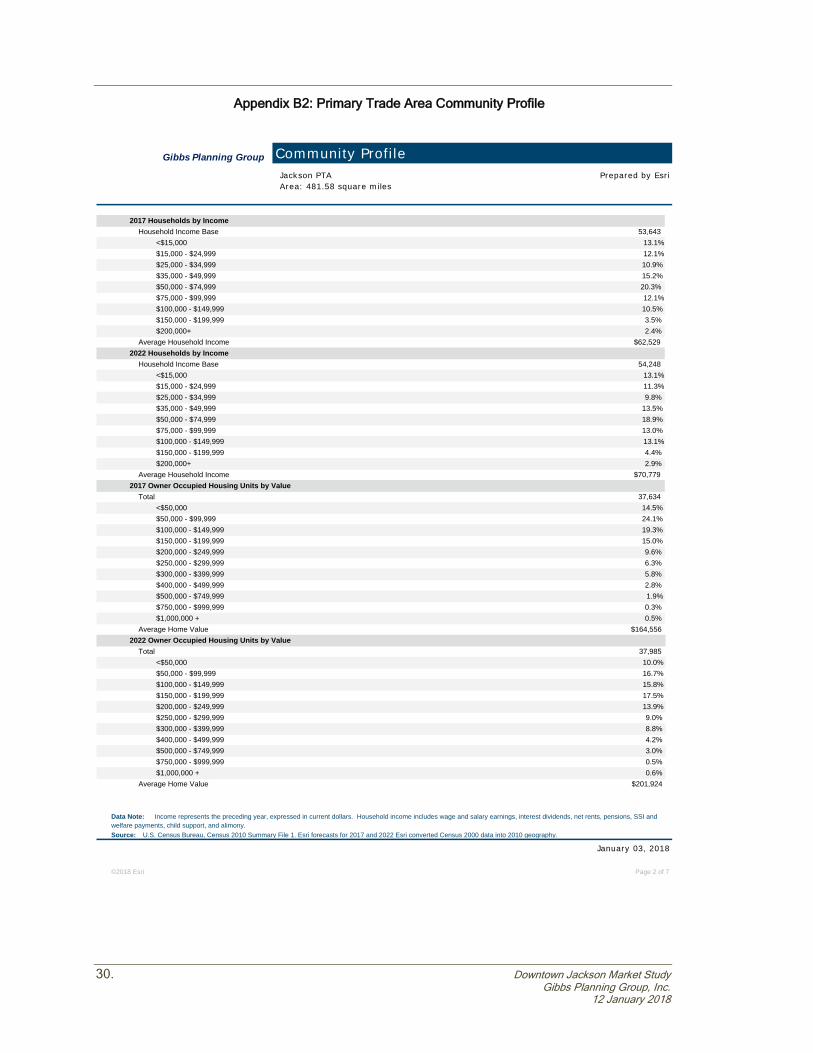
Appendix B2: Primary Trade Area Community Profile
Gibbs Planning Group Community Profile
Household Income Base 53,6432017 Households by Income
Area: 481.58 square milesJackson PTA Prepared by Esri
$35,000 - $49,999 15.2%$25,000 - $34,999 10.9%$15,000 - $24,999 12.1%<$15,000 13.1%
$150,000 - $199,999 3.5%$100,000 - $149,999 10.5%$75,000 - $99,999 12.1%$50,000 - $74,999 20.3%
2022 Households by IncomeHousehold Income Base 54,248
Average Household Income $62,529$200,000+ 2.4%
$35,000 - $49,999 13.5%$25,000 - $34,999 9.8%$15,000 - $24,999 11.3%<$15,000 13.1%
$150,000 - $199,999 4.4%$100,000 - $149,999 13.1%$75,000 - $99,999 13.0%$50,000 - $74,999 18.9%
2017 Owner Occupied Housing Units by ValueTotal 37,634
Average Household Income $70,779$200,000+ 2.9%
$150,000 - $199,999 15.0%$100,000 - $149,999 19.3%$50,000 - $99,999 24.1%<$50,000 14.5%
$400,000 - $499,999 2.8%$300,000 - $399,999 5.8%$250,000 - $299,999 6.3%$200,000 - $249,999 9.6%
Average Home Value $164,556$1,000,000 + 0.5%$750,000 - $999,999 0.3%$500,000 - $749,999 1.9%
$100,000 - $149,999 15.8%$50,000 - $99,999 16.7%<$50,000 10.0%
2022 Owner Occupied Housing Units by ValueTotal 37,985
$300,000 - $399,999 8.8%$250,000 - $299,999 9.0%$200,000 - $249,999 13.9%$150,000 - $199,999 17.5%
$1,000,000 + 0.6%$750,000 - $999,999 0.5%$500,000 - $749,999 3.0%$400,000 - $499,999 4.2%
January 03, 2018
Data Note: Income represents the preceding year, expressed in current dollars. Household income includes wage and salary earnings, interest dividends, net rents, pensions, SSI and welfare payments, child support, and alimony. Source: U.S. Census Bureau, Census 2010 Summary File 1. Esri forecasts for 2017 and 2022 Esri converted Census 2000 data into 2010 geography.
Average Home Value $201,924
Page 2 of 7©2018 Esri
Downtown Jackson Market Study 31. Gibbs Planning Group, Inc. 12 January 2018
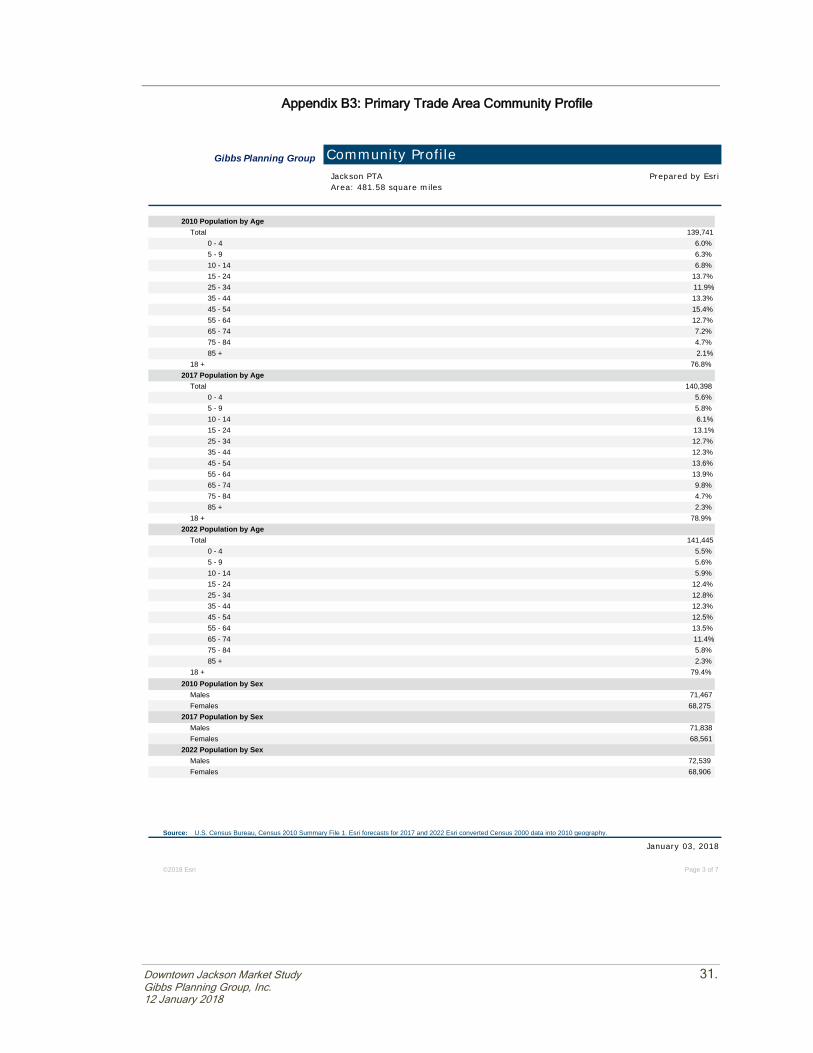
Appendix B3: Primary Trade Area Community Profile
Gibbs Planning Group
Area: 481.58 square milesJackson PTA Prepared by Esri
Community Profile
5 - 9 6.3%0 - 4 6.0%
Total 139,7412010 Population by Age
35 - 44 13.3%25 - 34 11.9%15 - 24 13.7%10 - 14 6.8%
75 - 84 4.7%65 - 74 7.2%55 - 64 12.7%45 - 54 15.4%
2017 Population by AgeTotal 140,398
18 + 76.8%85 + 2.1%
15 - 24 13.1%10 - 14 6.1%5 - 9 5.8%0 - 4 5.6%
55 - 64 13.9%45 - 54 13.6%35 - 44 12.3%25 - 34 12.7%
18 + 78.9%85 + 2.3%75 - 84 4.7%65 - 74 9.8%
5 - 9 5.6%0 - 4 5.5%
2022 Population by AgeTotal 141,445
35 - 44 12.3%25 - 34 12.8%15 - 24 12.4%10 - 14 5.9%
75 - 84 5.8%65 - 74 11.4%55 - 64 13.5%45 - 54 12.5%
2010 Population by SexMales 71,467
18 + 79.4%85 + 2.3%
Females 68,561
2017 Population by SexMales 71,838
Females 68,275
Source: U.S. Census Bureau, Census 2010 Summary File 1. Esri forecasts for 2017 and 2022 Esri converted Census 2000 data into 2010 geography.
January 03, 2018
Females 68,906
2022 Population by SexMales 72,539
©2018 Esri Page 3 of 7

32. Downtown Jackson Market Study Gibbs Planning Group, Inc.
12 January 2018
Appendix B4: Primary Trade Area Community Profile
Gibbs Planning Group Community Profile
2010 Population by Race/EthnicityTotal 139,742
Jackson PTA Prepared by EsriArea: 481.58 square miles
Asian Alone 0.8%American Indian Alone 0.4%Black Alone 9.0%White Alone 86.4%
Hispanic Origin 3.2%Two or More Races 2.7%Some Other Race Alone 0.8%Pacific Islander Alone 0.0%
White Alone 85.0%
2017 Population by Race/EthnicityTotal 140,399
Diversity Index 29.2
Pacific Islander Alone 0.0%Asian Alone 1.0%American Indian Alone 0.4%Black Alone 9.4%
Diversity Index 32.2Hispanic Origin 3.8%
Two or More Races 3.2%Some Other Race Alone 1.0%
American Indian Alone 0.4%Black Alone 9.6%White Alone 84.1%
2022 Population by Race/EthnicityTotal 141,445
Two or More Races 3.6%Some Other Race Alone 1.1%Pacific Islander Alone 0.0%Asian Alone 1.3%
2010 Population by Relationship and Household TypeTotal 139,742
Diversity Index 34.3Hispanic Origin 4.4%
Spouse 17.9%Householder 25.1%
In Family Households 77.7%In Households 93.1%
In Nonfamily Households 15.4%Nonrelative 2.7%Other relative 2.4%Child 29.6%
Data Note: Persons of Hispanic Origin may be of any race. The Diversity Index measures the probability that two people from the same area will be from different race/ethnic groups.Source: U.S. Census Bureau, Census 2010 Summary File 1. Esri forecasts for 2017 and 2022 Esri converted Census 2000 data into 2010 geography.
Noninstitutionalized Population 1.3%Institutionalized Population 5.6%
In Group Quarters 6.9%
Page 4 of 7©2018 Esri
January 03, 2018

Downtown Jackson Market Study 33. Gibbs Planning Group, Inc. 12 January 2018
Appendix B5: Primary Trade Area Community Profile
Gibbs Planning Group Community Profile
Total 97,4502017 Population 25+ by Educational Attainment
Area: 481.58 square milesJackson PTA Prepared by Esri
GED/Alternative Credential 6.7%High School Graduate 27.5%9th - 12th Grade, No Diploma 7.6%Less than 9th Grade 2.0%
Graduate/Professional Degree 6.4%Bachelor's Degree 14.5%Associate Degree 9.7%Some College, No Degree 25.5%
Widowed 6.2%Married 47.1%Never Married 32.3%
2017 Population 15+ by Marital StatusTotal 115,913
Civilian Unemployed (Unemployment Rate) 7.4%
2017 Civilian Population 16+ in Labor ForceCivilian Employed 92.6%
Divorced 14.3%
Construction 5.5%Agriculture/Mining 0.6%
2017 Employed Population 16+ by IndustryTotal 59,397
Transportation/Utilities 5.2%Retail Trade 11.8%Wholesale Trade 2.4%Manufacturing 18.9%
Public Administration 4.6%Services 45.4%Finance/Insurance/Real Estate 4.7%Information 1.0%
Professional 18.0%Management/Business/Financial 10.8%White Collar 53.2%
2017 Employed Population 16+ by OccupationTotal 59,396
Blue Collar 26.6%Services 20.2%Administrative Support 14.0%Sales 10.3%
Production 12.4%Installation/Maintenance/Repair 3.5%Construction/Extraction 4.4%Farming/Forestry/Fishing 0.4%
Population Inside Urbanized Area 64.4%
2010 Population By Urban/ Rural StatusTotal Population 139,742
Transportation/Material Moving 6.0%
Source: U.S. Census Bureau, Census 2010 Summary File 1. Esri forecasts for 2017 and 2022 Esri converted Census 2000 data into 2010 geography.
January 03, 2018
Rural Population 34.4%Population Inside Urbanized Cluster 1.1%
©2018 Esri Page 5 of 7
34. Downtown Jackson Market Study Gibbs Planning Group, Inc.
12 January 2018
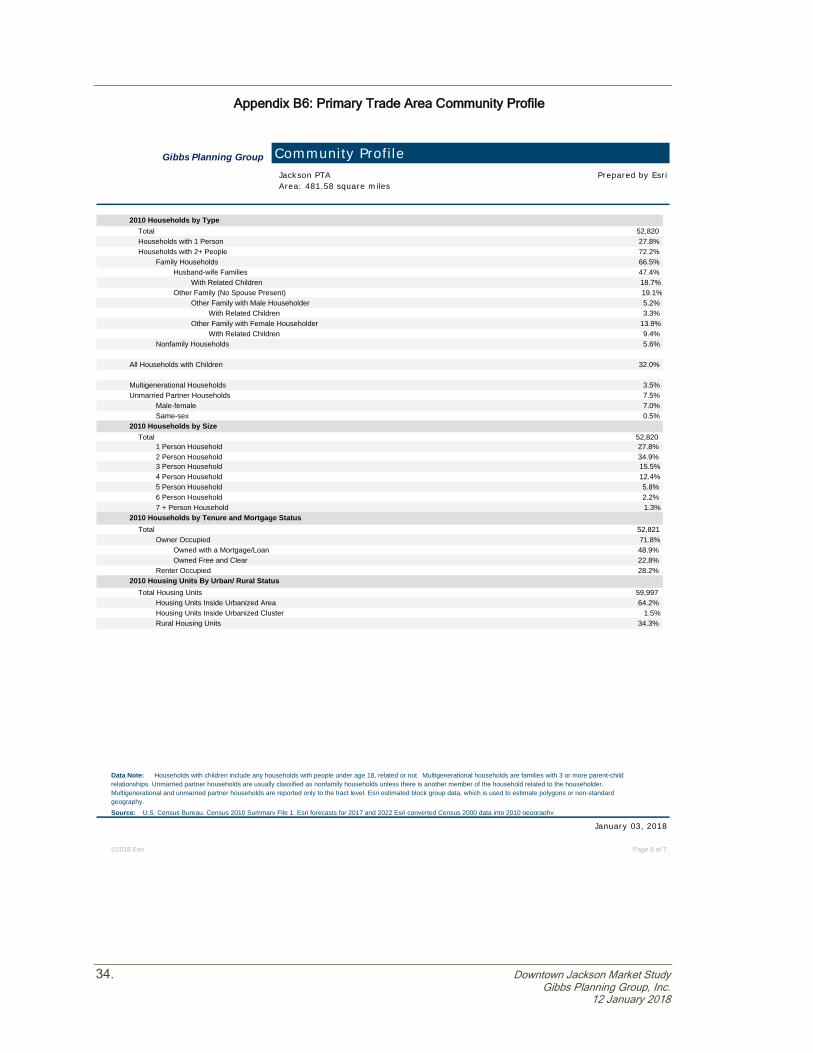
Appendix B6: Primary Trade Area Community Profile
Gibbs Planning Group
Jackson PTA Prepared by EsriArea: 481.58 square miles
Community Profile
Households with 1 Person 27.8%
2010 Households by TypeTotal 52,820
With Related Children 18.7%Husband-wife Families 47.4%
Family Households 66.5%Households with 2+ People 72.2%
Other Family with Female Householder 13.9%With Related Children 3.3%
Other Family with Male Householder 5.2%Other Family (No Spouse Present) 19.1%
All Households with Children 32.0%
Nonfamily Households 5.6%With Related Children 9.4%
Male-female 7.0%Unmarried Partner Households 7.5%Multigenerational Households 3.5%
1 Person Household 27.8%
2010 Households by SizeTotal 52,820
Same-sex 0.5%
5 Person Household 5.8%4 Person Household 12.4%3 Person Household 15.5%2 Person Household 34.9%
2010 Households by Tenure and Mortgage StatusTotal 52,821
7 + Person Household 1.3%6 Person Household 2.2%
Renter Occupied 28.2%Owned Free and Clear 22.8%Owned with a Mortgage/Loan 48.9%
Owner Occupied 71.8%
Housing Units Inside Urbanized Cluster 1.5%Housing Units Inside Urbanized Area 64.2%
2010 Housing Units By Urban/ Rural StatusTotal Housing Units 59,997
January 03, 2018
Data Note: Households with children include any households with people under age 18, related or not. Multigenerational households are families with 3 or more parent-child relationships. Unmarried partner households are usually classified as nonfamily households unless there is another member of the household related to the householder. Multigenerational and unmarried partner households are reported only to the tract level. Esri estimated block group data, which is used to estimate polygons or non-standard geography.Source: U.S. Census Bureau, Census 2010 Summary File 1. Esri forecasts for 2017 and 2022 Esri converted Census 2000 data into 2010 geography.
Rural Housing Units 34.3%
Page 6 of 7©2018 Esri

Downtown Jackson Market Study 35. Gibbs Planning Group, Inc. 12 January 2018
Appendix C1: Primary Trade Area Housing Profile
Gibbs Planning Group
Percent100.0%87.4%61.2%26.2%12.6%
Percent100.0%
10.0%16.7%15.8%17.5%13.9%9.0%8.8%4.2%3.0%0.5%0.6%
Jackson PTA Prepared by EsriArea: 481.58 square miles
Housing Profile
Population Households2017 Median Household Income $48,354
2017 Total Population 140,398 2022 Median Household Income $52,0662010 Total Population 139,742
2017-2022 Annual Rate 1.49%2017-2022 Annual Rate 0.15%2022 Total Population 141,445
Census 2010 2017 2022Percent Number
Total Housing Units 59,997 100.0% 60,936 100.0% 62,099Housing Units by Occupancy Status and Tenure Number Percent Number
88.0% 54,248Owner 37,911 63.2% 37,634 61.8% 37,985
Occupied 52,821 88.0% 53,643
26.3% 16,263Vacant 7,176 12.0% 7,293 12.0% 7,851
Renter 14,910 24.9% 16,009
2017 2022Percent Number
Total 37,634 100.0% 37,984Owner Occupied Housing Units by Value Number
14.5% 3,798$50,000-$99,999 9,072 24.1% 6,343<$50,000 5,442
19.3% 6,005$150,000-$199,999 5,636 15.0% 6,656$100,000-$149,999 7,265
9.6% 5,294$250,000-$299,999 2,356 6.3% 3,403$200,000-$249,999 3,618
5.8% 3,339$400,000-$499,999 1,042 2.8% 1,582$300,000-$399,999 2,168
1.9% 1,132$750,000-$999,999 122 0.3% 190$500,000-$749,999 729
0.5% 242$1,000,000+ 184
$171,379Average Value $164,556 $201,924Median Value $129,615
Total 59,997 100.0%Census 2010 Housing Units Number Percent
In Urban Clusters 876 1.5%In Urbanized Areas 38,548 64.2%
Data Note: Persons of Hispanic Origin may be of any race.Source: U.S. Census Bureau, Census 2010 Summary File 1.
January 03, 2018
Rural Housing Units 20,573 34.3%
©2018 Esri Page 1 of 2

36. Downtown Jackson Market Study Gibbs Planning Group, Inc.
12 January 2018
Appendix C2: Primary Trade Area Housing Profile
Gibbs Planning Group
Jackson PTA Prepared by EsriArea: 481.58 square miles
Housing Profile
Total 37,911 100.0%Census 2010 Owner Occupied Housing Units by Mortgage Status Number Percent
Owned Free and Clear 12,057 31.8%Owned with a Mortgage/Loan 25,854 68.2%
Census 2010 Vacant Housing Units by StatusPercent
Total 7,121 100.0%Number
2,474 34.7%Rented- Not Occupied 78 1.1%For Rent
1,181 16.6%Sold - Not Occupied 292 4.1%For Sale Only
1,312 18.4%For Migrant Workers 4 0.1%Seasonal/Recreational/Occasional Use
1,780 25.0%Other Vacant
Census 2010 Occupied Housing Units by Age of Householder and Home OwnershipOwner Occupied Units
Occupied Number % of Occupied52,822 37,911 71.8%Total
2,238 505 22.6%15-246,957 3,634 52.2%25-348,980 6,261 69.7%35-4411,384 8,702 76.4%45-5410,228 8,401 82.1%55-64
6,415 5,440 84.8%65-744,492 3,645 81.1%75-842,128 1,323 62.2%85+
Census 2010 Occupied Housing Units by Race/Ethnicity of Householder and Home OwnershipOwner Occupied Units
Occupied Number % of Occupied52,820 37,910 71.8%Total47,762 35,771 74.9%White Alone
3,508 1,344 38.3%Black/African American Alone170 89 52.4%American Indian/Alaska Native Alone323 182 56.3%Asian Alone
8 6 75.0%Pacific Islander Alone354 174 49.2%Other Race Alone695 344 49.5%Two or More Races
1,090 616 56.5%Hispanic Origin
Census 2010 Occupied Housing Units by Size and Home OwnershipOwner Occupied Units
Occupied Number % of Occupied52,822 37,911 71.8%Total14,704 8,661 58.9%1-Person18,427 14,708 79.8%2-Person
8,211 5,985 72.9%3-Person6,543 4,979 76.1%4-Person3,048 2,251 73.9%5-Person1,177 855 72.6%6-Person
Data Note: Persons of Hispanic Origin may be of any race.Source: U.S. Census Bureau, Census 2010 Summary File 1.
January 03, 2018
712 472 66.3%7+ Person
©2018 Esri Page 2 of 2
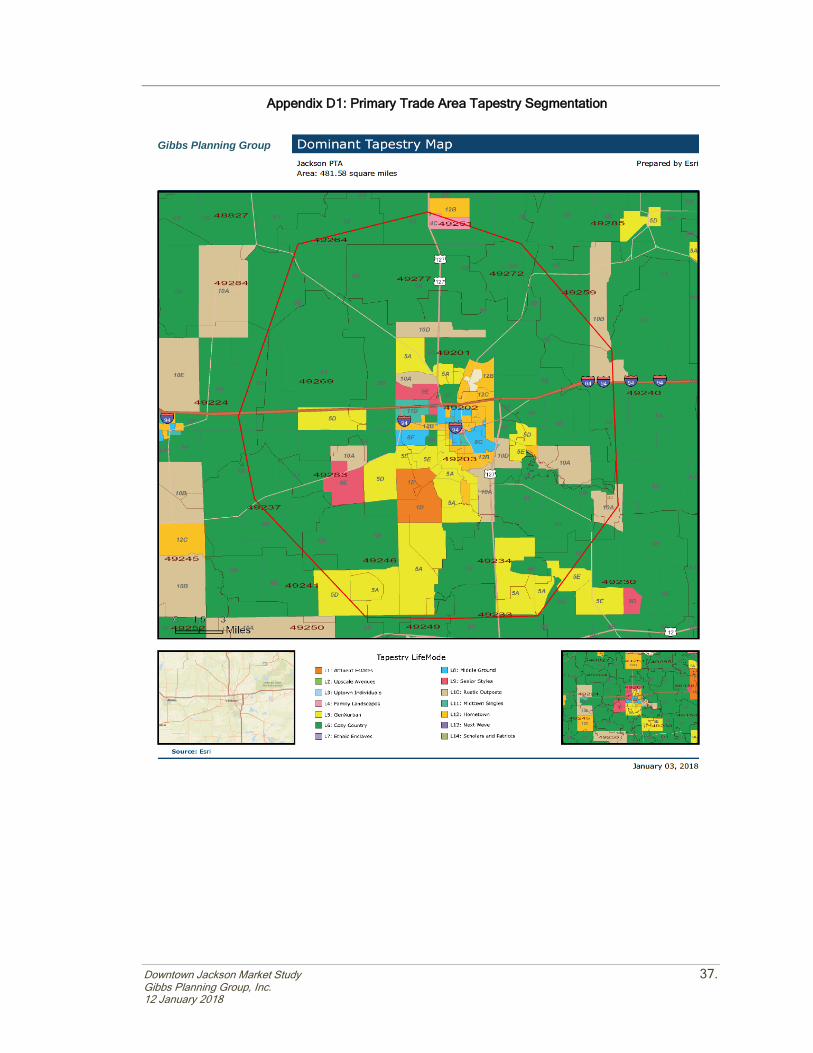
Downtown Jackson Market Study 37. Gibbs Planning Group, Inc. 12 January 2018
Appendix D1: Primary Trade Area Tapestry Segmentation
Gibbs Planning Group

38. Downtown Jackson Market Study Gibbs Planning Group, Inc.
12 January 2018
Appendix D2: Primary Trade Area Tapestry Segmentation
Gibbs Planning Group Tapestry Segmentation Area Profile
Top Twenty Tapestry Segments
Jackson PTA Prepared by EsriArea: 481.58 square miles
Percent Percent IndexRank Tapestry Segment Percent Percent
2017 U.S. HouseholdsCumulativ Cumulativ
2017 Households
1.9% 4.8% 6212 Traditional Living (12B) 12.1% 26.7%2.9% 2.9% 5081 Salt of the Earth (6B) 14.6% 14.6%
2.2% 9.3% 3794 Rustbelt Traditions (5D) 8.4% 43.6%2.3% 7.1% 3683 Heartland Communities (6F) 8.5% 35.2%
12.5%Subtotal 51.5%3.2% 12.5% 2485 Green Acres (6A) 7.9% 51.5%
1.2% 13.7% 6126 Hardscrabble Road (8G) 7.5% 59.0%
1.2% 17.4% 4898 Retirement Communities (9E) 6.0% 72.0%2.5% 16.2% 2857 Comfortable Empty Nesters (5A) 7.0% 66.0%
2.5% 23.0% 17410 Midlife Constants (5E) 4.3% 81.5%3.1% 20.5% 1679 Southern Satellites (10A) 5.2% 77.2%
10.5%Subtotal 30.0%
2.3% 27.2% 11812 Old and Newcomers (8F) 2.7% 87.3%1.9% 24.9% 16611 Small Town Simplicity (12C) 3.1% 84.6%
1.1% 29.2% 14214 Down the Road (10D) 1.6% 91.2%0.9% 28.1% 25613 City Commons (11E) 2.3% 89.6%
7.6%Subtotal 11.2%1.4% 30.6% 10715 Set to Impress (11D) 1.5% 92.7%
1.9% 32.5% 7116 Exurbanites (1E) 1.4% 94.1%
3.0% 37.7% 4218 Savvy Suburbanites (1D) 1.2% 96.6%2.2% 34.7% 5817 In Style (5B) 1.3% 95.4%
1.0% 39.5% 9220 Rural Resort Dwellers (6E) 0.9% 98.7%0.8% 38.5% 14819 Social Security Set (9F) 1.2% 97.8%
8.9%Subtotal 6.0%
January 03, 2018
Data Note: This report identifies neighborhood segments in the area, and describes the socioeconomic quality of the immediate neighborhood. The index is a comparison of the percent of households or Total Population 18+ in the area, by Tapestry segment, to the percent of households or Total Population 18+ in the United States, by segment. An index of 100 is the US average.Source: Esri
39.7% 249Total 98.8%
Page 1 of 6©2018 Esri