Retail Market Monitor 20210705 - alanyeo.files.wordpress.com
12
R e t a i l M a r k e t M o n i t o r Monda y , 05 Jul y 2021 www.utrade.com.sg 1 SINGAPORE MARKET NEWS US stocks were higher after the close on Friday, as gains in the technology, consumer discretionary and communication services sectors led shares higher. At the close of the NYSE, the DJIA rose 0.44% while the S&P 500 index gained 0.75%, and the NASDAQ Composite index advanced 0.81%. Advancing stocks outnumbered falling ones on the NYSE by 1,680 to 1,600 and 178 ended unchanged; on the Nasdaq Stock Exchange, 2,555 declined and 1,723 advanced, while 211 ended unchanged. (Source: WSJ, CNBC) During the last trading session, the FSSTI index rose 4.76pt to 3,128.95. Among the top active stocks were Sembcorp Marine (+1.6%), Thai Beverage (-0.7%), SIA (+1.8%), Rex International (+1.1%) and MM2 Asia (+4.3%). The FTSE ST Mid Cap Index was up 0.7% while the FTSE ST Small Cap Index rose 1.2%. The broader market saw 269 gainers and 230 losers with total trading value of S$1.10b. WHAT’S IN THE PACK Singapore Sector Update: Telecommunications - 5G rollout on track; near-term ARPU rise will partly mitigate dilution from SIM-only plans. The 5G standalone rollout is on track to achieve 50% population coverage by end-22. We expect the competitive landscape to remain benign as incumbents focus on monetising 5G services. A back-test of the 3G and 4G technological transition suggests telcos benefit from a new/better products and services, and this will likely come from the enterprise solution in the 5G era. Industry consolidation/JV will help to stabilise ROICs. Maintain OVERWEIGHT. Top picks: Netlink and Singtel… Singapore Sector Update: EV Battery Materials - Leading players’ acceleration continues in 2H21. Riding on strong downstream demand, EV battery material prices and shipments continue to be boosted in 2H21. For electrolytes: Aggressive capacity expansion from 2023 onward and long- term contracts will offset cyclicality. For cathodes: An accelerating nickel-rich trend and the metal price stabilising. For separators: Possible price hikes to serve as a catalyst in the future. Raise target prices for Enjie, Tinci and Easpring on higher earnings forecasts... REITs & Landlords - Consumption vouchers and travel resumption to support retail rebound; upgrade to OVERWEIGHT. Hong Kong retail sales increased 10.5% yoy in May 21, above expectations of 6.9%. We expect the rollout of the government’s evoucher support scheme to boost retail sales in the short term. Meanwhile, we observe that vaccination rates have been increasing meaningfully and this could lead to relaxation of social distancing measures and travel restrictions in the next six months. Upgrade to OVERWEIGHT as we expect retail rents to rebound in 2H21… Singapore Technical Analysis: CSE Global (CSE SP) - Trading BUY The price broke and closed above the cloud last Friday after being supported by the cloud support, keeping the bullish trend intact… Frasers Centrepoint Trust (FCT SP) - Trading BUY The outlook of the stock price remains bullish as the price is still trading above the cloud. There is still a bullish conversion and base line crossover… Get up to speed by learning from our experts - Sign up for a seminar today! PRICE CHART KEY INDICES Prev Close 1D % YTD % DJIA 34786.4 0.4 13.7 S&P 500 4352.3 0.8 15.9 FTSE 100 7123.3 (0.0) 10.3 AS30 7587.1 0.6 10.8 CSI 300 5081.1 (2.8) (2.5) FSSTI 3129.0 0.2 10.0 HSCEI 10415.6 (2.3) (3.0) HSI 28310.4 (1.8) 4.0 JCI 6023.0 0.3 0.7 KLCI 1533.4 (0.1) (5.8) KOSPI 3281.8 (0.0) 14.2 Nikkei 225 28783.3 0.3 4.9 SET 1578.5 (1.0) 8.9 TWSE 17710.2 (0.0) 20.2 BDI 3285 (1.6) 140.5 CPO (RM/mt) 3892 (0.7) 2.7 Brent Crude (US$/bbl) 76 (0.2) 46.8 Source: Bloomberg TOP VOLUME Company Price (S$) Chg (%) Volume ('000s) Sembcorp Marine 0.13 1.6 138,877 ESR-REIT 0.46 5.8 47,893 Thai Beverage 0.67 (0.7) 41,832 Genting Singapore 0.84 0.0 39,236 Keppel DC REIT 2.45 (0.8) 19,143 TOP GAINERS Company Price (S$) Chg (%) Volume ('000s) Oue Commercial Real Estate 0.44 6.1 14,683 ESR-REIT 0.46 5.8 47,893 SPH REIT 0.93 5.1 8,589 Sinarmas Land 0.29 3.6 95 Lendlease Global Commercial 0.87 3.0 9,486 TOP LOSERS Company Price (S$) Chg (%) Volume ('000s) Oxley Holdings 0.23 (4.2) 477 Ifast Corp 8.09 (2.3) 742 Hour Glass 1.52 (1.9) 364 Frasers Property 1.14 (1.7) 131 Raffles Medical Group 1.15 (1.7) 456
Transcript of Retail Market Monitor 20210705 - alanyeo.files.wordpress.com

R e t a i l M a r k e t M o n i t o r Monda y , 05 Ju l y 2021
w w w . u t r a d e . c o m . s g 1
S I N G A P O R E
MARKET NEWS US stocks were higher after the close on Friday, as gains in the technology, consumer discretionary and communication services sectors led shares higher. At the close of the NYSE, the DJIA rose 0.44% while the S&P 500 index gained 0.75%, and the NASDAQ Composite index advanced 0.81%. Advancing stocks outnumbered falling ones on the NYSE by 1,680 to 1,600 and 178 ended unchanged; on the Nasdaq Stock Exchange, 2,555 declined and 1,723 advanced, while 211 ended unchanged. (Source: WSJ, CNBC)
During the last trading session, the FSSTI index rose 4.76pt to 3,128.95. Among the top active stocks were Sembcorp Marine (+1.6%), Thai Beverage (-0.7%), SIA (+1.8%), Rex International (+1.1%) and MM2 Asia (+4.3%). The FTSE ST Mid Cap Index was up 0.7% while the FTSE ST Small Cap Index rose 1.2%. The broader market saw 269 gainers and 230 losers with total trading value of S$1.10b.
WHAT’S IN THE PACK Singapore Sector Update: Telecommunications - 5G rollout on track; near-term ARPU rise will partly mitigate dilution from SIM-only plans. The 5G standalone rollout is on track to achieve 50% population coverage by end-22. We expect the competitive landscape to remain benign as incumbents focus on monetising 5G services. A back-test of the 3G and 4G technological transition suggests telcos benefit from a new/better products and services, and this will likely come from the enterprise solution in the 5G era. Industry consolidation/JV will help to stabilise ROICs. Maintain OVERWEIGHT. Top picks: Netlink and Singtel…
Singapore Sector Update: EV Battery Materials - Leading players’ acceleration continues in 2H21. Riding on strong downstream demand, EV battery material prices and shipments continue to be boosted in 2H21. For electrolytes: Aggressive capacity expansion from 2023 onward and long-term contracts will offset cyclicality. For cathodes: An accelerating nickel-rich trend and the metal price stabilising. For separators: Possible price hikes to serve as a catalyst in the future. Raise target prices for Enjie, Tinci and Easpring on higher earnings forecasts...
REITs & Landlords - Consumption vouchers and travel resumption to support retail rebound; upgrade to OVERWEIGHT. Hong Kong retail sales increased 10.5% yoy in May 21, above expectations of 6.9%. We expect the rollout of the government’s evoucher support scheme to boost retail sales in the short term. Meanwhile, we observe that vaccination rates have been increasing meaningfully and this could lead to relaxation of social distancing measures and travel restrictions in the next six months. Upgrade to OVERWEIGHT as we expect retail rents to rebound in 2H21…
Singapore Technical Analysis: CSE Global (CSE SP) - Trading BUY The price broke and closed above the cloud last Friday after being supported by the cloud support, keeping the bullish trend intact…
Frasers Centrepoint Trust (FCT SP) - Trading BUY The outlook of the stock price remains bullish as the price is still trading above the cloud. There is still a bullish conversion and base line crossover…
Get up to speed by learning from our experts - Sign up for a seminar today!
P R I C E C H A R T
KEY INDICES Prev Close 1D % YTD %
DJIA 34786.4 0.4 13.7 S&P 500 4352.3 0.8 15.9 FTSE 100 7123.3 (0.0) 10.3 AS30 7587.1 0.6 10.8 CSI 300 5081.1 (2.8) (2.5)FSSTI 3129.0 0.2 10.0 HSCEI 10415.6 (2.3) (3.0)HSI 28310.4 (1.8) 4.0 JCI 6023.0 0.3 0.7 KLCI 1533.4 (0.1) (5.8)KOSPI 3281.8 (0.0) 14.2 Nikkei 225 28783.3 0.3 4.9 SET 1578.5 (1.0) 8.9 TWSE 17710.2 (0.0) 20.2
BDI 3285 (1.6) 140.5 CPO (RM/mt) 3892 (0.7) 2.7 Brent Crude (US$/bbl) 76 (0.2) 46.8
Source: Bloomberg
TOP VOLUME
Company Price (S$)
Chg (%)
Volume ('000s)
Sembcorp Marine 0.13 1.6 138,877ESR-REIT 0.46 5.8 47,893Thai Beverage 0.67 (0.7) 41,832Genting Singapore 0.84 0.0 39,236Keppel DC REIT 2.45 (0.8) 19,143
TOP GAINERS
Company Price (S$)
Chg (%)
Volume ('000s)
Oue Commercial Real Estate 0.44 6.1 14,683ESR-REIT 0.46 5.8 47,893SPH REIT 0.93 5.1 8,589Sinarmas Land 0.29 3.6 95Lendlease Global Commercial 0.87 3.0 9,486
TOP LOSERS
Company Price (S$)
Chg (%)
Volume ('000s)
Oxley Holdings 0.23 (4.2) 477Ifast Corp 8.09 (2.3) 742Hour Glass 1.52 (1.9) 364Frasers Property 1.14 (1.7) 131Raffles Medical Group 1.15 (1.7) 456

R e t a i l M a r k e t M o n i t o r Monda y , 05 Ju l y 2021
w w w . u t r a d e . c o m . s g 2
S I N G A P O R E
TRADERS’ CORNER
CSE Global (CSE SP) Trading Buy Range: S$0.540-0.545
Last price: S$0.540
Target price: S$0.590
Protective stop: S$0.520
The price broke and closed above the cloud last Friday after being supported by cloud support, keeping the bullish trend intact. The MACD is bullish and there is a bullish crossover. We could see price continuing its upward strength to move higher. The potential upside target is S$0.590. Stops could be placed at S$0.520. Approximate timeframe on average: 1-2 weeks (initiate this trade idea if the stock hits the entry price range within three trading days) Our institutional research has a fundamental BUY and target price of S$0.68.
Frasers Centrepoint Trust (FCT SP) Trading Buy Range: S$2.47-2.48
Last price: S$2.45
Target price: S$2.60
Protective stop: S$2.40
The outlook of the stock price remains bullish as price is still trading above the cloud. There is still a bullish conversion and base line crossover. The MACD is also bullish and there is a bullish crossover. These could increase chances of the stock price breaking above its recent high to move higher. The potential upside target is S$2.60. Stops could be placed at S$2.40. Approximate timeframe on average: 1-2 weeks (initiate this trade idea if the stock hits the entry price range within three trading days) Our institutional research has a fundamental BUY and target price of S$3.06. ANALYST(S) Wong Shueh Ting, CFTe +65 6590 6616 [email protected]

R e t a i l M a r k e t M o n i t o r Monda y , 05 Ju l y 2021
w w w . u t r a d e . c o m . s g 3
S I N G A P O R E
FROM THE REGIONAL MORNING NOTES.. .
Telecommunications - Singapore 5G SA Rollout On Track; ARPU Rise To Partly Arrest Dilution From SIM Plans The 5G standalone rollout is on track to achieve 50% population coverage by end-22. We expect the competitive landscape to remain benign as incumbents focus on monetising 5G services. A back-test of the 3G and 4G technological transition suggests telcos benefit from a new product/customer base, and this will likely come from the enterprise solution in the 5G era. Industry consolidation/JV will help to stabilise ROICs. Maintain OVERWEIGHT. Top picks: Netlink and Singtel.
WHAT’S NEW • 5G standalone rollout is on track... Singtel, StarHub and M1 are currently focused on
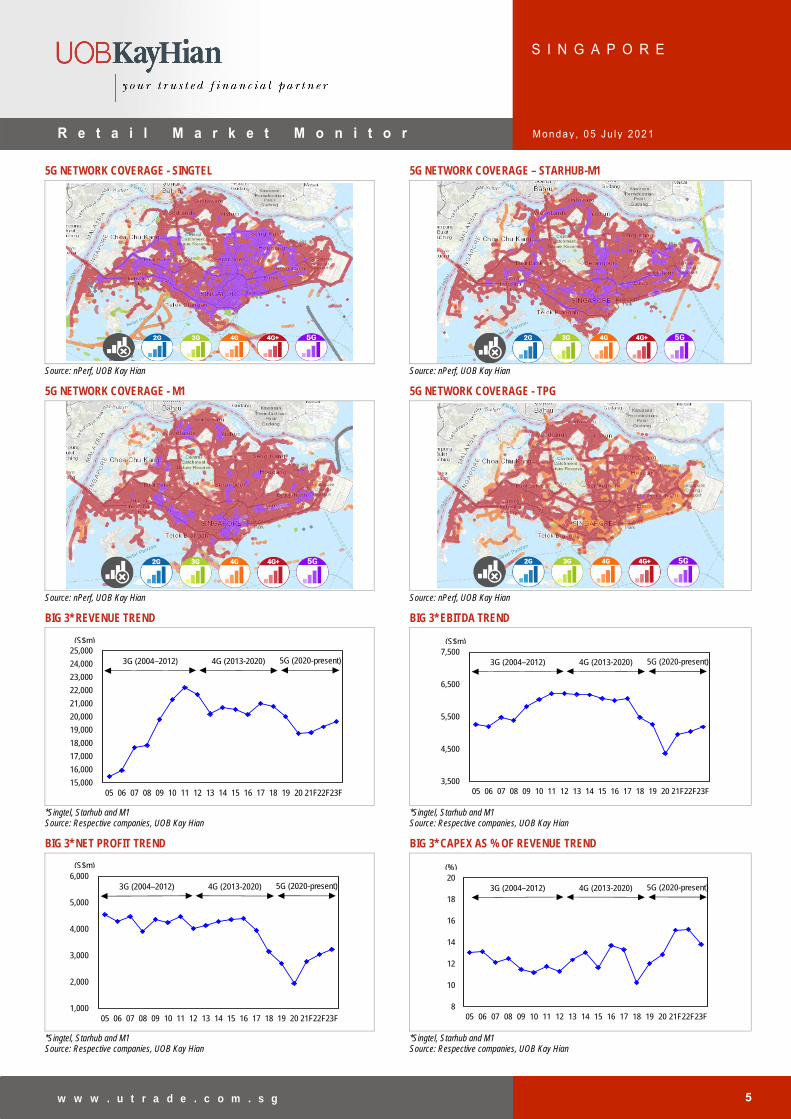
the expansion of the 5G-standalone (SA) network. Importantly, all operators are on track to deliver 50% population coverage by 2022 and nationwide coverage by 2025. Based on a network survey by nPerf (see charts), Singtel had a head start with the launch of 5G SA coverage back in 4Q20. As for the StarHub-M1 joint venture (named Antina), we understand that the 5G SA rollout started with base station identification and installation. At this juncture, StarHub has achieved more than 70% of outdoor 5G NSA coverage. Singtel and Antina have appointed Ericsson and Nokia as their respective 5G core provider. Based on a report from Open Signal, Singapore is ranked in the middle of the Asia Pacific region (APAC) market for 5G download speed with 2.9x faster download speed vs the existing 4G network. Also, Singapore appears to rank second (only to South Korea) for the 5G game experience at this stage.
• … and take-up of premium bundles have been encouraging. With the rollout of 5G handset bundles (since 4Q20), telcos have been reporting good take-up of these packages (ie meeting internal targets). It appears that smartphone users are embracing 5G to improve user experience with mobile applications. This, we believe, will remain the trend in 2H21. Importantly, the introduction of 5G services will help to partly offset average revenue per user (ARPU) dilution from SIM-only plans. In 1Q21, StarHub demonstrated sequentially stable blended ARPUs (postpaid: S$28/month, prepaid: S$10/month) and we believe this is due to: a) benign competitive landscape, and b) uplift from 5G bundles helping to partly offset ARPU dilution. Singtel also mentioned that 2HFY21 sales of equipment were higher (+41% hoh, +6% yoy) due to higher sales of 5G handsets.
• 5G consumer bundles appear encouraging thus far, helping to partly mitigate ARPU dilution from SIM-only plans. Pulling away from TPG’s attractive data pricing packages, we note that the incumbents (particularly StarHub and Singtel) are offering 5G embedded offers. For one, StarHub recently launched a 5G SIM-only product called Mobile+ SIM Only. The most affordable plan, at S$38 monthly, comes with a total of 70GB data. On top of having huge data bundles, customers on these plans will also enjoy 12 months of Disney+ on StarHub. This product is S$10/month higher than its 1Q21 postpaid ARPUs. Singtel is offering 5G services via its XO Plus plans. With the exception of XO Plus 50 (for S$50/month), 5G access is available to all XO Plus plans (ranging from S$68-S$168/month). In contrast, Singtel’s postpaid ARPUs are hovering at S$29/month (2HFY21).
PEER COMPARISON Company Tickers Rec Share Price Target Price Market Cap ------------- PE (x) ------------- ------- EV/EBITDA (x) ------- ---- Dividend Yield (%) ----
2 Jul 21 (S$) (S$) (S$)
FY21F(x)
FY22F(x)
FY21F (x)
FY22F (x)
FY21F(x)
FY22F(x)
NetLink NBN Trust NETLINK SP BUY 0.955 1.08 3,722 37.3 35.6 16.0 15.5 5.3 5.3 Singtel ST SP BUY 2.27 2.84 37,486 14.1 12.8 11.5 11.4 4.4 5.0 StarHub STH SP HOLD 1.21 1.30 2,095 15.1 14.0 5.7 5.2 4.1 5.0
Source: UOB Kay Hian

R e t a i l M a r k e t M o n i t o r Monda y , 05 Ju l y 2021
w w w . u t r a d e . c o m . s g 4
S I N G A P O R E
ACTION • Maintain OVERWEIGHT on the sector given attractive sector valuation and earnings
recovery beyond 1H21. The sector is currently trading at 1SD below its 5-year mean EV/EBITDA of 12.3x. We believe earnings recovery should be more certain, given the benign competitive landscape and relatively better control of COVID-19 cases. We also believe the nationwide 5G rollout will help the incumbents sustain market share. Pronounced earnings uplift from the enterprise business may take a longer time to bear fruit as telcos continue to explore new business applications for 5G. Our top pick is undervalued Singtel and defensive Netlink. Singtel will benefit from the reopening of economies in the region and positive newsflow on the stake sale of Optus tower, amongst others.
• Singtel (ST SP/BUY/Target: S$2.84). We believe earnings weakness is largely priced in as the stock trades close to 1SD below its 5-year mean EV/EBITDA. Key re-rating catalysts include: a) reopening of economies in 2H21; b) monetisation of 5G nationwide coverage; c) faster-than-expected recovery in Optus’ consumer and enterprise business; and d) market repair in Singapore. Our DCF-based target price implies 14x 2022F EV/EBITDA (5-year mean).
• NetLink NBN Trust (NETLINK SP/BUY/Target: S$1.08). NetLink NBN Trust (Netlink) offers good earnings visibility and a sustainable dividend yield of 5% over FY22-23. The stock is defensive amid external volatility with 80% of group revenue derived from a 7% regulated return over 2018-22. Key re-rating catalysts include: a) 5G densification – more job orders arising from telcos’ fibre network densification demand; and b) growth in demand for non-building address point connections with the rollout of 5G/Smart Nation initiatives. At our target price, the stock trades at 17x FY21F EV/EBITDA, +1SD above its three-year mean EV/EBITDA of 15.3x. We expect the stock to further outperform as investors seek shelter in high dividend yielding stocks amid external volatility.
ESSENTIALS • Back-test of 3G and 4G technological refresh… We back-test periods of technological
refresh between 3G and 4G for the mobile service revenue and valuation trend in Singapore. Clearly, when telcos moved from 2G to 3G, there was strong top-line growth (5-year CAGR of 7%) and valuation expansion (see RHS chart). We believe this was due to telco operators’ ability to upsell via a “new” product ie data. Telcos were concurrently selling voice, SMS and data (with bundled smartphones). Thereafter, the transition towards 4G appeared to be characterised by sliding mobile service revenue (as 4G offers faster speed but same product ie data, thereby creating competition) and valuation (due to lower ROIC given higher capex). Please refer to overleaf charts.
• …provides pointers for 5G outlook. Stepping into the era of 5G, we expect the following trends: a) ARPU uplift for consumer packages (coming from gamers and premium customers) will partly offset intense data pricing in the market, and importantly, b) establishment of new business applications for 5G will open up a new customer base for telcos ie machines/connection points (Internet of Things (IoT)). In addition, industry consolidation (including the tower asset sale) and joint co-location for 5G rollout will address dilution in ROICs.
• Singapore telcos echoed the view that 5G enterprise opportunities will be driven mainly by solutions and applications. By virtue of low latency and high reliability (for the 5G SA network) 5G is expected to land new user cases across sectors, like remote robotics, massive IoT deployment and so forth. In an independent research report, the potential annual revenue accretion from 5G is estimated at S$370m-510m (or 7-9% of current annual enterprise business revenue for Singtel and StarHub). However, monetisation of 5G use cases is expected to take place over time as the ecosystem is still nascent and not all use cases can be effectively addressed by telecom operators.
• 2H21 recovery likely to be aided by resumption of handset sales and ICT revenue. We expect the gradual reopening of economic activities and business sentiment to boost demand for project-based services, ie information and communications technology solutions and cybersecurity services. Together with benign competitive landscape (TPG is still aggressive in terms of data pricing but the incumbents are pulling away with a focus on its 5G offering) will aid Singtel and StarHub towards their earnings recovery for 2H21. The enterprise segment accounts for 34% and 33% of their group revenue respectively.
R e t a i l M a r k e t M o n i t o r Monda y , 05 Ju l y 2021
w w w . u t r a d e . c o m . s g 5
S I N G A P O R E
5G NETWORK COVERAGE - SINGTEL 5G NETWORK COVERAGE – STARHUB-M1
Source: nPerf, UOB Kay Hian Source: nPerf, UOB Kay Hian
5G NETWORK COVERAGE - M1 5G NETWORK COVERAGE - TPG
Source: nPerf, UOB Kay Hian Source: nPerf, UOB Kay Hian
BIG 3* REVENUE TREND BIG 3* EBITDA TREND
15,000
16,000
17,000
18,000
19,000
20,000
21,000
22,000
23,000
24,000
25,000
05 06 07 08 09 10 11 12 13 14 15 16 17 18 19 20 21F22F23F
3G (2004–2012) 4G (2013-2020) 5G (2020-present)
(S$m)
3,500
4,500
5,500
6,500
7,500
05 06 07 08 09 10 11 12 13 14 15 16 17 18 19 20 21F22F23F
3G (2004–2012) 4G (2013-2020) 5G (2020-present)
(S$m)
*Singtel, Starhub and M1 Source: Respective companies, UOB Kay Hian
*Singtel, Starhub and M1 Source: Respective companies, UOB Kay Hian
BIG 3* NET PROFIT TREND BIG 3* CAPEX AS % OF REVENUE TREND
1,000
2,000
3,000
4,000
5,000
6,000
05 06 07 08 09 10 11 12 13 14 15 16 17 18 19 20 21F22F23F
3G (2004–2012) 4G (2013-2020) 5G (2020-present)
(S$m)
8
10
12
14
16
18
20
05 06 07 08 09 10 11 12 13 14 15 16 17 18 19 20 21F22F23F
3G (2004–2012) 4G (2013-2020) 5G (2020-present)
(%)
*Singtel, Starhub and M1 Source: Respective companies, UOB Kay Hian
*Singtel, Starhub and M1 Source: Respective companies, UOB Kay Hian

R e t a i l M a r k e t M o n i t o r Monda y , 05 Ju l y 2021
w w w . u t r a d e . c o m . s g 6
S I N G A P O R E
FROM THE REGIONAL MORNING NOTES.. .
EV Battery Materials – China Leading Players’ Acceleration To Continue In 2H21 And Beyond Riding on strong downstream demand, EV battery material prices and shipments continue to be boosted in 2H21. For electrolytes: Aggressive capacity expansion from 2023 onward and long-term contracts will offset cyclicality. For cathodes: An accelerating nickel-rich trend and the metal price stabilising. For separators: Possible price hikes to serve as a catalyst in the future. Raise target prices for Enjie, Tinci and Easpring on higher earnings forecasts.
WHAT’S NEW • Surging EV battery installations in 5M21. China’s domestic electric vehicle (EV)
battery installation hit 9.8GWh in May 21, up 178.2% yoy and 16.2% mom. Of the 9.8 GWh, NCM/LFP batteries accounted for 53%/46% of total installations respectively. For 5M21, total domestic EV battery installations hit 41.4GWh, up 223.9% yoy, and NCM/LFP battery installations hit 24.2/17.1GWh, up 151.7%/456.6% yoy respectively.
• Electrolyte: Aggressive capacity expansion from 2023 onwards; long-term contracts to offset cyclicality. The spot LiPF6 (core raw material of electrolyte) price continued to be strong and cumulatively gained 186% ytd after gaining 11% since end- May 21. We believe there will be no relief from the supply shortage before 2023, despite aggressive LiPF6 capacity expansion plans announced by major players, who are mostly likely to start production within 18-36 months. CATL’s move to sign a long-term contract with Tinci Materials (002709 CH) will help to partially offset the cyclicality of the electrolyte industry.
• Cathode: Accelerating nickel-rich trend; price stabilising. As of 22 Jun 21, the prices of NCM 622/523/111 precursors had risen 6%/1%/0% mtd respectively, thanks to the raw material price stabilising. Meanwhile, the prices of 8/6-series cathode also rose 2%/1% mtd. According to ICCSINO, nickel-rich batteries accounted for 38% of May 21’s total NCM cathode production (vs 24% in 2020). We believe this trend is likely to continue going forward with customers’ pursuit of higher energy density and longer range requirements.
• Separator: Possible price hikes to serve as a catalyst in the future. Due to technology development and fierce competition within the industry, separator prices (both dry-processed and wet-processed) have been on a continuous downtrend in the past few years. However, we believe that it is possible for leaders in the industry to raise product prices amid the tight market supply in the near term. This could serve as a positive catalyst for the whole industry.
PEER COMPARISON
Company Ticker Rec Price @ Target Upside/
(Downside) Market ---------- PE ---------- --------- P/B -------- ---- EV/EBITDA --- 01 Jul 21 Price to TP Cap 2021F 2022F 2021F 2022F 2021F 2022F ROE (lcu) (lcu) (%) (US$m) (x) (x) (x) (x) (x) (x) (%)
Beijing Easpring Material Technology 300073 CH BUY 55.08 73.00 32.5 3,895 40.6 31.6 5.6 4.9 31.8 24.1 16.6 Yunnan Energy New Material 002812 CH BUY 235.96 270.00 14.4 32,069 93.9 54.1 15.8 12.5 45.7 30.0 25.8 GEM 002340 CH BUY 9.07 11.80 30.1 6,872 28.7 22.4 2.7 2.5 15.4 13.0 11.6 Guangzhou Tinci Materials Technology 002709 CH BUY 101.92 130.00 27.6 14,846 52.0 37.1 13.5 10.2 41.4 30.1 31.3
Source: Bloomberg, UOB Kay Hian

R e t a i l M a r k e t M o n i t o r Monda y , 05 Ju l y 2021
w w w . u t r a d e . c o m . s g 7
S I N G A P O R E
ESSENTIALS • Beijing Easpring (300014 SZ/BUY/Target price: Rmb73.00): On 22 Apr 21, Easpring
announced its private placement plan to raise Rmb4.65b to expand its production capacity in Changzhouy (annual capacity of 50,000 tonnes for NCA/NCM811 cathode) and Jiangsu (annual capacity of 20,000 tonnes for 3C battery cathode). The private placement is still subject to the regulator’s approval but the company expects its annual cathode production capacity to hit 109,000 tonnes by end-25 from 44,000 tonnes by end-21 and expects these projects to contribute a total net profit of Rmb500m after commencing production.
• Easpring’s target price set at Rmb73.00, is based on 42x 2022F PE. Maintain BUY. With the accelerating shipment increase in 2H21 and beyond backed by new capacity to come on-stream, we expect Easpring earnings to continue to see 20-30% yoy growth for the next three years. The stock is currently trading at about 30x 2022F PE, which we believe is attractive compared with its peers.
EASPRING’S EARNINGS FORECAST CHANGE ----------------- Old ----------------- ----------------- New ----------------- ----------------- chg% -----------------
Rmb m 2021F 2022F 2023F 2021F 2022F 2023F 2021F 2022F 2023F Rev 5,742 6,537 7,888 5,742 7,265 8,535 0.0% 11.1% 8.2% NI 582 683 820 616 790 916 5.7% 15.6% 11.8% EPS (cent) 128 151 180.77 136 174 202 5.7% 15.6% 11.8%
Source: UOB Kay Hian
• Yunnan Energy New Material (002812 CH/BUY/Target price: Rmb270.00). On 23 Jun 21, the company (known as Enjie) announced plans to acquire the minority interest (4.78%) of Shanghai Enjie for a total of Rmb2.34b (cash of Rmb800m and private placement of Rmb1.5b), after which Shanghai Enjie will become a wholly-owned subsidiary of the listco.
• On 30 Jun 21, Enjie posted its 1H21 preliminary result with net profit estimated to increase 211-239%yoy to Rmb1.0b-1.09b, indicating 2Q21 net profit of Rmb0.57b-0.66b (up 210-260%yoy, 31-52%qoq).The 2Q21 result was slightly above our expectation, mainly driven by: a) the production increase of wet-processed separators with a new capacity ramp-up, and b) employee bonuses and other expenses were reflected in 1Q21. Based on recent channel checks, we estimate that the capacity ramp-up is on track with the utilisation rate at a high level on rising demand from both domestic and overseas clients in 1H21. By end-21 it is estimated that base film output will hit about 5b sqm ( +about 50%yoy) and the proportion of coated separators will see a steady increase.
• We raise Enjie’s earnings forecasts by 19%/54% for 2021/22, mainly due to: a) higher sales volumes, and b) slightly higher margin forecasts. We raise our target price to Rmb270 (from Rmb190) on a higher earnings forecast, which is derived from 65x 2022F PE. Maintain BUY. As one of the key beneficiaries on the global EV battery market boom, we believe Enjie will maintain its market-leading position by enhancing its connections with domestic and overseas battery/EV markers for the next 3-5 years.
ENJIE’S EARNINGS FORECAST CHANGE Rmb m ----------------- Old ----------------- ----------------- New ----------------- ---------------- Chg% ----------------
2021F 2022F 2023F 2021F 2022F 2023F 2021F 2022F 2023F Revenue 5,996 7,590 8,647 6,947 10,694 12,047 16% 41% 39% NI 1,868 2,506 2,769 2,228 3,868 4,274 19% 54% 54% EPS (fen) 211 283 312 251 436 482 19% 54% 54%
Source: UOB Kay Hian
• Guangzhou Tinci Materials Technology (002709 CH/BUY/Target price: Rmb130.00). On 17 Jun 21, Tinci announced its capacity expansion plan of 150,000 tonnes of liquid LIPF6, 300,000 tonnes of Iron Phosphate (FePO4) and 60,000 tonnes of HFSI with a total investment of Rmb1.56b. These projects are expected to complete construction within 15-18 months and the annual net profit contribution is estimated at Rmb802m after commencing production.
• We like Tinci amid a rising raw material cost environment given: a) its high self-sufficiency

R e t a i l M a r k e t M o n i t o r Monda y , 05 Ju l y 2021
w w w . u t r a d e . c o m . s g 8
S I N G A P O R E
of LIPF6, b) better cost control from liquid LIPF6 production technology, and c) leading position in advanced electrolyte additives and lithium salt products. We expect the company to deliver consensus-beating results amid the continuous price hikes of LIPF6 due to tight supply in the near term. For the longer term, the company targets to reach 35-40% of global market share in the electrolyte market, from its current market share of 27-28%. Given its leading position in the global electrolyte market with a solid production expansion plan for the next five years, we expect Tinci to be one of the key beneficiaries among LIB materials players globally.
• We raise Tinci’s earnings forecasts by 34%/37% for 2021/22, mainly to factor in: a) a higher ASP forecast for electrolytes, and b) higher sales volumes forecast for 2H21 and 2022. Our new target price of Rmb130 (from Rmb88) is derived from 43x 2022F PE. Maintain BUY.
TINCI’S EARNINGS FORECAST CHANGE Rmbm ----------------- Old ----------------- ----------------- New ----------------- ---------------- Chg% ----------------
2021F 2022F 2023F 2021F 2022F 2023F 2021F 2022F 2023F Rev 6,930 9,853 13,336 9,325 13,446 18,365 35% 36% 38% NI 1,358 1,868 2,385 1,819 2,554 3,348 34% 37% 40% EPS (fen) 146.24 201.17 256.93 195.91 275.06 360.67 34% 37% 40%
Source: UOB Kay Hian
• Maintain OVERWEIGHT on China EV battery materials sector, buy leaders. We believe 3Q21 is a good time to accumulate good LIB materials companies, despite the significant share price rally in 2Q21, as we expect: a) leading names to deliver strong 1H21 results, and b) earnings growth to continue in 2H21 with shipments to accelerate in the traditional demand peak season in 4Q21. We also expect earnings forecasts to be adjusted up across leading LIB material names for 2021/22, after the 1H21results, with the new capacity ramp-ups, which can expect to absorb the current rich valuations. We re-iterate our positive view on key battery materials demand in the mid-to-long run. We expect ternary cathodes/anodes/separators/electrolytes to see a five-year volume-based demand CAGR of 36%/29%/28%/29% respectively, based on our estimates.
• Still prefer global leading players with deep-rooted ties to top battery makers/OEMs and with overseas market share gains potential. We believe the key factors that would help EV LIB material producers maintain their competitive edge and expand market share would be: a) strengthening ties with top battery makers/OEMs, and b) securing overseas market share gains. We expect better earnings growth as well as earnings visibility for leaders in the EV battery materials industry, which are those that serve top-tier suppliers to downstream battery makers, and particularly those with overseas exposure.
SUPPLY CHAIN OF KEY BATTERY MAKERS
Cathode Anode Separator Electrolyte Copper foil Structural
component
Tesla Beijing Easpring Ningbo Ronbay
CNGR Enjie Tinci Materials
Nuode Investment Kedali
SK Beijing Easpring Zhongke Electric
Mitsubishi Chemical Self-
supplied Self-supplied
LG
Shanshan Beijing Easpring
GEM Bamo Tech
CNGR
Shanshan BTR
Putailai
Senior Enjie
Capchem Tinci MaterialsJiangsu Guotai
Kedali
Panasonic Xiamen Tungstun
Umicore BTR Enjie Capchem
Jiangsu Guotai Source: UOB Kay Hian

R e t a i l M a r k e t M o n i t o r Monda y , 05 Ju l y 2021
w w w . u t r a d e . c o m . s g 9
S I N G A P O R E
FROM THE REGIONAL MORNING NOTES.. .
REITs & Landlords – Hong Kong Consumption Vouchers And Travel Resumption To Support Retail Rebound; Upgrade to OVERWEIGHT Hong Kong retail sales increased 10.5% yoy in May 21, above expectations of 6.9%. We expect the rollout of the government’s evoucher support scheme to boost retail sales in the short term. Meanwhile, we observe that vaccination rates have been increasing meaningfully and this could lead to relaxation of social distancing measures and travel restrictions in the next six months. Upgrade to OVERWEIGHT as we expect retail rents to rebound in 2H21.
WHAT’S NEW • Retail sales increased 10.5% yoy in May 21. According to the Census and Statistics
Department, the value of total retail sales increased by approximately 10.5% yoy in May 2021, and 8.9% in 5M21. In particular, sales of jewellery, watches and clocks, and valuable gifts rose 54.8% yoy; wearing apparel (12.6% yoy); food, alcoholic drinks and tobacco (0.5% yoy); medicines and cosmetics (19.3% yoy); footwear, allied products and other clothing accessories (up 9.4% yoy); Chinese drugs and herbs (up 18.8%).
• Hong Kong retail sales grew at a slower pace of 10.5% in May 21 vs the 12.1% growth in Apr 21 but nevertheless beat consensus estimates of 6.9% yoy growth. Compared with May 19, retail sales of HK$29.6b in 2021 is still 26% lower.
• Government’s evoucher support scheme could boost 2021 total retail sales by HK$36b. Hong Kong permanent residents and recent migrants from mainland China can start applying for the government’s COVID-19-related HK$5,000 consumption voucher scheme on 4 Jul 21 and start receiving the money as early as 1 Aug 21. The vouchers can be used for public transport, at restaurants, in retail stores, consumption service outlets, and locally registered online stores. It was estimated by the government that the HK$36b scheme would help boost the economy by 0.7%. HK$36b also represents around 11.0% of 2020 Hong Kong retail sales of HK$326.45b, which suggests the impact could be significant. The vouchers will be given in 2-3 batches with HK$1,000-3,000 each time and within 3-4 months, and we expect low- to mid-end retail (general retail and F&B/supermarkets) to benefit more from the scheme.
• Vaccination rates picking up fast as vaccination centres capacity usage more than doubled. Hong Kong’s rate of vaccination was relatively slow early this year due to various safety concerns; we estimate the vaccination stations were running at only 20-50% capacity. 28 May was the turning point as the rate of vaccination seemed to rebound significantly. This was when many different incentives for vaccinations were rolled out, including the eye-grabbing lottery involving a HK$10.8m apartment and others such as vaccination leave. In order to join this series of lottery, injection of either dose of COVID-19 vaccines was required. These incentives have been effective in boosting the vaccination rates as we note the number of Hong Kong residents receiving the vaccines skyrocketed almost instantly. Most recently, on 2 Jul 21, the number of doses administered (both dose 1 and dose 2) in a day hit a record high of 70,116, which is considerably higher than the capacity of 50,000 as guided by Hong Kong government officials based on the number of Community Vaccination Centres in operation.
PEER COMPARISON Price Target Upside/ Market Curr Fwd Curr Fwd Book Price/ Fwd
Company Ticker Rec 2-Jul-21 Price (Downside) Cap. PE PE Yield Yield NAV ps Book ROE Gearing(HK$) (HK$) to TP (%) (US$m) (x) (x) (%) (%) (HK$) (x) (%) (%)
Champion REIT 2778 HK HOLD 4.39 4.66 6.2 3,347 16.4 16.6 5.5 5.7 8.61 0.5 2.1 29.0 Fortune REIT 778 HK BUY 8.39 8.80 4.9 2,120 15.7 15.6 5.7 5.8 14.62 0.6 2.8 30.0 Link REIT 823 HK BUY 74.65 85.10 14.0 20,011 24.0 22.3 4.0 4.2 76.24 1.0 3.7 22.8 Wharf REIC 1997 HK BUY 44.4 52.37 18.0 17,358 15.9 16.0 3.7 4.3 67.38 0.7 3.8 24.8 Source: Bloomberg, UOB Kay Hian

R e t a i l M a r k e t M o n i t o r Monda y , 05 Ju l y 2021
w w w . u t r a d e . c o m . s g 10
S I N G A P O R E
% OF POPULATION THAT HAVE RECEIVED 1ST/2ND VACCINATION DOSE
Source: HKSAR, UOB Kay Hian
• We estimate herd immunity could be achieved by Nov 21. We observed a significant 97% increase in the number of doses administered per day after 28 May 21. The average number of doses administered daily for the 1st dose increased from 14,400 per day (during 1-28 May 21) to 28,400 per day (during 29 May to 4 Jul 21). As of 4 Jul 21, the vaccination rate in Hong Kong was only 21%, but we expect this to pick up as we see 2nd dose vaccination rates picking up following the trend for the 1st dose (with an estimated 24-day lag time). Assuming that the 2nd dose injection rate follows the trend for the 1st dose and keeps at a high of around 28,000 per day, we estimate Hong Kong could reach herd immunity (70% of population vaccinated) in 4.3 months or by mid-Nov 21.
• More confidence for travel bubbles to be implemented. Given higher vaccination rates and supportive data on vaccine protection against variant strains, we believe that travel bubbles are more likely to be implemented successfully now. Restoration of travel may further incentivise vaccination if it is a requisite for travel. Travel bubbles expected to be formed and become effective in the near term include those between Hong Kong and Singapore, Macau or the Mainland. Increased tourism will help retail sales see meaningful improvement as tourist spending used to account for around 20% of total retail sales in Hong Kong.
ACTION • Upgrade sector to OVERWEIGHT; retail rents likely to have bottomed. We upgrade
our sector rating from MARKET WEIGHT to OVERWEIGHT as we expect: a) retail sales in Hong Kong to record a 10% yoy growth this year, and b) a meaningful improvement in consumer sentiment on the back of relaxed social distancing measure and travel restrictions over the next 6-12 months. This is due to increased vaccination rates in Hong Kong and globally. The government’s evoucher support scheme is likely to support retail sales in the short run as well. Meanwhile, more landlords are guiding for a bottom in retail rents and see no need to offer rental concessions to tenants. We remain cautious on the office sector as rents have yet to stabilise, although we recognise that leasing activity is picking up as rents in core areas like Central have fallen to a more reasonable level, attracting more corporates back to such areas. Our top picks are Link REIT and Wharf REIC.
• Maintain BUY on Link REIT. Link REIT expects a significant improvement in Hong Kong rental reversions starting 2022 and its recent acquisitions will further add to rental growth from new rental contributions. We have a target price to HK$85.10, based on our required rate of return of 6.1% and terminal growth rate of 2.0%.
• Upgrade Wharf REIC from HOLD to BUY. We expect Wharf REIC to be the largest beneficiary of a travel resumption given its flagship malls are a hotspot for tourists. We upgrade our target to HK$52.37 based on a 3.6% FY22 dividend yield which implies a target 0.75x FY22F P/B ratio.

R e t a i l M a r k e t M o n i t o r Monda y , 05 Ju l y 2021
w w w . u t r a d e . c o m . s g 11
S I N G A P O R E
Disclosures/Disclaimers
This report is prepared by UOB Kay Hian Private Limited (“UOBKH”), which is a holder of a capital markets services licence and an exempt financial adviser in Singapore. This report is provided for information only and is not an offer or a solicitation to deal in securities or to enter into any legal relations, nor an advice or a recommendation with respect to such securities. This report is prepared for general circulation. It does not have regard to the specific investment objectives, financial situation and the particular needs of any recipient hereof. Advice should be sought from a financial adviser regarding the suitability of the investment product, taking into account the specific investment objectives, financial situation or particular needs of any person in receipt of the recommendation, before the person makes a commitment to purchase the investment product. This report is confidential. This report may not be published, circulated, reproduced or distributed in whole or in part by any recipient of this report to any other person without the prior written consent of UOBKH. This report is not directed to or intended for distribution to or use by any person or any entity who is a citizen or resident of or located in any locality, state, country or any other jurisdiction as UOBKH may determine in its absolute discretion, where the distribution, publication, availability or use of this report would be contrary to applicable law or would subject UOBKH and its connected persons (as defined in the Financial Advisers Act, Chapter 110 of Singapore) to any registration, licensing or other requirements within such jurisdiction. The information or views in the report (“Information”) has been obtained or derived from sources believed by UOBKH to be reliable. However, UOBKH makes no representation as to the accuracy or completeness of such sources or the Information and UOBKH accepts no liability whatsoever for any loss or damage arising from the use of or reliance on the Information. UOBKH and its connected persons may have issued other reports expressing views different from the Information and all views expressed in all reports of UOBKH and its connected persons are subject to change without notice. UOBKH reserves the right to act upon or use the Information at any time, including before its publication herein. Except as otherwise indicated below, (1) UOBKH, its connected persons and its officers, employees and representatives may, to the extent permitted by law, transact with, perform or provide broking, underwriting, corporate finance-related or other services for or solicit business from, the subject corporation(s) referred to in this report; (2) UOBKH, its connected persons and its officers, employees and representatives may also, to the extent permitted by law, transact with, perform or provide broking or other services for or solicit business from, other persons in respect of dealings in the securities referred to in this report or other investments related thereto; (3) the officers, employees and representatives of UOBKH may also serve on the board of directors or in trustee positions with the subject corporation(s) referred to in this report. (All of the foregoing is hereafter referred to as the “Subject Business”); and (4) UOBKH may otherwise have an interest (including a proprietary interest) in the subject corporation(s) referred to in this report. As of the date of this report, no analyst responsible for any of the content in this report has any proprietary position or material interest in the securities of the corporation(s) which are referred to in the content they respectively author or are otherwise responsible for. IMPORTANT DISCLOSURES FOR U.S. PERSONS This research report was prepared by UOBKH, a company authorized, as noted above, to engage in securities activities in Singapore. UOBKH is not a registered broker-dealer in the United States and, therefore, is not subject to U.S. rules regarding the preparation of research reports and the independence of research analysts. This research report is provided for distribution by UOBKH (whether directly or through its US registered broker dealer affiliate named below) to “major U.S. institutional investors” in reliance on the exemption from registration provided by Rule 15a-6 of the U.S. Securities Exchange Act of 1934, as amended (the “Exchange Act”). All US persons that receive this document by way of distribution from or which they regard as being from UOBKH by their acceptance thereof represent and agree that they are a major institutional investor and understand the risks involved in executing transactions in securities. Any U.S. recipient of this research report wishing to effect any transaction to buy or sell securities or related financial instruments based on the information provided in this research report should do so only through UOB Kay Hian (U.S.) Inc (“UOBKHUS”), a registered broker-dealer in the United States. Under no circumstances should any recipient of this research report effect any transaction to buy or sell securities or related financial instruments through UOBKH. UOBKHUS accepts responsibility for the contents of this research report, subject to the terms set out below, to the extent that it is delivered to and intended to be received by a U.S. person other than a major U.S. institutional investor. The analyst whose name appears in this research report is not registered or qualified as a research analyst with the Financial Industry Regulatory Authority (“FINRA”) and may not be an associated person of UOBKHUS and, therefore, may not be subject to applicable restrictions under FINRA Rules on communications with a subject company, public appearances and trading securities held by a research analyst account.
R e t a i l M a r k e t M o n i t o r Monda y , 05 Ju l y 2021
w w w . u t r a d e . c o m . s g 12
S I N G A P O R E
Analyst Certification/Regulation AC Each research analyst of UOBKH who produced this report hereby certifies that (1) the views expressed in this report accurately reflect his/her personal views about all of the subject corporation(s) and securities in this report; (2) the report was produced independently by him/her; (3) he/she does not carry out, whether for himself/herself or on behalf of UOBKH or any other person, any of the Subject Business involving any of the subject corporation(s) or securities referred to in this report; and (4) he/she has not received and will not receive any compensation that is directly or indirectly related or linked to the recommendations or views expressed in this report or to any sales, trading, dealing or corporate finance advisory services or transaction in respect of the securities in this report. However, the compensation received by each such research analyst is based upon various factors, including UOBKH’s total revenues, a portion of which are generated from UOBKH’s business of dealing in securities. Reports are distributed in the respective countries by the respective entities and are subject to the additional restrictions listed in the following table. General This report is not intended for distribution, publication to or use by any person or entity who is a citizen or resident of or
located in any country or jurisdiction where the distribution, publication or use of this report would be contrary to applicable law or regulation.
Hong Kong This report is distributed in Hong Kong by UOB Kay Hian (Hong Kong) Limited ("UOBKHHK"), which is regulated by the Securities and Futures Commission of Hong Kong. Neither the analyst(s) preparing this report nor his associate, has trading and financial interest and relevant relationship specified under Para. 16.4 of Code of Conduct in the listed corporation covered in this report. UOBKHHK does not have financial interests and business relationship specified under Para. 16.5 of Code of Conduct with the listed corporation covered in this report. Where the report is distributed in Hong Kong and contains research analyses or reports from a foreign research house, please note: (i) recipients of the analyses or reports are to contact UOBKHHK (and not the relevant foreign research house) in Hong Kong in respect of any matters arising from, or in connection with, the analysis or report; and (ii) to the extent that the analyses or reports are delivered to and intended to be received by any person in Hong Kong who is not a professional investor, or institutional investor, UOBKHHK accepts legal responsibility for the contents of the analyses or reports only to the extent required by law.
Indonesia This report is distributed in Indonesia by PT UOB Kay Hian Sekuritas, which is regulated by Financial Services Authority of Indonesia (“OJK”). Where the report is distributed in Indonesia and contains research analyses or reports from a foreign research house, please note recipients of the analyses or reports are to contact PT UOBKH (and not the relevant foreign research house) in Indonesia in respect of any matters arising from, or in connection with, the analysis or report.
Malaysia Where the report is distributed in Malaysia and contains research analyses or reports from a foreign research house, the recipients of the analyses or reports are to contact UOBKHM (and not the relevant foreign research house) in Malaysia, at +603-21471988, in respect of any matters arising from, or in connection with, the analysis or report as UOBKHM is the registered person under CMSA to distribute any research analyses in Malaysia.
Singapore This report is distributed in Singapore by UOB Kay Hian Private Limited ("UOBKH"), which is a holder of a capital markets services licence and an exempt financial adviser regulated by the Monetary Authority of Singapore.Where the report is distributed in Singapore and contains research analyses or reports from a foreign research house, please note: (i) recipients of the analyses or reports are to contact UOBKH (and not the relevant foreign research house) in Singapore in respect of any matters arising from, or in connection with, the analysis or report; and (ii) to the extent that the analyses or reports are delivered to and intended to be received by any person in Singapore who is not an accredited investor, expert investor or institutional investor, UOBKH accepts legal responsibility for the contents of the analyses or reports only to the extent required by law.
Thailand This report is distributed in Thailand by UOB Kay Hian Securities (Thailand) Public Company Limited, which is regulated by the Securities and Exchange Commission of Thailand.
United Kingdom
This report is being distributed in the UK by UOB Kay Hian (U.K.) Limited, which is an authorised person in the meaning of the Financial Services and Markets Act and is regulated by The Financial Conduct Authority. Research distributed in the UK is intended only for institutional clients.
United States of America (‘U.S.’)
This report cannot be distributed into the U.S. or to any U.S. person or entity except in compliance with applicable U.S. laws and regulations. It is being distributed in the U.S. by UOB Kay Hian (US) Inc, which accepts responsibility for its contents. Any U.S. person or entity receiving this report and wishing to effect transactions in any securities referred to in the report should contact UOB Kay Hian (US) Inc. directly.
Copyright 2021, UOB Kay Hian Pte Ltd. All rights reserved. http://research.uobkayhian.com RCB Regn. No. 197000447W