RETAIL-LOAD PARTICIPATION IN COMPETITIVE ... LIST OF ACRONYMS AMR Automated-meter reading CBL...
74
RETAIL-LOAD PARTICIPATION IN COMPETITIVE WHOLESALE ELECTRICITY MARKETS ERIC HIRST and BRENDAN KIRBY Consulting in Electric-Industry Restructuring Oak Ridge, Tennessee 37830 December 2000 Prepared for Edison Electric Institute Washington, DC Russell Tucker, Project Manager and Project for Sustainable FERC Energy Policy Alexandria, VA Terry Black, Project Manager
Transcript of RETAIL-LOAD PARTICIPATION IN COMPETITIVE ... LIST OF ACRONYMS AMR Automated-meter reading CBL...

RETAIL-LOAD PARTICIPATION INCOMPETITIVE WHOLESALE ELECTRICITY MARKETS
ERIC HIRST and BRENDAN KIRBYConsulting in Electric-Industry Restructuring
Oak Ridge, Tennessee 37830
December 2000
Prepared forEdison Electric Institute
Washington, DCRussell Tucker, Project Manager
and
Project for Sustainable FERC Energy PolicyAlexandria, VA
Terry Black, Project Manager

ii

iii
CONTENTS
Page
SUMMARY . . . . . . . . . . . . . . . . . . . . . . . . . . . . . . . . . . . . . . . . . . . . . . . . . . . . . . . . . . . . . . v
LIST OF ACRONYMS. . . . . . . . . . . . . . . . . . . . . . . . . . . . . . . . . . . . . . . . . . . . . . . . . . . . vii
1. INTRODUCTION. . . . . . . . . . . . . . . . . . . . . . . . . . . . . . . . . . . . . . . . . . . . . . . . . . . . . . . 1
2.BASIC CONCEPTS . . . . . . . . . . . . . . . . . . . . . . . . . . . . . . . . . . . . . . . . . . . . . . . . . . . . . . 5SUPPLY, DEMAND, AND PRICE ELASTICITY. . . . . . . . . . . . . . . . . . . . . . . . . 5VOLATILITY OF ELECTRICITY PRICES . . . . . . . . . . . . . . . . . . . . . . . . . . . . . . 7TWO COMPONENTS OF ELECTRICITY PRICES. . . . . . . . . . . . . . . . . . . . . . . 10
3. DYNAMIC-PRICING AND LOAD-REDUCTION PROGRAMS. . . . . . . . . . . . . . . . 13PRICING AND PROGRAM TYPES. . . . . . . . . . . . . . . . . . . . . . . . . . . . . . . . . . . 13PRICING AND PROGRAM EXAMPLES. . . . . . . . . . . . . . . . . . . . . . . . . . . . . . . 17
4. CUSTOMER CHARACTERISTICS . . . . . . . . . . . . . . . . . . . . . . . . . . . . . . . . . . . . . . . 35
5. METERING, COMMUNICATIONS, AND COMPUTING. . . . . . . . . . . . . . . . . . . . . 41METERS . . . . . . . . . . . . . . . . . . . . . . . . . . . . . . . . . . . . . . . . . . . . . . . . . . . . . . . . . 43COMMUNICATION SYSTEMS . . . . . . . . . . . . . . . . . . . . . . . . . . . . . . . . . . . . . . 44ANALYSIS, DECISION, AND RESPONSE SYSTEMS. . . . . . . . . . . . . . . . . . . 46
6. PROGRAM AND PRICING PROVIDERS. . . . . . . . . . . . . . . . . . . . . . . . . . . . . . . . . . 49REGIONAL TRANSMISSION ORGANIZATIONS . . . . . . . . . . . . . . . . . . . . . . . 49LOAD-SERVING ENTITIES . . . . . . . . . . . . . . . . . . . . . . . . . . . . . . . . . . . . . . . . . 51DISTRIBUTION UTILITIES . . . . . . . . . . . . . . . . . . . . . . . . . . . . . . . . . . . . . . . . . 52FEDERAL ENERGY REGULATORY COMMISSION . . . . . . . . . . . . . . . . . . . . 52PUBLIC UTILITY COMMISSIONS . . . . . . . . . . . . . . . . . . . . . . . . . . . . . . . . . . . 53
7. BARRIERS . . . . . . . . . . . . . . . . . . . . . . . . . . . . . . . . . . . . . . . . . . . . . . . . . . . . . . . . . . . 55REGULATORY OBSTACLES . . . . . . . . . . . . . . . . . . . . . . . . . . . . . . . . . . . . . . . . 55TECHNICAL OBSTACLES . . . . . . . . . . . . . . . . . . . . . . . . . . . . . . . . . . . . . . . . . . 57INSTITUTIONAL OBSTACLES . . . . . . . . . . . . . . . . . . . . . . . . . . . . . . . . . . . . . . 58

iv
8. CONCLUSIONS . . . . . . . . . . . . . . . . . . . . . . . . . . . . . . . . . . . . . . . . . . . . . . . . . . . . . . . 59
ACKNOWLEDGMENTS . . . . . . . . . . . . . . . . . . . . . . . . . . . . . . . . . . . . . . . . . . . . . . . . . . 61
REFERENCES . . . . . . . . . . . . . . . . . . . . . . . . . . . . . . . . . . . . . . . . . . . . . . . . . . . . . . . . . . 63

v
SUMMARY
Competitive wholesale markets today resemble the sound of one hand clapping. Theyare often inefficient and not fully competitive, in part because retail-customer loads do notparticipate in these markets.
Electricity costs vary substantially from hour to hour, often by a factor of ten within asingle day. Because most customers buy electricity as they always have—under time-invariantprices that are set months or years ahead of actual use—consumers are fully insulated from thevolatility of wholesale electricity markets.
Retail electricity prices reflect two components that should be priced separately: � the electricity commodity and � the insurance premium that protects customers from price variations.
Customers should have the opportunity to see electricity prices that vary from hour tohour, reflecting wholesale-market price variations. Permitting customers to face the underlyingvariability in electricity costs can improve economic efficiency, increase reliability, and reducethe environmental impacts of electricity production. Economic efficiency requires a range ofcustomer choices. Offering customers a variety of pricing options is an essential component ofcompetitive markets and a key to improving customer well-being. Customers who choose toface the volatility of electricity prices can lower their electricity bills in two ways. First, theyprovide their own insurance. Second, they can modify electricity usage in response to changingprices, increasing usage during low-price periods and cutting usage during high-price periods.
Retail customers who modify their usage in response to price volatility help lower thesize of price spikes. This demand-induced reduction in prices is a powerful way to disciplinethe market power that some generators would otherwise have when demand is high andsupplies tight. And these price-spike reductions benefit all retail customers, not just those whomodify their consumption in response to changing prices; see the figure on the following page.
Customers who face real-time prices and respond to those prices provide valuablereliability services to the local control area. Specifically, load reductions at times of high prices(generally caused by tight supplies) provide the same reliability benefits that the same amountof additional generating capacity would.
Finally, strategically timed demand reductions decrease the need to build new generationand transmission facilities. When demand responds to price, system load factors improve,increasing the utilization of existing generation and reducing the need to build new facilities.

vi
2016
0
100
200
300
400
500
600
700
0 5 10 15 20 25 30
SUPPLY OR DEMAND (GW)
PR
ICE
($/
MW
h)
Supply
Inelastic Demand
Price-Responsive Demand, e = -0.03
Q=29P=550
Q=27.5P=250
Hypothetical wholesale supply and demand curves.The solid vertical line represents demand that isinsensitive to price; the dashed line representsdemand that varies with price. For this case,consumer response to price reduces demand by5% and cuts the price by 55%. This price-spikereduction benefits all customers, not just thosewith price-responsive demand.
Deferring such construction may improveenvironmental quality. Cutting demand attimes of high prices may also encouragethe retirement of aging and inefficientgenerating units.
Ultimately, competitive electricitymarkets will feature two kinds of demand-response programs. First, some customerswill choose to face electricity prices thatvary from hour to hour. Typically, theseprices will be established day-ahead in themarkets run by regional transmissionorganizations, such as those now operatingin California, New York, and the mid-Atlantic region. Second, some customerswill select fixed prices, as they have in thepast, but voluntarily cut demand duringperiods of very high prices. In this secondoption, the customer and the electricitysupplier will share the savings associated with such load reductions.
Although the potential benefits of dynamic pricing are large, so too are the barriers towidespread adoption. State legislatures and regulatory commissions have inadvertently blockedcustomer access to wholesale markets in their efforts to protect retail customers, especiallyresidential consumers, from the vagaries of competition. State regulators need to rethink theirdecisions on standard-offer rates that are set so low that new suppliers are unable to competeand customers have no incentive to look elsewhere for a better deal. Although regulators shouldnot force consumers to face dynamic pricing, neither should they make it difficult for them todo so. Ultimately, consumers will have to pay for prices that are set too low today.
Metering, communications, and computing technologies are needed to support dynamicpricing and voluntary-load-reduction programs. The cost and bother of designing and installingthis infrastructure represents another important barrier to these programs. In addition to the costof installing and operating this equipment, the unfamiliarity with the bewildering array ofchoices contributes to this barrier. Fortunately, these technology barriers will fall as moredynamic-pricing programs are implemented.
In summary, the convergence of retail competition, wholesale competition, andimproved technologies should greatly expand the type and magnitude of price-responsivedemand. Permitting and encouraging retail customers to respond to dynamic prices willimprove economic efficiency, discipline market power, improve reliability, and reduce the needto build new generation and transmission facilities.

vii
LIST OF ACRONYMS
AMR Automated-meter reading
CBL Customer baseline load
EMS Energy-management system
FERC Federal Energy Regulatory Commission
ISO Independent system operator
LSE Load-serving entity
PGE Portland General Electric
PJM Pennsylvania-New Jersey-Maryland Interconnection, LLC
PUC Public utility commission
PX Power exchange
RTO Regional transmission organization
RTP Real-time pricing
TOU Time-of-use

CHAPTER 1
INTRODUCTION
Competitive electricity markets in the United States are under siege. The substantialsummer 2000 increases in electricity prices in California, price spikes in other parts of thecountry, concerns about generator market power in all four operating bulk-power markets [NewEngland, New York, mid-Atlantic (the PJM Interconnection), and California], and manyreliability near-misses suggest that electricity competition is not yet working well. Many factorsaccount for these problems, including insufficient construction of new generation andtransmission facilities during the past several years, flaws in the design and operation of thesenew markets, inexperience on the part of many market participants, and the uneven patterns andtrends in electric-industry restructuring across the country.
Recently, one potential solution to these problems has received increasingattention—demand-side participation in bulk-power markets. We now recognize, perhapsbelatedly, that electricity markets can be competitive and efficient only when both the supplyand demand sides participate. As the Federal Energy Regulatory Commission (FERC 2000)recently noted, “… lack of price responsive demand is a major impediment to thecompetitiveness of electricity markets.” The California Public Utilities Commission (cited inSan Diego Gas & Electric 2000) was more specific:
The revelation of the real-time price of electricity coupled with a rate alternativethat allows the customer to respond intelligently will produce savings for anycustomer who is able to shift demand from peak to off-peak hours. The potentialthat many customers will respond to this opportunity to take significant controlover the cost of their consumption will produce a collective benefit, in thatdemand will be redistributed away from the current peaks. Future generationdemands will be forestalled even as existing investments in generation are mademore productive. The result is a triple win, embracing the individual consumerof any class who is able to reduce costs by shifting load, the society at largewhich defers the demand for new generation, and investors in existing plant andequipment who see it put to more productive use.
Because the vast majority of U.S. electricity consumers are fully insulated from the pricevariability of wholesale markets, those markets do not—and cannot be expected to—work asintended. Almost all retail customers continue to pay for electricity at a fixed price determinedlong before consumption occurs.
Permitting (but not requiring) retail customers to see dynamically varying electricityprices is essential because electricity prices vary dramatically from hour to hour, between

*All four of the operational independent system operators (ISOs) in the United States experiencemarket-power problems when demand is high (typically during the summer). As a consequence, the fourISOs impose price or bid caps on the participating generators. A robust demand side that participated in bulk-power markets might obviate the need for such caps.
#A large generator that provides reliability services (e.g., 100 MW of 10-minute reserves) that tripsoffline provides no reliability benefit. It is very unlikely that hundreds or thousands of customers who,together, provide 100 MW of reserves would all fail to respond at the same time.
2
weekdays and weekends, and by season. Because of this high variability in wholesale electricitycosts and prices, the price we pay for electricity includes two components: (1) the electricitycommodity and (2) the insurance premium that protects customers from price variations. Mostconsumers and many government regulators are unaware of this second component—the riskpremium—associated with traditional electricity pricing.
Why should consumers, regional transmission organizations (RTOs), governmentregulators, and others care whether consumers are permitted to face dynamic electricity prices?The answers fall into three categories: economic efficiency, reliability, and environmentalquality. With respect to economic efficiency, the essence of competition is to expand the rangeof customer choices. Offering customers a variety of pricing options is an essential componentof competitive markets and a key to improving customer well-being. Customers who chooseto face some or all of the volatility of electricity prices can lower their electricity bills in twoways: (1) by self-insuring and (2) by shifting electricity use away from high-price periods tolow-price periods. Retail customers who modify their usage in response to prices reduce pricevolatility by lowering the magnitudes of price spikes. This demand-induced reduction in pricespikes is a powerful way to discipline the market power that some generators would otherwisehave during periods of peak demand and constrained supply.* And these reductions in pricespikes benefit all retail customers, not just those who modify their consumption in response tochanging prices.
Customers who choose to face real-time prices and respond to those prices providevaluable reliability services to the local control area. The North American Electric ReliabilityCouncil (2000) noted that to “… improve the reliability of electric supply, some or all electriccustomers will have to be exposed to market prices … .” Specifically, load reductions at timesof high prices (generally caused by tight supplies) provide the same reliability benefits that thesame amount of additional generating capacity would. From the reliability perspective, areduction in demand is equivalent to an increase in generation. Indeed, to the extent the demandreduction is spread among many (perhaps thousands) of customers, diversity enhances thereliability benefits of load reductions.# On the other hand, nondispatchable loads may provideless certainty to system operators than generators under their direct control.
Finally, strategically timed demand reductions decrease the need to build new generationand transmission facilities. When demand responds to price, system load factors improve,

3
increasing the utilization of existing generation and reducing the need to build new facilities.Higher asset utilization should lower overall electricity costs. Avoiding, or at least deferring,such construction improves environmental quality. Cutting demand at times of high prices mayalso encourage retirement of aging and inefficient generating units.
The preceding paragraphs suggest that customer participation in wholesale marketsbenefits retail consumers, system operators, the environment, and society at large. Thesebenefits can be realized in both competitive and regulated electricity markets. These programscan be implemented by regulated utilities absent retail competition if and only if a visible spotprice for wholesale electricity exists. As discussed in the following chapter, if even a smallfraction of retail load responds only slightly to time-varying electricity prices, the results wouldbe dramatic.
This report addresses the issues discussed above. [Two important issues not coveredhere are (1) the direct customer and supplier-marketing costs for these programs and (2) the roleof distributed generation in competitive wholesale markets.] The results are based on telephonediscussions with experts from various sectors of the electricity industry, including independentsystem operators (ISOs), electric utilities, load-serving entities (LSEs), communication-systemproviders, energy-service companies, regulators, and environmental groups. We also drew onthe relevant literature, including ISO filings with FERC, utility-program descriptions, andpublished articles and reports.
The remainder of this report is organized as follows. Chapter 2 presents key conceptsrelated to price elasticity, the inherent volatility of electricity costs, and the commodity andinsurance components of electricity prices. Chapter 3 discusses the various kinds of demand-side pricing programs that apply in competitive markets, and gives examples of these programs.Chapter 4 discusses the differences among customers and customer types that might affect theirinterest in, and ability to respond to, dynamic prices. Chapter 5 discusses the enabling metering,communications, computing, and control technologies. Chapter 6 discusses the potential rolesof the providers of these pricing and program options. Chapter 7 discusses the key technical andregulatory barriers to widespread adoption of these options. Finally, Chapter 8 summarizes theresults of this study and suggests future actions.

4

5
CHAPTER 2
BASIC CONCEPTS
SUPPLY, DEMAND, AND PRICE ELASTICITY
Figure 1 illustrates the current disconnect between wholesale and retail markets, usingthe economists’ traditional supply-demand curves (Eakin 2000). The top graph shows a typicalsupply curve, in which increasing amounts of generating capacity are offered at higher andhigher prices. [This supply curve is based on the generator offers to the California PowerExchange (PX) in June 2000. It is similar to the supply curves seen in the three northeasternISOs.] The graph also shows consumer demand during on- and off-peak periods; both curvesare vertical, indicating consumer insensitivity to changes in electricity prices. This priceinsensitivity is a consequence of the current status of electricity restructuring in which the vastmajority of consumers, regardless of whether they have chosen another supplier, face time-invariant electricity prices. The bottom graph shows how consumers might respond to pricechanges during the same on- and off-peak periods if they faced time-varying prices; this graphalso shows the fixed price that most consumers pay for electricity.
Figure 2, using the same supply curve shown in the top of Fig. 1, illustrates the effectsof price-sensitive demand during peak periods. If consumers are insulated from time-varyingprices, the market clears at 29 GW at a price of $550/MWh. However, if some consumersduring this high-demand hour are even modestly sensitive to prices, the market clears at 27.5GW at a price of $250/MWh. In other words, a 5% reduction in peak demand reduces pricesby more than 50%. In this example, customers as a whole, not just those that respond to price,save almost $9 million an hour. In addition, such responses reduce price volatility.
The concept presented in Fig. 2 has major practical implications. On June 7, 1999,maximum demand and spot price in the PJM Interconnection (2000a) were 48,000 MW and$850/MWh. “On June 7, during the peak demand hours, an increase in supply or a decrease indemand of 500 MW would have reduced the price by about $100/MW. An increase in supplyor a decrease in demand of 1,000 MW would have reduced the price by in excess of $200/MW.An increase in supply or a decrease in demand of 2,000 MW would have reduced the price byabout $400/MW.” Thus, a 4% drop in demand could have cut the hourly price by almost 50%(PJM Interconnection 2000a). This 4% reduction could occur if, say, 20% of the retail loadfaces hourly prices and, in response to changes in these prices, cuts their demand by 20%. Thisexample demonstrates that substantial benefits can occur when even a small fraction of the loadtakes modest actions in response to time-varying prices.
6
2016
0
100
200
300
400
500
600
700
0 5 10 15 20 25 30
WHOLESALE SUPPLY OR DEMAND (GW)
PR
ICE
($/
MW
h)Supply
Offpeak Inelastic Demand
Onpeak Inelastic Demand
2016
0
100
200
300
400
500
600
700
0 5 10 15 20 25 30
RETAIL DEMAND (GW)
PR
ICE
($/
MW
h)
Retail Price
Offpeak Elastic Demand
Onpeak Elastic Demand
Fig. 1. Schematic illustration of the disconnect between wholesale and retail electricitymarkets. The top graph shows a typical wholesale supply curve and price-insensitive consumer demand during on- and off-peak periods. The bottomgraph shows how consumer demand might respond to time-varying prices aswell as the fixed price that most retail consumers face.

*The price elasticity of demand is the percentage change in the demand for the product (electricityin this case) caused by a 1% change in its price. Mathematically, the elasticity is equal to (dQ/Q)/(dP/P),where d is a small change, Q is quantity, and P is price. For example, doubling the price would cut demandby 6.7% if the price elasticity is �0.1. Although price elasticities are almost always negative, reflecting thefact that consumers use less of a product when its price increases, we report elasticities here as positivenumbers for simplicity.
7
2016
0
100
200
300
400
500
600
700
0 5 10 15 20 25 30
SUPPLY OR DEMAND (GW)
PR
ICE
($/
MW
h)
Supply
Inelastic Demand
Price-Responsive Demand, e = -0.03
Q=29P=550
Q=27.5P=250
Fig. 2. Generation-supply curve and two demand curves. The solid vertical linerepresents inelastic demand (as shown in the top of Fig. 1). The dashed slopedline represents demand with a price elasticity of about 0.03.
The effects of a nonzero price elasticity of demand* during offpeak periods (say,between 10 and 20 GW on Fig. 2), are very small. Because the supply curve is nearly horizontalat low and modest loads, the effects of consumer sensitivity to prices are small, on both demandand price. However, as shown in Fig. 2, when supplies are tight, small changes in the amountof power demanded can have dramatic effects on market-clearing prices.
VOLATILITY OF ELECTRICITY PRICES
Providing retail customers an opportunity to face time-varying electricity prices isimportant because electricity prices are volatile, perhaps more volatile than for any othercommodity. Prices are so variable for several reasons:

*Generators also have fixed costs (e.g., fixed operations and maintenance expenses, taxes,depreciation, interest payments, and return on equity). In competitive markets, these fixed costs are recoveredwhen the market price of power is above the generator’s variable cost.
8
� Generators differ substantially in their costs to produce electricity (e.g., the runningcosts for hydro and nuclear units are typically well below $10/MWh, while the cost foran old combustion turbine might be $100/MWh or more).*
� System loads vary from hour to hour (e.g., by a factor of two to three during a singleday).
� Electricity cannot easily be stored and therefore must be produced and consumed at thesame time.
� Sudden generator outages, transmission outages, extreme weather conditions, and otherevents can trigger unexpected imbalances between generation and demand; rebalancingthe electrical system can be expensive.
� Intertemporal constraints limit generator flexibility so that at certain low-load hours theprice can be zero or negative because it costs more to turn a unit off and turn it on againlater than to keep it running.
� When unconstrained demand exceeds supply, the price is set by consumer demand ata level above the running cost of the most expensive unit then online. During these few,high-load hours, generators must bid prices above their running costs to recover theirstartup and noload costs.
To illustrate the volatility in electricity prices, consider the one-week period for PJMshown in Fig. 3. Wholesale hourly prices averaged $47/MWh. This average, however,subsumes substantial volatility, as prices ranged from a low of zero on Sunday morning to ahigh of $157/MWh on Monday and Tuesday afternoons. These large hour-to-hour differencesin electricity prices provide substantial opportunities to make money by selling electricity at theright times (when prices are high rather than low) and by shifting consumption from one timeto another (from high-priced to low-priced periods).
The statistics for hourly prices are skewed, with the mean generally much greater thanthe median. In the California day-ahead market in June 2000, the mean hourly price was$120/MWh, while the median was $61. This relationship between the mean and median occursbecause there are many hours with low prices and a few hours with very high prices.
Table 1 summarizes variations in the day-ahead hourly electricity markets run by theCalifornia PX, New York ISO, and PJM Interconnection. Prices were more volatile and reachedmuch higher levels in California than in the Northeast because of the mild summer 2000

9
PJMprice
0
20
40
60
80
100
120
140
160
1 25 49 73 97 121 145
MONDAY - SUNDAY, WEEK OF JULY 14, 1997 (hours)
PJM
SP
OT
PR
ICE
($/
MW
h)
Fig. 3. Hourly prices in the PJM Interconnection for one week. Prices ranged from $0to $157, with an average of $47/MWh and a standard deviation of $38/MWh.
Table 1. Statistical characteristics of day-ahead hourly electricity markets
California(11/99 � 10/00)
New York(12/99 � 10/00)
PJM(6/00 � 10/00)
Average ($/MWh) 70.1 36.8 28.6Maximum ($/MWh) 750 523 140Minimum ($/MWh) 6 0 0Standard deviation ($/MWh) 81.8 22.3 18.9Fraction of hours (%) < $10 0.7 0.2 4.2 < $20 4.0 15.5 45.2 > $100 18.1 0.9 0.3 > $200 5.9 0.2 0.0
weather in the Northeast. Real-time hourly prices are much more volatile than the day-aheadprices; the standard deviations of the real-time prices were 20% higher for PJM, 200% higherfor New York, and 50% higher for California.

10
TWO COMPONENTS OF ELECTRICITY PRICES
The high variability of spot-market electricity prices illustrates an important, but oftenoverlooked, feature of retail electricity markets: the traditional regulated price paid forelectricity includes two components. The first is the electricity commodity, the kilowatt-hoursof electricity we consume whenever we want to in whatever quantities we choose. The secondis a risk premium (an insurance policy) that protects customers from the volatility of electricityprices by permitting them to buy unlimited quantities of electricity at a fixed price that isdetermined months (or even years) before consumption.
Traditionally, retail customers bore these risks—but not in real time. Utilities managedrisk by building “extra” generating capacity. This planning reserve margin was intended toensure the utility’s ability to meet almost any foreseeable load. The capital and operating costsassociated with this extra capacity is an economically inefficient way to manage risk becauseit assumes that all customers value electricity the same and have almost no ability to shift usagefrom on- to off-peak hours.
In addition, utilities collected any approved changes in power-supply costs (e.g., causedby changes in fuel costs) relative to those in base rates through monthly or quarterly fuel-adjustment clauses. If these cost changes persisted, utilities sought rate increases from thepublic utility commission (PUC). These delays, coupled with the absence of hourly meters,prevented customers from responding to the time-varying costs of electricity.
Competitive retail suppliers that offer electricity at a fixed price accept both quantity andprice risks. The price risk (as illustrated in Fig. 3) reflects the a priori unknown level andvolatility of electricity prices. The quantity risk reflects the likelihood that electricityconsumption will be higher when prices are higher. Electricity consumption and prices arehighly correlated, as one would expect. For the week shown in Fig. 3, the correlation betweenprices and quantities suggests that the amount of electricity consumed explained 72% of thevariation in electricity prices. Of course, other factors, such as sudden generator or transmissionoutages, can also yield high prices.
A supplier selling fixed-price electricity would have to charge more than the averageprice to make a reasonable profit. Returning to the Fig. 3 example, a customer wanting topurchase electricity during this week and willing to face spot prices would pay $47/MWh onaverage, assuming a time-invariant load. If, however, the customer consumed electricity usingthe same load shape as the PJM system load, its consumption-weighted price for the weekwould be $54/MWh, 15% higher than the unweighted average price. Altogether, a suppliermight offer customers a fixed price of, say, $60/MWh for this period to account for price andquantity risks.

11
2016
0
0.2
0.4
0.6
0.8
1
0 5 10 15 20
MARKET SHARE (% OF TOTAL LOAD)
PR
ICE
AS
FR
AC
TIO
N O
FZ
ER
O-E
LAS
TIC
ITY
PR
ICE
0.1 0.2 0.3Price Elasticity of Demand
Fig. 4. The effects of price-responsive demand on the market price of electricity as afunction of the price elasticity of demand, the percentage of load that respondsto time-varying prices, and the initial price of $10,000/MWh.
An analysis of California markets estimated the cost of an option to buy 1 MWh at$250/MWh during all weekdays in June and July 2001 between the hours of 11 am and 6 pm.The cost of such an option would be $15,400 (Boston Pacific 2000). Spread over all 1,464hours in the two months, this risk premium is equivalent to $11/MWh. An option to protectagainst price spikes above $100/MWh would be almost three times as expensive as the $250option.
On the other hand, customers willing to accept the quantity and price risks would, in theend, pay less for electricity. These customers would do so by buying only the electricitycommodity and by providing the insurance. In addition, customers who face hourly prices canmodify their loads in response to those prices and further lower their electricity costs.
As shown in Fig. 4, if even a small fraction of retail load responded only slightly to time-varying electricity prices, the results would be dramatic (Caves, Eakin, and Faruqui 2000). Forexample, if 10% of the customers responded to a $10,000/MWh price spike with an elasticityof 0.1, the price would be cut almost 60%. (The percentage reduction in price declines as theprice spike declines. At an initial price of $500/MWh, the price reduction would be 30%.)

12

*As an example, the California Power Exchange runs a market for monthly block forwards, each ofwhich is for 16 hours every weekday during a particular month.
#A put gives the buyer the right to sell a certain asset at a certain date for a fixed price, called thestrike price. A call gives the buyer the right to buy a certain asset at the strike price. For example, a calloption might be written for 100 MWh of electricity during any hour of the summer months with a strike priceof $150/MWh. The buyer would exercise this option only when the hourly spot price exceeded $150.
13
CHAPTER 3
DYNAMIC-PRICING AND LOAD-REDUCTION PROGRAMS
PRICING AND PROGRAM TYPES
Competitive electricity providers can offer prospective customers several options thatshare the financial risks between the provider and customer (Eakin and Faruqui 2000). Thebuilding blocks for these products include the hourly spot price, forward contracts (e.g., forfixed amounts for specified monthly blocks*), and financial instruments (e.g., put and calloptions #). Because customers have different electricity-use patterns, varying abilities to modifytheir electricity use in response to price signals, and different risk preferences, they will differin their preferences among various product offerings (discussed in Chapter 4).
The ends of the risk spectrum are anchored by (1) a guaranteed fixed price that isannounced well in advance and applies to all units of consumption and (2) a simple pass-through of hourly wholesale electricity prices to the customer. Seasonal or time-of-use (TOU)rates shift some risks from the supplier to the customer. [Seasonal rates vary from season toseason but are time-invariant during each season. TOU rates differ across hours of the day butare predetermined (e.g., 4¢/kWh from 10 pm to 8 am, 6¢/kWh from 8 am to noon, 10¢/kWhfrom noon to 4 pm, and 6¢/kWh from 4 pm to 10 pm).] Additional risk can be shifted to thecustomer through a combination of a forward contract and a balancing contract for incrementalor decremental load, in which the incremental or decremental consumption is settled at thewholesale spot price. A combination of hourly spot price plus a price cap (perhaps paid for witha price floor) also shifts risk to the customer relative to a guaranteed fixed price alone. Theseproducts represent different combinations of a forward contract and financial options.
Customers with a guaranteed fixed price could lower their electricity costs byparticipating in a voluntary load-reduction program and reducing their demands at times of highprices. In such programs, the LSE and customer share the savings. Alternatively, the customerscould commit to reduce their loads during certain times when prices are high or reliability is

*We prefer the term dynamic pricing to real-time pricing (RTP) because real-time prices aredetermined by current conditions on the grid. Dynamic pricing, a more general term, encompasses RTP aswell as forward (e.g., day-ahead or hour-ahead) prices.
14
threatened. Such interruptible contracts provide a call option to the supplier, the right but notthe obligation to reduce those customers’ demands under certain prespecified conditions.
Historically, utilities have run a variety of demand-side-management programs aimedat affecting customer electricity use levels and load shapes. These programs were drivenprimarily by the utility’s resource planning needs rather than by competitive-market pressuresand the interests of individual consumers. Such programs emphasized energy efficiency(affecting overall levels of electricity use) and load management (affecting the timing ofelectricity use). Typical energy-efficiency programs offered free or low-cost home energyaudits, compact fluorescent lamps for commercial and industrial facilities, and other forms ofadvice and financial incentives. Load-management programs offered interruptible rates to largecustomers in exchange for the right to interrupt service to that customer under predeterminedreliability conditions and direct load control (especially of water heaters and air conditioners)for residential customers.
Customer programs in competitive markets are likely to (1) focus on market, rather thanregulated, prices and costs and (2) emphasize value to the customer. Competitive markets arelikely to feature three broad classes of programs: dynamic pricing, voluntary load reductionsat times of high prices, and customer sales of ancillary services to the system operator:
� Dynamic pricing* generally involves supplier provision of a set of 24 hourly prices,usually one day before real time (sometimes only an hour or two ahead). Pure spotpricing exposes all of a customer’s loads to hourly price changes. Spot pricing with riskmanagement adds a forward contract for a certain amount of load at a fixed price. In thissecond case, the customer pays for (is paid for) any hourly consumption above (below)the baseline at the hourly price.
� Interruption rights permit the utility (in traditional programs) to reduce participating-customer loads at certain times in return for a reduction in rates. Because customersreceived payments up front and the utility counted on the contracted-for resourceresponse, these traditional interruptible-rate programs usually had penalties fornoncompliance. Recently, utilities and LSEs have offered customers a shared-savingsoption in combination with a guaranteed price. Under such arrangements, the supplieragrees to share with the customer some of the savings that occur when the customerreduces consumption during high-priced periods. For example, the supplier andcustomer might agree that the customer will reduce load by 2 MW when prices exceed$200/MWh. In return, the customer and supplier will share the savings. If, for example,the fixed price of energy was $50/MWh and the load reduction occurred at a spot priceof $300/MWh, the customer and supplier might share the $250/MWh savings 50:50.

15
Table 2 compares the characteristics of the “traditional” reliability-based interruptibleprograms with voluntary price-based programs. The voluntary programs are typicallymore flexible, focus more on economics (high prices) than on reliability, and rely moreon incentives to customers than penalties for nonperformance.
� Customer sale of ancillary services entails the use of load reductions as an alternativeto generator provision of operating reserves (Hirst and Kirby 1998). These reservesinclude 10-minute contingency reserves and either 30- or 60-minute replacementreserves.
The greater flexibility of the new breed of interruptible programs relative to thetraditional programs (Table 2) will likely substantially expand the number and range ofcustomers who participate and increase economic benefits to those participants (Newcomb andByrne 1995). Analysis of industrial customers participating in a Niagara Mohawk programshowed large differences between schemes based on prices vs those based on mandatedinterruptions:
When the customers were charged $0.50/kWh for 6 hours during a criticaldemand period, they reduced load voluntarily in ways that revealed marginaloutage costs of only $0.13/kWh for the forgone load. When an interruptibleservice program was used instead—and the utility curtailed load to produce thesame total load reduction as in the first case—the [revealed] outage cost tocustomers was $1.19/kWh of unserved load. This nearly 10-fold differenceresults from the fact that price changes give customers greater choice than docurtailments, allowing them to configure usage more easily.
One potential problem with load-reduction programs is the need for a baseline againstwhich to measure and pay for load reductions. This baseline (the load shape the customer
Table 2. Comparison of traditional and voluntary load-reduction programs
Traditional interruptible programs Voluntary load-reduction programs
Purpose Reliability; often used as discountsin disguise
Economics; reduce costs whenprices are high
Duration Tariffs of one or more years Short-term (e.g., monthly orseasonal) contracts
Dispatch Rarely; for reliability purposes only When prices exceed specified levelPayments Upfront payments (often bill
discounts); no performancepayments
Usually no reservation payments;explicit sharing of actual savings(performance based)
Penalties Substantial None

16
would have achieved were it not for the load-reduction program) can be based on load shapesduring one or more previous days, the load during the previous hour, a statistical model ofcustomer-specific electricity use that accounts for weather and other factors, the load of theparticular end use or equipment affected, or some other method. Regardless of the methodchosen, the key is to ensure that the LSE and customer agree on the baseline and are bothcomfortable with it. It may not be necessary, from the societal perspective, to worry about thevalidity of the baseline used to measure voluntary load reductions. However, if the demandreduction is required for reliability (e.g., used as contingency reserves), the RTO, as well asstate and federal regulators, will want to be sure that the expected reliability benefits actuallymaterialize when called on.
The new voluntary programs, described above, offer a low-risk way for retail customersto cut their electricity costs in exchange for limited exposure to price volatility; see Table 3. Inthese programs, customers enjoy the benefits of a guaranteed fixed price, and they pay the riskpremium for this protection. These programs permit customers, at their discretion, to recouppart of the risk premium from the supplier by agreeing to share the cost savings associated withdemand reductions at times of very high prices.
However, the load-reduction programs can be more complicated than dynamic pricing.They may contain various restrictions, including the number of times the supplier can invokethe program, the minimum advance-notification time, the minimum and maximum duration foreach interruption, the load-shape basis for payment for interruptions, the minimum amount ofload that can participate, the existence and magnitude of penalties for noncompliance, and soon. Of course, these restrictions apply more to the traditional interruptible programs than to thenew voluntary, price-based load-reduction programs.
Table 3. Comparison of dynamic pricing and voluntary load-reduction programs
Dynamic pricing Voluntary load-reduction programs
Purpose Economics EconomicsDispatch Whenever customers wants When supplier calls for responseBaseline None needed Either “down to” or “down by,” both
of which are imperfecta
Payments None Explicit sharing of dollar savingsassociated with load reduction
Penalties Never Usually none; sometimes for failure tocomply with committed reduction
Type of customerresponse
Do whatever makes sense Cut demand at specified times,usually at customer option
aA down-to baseline is a set MW level, while a down-by baseline is a set reduction inload from the current level.

17
PRICING AND PROGRAM EXAMPLES
Dynamic Pricing
Some electric utilities began small real-time pricing programs in the mid-1980s (Makand Chapman 1993). Newcomb and Byrne (1995) identified 29 North American utilities withreal-time pricing programs as of 1995. These programs were aimed primarily at large industrialcustomers and secondarily at large commercial customers. Most had a per customer minimumload of about 1 MW. Typically, these programs involved fewer than 100 customers.
The hourly pricing for these programs was complicated because the programs were runby vertically integrated utilities under cost-of-service regulation. The prices typically includeddemand charges, customer charges, energy charges, and adders or multipliers. The adders andmultipliers were used to ensure revenue neutrality for the utility. These factors sometimesreflected extreme conditions, such as capacity shortages (marginal outage costs).
Customers in these programs were typically notified of hourly prices by 4 pm on theprevious day. Communication methods typically focused on use of the telephone and faxes.(These programs were operating before the Internet became the preferred communicationmedium.)
Four of the nine utilities reviewed by Mak and Chapman conducted customer surveys,which generally showed considerable satisfaction with these programs. “Overall, customersatisfaction was high for all four RTP programs. Most participants planned to continue on theirrespective programs and expressed interest in investing in modifications of their facilities if andwhen RTP tariffs were to become permanent and longer contracts were made available.” Thekey reasons for customer satisfaction included bill savings and customer control over electricitycosts. Customers also mentioned reliability in price notification, a desire for more advancenotice of prices, and a limit on the number of times the utility could revise upward its prices.
Four of the utilities analyzed customer responses to time-varying prices and found “thathigh prices do indeed induce customers to significantly reduce loads. This general conclusionprevails despite significant differences in structural characteristics and real-time prices amongthese programs.” Customer responses to dynamic prices can take two forms: “(1) Intradayflexibility which reflects the customer’s ability to shift usage from one hour to other hours ofthe day, and (2) Interday flexibility, which reflects the customer’s ability to shift usage fromone hour to hours on other days.”
Medium and large industrial and commercial customers have been buying electricity onthe basis of half-hourly prices in England and Wales since 1990. Patrick and Wolak (1997)analyzed customer data for four years (1991 through 1995) for their response to these prices.Their analysis found substantial heterogeneity across industries in their price elasticity and thepattern of within-day substitutions in electricity consumption. A substantial amount of load

*According to the Georgia Power RTP schedule: “The customer baseline load (CBL) is developedusing one complete year of customer-specific hourly firm data that represents the electricity consumptionpattern and level agreed to by the customer and Georgia Power Company as typical of this customer’soperation for billing under his conventional tariff and from which to measure changes in consumption for[RTP] billing. The CBL is the basis for achieving revenue neutrality with the appropriate non-real-time-pricing firm load tariff on a customer-specific basis.”
18
could be shifted away from high-price periods because, even though the elasticities were small,the price changes can be substantial.
Another analysis of customer response to dynamic pricing in England and Wales foundthat “the amount of load shifting that occurred between days is much larger [about 10 timesgreater] than the load shifting that occurred within days” (King and Shatrawka 1994). Thebetween-day elasticities ranged from 0.1 to 0.2, while the within-day elasticities were aboutone-tenth the between-day values. This study also found that between one-third and one-halfof the customers responded to time-varying prices.
Today, Georgia Power operates the largest dynamic-pricing program in the UnitedStates. About 1,600 of its large industrial and commercial customers (representing about 5,000MW of load) face hourly prices (Braithwait and O’Sheasy 2000; O’Sheasy 2000). Participationin this program has increased steadily since it began as a pilot program in 1992. About 85% ofthe participating load is industrial, with the commercial sector accounting for the remainder.
The utility offers day- or hour-ahead notification of firm prices. About 35 of its largestindustrial customers participate in the hour-ahead program. The day-ahead participantsencompass a wide range of loads, from 0.25 MW up to 100 MW or more. These customersinclude a variety of industries (which account for about two-thirds of the participating load) andcommercial businesses (e.g., grocery stores, shopping malls, hospitals, public schools, anduniversities). Some of these customers, especially the large industrials, have onsite generation.
Georgia Power posts the day-ahead prices at 4 pm by e-mail and increasingly throughan Internet site. The day-ahead price is equal to the utility’s expected hourly marginal cost plus$4/MWh. Because its risks are lower with hour-ahead prices, the markup over marginal costis only $3/MWh for this option.
Georgia Power uses a two-part design, based on a predetermined customer baseline load(CBL). The CBL is intended to reflect the customer’s preparticipation hourly load shape forpurposes of traditional cost-of-service revenue requirements. In other words, if the customeruses electricity according to its CBL, the utility is revenue neutral with respect to the time-invariant rate the customer would otherwise pay.*
Wholesale electricity prices have been increasing in level and volatility during the pastfew years (O’Sheasy 2000). Historically, Georgia Power counted on about 500 MW of load
19
reduction when prices reached $500/MWh or more. In August 1999, when prices exceeded$1,000/MWh, customer response reached 800 MW (roughly a 20% load reduction). Althoughmore customers have complained about high prices during the past few summers, very fewhave left the RTP tariff because of this concern. Instead many customers bought “pricing-protection products” from Georgia Power: risk management packages, such as contracts fordifferences, caps, and collars that allow customers to protect specific loads during specific timeperiods.
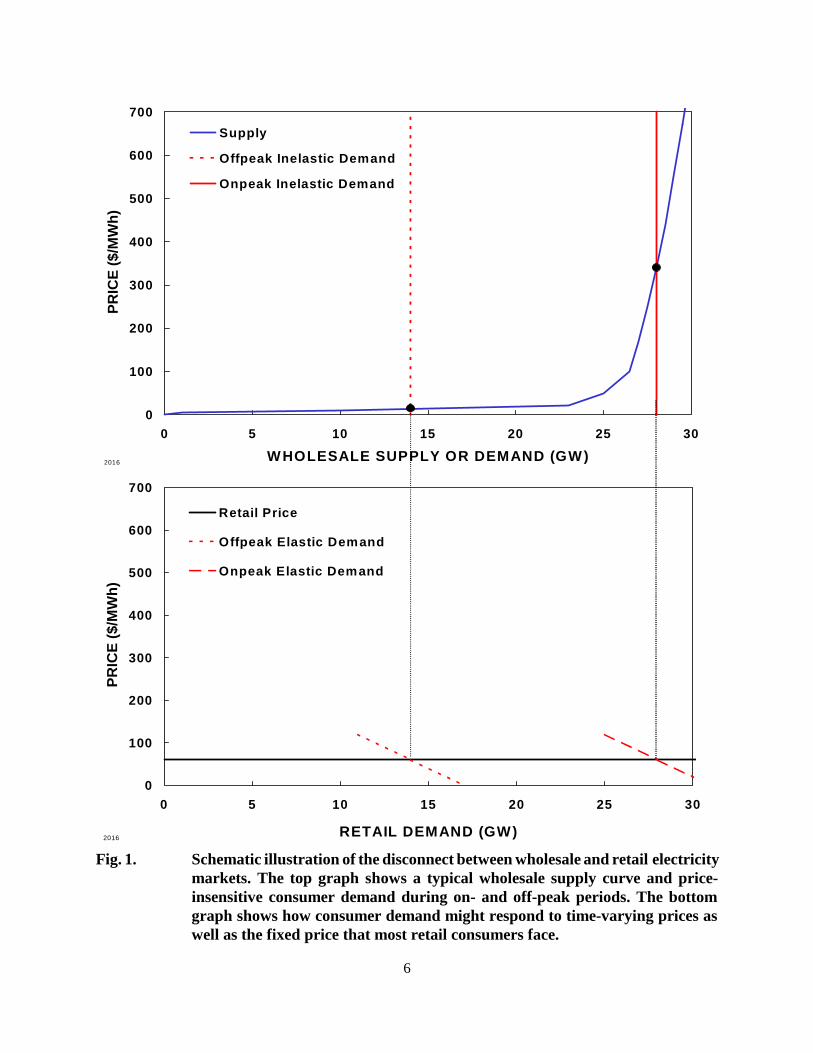
Figure 5 shows the responses to price changes for four Georgia Power customers. Theprices during these two July days ranged from $19 to about $130/MWh, with an average ofabout $54/MWh. The mining and chemical companies responded strongly to these time-varyingprices; the correlation coefficients between their hourly consumption and hourly prices were�0.89 and �0.99, respectively. Mid-afternoon consumption for the mining customer was only29% of its maximum value; the comparable value for the chemical company was 83%. Themarble and college customers, on the other hand, showed very little response to these hourlyprice changes. Indeed, electricity use at the colleges increased when prices were highest,although the increase might have been less than would have occurred at lower prices. Theseresults show that customers differ enormously in their willingness and ability to respond todynamic prices. The results also show that some price-insensitive customers still choosedynamic pricing over the standard tariff; these customers save money by self insuring. Roughlyhalf of the load on dynamic pricing responds to price changes; in general, customers with onsitegeneration are more likely than other customers to respond (Braithwait 2000b).
Georgia Power customers also respond differently to moderately and very high prices(Table 4). As expected, the percentage reductions in load are much higher at very high prices.Also, the largest industrial customers, the ones that chose the hour-ahead prices, exhibit higherelasticities than the day-ahead customers. Overall, elasticities range from 0.03 for commercialcustomers to 0.3 for the hour-ahead customers.
Table 4. Georgia Power customer responses to dynamic prices by notification periodand maximum daily price
Maximum daily price Percentage reduction in hourly electricity use Hour-ahead participants Day-ahead participants
$300 to $350/MWh 29% 8%$1,500 to $2,000/MWh 60% 20%
Source: Braithwait (2000b).

20
GPCRTP
0.0
0.4
0.8
1.2
1.6
0:00 6:00 12:00 18:00 0:00
ELE
CT
RIC
ITY
US
E (
norm
aliz
ed)
0
4
8
12
16
20
ELE
CT
RIC
ITY
PR
ICE
(¢/
kWh)
M in ingM arblePrice
GPCRTP
0.0
0.4
0.8
1.2
0:00 6:00 12:00 18:00 0:00
ELE
CT
RIC
ITY
US
E (
norm
aliz
ed)
0
4
8
12
16
20
ELE
CT
RIC
ITY
PR
ICE
(¢/
kWh)
CollegeChemicalPrice
Fig. 5. Customer responses to Georgia Power’s dynamic pricing program. The topgraph shows the responses (normalized to average hourly use, the light dottedlines) from a large mining company (87 MW) and a marble manufacturer (4MW). The bottom graph shows the responses from a chemical plant (47 MW)and several colleges (18 MW). (The dotted lines and right-hand axes showhourly electricity prices.)

21
Duke Power (in North and South Carolina) has a similar dynamic-pricing program, withabout 110 customers, representing 1,000 MW of load. Duke’s program began as a pilot with12 participants in 1994. Only about a dozen customers have dropped out of the program sinceits inception. Duke’s analysis (Schwarz et al. 2000) showed the following results:
� Customer responses to Duke’s hourly prices during the four summer months show lowerelasticities than other utilities report, roughly 0.04 vs 0.1. As in other studies, Dukefound that only some customers respond significantly to price changes.
� Customers with self generation respond significantly to electricity prices above athreshold point at which self-generation becomes economical. Below the price at whichit makes sense to operate the onsite generation, these customers show little response torising prices; above the price at which the onsite generation is economical, thecustomers show substantial price response.
� Customer responses to price changes increase with experience on the RTP rates.
� Customers with a “discrete production process that allows delay” show a large priceresponse. For example, paper manufacturers use large grinders for making pulp; thesegrinders can be operated independently of the rest of the production process to avoidhours with high prices.
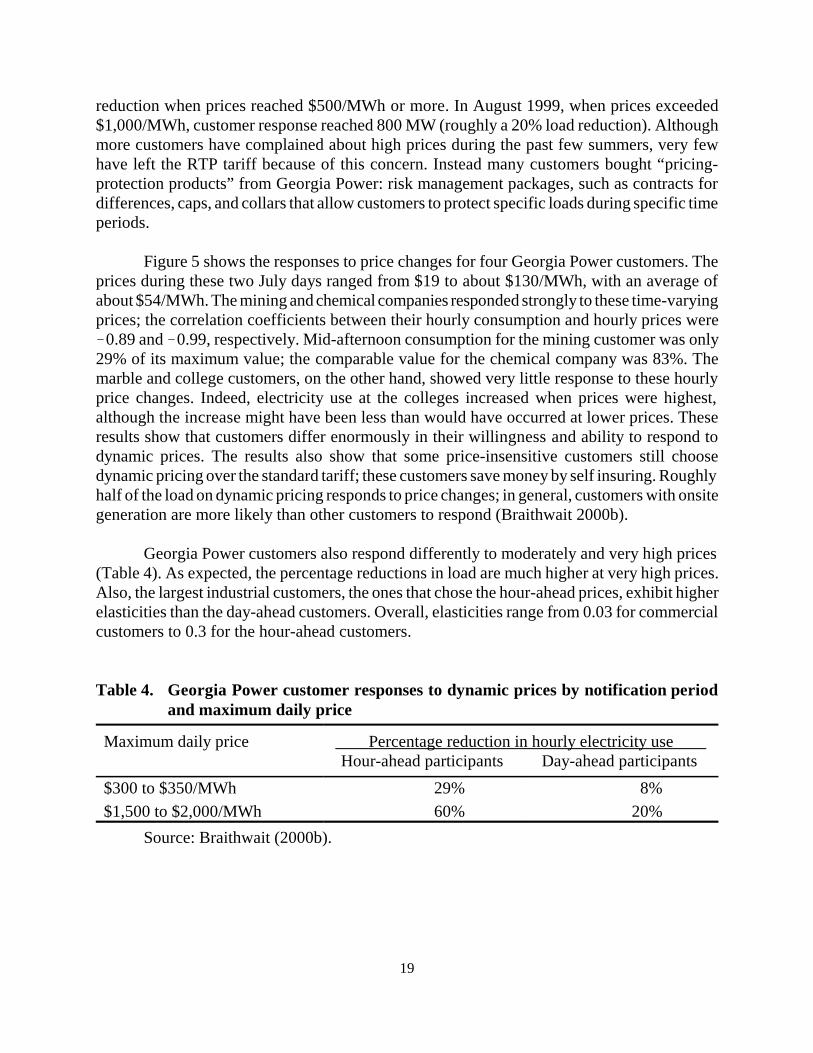
While Fig. 5 showed differences among customers in their responses to hourly pricechanges (for Georgia Power), Fig. 6 shows how customers in aggregate respond to differentprice levels. The graph shows the daily load profile for all of Duke Power’s RTP participantsas a function of the maximum hourly price. As prices increase, mid-afternoon loads decline.The ratio of maximum hourly load to minimum hourly load increases from 1.04 when pricesare below $50/MWh to 1.13 when prices are between $100 and $150/MWh and to 1.21 whenprices exceed $250/MWh.
The authors of the Duke analysis also investigated the optimal amount of advance noticeof electricity prices, trading off the benefits to customers of more advance notice (e.g., day- vshour-ahead notification) against the risks to the supplier of having real-time prices differentfrom the a priori price guarantee (Taylor and Schwarz 2000). Increasing the amount of advancenotice allows customers to find and implement more ways to adjust their production processesto respond to these prices. On the other hand, the price forecast error increases with moreadvance notice. “Under reasonable assumptions, customer benefits from advance notice tendto exceed the cost of increased risk associated with forecast error. … The simulation suggeststhat day-ahead advance notice increases welfare for reasonable magnitudes of customerelasticity and utility forecast error.”
*Recall that TOU prices differ from real-time prices in that TOU prices are fixed well in advance ofconsumption for set blocks of hours each day. Real-time prices, on the other hand, vary from hour to hourand are set either day- or hour-ahead, or sometimes in real time (either ex ante or ex post).
22
2017
840
870
900
930
960
990
1020
0 6 12 18 24TIME (hour)
DU
KE
PO
WE
R L
OA
D (
MW
)
<50 100 to 150 >250
Maximum Price ($/MWh)
Fig. 6. Customer response to Duke Power’s day-ahead hourly pricing program as afunction of the maximum hourly price.
Although most of the dynamic-pricing programs today focus on large industrial andcommercial customers, some utilities run such programs for residential customers. GPU Energyran an innovative time-of-use* pilot program that featured an interactive communication system(Braithwait 2000a). This system allowed the utility to communicate price signals to the homethermostat so that electricity use for heating or air conditioning could be automatically adjustedin response to price changes. The overall elasticity for these customers was about 0.30, muchhigher than that experienced in other residential TOU programs. During the summer months,participants cut their weekday electricity consumption by 7%, on average.
Several other utilities continue to run RTP programs. In general, these programs havevery few participating customers. In addition, many customers have left these programs duringthe past couple of years as they have experienced dramatic price spikes. Interestingly, neitherGeorgia Power nor Duke Power experienced such customer losses.

*For purposes of this report, LSEs can include load aggregators, energy-service providers, energy-service companies, scheduling coordinators, the marketing affiliate of a distribution utility, or a municipaldistribution utility.
#Air-conditioner cycling involves repeatedly turning the unit off (say, for 10 minutes every half hour)and then on (for 20 minutes). Air-conditioner shedding involves turning the unit off for an extended time,say four hours.
23
In principle, large customers or their LSEs* could bid price-responsive demand into theISO/PX day-ahead, hour-ahead, or real-time markets. However, very little such behavior isoccurring. Given the need for some advance notice to plan operations, we had expected to seevery little price response to real-time markets, but we had expected to see considerable suchbehavior in the New York, PJM, and California day-ahead energy markets. (New England doesnot yet operate a day-ahead energy market; it operates only a real-time energy market.) Noneof the people we spoke with had an explanation for why so little load was responding to pricesin day-ahead markets; we return to this issue in Chapter 6.
Interruptible and Voluntary Load-Reduction Programs
Electric utilities have been running programs to encourage demand reductions at timesof tight supply for at least two decades. These programs have focused on large industrial andcommercial customers, typically offering a discount in the demand charge (expressed in $/kW-month) in exchange for the right to interrupt service to a portion of the customer’s load(Table 2). These programs are characterized by a rigid structure that specifies far in advancethe maximum number of times a year the utility can call for interruptions, the minimum amountof advance notice it must provide, the maximum time permitted for each interruption, and thepenalty imposed on customers who do not meet their contractual obligation to interrupt demandwhen called upon to do so. A 1994 survey identified 89 such programs, covering almost 7,000industrial and commercial customers (Plexus Research 1995).
The same survey identified 333 load-control programs, most of which focused onresidential water heaters and air conditioners. The programs typically used a communicationsystem to remotely turn off and on the end-use equipment. The 6.7 million controlledinstallations included nearly 3.2 million air conditioners, nearly 2.4 million water heaters, andnearly 1.0 million space-heating systems, almost all of them in residential applications.Participating customers typically received a bill credit of $20 to $30 a year for each piece ofequipment under utility control. Reported load reductions ranged from 0.6 kW for water heatersto 0.9 kW for cycled air conditioners, 1.8 kW for shed air conditioners, and 1.4 kW for space-heating systems.#
The Energy Information Administration (1999) collects data each year on electric-utilitydemand-side-management programs. The results for 1998 show that these programs achieveda potential peak load reduction of 41,400 MW, down from the 48,300 MW reported for 1996.

*These delays refer to the time it takes for Planergy to learn how customers responded to theinterruption request, not to the time for the response to occur. The latter lag is a function of the time it takesPlanergy to notify participating customers of an interruption and of the time it takes customers to implementcontrol actions.
24
(Two-thirds of the 41,400 MW reduction was attributed to load-management programs, withthe remainder attributed to energy-efficiency programs.) This potential reduction was splitroughly equally among the residential, commercial, and industrial sectors. Utilities spent about$540 million on these load-management programs in 1998.
Utilities are not the only entities operating reliability-based load-management programs.Planergy, working as an aggregator, provides a similar program with a total load reduction ofabout 100 MW to two utilities in Texas: Reliant Energy and CSW (now part of AmericanElectric Power). Planergy offers a near-turnkey service to utilities that includes marketing,program operations, monitoring, and verification for settlements (Slifer 1999). By aggregatingacross customers and selling the aggregate load reduction to the utility, Planergy’s program isavailable to smaller commercial and industrial customers than those that typically participatein utility interruptible programs.
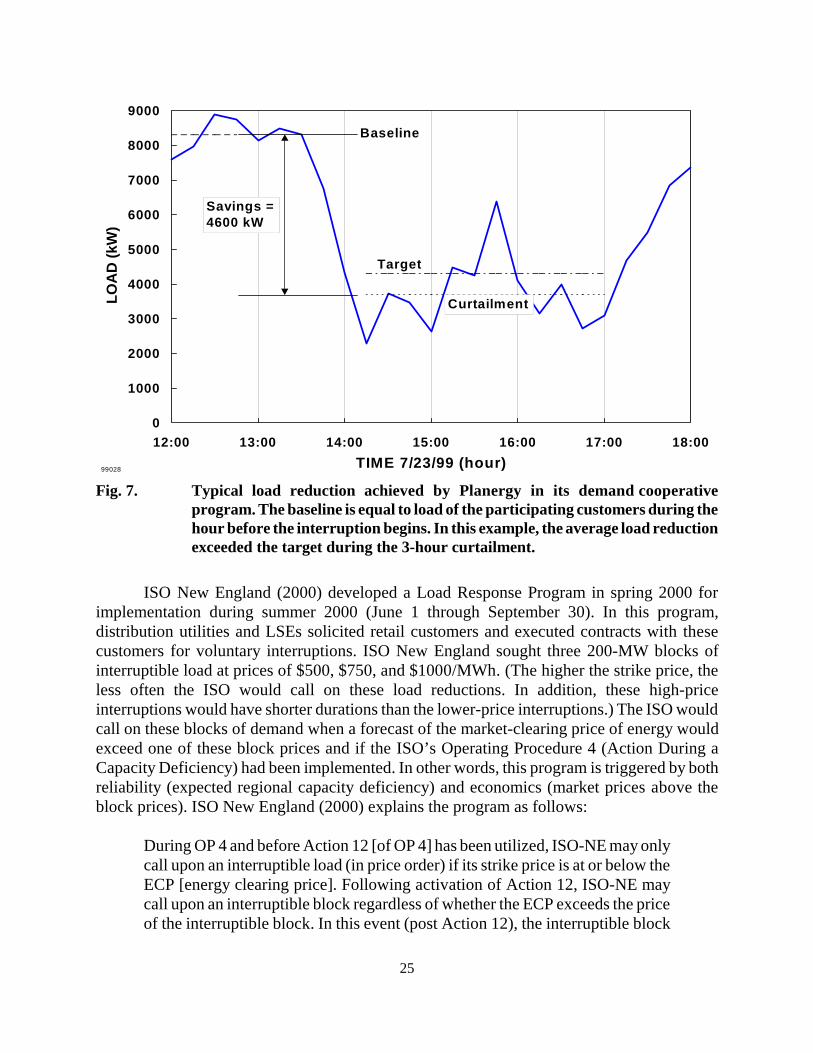
Planergy uses 15-minute load data. It measures load reductions relative to the loadduring the hour before the utility called for the load reduction, a very simple way to define thebaseline (Fig. 7). The utility calls Planergy to announce a curtailment at least 75 minutes beforeit is to begin. Planergy then uses an automated telephone dialer to notify customers of theforthcoming interruption. Planergy uses telephone lines or satellite phones to collect 15-minutecustomer-load data to monitor the progress of the interruption, usually with a 15- to 20-minutedelay.* (This delay occurs because of the inherent lags in getting data from meters that recordcumulative consumption only once every 15 minutes, as well as the time it takes the Planergysystem to make all the phone calls to the end-use meters and to process the data.) Planergy usesthese data to follow up with customers who are not meeting their load-reduction obligations.If a customer is not able to respond, Planergy will solicit backup customers who are willing toparticipate from time to time but not on an ongoing basis. Because of this active followup,Planergy obtains near 100% compliance with the utility interruption requests. Customers whoconsistently fail to respond to the interruption requests are removed from the program.
Advance notice is typically one hour, and the interruptions typically last three or fourhours. As with the utility programs, there are limits on the number of times a year interruptionscan be called and on maximum outage duration. Because customers are paid on a monthly basisin terms of $/kW-month for each kW of load reduction offered, customers are penalized forfailure to respond.
In addition to these “traditional” load-management programs, ISOs and utilities operatea variety of new, primarily voluntary load-reduction programs. We first discuss the summer2000 ISO programs and then discuss a few of the new utility programs.
25
99028
0
1000
2000
3000
4000
5000
6000
7000
8000
9000
12:00 13:00 14:00 15:00 16:00 17:00 18:00
TIME 7/23/99 (hour)
LOA
D (
kW)
Savings =4600 kW
Baseline
Target
Curtailment
Fig. 7. Typical load reduction achieved by Planergy in its demand cooperativeprogram. The baseline is equal to load of the participating customers during thehour before the interruption begins. In this example, the average load reductionexceeded the target during the 3-hour curtailment.
ISO New England (2000) developed a Load Response Program in spring 2000 forimplementation during summer 2000 (June 1 through September 30). In this program,distribution utilities and LSEs solicited retail customers and executed contracts with thesecustomers for voluntary interruptions. ISO New England sought three 200-MW blocks ofinterruptible load at prices of $500, $750, and $1000/MWh. (The higher the strike price, theless often the ISO would call on these load reductions. In addition, these high-priceinterruptions would have shorter durations than the lower-price interruptions.) The ISO wouldcall on these blocks of demand when a forecast of the market-clearing price of energy wouldexceed one of these block prices and if the ISO’s Operating Procedure 4 (Action During aCapacity Deficiency) had been implemented. In other words, this program is triggered by bothreliability (expected regional capacity deficiency) and economics (market prices above theblock prices). ISO New England (2000) explains the program as follows:
During OP 4 and before Action 12 [of OP 4] has been utilized, ISO-NE may onlycall upon an interruptible load (in price order) if its strike price is at or below theECP [energy clearing price]. Following activation of Action 12, ISO-NE maycall upon an interruptible block regardless of whether the ECP exceeds the priceof the interruptible block. In this event (post Action 12), the interruptible block

*The ISO requires only that the LSEs “calculate an estimate of the load reduction actually achievedin each hour of request. The estimate should be based on hourly meter readings adjusted to account fornormal load shapes and temperature differences.”
#PJM included this minimum load-reduction duration to ensure that participating customers couldearn enough money to warrant their participation in the program (Bresler 2000).
26
would be eligible to set the ECP and would essentially act as a floor price untilthat hour following the restoration of the ten-minute reserve.
Customer responses to interruption requests are voluntary, with no ISO or LSE penaltiesimposed for noncompliance. The ISO pays the LSEs for measured load reductions. Thepayments to participating customers are of no concern to the ISO and are left entirely to theLSE and its customers. In a similar fashion, the ISO specifies no method for determining eachcustomer’s baseline load; instead, the LSEs are responsible for determining customer-specificbaselines against which to measure load reductions.* The ISO imposes no minimum load sizeor load-reduction magnitude. The only requirements the ISO imposes on customers is that theyhave hourly meters and can respond to interruption requests within one hour of being asked tointerrupt.
More than 900 retail customers, accounting for 253 MW, signed up for this program.Almost all of this load (240 MW) signed up at the $500/MWh price, 6 MW at $750, and 7 MWat $1,000. The program was never activated because summer temperatures were unseasonablymild.
PJM (2000b) operated a similar program, called the Customer Load Reduction PilotProgram. Like the New England program, the PJM program is reliability based, voluntary,operated through the LSEs, and of limited duration (summer only). Participating loads must beable to reduce at least 0.1 MW of load, be able to participate for a minimum of 10 hours overthe program-operation period ending September 30, 2000, be available all hours between 9 amand 10 pm all seven days of the week, be capable of achieving full reduction within one hourof PJM’s request to reduce load, maintain the load reduction for at least two hours,# and havemeters that can record consumption on an hourly basis.
The program design permitted PJM to call on these interruptible loads following thedeclaration of Maximum Emergency Generation and before implementation of other load-management programs. (Maximum Emergency Generation is used to increase the amount ofgenerating capacity available to the PJM system beyond the maximum economic level duringreliability emergencies.) PJM will pay the LSEs the higher of the appropriate zonal locationalmarginal price of energy or $500/MWh. As with the New England Program, PJM leaves it tothe LSEs to determine the baseline load shape against which to measure load reductions. Tothe extent that participating customers are high-load-factor industrials, the baseline load shapeis largely time invariant.

27
About 30 customers representing 100 MW (ranging in size from 0.1 to 15 MW) signedup for the program. The program was never activated during summer 2000 because, as was truefor New England, mild weather kept loads from reaching very high levels.
In addition to its new pilot program, PJM (2000c) has also operated an Active LoadManagement program since 1991 (Exhibit 1). This program, operated primarily by thedistribution utilities, includes direct control of residential equipment, customer load reductionto a firm level (interruptible contracts), and guaranteed load drops implemented through the useof onsite generation. In this program, PJM provides no monetary payment. Instead,participating utilities receive installed-capability credits for the load reductions, which reducethe utilities’ costs of installed generating capacity. Participating loads must be available for upto ten PJM-initiated interruptions during the planning period (October through May and Junethrough September), for interruptions lasting up to six hours between noon and 8 pm onweekdays, and within two hours of notification to the LSE by PJM. The baseline is either thecustomer’s load one hour before the event or the customer’s hourly loads on a comparable day,as determined by the LSE. Failure to perform can lead to penalty charges related to PJM’scapacity deficiency charge; that is, the penalty is comparable to that which would apply forproviding insufficient generating capacity to meet the required installed-capability requirement.
About 1,700 MW of load (roughly half of which is residential and small-commercialdirect-load control and half of which is industrial loads and onsite generation) qualify forinstalled capability in PJM. The program was called upon six times during the summer of 1999but not at all during the summer of 2000. The program would be called upon immediately afterPJM calls on the loads participating in the previously discussed load-reduction pilot program.
The California ISO operated a similar Demand Relief Program, in which it sought 1,000MW of participating loads, each of which must be greater than 1 MW. The program ran fromJune 15 through October 15, 2000, and was contracted on a monthly basis. Unlike the otherISO programs, which paid only for actual energy reductions (on a $/MWh basis), the Californiaprogram paid both for capacity reserved (on a $/MW-month basis) and for energy saved (basedon the difference between scheduled and actual energy use). These loads were to be calledupon when the ISO declared a Stage 1 emergency, which means that operating reserves areexpected to fall below the required 7% of daily peak demand. Unlike the two other ISOs, theCalifornia program specified the baseline against which load reductions were to be measuredas the demand for the same hour averaged over the 10 prior weekdays. As with the otherprograms, meters that record hourly consumption were sufficient for participation. Of the180 MW of bids accepted by the ISO, contracts were signed with about 65 MW (Dozier 2000).
Unlike the programs in the Northeast, the California program was invoked 20 timesduring June, July, August, and September 2000 because California experienced hot weather,high demand, and limited supplies many times. As of November 2000, the ISO had publishedno information on the actual performance of the program.
28
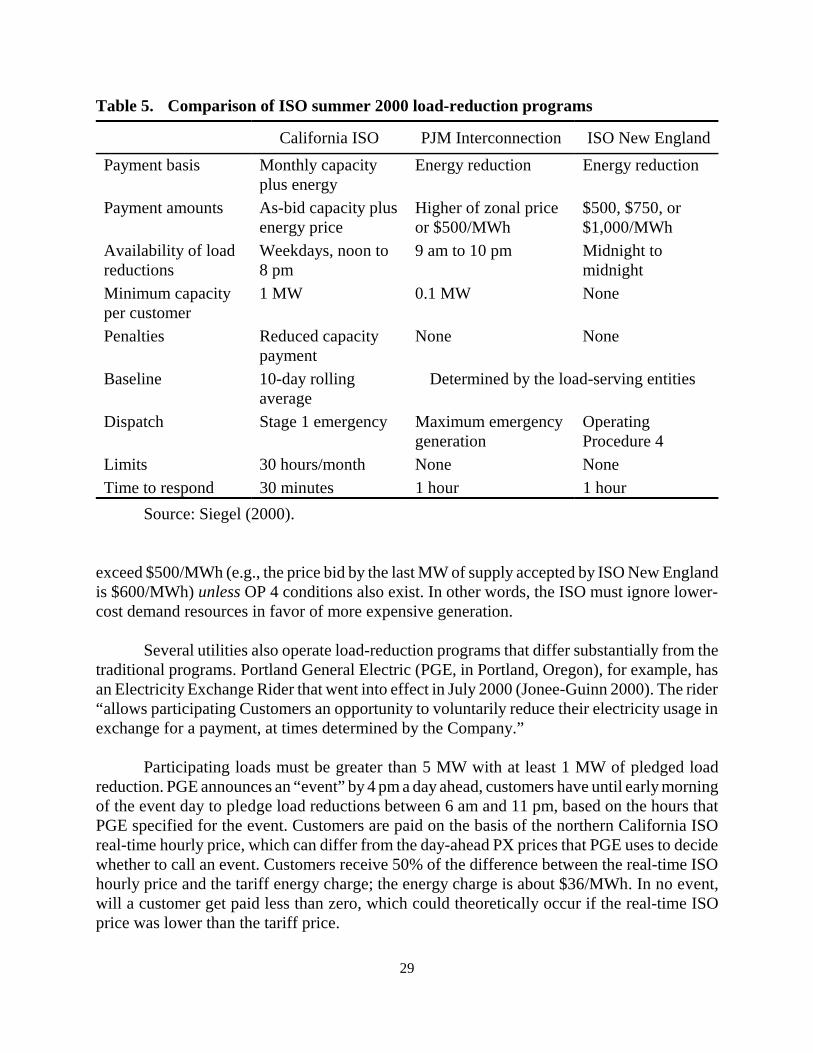
Table 5 compares the characteristics of the summer 2000 load-reduction programs runby the three ISOs. All three programs represent small, but important steps towards the creationof competitive markets in which loads fully participate. Because these programs are drivenmore by reliability requirements than by economics, their benefits are much less than they couldhave been. For example, the New England program received 240 MW of load-reduction offersat a price of $500/MWh. However, the ISO cannot call on these loads when the supply offers
PJMPrice
30000
35000
40000
45000
50000
55000
1 2 3 4 5 6 7 8 9 10 11 12 13 14 15 16 17 18 19 20 21 22 23 24
SUMMER PEAK DAY 7/6/99 (hour)
PJM
LO
AD
(M
W)
9 hours of emergency load reliefcut demand by 3.5%
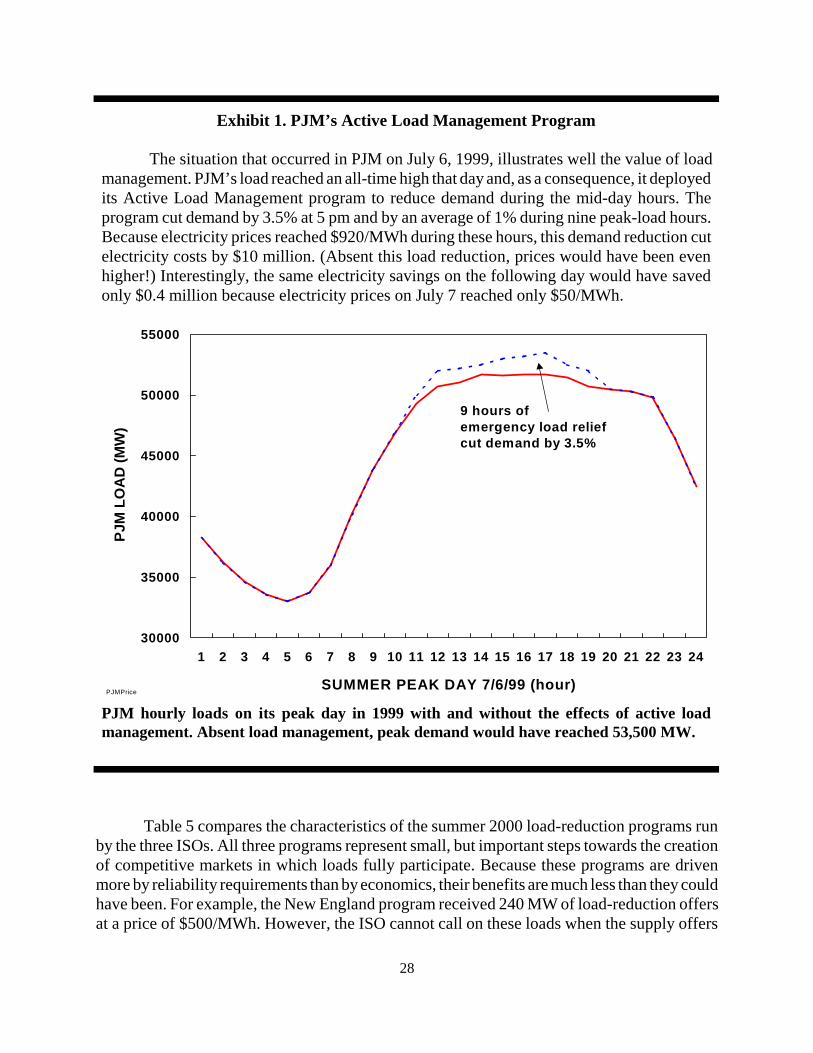
PJM hourly loads on its peak day in 1999 with and without the effects of active loadmanagement. Absent load management, peak demand would have reached 53,500 MW.
Exhibit 1. PJM’s Active Load Management Program
The situation that occurred in PJM on July 6, 1999, illustrates well the value of loadmanagement. PJM’s load reached an all-time high that day and, as a consequence, it deployedits Active Load Management program to reduce demand during the mid-day hours. Theprogram cut demand by 3.5% at 5 pm and by an average of 1% during nine peak-load hours.Because electricity prices reached $920/MWh during these hours, this demand reduction cutelectricity costs by $10 million. (Absent this load reduction, prices would have been evenhigher!) Interestingly, the same electricity savings on the following day would have savedonly $0.4 million because electricity prices on July 7 reached only $50/MWh.
29
Table 5. Comparison of ISO summer 2000 load-reduction programs
California ISO PJM Interconnection ISO New England
Payment basis Monthly capacityplus energy
Energy reduction Energy reduction
Payment amounts As-bid capacity plusenergy price
Higher of zonal priceor $500/MWh
$500, $750, or$1,000/MWh
Availability of loadreductions
Weekdays, noon to8 pm
9 am to 10 pm Midnight tomidnight
Minimum capacityper customer
1 MW 0.1 MW None
Penalties Reduced capacitypayment
None None
Baseline 10-day rollingaverage
Determined by the load-serving entities
Dispatch Stage 1 emergency Maximum emergencygeneration
OperatingProcedure 4
Limits 30 hours/month None NoneTime to respond 30 minutes 1 hour 1 hour
Source: Siegel (2000).
exceed $500/MWh (e.g., the price bid by the last MW of supply accepted by ISO New Englandis $600/MWh) unless OP 4 conditions also exist. In other words, the ISO must ignore lower-cost demand resources in favor of more expensive generation.
Several utilities also operate load-reduction programs that differ substantially from thetraditional programs. Portland General Electric (PGE, in Portland, Oregon), for example, hasan Electricity Exchange Rider that went into effect in July 2000 (Jonee-Guinn 2000). The rider“allows participating Customers an opportunity to voluntarily reduce their electricity usage inexchange for a payment, at times determined by the Company.”
Participating loads must be greater than 5 MW with at least 1 MW of pledged loadreduction. PGE announces an “event” by 4 pm a day ahead, customers have until early morningof the event day to pledge load reductions between 6 am and 11 pm, based on the hours thatPGE specified for the event. Customers are paid on the basis of the northern California ISOreal-time hourly price, which can differ from the day-ahead PX prices that PGE uses to decidewhether to call an event. Customers receive 50% of the difference between the real-time ISOhourly price and the tariff energy charge; the energy charge is about $36/MWh. In no event,will a customer get paid less than zero, which could theoretically occur if the real-time ISOprice was lower than the tariff price.

*In addition, the utility paid a large mining company (with a load of 90 MW) $82,000 to shut downon one day when prices were especially high.
30
PGE defines the baseline for each customer based on its hourly loads during the 14consecutive weekdays before the day of the event. Participating customers have hourly metersthat are read through telephone lines.
PGE imposes no penalties for noncompliance. However, if a customer pledges a loadreduction for an event and then fails to deliver three times, it is dropped from the program.
Between July and November 2000, PGE called 32 events. The six participatingcustomers achieved load reductions of up to 121 MW. PGE paid $1 million to the participatingcustomers. To encourage customer participation, PGE did not call an event unless it expectedthe real-time price to exceed $250/MWh. PGE, based on discussions with its customers,believes that the customer costs for interruption are such that lower payments (e.g., at pricesof $100/MWh) would greatly reduce participation.
GPU Energy (operating in New Jersey and Pennsylvania) operated a program similarto PGE’s (Stathis 2000). GPU targeted retail customers with a minimum demand of 0.3 MWthat had 15-minute interval meters. Altogether, GPU signed up seven companies with 15 MWof load for this pilot program. GPU found that mail solicitations did not work. Successfulmarketing required face-to-face meetings with customers.
Unlike the PGE program, the GPU program was based on firm day-ahead prices andcommitments. GPU, based on its expectations for PJM’s day-ahead locational prices, sent thecustomers participating in its Voluntary Load Reduction Program a set of hourly prices for thehours ending noon to 8 pm for the following day by 9 am. Customers were required to bidhourly MW reductions to GPU by noon of that day. Unlike the PGE program, which had nopenalties for noncompliance, GPU penalized customers who provided less than 90% of theirday-ahead load-reduction bids. As with the PGE program, GPU shared the benefits of loadreductions 50:50 with participating customers.
Because of the mild summer, GPU invoked the program only five times. Like PGE,GPU did not offer the program unless the day-ahead price was sufficiently high, about$200/MWh for GPU. On average, about 4 MW of load reduction was obtained.
The PGE and GPU programs used the same Internet-based communication system,developed and sold by Apogee Interactive, to send price information to participating customersand to receive customer responses. The Apogee system also calculated the actual loadreductions, based on its proprietary analysis of customer-specific baseline load shapes.
Wisconsin Electric developed two programs for implementation in summer 2000(Sodemann 2000).* The company was motivated in part by negative customer reaction to its

31
traditional interruptible-rate programs. After years of enjoying the rate discount and not havingbeen called upon to interrupt loads, customers were angry that they were forced to reduce loadsduring the summer of 1998. Wisconsin Electric wanted to develop programs that gave morecontrol to customers. The goal was to develop programs that paid customers for voluntary loadreductions when regional electricity prices were high.
The Dollars for Power program was aimed at commercial and industrial customers andused fixed bid prices of $400, $800, and $1,250/MWh for load reductions, with participationby about 4 MW, 4 MW, and 7 MW, respectively, of load relief. Participation was limited tocustomers who could provide reductions greater than 0.05 MW and that had hourly meters.Customers signed up for load reductions at one of the three prices, but were free to switch fromone price to another on a monthly basis.
The utility used a combination of its website plus e-mails and pagers to post prices andannounce the time deadline for customer MW-reduction bids. Customers who provided loadreductions were paid according to the fixed price; no penalties were applied for failure toreduce load. Unlike the PGE and GPU programs, this was a day-of program, in whichWisconsin Electric announced prices and solicited MW-reduction bids in the morning for uselater that day.
The Power Market Incentives program was aimed at Wisconsin Electric’s largest andmost sophisticated industrial customers. In this program, the utility established the price atwhich it would buy back load reductions and then solicited MW-reduction bids from thecustomers. The minimum load reduction for this program was 0.5 MW, ten times that for theDollars for Power program. Altogether, 27 customers with 85 MW of load relief participatedin this program. Unlike the Dollars for Power program, this program included penalties fornonperformance, with the amount of the penalty based on the actual wholesale price of power.
In both programs, the utility and customer negotiated a baseline load shape prior toprogram initiation. Because many of the very large customers have essentially flat load shapes,agreement on a baseline was not difficult.
Utilities are not the only entities that offer such load-reduction programs. Several powermarketers and energy-service providers offer similar programs. We were not able to obtaindetails on any of these programs, however.
Ancillary Services
For both reliability and commerce, bulk-power systems require certain services beyondthe basics of energy, generating capacity, and power delivery (Hirst 1999). Some of theseancillary services (such as regulation and reactive power) are required during normal operationsto maintain the necessary balance between generation and load in real time and maintainvoltages within the required ranges. Other ancillary services (such as contingency reserves)

*In November 1999, the North American Electric Reliability Council changed the recovery periodfor its Disturbance Control Standard from 10 minutes to 15 minutes. The ISOs are using the extra fiveminutes to determine whether an outage has occurred that warrants use of contingency reserves and, if so,which reserves to use.
32
provide insurance to prevent minor problems from becoming catastrophes. Finally, someservices (such as system blackstart) are required to restore the bulk-power system to normaloperations after a major outage occurs.
In response to a rapidly changing structure for the U.S. electricity industry and therequirements of FERC’s (1996 and 1999) Orders 888 and 2000, the industry is unbundlingthese services and pricing them separately. In particular, certain services are being bought andsold competitively, primarily through markets operated by ISOs. Some of these services, suchas contingency reserves and load following, can be provided by loads as well as by generators:
� Load following is the use of online generation equipment to track the interhour changesin customer loads. These hourly and diurnal changes in customer loads are generallycorrelated with each other and are predictable.
� Spinning reserve is the use of generating equipment that is online and synchronized tothe grid that can begin to increase output immediately in response to changes ininterconnection frequency and that can be fully available within 10 minutes* to correctfor generation/load imbalances caused by generation or transmission outages. Inprinciple, loads under the control of the system operator could help provide this service.
� Supplemental reserve is the use of generating equipment and interruptible load that canbe fully available within 10 minutes to correct for generation/load imbalances causedby generation or transmission outages. Supplemental reserve differs from spinningreserve only in that supplemental reserve need not begin responding to an outageimmediately. This service may also include the provision of additional generatingcapacity that must be fully available within 30 or 60 minutes (the exact time dependson the rules of the regional reliability council) and can then be maintained untilcommercial arrangements can be made (e.g., for two hours) to “back up” the normalsupply for the load.
� Backup supply is a service customers could purchase to protect against forced outagesat the generating units that provide their energy or against loss of transmission betweentheir normal supply and their load. This service is used to restore operating reserves tonormal levels and therefore must be available within 30 to 120 minutes. Unlike spinningand supplemental reserves, which are system services required for reliability, backupsupply is a commercial service that supports individual transactions. Customers who didnot purchase backup supply would be required to disconnect their loads from the gridwhen their power supply failed or to buy power on the spot market.

*The California ISO’s (2000a) technical standard for loads notes its need for “near real-time [data]… to continuously monitor the status, location, and amount of reserves available to meet reliability criteriaset by the Western Systems Coordinating Council and the North American Electric Reliability Council.”
33
Municipal water pumping accounts for 3 to 4% of U.S. electricity use (Kueck 2000).Because water systems have extensive storage in pipelines and water towers, the pump motorscould be turned off immediately in response to bulk-power-system contingencies. This pumpingload could provide half the nation’s spinning-reserve requirements. Unfortunately, currentreliability rules prohibit the use of such rapid-response loads as spinning reserve.
The three Northeastern ISOs as well as the California ISO run markets for 10-minutespinning and supplemental reserves and either 30-minute (Northeastern ISOs) or 60-minute(California) replacement reserves. None of the ISOs runs a market for load following;implicitly, this service is captured in their intrahour energy markets (5 minutes for theNortheastern ISOs and ten minutes for California). The ISOs do not run markets for backupsupply because the longer-term nature of this service removes it from the ISOs’ reliabilityresponsibilities.
Although loads can, in principle, provide any of these services, in general they are notdoing so. Only in California are some loads participating in ancillary-service markets: aboutone-third of supplemental reserve and 1% of replacement reserve comes from loads.Specifically, a couple of large government water agencies provide about 300 MW, on average,of supplemental reserve.
In February 2000, the California ISO (2000a) issued a request for bids inviting loadsgreater than 1 MW to participate in its 10-minute nonspinning-reserve and 60-minute reservemarkets as well as its supplemental-energy (real-time) market. The ISO was hoping to obtainabout 400 MW in each of the two reserve markets plus 1,000 MW in the supplemental-energymarket. The ISO received six bids for 400 to 500 MW in all three markets. Ultimately, the ISOsigned Participating Load Agreements with about 230 MW of this load.
Load responses were limited because of the ISO’s stringent requirements for real-timedata. (The ISOs’ metering requirements are more relaxed for the voluntary load-reductionprograms, presumably because the load-response time is an hour instead of 10 minutes fornonspinning reserve.) The ISO standards for metering and telemetry of load data from thecustomer’s meter to the ISO are based on its historical practice with generation, which calls fordata transmissions every four seconds. The ISO believes that it must have such frequent datato comply with reliability requirements.* To accommodate loads that have meters that are readless often, the ISO adopted the concept of an Aggregating Load Meter Data Server, a data-acquisition and processing system that collects data from individual loads and passes theaggregate data to the ISO’s computer system. Although the data server would be required tosend data to the ISO every four seconds for nonspinning reserve (once a minute for replacement
34
reserve), the individual loads could report data to the data server at one-minute intervals (onceevery five minutes for replacement reserve).
Loads wanting to sell nonspinning reserve are required to be able to reach their load-reduction commitment within 10 minutes and maintain that reduction for at least two hours.Loads wanting to sell replacement reserve are required to reach their load-reductioncommitment in no more than 60 minutes and, once again, maintain that reduction for at leasttwo hours.
Most of the load that planned to participate in the ISO’s ancillary-service markets wasalready participating in existing utility interruptible programs and, therefore, subject to approvalfrom the California PUC. (Some parties were concerned that loads might get paid twice for thesame interruption, while others felt there would be no overlap because the utility programs andancillary-service requests would be called at different times and for different reasons.) Becausethe PUC had not ruled on such participation by November 2000, there was essentially no newparticipation by loads in the ISO markets (California ISO 2000b).

*We know of one utility with about 500,000 customers for which the largest 600 customers (all ofwhich have 5-minute interval meters) account for 60% of total load. We know of another utility for whichthe largest 15 customers represent 20% of total load.
35
CHAPTER 4
CUSTOMER CHARACTERISTICS
This chapter discusses various factors that might affect a customer’s interest in andability to participate in programs that modify the timing of electricity use. First, however, weexamine the distribution of customers by energy use and demand. The infrastructure costs ofmetering, communications, and control are, to some extent, independent of the magnitude ofload. Therefore, it is useful to know, roughly at least, how large customer-specific loadreductions must be to justify the infrastructure costs.
Nationwide, the 538,000 industrial customers represent 0.4% of all customers but 30%of total demand (Edison Electric Institute 1999), equivalent to about 200 GW of demand at thetime of summer peak. As illustrated in Fig. 8, a very small percentage of customers (1% in thecase of this utility) account for a substantial share of total electricity sales and demand (about50% in this case). A mere 0.01% of this utility’s customers account for 16% of its total load;0.1% of its customers account for about one-third of its total load.*
These results show that large benefits can likely be achieved by offering dynamicpricing and related programs to a tiny fraction of the nation’s electricity consumers. In otherwords, your grandmother need not worry about responding to dynamic pricing.
In addition to size, customers differ in their hour-to-hour load shapes and energyintensity, as shown in Fig. 9 (Rabl 2000). The top part of the figure shows the typical weekdayload shapes for four types of commercial facilities. Overall, grocery stores and restaurants aremore electricity intensive than office and retail facilities. However, the latter two building typeshave much lower load factors (about 60% relative to the roughly 80% for the two other buildingtypes).
The bottom part of Fig. 9 shows how various commercial building types differ in overallenergy intensity for lighting and air conditioning. Facilities on the left of the graph may be goodcandidates for load management because they use more electricity for these end uses to beginwith.

36
2021
0
10
20
30
40
50
60
70
80
90
100
0.001 0.01 0.1 1 10 100
CUMULATIVE % OF CUSTOMERS
CU
MU
LAT
IVE
% O
F L
OA
D
1% of customers account for 52% of total load
Fig. 8. Cumulative load as a function of the cumulative number of customers for anelectric utility. Note that the horizontal axis is logarithmic.
The value of certain end uses, such as air conditioning and space heating, is very timesensitive. Customers want to cool their buildings during hot summer days and heat them duringcold winter days. The thermal storage implicit in these end uses make them good candidatesfor short-term (less than an hour or so) interruptions. On the other hand, some end uses, suchas clothes washing and drying, can be shifted from one hour to another with little loss incustomer service. In California, residential clothes dryers use almost 1,000 MW of load at thetime of system peak (Reed 2000). Agricultural water pumping for irrigation accounts for anadditional 2,200 MW. If residential and agricultural customers faced dynamic pricing, theymight willingly shift these loads to lower-cost hours.
Customers differ in the flexibility of their operations, including the speed and ease withwhich they can reduce load and then later increase load. Some customers may be able tointerrupt loads for short periods but not for several hours. On the other hand, some customersmay be able to interrupt loads economically only if they are paid for the interruption overseveral hours (e.g., a full shift). As shown in Fig. 10, the distribution of high-price hours canbe very nonuniform. In this case, the California PX prices from July 1999 through June 2000,prices exceeded $100/MWh for 260 hours. On eight occasions, the price was above $100/MWhfor two consecutive hours. At the other extreme, the price remained above this level for 11 ormore hours 11 times (including one time for 17 hours).

37
2018
0
1
2
3
4
5
6
7
8
9
10
1 3 5 7 9 11 13 15 17 19 21 23
BU
ILD
ING
LO
AD
(W
/ft2 ) Grocery
Restaurant
Office
Retail
2018
0
2
4
6
8
10
12
Health
care
Food s
ervic
e
Food s
ales
Office
Merca
ntile
& Ser
vice
Lodg
ing
Public
asse
mbly
Public
orde
r & sa
fety
Educa
tion
War
ehou
se &
stor
age
EN
ER
GY
INT
EN
SIT
Y (
kWh/
ft2 )
Lighting Cooling
Fig. 9. Customers differ in their ability to modify their loads, in part as a function oftheir daily load shape (top) and annual intensity of use (bottom).

38
CAPXprices
0
2
4
6
8
10
1 2 3 4 5 6 7 11-17
NUMBER OF CONSECUTIVE HOURS (7/1/99 - 6/30/00)
NU
MB
ER
OF
OC
CU
RR
EN
CE
S
Fig. 10. The number of times prices exceeded $100/MWh in the California PowerExchange day-ahead market as a function of the duration of these high prices.
Finally, customers differ in whether they have automated controls for some of theirelectricity-using equipment. For example, many commercial facilities have building automationsystems, which automatically adjust ventilation levels, chiller operations, and lighting levelsas functions of outdoor conditions and facility use. Providing these control systems withinformation on hourly electricity prices permits automatic adjustment of equipment to savemoney on electricity bills and maintain occupant comfort, health, and safety.
The Marriott Marquis (with a peak demand of 6 MW) in New York City offers aninteresting case study on the benefits of automatic control. This project, which involved thehotel, Consolidated Edison (the local utility), and EPRI, linked real-time price information fromthe utility with the hotel’s energy-management system (EMS). The EMS controls hundreds ofparameters to manage heating, ventilation, air conditioning, lighting, and other loads. Tooptimize building energy use in response to hourly prices would require either operators tomake manual adjustments several times a day on set points and start/stop times for variouspieces of equipment or an electronic link between the price signals and the EMS. Implementingthis linkage was not trivial in the mid-1990s when this project took place (Hoffman and Renner1997): “Software was needed at the utility to prepare the real-time prices, a communicationsystem was needed so that the utility could ‘talk RTP’ with the customer, and a controller wasneeded at the customer site to decide how to manage loads.”

39
The Marriott project demonstrated all these systems and their successful integration. Thecommunication links between the hotel and utility used ordinary phone lines for two-waycommunication. The Marriott system included indoor air-quality sensors used to adjustventilation levels; the system also precooled conference rooms and ballrooms as a function ofhourly prices. This hotel saved $500,000 a year from this combined system of RTP andautomated controls, primarily through reductions in electricity costs for air-handling units (60%of total), chillers for air conditioning (20%), and exhaust fans (16%). Overall, integration ofRTP data with the hotel’s EMS increased the load reductions from about 3% of total load (withmanual responses) to almost 20%.
Automatic control (e.g., of chiller shutdown and restart) permits a facility to achieveload reductions and cost savings on all days, not just on those when prices are very high.Manually controlling equipment to respond to dynamic prices makes sense primarily when highprices occur infrequently and predictably. Automatically controlling equipment permits thebuilding owner to save energy and money whenever prices are above their average values.Although the per-hour savings are smaller on average, the number of hours when savings occuris so much higher that automatic controls are often justified.
Customers who have either product- or thermal-storage capabilities (e.g., water-heatertanks and air-conditioned spaces) might easily provide load reductions for the 30 to 60 minutesrequired for contingency reserves. Such customers might find it more difficult to participate inload-reduction programs that required curtailments for a few hours.

40

41
LOAD-SERVINGENTITY
CUSTOMER
Automatic orManual
Responseto Prices
IntervalMeter
Interval kWh Data
Hourly Prices
Data/Analysis on Electricity Use/Costs
2016
Fig. 11. Dynamic-pricing and load-reduction programs require interval meters,communication systems to move data and instructions between the customerand its LSE, and perhaps automatic-control systems that respond to time-varying prices.
CHAPTER 5
METERING, COMMUNICATIONS, AND COMPUTING
Implementing the kinds of programs discussed here requires various technologies(Fig. 11). To begin, customers must have meters that record, store, and communicate data ontheir electricity use at the hourly or subhourly (e.g., once every 5 minutes) level. Second, theLSE must be able to provide price and interruption-request information to the customer in atimely, usually automated, fashion. Similarly, the customer’s interval kWh-consumption datamust be transmitted periodically to the LSE. The LSE may provide additional data and analysison the customer’s electricity use and bill-saving options to the customer. Finally, based on thesedata and analysis, the customer needs to implement control actions, either automatically ormanually, to manage electricity use and costs. This chapter discusses these technologies andhow they enable customer participation in wholesale markets.
The type of program and kind of customer response determine how quickly informationmust be transmitted from the LSE to the customer and from the customer to the LSE. Forexample, if the customer is participating in a day-ahead dynamic-pricing program, the LSEneeds to communicate with the customer only once a day. Indeed, the LSE can post the nextday’s 24 hourly prices on its website; customers can then access these data at their convenience.On the other hand, if the customer is providing nonspinning reserve, the RTO (perhaps actingthrough the LSE) may issue customer-specific control signals on a minute-by-minute basis innear-real time (e.g., reduce your load by 2 MW within 10 minutes).

42
The frequency with which the customer’s electricity-use data must be transmitted to theLSE also varies. Although all these programs require that the customer’s load data be measuredand stored hourly or subhourly, these data need not be reported to the LSE more often thanonce a month. For example, a customer participating in a dynamic-pricing program would needa meter that records and stores hourly consumption data. But the LSE needs that data on onlya monthly basis for billing purposes. On the other hand, if the customer is participating in aload-reduction program, the LSE might want to know the load reduction as it occurs, in whichcase the communication from the customer’s meter to the LSE needs to be either much morefrequent or based on a system that permits the LSE to poll the customer’s meter at any time.
If the customer participates in a program that provides it with current information on itselectricity use, ways to reduce that use, and current prices, the LSE will need frequent accessto the meter data so that it can analyze these data and provide the customer with the results ofits analysis. Alternatively, the customer’s electric meter could communicate directly with itscomputer or EMS. This second approach requires a meter with multiple communication portsthat can send data to both the customer and the LSE and customer-side software that convertsraw meter data into useful information.
Because of the factors discussed above, it is difficult to estimate the costs of theseenabling technologies. Table 6 offers a broad range, suggesting an annual cost of $30 to $250per residential or small commercial customer. For large commercial and industrial customers(which use about 100 times more electricity than residential and small commercial customers),the range in annual cost is roughly $100 to $800.
Table 6. Approximate costs for metering, communication, and decision-supporttechnologies
Residential andsmall commercial
Large commercialand industrial
Interval meter $50 (retrofit) to$200 (new meter)
$250 to $1,000 (new meter)
Communication systems (from LSE tocustomer and from meter to LSE) plusanalysis software
$2 to $20/meter-month
$5 to $50/meter-month

*The frequency with which the meter stores the consumption data depends on the kinds of programsthe customer might participate in. A meter that records hourly data is sufficient for a customers who plansto respond to hourly prices. A customers who wants to sell spinning reserve to the system operator, on theother hand, might need data recorded once every five minutes.
43
METERS
Meters differ in what they measure and how frequently they do so (Otero-Goodwin1999). Traditionally, utilities have deployed two kinds of meters, one for operations and theother for billing. Operational meters collect and transmit data to the control center once everyfew seconds but are not very accurate. Revenue meters, on the other hand, take longer tomeasure and record electricity use but are sufficiently accurate to use for billing. Use of revenuemeters to make real-time load-control decisions is difficult because these meters reportconsumption only at the end of each interval.
Meters for residential and small commercial customers usually measure single-phasereal energy use only. Meters for large commercial and industrial customers measure three-phasedemand and energy and may also measure reactive-power consumption and power-qualitycharacteristics. The traditional residential meter records cumulative electricity use, typicallyread once a month by a meter reader who walks from house to house reading the dials on eachmeter. Advanced meters record and store (within the meter) electricity consumption at muchfiner intervals of 5, 10, 15, 30, or 60 clock-synchronized minutes.*
For residential and small commercial customers, it may be cost-effective to retrofit theirexisting meters. These upgrade packages include a pulse initiator (that generates an electricalpulse for every revolution of the meter disc), a data recorder (that records the number ofpulses), and a communication interface. These packages permit the capture of electricity-usedata at 15-minute intervals with communication of that data to the LSE on a daily or weeklybasis. The cost of such upgrade packages is roughly $50 to $200.
For new installations, larger customers, or more sophisticated applications, a newelectronic solid-state meter may be installed. Such meters range in cost from $200 to more than$3,000, depending on their capabilities. The price range is so large because these meters differin the number of channels of data they record, the amount of data that can be stored within themeter, the number of communication ports, and the communication medium. Fourmanufacturers dominate this market: ABB, General Electric, Schlumberger, and Siemens.
Expanding meter functionality can spread these costs over more purposes. Someadvanced meters can accept data from gas and water meters and can transmit that data to theappropriate utility. Some meters can accept inputs from customer alarms, such as those thatprovide notification of flooding, freezing, or meter tampering.

44
COMMUNICATION SYSTEMS
Price Communication from LSE to Customers
As with all products, customers have to know the price (or have a reasonableexpectation of what the price will be) before they can make consumption decisions.Historically, fixed prices were communicated through published tariffs. This type ofcommunication is adequate for prices that do not change or for prices that change with a fixedpattern, such as TOU rates.
Automatic price communication is required to communicate time-varying market-basedprices. Because customers are generally price takers, price signals can be broadcast to all theapplicable loads simultaneously. Therefore, the LSE need not send a unique message to eachconsumer.
The frequency with which prices need to be communicated depends on the market theconsumer participates in. It may be acceptable to take several hours to deliver day-ahead energyprices. Real-time prices (e.g., those that are produced by the ISOs’ 5- or 10-minute markets)must be delivered within minutes. The communication system for transmitting such real-timeprices must be automated and integrated with the ISO that operates the real-time market.
Price communications need to be reasonably secure. If the prices are public information(as with a clearing-price power exchange), eavesdropping is not a concern, but injection of abogus price could be very disruptive.
Several technologies are used today to communicate real-time price information,including fax, telephone, e-mail, pagers, PC-to-PC communication, and the Internet. E-mail iscurrently the most popular choice because it is cheap and easy to automate. In some cases, thecustomer determines when it wants to obtain current price data, possibly downloading from aweb site. In other cases, the supplier initiates the communication either when prices change oron a regularly scheduled basis, usually by e-mail or possibly by telephone. In either case, thecommunication is with the customer’s staff, computer, EMS, or end-use equipment (e.g.,thermostat), not with the electricity meter.
Communicating price signals over the Internet (i.e., posting prices on a website) ischeap, easy to use, and provides broad access to customers. It is much simpler for an LSE tohost a web site than to establish telephone communications with each customer in a largegroup. Communications with customer personnel by telephone, pager, e-mail, or web site iseasier than communicating with customer equipment. Standards will be required on the datato be transmitted as well as the communication protocols before machine-to-machinecommunication becomes cheap and widespread.

*AMR offers benefits beyond those applicable to dynamic pricing, such as more accurate meterreadings, shorter lag times between meter reading and bill preparation, reduction in the need for estimatedreadings, and elimination of the personal hazards associated with manual reading in some locations (e.g., adog in the backyard).
#Power-line carrier (PLC) communications have also been used, but most new systems use telephoneor radio networks. PLC systems are expensive because they require shunts around distribution transformers,and their data-transfer rates are slow.
45
Consumption Communication from Customer Meter to LSE
The kilowatt-hour consumption data recorded by revenue meters must be transmittedto the LSE and to the customer to guide load-control actions. For the vast majority of electricityconsumers, meters are read manually once a month by meter readers. Although this process isslow, it is cost effective for customers with time-invariant prices, typically costing less than$1/meter-month (Taub 2000).
Automated-meter reading (AMR), now in use for 5 to 10% of the nation’s electricitymeters, is required to record and communicate electricity-use data at the hourly or subhourlylevel (Nesbit 2000).* Two technologies dominate the AMR field, telephone and fixed radionetworks (Skog 2000).#
Telephone lines are often used to communicate with meters, usually through a telephonemodem. The data transmission can either be initiated by the LSE (called outboundcommunication) or by the meter (inbound communication). In both cases, the communicationcan be conducted with the same phone line the customer uses; in some cases, a separate phoneline is installed, which increases the cost of this option. Another option is to use a dedicatedcellular or satellite phone, which would substantially increase costs. This option is useful forloads that do not have standard telephone access, such as billboards, street lights, and irrigationpumps.
For inbound communication, the meter is programmed to call a phone number (eithera local number or a 1-800 number) at certain times (e.g., at 2:30 am every night). The metermodems are smart enough to recognize when the phone is in use and will then place their phonecall later. These modems can also recognize when the telephone is picked up while they aretransmitting data to the LSE; they immediately terminate their use of the phone to permit thecustomer to use the phone and then resume data transmission later.
Outbound communication provides more flexibility for the LSE, permitting it to poll themeters whenever it wants to. On the other hand, the LSE now has to manage all these phonenumbers and needs a ringless technology (so the customer does not hear the phone ring whenthe LSE calls the meter).
*Some AMR systems use mobile radio networks, in which a person walks or drives past each meterand uses a hand-held transmitter/receiver to read meter data. Such mobile systems are relatively inexpensive,but their ability to support dynamic pricing and load-reduction programs is very limited.
#The meter needs a transmitter so it can send kWh-consumption data to the pole-mounted unit. Itneeds a receiver so the system can tell the meter when to report data.
46
Typically, the phone calls last from 20 seconds to connect and transfer 24 hourlyconsumption values to 90 seconds to connect and transfer hourly data for a full month. Thesetimes are short if the system needs to read only a few meters, but can cause problems if thesystem must read thousands of meters.
Phone systems can be used for customers who are geographically dispersed. Where theloads are densely packed, fixed radio systems may be preferred.* In such systems, each meterhas a transmitter/receiver attached to it.# Radio transmitters/receivers are mounted on utilitypoles or outside walls of buildings, situated so they can “see” the meter-mounted radio systems.The pole- or wall-mounted systems then communicate with central transmitters/receivers,which in turn send the electricity-consumption data to the LSE’s central computer.
Because radio systems do not rely on phone lines, they can communicate with the metersat any time. Communications are faster with fixed radio networks than with telephone systems.For low volumes, readings can take less than 10 seconds per meter. Such systems are usedtoday to serve commercial and industrial customers. For high volumes, up to 100,000 meterscan be read per hour, but this increases the processing time greatly. In most high-volumeapplications, the systems collect and deliver a daily read file for a million or more end pointsby 8 am next business day. As the market moves to more dynamic pricing scenarios, CellNet,a major provider of fixed radio networks, envisions having to deliver data within the next hourof use (Eskew 2000).
The costs of fixed radio systems depend on the number of customers connected to thesystem, the geographic density of the customers, the topology of the area (which affects thepropagation of the radio waves), and the location of meters (indoors vs outdoors). Fixed-radionetworks are lowest in cost when all (or almost all) the customers in a particular area are servedby the same communication system. These radio systems are typically owned and operated bythird-party vendors, which sell the service to utilities on a dollar-per-meter-month basis. Thecosts vary from about $1 to $5/meter-month, depending on the frequency of meter reading andthe amount of data transferred (Eskew 2000).
ANALYSIS, DECISION, AND RESPONSE SYSTEMS
Communicating price signals from the LSE to the customer and consumption data fromthe customer to the LSE is, technically speaking, all that is required for customer participationin dynamic-pricing programs. But the benefits of such participation are much greater if the

47
customer responds intelligently to these price and consumption data. Customers, based on thisinformation might decide to:
� Do nothing and continue to consume electricity as before,� Respond to price changes by manually adjusting consumption,� Respond to price changes by automatically adjusting consumption, or� Invest in new equipment and controls to expand the range of possible responses.
In some cases, consumers might like to see data and analyses of their energy bills on amonthly or quarterly basis. They may use this after-the-fact data to decide on appropriateoperations and maintenance changes or capital investments that, on a long-term basis, will cost-effectively reduce their electricity bills. In such cases, the meter resolution is hourly but thecommunications can occur infrequently.
Other customers will choose to respond closer to real time. For these customers, LSEsmay provide data and analysis tools that help customers decide what to do when. Such systemscan be especially helpful to customers who decide to take manual-control actions only duringthe few hundred highest-priced hours during the year. Systems such as Silicon Energy’sEnerscape software (and similar packages from iTron and Active Energy Management) canfacilitate such decision making.
If the customer plans to respond routinely to price changes, automatic response is morepractical. Johnson Controls and Honeywell market systems that integrate electricity-price datawith their automated EMSs. In general, these systems use the Internet to communicate withcustomers, although pagers are also used. The Honeywell system was tested at a few largefacilities and demonstrated savings of 10 to 20% through automated response to dynamic prices(Kiernan 1999).
Carrier Electronics developed a thermostat for residential application that, upon receiptof a control or price signal from the LSE, can adjust air-conditioning or space-heatingtemperature settings up or down. Puget Sound Energy conducted a small Home ComfortControl pilot program during the 1999/2000 winter season (Boice 2000). The program featureda two-way radio-communication system from Schlumberger, programmable thermostats fromCarrier Electronics, and energy management and Internet services from Silicon Energy. Theprogram tested customer comfort and acceptance of 2o and 4o F decreases in temperature settingfor two hours at a time, periodically invoked by the utility. Customers could, at a cost of $2 perevent, override the utility setting. The pilot program demonstrated the reliable operations andintegration of the technologies and very high customer satisfaction with the program.
Cannon Technologies (2000) has more than 250 load-control systems installed for allkinds of electric utilities. Its Internet-based system can implement various strategies to cycleequipment on and off, control generators and irrigation pumps, and manage other electricity-using equipment based on price changes. Cannon reduces the infrastructure burden for the LSE

48
by creating a private load-control master station on its server. Communications from its serverto the loads is via 900-MHz FLEX™ national paging. By integrating the system with real-timemeter data, Cannon provides a complete system for monitoring and controlling demandanywhere in the country. Utility Data offers similar capabilities using telephone lines forcommunications.
Apogee Interactive operates an Internet-based demand exchange, that permits customersto bid load reductions to their LSE. The PGE and GPU Energy programs discussed in Chapter 3use the Apogee system, as do programs run by the Bonneville Power Administration, Entergy,and other utilities (Gilbert 2000). Apogee developed software to calculate customer-specificbaseline load shapes (based on prior consumption, weather data, and other factors) that can beused to determine the extent of actual load reductions. Apogee has about 2,800 MW of loadreduction under contract, involving more than 500 customers of all types. For the utility, thisis a free call option in return for which the electricity-bill savings are shared (often 50:50)between the customer and the utility.
Future technology developments might lower the cost of communication to the end userand, especially, communications within the end-user’s facility. Developments in wirelesscommunications over short distances may make it possible to easily interconnect meters to thetelephone system, the Internet, and individual electricity-using equipment throughout thefacility. For example, a “smart” refrigerator might receive data on current electricity prices and,based on the contents of the refrigerator and the temperatures in the freezer and refrigeratorcompartments, turn off the compressor for an hour or two. Such distributed intelligenceconnected by a fast and inexpensive communication system should permit broader, easier, andmore effective responses to time-varying electricity prices. Such systems have applications farbeyond electricity, affecting natural gas use, water use, and appliance repair.
In addition, standardization can help lower the costs of advanced meters andcommunication systems. The tasks required of these systems are no more complicated thanthose performed by devices like cell phones, pagers, and calculators. To realize cost reductionsrequires mass production, which should not be a problem, given the existence of 125 millionelectric meters in the United States. Such mass production, however, requires standardizationof the functions, communication protocols, and markets so that inexpensive devices can bedesigned and manufactured.

49
CHAPTER 6
PROGRAM AND PRICING PROVIDERS
Chapter 3 discussed a sample of current programs, most of which are offered by thetraditional utilities. This chapter discusses the potential roles of various entities, includingRTOs, nonutility LSEs, and the incumbent utilities. We also discuss the actions FERC and stateregulators could take to encourage greater customer participation in bulk-power markets.
REGIONAL TRANSMISSION ORGANIZATIONS
In some respects, the RTOs are logical candidates to promote demand-side participationin their markets. They run many of the day-ahead, hour-ahead, and real-time markets for energyand ancillary services. Because they are responsible for making these markets efficient andcompetitive, they are interested in expanding the range and diversity of resources participatingin these markets. On the other hand, the RTO markets are wholesale, and the issues this reportdiscusses concern retail customers. The RTOs are structured to deal with a few marketparticipants, each of which is responsible for hundreds (or at least tens) of megawatts ofdemand or supply. The RTOs are not set up to interact with thousands (or millions) ofcustomers. Perhaps, the issue is whether the manager of wholesale markets has a responsibilityto ensure easy access for retail customers and their providers.
As a practical matter, the existing ISOs are becoming more active in soliciting demand-side participation in their markets. The ISOs operated various small scale, experimentaldemand-side programs for summer 2000 (Chapter 3) and are planning expanded and improvedprograms for 2001. On the other hand, none of the ISOs (or the California PX) has yetinvestigated the reasons for the very limited participation in their hourly energy markets byprice-responsive load or done much to encourage such participation.
At a minimum, the RTOs must ensure that customer loads are in no way prevented fromparticipating in RTO markets. Just as the ISOs have developed many rules and procedures todeal with the idiosyncracies of different types of generation, so must the RTOs develop rulesthat accommodate differences between the loads and generators (as well as among differenttypes of loads) that might participate in their markets. Figure 12 illustrates some of thecomplexities that occur in dispatching generators to maintain the necessary near-real-timebalance between generation and load. Although it is convenient to think of a simple “stack” ofresources that differ only in price, the intertemporal constraints of many generators make theoptimal scheduling and dispatch solution difficult to achieve. In this example, the generatorsin the bid stack differ in their ramp rate, speed with which they can change direction, minimum

*For example, the California Department of Water Resources has a pumping load that ranges from1,000 to 2,600 MW (Radford 2000). The Department can turn these pumps off almost instantaneously, butit cannot meet the ancillary-service requirements of the California ISO to restore the load within 10 minutes
50
2020
0
5
10
15
20
25
30
35
-300 -200 -100 0 100 200 300 400
CAPACITY BID (MW)
PR
ICE
BID
($/
MW
h)
1 MW/minuteramp rate
5 MW/minuteramp rate
Offline CT:2-hr minimumruntime
100-MW CT:block-loaded
Can't turnaroundfor 45 minutes
Fig. 12. Supply bid stack for an RTO’s real-time balancing market, illustrating some ofthe complexities caused by the operating limits of some generators.
runtime, and ability to operate at less than full output. This graph does not show thecomplexities associated with energy-limited hydro units, which may have daily water budgetsand other environmental restrictions on their operation.
Consistent with the many rules that reflect and respect differences among generators,RTOs must accept differences among the loads that might participate in their markets. TheRTOs cannot simply require that loads conform to the existing supply-side rules because thoserules were developed with generators—and only generators—in mind. For example, some loadsmay be able to reduce their output very quickly and can therefore provide contingency reserves.However, some such loads may not be able to return to their precontingency consumption levelwithin the RTO-prescribed time, say 10 minutes. Rather than prohibiting such loads fromparticipating in reserve markets, the RTOs should examine the basis for the 10-minuterestoration rule and decide whether a longer period of reduced load might be acceptable.(Resources must be restored to their pre-contingency levels when directed to do so by the RTOso they can, once again, be ready to respond to the next contingency.) Perhaps a load thatcannot increase consumption for at least two hours after reducing its load in response to acontingency should be permitted to participate in contingency-reserve markets but get paid alower price than resources that can return to their precontingency state within 10 minutes.*

of being directed to do so. The pumps must remain off for at least 30 minutes (analogous to the minimumruntimes of some generators) and can then be turned back on at the rate of 20 MW/minute (e.g., an hour torestore 1,200 MW of pumping load).
51
The RTOs can play important roles in two other ways. First, they must ensure that theirresource scheduling and dispatching software can accept bids from customer loads as well asfrom supply resources. Not all of the software used by today’s ISOs can appropriately handleprice-responsive load. Second, the RTOs should review their metering and telecommunicationrequirements. The typical requirement is for metering and telecommunication of generatoroutput to the RTO control center every four to six seconds. While obtaining data from largegenerating units so frequently may make sense, it may not be necessary for small loads. Systemoperators monitor the output from large generators so frequently because the failure of any oneunit must be compensated for immediately. Because almost all loads are tiny compared togenerators, the statistical averaging across loads reduces greatly the need to monitor theconsumption of individual loads. Also, it is inherently more reliable to turn something off (e.g.,interrupt a load) than to turn something on (e.g., start a combustion turbine to providecontingency reserves).
The RTOs need to be sure that the metering and telecommunications requirements theyimpose on participating loads are consistent with the RTO’s reliability responsibilities. Forexample, the California ISO (2000a), in its effort to encourage load participation in itsancillary-service markets, relaxed the frequency with which individual loads must record andreport their consumption from once every four seconds to once a minute. Because these loadsare required to respond within ten minutes of an ISO request, it is hard to see why the ISOwould need to know the consumption levels of these loads more often than once a minute.Although the RTO needs to be able to measure the performance of loads in delivering servicesto the RTO, it may not need to make these measurements in real time.
Finally, RTOs can encourage dynamic pricing and load-reduction programs byproviding appropriate accounting, billing, and settlement services. Such functions are neededto accurately track the benefits of these load reductions and assign them to the correct LSEs.
LOAD-SERVING ENTITIES
LSEs may be the best candidates, in competitive markets, to offer a variety of risk-management options to their retail customers. They have direct contact with retail customers,they have direct contact with wholesale markets, and they have the appropriate economicincentives to manage retail loads. Because these entities bridge wholesale and retail markets,they should be in the best position to offer and profit from a full range of pricing options.Indeed, much of the customer-choice benefit of retail competition should derive from the abilityof LSEs to identify and act upon customer preferences for risk management and other services.In addition, the LSEs’ aggregation functions may obviate the need for the RTOs to consider therequirements and costs of communicating with thousands of small loads.

52
Our conversations with representatives of LSEs suggest that few are offering suchpricing options today. The focus of LSE marketing efforts seems to be on building market sharethrough the offer of price discounts. The LSEs see several obstacles to their provision of risk-management services. First and foremost, the LSEs emphasize the tremendous regulatoryuncertainty about standard-offer service, provider-of-last-resort requirements, the status ofincumbent utilities, and stranded-cost recovery. If, for example, the state regulator requires thelocal utility to provide a discounted, guaranteed rate as part of the standard offer, the LSE willhave a very difficult time selling dynamic pricing to potential customers.
Second, LSEs are not sure who owns and who has rights to the metering andcommunication infrastructure required to implement such programs, as well as to the data thesesystems produce. In many states, the PUC has not yet determined whether these functions areto be provided exclusively by the distribution utility, subject to competition, or provided by anyentity other than the distribution utility. Until the rights and responsibilities for meters, meterreading, communications, and data are resolved, LSEs are reluctant to invest in the equipment.
DISTRIBUTION UTILITIES
Whether distribution utilities should offer such programs depends on whether the utilityis a wires-only company or is permitted (or required) to remain in the retail-service business.Again, the role of the state regulator is paramount here. At the moment, most utilities retainretail responsibilities, such as the standard offer for those customers who do not choose anothersupplier, for those customers who leave another supplier, and for all customers where retailmarkets have not yet been opened to competition. It is for these reasons that most of theprograms discussed above are operated by utilities.
In addition, distribution utilities may lose money if they encourage customers to reduceloads. This earnings loss can occur if utility revenues, but not costs, depend primarily on energyand demand charges (in ¢/kWh and $/kW-month) rather than customer charges (in $/month).
FEDERAL ENERGY REGULATORY COMMISSION
On the regulatory side, it is unclear whether FERC has any direct jurisdictional authorityover demand-side participation in wholesale markets. However, FERC can ensure that RTOmarket rules and tariffs present no unfair obstacles to such participation. Indeed, FERC canrequire RTOs to fairly and fully accommodate load participation in such markets.
In addition, FERC should recognize that its approval of price caps in ISO markets canthwart demand-side participation in these markets. The programs discussed in Chapter 3suggest that customers are unlikely to participate in voluntary load-reduction programs unlessthe price for such reductions exceeds about $250/MWh. (Clearly, customers who face dynamicprices do respond to prices below $250/MWh.) Thus, the California price cap of $250/MWhmay effectively eliminate demand-side participation in such programs; the $1,000/MWh capsin the Northeastern markets may not inhibit demand participation.

*PUCs might require all large consumers (e.g., with demands greater than 20 kW) to have intervalmeters. Such meters permit large customers to respond to dynamic pricing and load-reduction programs andprovide a strong incentive to their LSE to manage the timing of their electricity use.
#If PUCs permit utilities to offer competitive retail energy services, they may require the companyto be split into a regulated delivery entity (wires only) and an unregulated retail provider. As part of thisseparation process, PUCs need to decide whether meters and related services should remain with the wirescompany or be considered contestable.
53
Given the critical importance of price-responsive demand to the successful operationof competitive wholesale markets, FERC might encourage such participation. It could do sothrough its authority to permit generators to sell power at market-based (vs regulated) rates, itsapproval of RTOs under Order 2000, its mitigation of market power, and its approval ofmergers and acquisitions.
PUBLIC UTILITY COMMISSIONS
On the other hand, PUCs can play powerful roles in encouraging such participation.* Tobegin, PUCs need to decide what functions the incumbent utility may and may not perform.Specifically, is the utility a wires-only company that delivers a product from a customer’ssupplier to the customer’s meter? Or is the utility also in the retail-service business?# If thelatter, is the utility required to provide energy supplies to some or all of the customers in itsservice area? If so, what are the terms, conditions, and prices for such standard-offer service.
If PUCs require local utilities to stand ready to serve any and all customers at a standard-offer rate and if that rate includes a discount, the opportunity, both for other suppliers andconsumers, to have retail loads participate in wholesale markets is greatly blunted. Any suchdiscount, relative to the market price of generation, will ultimately be paid for, either by utilityshareholders or, more likely, by customers at a later time; there is no free lunch! Other supplierswill have great difficulty competing with an unfairly discounted price. Equally important,customers will have no incentive to accept the risks associated with dynamic pricing.
Several LSEs in the northeast, where standard-offer rates are low, offer September-to-May products and then “return” retail customers to the incumbent utility for the high-pricesummer months. This is not how competitive markets should work and is not sustainable.
If, however, the PUC establishes a standard offer that explicitly recognizes the twocomponents of electricity—the kWh product and the risk premium—then the entity providingthat standard offer can earn a reasonable return, and customers will face a reasonable price,neither too high nor too low. (If the standard-offer price is too high, customers will find betterdeals elsewhere; if the price is too low, customers will almost surely be required to repay thesecosts at a later time.) In such situations, customers will have appropriate incentives to acceptsome of the risk premium in exchange for a lower electricity price. And alternative supplierswill have appropriate incentives to offer such price/risk combinations.

54
If the utility is required to provide standard-offer service and that utility has a fuel- andpurchase-power-adjustment clause, the utility has little incentive to manage price or quantityrisks. (In such a situation, the utility might sign forward contracts for some of its electricitysupply, but only if it believes the PUC will not second guess its decisions through subsequentprudency reviews of those contracts.) Any increase in electricity costs is passed through tocustomers, although with some delay. In such situations, customers face strong incentives tomanage their electricity use; however, faced with time-invariant prices and monthly bills,customers have virtually no ability to respond to these temporal changes. This is the situationthat electricity consumers in San Diego faced during summer 2000.
On the other hand, if the utility is not able to recover fully its wholesale power costs andis required to provide standard-offer service, it temporarily faces all the quantity and price risksdiscussed above. In such cases, the utility will likely request a rate increase from the PUC, asoccurred recently in California, and customers will eventually pay these costs. Correspondingly,retail customers face none of these risks in the short term. In this case, PUCs should recognizethe risk-management role that the utility plays and compensate it accordingly.
Metering, communications, and billing represent another area where PUC authority isimportant. PUCs need to decide whether these functions should remain monopolies with theincumbent utility or be made competitive (Gromer 1999). Some metering and communicationtechnologies offer large economies of scale (e.g., fixed radio communications), which arguesfor monopoly provision of these services. On the other hand, competitive markets may spurgreater innovation and attention to customer service, which is especially important fortechnologies like these, that are rapidly evolving. PUC indecision on this set of issues isdelaying greater use of real-time metering, communications, and analysis, the infrastructureneeded to support retail-customer participation in bulk-power markets.
If the PUC permits most customers to be billed on the basis of a representative loadprofile (i.e., with meters that read only their monthly consumption), incentives to respond toreal-time prices are further dampened. “Without a retail market that has a large fraction of finaldemand facing an hourly price for each unit of consumption during that hour that is tied directlyto the wholesale price of electricity during that hour, it is impossible for electricity suppliersto credibly bid into the day-ahead and real-time markets to reduce their demand in response tohigh wholesale prices” (Wolak 1999). The use of predetermined load profiles instead of intervalmeters eliminates all financial incentives the LSE or its customers might otherwise have tomodify loads in response to price changes.
Finally, PUCs can help educate customers about the time-varying costs of electricity andthe benefits to customers of adjusting to these dynamics. In the long term, LSEs will beresponsible for marketing dynamic-pricing and load-reduction programs to customers, butduring the transition period PUCs can play important roles.
*The lack of publicly available data on the potential size of various markets and on the costs andbenefits of various programs are not obstacles. In competitive markets, suppliers should—and have theincentive to—determine what works and what does not.
55
CHAPTER 7
BARRIERS
The previous chapters suggest substantial potential for price-responsive demand andlarge benefits, both to participating customers and to electricity consumers in general, fromsuch behavior. Given these large benefits, why is so little happening today? And what can bedone to realize more of that potential? We see three sets of obstacles: regulatory, technical, andinstitutional.*
REGULATORY OBSTACLES
In our view, the rules that state regulators have established governing retail competitionare, perhaps inadvertently, limiting customer participation in dynamic-pricing programs. Evenwhere retail competition is not in place, PUCs can take steps to encourage consumer responseto time-varying prices.
The key problem, as we see it, is PUC indecision on how to create truly competitivemarkets without inappropriate “protections” for retail customers. As William Weaver, the CEOof Puget Sound Energy, noted (Boschee 2000):
If the wholesale electricity markets are ever going to rationalize themselves, it’sthe end users who ultimately make the buying decisions and they’re the ones thatmust receive market price signals. Under the partial deregulatory scheme in theU.S. today, utilities insulate their customers from market price signals in mostparts of the country. In effect, these utilities are providing their end usecustomers with a valuable hedge … .
In many states, PUCs have mandated rate discounts, imposed rate freezes, andestablished predetermined load profiles as part of the transition to retail competition. Perhapsuncertain about the benefits of competition to retail customers, PUCs have required thedistribution utilities to offer electricity at a reduced price. In some areas, the generationcomponent of the standard offer retail rate is below the wholesale price, which blocks allcompetition. Such discounts will almost surely be paid by consumers later on. As the California

56
ISO (2000b) noted, “The retail rate freeze mutes the incentives for loads to reduce demand attimes of high system load and high prices.”
For example, the standard-offer and default rates in Massachusetts were initially setbelow the market price of power. As a consequence, very few retail customers selected new,competitive suppliers. And, the incumbent utilities wound up deferring more than $100 million,to be recovered from customers later on. More important, customers were not given theopportunity to face dynamic, market-based prices. In recognition of the lack of competition forretail customers, the Massachusetts Department of Telecommunications and Energy, in June2000, ordered the utilities to begin charging market-based rates for default service in January2001 (Electric Power Supply Association 2000).
Key to resolving this problem is explicit PUC recognition that the provision of fixed-price electricity includes an insurance policy as well as the electricity commodity. Asmentioned several times in this report, PUCs, in establishing policies, rates, and earnings forstandard-offer service, must account for these risk-management costs. Such costs must beincluded in the rates customers face, and such costs must be reflected in the earnings that theprovider of the standard-offer service receives for this service. Requiring the incumbent utilityto offer this service at an artificially discounted price will block potential competitors fromentering the retail market and will remove all incentives retail customers might have for otherpricing options. PUCs should be sure the default provider service is a fair deal, for bothcustomers and the provider, but not too good a deal for customers. A deal that is “too good tobelieve” today will have to be paid for later!
If PUCs impose rate caps on the local utilities, the utilities lose money if they runinnovative load-reduction programs and pay for the associated metering and communicationinfrastructure. PUCs may want to modify their policies to encourage such programs.
PUC decisions on metering and related services (billing and access to meter data) arealso critical to expanding price-responsive demand. As Gromer (1999) noted, metering is “theplatform for innovative pricing and service packages.” Causey (1999) wrote: “There istremendous regulatory uncertainty about who eventually will own the meters and relatedequipment and the data generated from meter reading. Thus, utilities are justifiably fearful ofmaking an investment today that might become a stranded asset tomorrow.” We believe thatPUC indecision on these issues is slowing the adoption of the infrastructure technologiesdiscussed in Chapter 5.
This lack of resolution inhibits utilities from installing these systems, for fear thatregulators will either disallow these costs or that they might become stranded. LSEs are unsurewhether they are permitted to install such systems. If they do install these systems, how willthey recover costs if customers switch to a different energy supplier? In the meantime, whatentities have access to customer-meter data? Advanced metering can occur with either a

57
regulated monopoly or a competitive market, but it will likely not occur until regulators decideon the framework for such metering and infrastructure issues.
PUCs can encourage adoption of these dynamic-pricing and voluntary load-reductionprograms regardless of whether retail markets remain regulated or are open to competition.Indeed, many of the programs described in this report are run by utilities under state regulation.A necessary prerequisite for these programs, however, is a competitive wholesale market withvisible hourly prices.
At the federal level, FERC’s acceptance and imposition of low price caps in the ISO andPX markets it regulates will suppress customer participation in voluntary load-reductionprograms. The limited program experience to date (Chapter 3) suggests that consumers will notparticipate in such programs unless the price exceeds about $250/MWh. Indeed, the CaliforniaISO proposed a performance payment of $500/MWh plus a reservation payment of$20,000/MW-month for its summer 2001 Demand Relief Program, well above the current capof $250/MWh. More generally, the greater the risk and magnitude of price spikes, the greaterthe incentives for price-responsive demand. As the California ISO’s Market SurveillanceCommittee noted “Price spikes provide the economic signals for retail customers to make theinvestments necessary to shift their demand in response to high prices” (Wolak, Nordhaus, andShapiro 2000).
TECHNICAL OBSTACLES
As discussed in Chapter 5, all the technical components necessary for dynamic-pricingand voluntary load-reduction programs exist and have been applied in various settings.Unfortunately, the industry has not evolved to the point that standardized (off-the-shelf)equipment and communication packages are readily available. It seems that every program hasto custom design its own enabling infrastructure. To the extent that complete systems involvecomponents from various manufacturers (e.g., meters, communication systems, and data-analysis software), the industry may need to develop standards to ensure that the variouscomponents can work well with each other, regardless of who manufactures what.
Although the evidence we obtained on the capital and ongoing costs of these systemsis sketchy, we believe there is substantial opportunity for cost reductions. In particular, as moreutilities and LSEs offer such programs and the number of installations increases, the cost percustomer should decline. Such cost reductions will permit the cost-effective application of theseprograms to smaller and smaller electricity consumers. The metering, communications, andanalysis tasks are not particularly challenging. Cell phones, pagers, and calculators performmore demanding duties. If the requirements for these services can be standardized, mass-produced electronics can likely dramatically reduce the cost and increase the performance ofadvanced metering. This would facilitate real-time market response for even the smallest load.

58
INSTITUTIONAL OBSTACLES
A variety of traditional practices are limiting widespread adoption of dynamic pricingand related competitive options. Perhaps the greatest barrier here is the widespread belief thatelectricity costs and prices can and should remain time invariant. At the risk of yet anotherrepetition, we emphasize our view that consumers, suppliers, and regulators need to recognizethe risk-management component of electricity pricing. A related barrier is the lack ofexperience with market-based prices that vary from hour to hour and with retail-customerprograms that encourage economic responses to these price changes.
In addition, system operators (today’s vertically integrated utilities and ISOs andtomorrow’s RTOs) have traditionally focused on the supply side and ignored the demand sideof the equation (by assuming, in essence, that demand is completely price inelastic). That is,they maintain reliability by managing generation and transmission assets to meet fixedcustomer demands. However, customer loads, as discussed throughout this report, canparticipate in bulk-power operations to maintain reliability and participate in commercialmarkets. System operators (Chapter 6) need to broaden their thinking to accommodate theunique characteristics of customer loads, just as they have done for the unique characteristicsof individual generating units. Ancillary services need to be defined in terms of their functions,not with reference to the generators that traditionally provided the services. System operatorsshould recognize the reliability benefits of using large numbers of small loads that can respondquickly.
The LSEs need to do additional market research to understand what customers wantfrom their electricity supplier and how customers might respond to different products andservices. More important, LSEs need to offer a variety of price and risk options. As discussedin Chapter 4, customers differ substantially in the magnitude of their electricity consumption,load shape, storage capabilities, automation of electricity-using processes, and other factors thataffect their interest and ability to participate in dynamic-pricing programs. The LSEs and PUCsneed to educate consumers about electricity, its production, costs, and alternative pricing andrisk-management strategies.
Finally, not everyone benefits when loads respond to prices. In particular, generatorslose money when customer demand drops in the face of high prices. Because generatorearnings are very sensitive to price spikes, generator owners might object to RTO efforts toaccommodate price-sensitive loads.

59
CHAPTER 8
CONCLUSIONS
After the summer 1998 Midwest price spikes, the FERC (1998) staff wrote:
The fact that retail customers had no incentive to adjust their usage based onprice contributed to the price spike. Retail competition, coupled with the abilityto respond in real time, could allow customers to see the price of the power theyuse and react accordingly.
Clearly, we must have customer participation in bulk-power markets; otherwise these marketswill not and cannot be truly competitive, and the expected benefits of competition will not berealized.
Fortunately, not much participation is needed to realize large benefits. If even a smallfraction (say 20%) of retail load participates and even if this load exhibits a very low priceelasticity (say 0.1), the effects on price spikes, price volatility, market-power abuses, mix ofnew generation constructed, and overall electricity costs will be substantial (Fig. 4).
The new breed of customer programs differs dramatically from traditional demand-sideprograms. Traditional programs focused on the resource needs of vertically integrated utilitiesand were closely overseen by PUCs. Current and emerging programs focus on customerbenefits and, therefore, emphasize the timing, much more than the magnitude, of electricity use.These programs will be largely independent of regulatory oversight, market driven, and focusedon customer service and benefits—helping customers cut their energy costs. Fundamentally,the new programs recognize the two-part nature of electricity, the commodity and the insuranceservice. Consumers can purchase insurance to protect themselves from the volatility ofelectricity prices. Or they can self insure, avoid the insurance premium, and also manage theirelectricity use in response to time-varying prices.
There is little need to identify resource potential (in MW and cost-effectiveness) becausethat is the role of competitive markets. If customers face dynamic prices or pay appropriateamounts for insurance that protects them from time-varying prices, society need not beconcerned with whether they respond to time-varying costs.
The notion that consumers are indifferent to electricity prices or have no interest inresponding to hourly prices may be true today, given the price discounts and insulation fromprice volatility they enjoy thanks to PUC mandates for standard-offer service. As customersrecognize the inherent volatility of electricity prices and what they pay for risk management,

60
some will likely choose to face prices that vary from hour to hour. And some of the customerswho do not want to deal with dynamic pricing might participate in voluntary load-reductionprograms, in which they can, entirely at their option, cut back during occasional, very high-price hours.
The reliability benefits of customer response to market prices will become increasinglyimportant. In the long run, the distinction between reliability and markets will diminish assystem operators rely more and more on markets to obtain reliability services. Specifically, highprices will signal impending reliability problems. A focus on prices rather than on strictreliability rules will provide much more flexibility and incentive to customers to save money,automatically improving system reliability.
Although the potential benefits of dynamic pricing are large, so too are the barriers towidespread adoption. The greatest barriers are legislative and regulatory, deriving from stateefforts to protect retail customers from the vagaries of competitive markets. PUCs must rethinktheir decisions on standard-offer requirements and competition for metering and relatedservices. If PUCs require distribution utilities to bear the risks of price volatility through ratefreezes, fixed prices, and standard-offer service with prices set too low, it will be impossiblefor competitive retail suppliers to offer innovative risk-management services to potentialcustomers. Although PUCs should not force consumers to face dynamic prices, neither shouldthey make it difficult for consumers to do so. Ultimately, PUCs need to balance their interestin promoting competitive electricity markets with their interest in “protecting” customers,especially residential customers, from the vagaries of such markets. Artificial discounts offeredcustomers today will almost surely be repaid by those customers later on.
Another important barrier is the limited use to date of the metering, communication,computing, and control technologies needed to realize these benefits. These technology barrierswill likely fall as more dynamic-pricing programs are offered throughout the country and asthese functions are standardized, allowing equipment and software manufacturers to harnessthe benefits of mass-produced electronic systems.
The RTOs should work with LSEs and other load aggregators to simplify their data andcommunication requirements so that loads can fully participate in RTO markets. The RTOsshould specify clearly the minimum metering and telemetry requirements consistent withreliability standards. The RTOs should review their existing market rules, in particular thespecial modifications that recognize the unique nature of many generators, and implementcomparable rules that recognize the unique nature of many loads that might participate in theirmarkets. Their focus should be on system reliability, not on their traditional use of generatorsto maintain reliability.
In summary, the convergence of retail competition, wholesale competition, andimproved technologies should greatly expand the type and magnitude of price-responsivedemand. Permitting and encouraging retail customers to respond to dynamic prices will

61
improve economic efficiency, discipline market power, improve reliability, and reduce the needto build new generation and transmission facilities.
ACKNOWLEDGMENTS
We thank Terry Black and Russell Tucker for their advice and encouragementthroughout the course of this project. We thank Barbara Barkovich, Denis Bergeron, CharlesBlack, Terry Black, Eric Blank, Joseph Bowring, Steven Braithwait, Stu Bresler, Robert Burke,James Caldwell, Keith Casey, Richard Cowart, Laurence DeWitt, Michael Dozier, BillEastlake, Timothy Eskew, Ahmad Faruqui, Joel Gilbert, Charles Goldman, Daniel Griffiths,Cheryl Harrington, Steven Huntoon, Daniel Johnson, Meghan Jonee-Guinn, John Kueck, DavidLawrence, Ronald Liberty, Kenneth Linder, Mathew Morey, David Moskovitz, Steven Nadel,Michael O’Sheasy, Paul Peterson, Irwin Popowsky, John Reynolds, Steven Rosenstock, AmirShalaby, John Skog, Linda Sodemann, Rick Starr, Dean Stathis, Thomas Taylor, Tracy Terry,Susan Tierney, and Russell Tucker for providing valuable information for this project,reviewing the draft of this report, or both. Finally, we thank Fred O’Hara for editing the finalreport.

62

63
REFERENCES
C. Boice 2000, personal communication, Boice Dunham Group, New York, NY, August 10.
P. Boschee 2000, “Puget Sound Energy Scores High in Service Quality While Positioning forSolid Growth,” Electric Light & Power 78(9), 18�20, September.
Boston Pacific Co. 2000, An Initial Analysis of Recent Wholesale Prices, Price Caps, and TheirEffects on Competitive Bulk Power Markets, Electric Power Supply Association, Washington,DC, October.
S. Braithwait 2000a, “Residential TOU Price Response in the Presence of InteractiveCommunication Equipment,” Chapter 20 in Pricing in Competitive Electricity Markets, editedby A. Faruqui and K. Eakin, Kluwer Academic Publishers, Boston, MA.
S. Braithwait 2000b, “Customer Response to Market Prices � Evidence from Georgia PowerRTP and Other Sources,” Demand-Responsiveness Workshop sponsored by the CaliforniaPower Exchange, San Francisco, CA, March 24.
S. Braithwait and M. O’Sheasy 2000, “Customer Response to Market Prices � How Much CanYou Get When You Need it Most?”EPRI International Energy Pricing Conference 2000,Washington, DC, July 2000.
S. Bresler 2000, personal communication, PJM Interconnection, Norristown, PA, August.
California Independent System Operator 2000a, Market Participating Load Technical Standardfor Summer 2000, Folsom, CA, February 24.
California Independent System Operator 2000b, Request to Extend Price Caps, Department ofMarket Analysis, Folsom, CA, August 10.
Cannon Technologies 2000, www.cannontech.com, Wayzata, MN, accessed September 20.
W. B. Causey 1999, “Waiting for the Call,” Electric Perspectives 24(1), 23�36,January/February.
D. Caves, K. Eakin, and A. Faruqui 2000, “Mitigating Price Spikes in Wholesale MarketsThrough Market-Based Pricing in Retail Markets,” The Electricity Journal 13(3), 13�23, April.

64
M. Dozier 2000, personal communication, Manager of Contracts, California IndependentSystem Operator, Folsom, CA, August.
K. Eakin 2000, “Connecting Retail and Wholesale Electricity Markets,” Edison ElectricInstitute Conference on RTOs and Market Design, Washington, DC, September 29.
K. Eakin and A. Faruqui 2000, “Pricing Retail Electricity: Making Money Selling aCommodity,” Chapter 2 in Pricing in Competitive Electricity Markets, edited by A. Faruqui andK. Eakin, Kluwer Academic Publishers, Boston, MA.
Edison Electric Institute 1999, Statistical Yearbook of the Electric Utility Industry, 1999Edition, Washington, DC.
Electric Power Supply Association 2000, Retail Electric Competition: Getting it Right!,Washington, DC, October.
Energy Information Administration 1999, Electric Power Annual 1998, Volume II, DOE/EIA-0348(98)/2, U.S. Department of Energy, Washington, DC, December.
T. Eskew 2000, personal communication, Schlumberger, Norcross, GA, October 23.
J. Gilbert 2000, personal communication, Apogee Interactive, Tucker, GA, August 28.
P. Gromer 1999, Competition Comes to Metering: Regulatory Debates and Decisions, EIC-5,E Source, Boulder, CO, May.
E. Hirst 1999, Bulk-Power Ancillary Services for Industrial Customers, Electricity ConsumersResource Council, Washington, DC, June.
E. Hirst and B. Kirby 1998, Unbundling Generation and Transmission Services for CompetitiveElectricity Markets: Examining Ancillary Services, NRRI 98-05, National Regulatory ResearchInstitute, Columbus, OH, January.
S. Hoffman and R. Renner 1997, “Taking Advantage of Real-Time Pricing,” EPRI Journal,22(2), 18�23, March/April.
ISO New England 2000, Load Response Program and Changes to Market Rule 20, Docket No.ER00-2424-000, submitted to the Federal Energy Regulatory Commission, Holyoke, MA,May 5.
M. Jonee-Guinn 2000, personal communication, Portland General Electric, Retail EnergyProducts and Services Department, Portland, OR, October 4.

65
B. Kiernan 1999, From RTP to Dynamic Buying: Communication, Analysis, and Control Toolsfor Managing Risk, EIC-7, E Source, Boulder, CO, September.
K. King and P. Shatrawka 1994, “Customer Response to Real-Time Pricing in Great Britain,”2.195�2.203, Proceedings of the ACEEE 1994 Summer Study on Energy Efficiency inBuildings, Washington, DC, August.
J. Kueck 2000, personal communication, Oak Ridge National Laboratory, Oak Ridge, TN,December 1.
J. C. Mak and B. R. Chapman 1993, “A Survey of Current Real-Time Pricing Programs,” TheElectricity Journal 6(7), 54�65, August/September.
B. Nesbit 2000, “Utilities Install Mega-Meter Systems,” Electrical World 214(4), 28�29,July/August.
J. Newcomb and W. Byrne 1995, Real-Time Pricing and Electric Utility IndustryRestructuring: Is the Future “Out of Control?” SIP V, E Source, Boulder, CO, April.
North American Electric Reliability Council 2000, Reliability Assessment 2000�2009,Princeton, NJ, October.
M. O’Sheasy 2000, personal communication, Georgia Power Company, Atlanta, GA,August 29.
C. Otero-Goodwin 1999, When You’ve Gotta Have It: Options for Collecting Interval Data,EIC-8, E Source, Boulder, CO, November.
R. H. Patrick and F. A. Wolak 1997, Estimating the Customer-Level Demand for ElectricityUnder Real-Time Market Prices, draft, Rutgers University, Newark, NJ, and StanfordUniversity, CA, August.
PJM Interconnection 2000a, PJM Interconnection State of the Market Report 1999, Norristown,PA, June.
PJM Interconnection 2000b, PJM’s Customer Load Reduction Pilot Program, Norristown, PA,June.
PJM Interconnection 2000c, Load Data Systems, Manual M-19, Revision 01, Norristown, PA,June 1.
Plexus Research 1995, 1994 Survey of Utility Demand-Side Programs and Services, EPRI TR-105685, EPRI, Palo Alto, CA, November.

66
V. Rabl 2000, “Reinventing Load Management,” Peak Load Management Alliance Conference,New Orleans, LA, June 5 - 6.
B. Radford 2000, “Price Cap Follies,” Public Utilities Fortnightly 138(15), 4�6, August.
W. L. Reed 2000, “The Transformation of Competitive Electricity Markets by InnovativeTechnologies,” Sempra Energy, San Diego, CA, October.
San Diego Gas & Electric Company 2000, Application of San Diego Gas & Electric Company(U 902-E) for Authority to Provide Customers with Real-Time Energy Meters, Docket No.A.00-07-055, before the California Public Utilities Commission, San Diego, CA, July 31.
P. M. Schwarz, T. N. Taylor, M. Birmingham, and S. L Darden 2000, Industrial Response toReal-Time Prices for Electricity: Short-Run and Long-Run, University of North Carolina andDuke Power, Charlotte, NC.
T. Siegel 2000, “Comparison of Curtailable Loads,” California ISO, Folsom, CA,September 20.
J. Skog 2000, personal communication, Maintenance & Test Engineering Company, Olympia,WA, October 4.
D. Slifer 1999, “Planergy Demand Cooperative Description,” Planergy Services, Inc.,Richmond, CA, October.
L. Sodemann 2000, “Wisconsin Electric’s Voluntary Load Reduction Programs,” EdisonElectric Institute Conference on RTOs and Market Design, Washington, DC, September 29.
D. Stathis 2000, personal communication, Manager of Natural Gas Transactions, GPU Energy,Reading, PA, October.
S. Taub 2000, “The Information Engine,” Electric Perspectives 25(5), 56�71, September-October.
T. N. Taylor and P. M. Schwarz 2000, “Advance Notice of Real-Time Electricity Prices,”Atlantic Economic Journal 28(4), 478�488, December.
U.S. Federal Energy Regulatory Commission 1996, Promoting Wholesale Competition ThroughOpen Access Non-Discriminatory Transmission Services by Public Utilities; Recovery ofStranded Costs by Public Utilities and Transmitting Utilities, Final Rule, Docket Nos. RM95-8-000 and RM94-7-001, Order No. 888, Washington, DC, April 24.

67
U.S. Federal Energy Regulatory Commission 1998, Staff Report to the Federal EnergyRegulatory Commission on the Causes of Wholesale Electric Pricing Abnormalities DuringJune 1998, Washington, DC, September 22. U.S. Federal Energy Regulatory Commission 1999, Regional Transmission Organizations,Order No. 2000, Docket No. RM99-2-000, Washington, DC, December 20.
U.S. Federal Energy Regulatory Commission 2000, NStar Services Company, Order onComplaint and Conditionally Accepting Market Rule Revisions, Docket No. EL00-83-000 etal., Washington, DC, July 26.
F. A. Wolak 1999, Report on Redesign of California Real-Time Energy and Ancillary ServicesMarkets, Market Surveillance Committee of the California Independent System Operator,Folsom, CA, October 18.
F. A. Wolak, R. Nordhaus, and C. Shapiro 2000, An Analysis of the June 2000 Price Spikes inthe California ISO’s Energy and Ancillary Services Markets, Market Surveillance Committee,California Independent System Operator, Folsom, CA, September 6.
C:\Data\Wpd\Rest\DSMReport.wpd