Retail Insight: Moving Beyond Omnichannel - · PDF fileRetail Insight: Moving Beyond...
35
Retail Insight: Moving Beyond Omnichannel SPS Commerce Industry Benchmark Report Paula Rosenblum and Nikki Baird, Managing Partners January 2017 In Cooperation With:
Transcript of Retail Insight: Moving Beyond Omnichannel - · PDF fileRetail Insight: Moving Beyond...

Retail Insight: Moving Beyond Omnichannel SPSCommerceIndustryBenchmarkReport Paula Rosenblum and Nikki Baird, Managing Partners
January 2017
In Cooperation With:

Executive Summary
Key Findings
Omnichannel has been the dominant business challenge across the retail ecosystem for many years now, but as we turn the corner into 2017, RSR finds that for many ecosystem participants, omnichannel is becoming a matter of course – shifting from a specific strategy to something that drives the entire business. The industry needs to move beyond omnichannel – and quite frankly – toward however the customer wants to shop. Thus, companies are growing more and more concerned about consumer behavior overall, especially within the context of an uncertain economy.
This is our fifth year doing this survey, and one theme endures: consumers are setting expectations in retailing. We expect this trend will continue and accelerate in coming years, as the attention the industry had toward becoming omnichannel-capable is folded into a broader focus on satisfying the consumer.
And in this year’s survey of the SPS Commerce ecosystem, we find that companies are moderately optimistic about future growth, but are hesitant to invest more budget to realize that growth. How does that play out across business challenges, opportunities, organizational inhibitors, and finally, their planned technology investments? That is what this report set out to benchmark.
Findings include:
• Blurring lines of competition between manufacturers, distributors, and retailers create a more aligned view of business challenges. Unfortunately, the “Amazon effect” is looming large over the ecosystem. To find out how that is impacting what companies expect for the future, read the Business Challenges section (page 9).
• All ecosystem participants see significant opportunity in growing eCommerce sales, but this prioritization comes at the expense of focusing on stores. Retailers feel a need to reinvigorate stores, but the rest of the ecosystem has much less interest – perhaps to their long-term detriment. E-commerce is not the only area of opportunity. To find where manufacturers, distributors, and retailers all see ways to collaborate more in the future, read the Opportunities section (page 14).
• Omnichannel is indeed becoming “business as usual” within the enterprise, with other priorities on the decline and pressure to keep up with competitors on the rise. But one internal obstacle stands out beyond all others, across the ecosystem. Find out what it is in the Organizational Inhibitors (page 20).
• Companies are indeed not putting as much budget into play as their growth opportunities might otherwise suggest. To find out what made the cut, read the Technology Enablers section (page 23).
Based on our data, we also offer several in-depth and pragmatic suggestions on how companies in the retail ecosystem should proceed. These recommendations can be found in the Bootstrap Recommendations portion of the report.
We certainly hope you enjoy it,
Paula Rosenblum and Nikki Baird

ii
Table of Contents Executive Summary ......................................................................................................................... i Research Overview ......................................................................................................................... 1
The State Of 2016: An Omnichannel Progress Report ................................................................ 1 The Disconnects Begin: Challenges vs. Growth .......................................................................... 2 The Foundation For Winning ....................................................................................................... 4 Defining Winners And Why They Win .......................................................................................... 5 Methodology ................................................................................................................................ 8 Survey Respondent Characteristics ............................................................................................ 8
Business Challenges ....................................................................................................................... 9 On The Consumer Learning Curve .............................................................................................. 9 How Much Have Consumers Changed? ................................................................................... 10 Ask, And You Shall Receive ...................................................................................................... 11 The Second Disconnect: Growth Doesn’t Just ‘Happen’ ........................................................... 13
Opportunities ................................................................................................................................. 14 Is E-Commerce The Path To Growth, Or Part Of A Bigger Plan? ............................................. 14 Collaboration: It’s Finally All About The Data ............................................................................ 15 Omnichannel’s Opportunities ..................................................................................................... 18 And Then Things Get Pragmatic… ............................................................................................ 18 The Opportunities Are There ..................................................................................................... 19
Organizational Inhibitors ................................................................................................................ 20 Other Priorities Hold Many Back, Others Think They’re On Track ............................................ 20 If They Can’t Get It From Us, Consumers Will Simply Go Elsewhere ....................................... 20 Progress Is Slow Across The Ecosystem .................................................................................. 21 Inventory Visibility Remains An Enormous Challenge ............................................................... 22
Technology Enablers ..................................................................................................................... 23 An Ecosystem Moving Very, Very Slowly .................................................................................. 23 Retail Winners Are Somewhat More Advanced ......................................................................... 23 Despite Lack Of Optimization, Budgets Are Reduced ............................................................... 24 Lukewarm Priorities Around Working With The Ecosystem ...................................................... 25 Where Is The Wake-Up Call? .................................................................................................... 26
BOOTstrap Recommendations ..................................................................................................... 27 Better Together .......................................................................................................................... 27 For Retailers: Include The Ecosystem In Store Plans ............................................................... 27 For Manufacturers: Pay Attention To Retail Channel Health ..................................................... 27 For Distributors: Services Help Prevent Being Squeezed In The Middle .................................. 27 For Logistics Service Providers: It’s All About Speed ................................................................ 28 Omnichannel Fades Into The Background? .............................................................................. 28
Appendix A: The BOOT Methodology© ........................................................................................... a Appendix B: About Our Sponsor ..................................................................................................... b Appendix C: About RSR Research ................................................................................................. c
iii
Figures Figure 1: Facing Uncertainty, Companies Focus On The Customer ............................................... 1
Figure 2: Consumers Loom Over The Retail End Of The Ecosystem ............................................. 2
Figure 3: Different Growth Expectations For Different Folks ........................................................... 3
Figure 4: A Budget Disconnect? ...................................................................................................... 4
Figure 5: Competitive Advantage Depends On Position In The Ecosystem ................................... 5
Figure 6: Retail Winners Focus On Long-Term Differentiation ....................................................... 6
Figure 7: Winning Manufacturers Look To Relationships ................................................................ 7
Figure 8: Channel Conflict Is Becoming A Way Of Life ................................................................... 9
Figure 9: Power To The Shopper? ................................................................................................ 10
Figure 10: Still The Perception Of An Entirely Price-Obsessed Consumer ................................... 10
Figure 11: The Amazon Effect And The Need For Speed ............................................................. 11
Figure 12: Ripples From The Amazon Effect ................................................................................ 12
Figure 13: Speed Most Of All ........................................................................................................ 12
Figure 14: The Channel Conflicts Continue .................................................................................. 14
Figure 15: Speed Most Of All ........................................................................................................ 15
Figure 16: Inventory Data, Attribute Data, And Analyzing Data .................................................... 16
Figure 17: More Alignment Than Past Surveys ............................................................................. 17
Figure 18: Drop-Ship’s Potential Growth ....................................................................................... 17
Figure 19: Change Is Coming Thanks To Omnichannel ............................................................... 18
Figure 20: When The Going Gets Tough, It All Comes Back To Price ......................................... 19
Figure 21: Cultural Change And Money Hard To Come By .......................................................... 20
Figure 22: Competitive Pressures Fuel Change ........................................................................... 21
Figure 23: Little Progress Across The Ecosystem ........................................................................ 23
Figure 24: Retail Winners Marginally Ahead ................................................................................. 24
Figure 25: Technology Investments On The Decline .................................................................... 25
Figure 26: Winners Pushing On Proirities ..................................................................................... 26

1
Research Overview
The State Of 2016: An Omnichannel Progress Report The year 2016, while not tumultuous to the degree of 2008, has experienced its own fair amount of disruption and uncertainty. This is not just in terms of business operations, but in the business environment that companies will operate within, now and in the future.
In the retail ecosystem within SPS Commerce’s customer base, the response has been to focus on the customer while keeping one eye on the economy and one on the competition (Figure 1).
Figure 1: Facing Uncertainty , Companies Focus On The Customer
Source: RSR Research, January 2017
Concern about consumer buying preferences has grown year over year, along with concern about the economy. This year we added an option for greater competition and it jumped straight to third on the list of aggregated responses, though, as you’ll see below, there are some differences in perspective depending on where a company sits within the ecosystem.
While it would appear that omnichannel is not having the same impact on business as it has in the past, as more and more consumers shop across channels, that concern has merely shifted from one focused on omnichannel to a larger perspective about consumer behavior overall. Omnichannel isn’t going away as a pressure, it’s just being considered as part of the general environment, rather than a specific case.
Anyone contemplating selling to consumers – and this increasingly includes manufacturers and distributors as well as retailers – is concerned about how consumer buying preferences are shifting (Figure 2, below).
8%
20%
16%
17%
39%
NA
59%
61%
8%
17%
23%
24%
30%
54%
70%
74%
Security/data breaches
Mobile
Politics/regulations
Internet of Things (IoT)
Omnichannel retailing
Greater competition
Economy
Consumer buying preferences
External Forces Impacting Your Business Over The Next 5 Years
2016 2015

2
Figure 2: Consumers Loom Over The Retai l End Of The Ecosystem
Source: RSR Research, January 2017
Retailers, the biggest contingent dealing most directly with consumers, have markedly different concerns than their peers in the ecosystem. Retailers are far more concerned about omnichannel retailing, mobile, and competition than the overall economy.
Logistics service providers remain eternally concerned about regulations, the economy, and competition.
The Disconnects Begin: Challenges vs. Growth These external factors have not dampened the ecosystem’s optimism for business prospects next year – which are almost entirely unchanged from 2015, with 53% of respondents expecting sales growth to be “somewhat better than last year” and another 29% predicting sales growth to be “much better” than last year. This perspective is interesting given how much certain external factors, like the economy and consumer behavior, have shifted.
However, there are some significant differences depending on a company’s position in the ecosystem (Figure 3).
21%
42%
8%
18%
32%
76%
58%
45%
7%
24%
25%
14%
26%
73%
54%
77%
8%
20%
29%
12%
30%
72%
50%
78%
9%
11%
20%
35%
46%
52%
58%
68%
Security/data breaches
Politics/regulations
Internet of Things (IoT)
Mobile
Omnichannel retailing
Economy
Greater competition
Consumer buying preferences
External Forces Impacting Your Business Over The Next Five Years
Retailer Distributor Manufacturer / Supplier Logistics firm

3
Figure 3: Different Growth Expectat ions For Different Folks
Source: RSR Research, January 2017
Retail respondents are the most conservative about their expectations for 2017, but no one is overly pessimistic. At the same time, a relatively small number across the ecosystem are wildly enthusiastic about growth prospects for the year. One interesting thing to watch for in this report: retailers have been moving aggressively on cross-channel fulfillment, whether ship from store, save the sale, endless aisle or some mix of the three.
In this research, we see that logistics providers are the most positive about 2017, while retailers are the least positive. Is retailers’ tempered enthusiasm merely the other side of the coin for logistic providers’ greater confidence? Are LSP’s the only ones really making money from cross-channel fulfillment? That’s one of many trends we’ll explore in this research.
Moderate-to-strong growth expectations do not translate into a one-for-one increase in budgets, however (Figure 4, below).
0%
26%
45%
29%
3%
18%
51%
27%
3% 12%
54%
30%
3% 8%
63%
26%
Somewhat worse than 2016
The same as 2016 Somewhat better than 2016
Much better than 2016
Expectations for Sales Growth in 2017
Retailer Distributor Manufacturer / Supplier Logistics firm

4
Figure 4: A Budget Disconnect?
Source: RSR Research, January 2017
Overall, 82% of respondents believe sales growth will be better than last year, but only 47% of aggregated respondents are increasing their budgets - and 15% are cutting budget even when only 4% believe that growth next year will be challenging.
The Foundation For Winning All of these perspective converge into a lukewarm environment: a year that will see more sales growth than last year, but will come with a general unwillingness to increase budget to go along with that growth – all within a retail ecosystem that believes external business factors like customer buying preferences and the economy are becoming ever more important to them.
How does the ecosystem expect to respond? Overall, respondents expect to rely on a powerful brand, differentiated customer service, and increased supply chain efficiency - with a strong internal culture and collaborative trading partner relationships tied for fourth on the list.
The breakout by type of company is unsurprising – retailers and manufacturers care mostly about brand, while distributors care most about supply chain efficiency (Figure 5, below).
But when you match these differentiators against the business challenges the ecosystem says it faces, there appears to be something of a disconnect. Companies are challenged by consumer buying preferences, competition, and the economy. These trends are driven primarily by technology – technology that is changing how consumers buy, blurring the lines between competitor and collaborator, and disrupting the economy through things like the “Uberization” of services.
48%
34%
18%
53%
35%
12%
45% 40%
15%
37%
47%
16%
Budget has increased Budget has stayed the same as 2016
Budget has decreased
Budget Changes 2016 to 2017
Retailer Distributor Manufacturer / Supplier Logistics firm

5
Figure 5: Competit ive Advantage Depends On Posit ion In The Ecosystem
Source: RSR Research, January 2017
And yet, the ecosystem is turning mostly to differentiators that do not speak to the changing role of technology: ultimately realizing the importance of the people and process part of change. Not everything is being driven by technology. A powerful brand? Differentiated customer service? A strong internal culture? Do companies in the retail market see these as an outcome from strategic technology investments? Or do they believe these non-technology kinds of differentiators will overcome the challenges of an increasingly technology-driven world?
That is what we explore in this research, with a special focus on the competitive environment (as in: how much impact online pureplays like Amazon are changing the industry), companies’ ability to predict the future (a measure of technology sophistication), inventory visibility, and drop ship (as one aspect of partner collaboration).
Defining Winners And Why They Win In our benchmark reports, RSR quite frequently cites differences between retailer over-performers in year-over-year comparable sales and their competitors. We find that consistent sales performance is an outcome of a differentiating set of thought processes, strategies and tactics. We call sales over-performers “Retail Winners.”
RSR’s definition of these winners is straightforward. Assuming industry average comparable store/channel sales growth of 4.5 percent, we define those with sales above this hurdle as “winners,” those at this sales growth rate as “average,” and those below this sales growth rate as “laggards” or “also-rans.”
8%
23%
35%
29%
24%
34%
25%
30%
33%
57%
7%
25%
33%
29%
22%
45%
16%
38%
44%
41%
8%
15%
22%
23%
25%
31%
32%
38%
51%
55%
Deep process analytics and metrics
Deep customer insights
Collaborative trading partner relationships
National brand name products
Supply chain agility
Supply chain efficiency
Private label products
A strong internal culture
Differentiated customer service
A powerful brand
Top Three Sources Of Competitive Advantage
Retailer Distributor Manufacturer / Supplier

6
Because we expanded our view beyond the retail industry, we asked respondents from other parts of the ecosystem to report their year-over-year sales growth exclusive of mergers and acquisitions. This helps us normalize data and create consistency across business types.
Winning performance distinguishes companies across the ecosystem, but self-identified reasons for winning vary depending on type of company. Each type of company appears to have its own agenda, which ultimately perpetuates conflict as well as collaboration.
For Retail Winners, a powerful brand is paramount, even if the retailer in question is selling nationally branded merchandise (Figure 6).
Figure 6: Retai l Winners Focus On Long-Term Different iat ion
Source: RSR Research, January 2017
Brand is an advantage that speaks to maintaining a position of power (as much as possible) within the customer relationship. However, for Retail Winners, a strong internal culture wins out over supply chain efficiency, an area where one would think retailers would need to maintain competitive advantage. What is happening, though, is a question of tactics vs. goals. In RSR’s experience, Retail Winners tend to distinguish very strongly between goals and what it takes to reach goals – prioritizing actions rather than outcomes. In this case, a strong internal culture makes supply chain efficiency possible, and a lack of such a culture makes it more difficult.
But manufacturers have a different set of valued differentiators (Figure 7, below).
9%
21%
27%
27%
27%
27%
30%
52%
27%
52%
7%
10%
13%
20%
23%
33%
33%
47%
53%
60%
Deep process analytics and metrics
Deep customer insights
Collaborative trading partner relationships
National brand name products
Supply chain agility
Supply chain efficiency
Private label products
Differentiated customer service
A strong internal culture
A powerful brand
Retailer Top Three Sources Of Competitive Advantage
Retail Winners Others

7
Figure 7: Winning Manufacturers Look To Relat ionships
Source: RSR Research, January 2017
While manufacturers also believe in a powerful brand, winning manufacturers tend to prioritize collaborative trading partner relationships over supply chain efficiency – another case of tactics and actions over outcomes. Winning manufacturers also tend to place stronger emphasis than peers on deep customer insights and products that carry brand weight in the marketplace, while peers are caught up on things like supply chain agility.
Does this theme – a focus on actions vs. outcomes – follow through from business challenges to technology investments? Let’s find out.
13%
25%
21%
29%
21%
17%
25%
46%
42%
63%
0%
6%
25%
25%
31%
31%
31%
38%
50%
63%
Deep process analytics and metrics
Supply chain agility
Differentiated customer service
Private label products
National brand name products
Deep customer insights
A strong internal culture
Supply chain efficiency
Collaborative trading partner relationships
A powerful brand
Manufacturer Sources Of Competitive Advantage
Winners Others

8
Methodology RSR uses its own model, called The BOOT Methodology© to analyze retail industry issues. We build this model with our survey instruments. See Appendix A for a full explanation.
In our surveys, we continue to find the kinds of differences in thought processes, actions, and decisions cited above. The BOOT helps us better understand the behavioral and technological differences that drive sustainable sales improvements and successful execution of brand vision.
Survey Respondent Characteristics RSR launched this survey in October 2016. We received responses from 563 qualified companies, focused on the SPS Commerce community of customers and partners. All responses were anonymous.
• 12 percent self-identified as retailers • 20 percent self-identified as distributors • 61 percent self-identified as manufacturers, vendors or suppliers • 7 percent self-identified as logistics providers (LSPs)
Job Functions Supply Chain, Logistics, Transportation and Warehouse 25% Executive Management 22% Business Development / Sales 18% Information Technology 13% Finance 12% Marketing / Merchandising / E-commerce 10%
Category of Products Sold or Handled
General merchandise 22% Fashion/Apparel 17% Food/Grocery 16% Sports, hobbies, books 14% Electronics 9% Health 8% Home furnishings 6% Auto 4%
Home improvement 4%
Geography (Headquarters)
North America 75% Australia/Oceania 15% Europe/Africa 5% Asia 4% South America 1%

9
Business Challenges
On The Consumer Learning Curve Across the ecosystem, nearly all types of companies are concerned with consumer buying behaviors. That is primarily because – whether retailer, manufacturer, or distributor – they all have more direct connections to those consumers than ever before (Figure 8).
Figure 8: Channel Conf l ict Is Becoming A Way Of Li fe
Source: RSR Research, January 2017
While manufacturers have been slow to embrace stores (not surprising, given how much retailers struggle to keep stores relevant today), they have invested more heavily than their retail counterparts in online third party marketplaces, and are just as likely to operate their own branded e-commerce site.
However, winning manufacturers do not appear to be the ones driving these blurred lines of competition. Outside of third party marketplaces, high performing manufacturers have not invested in stores or branded e-commerce sites to the same degree as their less well-performing peers (Figure 9, below).
Winning manufacturers seem to be taking their time in moving more deeply into the retail market – they are on the learning curve of direct-to-consumer by participating in third party marketplaces, but have not rushed in to make investments in stores or e-commerce platforms to the same degree as their peers.
71% 75%
40% 31%
50% 58%
12%
44% 40%
60%
16%
60%
Company branded stores
Company branded e-commerce site(s)
Company branded mobile app(s)
Online 3rd Party Marketplaces
In Which Of The Following Direct-to-Consumer Channels Do You Operate Today?
Retailer Distributor Manufacturer / Supplier

10
Figure 9: Power To The Shopper?
Source: RSR Research, January 2017
How Much Have Consumers Changed? Across the ecosystem, survey respondents report that price is still the top factor impacting customer buying decisions. Consumers still rule. Product availability comes second, but options drop off very quickly after that (Figure 10).
Figure 10: St i l l The Percept ion Of An Ent ire ly Pr ice-Obsessed Consumer
Source: RSR Research, January 2017
But when you dig into these numbers by company type, an “Amazon Effect” rapidly emerges (Figure 11, below).
25% 44%
19%
56% 50%
71%
17%
50%
Company branded stores Company branded e-commerce site(s)
Company branded mobile app(s)
Online 3rd Party Marketplaces
Manufacturers: Direct-to-Consumer Channels Operated Today
Winners Others
6%
17%
18%
22%
25%
27%
28%
36%
54%
68%
Free returns
Trending in social media
Faster shipping
Better internet discovery
User ratings/reviews
Free shipping
Product information, including images/videos
Product assortment
Product availability
Pricing
Factors With The Biggest Impact On Consumer Buying Decisions

11
Figure 11: The Amazon Effect And The Need For Speed
Source: RSR Research, January 2017
While the ecosystem is fairly well-aligned across consumer decision factors like price and product availability, there are two options that stand out immediately as factors that retailers feel more acutely than peers: free shipping, and faster shipping.
This is without a doubt one result of competing against Amazon and other online-only retailers. Whether truly “free” or not, consumers increasingly have a base expectation that they will not pay for shipping. And to compete with phenomena like Uber deliveries or Prime Now, for the past two years retailers have reported they need their logistics to get faster. They need to cut the time it takes from when they take the order until they move the box out the door, and they also need to cut the time it takes from when it leaves the door until it arrives in the shopper’s hands.
It’s also interesting to note that retailers tend to place less emphasis on product availability than peers. This is another impact from the Amazon Effect – for retailers, it is becoming less important to have the product in hand than it is to be able to get it to customers fast and free. This is a subtle difference that means a whole new world for stores, supply chain, and logistics.
Ask, And You Shall Receive Speaking of logistics, it should be no surprise that given retailers’ shifting views of what’s important to customers, LSPs are being asked to provide different levels of service than in the past. In fact, there has been a significant shift from 2015 to 2016 (Figure 12, below).
14%
39%
23%
55%
67%
16%
37%
24%
60%
71%
25%
35%
42%
48%
65%
Faster shipping
Product assortment
Free shipping
Product availability
Pricing
Factors With The Biggest Impact On Consumer Buying Decisions (Selected Differences)
Retailer Distributor Manufacturer / Supplier

12
Figure 12: Ripples From The Amazon Effect
Source: RSR Research, January 2017
LSPs report that price is becoming less important overall to customers, in favor of increased reliability and the locations of their warehouses. The most important questions from customers in the ecosystem seem to be “Can you get there as fast as Amazon?” This is a question answered by whether a provider has the warehouse locations positioned strategically in order to enable speed and only leads to: “Can you do so reliably?”
This carries over into the challenges LSPs say their customers are asking them to solve – rapid fulfillment remains at the top of the list in 2016 (Figure 13).
Figure 13: Speed Most Of Al l
Source: RSR Research, January 2017
0%
0%
3%
7%
17%
14%
3%
21%
35%
0%
3%
5%
5%
11%
11%
11%
26%
29%
Drop-ship capabilities
Warehouse capacity
Technology
Reputation
Suite of offerings
Scalability
Warehouse locations
Reliability
Pricing
LSPs: Single Attribute Most Important To Customers' Buying Decisions
2016 2015
0%
14%
0%
14%
14%
17%
41%
3%
5%
11%
13%
13%
18%
37%
Streamlined returns
Global orders
Adding new retailer customers
Drop-ship fulfillment
Accurate visibility to inventory levels/locations
Expanded number of EDI transactions
Rapid fulfillment
LSPs: Biggest Challenge Customers Are Asking You To Solve This Year
2016 2015

13
However, it’s interesting to note that global orders fell precipitously from 2015 to 2016, while adding new retail customers grew by nearly the same amount. Rather than reaching across the globe themselves, the ecosystem is looking for partners within a region to help them get closer to consumers.
The Second Disconnect: Growth Doesn’t Just ‘Happen’ We’ve already pointed out the budget disconnect that retailers are facing. The good news is that more of the ecosystem has a direct line to the end consumer, primarily through blurring lines of competition. As a result, the belief that consumers are primarily obsessed with price appears to be shifting. This is driven mostly by retailers who are finding themselves forced to respond to higher consumer expectations for speed and cost of shipping, and undoubtedly also by increased competition from online pureplays like Amazon. The ecosystem is starting to respond – LSPs in particular show important shifts in what their customers are asking of them.
In the big-picture context, consumer buying preferences and the economy are overall becoming bigger challenges for the retail ecosystem, and companies are responding by tempering growth expectations even though they are not increasing budgets at the same rate. And while companies want to respond with a powerful brand and better-performing companies look to either a strong internal culture or strong relationships with other partners in the ecosystem, when it comes down to it: they report that consumers are still mostly motivated by price.
Which leads us back to the first question of this report: are companies prioritizing actions, or are they hoping for outcomes? Let’s look at their opportunities to find out the answer.

14
Opportunities
Is E-Commerce The Path To Growth, Or Part Of A Bigger Plan? When we conducted this research last year, it was the first time that e-commerce sales were prioritized over stores. This year, that trend only strengthens. Across the ecosystem, retailers, distributors, and manufacturers all agree that one of their top priorities for 2017 is to focus on growing e-commerce sales (Figure 14).
Figure 14: The Channel Conf l icts Continue
Source: RSR Research, January 2017
One could argue that this is very much a focus on outcomes instead of actions – there are very few members of the retail ecosystem for whom e-commerce sales are flat or falling. But it raises an interesting question about how invested distributors and manufacturers really are in retail’s success. Part of the reason this question needs to be asked is the fact that retailers have clearly placed high emphasis on reinvigorating the store experience, but none of the other ecosystem partners share the urgency.
This is especially problematic for manufacturers – many of whom are pursuing their own e-commerce growth as a top priority (Figure 15, below).
23%
26%
26%
14%
31%
41%
58%
21%
62%
28%
31%
16%
11%
31%
46%
60%
12%
65%
9%
17%
20%
22%
38%
38%
45%
45%
66%
Manage legacy systems
Discover unique assortments
Expand localized merchandising
Grow in-store digital engagement
Expand private label product offerings
Improve e-commerce profitability
Streamline fulfillment
Improve/reinvigorate the in-store experience
Grow e-commerce sales
Top Three Priorities for 2017
Retailer Distributor Manufacturer / Supplier

15
Figure 15: Speed Most Of Al l
Source: RSR Research, January 2017
While many manufacturers don’t own or operate stores, or perhaps simply operate tiny outlet businesses, the fact that they don’t see the same urgency around the health of stores as retailers do could come back to haunt them later.
In the United States, the fall of sporting goods retailer Sports Authority became an instant case study on why retail partners should prioritize the success of the store. Sports Authority’s demise had many causes, but a big part of it was a completely irrelevant store experience that stood no chance with an increasingly digital shopper. Why should a manufacturer care? After Sports Authority declared bankruptcy, some of its major suppliers took a serious hit on the news of slower growth and lower margins – soley due to Sports Authority’s closure.
The health of the retail market will become increasingly important to manufacturers, especially as they appear more willing to invest in e-commerce than in stores of their own. The collapse of a major brick and mortar retailer cannot be offset by e-commerce growth alone, but if manufacturers do not do what they can to ensure the health of the brick and mortar channel, they may also find themselves in dire straits.
Collaboration: It’s Finally All About The Data Manufacturers and retailers may not be aligned around the priority that needs to be given to stores, but they are aligned around specific topics related to collaboration, and that is very good news. No matter where they are in the ecosystem, companies report that they share similar goals around inventory visibility, sharing item attributes, and analyzing sell-through data (Figure 16).
29%
25%
13%
17%
29%
46%
25%
63%
54%
13%
19%
19%
31%
31%
31%
38%
50%
69%
Discover unique assortments
Expand private label product offerings
Grow in-store digital engagement
Expand localized merchandising
Manage legacy systems
Improve e-commerce profitability
Improve/reinvigorate the in-store
Grow e-commerce sales
Streamline fulfillment
Manufacturers: Top Three Priorities For 2017
Winners Others

16
Figure 16: Inventory Data, Attr ibute Data, And Analyzing Data
Source: RSR Research, January 2017
After that relative level of agreement, the pattern changes. Distributors and manufacturers show interest in increasing product promotions, a priority that is met with less enthusiasm by retailers. Everyone is worried about consumer price sensitivity, but retailers have been on the front line of a bruising race to the bottom on price ever since the Great Recession - and they are not as interested in becoming more promotional than their partners. They are, however, more interested in working on drop-ship relationships. This is an important reversal of attitude from retailers, who historically have viewed drop-ship as something to be awarded to only the most trusted partners. As we will see below, retailers are increasingly interested in drop-ship as a low-risk way of expanding their assortment as a hedge against uncertain consumer demand.
Regardless of these differences, retailers and manufacturers do have important areas of alignment where they can collaborate in the future. Though the order is not the same, two of the top three priorities for both retailers and manufacturers are the same: analyze sell-through data, and provide visibility into available inventory (Figure 17, below).
29%
29%
61%
65%
57%
60%
24%
27%
68%
60%
57%
64%
22%
43%
51%
60%
60%
65%
Comply with trading requirements
Provide drop-ship fulfillment details
Increase product promotions
Analyze sell-through data
Provide more or improved item attributes
Provide visibility to available inventory
Top Three Ways To Collaborate Better With Partners Next Year
Retailer Distributor Manufacturer / Supplier

17
Figure 17: More Al ignment Than Past Surveys
Source: RSR Research, January 2017
If the ecosystem can focus on areas of alignment, rather than differences, the opportunities for collaboration going forward seem more positive than in past years.
One interesting outlier from the charts above is the relative low priority for drop-ship fulfillment. Retailers placed more priority on the capability than partners in the ecosystem, but even among retailers, drop-ship is fifth on the list overall. Certainly, drop-ship activity appears to be increasing – LSPs report very large expected increases in drop-ship relationships over the next three years (Figure 18).
Figure 18: Drop-Ship’s Potent ial Growth
Source: RSR Research, January 2017
27%
45%
52%
61%
61%
55%
17%
40%
50%
60%
67%
67%
Comply with trading requirements
Provide drop-ship fulfillment details
Increase product promotions
Analyze sell-through data
Provide visibility to available inventory
Provide more or improved item attributes
Retailers: Top Three Ways To Collaborate Better With Partners
Next Year
Retail Winners Others
54%
29%
29%
58%
71%
58%
38%
38%
44%
50%
63%
69%
Comply with trading requirements
Provide drop-ship fulfillment details
Provide more or improved item attributes
Provide visibility to available inventory
Analyze sell-through data
Increase product promotions
Manufacturers: Top Three Ways To Collaborate Better With Partners
Next Year
Winners Others
11%
26%
11%
16%
16%
21%
29%
11%
16%
11%
5%
8%
13%
8%
In 3 Years?
Today?
Percent of LSP Sales From Dropship
Less than 5% 5-10% 11-25% 26-50% 51-75% 76-100% Don't Know
18
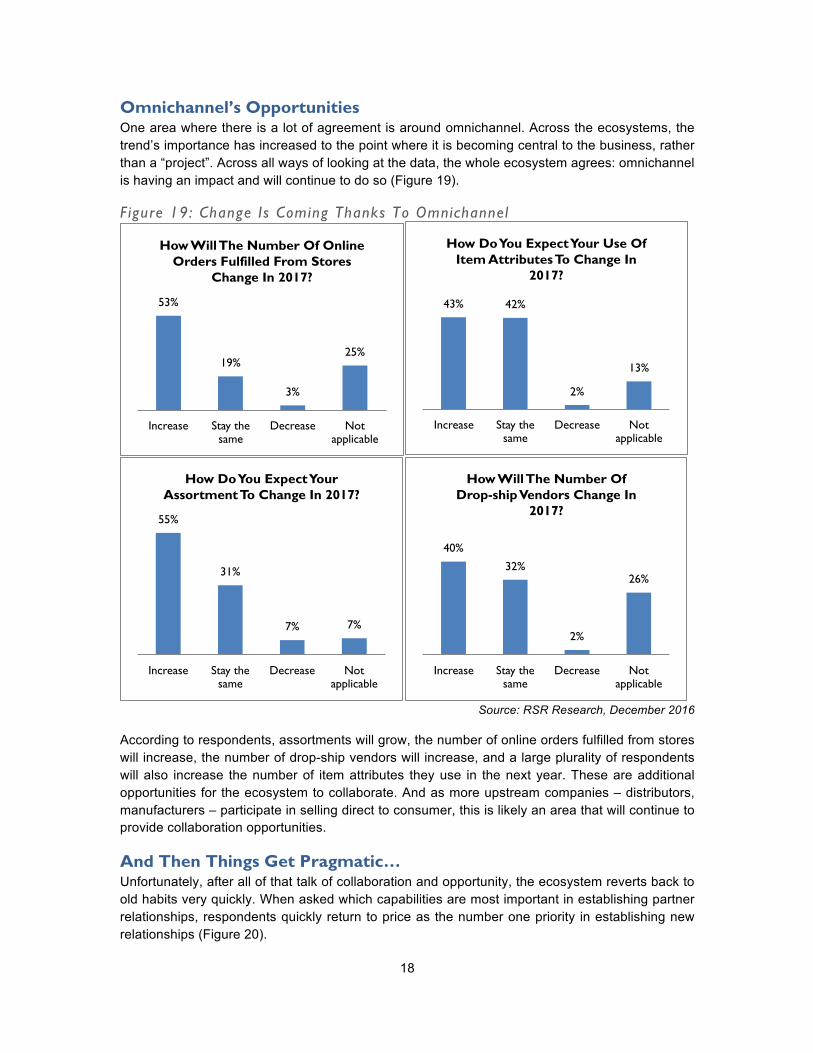
Omnichannel’s Opportunities One area where there is a lot of agreement is around omnichannel. Across the ecosystems, the trend’s importance has increased to the point where it is becoming central to the business, rather than a “project”. Across all ways of looking at the data, the whole ecosystem agrees: omnichannel is having an impact and will continue to do so (Figure 19).
Figure 19: Change Is Coming Thanks To Omnichannel
Source: RSR Research, December 2016
According to respondents, assortments will grow, the number of online orders fulfilled from stores will increase, the number of drop-ship vendors will increase, and a large plurality of respondents will also increase the number of item attributes they use in the next year. These are additional opportunities for the ecosystem to collaborate. And as more upstream companies – distributors, manufacturers – participate in selling direct to consumer, this is likely an area that will continue to provide collaboration opportunities.
And Then Things Get Pragmatic… Unfortunately, after all of that talk of collaboration and opportunity, the ecosystem reverts back to old habits very quickly. When asked which capabilities are most important in establishing partner relationships, respondents quickly return to price as the number one priority in establishing new relationships (Figure 20).
53%
19%
3%
25%
Increase Stay the same
Decrease Not applicable
How Will The Number Of Online Orders Fulfilled From Stores
Change In 2017?
43% 42%
2%
13%
Increase Stay the same
Decrease Not applicable
How Do You Expect Your Use Of Item Attributes To Change In
2017?
55%
31%
7% 7%
Increase Stay the same
Decrease Not applicable
How Do You Expect Your Assortment To Change In 2017?
40%
32%
2%
26%
Increase Stay the same
Decrease Not applicable
How Will The Number Of Drop-ship Vendors Change In
2017?

19
Figure 20: When The Going Gets Tough, I t Al l Comes Back To Pr ice
Source: RSR Research, January 2017
Given that the entire ecosystem places a high priority on a powerful brand as a differentiator, it is supremely ironic that brand is third on the list of the top three most important capabilities for establishing a relationship. Companies quickly return to the hard costs of price and availability in exchange for the “softer” capabilities that more strongly contribute to brand – like brand image, compliance, and experience of any kind.
The Opportunities Are There For an ecosystem that is not overtly eager to invest to capture growth, the opportunities to grow through collaboration and such goals as growing e-commerce or invigorating stores are there – if companies can get out of their own way to capture those opportunities. While respondents do prioritize focusing on the customer, even as they keep an eye on the economy, it won’t take much to tip the scales towards worrying more about the economy than customers. In turn this risks triggering many of the reflex behaviors that have led to a race to the bottom in the past – a focus on promotions, growing internally at the expense of the health of the overall ecosystem, and on ignoring data-driven opportunities to collaborate in favor of execution-oriented ones – none of which will yield the same results in this digital (and data-driven) age.
Are companies aware of this delicate balance between doing what’s right for the consumer vs. protecting the company’s own interests? Let’s take a look at organizational inhibitors and see.
9%
21%
11%
14%
17%
16%
26%
22%
37%
60%
67%
8%
12%
13%
13%
13%
14%
21%
22%
23%
47%
51%
62%
Flexible return strategy
Item novelty
Digital/marketing assets
Years in operation
Size of company
Drop-ship experience
Merchandising programs
Visibility to sales and order status
Compliance with trading requirements
Brand image
Item availability
Price
Top Three Important Capabilities In Establishing New Retailer/Vendor Trading Relationships
2016 2015
NA

20
Organizational Inhibitors
Other Priorities Hold Many Back, Others Think They’re On Track For the past three years, we’ve asked respondents across the ecosystem what’s hindering their omnichannel strategy. The most frequent answer this year remains the same as it always has: other priorities. This has been a consistent source of befuddlement to us (Figure 21).
Figure 21: Cultural Change And Money Hard To Come By
Source: RSR Research, January 2017
However, two pieces of good news have emerged: the percentage citing these “other priorities” as a top three inhibitor has dropped from 52% in 2014 to 40% in 2016, and the percentage world-wide citing their omnichannel plans are on schedule has risen to 35%, up from 27% in 2015.
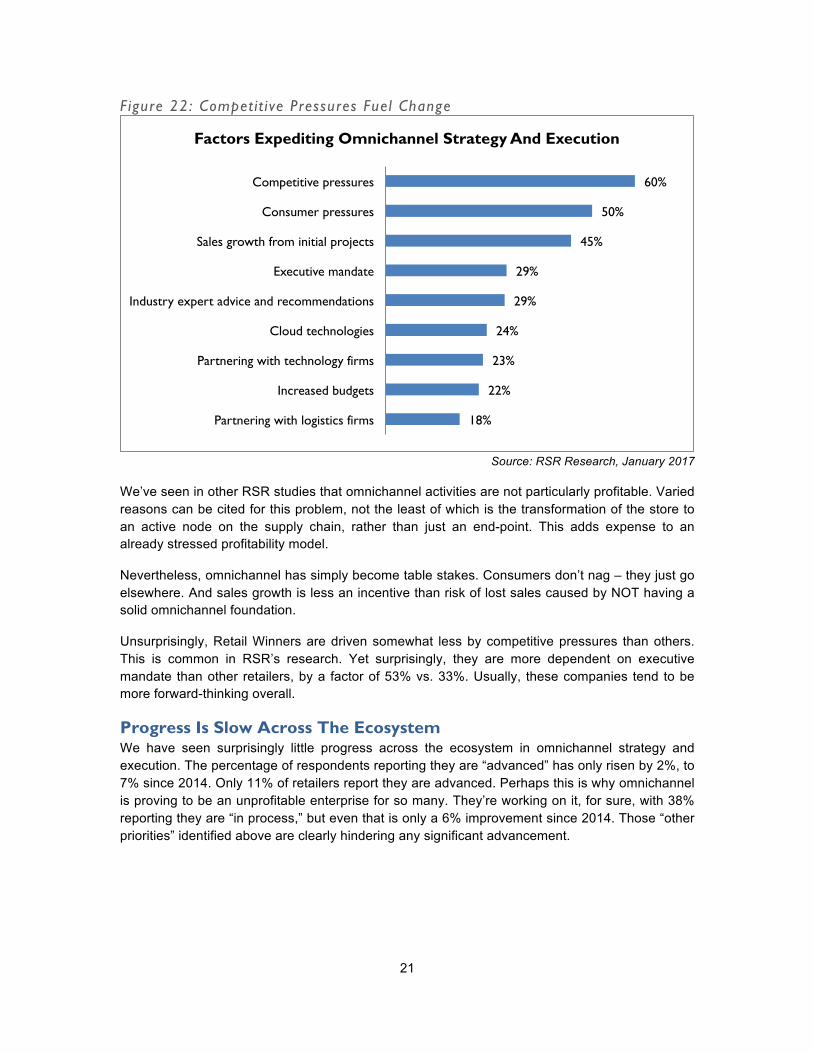
If They Can’t Get It From Us, Consumers Will Simply Go Elsewhere The odd saving grace for the entire ecosystem is competitive pressures. These even top consumer pressures as a frequently-cited factor expediting omnichannel strategy and execution (Figure 22).
18%
24%
26%
26%
29%
29%
35%
40%
Silos of information/operations
Cultural resistance to change
Lack of executive direction
Unclear of next steps
Insufficient budget
Legacy systems/technology
Not applicable, our omnichannel plans are on schedule
Other priorities
Top Three Factors Hindering Omnichannel Strategy And Execution
21
Figure 22: Competit ive Pressures Fuel Change
Source: RSR Research, January 2017
We’ve seen in other RSR studies that omnichannel activities are not particularly profitable. Varied reasons can be cited for this problem, not the least of which is the transformation of the store to an active node on the supply chain, rather than just an end-point. This adds expense to an already stressed profitability model.
Nevertheless, omnichannel has simply become table stakes. Consumers don’t nag – they just go elsewhere. And sales growth is less an incentive than risk of lost sales caused by NOT having a solid omnichannel foundation.
Unsurprisingly, Retail Winners are driven somewhat less by competitive pressures than others. This is common in RSR’s research. Yet surprisingly, they are more dependent on executive mandate than other retailers, by a factor of 53% vs. 33%. Usually, these companies tend to be more forward-thinking overall.
Progress Is Slow Across The Ecosystem We have seen surprisingly little progress across the ecosystem in omnichannel strategy and execution. The percentage of respondents reporting they are “advanced” has only risen by 2%, to 7% since 2014. Only 11% of retailers report they are advanced. Perhaps this is why omnichannel is proving to be an unprofitable enterprise for so many. They’re working on it, for sure, with 38% reporting they are “in process,” but even that is only a 6% improvement since 2014. Those “other priorities” identified above are clearly hindering any significant advancement.
18%
22%
23%
24%
29%
29%
45%
50%
60%
Partnering with logistics firms
Increased budgets
Partnering with technology firms
Cloud technologies
Industry expert advice and recommendations
Executive mandate
Sales growth from initial projects
Consumer pressures
Competitive pressures
Factors Expediting Omnichannel Strategy And Execution

22
Inventory Visibility Remains An Enormous Challenge One of the major internal drags on omnichannel execution and profitability remains a lack of inventory visibility. This blindness extends across the ecosystem, and is notable in areas that we find completely unexpected.
• Only 77% of retailers have full visibility into their in-store inventory, and 78% have full visibility into their own distribution center inventory. This is virtually identical to respondents in 2015.
• Only 66% of distributors have visibility into inventory at their own distribution centers and 47% have no visibility at all into their partners’ inventory,
• Only 62% of manufacturers and suppliers have full visibility into inventory at their own distribution centers and 45% have no visibility at all into their partners’ distribution center inventory.
This lack of inventory visibility creates ripples far beyond omnichannel execution. Poor inventory visibility can drive over-investment in slow-moving or dying product, while starving hot or fresh merchandise.
Having identified the external pressures, possibilities and internal challenges, it’s time to take a look at the state of technology across the ecosystem.

23
Technology Enablers
An Ecosystem Moving Very, Very Slowly Whether the reasons are budgetary, cultural, priority-based, or simple denial, the ecosystem is not moving quickly to enable omnichannel activities with technology. As we can see in Figure 23, below, “full optimization” is hard to find in any area of direct-to-consumer processes. Even shipping orders to stores has only been fully optimized by barely half of respondents.
Figure 23: L itt le Progress Across The Ecosystem
Source: RSR Research, January 2017
Now, the fact is that consumers are expecting two-day delivery. They also expect to return product via the channel of their choice, and shipments from stores to consumers are becoming part of everyday life. Unfortunately, because processes and technologies are so sub-optimized, they’re also expensive, and profit leaks out of the enterprise.
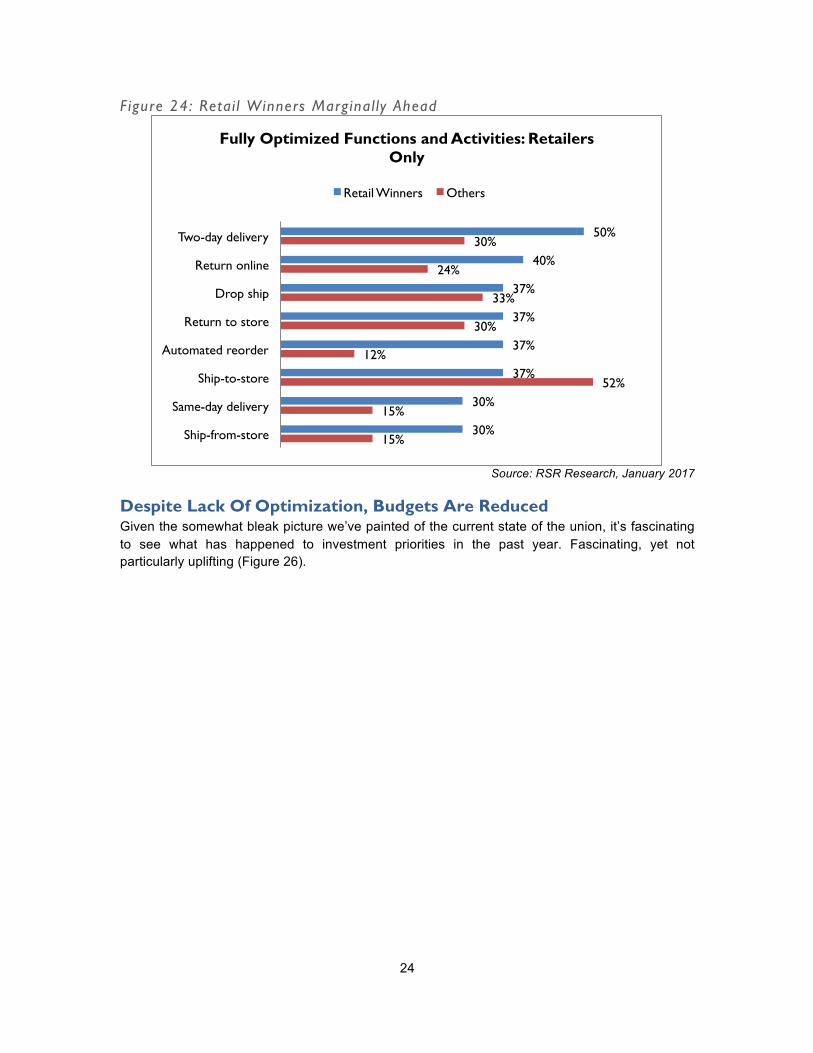
Retail Winners Are Somewhat More Advanced RSR’s research has consistently shown that Retail Winners made investments earlier and often. And so, as we can see in Figure 24, they are marginally ahead of their less well-performing peers. But still, with Amazon Prime’s guaranteed two-day delivery, it’s hard to call 50% at full optimization a major victory. It’s equally unremarkable to report that 52% of other retailers have fully optimized their ability to ship to stores.
16%
12%
6%
16%
17%
39%
31%
45%
26%
20%
10%
13%
18%
38%
36%
50%
22%
23%
23%
34%
34%
35%
38%
45%
Same-day delivery
Ship-from-store
Automated reorder
Return to store
Return online
Drop ship
Two-day delivery
Ship-to-store
Fully Optimized Operations And Activities: By Business Type
Retailer Distributor Manufacturer / Supplier
24
Figure 24: Retai l Winners Marginal ly Ahead
Source: RSR Research, January 2017
Despite Lack Of Optimization, Budgets Are Reduced Given the somewhat bleak picture we’ve painted of the current state of the union, it’s fascinating to see what has happened to investment priorities in the past year. Fascinating, yet not particularly uplifting (Figure 26).
15%
15%
52%
12%
30%
33%
24%
30%
30%
30%
37%
37%
37%
37%
40%
50%
Ship-from-store
Same-day delivery
Ship-to-store
Automated reorder
Return to store
Drop ship
Return online
Two-day delivery
Fully Optimized Functions and Activities: Retailers Only
Retail Winners Others

25
Figure 25: Technology Investments On The Decl ine
Source: RSR Research, January 2017
We would expect to see lack of major investments in either areas where success has been achieved or in areas of declining importance. Yet here we have critical elements (most especially supply chain visibility) that have been identified as lacking, and investments have declined by more than 50%. It’s hard to know what to say about this.
We know in the US, retailers have taken some heat from Wall Street on continued omnichannel investments, but basics like forecasting, inventory management and e-commerce advancements should be on every company’s prioritized investment list.
This begs the question: what exactly ARE the ecosystem’s priorities?
Lukewarm Priorities Around Working With The Ecosystem Priorities for collaborative forecasts, managing sell-through or even reducing stock-outs are surprisingly limp. As evidenced in Figure 27, even over-performing companies just don’t rate any of these initiatives all that highly.
12%
19%
13%
22%
12%
24%
31%
30%
27%
37%
5%
8%
8%
10%
11%
12%
12%
15%
18%
21%
Private label
Mobile commerce advancements
New stores/locations
Forecasting and planning systems
Expanded vendor network
Inventory management
Supply chain collaboration/visibility
Warehouse improvements
Expanded product assortment
E-commerce advancements
Major Investment Plans Year Over Year
2016 2015

26
Figure 26: Winners Pushing On Pr ior i t ies
Source: RSR Research, January 2017
Where Is The Wake-Up Call? In general, it’s hard to be optimistic about the picture this year’s data paints. We see a rosy opinion on future growth, but that rosy glow doesn’t translate into budgets or even a sense of urgency around improving basic inventory planning, forecasting or management. We’re somewhat befuddled by this missing sense of urgency. Profits are not on the rise, sales are moving online to competitors who mostly “buy” their sales with artificially low shipping costs or to their own sub-optimized processes, and yet the ecosystem remains sanguine. We do wonder what kind of wake-up call is needed to jolt the industry out of its torpor.
We will present some recommendations below.
57%
43%
57% 60% 52%
39% 42% 39%
Improve pre-season planning and
forecasting to better optimize assortments
Improve our ability to make adjustments to deviations from the
forecast
Reduce stock-outs to make sure consumers can find the products they are looking for
Manage sell-through with analytics
High Priority Business Problems To Solve With Partners Next Year: Retailers Only
Retail Winners Others

27
BOOTstrap Recommendations
Better Together Overall, we were disappointed to see such lukewarm interest across the ecosystem in working together to get faster, smarter, and please the consumer. Since speed and consistency are what the consumer seems to want, and since the entire ecosystem knows it, it behooves us to work in concert to achieve these objectives. Certainly, anticipated increases in assortment breadth and potential rise in drop shipped product require a great deal of orchestration between vendor and retail partners.
The general lack of progress in creating efficient and effective omnichannel operations tells us that perhaps it’s time to try another approach. Particularly for retailers who are not winners, overcoming fear of competitive threats would go a long way towards improving brand identity.
For Retailers: Include The Ecosystem In Store Plans Retailers are clearly focused on trying to figure out the future of their stores, but this does not need to be an internal-only project. Including manufacturers and distributors in the discussion – or at least considering store strategy impact on these partners can play two important roles. One, it ensures that you come up with a future store format that your partners can actually support. And two, as these partners are struggling with questions about the relevancy of the retail channel, their involvement in the future of that channel will help build their understanding. Manufacturers need to understand the complexity and challenges of operating stores today, not so that they can do it better than you, but so that they can understand they may be biting off more than they can chew as they look to their own channel growth in the future – and so that they can bring their own creativity and goals to the future of the store, thus helping you support the channel, rather than working against it.
For Manufacturers: Pay Attention To Retail Channel Health For manufacturers, our advice is to pay attention to the health of your retail channels. If retailers are struggling, it may be worth doing more to support the channel, because if you lose a large retailer, you’re not going to be able to make up that volume with your existing online investments and stores.
It seems a bit drastic to worry about major retailers, but after Sports Authority shut its doors, it has become clear that industry shifts impact big and small retailers alike. While manufacturers are making moves to sell direct to consumers, and some of those moves may lead to a stronger store strategy, there is a reason why the retail channel exists in the first place – because you can’t do it all yourself.
For Distributors: Services Help Prevent Being Squeezed In The Middle With manufacturers going direct to consumer, and retailers increasingly interested in drop-ship relationships, it could seem on the surface that distributors will get squeezed in the middle. However, retailers need to get faster, and they need access to a larger assortment, and they need help in managing that. And manufacturers, as they seek to go direct themselves and struggle with a consolidating retail market, will need help too.
There are a lot of opportunities here for distributors, however, from this report is seems that more of them are focused on product promotions rather than services. This is a dangerous game, as
28
retailers are learning themselves – the race to the bottom ultimately has no winners, only companies who have destroyed a lot of value along the way. Distributors can help both sides of the retail market through services, including higher-end services for consumers themselves – if distributors recognize that a promotional strategy is not the answer.
For Logistics Service Providers: It’s All About Speed Retailers were clear, and their intentions will drive a lot of the behavior in the ecosystem, that they want the supply chain to get faster, especially the downstream end that connects products to customers. For LSP’s, the mandate is clear: help them get there. But there is also an opportunity to remind your partners that speed for speed’s sake can be dangerous – not every product is ideal for same-day delivery, especially when the consumer is the one who has to take on that cost of delivery. But should every ecosystem partner be aiming for same-day ship, as in, it leaves the four walls of the distribution center the same day the order is received? Yes, they should.
Omnichannel Fades Into The Background? We opened this report with a sense that omnichannel challenges were evolving into just plain business challenges, across the ecosystem. “Omnichannel” on its own is not necessarily as compelling as it used to be. But that does not mean that the ecosystem is no longer feeling the impact of omnichannel forces. As the term begins to fade into the background, all ecosystem partners would do well to remember that it has left a permanent mark on the industry – and that mark will not fade.

a
Appendix A: The BOOT Methodology© The BOOT Methodology© is designed to reveal and prioritize the following:
• Business Challenges – Retailers of all shapes and sizes face significant external challenges. These issues provide a business context for the subject being discussed and drive decision-making across the enterprise.
• Opportunities – Every challenge brings with it a set of opportunities, or ways to change and overcome that challenge. The ways retailers turn business challenges into opportunities often define the difference between winners and “also-rans.” Within the BOOT, we can also identify opportunities missed – and describe leading edge models we believe drive success.
• Organizational Inhibitors – Even as enterprises find opportunities to overcome their external challenges, they may find internal organizational inhibitors that keep them from executing on their vision. Opportunities can be found to overcome these inhibitors as well. Winning Retailers understand their organizational inhibitors and find creative, effective ways to overcome them.
• Technology Enablers – If a company can overcome its organizational inhibitors, it can use technology as an enabler to take advantage of the opportunities it identifies. Retail Winners are most adept at judiciously and effectively using these enablers, often far earlier than their peers.
A graphical depiction of the BOOT Methodology© follows:

b
Appendix B: About Our Sponsor
SPS Commerce perfects the power of trading partner relationships with the industry's most broadly adopted, retail cloud services platform. As a leader in cloud-based supply chain management solutions, we provide proven integrations and comprehensive retail performance analytics to thousands of customers worldwide. SPS Commerce has achieved 63 consecutive quarters of revenue growth and is headquartered in Minneapolis.

c
Appendix C: About RSR Research
Retail Systems Research (“RSR”) is the only research company run by retailers for the retail industry. RSR provides insight into business and technology challenges facing the extended retail industry, providing thought leadership and advice on navigating these challenges for specific companies and the industry at large. We do this by:
• Identifying information that helps retailers and their trading partners to build more efficient and profitable businesses;
• Identifying industry issues that solutions providers must address to be relevant in the extended retail industry;
• Providing insight and analysis about a broad spectrum of issues and trends in the Extended Retail Industry.
Copyright© 2017 by Retail Systems Research LLC • All rights reserved.
No part of the contents of this document may be reproduced or transmitted in any form or by any means without the permission of the publisher. Contact [email protected] for more information.