Retail In-store Design and Sensory Cues -...
72
Retail In-store Design and Sensory Cues MASTER DEGREE THESIS WITHIN: Business Administration NUMBER OF CREDITS: 15 PROGRAMME OF STUDY: International Marketing AUTHOR: Yuyu Wang & Jingjing Wu JÖNKÖPING February 2017
Transcript of Retail In-store Design and Sensory Cues -...

Retail In-store Design and Sensory Cues
MASTER DEGREE
THESIS WITHIN: Business Administration
NUMBER OF CREDITS: 15
PROGRAMME OF STUDY: International
Marketing
AUTHOR: Yuyu Wang & Jingjing Wu
JÖNKÖPING February 2017
i
Master Thesis in Business Administration
Title: Retail in-store design and sensory cues
Authors: Yuyu Wang & Jingjing Wu
Tutor: Darko Pantelic
Date: 2017-08-14
Key terms: Sensory marketing, sensory cues, sensory stimuli, retail industry, consumer
behaviour, female consumers, purchase intention, positive emotion
Abstract
Background Female consumers are powerful purchasers; sensory marketing is
regarded as an effective marketing strategy to reach female consumer
group. The sensory cues in the cosmetic retail environment can be
considered as: layout and lighting effect, the ambient scents diffused, the
music playing, and the opportunity to test the cosmetic products.
Purpose The purpose of this study aims to investigate what sensory cues in a
cosmetic shop have a better capacity to trigger female consumer’s
positive emotion, as well as to identify the impact level of these sensory
stimuli on female’s purchase intention in the cosmetic retail environment.
Method With the support of the proposed hypotheses and conceptual model from
the theoretical framework, a quantitative research was conducted. A total
of 188 responses was collected from online questionnaire. The target
sampling population of the questionnaire was determined by using a
judgmental convenience sampling.
Conclusion The research demonstrated that both olfactory cues and tactile cues enable
to trigger female’s consumer positive emotion in a cosmetic store.
Furthermore, visual stimuli have the most positive influence on female
consumer’s purchase intention in a cosmetic retail store.

ii
Acknowledgement
First and foremost, we would like to express our sincere gratitude to our thesis supervisor,
Darko Pantelic. Without his continuous support, patience, insightful comments and
encouragement, our master thesis would have never been finished.
We would also like to express our gratitude to our fellows, who have given us valuable
constructive criticism and friendly suggestions during the whole process of the thesis. Truly
thanks for their illuminating advice.
Furthermore, we would like to thank all the participants of the online questionnaire. Without
their precious assistance, the research cannot be further conducted.
Lastly, we would like to express our gratitude to everyone who supported the process of this
master thesis.
Thank you,
Yuyu Wang and Jingjing Wu

iii
Table of Contents
1. Introduction ........................................................................... 6
1.1 Background ............................................................................................ 6
1.2 Research purpose .................................................................................. 7
1.3 Research question ................................................................................. 8
1.4 Contribution............................................................................................ 8
1.5 Delimitation ............................................................................................ 9
1.6 Limitation of the study ............................................................................ 9
1.7 Key words ............................................................................................ 10
2. Frame of reference .............................................................. 11
2.1 Sensory marketing ............................................................................... 11
2.1.1 Tactile dimension ................................................................................. 13
2.1.2 Olfactory dimension ............................................................................. 14
2.1.3 Auditory dimension .............................................................................. 15
2.1.4 Visual dimension .................................................................................. 15
2.1.5 Taste dimension ................................................................................... 16
2.2 Retail environment ............................................................................... 16
2.3 Consumer behaviour ............................................................................ 18
2.3.1 Mehrabian-Russell Model .................................................................... 18
2.3.2 The impact of mood ............................................................................. 19
2.3.3 Approach and avoidance behaviour ..................................................... 22
2.4 Female consumer characteristics ........................................................ 24
2.4.1 Female consumer behaviour in cosmetic retail store ........................... 24
2.4.2 Female consumer and sensory marketing ........................................... 25
2.5 Hypothesis and conceptual model ....................................................... 26
2.5.1 Hypothesis ........................................................................................... 26
2.5.2 Conceptual model ................................................................................ 27
3. Methodology ........................................................................ 29
3.1 Research philosophy ........................................................................... 29
3.2 Research approach .............................................................................. 30
3.3 Research design .................................................................................. 30

iv
3.4 Data collection ..................................................................................... 31
3.4.1 Quantitative method ............................................................................. 32
3.4.2 The questionnaire design ..................................................................... 32
3.4.3 Sampling techniques ............................................................................ 33
3.5 Quantitative data analysis .................................................................... 34
3.5.1 Evaluation of the fitness of SEM .......................................................... 35
3.5.2 Evaluation of the relationships among variables .................................. 36
3.5.3 Evaluation of the effect size among variables ...................................... 36
3.6 Reliability and validity ........................................................................... 36
3.7 Summary ............................................................................................. 37
4. Findings ............................................................................... 38
4.1 Response ............................................................................................. 38
4.2 Reliability Summary ............................................................................. 38
4.3 Respondent introduction ...................................................................... 39
4.4 Descriptive information ........................................................................ 40
4.5 Results of structural equation model .................................................... 42
4.5.1 Evaluation of initial model fitness ......................................................... 42
4.5.2 Model modification ............................................................................... 43
4.5.3 Evaluation of revised model fitness ...................................................... 44
4.5.4 Results ................................................................................................. 45
4.5.5 Summary of the hypotheses and findings ............................................ 48
5. Discussion ........................................................................... 50
5.1 Discussion ........................................................................................... 50
6. Conclusion .......................................................................... 55
6.1 Conclusion ........................................................................................... 55
6.2 Managerial implications ....................................................................... 56
6.3 Future research .................................................................................... 57
Reference list ............................................................................... 58
Appendix....................................................................................... 68
v
Figures
Figure 1. A conceptual framework of sensory strategy (Krishna, 2011)
Figure 2. Five sensory senses (Hultén, 2009)
Figure 3. The Mehrabian-Russell Model (1974)
Figure 4. Dimensions of emotional states (Russell & Pratt, 1980)
Figure 5. The Conceptual model developed based on the SOR-model of Mehrabian
and Russell (1974)
Figure 6. Research onion (Saunders et al., 2009, p.138)
Figure 7. Initial SEM estimation
Figure 8. The revised model
Tables
Table 1. Overview of hypotheses and theoretical support
Table 2. The acceptable level for fitness indices (Browne & Cudeck, 1993; McDonald & Ho,
2002)
Table 3. Reliability summary
Table 4. Dataset of respondents’ information
Table 5. Respondents’ purchasing frequency in different stores (n=188)
Table 6. Respondents’ staying time in different cosmetic stores (n=188)
Table 7. Fitness indices of the initial model
Table 8. The fitness indices of the revised model
Table 9. Summary of the path coefficient
Table 10. Overview of hypotheses results

6
1. Introduction
The following part is going to give a general introduction of this thesis. To be more specific, it consists of
research background, research purpose, research question, contribution, delimitation, limitation and
related keywords that used in the whole thesis.
1.1 Background
In the contemporary context of experience economy, the majority of retailers and manufacturers have
acknowledged that it is far from enough to satisfy individual consumers or enterprises through providing
them with products and service (Carù & Cova, 2003). A major trend that favoured by dozens of customers is
that they expect to enjoy a more individualized consumption experience but against the almost same and
unified retail design when entering a store (Dowdy, 2008). Hence, under the context of high homogenization
of products, empathizing on the interior design can be an appropriate strategy for the retail store to enhance
discrimination from a variety of competitors (Castro & Navarro, 2003).
As competition for store-based business has become increasingly strong, in terms of price, convenience,
time savings and trading efficiency, it is necessary for retailers to explore and create a new and
comprehensive point of competitive predominance and transaction philosophy (Ogden-Barnes & Barclay,
2011). In retail practice, when individual enters a retail store, the whole process can be considered as a
sensory experience, including vision, sound, touch, smell and taste, which will affect his or her purchase
intention, and the subjective feeling and experience might contribute to make a final purchasing decision
(Krishna, 2012). Research also indicates that creating a favourable atmosphere by using the sensory attributes
would contribute to enhance the store differentiation (Sakamoto et al., 2017; Chrysi, 2013). Hence, it seems to
be an opportunity for majority of retailers to connect with consumers’ five senses. In fact, it is approved by a
number of retailers that sensory engagement has played a significant part in reinvigorating the store
experience (Ogden-Barnes & Barclay, 2011). For example, Singapore Airlines has developed Stephen
Florian perfume for stewardess and nacelle, and the company has made this patent for perfume to ensure that
customers have a unique sense of smell on their brand (Linstrom, 2010).
It is acknowledged that consumers are the main determinants of success or failure in the contemporary retail
stores (Fiore & Kim, 2007), especially for female consumers. As Huddleston and Minahan (2011, p.5)
claimed: “women call the shots in the vast majority of consumer decisions.” Female consumers are mainly
hedonic shoppers as they are in the pursuit of an emotionally pleasant shopping experience, in spite of purchase
or not (Kim, 2006; (Mpinganjira, 2014). In fact, a female consumer's desire to enjoy unique shopping
experience could be satisfied through creating an enjoyable and positive store atmospherics, since it is
7
considered to affect consumer's perception, force positive thinking and encourage consumers to try new
products (Puccinelli et al, 2009; Wanger, 2002). Therefore, through attracting female consumer's senses,
emotions and values, guiding the retail design of the store and creating an unforgettable customer experience
seem to be effective measures for distinguishing between oneself and its competitors in current retail stores
(Petermans & Van Cleempoel, 2009). Considering that the retail environment enables to influence customer
sentiment and further exert an impact on consumer response, understanding the actual consumer’ in-store
performance is necessary for retail studies (Donovan & Rossiter, 1982; Fiore & Kim, 2007). On the other
hand, researches could also pay attention to the mediating role of sentiment on consumer response. Namely,
in order to figure out female consumers’ understanding of the retail in-store environment, retail investigators
should emphasize on identifying how consumers interpret an actual retail environment and which sentiments
they experience under this certain environment. (Petermans & Van Cleempoel, 2010)
Hence, there is a pathway for designing more effective, efficient and practical retail interiors, which is to pay
attention to the tangible and sensory perspectives of customer engagement (Houliez, 2010). The introduction
of sensory effects in retail store generally means “shopping arousal”, which can be considered as an
activating factor during the process of purchase decision. However, it exists challenges when applying these
sensory cues, and it requires to understand and adopt the suitable tactics so that the sensory cues enable exert
maximum impact (Ogden-Barnes & Barclay, 2011). In a word, retailers must re-examine the theories and
practices of in-store consumer participation and learn more about how their physical store environments are
used to achieve the best results to increase female customers’ purchase intention and ensure customer
satisfaction.
1.2 Research purpose
The purpose of this study aims to investigate what sensory cues in a cosmetic shop have a better capacity to
trigger female consumer’s positive emotion, as well as to identify the impact level of these sensory stimuli
on female’s purchase intention in the cosmetic retail environment. In order to achieve the research purposes,
the following research objectives will be set:
The most important is to assess the impact level of each sensory component on female customers’ purchase
intention. In addition, to recommend the sensory strategy that would be suitable for increasing female
customers’ purchase intention.

8
1.3 Research question
Based on the research purpose mentioned before, the main objective of this thesis is to answer the research
questions:
RQ1. What sensory cues can trigger female consumer’s positive emotion in a cosmetic store?
This research question aims to identify which sensory cues have a better capacity of triggering female’s
positive emotion. To answer this research question, four hypotheses were proposed. A questionnaire will be
constructed to provide results for answering this question. Besides, a statistical analysis technique, SEM
(structural equation modeling), will be used to identify the relationship between the sensory cues and
positive emotion. The higher magnitude of path coefficient, the better performance of this sensory cue.
SEM enables to present clear relationships among different and numerous variables by using a graphical
figure (Suhr, 2006). By comparison with traditional statistical method, SEM seems to have a distinct
superiority in the aspect of avoiding measurement errors; besides, a key benefit of SEM is that it enables to
evaluate all of the hypothesized relationships and measure the influence of latent variables (Byrne, 2001;
Suhr, 2006).
RQ2. Which sensory stimuli has the most impact on female customers’ purchase intention in the cosmetic
retail environment?
To answer this research question, another four hypotheses were proposed. It is assumed that visual stimuli,
olfactory stimuli, tactile stimuli and auditory stimuli all enable to exert a positive influence on female
consumers’ purchase intention in a cosmetic retail store. Then SEM will also be used to compare the
magnitude of each path coefficient and finally decide the effect size of each sensory stimulus on female’s
purchase intention. The highest magnitude of path coefficient indicates this sensory stimulus have the most
positive effect on female consumer’s purchase intention.
1.4 Contribution
A number of previous researches have contributed to the topic of using sensory marketing as a strategy have
a positive impact on purchase intention (Krishna, 2012; Grębosz & Wronska, 2013). However, till authors’
knowledge very few research has addressed female consumers as an important variable in terms of sensory
marketing, especially in the cosmetic retail industry. Huddleston (2017, p.10) has claimed that “female
consumers are powerful purchasers yet there is no substantive body of theory on how to target them
effectively”. In general, when it comes to cosmetics, people seem to associate them with female groups, and

9
the fact is that many cosmetic enterprises also regard young female consumers as their main target groups
(Kumar et al., 2006). Hence, it is supposed that marketers could consider to apply different strategies
according to different gender. Therefore, this thesis will provide guidelines to cosmetic retailers who mainly
has female customers as target group.
The result from this thesis would help marketers to figure out how to efficiently use in-store design to attract
female consumers and to heighten female consumers’ sensory stimulation. Moreover, findings will give
credibility to the field and allow marketers to find a strategy to differentiate from competitors.
1.5 Delimitation
For better comprehensibility of this thesis, there are several points needs to be figured out. Firstly, since
there are many types of retailers, according to Baines, Fill & Page (2008), who have classified retailers into
six types, including department stores, discount stores, limited line retailers, category killer stores,
supermarket, convenience store, however, we only emphasize on research of limited line retailers. For this
type of retailer, it is characterized by offering a narrow but deep product classification and consumer service
that distinguish from other stores (Baines et al., 2008). Clothing retailers, furniture stores and cosmetic
stores that specialize in small amount but relevant product types could be regarded as examples.
Secondly, the research only investigates the four senses: visual sense, auditory sense, olfactory sense and
tactile sense, while ignoring the taste sense. Since in this case, unlike the restaurant industry, there leaves a
little room for enterprises in the cosmetic industry to adopt gustative marketing strategies. Therefore, the
taste sense will not be considered and the other four senses are considered to exert more impact on the target
market.
1.6 Limitation of the study
This research is limited in several ways which directly lead to further research implications:
First of all, due to the time constraints, the number of collected questionnaire is limited. Extended time could
have allowed to collect a bigger amount of answers. As a result, it would be advisory to collect more
answers in the future so that to collect a bigger sample of data.
Secondly, this thesis only surveyed female customers about cosmetic shop, the result may not be able to
apply to other type of shops. It is advisory for conduct more researches in different areas according to
different genders. According to Liang, Chen, Duan and Ni (2013), sensory marketing will be the mainstream

10
of future market. How to efficiently use sensory marketing to stimulate purchase and to achieve better result
will become the topics for future studies.
1.7 Key words
Sensory marketing: marketing that engages the consumers' senses and affects their perception, judgment and
behaviour (Krishna, 2012)
Purchase intention: It is a purchase probability, associated with an intention at the percentage of individuals
that will actually buy the product (Whitlar, Geurts, and Swenson, 1993)
Sensory cue: a sense stimulus that evokes a response or a behaviour pattern (Pam, n.d.).
Retailing: is all the activities that directly relevant with the sales of goods and the end customer for private
use and non-business use (Baines et al., 2008).
Atmosphere: “the design of the of retail chain outlet that produces specific emotional effects on the buyer
that enhances his purchasing probability” (Kotler, 1973, p.74)
Positive emotion: primarily include arousing, exciting, pleasant and relaxing in this case (Russell & Pratt,
1980)
Cosmetic industry: a profitable fast moving but high competitive industry, which mainly sells skin care
products, make-up and perfume, etc. (Larsen & Tambo, 2014).
SEM: structural equation modelling

11
2. Frame of reference
This chapter presents a review of existing literature, concepts and theories on sensory marketing and
relevant concept, for example, consumer behaviour, retail atmospherics. The frame of reference will provide
a foundation for the whole research.
2.1 Sensory marketing
With the ongoing globalization trend, the competition among brands has become fierce and harsh, brands
have to develop new marketing strategies to combat competition. Considering the huge amount of
advertisement messages that consumers receive every day, marketers noticed that unconscious triggers that
are attracted to the basic senses might be a more efficient way to marketing products (Krishna, 2012). Thus,
in order to stand out, the concept of sensory marketing has been introduced. The emergence of sensory
marketing also illustrates the transition from a traditional marketing approach which emphasizes on the
vision of need recognition, information search, evaluation of alternatives and product’s attributes to a new
marketing approach that emphasizes on the vision of creating the experiences, senses as emotional fraction
of humans (Rajput & Dhillon, 2013).
Numerous researchers (Krishna, 2012; Lindstrom, 2005; Hultén, 2011) have developed theories on sensory
marketing. Krishna (2012, p.332) defined sensory marketing as “marketing that engages the consumers'
senses and affects their perception, judgment and behaviour”. Krishna (2012) also claims that sensory
marketing can be used to create subconscious triggers that define consumer perceptions of abstract notion of
the product. The following figure 1 shows Krishna (2012) conceptual framework of sensory strategy, which
suggests sensory marketing is an application of the understanding of sensation and perception to the field of
marketing. The process contains all the sensation elements which creates perception. Further, the perception
creates emotion and cognition which then define consumer’s attitude, learning and memory, and behaviour.
By using sensory marketing strategy based on this model, marketers are supposed to differentiate their
products in a highly individualized manner so as to exert an influence on consumer behaviour (Krishna,
2012).

12
Figure 1. A conceptual framework of sensory strategy (Krishna, 2011)
As previous literature reveals, the five human senses are of importance for the individual’s experience of
different purchase and consumption processes (Agapito, Valle, & Mendes, 2012). Hultén (2011) suggests
the main purpose of sensory marketing strategy is to facilitate the multi-sensory brand-experience expressed
through means as sensors, sensations, and sensory expressions in relation to the five human senses.
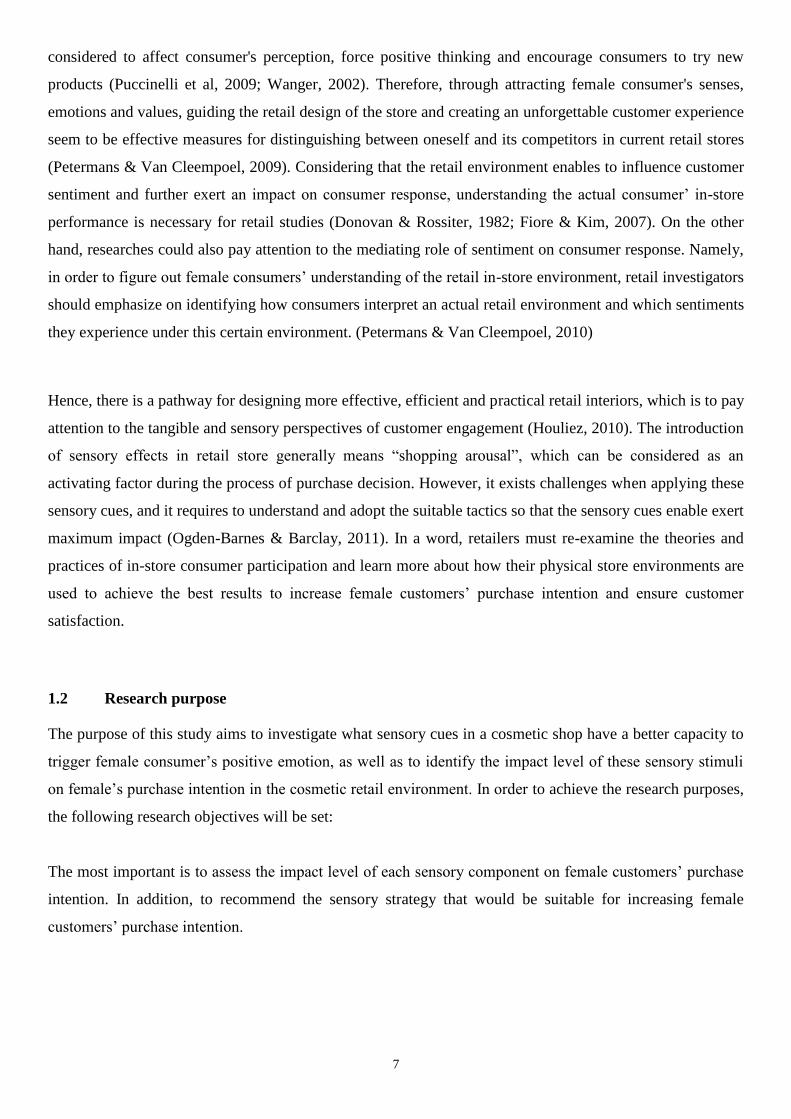
As can be seen from the following figure 2, sensors aim at communicating sensations and sensory
expressions that reinforce the multi-sensory brand experience for the customer, which can also be defined as
communicative means (Hultén, 2011). A sensation is defined as an emotion or feeling that deliberately links
the human mind and the senses (Hultén, 2011). The reason for a store to deliver a sensation is to be observed
by its customers. This is important since the human senses continually notice every small change in the
environment, and it links to memories (Lindstrom, 2005). Sensation helps to attract customer’s attention in a
crowded, global marketplace. A sensory expression is defined as an experience trigger that clarifies a
brand’s identity and values and it helps to create a deep memory in customers’ mind (Hultén, 2011). To sum
up, all the sensations that a customer received will transform a normal shopping to an experience, which
brings stores a chance to be differentiated.
13
Figure 2 Five sensory senses (Hultén, 2009)
As mentioned the five senses have great influence on the individual’s experience of different purchase and
consumption. However, the majority of brands merely focus on two senses: sound and sight (Kotler, Keller,
Brady, Goodman & Hansen, 2016). As suggested by Lindstrom (2005) that all brands should try to build
sense as much as possible into the brand appeal. Managing the sensory experience makes good sense
relating to brand image creation and management (Kotler et al., 2016). Thus, retailers have to understand the
importance of sensory marketing and efficiently using these sensory stimuli to affect customers.
Sensory marketing aims to create an atmosphere that encourages customers to consume more (Joshi,
2015). In order to provide insights to marketer how to efficiently using sensory marketing strategy, in the
following chapter, the five sensory dimension will be explained in details.
2.1.1 Tactile dimension
Touching is an especially important sense at the stage of product assessment and store perception (Anıl &
Merve, 2015). Customers have different motivation and preferences to touch the products or experience the
touch in the service environment (Kolter et al, 2016). According to Krishna (2010), there are four types of
touch can be observed. The first three types of touch assume a consumer is engaged in goal-directed,
problem solving pre-purchase behaviour, which can also be called instrumental touch. At the simplest level,
consumers may touch the product only to make a purchase. At the next level, consumers may touch a
product to obtain non-haptic product information, for example touch to visually inspect the product, to smell
the product, etc. Finally, consumers may touch a product in order to obtain haptic product information, for
example texture, hardness, weight or the temperate of the product. And the fourth type is called hedonic

14
touch. The goal of this touch is to general explore the product and to have fun. Hedonic touch may or may
nor ultimately result in product purchase.
Unlike other senses, the touch sense is an intimate sense which requires the contact with skin, and it is the
most useful when individuals physically touch an object (Hultén, Broweus & Van, 2009). It has been proved
that offering ample opportunities for customers to touch or test the products can lead to increased sales
(Kolter et al, 2016). When customers touch an object, they create image in minds and touch can trigger
connection with product quality (Kolter et al, 2016). Touching an object enables customers to relive
memories by feeling the texture, whether it is soft or hard, warm or cold (Hultén, Broweus & Van, 2009).
Sometimes, touching the product is supposed to trigger an emotional response from the consumer which
might increases the chance of impulsive buying and unplanned purchase (Kolter et al, 2016). Therefore,
consciously using texture in sensory marketing can increase the perceived value of a brand for customers
(Hultén, Broweus & Van, 2009). Thereby, tactile marketing gives a deeper meaning.
2.1.2 Olfactory dimension
The sense of smell is the only sense that people can not turn off and 75% of human’s emotions are triggered
by this sense (Lindstöm, 2005). According to Hultén et al (2009), different sense expressions that can be
used to create a smell experience. First is the product congruence, intensity and sex. Product congruence
refers to the degree of the odour is congruent of the retail product or the retail environment. For example, if
the main colour tone in the shop is yellow, it smells like orange not grape. Intensity is whether a scent is
distinct or subtle. Furthermore, sex means a scent can be feminine or masculine. Secondly, scents can be
used to create for a certain atmosphere, theme or advertency. Last but not least, a scent can be used as a
signature scent or to create a scent brand. Both of them are used to differentiate the brand in the marketplace.
For example, Victoria's Secret is a great example for using fragrance as a signature scent in their stores
(Goldkuhl & Styvén, 2007).
The sense of smell has been used as a marketing strategy by many marketers to gain consumers’ attention
nowadays. This strategy is not only applied by marketers but also studied by academics (Hultén et al, 2009;
Bradford & Desrochers, 2009). These academic experts try to figure out the extent of effectiveness of the
sense of smell in marketing. According to the conclusion, using scents congruent strategy would lead to a
positive outcome for instance strengthening brand image and resulting in additional revenues (Hultén et al,
2009, Herrmann, Zidansek, Sprott, & Spangenberg, 2012).
15
2.1.3 Auditory dimension
Sound has been applied in mass marketing for a long time, almost all the commercials has to include sound
element to convey the message clearly. Many researches indicate that sound has been using as a tool to
communicate with customers, or to arousing customers’ subconscious (Meyers-Levy, Bublitz & Peracchio,
2009). For example, from the jingle of a brand commercial to the familiar alert tone that you hear when
using your Apple phone, marketers successfully managed in shaping customers’ thoughts, judgments and
behaviours by using variety of sounds (Meyers-Levy, Bublitz & Peracchio, 2009).
To create a sound experience, using music is a relatively common way by marketers. According to Yorkston
(2010), the influence of music on customers can be studied by mainly following aspects: music tempo,
music type and music volume. The music tempo is often correlated with the shopping pace. It was proven
slower music keeps consumers stay more in the shop with greater consumption compared with fast music
(Milliman, 1982). On the other hand, fast music helps to heightened arousal and increase positive attitudes
(Milliman, 1982). The type of music also influences customer behaviour, not only on pace and time
perception but also affects product choice. In order to play the suitable music, the type of music should be
chosen according to the target demographics’ particular taste (Yorkston, 2010). The volume of music also
affect the amount of time spent in a shop. It has been found that customers stay less time in a shop when the
music was loud compared with music was soft (Yorkston, 2010).
2.1.4 Visual dimension
It is known that visual stimuli have a strong influence on humans compared with other sense stimuli, about
90% of information transmitted to human brain is visual (Ciprian Pavel, n.d.). Sight helps human perceive
different characteristics of an object, notice the changes in environment, many people trust their visual sense
completely (Hultén et al., 2009). This might be the reason that vision becomes the most commonly used
sense in marketing (Krishna, Cian& Sokolova, 2016).
The usage of visual stimuli in retail store is usually connected to how customers see the service, the
environment and particularly the interior design (Kotler, Keller, Brady, Goodman & Hansen,2016). For
example, the wall in the store is painted in plain white, the floor is earth tone and the lighting is bright
glaring light. There is one thing to bear in mind when designing a visual experience, the visualization of a
store’s sense expressions should clarify a store’s or a brand’s identity in order to create brand awareness and

16
brand image. Since most of customers’ decisions in daily life are based on sight impression (Hultén et al.,
2009).
2.1.5 Taste dimension
Lindström (2010) affirms that taste is detected by special structures: taste buds. Human’s tongue is equipped
with numerous taste buds and each buds has 50 to 100 taste cells. These cell convey the information to the
brain whenever people are eating food and this process form the basic sense of taste (Krishna & Elder, 2010).
It is believed individuals perceive differently on the taste, not only male and female have a different
sensitive levels towards the taste but also with people get old, their taste gradually changes as well (Mojet,
Christ-Hazelhof & Heidema, 2001). As a result, the sense of taste is considerably more complex compared
with other senses.
To sum up, Krishna (2012, p.2) defines sensory marketing as “marketing that engages the consumers’ senses
and affects their behaviours”. The five sensory dimensions do have an effect on the establishment of a
sensory experience. The personal sensory experience might enable the individual to develop behavioural,
emotional values toward the services or the products offered (Nasermoadeli, Ling & Maghnati, 2013).
Although the positive impacts that sensory marketing has, the managerial decision about applying sensory
marketing to the retail environment should be made with caution. Therefore, before applying sensory
marketing, the knowledge of retail environment should be studied first in order to achieve a better result.
2.2 Retail environment
Kotler (1973, p.74) has defined the atmosphere as “the design of the of retail chain outlet that produces
specific emotional effects on the buyer that enhances his purchasing probability”. Kotler (1973) also pointed
that the atmosphere of an area seems to increasingly occupy a dominant position than the product itself, and
emphasized that the atmosphere of a place could be considered as the prime product. In practical retail
environment, customers generally not only react to the tangible products or service that provided by the
store, but also pay attention the overall retail store environment (Kotler, 1973). Previous researchers
(Donovan & Rositer, 1982; Foxall, 1997; Levy & Weitz, 2012) have pointed that the atmosphere of a store
enables to exert an unseen but significant impact on customers’ in-store behaviour. As mentioned above,
consumers’ in-store behaviour can also be affected by shoppers’ general perception of the retail environment
(Mehrabian & Russell, 1974; Russell et al., 2016). To be more specific, the store environmental factors,
including the layout, colour, lighting, music and scent, can exert an impact on consumers’ subjective

17
feelings that experienced in the store, and subsequently affect their purchase intention, perceived quality,
sum of consumption, satisfaction (Olahut et al., 2012; Babin & Attaway, 2000).
Furthermore, Kotler (1973) claimed that store atmosphere could be regarded as an important marketing tool
in the industry that has small distinction. Product and price are the most important and discriminative criteria
from competitors in the past, however, many retailers have noticed that creating a differentiation advantage
has become progressively more difficult through just relying on the application of marketing mix: product,
price, promotion and place (Baker et al., 1992; Gou-Fong Liaw, 2007). Besides, McDonald, Rogers and
Woodburn (2000) have stated that nowadays consumers are becoming more experienced, more complex and
better informed. A major trend that favoured by dozens of customers is that they expect to enjoy a more
individualized consumption experience but against the almost same and unified retail design when entering a
store (Dowdy, 2008). Hence, under the context of high homogenization of products, empathizing on the
interior design can be an appropriate strategy for the retail store to enhance discrimination from a variety of
competitors (Castro & Navarro, 2003). In fact, consumer's desire to enjoy unique shopping experience could
be satisfied through creating a good and positive store atmospherics, since it is considered to impact
consumer's perception, force positive thinking and encourage consumers to try new products (Puccinelli et al,
2009; Wanger, 2002).
It is a fact that cosmetics have existed for a long time, approximately. There are a variety of products types
concerning cosmetics, such as make-up, perfume, skin-care, and hair-care, while the general purpose of
cosmetics is to beautify oneself (Kumar et al., 2006). Cosmetic industry, nowadays, is regarded as a
profitable fast moving but high competitive industry (US Commercial Service, 2015). The statistics have
indicated that the global annual consumption on cosmetics have reached $18 billion dollars, additionally,
numerous investors in this field scramble to enhance their market shares (Khraim, 2011). Therefore, an
innovative marketing strategy is in urgent need in order to survive in the intensely competitive market
(Larsen & Tambo, 2014). An appropriate store design is considered as a critical asset for certain brands
(Foscht et al., 2014). Research has suggested that sensory marketing plays a prominent part during
consumer’s purchase experience in fashion stores (Foscht et al., 2014). Therefore, creating a favorable
atmosphere would contribute to enhance the store differentiation, especially in the highly competitive
cosmetic industry (Sakamoto et al., 2017; Chrysi, 2013).
To sum up, considering that the atmosphere of a retail store could influence consumers’ emotional and
cognitive status (Castro & Navarro, 2003). Therefore, the design of in-store environment should take
consumers’ expectations into consideration, especially the target consumers’ requirements (Countryman &
Jang, 2006). Therefore, the following part will investigate the consumer characteristics specifically in the
retail environment.

18
2.3 Consumer behaviour
As Krishna (2012, p.2) defines sensory marketing as “marketing that engages the consumers’ senses and
affects their behaviours”. The five sensory dimensions do have an effect on the establishment of a sensory
experience. The personal sensory experience might enable the individual to develop behavioural, emotional
values toward the services or the products offered (Nasermoadeli, Ling & Maghnati, 2013). Although the
positive impacts that sensory marketing has, the managerial decision about applying sensory marketing to
the retail environment should be made with caution. Therefore, before applying sensory marketing, the
consumer behaviour should be studied first in order to better understand customers.
2.3.1 Mehrabian-Russell Model
An environmental psychology model presented by Mehrabian and Russell Model (1974) is applied to this thesis.
This model is commonly used in retailing environment (Mehrabian & Russell, 1974). This model assumed that
environmental stimuli influences consumer’s mood state On the other hand, mood state exerts influence on
consumer’s response, for example on approach or avoidance behaviour. The application of this model enables the
study of environmental changes impact on emotions and consumer behaviour (Ryu & Jang, 2008).
The M-R model is based on the Stimulus-Organism-Response (S-O-R) paradigm. The S-O-R paradigm explains
the environment (S) impact on approach - avoidance behaviours (R), mediated by the individual’s emotional
states (O). The Mehrabian - Russell model is commonly used concerning the study of store atmosphere
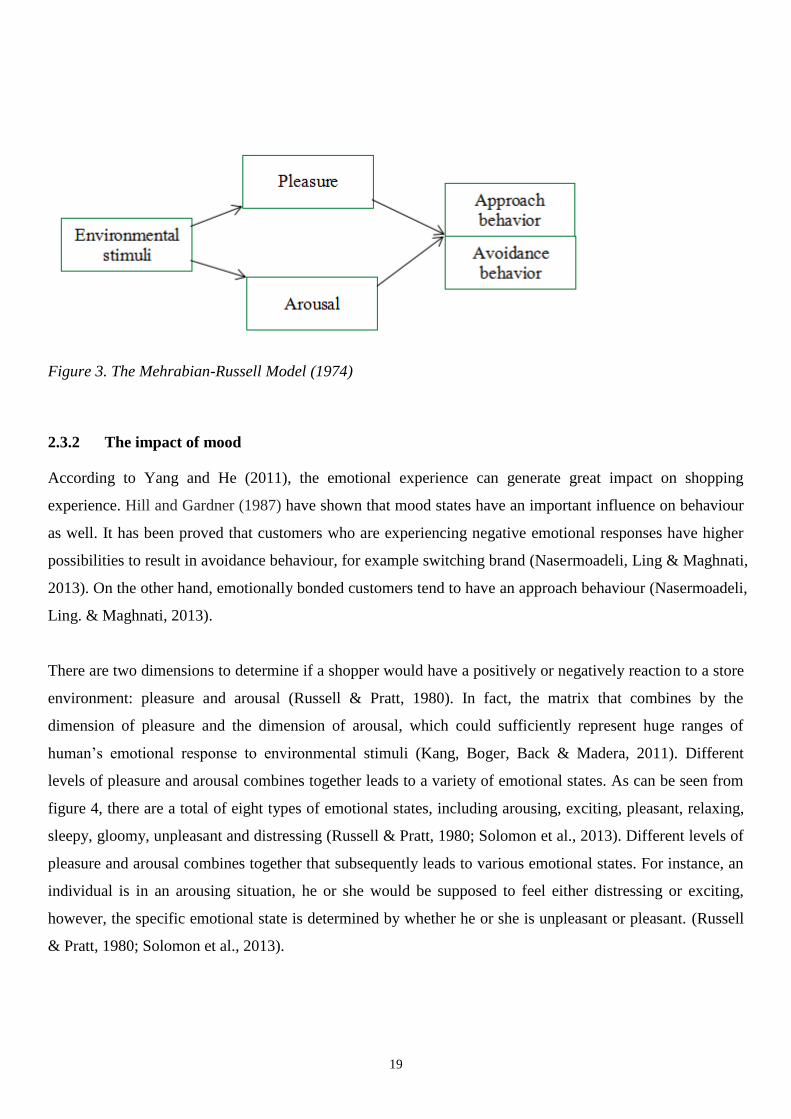
(Donovan, Rossiter, Marcoolyn & Nesdale, 1994). As the figure 3 illustrated, the model contains three elements,
which are environmental stimuli, emotional states and behaviour. The environmental stimuli include stimuli from
the store, for instance images, sounds, smell, etc (Sullivan & Adcock, 2002). The basic premise of this model is
that a shopper’s mood states are created by the shopping environment, and the behaviour can be affected by the
mood states (Sullivan & Adcock, 2002).
As figure 3 illustrated, there are two levels of responses can be observed. The first level of response is the
development of a mood state. In this model, a consumer’s mood state is described by two variables, which are
pleasure and arousal. Pleasure is used to describe as the extent to which a consumer feels good in the store
(Sullivan & Adcock, 2002). Whereas, arousal can be described as the extent to which a consumer feels
stimulated or excited (Sullivan & Adcock, 2002). The second level of response is behaviour based on consumer’s
mood state. This behaviour can be categorized into approach behaviour and avoidance behaviour.
In this thesis, authors developed the conceptual model based on the Mehrabian-Russell Model. Since the first
component of this thesis environmental stimuli has been discussed already, in the following chapter will
introduce the second component, the mood.
19
Figure 3. The Mehrabian-Russell Model (1974)
2.3.2 The impact of mood
According to Yang and He (2011), the emotional experience can generate great impact on shopping
experience. Hill and Gardner (1987) have shown that mood states have an important influence on behaviour
as well. It has been proved that customers who are experiencing negative emotional responses have higher
possibilities to result in avoidance behaviour, for example switching brand (Nasermoadeli, Ling & Maghnati,
2013). On the other hand, emotionally bonded customers tend to have an approach behaviour (Nasermoadeli,
Ling. & Maghnati, 2013).
There are two dimensions to determine if a shopper would have a positively or negatively reaction to a store
environment: pleasure and arousal (Russell & Pratt, 1980). In fact, the matrix that combines by the
dimension of pleasure and the dimension of arousal, which could sufficiently represent huge ranges of
human’s emotional response to environmental stimuli (Kang, Boger, Back & Madera, 2011). Different
levels of pleasure and arousal combines together leads to a variety of emotional states. As can be seen from
figure 4, there are a total of eight types of emotional states, including arousing, exciting, pleasant, relaxing,
sleepy, gloomy, unpleasant and distressing (Russell & Pratt, 1980; Solomon et al., 2013). Different levels of
pleasure and arousal combines together that subsequently leads to various emotional states. For instance, an
individual is in an arousing situation, he or she would be supposed to feel either distressing or exciting,
however, the specific emotional state is determined by whether he or she is unpleasant or pleasant. (Russell
& Pratt, 1980; Solomon et al., 2013).

20
Figure 4. Dimensions of emotional states (Russell & Pratt, 1980)
Generally, a consumer’s emotional state is supposed to be influenced by a variety of variables when entering
a retail store (Solomon et al., 2013). A number of researches have claimed that the sensory attributes of the
product itself enables to exert a more influential effect than extrinsic product cues on people’s emotional
reactions, including aspiration, satisfaction, and enthusiasm (Hinton & Henley, 1993; Ng et al., 2013). For
example, the research has indicated that human’s sensory inputs, such as visual experience, olfactory
experience, auditory experience and tactile experience, all enable to affect people’s emotional and cognitive
responses (Augustin, 2009). In short, the individual’s emotions enable to be influenced by the sensory
stimuli (Chen et al., 2009; Shu & Peck, 2011; Ng et al., 2013). In order to have a deep understanding, the
following part will discuss specifically how visual cues, olfactory cues, tactile cues and auditory cues impact
on mood.
● The effect of visual experience on mood
A number of previous researches (Donovan & Rossiter, 1982; Babin & Darden, 1995; Sherman et al, 1997;
Brengman & Geuens, 2003) have claimed that the visual cues as one of atmospheric elements, have a
potential to affect human’s mood in the retail environment. Nowadays, the visual cues, such as color, layout
and lighting effect are widely used in various retail stores for inspiring consumers and increasing brand
differentiation. For example, in terms of the lighting effects, as stated by Mehrabian (1976, p.89), “brightly
lit rooms are more arousing than dimly lit ones”. It was claimed that the brightness enabled to exert a strong
influence on the degree of people’s stimulation and arousal (Areni & Kim, 1994; Miwa & Hanyu, 2006). As
for the color in the interior retail environment, blue and green are generally considered to be the most

21
arousal in the retail environment (Dijksterhuis et al., 2005). Besides, blue and green interiors are claimed to
have better performance than warm interiors in a store (Crowley, 1993). Human’s positive mood, such as
hedonism and pleasure, can also be triggered by a well-designed layout in a retail store (Wakefield &
Blodgett, 1994; Mirabi & Samiey, 2015). In a word, it is suggested for retailers to consider the appropriate
use of visual cues in order to trigger positive mood from consumers in the retail store.
● The effect of olfactory experience on mood
The perception of scent includes more than the sensation of the scent itself, but also include the personal
experience and mood linked with the sensations (Social Issues Research Centre, n.d). Different people has
different scent preference and scents enable to trigger a strong emotional reaction and exert a powerful
influence on individual memory (Lindström, 2005). Besides, the ambient scent is more likely to create a
positive emotional state (Kotler, 1973; Dani & Vanishree, 2013). However, it seems that there is merely
positive relevance and pleasant memory that triggered by scents (Mercola, 2015). A scent can lead to a
mixed result, either trigger a positive mood or negative mood, but it all depend on the receivers themselves
since the emotional reaction may vary from person (Dani & Panalkar, 2013). In this case, it is suggested for
marketers and retailers to carefully used the scents in the retail store.
● The effect of tactile experience on mood
In terms of human’s tactile sense, Essick, James and McGlone (1999) has claimed that there is an
association between individual’s emotional reactions and tactile cues, such as products’ physical attributes.
Research has also indicated that if consumers are allowed to touch or test the product, they would generate a
more positive emotional reaction towards their experience of touch, even though there is inadequate
information provided by the tactile cues (Peck & Wiggins, 2006). In cosmetic retail environment, consumers
seem to be more accustomed that almost every cosmetic store provide free cosmetic samples for consumers
to test it (Gannon, 2011). If consumers’ senses are positively triggered through the opportunity of touching
or testing the cosmetic products, it is more likely to generate a more positive evaluation towards the
cosmetic product (Theofanides & Kerasidou, 2012). This would be an especially effective for female
consumers, because their pleasant tactile experience and strong emotional systems would persuade them into
impulsive purchasing (Gannon, 2011).
A number of studies seem to emphasize on the importance of positive emotions that triggered by the tactile
cues, however, it is inevitable to acknowledge that negative and unpleasant emotions is also possible to be
triggered by the tactile cues (Saariluomaand & Jokinen, 2014). Suppose that a consumer has a strong desire
to touch or test the product to feel its intrinsic sensory properties, but he or she is not allowed to touch it,
then a negative emotion is highly possible to be triggered (Fiore & Damhorst, 1992; Schifferstein & Spence,
2008; Lu et al., 2012) and subsequently generate a less positive product evaluation (Grohmann et al., 2007).

22
Therefore, it is suggested for retailers to consider whether provide the opportunity to touch or test the
product, but it should depend on the product types.
● The effect of auditory experience on mood
In order to create a favourable auditory experience, music has been used in the retail environment for
communicating with consumers or arousing consumers’ subconscious (Meyers-Levy, Bublitz & Peracchio,
2009). Besides, the potential of music could also be considered a powerful function for inducing consumers’
emotions (Juslin & Sloboda 2010; Van der Zwaag et al. 2012). For example, Vanderark and Ely (1993)
claimed that if the music playing with high tempo and high rhythm in the retail store, then the consumers’
arousal feeling would increase accordingly. According to Dube´ et al.’s (1995) research, it also suggested
the adoption of music has induced consumers’ feeling of pleasure and arousal in a banking context.
Research also indicated that fast tempo music seemed to have a better performance for increasing arousal
levels than slow tempo music (Krumhansl 1997, Van der Zwaag et al. 2012). Music is generally
acknowledged as a variable mean for triggering consumers’ emotion (Schäfer & Sedlmeier, 2009), however,
it seems there still remain controversies that whether the music has the capacity of inducing moods by
listeners or not (Kivy, 1990; Van der Zwaag et al., 2012). For example, a research by Van der Zwaag et al.
(2012) implied that there was no significant effect between music and arousal level, namely, music seems
not enable to induce consumer’s arousing feeling. Van der Zwaag et al. (2012) also claimed that female
consumers are more favor of retail environment that without music playing. Therefore, it is suggested for
retailers to carefully play music in their store, since music enables to trigger both a consumer’s positive
mood and a negative mood (Gancer & Huda, 2010).
To sum up, whether a positive or negative emotional state, it enables to exert impact on the judgments of
products or services (Solomon et al., 2013). In other words, if a consumer has a more positive mood that
stimulated by the ambience in a store, he or she would be more willing to stay longer or even purchase
products from the store. It is said mood do have the power to influence how consumer think and behave
(Babin, Darden & Griffin, 1992; Donovan & Rossiter, 1982). Hence, the following section will discuss more
about individual’s behavioural intentions.
2.3.3 Approach and avoidance behaviour
According to Mehrabian and Russell (1974), individual’s behavioural reactions to the surroundings are
generally classified into two types: one is approach oriented behaviour, and the other one is avoidance
oriented behaviour. Both two behaviours are on the basis of visitors’ emotional state from the sensory
stimulus, including visual stimuli, auditory stimuli, tactile stimuli, and olfactory stimuli (Sullivan & Adcock,
2012). Approach behaviours generally include all individuals’ positive responses, such as visitors’ patronage
intentions to certain environment (Baker et al., 2002), intentions to stay longer (Wakefield & Brodgett,
23
1994), individuals’ increased purchasing intentions (Donovan & Rossiter, 1982), re-patronage intentions as
well as the willingness to recommend their visiting store to others (Spies et al, 1996).
Purchase intention is considered to be the indicator of a consumer’s approach behaviour (Pettersson &
Söderström, 2015). Whitlar, Geurts, and Swenson (1993) asserted that purchase intention is a purchase
probability, associated with an intention at the percentage of individuals that will actually buy the product.
And Nasermoadeli, Ling & Maghnati (2013) claimed that intention to buy is the buyer’s prediction of which
company he will select to buy. They suggested that the greater the purchase intention is, the greater a
customer’s desire to buy a product. (Nasermoadeli, Ling & Maghnati, 2013) Thus, purchase intention can be
regarded as a predictor variable of actual purchase. Purchasing an object is the result of decision making
process. Kotler & Armstrong (2010) determined decision making process has a five steps, which are
problem recognition, information search, pre-purchase evaluation of alternatives, consumption, and post-
consumption evaluation. Solomon, Askegaard and Hogg (2013) defined there are several factors would
affect the purchase decision, for instance, situational factors, mood and shopping experience.
During the five decision making process, customers receive and interpret all possible information related to
the purchasing objective in the information search stage, then consumers develop a degree of product
preference. There was article claimed that customer experience does influence the customers’ preferences,
which then accordingly affect their purchase decision (Yang & He, 2011). Moreover, Nasermoadeli, Ling &
Maghnati, (2013) proved that there is a positive relationship between the sensory experience and purchase
intention, mediated by emotion. Purchase intention is influenced by the levels of consumer experience by
following manner: if the customers have their positive shopping experience, then their chances of intention
to purchase the products and services would be higher.
On the other hand, avoidance behaviours substantially represent negative reactions, which can be seen when
visitors tend to reduce participation into the surroundings, escape from the environment, and eventually
show a decreased tendency to purchase from that store (Sullivan & Adcock, 2012). Hence, it can be
summarized that both these two behaviours enable to exert an impact on individuals’ purchasing intentions,
but the approach behaviours have a positive influence. In this case, it intends to investigate the positive
influence of sensory stimuli on female’s purchase intention, therefore, the avoidance behaviour will not be
discussed specifically. Considering that female consumer is main object of study, the following chapter will
focus on female consumer characteristics.

24
2.4 Female consumer characteristics
As Huddleston and Minahan (2011, p.5) claimed: “women call the shots in the vast majority of consumer
decisions.” Female customers nowadays are generally considered as powerful purchasers, since they are one
half of the population and account for over half of the consumption (Silverstein & Sayre, 2009). Nowadays,
it is not surprised that there are an increasing number of shops opened and focused on serving for female
consumers. By comparing with female consumers, male consumers seem to become more acceptable and
comfortable with a few stores alternatives, especially in the beauty and fashion industry, since retailers are
generally providing focused to males. (Huddleston & Minahan, 2011) Moreover, women generally tend to
spend twice time in a store by comparing with man, and the majority of window-shopper are female
(Kuruvilla et al., 2009).
Female’s consumption can be affected by their age or education (Kaur, 2015), for example, younger woman
is generally more willing to spend time on consuming fashion products than older woman (Rich & Jain,
1968) Based on the research result from Mpinganjira (2014), it has suggested that consumers’ purchasing
behaviour is supposed to be influenced by a number of potential motivations. Generally, it can be essentially
summarized as two main motivations, including utilitarian motivation and hedonic motivation (Mpinganjira,
2014). Utilitarian motivation refers to that consumers intend to improve efficiency and make an achievement,
to be more specific, they have a clear shopping orientation and they are in conscious pursuit of these specific
product in a shorter period (Babin et al.,1994; Kim, 2006). While as for the hedonic motivation, shopping is
regarded as a positive experience which consumers are in the pursuit of an emotionally pleasant shopping
experience, in sprite of purchase or not (Kim, 2006). In fact, male consumers are mostly utilitarian shoppers
but female consumers mainly tend to hedonic shoppers (Mpinganjira, 2014). Considering that women have
huge consumption potential, it is suggested for marketers and retailers to create a more pleasant shopping
experience and pay more attention to female consumers in the competitive market. (Huddleston & Minahan,
2011). It is also beneficial for marketers to understand the tendencies that different gender may favour for
the purpose of better pleasing and satisfying the consumers (Bakshi, 2012).
2.4.1 Female consumer behaviour in cosmetic retail store
There is a common phenomenon that the majority of female individuals are more likely to spend time or
browse around on shopping (Mitchell & Walsh, 2004). In this case, female consumers are more likely to
have impulse purchase since they lack of the cognitive knowledge to be self control (Faber & Vohs, 2004;
Vohs & Faber, 2007). In fact, the research has suggested that female consumers seem to more impulsive
than male consumers (Greer, 1999; Kaur, 2015). Since female consumers generally have considerably
abundant emotion, especially when they are drawn attention by something fairly interested, they would more
likely to generate a higher purchase intention (Luo, 2002). Given that female consumers have rich emotion,
25
they tend to be more susceptible by their intuitive feeling and show a preference to certain products that
have attractive appearance, package or good scents (Pang & Yuan, 2011). Female emotional consumption
seems to be more apparent in the cosmetic and fashion retail industry (Kaur, 2015).
In general, female consumer is acknowledged to be the major force in consuming cosmetic product (Vang,
2010). Nowadays, cosmetic product has increasingly become an intermediate tool, especially when female
consumer intends to pursue emotional and spiritual satisfaction, and cosmetic products are also regarded as a
typical emotional goods (Turban, 2016). On the one hand, cosmetics could be regarded as a carrier of
female’s psychology identity, which also be reflected from their emotions, such as their affection and
satisfaction. On the other hand, when female consumers are going to purchase cosmetics, their emotional
characteristics reflect the vanity. Since there are a group of female consumers like to show off their financial
strength or special identity (Turban, 2016).
2.4.2 Female consumer and sensory marketing
Numerous researches (Meyers-Levy & Maheswaran, 1991; Shao et al, 2004) have pointed that there are
obvious differences between man and women when process information. In fact, the primary cause that
different genders process information differently is supposed to be relevant with behaviour objectives, and
therefore make distinct purchasing decisions (Elliot, 1993; Chang, 2007). Generally, a female’s purchasing
decision making process is fairly complicated (Johnson & Learned, 2004). To be more specific, when
female consumers enter a retail store, all of their five senses would be used for handling the information.
They are more willing to touch and test the sample products before purchasing (Holmberg & Öhnfeldt,
2010).
In addition, previous researchers (Kellaris & Altsech, 1992; Yalch & Spangenberg, 1990) also indicated that
gender differences are embodied in human’s reactions to environmental and sensory stimuli. It is stated by
previous studies (Liang et al., 2013) that female seems to be more sensitive to sensory stimuli than male.
Valle (1987) and Morrison (2004) claimed that women tend to be especially sensitive to the stimulation
from taste, smell, hearing frequency and intensity, as well as touch; however, male show a greater visual
sensitivity than female. Since female shopping are not only for seeking and purchasing products, they also
for the purpose of pleasure, entertainment and independence (Huddleston & Minahan, 2011). Hence,
creating a favourable sensory atmosphere, especially emphasizing on female’s senses, enables to contribute
to the increase of the passenger flows and potential profits. Considering that the above theory has been
elaborated, the following part will emphasize on proposing hypotheses and conceptual model.

26
2.5 Hypothesis and conceptual model
In order to answer research questions, the following hypotheses and conceptual model will be proposed
based on the theoretical framework. H1a, H2a, H3a and H4a are proposed to answer research question 1,
and H1b, H2b, H3b and H4b are aimed to answer research question 2.
2.5.1 Hypothesis
In order to have a better understanding, the following table 1 will demonstrate the hypotheses and their
theoretical support. In this case, the taste sense will not be considered and the other four senses are
considered to exert more impact on the target market. Since unlike the restaurant industry, there leaves a
little room for enterprises in the cosmetic industry to adopt gustative marketing strategies.
Table 1. Overview of hypotheses and theoretical support
Hypotheses Theoretical support
H1a. Visual cues have an influence on triggering
female consumer’s positive emotion in a cosmetic
store.
Visual cues have a great potential to affect
human’s positive mood in the retail environment
(Donovan & Rossiter, 1982; Brengman & Geuens,
2003).
H2a. Olfactory cues have an influence on triggering
female consumer’s positive emotion in a cosmetic
store.
Ambient scent is more likely to create a positive
emotional state (Kotler, 1973; Dani & Vanishree,
2013).
H3a. Tactile cues have an influence on triggering
female consumer’s positive emotion in a cosmetic
store.
Consumer will generate a more positive emotional
reaction if they are allowed to touch or test the
product (Essick, James & McGlone, 1999; Peck &
Wiggins, 2006).
H4a. Auditory cues have an influence on triggering
female consumer’s positive emotion in a cosmetic
store.
Music is generally acknowledged as a valuable
mean for triggering consumers’ emotion (Schäfer
& Sedlmeier, 2009).
H1b. Visual stimuli have a positive influence on
female consumer’s purchase intention in a cosmetic
store.
Sight is the strongest sense in human’s sensory
system, consumers are largely reply on this sense
and often make a purchasing decision decision
based on their first impression (Sayadi,
Mobarkabadi & Hamidi, 2015).
H2b. Olfactory stimuli have a positive influence on
female consumer’s purchase intention in a cosmetic
store.
Ambient scent enables to exert a positive
influence on individual’s actual behaviour, such as
purchase intention and store re-patronage
(Parsons, 2009; Bone & Ellen, 1999; Hultén,
2012).
H3b. Tactile stimuli have a positive influence on
female consumer’s purchase intention in a cosmetic
store.
Offering ample opportunities for customers to
touch the products can lead to increased purchase
intention (Kolter et al., 2016).

27
H4b. Auditory stimuli have a positive influence on
female consumer’s purchase intention in a cosmetic
store.
The potential of music is considered as a powerful
function for inducing consumers’ purchase
intention (Juslin & Sloboda 2010; Hussain & Ali,
2015)
2.5.2 Conceptual model
The model should serve to design the survey and to solve the research questions. As mentioned, the
purposes of this thesis are to find out how cosmetics retailers create positive emotion by using sensory
stimuli, and which sensory stimuli have the most positive impact on triggering female’s purchase intention.
In addition, how these sensory stimuli impact on female customers’ purchase intention. It is obviously that
sensory stimuli are vital part of the model structure. The emotional state is believed to play the role as a
mediator to connect the sensory stimuli and purchase intention (Kang et al., 2011).
As can be seen from figure 5, our model is mainly based on the environmental psychology model presented
by Mehrabian and Russell (1974). Mehrabian and Russell’s model assumed that environmental stimuli
influences a customer’s mood state. The mood state, on the other hand, sway customer’s response, for
example, to approach or to avoid. Here we developed our model to be more detailed. According to the
model, at the first stage, the sensory stimuli will be evaluated. Then at the second stage, the mood state will
be measured by Russell and Pratt (1980) ‘s model. Lastly, the three scale items presented by Shen and Zhao
(2005) will be used to measure purchase intention. Purchase intention is considered to be approach
behaviours. The avoidance behaviour will not be discussed in following part of the thesis.

28
Figure 5. The Conceptual model developed based on the SOR-model of Mehrabian
and Russell (1974)
29
3. Methodology
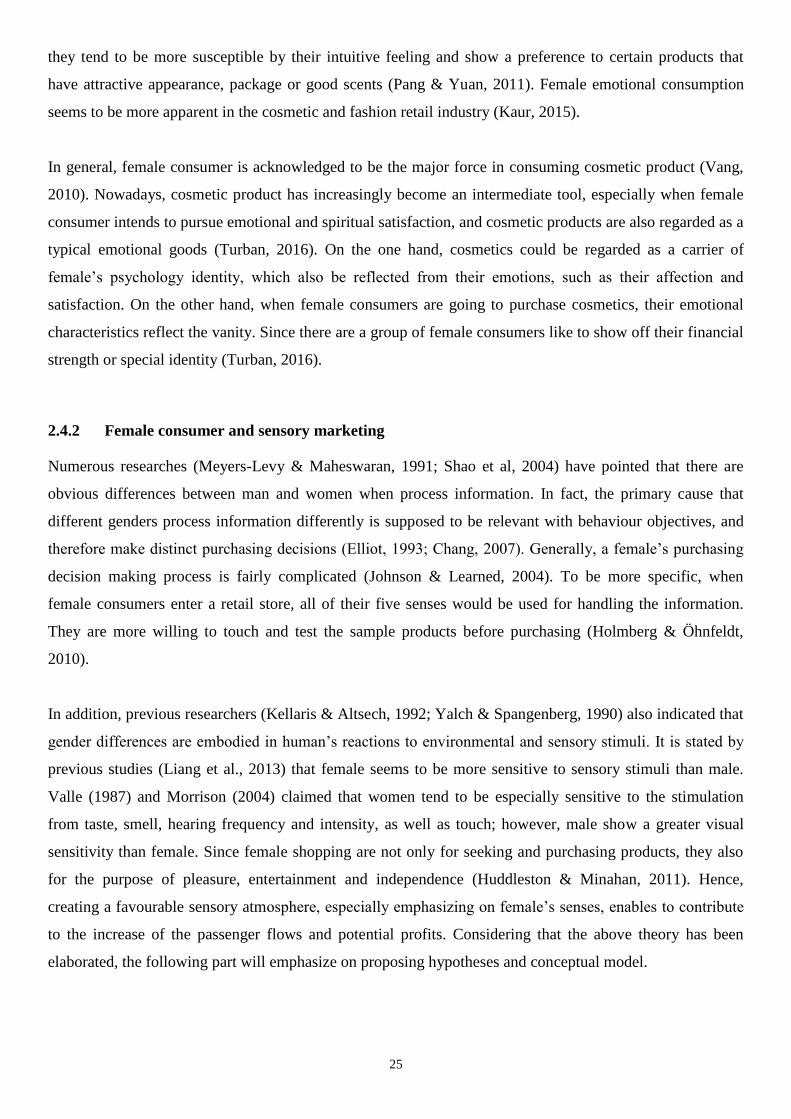
The following chapter represents the structure of the methodology. The whole research methodology part is
based on the research onion (see figure 6), which is created by Saunders, Lewis and Thornhill (2009).
Figure 6. Research onion (Saunders et al., 2009, p.138)
3.1 Research philosophy
According to the research onion, research philosophy is the first layer of research onion, which is defined as
the development and nature of knowledge. The research philosophy being adopted clarifies the the view of
how you perceive the world (Saunders et al., 2009). These assumptions have a vital effect on the choice of
research strategy and the method. Johnson and Clark (2006, p.108) explained the significance of knowing
the philosophical commitments: “We make through our choice of research strategy since this has significant
impact not only on what we do but we understand what it is we are investigating.”
There are three different terminologies of the research philosophy according to Saunders et al (2009), which
are positivism, interpretivism and realism. Realism is a philosophy related to scientific enquiry, it relies on
the idea of independence of reality from the human mind (Saunders et al., 2009). Interpretivist philosophy is
based on the intellectual tradition phenomenology, it is necessary for the researchers to understand the
differences between humans as social actors (Saunders et al., 2009). Interpretivist believes human beings
can change their behavior if they aware they are being observed (Collins, 1984). In order to understand
certain social action, researchers should explore how people really act in daily situation and to look into the

30
true reasons behind that (Saunders et al., 2009) This approach is usually adopted when the sample is small
and an in-depth investigation is needed (Saunders et al., 2009). So this approach is associated with
qualitative research method (Malhotra, Birks, & Wills, 2012).
This thesis adopted a positivism research philosophy. Positivism implies that only phenomena that people
can observe will lead to the production of credible data (Saunders et al., 2009). The goal of this philosophy
is to describe a phenomenon from an objective point of view (Hinkelmann & Witschel, 2013). A positivist
believes human’s behavior can be measured by identifying patterns and using quantitative methods (Jones &
Bartlett, n.d.). Therefore, it is encouraged to use the existing theory and collected data to explain people’s
behavior. This approach deals with numbers which clearly is associated with quantitative method (Saunders
et al. ,2009), which fits the situation of this thesis.
3.2 Research approach
There are two different research approaches are highlighted by Saunders et al (2009), which are inductive
and deductive. The deductive approach moves from the more general to the more specific, which means the
approach is based on theories and hypotheses. The purpose is to test if the result is supported or rejected
(Bryman, 1988). Whereas the inductive approach works opposed, which moves from specific to general.
More specifically, inductive approach aims at looking for patterns in order to build new theories (Bryman,
1988).
Basically, deductive approach is according to the following process: First of all, deductive approach based
on the theory about topic of interest. Then deducing hypotheses from the theory. The observation is
collected to address the hypotheses. Then all these processes eventually give a result of confirm or reject
(Saunders et al.,2012). In this thesis, the research methodology is based on a deductive approach because it
is considered to be applicable for positivism philosophy (Saunders et al.,2012). Deductive approach
emphasizes on collecting quantitative data, for example through a certain amounts of questionnaires, which
also corresponds with our research method (Soiferman, 2010). Moreover, the existing theories for sensory
marketing are sufficient for researchers to conduct a deductive research.
3.3 Research design
As mentioned, the whole methodology part is based on the research onion. In this chapter, the research
design will be explained in details.

31
According to Robson (2002), the process of research design is the process turning research questions into a
research project. There are generally three approaches to design the research, which are exploratory,
descriptive and explanatory (Saunders et al.,2009). Exploratory research is adequate for the situation when
the research question is poorly understood (Ghauri & Grønhaug, 2005). It aims to seek new insights, to
examine unknown phenomena and then to assess phenomena in a new light (Saunders et al.,2009).
Explanatory research and descriptive research better suits structured research question (Ghauri & Grønhaug,
2005). Explanatory research is also known as causal study since it aims to establish causal relationships
between variables (Saunders et al.,2009). Last but not least, descriptive research is used to solve problem
when it is structured and well-understood (Ghauri & Grønhaug, 2005). The aim of descriptive research is to
portray accurate profile for situations, events or persons (Saunders et al.,2009).
The research design of this thesis adapts descriptive approach. This decision was made based on authors’
research questions. If the research question needs to be answered with quantifiable facts, descriptive or
causal research is more suitable, otherwise exploratory research should be applied (Kolb, 2008). The
descriptive research is usually adopted when the research question is clear and structured (Ghauri &
Grønhaug, 2005). In order to answer the questions, numbers and details are needed. Moreover, this method
can offer an accurate description to the problem that the thesis is focusing on. And further to reveal an
answer to the research questions (Sarstedt & Mooi, 2011).
3.4 Data collection
Since this research has used quantitative approach, in this chapter, quantitative approach will be analyzed. In
this thesis, authors used a combination of primary data and secondary data collection. The primary data is
the data collected and analyzed from the designed survey, whereas secondary data is the previous
information within the subject collected by others (Ghauri & Grønhaug, 2005). Secondary sources might
have been collected for different purposes other than the current needs of the researcher (Zikmund, 2000).
Secondary data includes books, journal articles, online data sources (Ghauri & Grønhaug, 2005). One of the
primary advantage to use secondary data is more efficient and less expensive compared with collecting
primary data (Zikmund, 2000). The secondary data in this thesis is mainly obtained from academic books,
journals. Besides some searching engines have been used for instance, Google scholar and Jönköping
University Library database. Within the wide range of primary data collection, various forms of gathering
data can be used, for example, focus groups, observations, surveys, experiments and interviews (Easterby-
Smith, Thorpe & Jackson, 2015). In this thesis, the primary data was collected through questionnaire.

32
3.4.1 Quantitative method
A quantitative research uses numerical analysis to provide proof of a fact or a hypothesis (Kolb, 2008). In
other words, it is the research method that uses numerical data to looking for trends and patterns (Saunders
et al.,2009). Quantitative research is efficient to answer questions on relationships within measurable
variables with an intention to predict, explain and control a phenomenon (Leedy, 1993). In order to avoid
researchers’ bias, it is essential to have a large sample size when collecting the data (Tribou, 2011).
Since the research is aimed to find out which sensory stimuli has the most impact on female consumers’
purchase intention, a quantitative approach has been applied. The quantitative data was collected by
conducting a survey, as survey is the standard tool to use when conducting quantitative research (Kolb,
2008). The objectives to use survey are to evaluate their perception towards sensory stimuli have been used
in cosmetic shops. And to assess the impact of each sensory stimulus on female consumers’ purchase
intention. Authors was using the online survey tool Webropol to design the questionnaire. The respondents
were reached through the social network media tool such as Facebook. The respondents consist of
researcher’s own personal network. The findings were analysed using SEM, the findings and data analysis
will be further elaborated in the following chapters.
3.4.2 The questionnaire design
The questionnaire mainly consists of three part, the first part is category questions, the second part is sensory
marketing related questions and the last part is to investigate purchase intention. The design of this
questionnaire is mainly based on the Likert Scale Approach. Likert Scale Approach indicates how strongly
the person agrees or disagrees with a statement or series statements (Saunders et al, 2009). Individuals
generally choose from a four, five or seven alternatives which vary from very positive to very negative
(Zikmund, 2000).
Question 1 to Question 5 are category questions. The objective of using these questions is to enable each
respondent’s answer can fit to a category (Saunders et al, 2009). The first two questions were designed to
collect general demographics of the data, regarding gender and age. Question 3 to Question 5 are multiple
choice questions in order to collect descriptive data. The information enables researchers to divide them into
several clusters according to the three case stores they chosen (The body shop, Rituals and Lush). And all
the answers to the questionnaire should be based on the case store they chosen. According to the respondents,
authors are able to find out the frequency they visit the store and the time spent during their visit.
Question 6 is to be measured on a 7-point numerical scale. This question asks the respondents to describe
their perception about the case store. Respondents are requested to check the place that indicates the nearest

33
appropriate adjective. The purpose of this question is to find out respondents’ perception towards sensory
stimuli have been used in the case store.
Question 7 to 10 intended to investigate the how the sensory stimuli influences customer’s staying time and
their shopping experience. The Likert Scale Approach has been adopted here as it is the most popular tool
for measuring attitudes (Zikmund, 2000). With the 7-points scale, respondents were asked to indicate their
attitudes by checking how strongly they agree or disagree with the statements. Visual dimension, aural
dimension, olfaction dimension and tactile dimension have been measured. Whereas, the fifth sense taste is
irrelevant for the service environment so it’s not listed in the question.
Question 11 is designed in order to find out the mood state of consumers. The measurement of emotional
experience refers to Russell and Pratt (1980), using right items, which is designed to a semantic- differential
scale, for instance: sleep - arousing, gloomy - exciting, unpleasant - pleasant, distressing - relaxing.
The aim of last question is to find out respondents’ purchase intention. The measurement tool of purchase
intention is based on Shen and Zhao (2005) and it designed on a 7-point scale. The items are: I will often
shop in these supermarkets/shopping marts in the future, I will shop for my family and friends in
supermarkets/shopping marts., and I will recommend other to shop supermarkets/shopping marts.
3.4.3 Sampling techniques
The sampling techniques could be classified into two two types, including non-probability sampling and
probability sampling. In general, non-probability sampling technique primarily depends on the personal and
subjective judgments from the researchers, while the probability sampling technique seems to be more
precise and objective than non-probability sampling technique since it enables each sampling unit to have a
non-zero opportunity of being selected. (Malhotra & Birks, 2007) Before starting collecting data, ensuring
the precise selection of target population is also fairly significant, since imprecise definition of the target
group will lead to obtain ineffective and misrepresented research results (Malhotra & Birks, 2007). In this
thesis, a purposive participant selection was adopted to decide the target group (Saunders, Lewis &
Thornhill, 2012), since the authors want to investigate how female consumers are most sensitive to the
sensory cues in the cosmetic store.
Considering that the target participants of the questionnaire are required to be female who has shopping
experience in cosmetic stores. Hence, a purposive sampling would be considered since it enables to meet
certain criteria (Blumberg, Cooper & Schindler, 2008). Judgmental sampling is one type of purposive
sampling, although it is claimed that it is subjective and has high participant selection bias (Saunders et al.,
2012). Nonetheless, judgmental sampling has great advantages of low cost, great convenience and quick
34
response, and it is widely adopted in the exploratory research designs (Malhotra & Birks, 2007). Moreover,
it also seems to be useful when the researchers intend to choose a biased target group for screening purpose
(Blumberg et al., 2008). In this case, the data from the questionnaire planned to be collected from online
channels. As for the online survey, the authors planned to contact and send to the specific female group
purposively through using their own personal social network (Facebook). Besides, in order to reduce or even
avoid sampling errors, the questionnaire is allowed to be answered only once for each respondent.
3.5 Quantitative data analysis
In this thesis, a variety of statistical analysis methods would be applied in order to better understand the
meaning of data that collected from the questionnaire through SPSS. Firstly, the general information of the
respondents’ demographic variables and shopping habits would be analysed through descriptive statistics.
Secondly, it is necessary to check the reliability of the questionnaire, especially for the Likert-scale
questions, therefore, Cronbach’s alpha would be adopted for the purpose of testing the internal consistency
of the scales. Cronbach's alpha is favourable to measure respondents’ attitude scales in the survey because
the alpha levels imply whether the the elements measures the same structure (Burns & Burns, 2008). Besides,
this coefficient should be over the range of 0 to 1, but when the value is equal or lesser than 0.6, it
commonly implies deficient internal consistency reliability (Malhotra & Birks, 2007).
Generally, it is supposed to be a complicated process for researchers when analysing and interpreting the
quantitative research data. There are number of traditional statistical method for analysing quantitative data,
such as correlation analysis and regression analysis. However, these statistical methods are less flexible and
usually require a default model, and tend to occur more measurement errors (Suhr, 2006).
In this case, in order to identify the relationships between multiple variables and respond the research
questions, structural equation modelling (SEM) would be applied by using AMOS 17 software with
maximum likelihood (ML) based estimation approach (Ruckdäschel, 2015). The term, AMOS, namely,
refers to “Analysis of Moment Structures”, which is generally applied to empirically evaluate structural
equation models (Ruckdäschel, 2015). SEM enables to present clear relationships among different and
numerous variables by using a graphical figure (Suhr, 2006). By comparison with traditional statistical
method, SEM seems to have a distinct superiority in the aspect of avoiding measurement errors; besides, a
key benefit of SEM is that it enables to evaluate all of the hypothesized relationships and measure the
influence of latent variables (Byrne, 2001; Suhr, 2006). As a sophisticated statistical technique, SEM has
been widely in psychological, social sciences and business research (MacCallum & Austin, 2000; Yung,
2008). However, there are some conditions that are supposed to consider before using SEM.

35
● Firstly, a relative large samples of data is expected to be collected. To be more specific, the minimum
sample size of 100 should be ensured (Loehlin, 1992; Yang & Chen, 2015), but Kline (2005) claims
that it is better to have more than 200. In this case, a total of 224 responses had been received, but there
were 188 valid responses, which also can be acceptable for using SEM.
● Secondly, the hypothesis of the SEM should be supported by the theory (Yang & Chen, 2015). In this
case, all of the hypotheses were proposed on the basis of previous theory.
● Thirdly, several evaluation methods could be used to evaluate the fitness degree between parameters
and model, such as generalized least square and maximum likelihood method (Thompson, 1998; Yang
& Chen, 2015). In this case, a maximum likelihood method would be applied since it is appropriate for
data with small sample size and data is non-normally distributed (Suhr, 2006).
3.5.1 Evaluation of the fitness of SEM
SEM provides relevant evaluation criteria, such as fitness index, which contributes to examine the fitness
between existed theory and proposed hypothesis (Hair, Ringle & Sarstedt, 2011). In order to evaluate the
fitness of the model, there are three types of fitness indices that can be served as reference to avoid
measurement errors, including absolute fitness index, relative fitness index and simple fitness index
(McDonald and Ho, 2002; Hooper, Coughlan & Mullen, 2008; Yang & Chen, 2015). The acceptable level
for each fitness are listed in the following table 2. If the various indices can reach the acceptable level, then
it indicates a satisfying fitness of model.
Table 2. The acceptable level for fitness indices (Browne & Cudeck, 1993; McDonald & Ho, 2002)
Fitness index Index Acceptable level
Absolute fitness index X2, P P>0.05
GFI >0.9
AGFI >0.9
RMR <0.05
RMSEA <0.05good
<0.08reasonable
Relative fitness index NFI >0.9
RFI >0.9
IFI >0.9
Simple fitness index CN >200
NCX2/df <2

36
3.5.2 Evaluation of the relationships among variables
The relationships between each variable can be identified after the model has reached an acceptable level of
fitness. SEM is a powerful tool that enables to elaborate and estimate linear relationships among a variety of
variables in a model (MacCallum & Austin, 2000). The variables may include independent variable,
mediator variable as well as dependent variable (MacCallum & Austin, 2000). In this case, it specifically
refers to:
● Independent variable: four sensory stimuli (visual, olfactory, auditory, tactile)
● Mediator variable: positive emotional state (arousing, exciting, pleasant, relaxing)
● Dependent variable: behaviour intention (purchase intention)
3.5.3 Evaluation of the effect size among variables
The application of SEM enables to estimate simultaneously about the direct and indirect influence between
variables (Keith, 2006). Both direct effect size and indirect influence size enable to be measured by
comparing the magnitude of path coefficient (β) (Suhr, 2006; Keith, 2006). Generally, a positive path
coefficient value indicates there is positive effect between two variables, and vice versa. Besides, there is a
general guideline for evaluating the effect size through comparing the path coefficient (β) (Pedhazur, 1997;
Keith, 2006):
● When β ≦ 0.10, it implies a small but meaningful influence between two variables.
● When 0.11 ≦ β ≦ 0.25, it implies a moderate influence between two variables.
● When β > 0.25, it implies a strong and large influence between two variables.
In this case, it is possible to understand which sensory stimuli has the most important impact on female’s
purchase intention in the cosmetic store by comparing the comparing the magnitude of path coefficient.
3.6 Reliability and validity
Reliability and validity are considered as two significant concepts in research because they can serve as
testing tools for improving the veracity of assessment (Tavakol & Dennick, 2011). In different types of
studies, such as quantitative research and qualitative research, reliability and validity generally indicate
different meanings (Creswell, 2014). In this thesis, since only the quantitative research method is adopted, it
will focus on the meaning under the context of quantitative study. Moreover, it is feasible that the

37
measurement is reliable but not valid; nevertheless, if the results of measurement is proved to be unreliable,
then it is considered as invalid, either ((Thatcher, 2010; Twycross & Shields, 2004).
In this case, when it comes to measure reliability, it refers to “to the extent to which a scale produces
consistent results if repeated measurements are made” (Malhotra & Birks, 2007). In fact, certain questions in
the questionnaires would incorporate several terms which are designed in a different way but actually focus
on the same terms. Hence, in order to examine the homogeneity, Cronbach’s alpha is an appropriate
reliability measurement tool for measuring the internal consistency of the scale questions (Twycross &
Shields, 2004).
While in terms of validity, it is the strength of conclusions, inferences or propositions. Validity is defined by
Thatcher (2010, p. 125) as “the extent to which any measuring instrument measures what it is intended to
measure”. In this case, since all of the responses were collected through online platforms, the findings from
online questionnaire are required to be relevant with the reality (Saunders et al., 2009). Furthermore, when it
comes to how to examine the validity in the quantitative research, some types of validity, including content
validity, criterion validity and construct validity, could to be applied (Chen, 2001; Malhotra & Birks, 2007).
In this case, content validity would be used for measuring the validity. Content validity is committed to
measuring the effectiveness of each measurement question or item in the survey, or measuring the logical
link between the measurement question and research question (Saunders et al., 2009; Kumar, 2011). In this
thesis, the questions from the questionnaire was designed on the basis of the previous literature and the
objective observation from the store, hence, it assures the content validity of the research, to some extent.
3.7 Summary
In this chapter, the methodological framework has been proposed and explained. To sum up, the philosophy
of this thesis is a positivism research philosophy. A deductive approach is applied since the research moves
from the more general to the more specific. And the nature of the study emphasizes on the descriptive
approaches. The data is collected by the combination of primary data and secondary data. The majority of
secondary data is collected from academic books as well as journals. As for the primary data collection, the
quantitative method is adopted through distributing the designed questionnaires on the online platforms. And
the target sampling population of the questionnaire is determined by using a judgmental convenience
sampling technique by the authors. A variety of data analysis methods is also introduced for use of findings
part. Eventually, research reliability and validity are introduced accordingly.

38
4. Findings
According to Saunders et al (2008), quantitative data mainly involves numerical data that could be
quantified to answer the research questions. In this chapter, authors will present an overview of the findings
based on quantitative data. And the data will be analysed with SEM (Structural equation modelling).
4.1 Response
The questionnaire was collected with the help of the online survey and social media. The online survey was
published in Webropol, which is an online research software. Then the survey was distributed through
different social media channels for example Facebook. The whole responses were collected in two weeks,
between April 8th to April 22nd. After the collecting process, the results can be converted directly to SPSS
for further use. The survey can be found in Appendix 1 - Questionnaire.
There were total 224 responses were collected during the time frame. 9 of the responses had to be deleted
because they chose the gender as male and therefore did not match authors’ target group. Another 27
responses had to be eliminated because of the uncompleted questionnaires. After processing all data, there
were 188 valid answers could be used to analyse.
4.2 Reliability Summary
In order to evaluate the reliability of the Likert-scale questions of the designed questionnaire. The coefficient
of Cronbach’s alpha was calculated to check internal consistency of these scale questions.
Table 3. Reliability summary
Question Cronbach’s
alpha
Number of items
Evaluation of visual feeling (Q7) 0.83 5
Evaluation of olfactory feeling (Q8) 0.72 3
Evaluation of auditory feeling (Q9) 0.76 3
Evaluation of tactile feeling (Q10) 0.86 3
Emotional state scale (Q11) 0.82 4
Purchase intention scale (Q12) 0.85 3

39
In this case, there are six scale questions, and they were designed to evaluate the respondents’ visual feeling,
olfactory feeling, auditory feeling, tactile feeling, emotional state and their purchase intention. In general, as
table 3 illustrated, the majority of coefficient Cronbach’s alpha were over 0.8, which indicated there was a
high level of internal consistency. Except for the questions concerning respondents’ olfactory feeling and
auditory feeling, the coefficient values were 0.72 and 0.76 respectively, which could also be considered as
highly favored level of internal consistency. Based on above statistics, it could be concluded that the data
from the questionnaire was reliable.
4.3 Respondent introduction
Generally, the basic information from the questionnaire about the respondents was illustrated in the
following table 4.
Table 4. Dataset of respondents’ information
Item Response
distribution (n=188)
Percentage
Gender (Q1) Female 188 100%
Age (Q2) Below 20 22 12%
20-30 131 70%
31-40 29 15%
41-50 6 3%
51-60 0 0
Above 60 0 0
Consumption place (Q3) Lush 42 22%
The Body Shop 94 50%
Rituals 52 28%
Q1 in the questionnaire is designed to confirm the gender since the objective of this thesis is to discover how
the sensory stimuli in cosmetic shop are perceived by female customers. The valid answers for the

40
questionnaire accounts for totally 188. All the answers are from female respondents, which fits to authors’
target group.
Q2 is designed to identify the age of respondents. There are six age ranges with a ten year range in each
alternative. Out of the 188 valid respondents, as table 4 illustrated, 131 female respondents are between the
age group 20 - 30 years old, which accounts for 70%. 22 (12%) female participants are under the age of 20-
29 (15%) are from 31 to 40 years old. And 6 of female respondents belong to the age group 41 to 50, which
accounts for 3%.
Q3 aimes to divide the respondents according to the cosmetic shop they visited recently. As mentioned,
there are three cosmetic shops have been chosen, which are The Body Shop, Lush and Rituals. Since
different shops have different design and ambiances, it is necessary to analyse the consumers according to
different shops. According to data in table 4, there are 94 respondents recently buying products from The
Body Shop, which accounted for 50%. While the statistics for Lush and Ritual are pretty similar, which
accounts for 22% (42) and 28% (52) respectively.
4.4 Descriptive information
The following descriptive information will be analysed with the help of cross tabulation.
Table 5. Respondents’ purchasing frequency in different stores (n=188)
Have you purchased the cosmetic products from?
Purchasing frequency Lush The Body Shop Rituals
(n=42) (n=94) (n=52)
More than once a week (3%) 10% 1 % 2 %
Once a week (13%) 19 % 9 % 15 %
2-3 times per month (37%) 40 % 27 % 52 %
Others (47%) 31 % 63 % 31 %
Total 100 % 100 % 100 %
The objective of Q4 is to find out the frequency consumers visit each of the three stores. As the table 5
shows, most of the Lush’s customers visit the shop 2-3 times per months, which accounts for 40%. 31%

41
visit the shop few times a year, followed by 19% of the customers visit the shop once a week and only 10%
visit more than once a week. While, most of the customers from The Body Shop visit the shop only few
times a year, which accounts for 63%. 27% visit the shop 2-3 times per months. And 9% visit once a week
and 1% for more than once a week. In addition, there are 52% of Rituals’ customers visit the store 2-3 times
per month, followed by 31% of customers who visit the shop few times a year. 15,38% of customers visit
the shop once a week and 2% visit more than one time a week.
Table 6. Respondents’ staying time in different cosmetic stores (n=188)
Have you purchased the cosmetic products from?
Staying time
in the store
Lush The Body Shop Rituals
(n=42) (n=94) (n=52)
Less than 10 minutes 15 % 38 % 23 %
10-20 minutes 69 % 56 % 67 %
21-30 minutes 14 % 3 % 10 %
More than 30 minutes 2 % 3 % 0 %
Total 100 % 100 % 100 %
Q5 is designed to find out the individuals’ average staying time in each of three stores. It can be seen from
the table 6, in general, the majority of respondents would like to spend approximate 10 to 20 minutes in a
cosmetic store, since there are 69%, 56%, 67% of respondents staying 10 to 20 minutes in these three stores
respectively. Besides, it is worth noting that respondents seem to stay longer time in Lush, by comparing
with the the store of The Body Shop and Rituals. Since there are 16% of respondents are willing to spend
more than 20 minutes in Lush, while the other two stores: The Body Shop and Rituals, seem to account for
6% and 10% respectively. At the same time, only 15% of respondents would spend less than 10 minutes in
Lush, therefore, it can be implied that Lush seems to create a better atmosphere than other two stores to
attract consumers to stay longer in the store.

42
4.5 Results of structural equation model
Generally, the structural equation model was applied to examine the developed conceptual model (see
Figure 5 in the chapter 2.5) and the hypotheses. In this case, it aims to estimate the influence of sensory
stimuli on female consumers’ emotional state and their behavioural intention. The results would contribute
to answer the research question 2: “Which sensory stimuli has the most impact on female customers’
purchase intention?” Besides, a maximum likelihood method would be applied to test the degree of fitness
between the parameters and the model. In a short, the structural equation model is shown as following figure
7.
Figure 7. Initial SEM estimation
4.5.1 Evaluation of initial model fitness
Before examining the impact level of among variables, it is necessary to examine the fitness between
theoretical framework and proposed hypothesis (Hair, Ringle & Sarstedt, 2011). The fitness of indices is
useful for examining if the fitness of model and data is acceptable, which is shown in the following table 7.

43
Table 7. Fitness indices of the initial model
Index Observed data Acceptable level
X2 X2=104.877 Less x2 indicates a better result.
P 0.000 >0.05
GFI 0.878 >0.9
AGFI 0.452 >0.9
RMSEA 0.225 <0.08
As table 7 illustrated, the test of the overall model implies an unacceptable fitness, since all of the fitness
indices do not reach an acceptable level. Under the circumstances, considering that there is unacceptable
model fitness, it is suggested to revise the model until the modifications become fit and meaningful (Suhr,
2006).
4.5.2 Model modification
There are two approaches of model modifications when the original model is not appropriate. Essentially,
one of the approach is releasing constraints through adding new parameters or paths, which aims to make the
model more reliable; the other one is imposing constraints by deleting free parameters or insignificant path,
which makes the model clearer (Chou & Bentler, 2002). In this case, in order to obtain an acceptable model
fitness, several parameters, such as the auditory stimuli, pleasant and relaxing, were deleted since there are a
low significance between these deleted parameters with purchase intention. A revised model was illustrates
as following figure 8.

44
Figure 8. The revised model
Generally, the overall revised model implies a good fitness with the data after model modification. As for
the specific fitness indices, it has been illustrated in the following table 8.
4.5.3 Evaluation of revised model fitness
After model modification, evaluating the fitness indices is also required. The following table 8 presents the
fitness indices of the revised model.
Table 8. The fitness indices of the revised model
Types of fitness index Index Observed dat
a
Acceptable level
Absolute fitness index
X2 1.756 Less x2 indicates a better result.
P 0.625 >0.05
GFI 0.997 >0.90
AGFI 0.978 >0.90
RMR 0.012 <0.05
RMSEA 0.000 <0.08

45
Relative fitness
index
NFI 0.993 >0.90
RFI 0.964 >0.90
IFI 1.005 >0.90
Simple fitness
index
CN 1209 >200
NCX2/df 0.59 <2
As the table 8 shows, all the indicators have reached an acceptable level of fit, which indicates that the
revised model can be used to examine the proposed hypotheses. Therefore, the following part will elucidate
the concrete results for testing the hypotheses.
4.5.4 Results
On the basis of above figure 8, the following table 9 has summarized the relationship among each variable
and the path coefficient accordingly.
Table 9. Summary of the path coefficient
Relationships Path coefficient P
Direct effect
(Vision)
Visual stimuli ⇒ Purchase
intention
0.26 ***
Indirect effect
(Olfaction)
Olfactory stimuli ⇒
Arousing ⇒ Purchase
intention
0.26 x 0.21= 0.0546 .001
Olfactory stimuli ⇒
Exciting ⇒ Purchase
intention
0.20 x 0.21 = 0.042 .003
Both direct effect and
indirect effect (Touch)
Tactile stimuli ⇒ Purchase
intention
0.19 ***

46
Tactile stimuli ⇒ Arousing
⇒ Purchase intention
0.24 x 0.21 = 0.0504 .001
Tactile stimuli ⇒ Exciting
⇒ Purchase intention
0.38 x 0.21 = 0.0798 ***
According to the data, the hypotheses would be tested as following.
● Hypothesis H1a and H1b test
Firstly, hypothesis H1a proposes that visual stimuli have an influence on triggering female consumer’s
positive emotion in a cosmetic store. As can be seen from figure 8, visual cues do not appear to trigger any
positive emotion, either for triggering an arousing emotion or an exciting emotion. Therefore, H1a is
rejected.
Hypothesis H1b proposes that visual stimuli have a positive influence on female consumer’s purchase
intention in a cosmetic store. As table 8 illustrates, visual stimuli have a direct and positive significant
influence on female’s purchase intention (β = .26, p = .000). Keith (2006) has suggested that when β > 0.25,
it implies a strong and large influence between two variables. Therefore, the path coefficient of .26 implies
visual stimuli exert a positive and large influence on female consumer’s purchase intention. Consequently,
hypothesis H1b is supported.
● Hypothesis H2a and H2b test
Hypothesis H2a suggested that olfactory stimuli have an influence on triggering female consumer’s positive
emotion in a cosmetic store. According to table 9, olfactory stimuli have a positive influence on triggering
both female’s arousing emotion (β = .26) and exciting emotion (β = .20). Keith (2006) has suggested that
when 0.11 ≦ β ≦ 0.25, it implies a moderate influence between two variables. Therefore, H2a is supported.
Hypothesis H2b suggests that olfactory stimuli have a positive influence on female consumer’s purchase
intention in a cosmetic store. The results of table 9 have indicated that olfactory stimuli have an indirect
effect on purchase intention with the intervention of female consumer’s arousing mood and exciting mood.
Warner (2013) and Keith (2006) stated that the indirect effect size can be calculated by multiplying the
coefficients for every leg of the path.
● When female’s arousing mood plays a mediated role, the indirect effect of olfactory stimuli on
purchase intention is .0546 (β = .26 x .21= .0546, p = .001). As Keith (2006) suggested, when β ≦

47
0.10, it implies a small but meaningful influence between two variables. Hence, the path coefficient
of .0546 indicates olfactory stimuli have a positive but small influence on female consumer’s
purchase intention with the intervention of female consumer’s arousing mood.
● When female’s exciting mood plays a mediated role, the indirect effect of olfactory stimuli on
purchase intention is .042 (β = 0.20 x 0.21 = 0.042, p = .003). Therefore, the path coefficient of .042
indicates olfactory stimuli have a positive but small influence on female consumer’s purchase
intention with the intervention of female consumer’s exciting mood.
To sum up, with the intervention of female consumer’s arousing mood or exciting mood, olfactory stimuli
have a positive, indirect and small influence on purchase intention. Consequently, hypothesis H2b is
supported.
● Hypothesis H3a and H3b test
Hypothesis H3a proposes that tactile stimuli have an influence on triggering female consumer’s positive
emotion in a cosmetic store. Based on table 9, tactile stimuli have a significant influence on triggering both
female’s arousing emotion (β = .24) and exciting emotion (β = .38). Therefore, H3a is supported.
Hypothesis H3b suggests that tactile stimuli have a positive influence on female consumer’s purchase
intention in a cosmetic store. On the one hand, tactile stimuli have a direct and positive influence on
female’s purchase intention (β = .19, p = .000). Keith (2006) has suggested that when 0.11 ≦ β ≦ 0.25, it
implies a moderate influence between two variables. Therefore, the path coefficient of .19 implies tactile
stimuli exert a positive, direct and moderate influence on female consumer’s purchase intention.
On the other hand, the results of table 9 also indicate that tactile stimuli have an indirect effect on purchase
intention with the intervention of female consumer’s arousing mood and exciting mood. The path coefficient
of .0504 (β = 0.24 x 0.21 = 0.0504, p = .001), .0798 (β = 0.38 x 0.21 = 0.0798, p = .000) indicates olfactory
stimuli have a positive but small influence on female consumer’s purchase intention with the intervention of
female consumer’s arousing mood and exciting mood respectively.
To sum up, tactile stimuli have a positive influence on purchase intention in the cosmetic store, whether with
intervention of female consumer’s arousing mood and exciting mood or not. Consequently, hypothesis H3b
is supported.
● Hypothesis H4a and H4b test
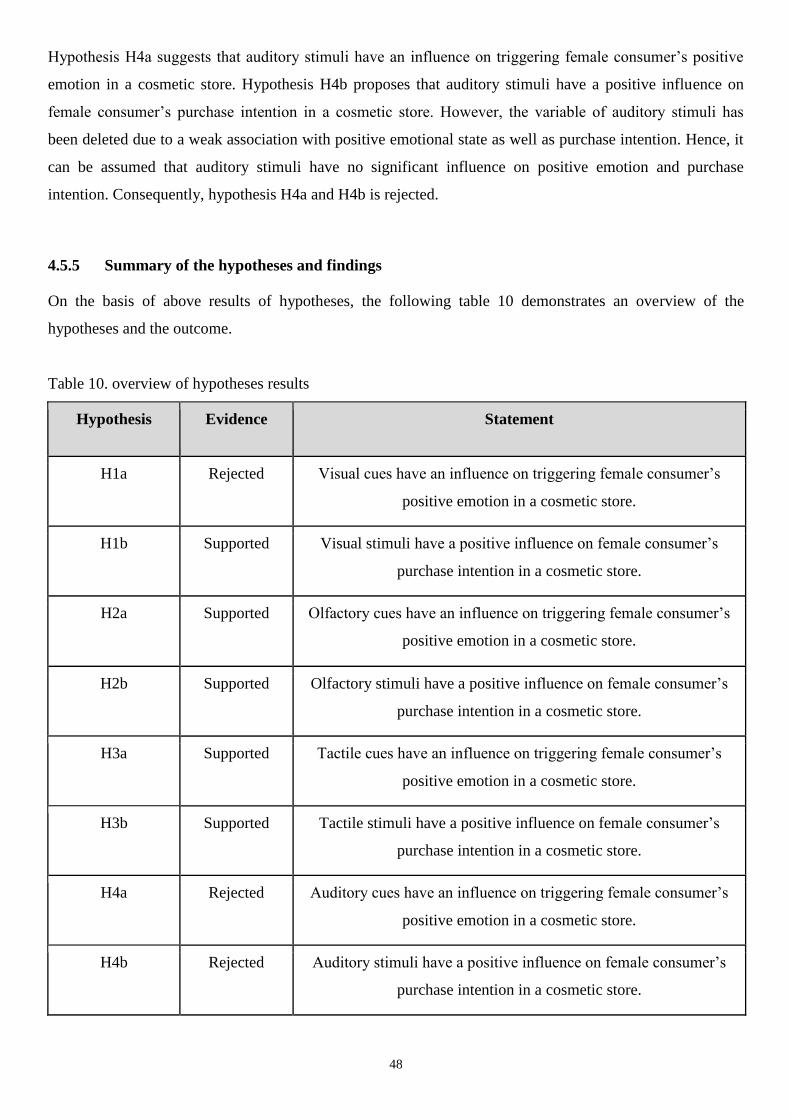
48
Hypothesis H4a suggests that auditory stimuli have an influence on triggering female consumer’s positive
emotion in a cosmetic store. Hypothesis H4b proposes that auditory stimuli have a positive influence on
female consumer’s purchase intention in a cosmetic store. However, the variable of auditory stimuli has
been deleted due to a weak association with positive emotional state as well as purchase intention. Hence, it
can be assumed that auditory stimuli have no significant influence on positive emotion and purchase
intention. Consequently, hypothesis H4a and H4b is rejected.
4.5.5 Summary of the hypotheses and findings
On the basis of above results of hypotheses, the following table 10 demonstrates an overview of the
hypotheses and the outcome.
Table 10. overview of hypotheses results
Hypothesis Evidence Statement
H1a Rejected Visual cues have an influence on triggering female consumer’s
positive emotion in a cosmetic store.
H1b Supported Visual stimuli have a positive influence on female consumer’s
purchase intention in a cosmetic store.
H2a Supported Olfactory cues have an influence on triggering female consumer’s
positive emotion in a cosmetic store.
H2b Supported Olfactory stimuli have a positive influence on female consumer’s
purchase intention in a cosmetic store.
H3a Supported Tactile cues have an influence on triggering female consumer’s
positive emotion in a cosmetic store.
H3b Supported Tactile stimuli have a positive influence on female consumer’s
purchase intention in a cosmetic store.
H4a Rejected Auditory cues have an influence on triggering female consumer’s
positive emotion in a cosmetic store.
H4b Rejected Auditory stimuli have a positive influence on female consumer’s
purchase intention in a cosmetic store.

49
The above results indicate that both olfactory cues and tactile cues enable to trigger female’s consumer
positive emotion in a cosmetic store, while visual cues and auditory do not seem to exert a significant
influence on female consumers. Considering that H1b, H2b, H3b is supported and H4b is rejected, it
indicates that visual stimuli, olfactory stimuli and tactile stimuli all enable to exert a positive impact on
female’s purchase intention in cosmetic retail environment, except for the auditory stimuli. Therefore, by
comparing the magnitude of these three sensory stimuli:
● visual stimuli (β = .26)
● tactile stimuli (β = .19; β = .0504; β = .0798)
● olfactory stimuli (β = .0546; β = .042)
The above data indicate that visual stimuli have the most positive influence on female consumer’s purchase
intention in a cosmetic retail store. Tactile stimuli have a moderate positive influence, olfactory stimuli have
small and positive influence, while auditory stimuli seem to have no significant influence on female’s
purchase intention in a cosmetic store. The following chapter will discuss the results in detail by associating
with the theory and answer the proposed research questions.

50
5. Discussion
The literature overview has contributed to propose a developed conceptual model as well as hypotheses. The
literature overview also enables to provide a better comprehension of the empirical data. In this section, a
detailed interpretation of the research findings with consideration of the literature will be discussed.
Meanwhile, the research questions will also be answered: RQ1. What sensory cues can trigger female
consumer’s positive mood? RQ2. Which sensory stimuli have the most positive impact on female consumer’s
purchase intention?
5.1 Discussion
● Research question 1: What sensory cues can trigger female consumer’s positive emotion in a
cosmetic store?
It is believed that if consumers have good mood, then they feel more willing to award themselves and tend
to have more impulsive spending (Giraud, 2001). Generally, a consumer’s emotional state is supposed to be
influenced by these sensory cues when entering a retail store (Solomon et al., 2013). In this case, the sensory
cues primarily include visual cues, olfactory cues, tactile cues and auditory cues. In-store components enable
to enhance shoppers’ positive emotion and feeling (Donovan and Rossiter,1982; Turley & Chebat, 2002).
And positive emotion consists of arousing, exciting, pleasant and relaxing. This research question aims to
identify which sensory cues have a better capacity of triggering female’s positive emotion. In this case, the
proposed hypothesis H1a, H2a, H3a, H4a are tested with the application of SEM.
H1a proposed that visual cues have an influence on triggering female consumer’s positive emotion in a
cosmetic retail store. The outcomes of statistical testing imply that visual cues do not appear to trigger a
female consumer’s any positive emotion, either for triggering an arousing emotion or an exciting emotion.
Therefore, H1a is rejected. However, the finding shows a contradictory conclusion with a number of
previous researches (Donovan & Rossiter, 1982; Brengman & Geuens, 2003), which claim that visual cues
have a great potential to affect human’s positive mood in the retail environment. In this case, the rejection of
the hypothesis can be explained that just because visual cues are widely used in various retail stores,
consumers seem to be more accustomed to these visual cues. Their positive mood cannot be easily triggered
by these visual tricks, especially for female consumers, they generally seek more hedonism and exciting
experience. Hence, it is assumed that the cosmetic retail stores could consider a more unique visual cues to
trigger female’s positive mood.
H2a proposed that olfactory cues have an influence on triggering female consumer’s positive emotion in a
cosmetic retail store. The outcomes of statistical testing imply that olfactory cues have a positive and
51
significant impact on stimulating female’s arousing emotion (β = .26, p = .001) and exciting emotion (β
= .20, p = .003), respectively. Therefore, H2a is supported. In line with various studies (Kotler, 1973; Dani
& Vanishree, 2013), it claims that the ambient scent is more likely to create a positive emotional state.
Therefore, it is supposed that an appropriate use of olfactory cues in a cosmetic store will contribute to
trigger female’s positive emotion.
H3a proposed that tactile cues have an influence on triggering female consumer’s positive emotion in a
cosmetic store. The outcomes of statistical testing indicate that tactile cues have a positive and large effect
on triggering female’s arousing emotion (β = .24, p = .001) and exciting emotion (β = .38, p = .000),
respectively. Hence, H3a is supported. The finding is consistent with Essick, James and McGlone (1999),
who claim that there is an association between individual’s emotional reactions and tactile cues. In cosmetic
retail environment, consumers seem to be more accustomed that almost every cosmetic store provide free
cosmetic samples for consumers to test it (Gannon, 2011). But a consumer’s negative emotion is supposed to
generate if her desire to touch the product cannot be satisfied (Lu et al., 2012). Therefore, it is suggested for
cosmetic retailers to consider whether provide the opportunity to touch or test the product, but it should
depend on the types of cosmetic.
H4a proposed that auditory cues have an influence on triggering female consumer’s positive emotion in a
cosmetic store. The outcomes of statistical testing imply that auditory cues do not seem to trigger a female
consumer’s any positive emotion, either for triggering an arousing emotion or an exciting emotion. The
finding is line with Van der Zwaag et al. (2012), who claim that there was no significant effect between
music and arousal level. However, it seems there still remain controversies that whether the music has the
capacity of inducing moods by listeners or not (Kivy, 1990; Van der Zwaag et al., 2012). Since research also
indicate that fast tempo and high rhythm music appear to perform better for increasing arousal levels than
slow tempo and low rhythm music (Krumhansl 1997, Van der Zwaag et al. 2012). In this case, the music
playing in the cosmetic stores do not seem to exert a significant influence on female positive emotion. It can
be assumed that auditory cues do not enable to trigger female’s positive emotion in a cosmetic store.
To sum up, both olfactory cues and tactile cues enable to trigger female’s consumer positive emotion in a
cosmetic store. While visual cues and auditory do not seem to exert a significant influence on female
consumers.

52
● Research question 2: Which sensory stimuli has the most positive impact on female customers’
purchase intention in the cosmetic retail environment?
Sensory marketing nowadays has gained an increasing popularity by a number of researches, it is also used
as a marketing strategy in order to influence on consumer’s purchase intention (Grębosz & Wronska, 2013).
The majority of previous studies have been focusing on human’s senses (Suhonen & Tengvall, 2009),
However, until authors’ knowledge, little research exists demonstrating which sensory stimuli have the most
positive impact on female’s purchase intention, especially in the cosmetic retail environment. Hence, this
research aims to identify which sensory stimuli have the most positive impact on female consumer’s
purchase intention. In this case, the proposed hypothesis H1b, H2b, H3b and H4b are tested with the
application of SEM.
H1b Proposed that visual stimuli have a positive influence on female consumer’s purchase intention in a
cosmetic retail store. The outcomes of statistical testing (β = .26, p = .000) imply that visual stimuli have a
positive and large impact on female’s purchase intention. Findings also indicate that a female consumer’s
purchase intention will be directly influenced by the visual cues that used in the retail environment, without
the intervention of consumer’s emotion. Therefore, statistical testing support H1b. This is line with what
Sayadi, Mobarkabadi and Hamidi (2015) stated: sight is the strongest sense in human’s sensory system,
consumers are largely reply on this sense and often make a purchasing decision decision based on their first
impression. Especially for female consumers, they tend to generate impulsive consumption when they are
attracted by something fairly interested, such as attractive appearance or unique design (Greer, 1999; Luo,
2002; Kaur, 2015).
H2b proposed that olfactory stimuli have a positive influence on female consumer’s purchase intention in a
cosmetic retail store. The outcomes of statistical testing (β = .0546, p = .001; β = .042, p = .003) indicate
that olfactory stimuli have a positive impact on female’s purchase intention. Besides, an interesting finding
is that olfactory stimuli, unlike visual stimuli, are not supposed to influence a female consumer’s purchase
intention directly. In this case, when female consumers are stimulated by the olfactory cues in the cosmetic
store, they will first generate an arousing mood or exciting mood, and then they will have a desire to
purchase. Consequently, statistical evidence support H2b. In line with Lodzka (2012) and Hussain and Ali
(2015), olfactory cues enable to exert an impact on consumer’s emotion and subsequently on their approach
behaviour (e,g. intention to patronage the store or purchase). Actually, female shopping is not only for
seeking and purchasing products, they also for the purpose of pleasure, entertainment and independence
(Huddleston & Minahan, 2011). The ambient scent of a retail store is more likely to create a positive
emotional state (Kotler, 1973; Dani & Vanishree, 2013). Therefore, it can be assumed that the application of

53
olfactory cues will first influence female consumers’ emotional state, and they tend to generate purchase
intentions when they consider the scents are pleasant.
H3b proposed that tactile stimuli have a positive influence on female consumer’s purchase intention in a
cosmetic retail store. On the one hand, the outcomes of statistical testing (β = .19, p = .000) suggest that
tactile stimuli have a positive and direct impact on female’s purchase intention. This finding is in line with
the literature that proposed by Kolter et al (2016), which claim that offering ample opportunities for
customers to touch the products can lead to increased purchase intention. On the other hand, an interesting
finding is that a female’ purchase intention also enables to be influenced indirectly, but it requires the
intervention of consumers’ arousing mood and exciting mood. This finding is also conformed with the
literature by Peck and Wiggins (2006), who state that if consumers are allowed to touch or test the product,
they would generate a more positive emotional reaction towards their experience of touch, even though there
is inadequate information provided by the tactile cues. Especially for female consumers, their pleasant tactile
experience and strong emotional systems would persuade them into impulsive purchasing (Gannon, 2011).
Tactile stimuli could be very useful for cosmetic stores and female consumers, since only if they a better
tactile experience, then they would be more persuaded to purchasing. Consequently, H3b is supported.
H4b proposed that auditory stimuli have a positive influence on female consumer’s purchase intention in a
cosmetic retail store. However, the outcomes of statistical testing imply that tactile stimuli have a weak
association with purchase intention. Hence, it can be assumed that auditory stimuli have no significant
influence on purchase intention. Consequently, hypothesis H4b is rejected. In contrast to authors’ findings,
the research has implied that auditory cues, such as music, enable to exert a significant influence on
consumers’ purchase intention in the retail environment (Hussain & Ali, 2015). The potential of music is
considered as a powerful function for inducing consumers’ purchase intention (Juslin & Sloboda 2010),
however, Van der Zwaag et al. (2012) also claim that female consumers seem to be more favor of retail
environment that without music playing. Hence, it can be assumed that auditory stimuli exert a less
significant influence on female consumers’ purchase intention.
To sum up, the outcomes of statistical testing imply that the magnitude of visual stimuli path coefficient is
the biggest. Hence, it is possible to assume that visual stimuli have the most positive influence on female
consumer’s purchase intention in a retail store, among other three sensory stimuli. Vision is regarded as the
most important sense when individuals perceive a commercial environment (Hultén, 2012). Lindstrom (2005)
states that 37% of people regard visual effect as the most important when evaluating the ambient
environment, scents have accounted for 23%, auditory effects have occupied 20%, taste have accounted for
15%, while tactile effect rank the last place and occupy only 5%. Lindstrom (2005) also mentioned that
visual stimuli usually overrule other sensory stimuli, which has a powerful potential to convince individuals

54
to reject all logic. Especially for female consumers, they tend to generate impulsive consumption when there
is attractive appearance or unique design (Greer, 1999; Luo, 2002; Kaur, 2015). Actually, the application of
visual cues is no more a unique advantage, since it is necessary for surviving in the retail environment.
Although the statistical data proves that visual stimuli have the most positive effect on female’s purchase
intention in a cosmetic store, female seems to be less sensitive towards visual cues since it is a common
strategy that used by retail store. Therefore, a combination of other sensory cues would be favored by female
consumers in the cosmetic retail environment. Since the statistical outcome from the questionnaire also
indicate that tactile cues and olfactory cues also grant a moderate and small effect respectively on female’s
purchase intention.
55
6. Conclusion
Since the findings of the research has been analysed in the discussion chapter. This chapter is going to
summarize the most critical point and demonstrate the conclusion of the thesis. Moreover, managerial
implications and recommendations for future study will be proposed in the end of the thesis.
6.1 Conclusion
Nowadays, it is undeniable fact that cosmetic consumption has become an essential part of every
individual’s life, whether for female or male (Larsen & Tambo, 2014). But to some degree, the cosmetic
industry seems to pay more attention to female consumers’ demands than male (Kumar et al., 2006). As
Huddleston and Minahan (2011, p.5) claim: “women call the shots in the vast majority of consumer
decisions.” Female customers nowadays are powerful purchasers, since they are one half of the population
and account for over half of the consumption (Silverstein & Sayre, 2009). Besides, female consumers
generally have abundant emotions, and they are more likely to make impulsive purchase and pursue hedonic
purchasing experience than male consumers (Greer, 1999; Mpinganjira, 2014; Kaur, 2015). Considering that
female consumers have huge consumption, therefore, developing an effective strategy is necessary for
cosmetic marketers to reach their target consumer group.
Nowadays, at the age of fierce competition environment and increasing expectations of consumers, a
number of enterprises have been forced to seek for new marketing strategy in order to achieve value co-
creation with their customers. Sensory marketing attempts to engage human’s five senses and subsequently
exert an impact on their emotion, judgment and behaviour (Krishna, 2012). The sensory cues in the cosmetic
retail environment can be considered as: layout and lighting effect, the ambient scents diffused, the music
playing, and the opportunity to test the cosmetic products. An appropriate use of these sensory cues would
contribute to create a favourable retail environment for cosmetic retail industry, and subsequently triggering
consumer’s positive emotion and purchase intention.
The concept of female consumers and sensory marketing are the core of this thesis. The purpose of this
study aims to investigate what sensory cues in a cosmetic shop have a better capacity to trigger female
consumer’s positive emotion, as well as to identify the impact level of these sensory stimuli on female’s
purchase intention in the cosmetic retail environment. In order to achieve the research purpose, the authors
have proposed the research questions, conceptual model as well as hypotheses. Besides, an online
questionnaire is used to collect primary data for the research. The responses from the respondents are from
female and their age are mainly in the range of 20 to 40 years old. The conceptual model and the hypotheses
are tested by using structural equation model (SEM), which is also rarely used in previous researches. In a
56
word, all the outcomes are for the purpose of answering research questions. The results are shown as
following:
● RQ1. What sensory cues can trigger female consumer’s positive emotion in a cosmetic store?
Both olfactory cues and tactile cues enable to trigger female’s consumer positive emotion in a cosmetic store,
while visual cues and auditory cues do not seem to exert a significant influence on female consumers.
● RQ2. Which sensory stimuli has the most positive impact on female customers’ purchase intention in
the cosmetic retail environment?
Visual stimuli have the most positive influence on female consumer’s purchase intention in a cosmetic retail
store. Tactile stimuli have a moderate positive influence, olfactory stimuli have small and positive influence,
while auditory stimuli seem to have no significant influence on female’s purchase intention in a cosmetic
store.
6.2 Managerial implications
According to the existing literature, it can be noticed that there is a lack of study to consider gender as an
important variable in terms of sensory marketing, especially in the cosmetic retail environment. Marketers
should consider to apply different strategies according to different gender. This research has closed this gaps
and confirms that the sensory dimension of tactile and visual stimuli can direct impact female customers’
purchase intention in cosmetic retail environment.
The findings demonstrated that environmental stimuli produced mood state, so that cosmetic shop could use
the findings as a guidance in planning exciting and arousing environments. There were some attributes that
were more significant than others in enhancing female consumer’s mood states, and purchase intention. So
the results of this thesis have implications for how to efficiently allocate business resources for cosmetic
retailers. On one hand, visual sense as the most important environmental stimuli that directly influences
female consumers’ purchase intention, which implies a cosmetic store’s lighting effect, layout and colours
are more likely to differentiate a store from its competitors. On the other hand, tactile dimension among the
cosmetic environmental features can also influence female consumers’ purchase intention, which indicates
the opportunity to touch or test the products is important in a cosmetic shop.
According to author’s finding, exciting and arousing were two of the most significant mood states that
affecting female customers’ purchase intention in cosmetic retail environment. The sensory stimuli of tactile
and olfaction can both trigger those two mood states. It is important to recognize that aroma and

57
opportunities to touch can be controlled by management, and this might be one of the least expensive ways
to trigger female customers exciting and arousing mood state. For instance, cosmetic retailers can provide as
much opportunities as possible for customers to try and to test the cosmetic products. Therefore, cosmetic
retailers should consider using proper sensory stimuli as an operational tool.
The overall results of this thesis reinforced the significant of understanding the impact of sensory stimuli on
female customer’s purchase intentions. Some cosmetic retailers may overlook the impact level of each
sensory component on female customers. The finding indicates each sensory stimuli has different impact
level on female customers. Therefore, cosmetic retailers should understand the significance of physical
environment in generating positive mood state so that further increase purchase intention.
6.3 Future research
There are several aspects can be recommended for future research. First of all, since this thesis surveyed
customers about cosmetic retailers with a focus on limited line retailers, the types of results examined may
not be able to generalized to all forms of retailers. Thus, it is recommended to conduct research in other
types of retail shops, for example clothes retailer shops, restaurants, etc.
Furthermore, this study is based on people’s perception towards environment. This means individual
differences (e.g.: cultural differences, personalities, ethnicity) could have an influences on the final result.
For future study, the study of sensory marketing within Lush, the Body shop and Ritual’s could be
conducted by investigating and controlling the individual differences might contribute to a better result
Another suggestion on future research is to conduct research on male samples. Since this thesis put a focus
on female samples, it is also recommended to conduct a similar research on male samples by choosing
typical male stores so that to compare how the genders perceive the sensory marketing; and in addition to
know which sensory stimuli is the most effective according to male’s perception.
58
Reference list
Agapito, D., Valle, P. O. D., & Mendes, J. (2012). Sensory marketing and tourist experiences. Spatial and
Organizational Dynamics Discussions Papers, 10, 7-19
Anıl Değermen Erenkol & Merve AK (2015). Sensory marketing. Journal of Administrative Sciences and
Policy Studies, 3(1), 1-26.
Areni, C. S., & Kim, D. (1994). The influence of in-store lighting on consumers' examination of
merchandise in a wine store. International of Research in Marketing, 11, 117-125.
Augustin, S. (2009). Place Advantage: Applied Psychology for Interior Architecture, Hoboken. New Jersey:
John Wiley & Sons, Inc.
Babin, B. J., Darden, W. R., & Griffin, M. (1992). Consumer Assessments of Responsibility for Product-
Related Injuries: The Impact of Regulations, Warnings, and Promotional Policies. Advances in Consumer
Research, 19, 870-878.
Babin, B. J., & Attaway J. S. (2000). Atmospheric affect as a toll for creating value and a gaining share of
customer. Journal of Business Research, 49, 91-99.
Babin, B.J. & Darden, W.R. (1995). Consumer self-regulation in a retail environment. Journal of Retailing,
71(1), 47-70.
Baines, P., & Fill, C., & Page, K. (2008). Marketing. Oxford. New York: Oxford University Press.
Baker, J., Levy, M., & Grewal, D. (1992). An experimental approach to making retail store environmental
decisions. Journal of Retailing, 68(4), 445-460.
Baker, J., Parasuraman, A., Dhruv, G., Glenn, B. V. (2002). The Influence of Multiple Store Environment
Cues on Perceived Merchandise Value and Patronage Intentions. Journal of Marketing, 66,120-141.
Bakshi, S. (2012). Impact of gender on consumer purchase behaviour. National monthly refereed journal of
research in commerce & management, 1(9), 1-8.
Blumberg, B., Cooper, D. R. & Schindler, P. S. (2008). Business Research Method. NY: McGraw-Hill
Higher Education.
Bradford, K. D., & Desrochers, D. M. (2009). The use of scents to influence consumers: The sense of using
scents to make cents. Journal of Business Ethics, 90, 141-153.
Brengman, M. & Geuens, M. (2003). The impact of colour in the store environment. In Proceeding of the
Society for Consumer Psychology, New Orleans: n.p.
Browne, M.W. & Cudeck, R. (1993). Alternative ways of assessing model fit. Testing structural equation
models. Newbury Park, CA: Sage, 136–162.

59
Burns, R. P., & Burns, R. A. (2008). Business Research Methods and Statistics Using SPSS. London, SAGE
Publications Ltd.
Bryman, A. (1988). Quantitative and qualitative research. London Boston: Unwin Hyman Publication.
Byrne, B. M. (2001). Structural equation modeling with AMOS: Basic concepts, applications, and
programming. Mahwah, NJ: Lawrence Erlbaum Associates.
Carù, A., & Cova, B. (2003). Revisiting consumption experience: a humbler but complete view of the
concept. Marketing Theory, 3(2), 259-278.
Chang, C. (2007). The relative effectiveness of comparative and non-comparative advertising: Evidence for
gender differences in information-processing strategies. Journal of Advertising, 36(1), 21-35.
Chen, X., Shao, F., Barnes, C., Childs, T., & Henson, B. (2009). Exploring relationships between touch
perception and surface physical properties. International Journal of Design, 3(2), 67-76.
Chou, C. P., & Bentler, P. M. (2002). Model modification in structural equation modeling by imposing
constraints. Computational Statistics & Data Analysis, 41, 271-287.
Chrysi, A. (2013). Sensory marketing and branding: exploring the power of the senses: a review. 117.
Ciprian, P. (n.d.). Using visual content in your marketing. Retrieved on March 4th, 2017 from
http://www.quaestus.ro/wp-content/uploads/2012/03/pavel5.pdf
Countryman, C. C., & Jang, S. (2006). The effects of atmospheric elements on consumer impression: the
case of hotel lobbies. International Journal of contemporary hospitality management, 18(7), 534-545.
Collins, J. C.(1984). Renormalization: an introduction to renormalization, the renormalization group and the
operator-product expansion. Cambridge university press.
Creswell, R. (2014). Research design: qualitative, quantitative, and mixed methods approaches. USA: Sage
Publications.
Crowley, A. E. (1993). The two-dimensional impact of color on shopping. Marketing Letters, 4(1), 59-69.
Dani, V., & Panalkar, V. (2013). Branding through sensory marketing. International Journal of Scientific
Research, 2(11), 300-302.
Dani, V., & Vanishree P. (2013). Branding through Sensory Marketing. International Journal of Scientific
Research, 2(11).
Dijksterhuis, A., Smith, P. K., Baaren, R. B., & Wigboldus, D. H. J. (2005). The Unconscious Consumer:
Effects of Environment on Consumer Behavior. Journal of Consumer Psychology, 15(3): 193-202.
Donovan, R., & Rossiter, J. (1982). Store Atmosphere: An Experimental Psychology Approach. Journal of
Retailing, 58, 34-57.
Dowdy, C. (2008). One-off: Independent Retail Design. Laurence King Publishing Ltd.

60
Dubé, L., Chebat, J., & Morin, S. (1995). The Effects of Background Music on Consumers' Desire to
Affiliate in Buyer-Seller Interactions. Psychology and Marketing 12(4), 305–319.
Easterby-Smith, M., Thorpe, R., & Jackson, P. R. (2015). Management and business research. Sage.
Elliott, R. (1993). Gender and the Psychological Meaning of Fashion Brands. Association for Consumer
Research, 2, 99-106.
Essick, G. K., James, A., & McGlone, F. P. (1999). Psychophysical assessment of the affective components
of non-painful touch. Neuroreport, 10(10), 2083-2087.
Faber, R. J., & Vohs, K. (2004). To buy or not to buy? Self-control and self-regulatory failure in purchase
behavior. In R. F. Baumeister & K. Vohs (Eds.), The Handbook of Self-Regulation, 509-524.
Fiore, A. M., & Damhorst, M. (1992). Intrinsic cues as predictors of perceived quality of apparel. Journal of
Consumer Satisfaction, Dissatisfaction and Complaining Behavior, 5, 168-178.
Fiore, A., & Kim, J. (2007). An Integrative Framework capturing Experiential and Utilitarian Shopping
Experience. International Journal of Retail & Distribution Management, 35(6), 421-442.
Foxall, G. R. (1997). The emotional texture of consumer environments: a systematic approach to
atmospherics. Journal of Economics Psychology, 18(4), 505-523.
Foscht, T., Morschett, D., Rudolph, T., Schnedlitz, P., Schramm-Klein, & Swoboda, B. (2014). European
Retail Research, 28 (1), 1-26.
Gancer, J., & Huda, F. (2010), Music’s Effect on Mood and Helping Behavior, UW-L Journal of
undergraduate research, 8, 1-5.
Gannon, D. (2011). How to use samples to promote your product? Retrieved 20th March, 2017 from
https://www.inc.com/guides/201105/how-to-use-samples-to-promote-your-product.html
Ghauri, P. N., & Grønhaug, K. (2005). Research methods in business studies: A practical guide. Pearson
Education.
Goldkuhl, L., & Styvén, M. (2007). Sensing the scent of service success. European Journal of Marketing,
41(11/12), 1297-1305.
Grębosz, M., & Wrońska, B. (2013). Sensory Impact on the Purchase of Textile Products. Fibres & Textiles
in Eastern Europe.
Grohmann, B., Spangenberg, E. R., & Sprott, D. E. (2007). The influence of tactile input on the evaluation
of retail product offerings. Journal of Retailing, 83(2), 237-245.
Hair, J. F., Ringle, C. M., & Sarstedt, M. (2011). PLS-SEM: indeed, a silver bullet. Journal of Marketing
Theory and Practice, 18(2), 139-152.
Herrmann, A., Zidansek, M., Sprott, D. E., & Spangenberg, E. R. (2012). The Power of Simplicity:
Processing Fluency and the Effects of Olfactory Cues on Retail Sales. Journal of Retailing, 89(1), 30-43.

61
Hill, R. P., & Gardner, M. P. (1987). The buying process: Effects of and on consumer mood states. ACR
North American Advances.
Hinton, P. B., & Henley, T. B. (1993). Cognitive and affective components of stimuli presented in three
modes. Bulletin of the Psychonomic Society, 31(6), 595-598.
Hinkelmann, K., & Witschel, H. F. (2013). How to choose a research methodology. University of Applied
Sciences, Northwestern Switzerland, School of Business, Available Online: http://knut. hinkelmann.
ch/lectures/project2013/p1_5_how-to-choose-a-researchmethodology. pdf [Accessed 1 April 2017].
Holmberg, J., & Öhnfeldt, R. 2010. The female fashion consumer behavior: from the perspective of the shop
Fever in Gothenburg. Bachelor Thesis, Gothenburg. Sweden.
Hooper, D., Coughlan, J., & Mullen, M. R. (2008). Structural Equation Modelling: Guidelines for
Determining Model Fit. The Electronic Journal of Business Research Methods, 6(1), 53 – 60.
Huddleston, P., & Minahan, S. (2011). Consumer behaviour: woman and shopping. New York: Business
Expert Press, LLC.
Hultén, B., Broweus, N., & Dijk, M. V. (2009). Sensory marketing. NY: Palgrave Macmillan.
Hultén, B. (2011). Sensory marketing: The multi-sensory brand-experience concept. European Business
Review, 23(3), 256-273.
Jeck, J., & Wiggins, J. (2006). It Just Feels Good: Customers’ Affective Response to Touch and Its
Influence on Persuasion. Journal of Marketing, 70, 56–69.
Joshi, A. (2015). ROLE OF SENSORY BRANDING ON CONSUMER BUYING BEHAVIOR IN FMCG
PRODUCTS. International Journal in Management and Social Science, 03(3), 127-138
Johnson, L., & Learned, A. (2004). Don't think pink: What really makes women buy--and how to increase
your share of this crucial market. AMACOM Div American Mgmt Assn.
Juslin, P. N., & Sloboda, J. A. (2010). The past, present, and future of music and emotion research. New
York: Oxford University Press.
Kang, E., Boger, C. A., Back, K. J., & Madera, J. (2011). The impact of sensory environments on Spagoers’
emotion and behavioral intention. Unpublished Thesis, Houston University Houston.
Kaur, S. (2015). Women and consumerism (impulsive buying). Indian Journal of Research, 4(3), 6-8.
Keith, T. Z. (2006). Multiple regression and beyond. Boston, MA: Allyn & Bacon.
Kellaris, J. J., & Altsech, M. B. (1992). The experience of time as a function of musical loudness and gender
of listener. Advances in consumer research, 19: 725–729.
Khraim, H. S. (2011). The Influence of Brand Loyalty on Cosmetics Buying Behavior of UAE Female
Consumers. International Journal of Marketing Studies, 3(2), 123-133.

62
Kim, H. S. (2006). Using hedonic and utilitarian shopping motivations to profile inner city consumers.
Journal of Shopping Center Research,13(1), 57‐79.
Kivy, P. (1990). Music alone: Reflections on a purely musical experience. NY: Cornell University Press.
Kline, R. B. (2005). Principles and Practice of Structural Equation Modeling (2nd ed.). New York: The
Guilford Press.
Kolb, B. (2008). Marketing research: a practical approach. Sage.
Kotler, P. & Armstrong, G. (2010). Principles of marketing (13th ed.). New Jersey: Pearson Education.
Kotler, P. (1973). Atmospherics as a Marketing Tool. Journal of Retailing, 49(4), 48-64.
Kotler, P., Keller, K. L., Brady, M., Goodman, M., & Hansen, T. (2016). Marketing management. Pearson
Education Ltd..
Krishna, A. (2010). Sensory marketing research on the sensuality of products. 6th edition. New York:
Routledge.
Krishna, A. (2012). An integrative review of sensory marketing. Engaging the senses to affect perception,
judgment and behavior. Journal of Consumer Psychology, 22(3), 332-351.
Krishna, A., & Elder, R. (2010). The Gist of Gustation. Sensory Marketing: Research on the Sensuality of
the Products, 281-297.
Krishna, A., Cian, L., & Sokolova, T. (2016). The power of sensory marketing in advertising. Current
Opinion in Psychology, 10, 142-147.
Krumhansl, C. L. (1997). An exploratory study of musical emotions and psychophysiology. Canadian
Journal of Experimental Psychology, 51, 336-352.
Kumar, R. (2011). Research Methodology: a step-by-step guide for beginners (3rd. ed.). London: SAGE
Publications Ltd.
Kumar, S., Massie, C. & Dumonceaux, M. D., 2006. Comparative innovative business strategies of major
players in cosmetic industry. Industrial Management & Data Systems 106, 285-306.
Kuruvilla, S. J., & Nishank, J., & Nidhi, S. (2009). Do men and women really shop differently? An
exploration of gender differences in mall shopping in India. International Journal of Consumer Studies, 33,
715-723.
Larsen, R. H., & Tambo, T. (2014). Managing cosmetics technologies in Dynamic environments. Aarhus
University. Retrieved 20th June, 2017 from
https://pure.au.dk/ws/files/82416676/Managing_cosmetics_technologies_in_a_never_stable_environment.pd
f
Levy, M., & Weitz, B. A. (2012). Retailing Management (8th ed.). New York, NY: McGraw-Hill.

63
Leedy, P. D., & Ormrod, J. E. (2001). Practical research: Planning and design . New Jersey: Prentice-Hall.
Liang, J. L., Chen, Y. Y., Duan, Y. S., & Ni, J. J. (2013). Gender differences in the relationship between
experiential marketing and purchase intention. Journal of International Management Studies, 8(1), 10-19.
Liaw, G. F. (2007). The Influence of Multiple Store Environment Cues on Shopping Mood and Patronage
Satisfaction. 7th Global Conference on Business & Economics. Rome.
Lindström, M. (2010), Brand sense, sensory secrets behind the stuff we buy. 2nd ed. Kogan Page limited,
United Kingdom.
Lindström, M. (2005). Broad sensory branding. Journal of Product & Brand management, 14(2), 84-87.
Loehlin, J. C. (1992). Latent variable models. Hillsdale, NJ: Lawrence Erlbaum Publishers.
Lu, Yu., Lu, Ya., & Wang, B. (2012). Effects of dissatisfaction on customer repurchase decisions in e-
commerce: An emotion-based perspective. Journal of Electronic Commerce Research, 13(3), 224-237.
MacCallum, R. C., & Austin, J. T. (2000). Applications of structural equation modeling in psychological
research. Annu Rev Psychol, 51, 201- 226.
Malhotra, N. Birks, D. (2007). Marketing Research: an applied approach: (3rd). Harlow, UK, Pearson
Education.
McDonald, M., & Rogers, B., & Woodburn, D. (2000). Key Customers: How to Manage Them Profitably.
Oxford: Butterworth-Heinemann.
McDonald, R. P., & Ho, M. H. R. (2002). Principles and Practice in Reporting Statistical Equation Analyses.
Psychological Methods, 7(1), 64-82.
Mercola. (2015). Why smells can trigger strong memories? Retrieved 18th March , 2017 from
http://articles.mercola.com/sites/articles/archive/2015/08/06/smells-trigger-memories.aspx
Meyers-Levy, J., Bublitz, M. G., & Peracchio, L. A. (2009). The sounds of the marketplace. Sensory
marketing: Research on the sensuality of products, 137-156.
Mehrabian, A., & Russell, J. A. (1974). An approach to environmental psychology. the MIT Press.
Mehrabian, A., (1976). Public Spaces and Private Spaces: The Psychology of Work, Play, and Living
Environments. New York: Basic Books.
Meyers-Levy. J., & Maheswaran, D. (1991). Exploring differences in males’ and females’ processing
strategies. Journal of Consumer Research, 18(1): 63 – 70.
Milliman, R. E. (1982). Using background music to affect the behavior of supermarket shoppers. The
Journal of Marketing, 86-91.
Mirabi, V. R., & Samiey, E. (2015). Factors influencing store environment perception (evidence from
Iranian chain stores). Journal of Scientific Research and Development, 2(6), 171-177.

64
Miwa, Y., & Hanyu, K. (2006). The effects of interior design on communication and impressions of a
counselor in a counseling room. Journal of Environment and Behaviour, 38, 484-502.
Mitchell, V. W., & Walsh, G. (2004). Gender differences in German consumer decision‐making styles.
Journal of Consumer Behaviour, 3(4), 331-346.
Malhotra, N. K., Birks, D. F., & Wills, P. (2012). Market Research.
Mojet, J., Christ-Hazelhof, E., & Heidema, J. (2001). Taste perception with age: generic or specific losses in
threshold sensitivity to the five basic tastes? Chemical senses, 26(7), 845-860.
Morrison, M. F. (2004). Hormones, Gender and the Aging Brain: The Endocrine Basis of Geriatric
Psychiatry. Cambridge: The Press Syndicate of the University of Cambridge.
Morrin, M., & Ratneshwar, S. (2003). Does it make sense to use scents to enhance brand memory?. Journal
of Marketing Research, 40(1), 10-25.
Mpinganjira, M. (2014). Understanding online repeat purchase intentions: a relationship marketing
perspective. University of Johannesburg. Retrieved 20th June, 2017 from http://hrcak.srce.hr/file/196731
Nasermoadeli, A., Ling, K. C., & Maghnati, F. (2013). Evaluating the impacts of customer experience on
purchase intention. International Journal of Business and Management, 8(6), 128.
Ng, M., Chaya, C., & Hort, J. (2013). The influence of sensory and packaging cues on both liking and
emotional, abstract and functional conceptualizations. Food Quality and Preference, 29(2), 146-156.
Ogden-Barnes, S. & Barclay, D. (2011). Store sense: Reclaiming the four walls with sensory engagement.
Retrieved 2th March, 2017, from http://www.biaa.com.au/resources/Library/store-sense.pdf
Olahut, M. R., & El-Murad, J., & Plaias, I. (2012). Store atmosphere: Conceptual Issues and Its Impact on
Shopping Behavior. In Proceedings of International Conference Marketing from information to decision (pp.
317-343). Academic Press.
Pam,M.S.,(n.d.) Sensory cue. Retrieved on March 6th, 2017 from https://psychologydictionary.org/sensory-
cue/
Pam MS (n.d.) What is sensory cue? Retrieved on March 6th, 2017 from
http://psychologydictionary.org/sensory-cue/
Peck, J., & Wiggins, J. (2006). It just feels good: Customers’ affective response to touch and its influence on
persuasion. Journal of Marketing, 70(4), 56-69.
Pedhazur, E. J. (1997). Multiple regression in behavioral research. New York, NY: Wadsworth.
Petermans, A., & Van Cleempoel, K. (2009). Retail Design and the Experience Economy: Where Are We
(Going)? Design Principles and Practices, 3(1), 171-182.
Petermans, A., & Van Cleempoel, K. (2010). Research in retail design: Methodological considerations for
an emerging discipline. In K. Sato, P. M. A. Desmet, P. Hekkert, G. Ludden, & A. Mathew (Eds.),

65
Proceedings of the 7th International Design & Emotion Conference [CD-ROM]. Chicago, USA: IIT
Institute of Design.
Pettersson, C., & Söderström, B. (2015). Factors affecting consumers purchase intentions for digital news:
A quantitative study of Resumé. Retrieved 10th April, 2017 from www.diva-
portal.org/smash/get/diva2:827720/FULLTEXT01.pdf
Puccinelli, N. M., Goodstein, R. C., Grewal, D., Price, R., Raghubir, P., & Stewart, D. (2009). Customer
experience management in retailing: understanding the buying process. Journal of Retailing, 85(1), 15-30.
Rajput, N., & Dhillon, R. (2013). Frontiers of the Marketing Paradigm for the Third Millennium:
Experiential Marketing. Global Journal of Management and Business Studies, 3(7), 711-724.
Rich, S. U., & Jain, S. C. (1968). Social class and life cycle as predictors of shopping behavior. Journal of
Marketing Research, 5, 41-49.
Robson, Colin (2002). Real World Research: A Resource for Social Scientists and PractitionerResearchers.
Oxford: Blackwell
Ruckdäschel, S. (2015). Leadership of Networks and Performance: A Qualitative and Quantitative Analysis.
Passau: Springer Fachmedien Wiesbaden.
Russell, J. A., & Pratt, G. (1980). A description of the affective quality attributed to environments. Journal
of Personality and Social Psychology, 38(2), 311–322.
Russell, J., & Lintern, F., & Gauntlett, L., & Davies, J. (2016). Cambridge International AS and A Level
Psychology. UK: Cambridge University Press.
Ryu, K., & Jang, S. (2008). Influence of restaurants' physical environments on emotion and behavioral
intention. The Service Industries Journal, 28(8), 1151-1165.
Saariluomaand, P., & Jokinen, J. P. P. (2014). Emotional dimensions of user experience: A user
psychological analysis. International Journal of Human-Computer Interaction, 30(4), 303-320.
Sakamoto, M; Watanabe, J. (2017). Exploring tactile perceptual dimensions using materials associated with
sensory vocabulary. Front Psychol, 8, 569.
Sarstedt, M. & Mooi, E., (2011). A concise guide to market research, chapter 9:“Cluster analysis”.
Saunders, M., Lewis, P., & Thornhill, A. (2009). Research methods for business students (5th ed.). England:
Pearson Education Limited.
Schäfer1, T. & Sedlmeier, P. (2009). What makes us like music. Proceedings of the 7th Triennial Conference
of European Society for the Cognitive Sciences of Music (ESCOM 2009), Jyväskylä, Finland, 487-490.
Schifferstein, H. N. J., & Spence, C. (2008). Multisensory product experience. In H. N. J. Schifferstein & P.
Hekkert (Eds.), Product experience (pp. 133-161). Amsterdam, the Netherlands: Elsevier.

66
Shao, C. Y., & Baker, J., & Wagner, J. A. (2004). The effects of appropriateness of service contact
personnel dress on customer expectations of service quality and purchase intention: The moderating
influences of involvement and gender. Journal of Business Research, 57, 164-1176.
Sherman, E., Mathur, A., & Smith, R. (1997). Store environment and consumer purchase behavior: Mediating
role of consumer emotions. Psychology and Marketing, 14(4), 361-378.
Shen Y, Zhao P (2005). A Comparative Res earch on Consumer Complaint Behavior. Acta Psychologica
Sinica, 37(3): 397-402
Shu, S. B., & Peck, J. (2011). Psychological ownership and affective reaction: Emotional attachment process
variables and the endowment effect. Journal of Consumer Psychology, 21(4), 439-452.
Silverstein, M. J. & Sayre, K. (2009). The female economy. Harvard Business Review. Retrieved 28th
March, 2017 from https://hbr.org/2009/09/the-female-economy
Social Issues Research Centre. (n.d). The smell report. Retrieved 18th March , 2017 from
http://www.sirc.org/publik/smell_emotion.html
Solomon, M., Bamossy, G. J., Askegaard, S., & Hogg, M. K. (2013). Consumer behaviour: A European
perspective (5.th ed.). Harlow: Pearson Education.
Soiferman, L. K. (2010). Compare and Contrast Inductive and Deductive Research Approaches. Online
Submission.
Spies, K., Westermann, R., Stahl, G., & Hesse, F. W. (1996). Relative effectiveness and validity of mood
induction procedures: a meta-analysis. European Journal of Social Psychology, 26, 557-580.
Suhr, D. (2006). The basics of structural equation modeling. Retrieved 12th May, 2017 from
http://www.lexjansen.com/wuss/2006/tutorials/TUT-Suhr.pdf
Sullivan, M., & Adcock, D. (2002). Retail marketing. Cengage Learning EMEA.
Tavakol, M., & Dennick, R. (2011). Making sense of Cronbach’s alpha. International Journal of Medical
Education, 2, 53-55.
Thatcher, R. (2010). Validity and reliability of quantitative electroencephalography. Journal of
Neurotherapy, 14(2), 122-152.
Theofanides, F., & Kerasidou, E. (2012). The role of sensory stimuli on perceived quality of cosmetic
products: An empirical examination of the buying process of face creams. International Conference on
Contemporary Marketing Issues (ICCMI), June 13-15, 2012, Thessaloniki, Greece.
Thompson, B. (1998). The ten commandments of good structural equation modeling behavior: a user-
friendly, introductory primer on SEM. Washington, DC.
Tribou, G. (2011) Sponsorship: associating image attributes with specific sports and particular teams.
International Journal of Sports Marketing & Sponsorship 12(2), 138-152

67
Twycross, A. & Shields, L. (2004). Validity and reliability - What's it all about? Part 2 Reliability in
quantitative studies. Paediatric Nursing, 16 (9), 28-36
US Commercial Service (2015). Cosmetics & Toiletries Market Overviews 2015. Retrieved 20th June, 2017
from http://trade.gov/industry/materials/ita.fsc.cosmoprof.2015_final2.pdf\
Vanderark, S. D., & Ely, D. (1993). Cortisol, biochemical, and galvanic skin responses to music stimuli of
different preference values by college students in biology and music. Sage Journals, 77(1), 227-234.
Van der Zwaag, M., Dijksterhuis, C., De Waard, D., Mulder, B., Westerink, J., & Brookhuis, K. (2012). The
influence of music on mood and performance while driving. Ergonomics, 55(1), 12.
Vohs, K. D., & Faber, R. J. (2007). Spent resources: Self-regulatory resource availability affects impulse
buying. Journal of Consumer Research, 33(4), 537-547
Wagner, J. (2002). A model of aesthetic value in the servicescape, in Swarz, T. and Iacobucci, D. (Eds).
Handbook of Services Marketing & Management. Thousand Oaks, CA: SAGE Publications Ltd.
Wakefield, K. L., & Blodgett, J. G. (1994). The importance of servicescapes in leisure service settings.
Journal of Services Marketing, 8(3), 66-76.
Warner, R. M. (2013). Applied Statistics: From Bivariate Through Multivariate Techniques. USA: Sage
Publications, Inc.
Whitlar, D.B., Geurts, M.D., & Swenson, M.J. (1993). New product forecasting with a purchase intention
survey. The Journal of Business Forecasting Methods, 12, 3.
Yalch, R. F., & Spangenberg, E. (1990). Effects of store music on shopping behavior. Journal of Consumer
Marketing, 7, 55–63.
Yang, Q.Y., & Chen, Y. M. (2015). Medical Statistics: AMOS analysis method and application. Taiwan:
Wunan.
Yang, Z., & He, L. (2011). Goal, customer experience and purchase intention in a retail context in China:
An empirical study. African Journal of Business Management, 5(16), 6738-6746.
Yorkston, E. (2010). Auxiliary auditory ambitions: Assessing ancillary and ambient sounds. Sensory
marketing: Research on the sensuality of products, 157-167.
Yung, Y. F. (2008). Structural Equation Modeling and Path Analysis Using PROC TCALIS in SAS. SAS
Global Forum. Paper 384.
Zikmund, W. (2000). G.(2000). Business research methods, 6.

68
Appendix
Sensory Marketing Questionnaire
Hello everyone!
We are conducting a research about the influence of sensory marketing on female consumer behavior.
We would greatly appreciate if you would like to fill out this short questionnaire. There are a total
of 12 choice questions and filling the survey takes approximately 3 minutes. All given information will
be treated as confidential material and the anonymity of all participants will be secured.
Thank you for your participation!
1. Gender? *
Male
Female
2. Age? *
Below 20
20-30
31-40
41-50
51-60
Above 60

69
3. Have you purchased the cosmetic products from? *
(If not, it is not necessary to continue answering the questionnaire.)
Lush
The Body Shop
Rituals
4. How often do you visit the store? *
More than once a week
Once a week
2-3 times per month
Others
5. How long do you usually stay in this store? *
Less than 10 minutes
10-20 minutes
21-30 minutes
More than 30 minutes
6. What do you think the atmosphere in this store? *
1 2 3 4 5 6 7
Unattractive Attractive
Dark Bright
Messy Organized
Low volume music High volume music

70
Slow rhythm music Fast rhythm music
Light fragrance Concentrated fragrance
Stale smell Fresh smell
Limited opportunity to touch and interact
with products Plenty opportunities to touch and interact
with products
7. How do you feel about the following statements regarding to visual experience in the store? *
(1=strongly disagree, 7=strongly agree)
1 2 3 4 5 6 7
I like the overall color of the store.
I like the layout of the store.
I like the lighting effects in the store.
The interior design (color, layout, lighting effects) is an important factor that influences
my staying time in a cosmetic store.
The interior design (color, layout, lighting effects) is an important factor that influences
my shopping experience in a cosmetic store.
8. How do you feel about the following statements regarding to smell experience in the store? *
(1=strongly disagree, 7=strongly agree)
1 2 3 4 5 6 7
I like the fragrance in the store.
The scent is an important factor that influences my staying time in a cosmetic store.
The scent is an important factor that influences my shopping experience in a cosmetic
store.
9. How do you feel about the following statements regarding to hearing experience in the store? *
(1=strongly disagree, 7=strongly agree)
1 2 3 4 5 6 7

71
I like the music playing in the store.
Music is an important factor that influences my staying time in a cosmetic store.
Music is an important factor that influences my shopping experience in a cosmetic store.
10. How do you feel about the following statements regarding to tactile experience in the store? *
(1=strongly disagree, 7=strongly agree)
1 2 3 4 5 6 7
I feel happy to test the cosmetics.
The opportunity to touch / test the product is an important factor that influences my
staying time in a cosmetic store.
The opportunity to touch / test the product is an important factor that influences my
shopping experience in a cosmetic store.
11. To what extent of intensity you feel when staying in the store? Please suggest on the following scale. *
1 2 3 4 5 6 7
Sleepy Arousing
Gloomy Exciting
Unpleasant Pleasant
Distressing Relaxing
12. To what extent would you agree with the following statements? *
(1=strongly disagree, 7=strongly agree)
1 2 3 4 5 6 7
I will often shop in this store in the future.
I will shop for my friends or family in this store.
I am willing to recommend the store to others.