Retail Advertising and Promotions for Cigarettes in … · Retail Advertising and Promotions for...
32
RETAIL ADVERTISING AND PROMOTIONS FOR CIGARETTES IN NEW YORK NEW YORK STATE DEPARTMENT OF HEALTH SEPTEMBER 2007
Transcript of Retail Advertising and Promotions for Cigarettes in … · Retail Advertising and Promotions for...
R E T A I L A D V E R T I S I N G A N D
P R O M O T I O N S F O R C I G A R E T T E S
I N N E W Y O R K
N E W Y O R K S T A T E
D E P A R T M E N T O F H E A L T H
S E P T E M B E R 2 0 0 7

Retail Advertising and Promotions for Cigarettes in New York
Prepared for
New York State Department of Health
Prepared by
Maria Girlando Brett Loomis
Kimberly Watson Matthew Farrelly
RTI International 3040 Cornwallis Road
Research Triangle Park, NC 27709
RTI International is a trade name of Research Triangle Institute.
Contents Section Page
Executive Summary .........................................................................................................................................v
1. Introduction......................................................................................................................................................1
2. Data and Methods............................................................................................................................................4
3. Results................................................................................................................................................................6
3.1 Prevalence of Retail Cigarette Advertising ........................................................................................6
3.2 Prevalence and Number of Interior Cigarette Advertisements ......................................................7
3.3 Prevalence and Number of Exterior Cigarette Advertisements......................................................9
3.4 Point-of-Purchase Cigarette Promotions ........................................................................................11
4. Discussion .......................................................................................................................................................15
References ..................................................................................................................................................................17
Appendixes
A Results by NYTCP Program Area.................................................................................................. A-1
B Multivariate Regression Results ......................................................................................................B-1
iv
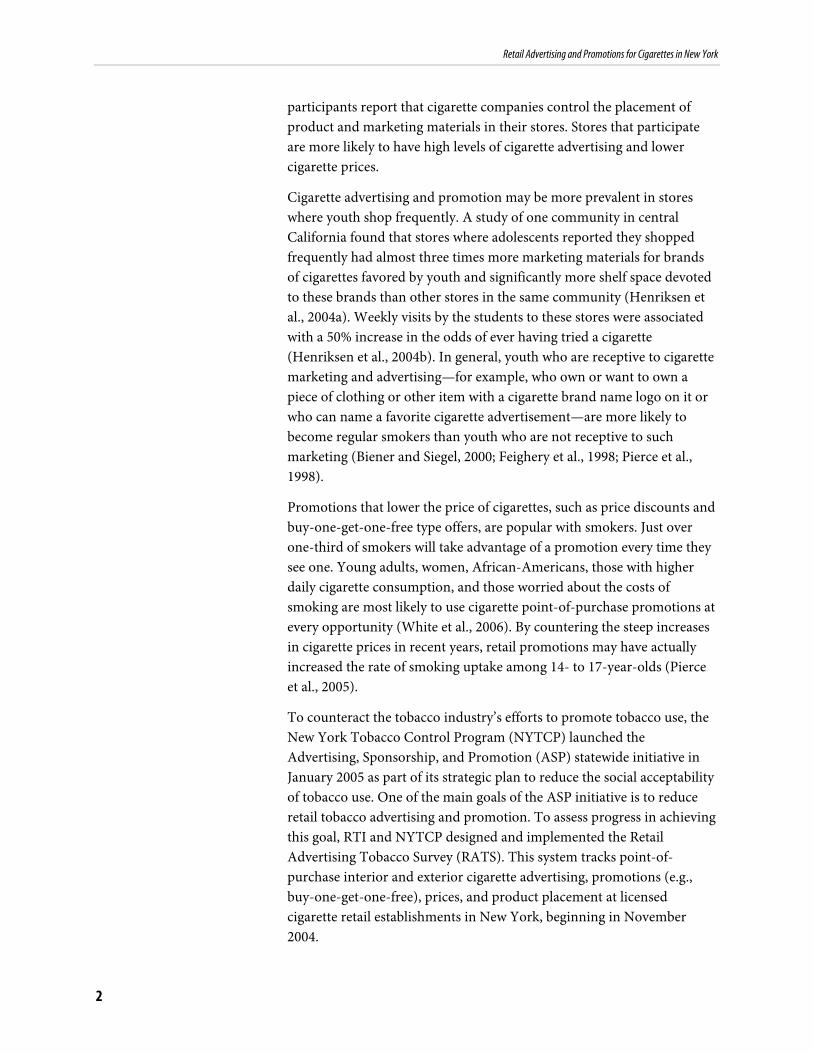
I Executive Summary
n January 2005, the New York Tobacco Control Program (NYTCP) launched its Advertising, Sponsorship, and Promotion initiative. One major goal of this initiative is to reduce retail tobacco
advertising and promotions in New York. To accomplish this goal, community partners are monitoring and assessing retail advertising and promotional strategies; conducting community education; placing paid media; and implementing advocacy strategies to influence individual retailers to reduce, rearrange, or eliminate retail tobacco advertising and promotions in their establishments. To date, most of the community partners’ efforts have been focused on assessing the retail environment, and interventions with individual retailers did not begin in earnest until summer 2006. This report therefore represents a baseline assessment of the extent and intensity of retail advertising and promotion for cigarettes in New York, using data from a random sample of licensed cigarette retailers from November 2004 to June 2006.
This report presents the following key findings:
� Retail advertising for cigarettes in New York is widespread, with only 4.2% of licensed cigarette retailers, on average, being completely free of interior and exterior cigarette advertising.
� Over the 12 months from March 2005 to March 2006, the percentage of retailers who were free of cigarette advertising decreased from 7.1% to 4.8%. In June, 2006, only 1.5% of licensed cigarette retailers were free of cigarette advertising.
� Outlets with the fewest retailers that are completely free from cigarette advertising are convenience stores (1.1%) and convenience/gas combinations (1.4%). Large grocery stores (8.7%) and mass merchandisers (8.4%) have the most retailers with no cigarette advertising.
� Almost every licensed cigarette retailer (95%) displays interior cigarette advertising, with an average of 18 ads per store. Tobacco only stores (22.7) and convenience/ gas combinations (21.1) have the highest number of interior ads per store, whereas small groceries (14.8) and gas only stores (11.4) have the lowest number of interior ads per store.
� Just over half (53%) of licensed cigarette retailers display exterior cigarette advertising. The outlets with the fewest stores that display exterior cigarette advertising are mass merchandisers (2.5%) and pharmacies (7.3%). The outlets with the most stores displaying exterior cigarette advertising are gas only (81%) and convenience/gas combinations (71.3%).
v

Retail Advertising and Promotions for Cigarettes in New York
� Among stores that display any exterior cigarette advertising, the average number of ads displayed is 5.5. Gas only stores have an average of 12.7 exterior ads per store, far more than the other retail channels.
� Overall, 19.8% of licensed tobacco retailers offer point-ofpurchase cigarette promotions. Pharmacies (28.9%) and convenience/gas stores (25.5%) have the highest rates of promotions, whereas gas only (6.0%) and mass merchandisers (12.3%) have the lowest rates.
vi
Retail Advertising and Promotions for Cigarettes in New York
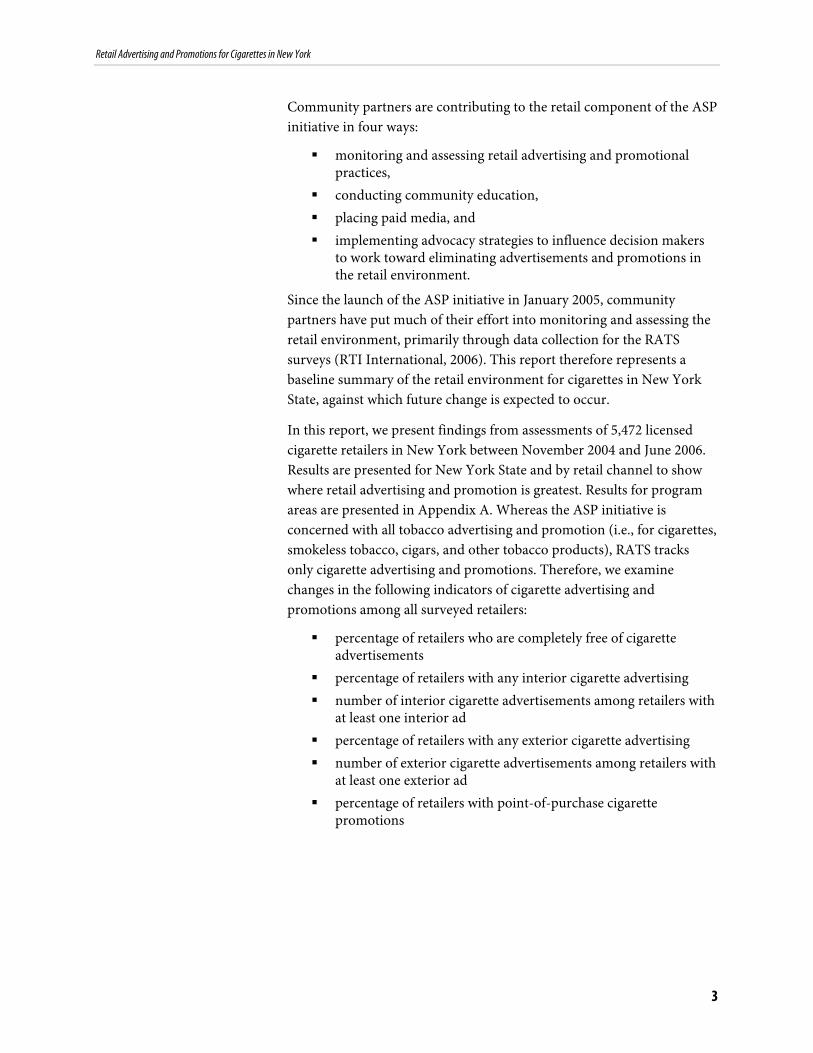
1. Introduction
In 2003, total advertising and promotional expenditures by the five major cigarette manufacturers was $15.15 billion, the largest amount ever (Federal Trade Commission, 2005). Of this amount, 89.5% was
spent on programs to advertise at the point of sale, reduce the retail price of cigarettes to consumers, and facilitate the placement and sale of cigarettes in retail stores. An additional 4.5% was spent on promotional allowances to cigarette wholesalers. The remaining 6% was spent on traditional forms of advertising, such as newspapers, magazines, transit, and event sponsorships. Assuming spending was proportional to population size across states, the industry spent $1 billion in New York State on cigarette advertising and promotions in 2003, or $52 per New Yorker.
Retail cigarette advertising (e.g., signs, displays, functional items) and promotion (e.g., price discounts, buy-one-get-one-free type offers) is widespread in the United States. A national study by the ImpacTeen project (Terry-McElrath et al., 2002) found some form of point-ofpurchase promotion in 92% of stores surveyed and tobacco advertising (interior or exterior) in 84% of stores. A similar study in California found that 94% of stores in that state had some form of cigarette advertising (Feighery et al., 2001). Since the 1998 Master Settlement Agreement, promoted sales of cigarettes have approximately doubled (Loomis, Farrelly, and Mann, 2006). Furthermore, there is evidence that states with comprehensive tobacco control programs may experience higher levels of cigarette advertising and promotion than states without such programs (Loomis, Farrelly, and Mann, 2006; Slater, Chaloupka, and Wakefield, 2001).
Retailer incentive programs are the primary mechanism through which cigarette companies influence the retail environment. The incentives offered to retailers include volume discounts, payments for prime shelf space and in-store displays, free signage, display racks, and functional items. For stores that sell large quantities of cigarettes, the incentive payments can be significant, reaching several thousand dollars per year (Feighery et al., 2004). In return, the cigarette companies require a large degree of control over product placement, advertising, and prices. Little is known about the details of retailer incentive programs because the contracts are negotiated privately and are customized for each retail outlet or chain. Only one national study has examined this issue in detail (Feighery et al., 2004). The authors found that 65% of retailers participate in some form of cigarette company incentive program, and 80% of
1
Retail Advertising and Promotions for Cigarettes in New York
participants report that cigarette companies control the placement of product and marketing materials in their stores. Stores that participate are more likely to have high levels of cigarette advertising and lower cigarette prices.
Cigarette advertising and promotion may be more prevalent in stores where youth shop frequently. A study of one community in central California found that stores where adolescents reported they shopped frequently had almost three times more marketing materials for brands of cigarettes favored by youth and significantly more shelf space devoted to these brands than other stores in the same community (Henriksen et al., 2004a). Weekly visits by the students to these stores were associated with a 50% increase in the odds of ever having tried a cigarette (Henriksen et al., 2004b). In general, youth who are receptive to cigarette marketing and advertising—for example, who own or want to own a piece of clothing or other item with a cigarette brand name logo on it or who can name a favorite cigarette advertisement—are more likely to become regular smokers than youth who are not receptive to such marketing (Biener and Siegel, 2000; Feighery et al., 1998; Pierce et al., 1998).
Promotions that lower the price of cigarettes, such as price discounts and buy-one-get-one-free type offers, are popular with smokers. Just over one-third of smokers will take advantage of a promotion every time they see one. Young adults, women, African-Americans, those with higher daily cigarette consumption, and those worried about the costs of smoking are most likely to use cigarette point-of-purchase promotions at every opportunity (White et al., 2006). By countering the steep increases in cigarette prices in recent years, retail promotions may have actually increased the rate of smoking uptake among 14- to 17-year-olds (Pierce et al., 2005).
To counteract the tobacco industry’s efforts to promote tobacco use, the New York Tobacco Control Program (NYTCP) launched the Advertising, Sponsorship, and Promotion (ASP) statewide initiative in January 2005 as part of its strategic plan to reduce the social acceptability of tobacco use. One of the main goals of the ASP initiative is to reduce retail tobacco advertising and promotion. To assess progress in achieving this goal, RTI and NYTCP designed and implemented the Retail Advertising Tobacco Survey (RATS). This system tracks point-ofpurchase interior and exterior cigarette advertising, promotions (e.g., buy-one-get-one-free), prices, and product placement at licensed cigarette retail establishments in New York, beginning in November 2004.
2
Retail Advertising and Promotions for Cigarettes in New York
Community partners are contributing to the retail component of the ASP initiative in four ways:
� monitoring and assessing retail advertising and promotional practices,
� conducting community education, � placing paid media, and � implementing advocacy strategies to influence decision makers
to work toward eliminating advertisements and promotions in the retail environment.
Since the launch of the ASP initiative in January 2005, community partners have put much of their effort into monitoring and assessing the retail environment, primarily through data collection for the RATS surveys (RTI International, 2006). This report therefore represents a baseline summary of the retail environment for cigarettes in New York State, against which future change is expected to occur.
In this report, we present findings from assessments of 5,472 licensed cigarette retailers in New York between November 2004 and June 2006. Results are presented for New York State and by retail channel to show where retail advertising and promotion is greatest. Results for program areas are presented in Appendix A. Whereas the ASP initiative is concerned with all tobacco advertising and promotion (i.e., for cigarettes, smokeless tobacco, cigars, and other tobacco products), RATS tracks only cigarette advertising and promotions. Therefore, we examine changes in the following indicators of cigarette advertising and promotions among all surveyed retailers:
� percentage of retailers who are completely free of cigarette advertisements
� percentage of retailers with any interior cigarette advertising � number of interior cigarette advertisements among retailers with
at least one interior ad � percentage of retailers with any exterior cigarette advertising � number of exterior cigarette advertisements among retailers with
at least one exterior ad � percentage of retailers with point-of-purchase cigarette
promotions
3
Retail Advertising and Promotions for Cigarettes in New York
2. Data and Methods
The data in this report are from the Retail Advertising Tobacco Survey (RATS), which monitors advertising and promotions in randomly sampled, licensed cigarette vendors throughout New
York. RATS captures information on the following items:
� the amount of interior and exterior cigarette advertising in retail outlets, including the percentage of advertisements within 3 feet of the floor or within 12 inches of candy and toys;
� cigarette prices and promotions for popular brands, including the percentage and type of promotions and regular or sale pricing;
� compliance with state youth access laws, including accessibility to products and compliance with the signage provisions of the 2002 Adolescent Tobacco Use Prevention Act (ATUPA);
� compliance with Master Settlement Agreement (MSA) restrictions on advertising;
� presence of other tobacco product advertising; and � presence of tobacco products near candy or toys or located at
child’s eye level, within 3 feet from the floor.
The data presented in this report were collected in November 2004, monthly from March 2005 through March 2006, and in June 2006. Details on the sampling methods, retail measurements, and validation of RATS can be found in the 2004 and 2005 Independent Evaluation Reports of NYTCP, which are available on the New York State Department of Health Web site: http://www.health.state.ny.us/nysdoh/smoking/main.htm.
We conducted regression analyses for each of the indicators presented in this report to test for changes over time and differences between retail channel and NYTCP program area. Each regression controls for a monthly time trend, mode of data collection (community partner or paid data collector), retail channel, and NYTCP program area where the store was located. Appendix B presents details of the regression models and complete results.
In addition to data from RATS, we also present trends in promoted cigarette sales from ACNielsen ScanTrack™ data (ACNielsen, 2005). The ScanTrack™ data are scanner data collected from supermarkets with annual sales of at least $2 million (about $5,550 a day) and are reported quarterly from January 1994 through June 2005 in 50 market areas across the United States. The market areas are defined by ACNielsen and
4

Retail Advertising and Promotions for Cigarettes in New York
consist of a collection of counties centered on a metropolitan area. The markets cover every major metropolitan area in the United States and capture nearly 76% of the total U.S. population. The ScanTrack™ data report total cigarette sales, in packs, as well as sales from each of three types of promotions: multipack giveaways (e.g., buy one pack, get one pack free), cents-off (e.g., price reduced by 50¢ per pack), and gift with purchase (e.g., buy two packs, get a free lighter). Sales from each of these three types of promotions were summed and then divided by total sales to arrive at the percentage of cigarette sales that are sold under a promotion.
5
Retail Advertising and Promotions for Cigarettes in New York
3. Results
Cigarette advertising and promotion in retail stores in New York is widespread and intensive. However, the statewide trends often conceal large and significant differences in cigarette advertising
and promotion across retail channels. Differences across NYTCP program areas do exist, but they are often smaller and not statistically significant compared with the differences across retail channels. Therefore, we present results by retail channel in this section and by NYTCP program area in Appendix A. Results from the regression models are reported in Appendix B.
3.1 Prevalence of Retail Cigarette Advertising
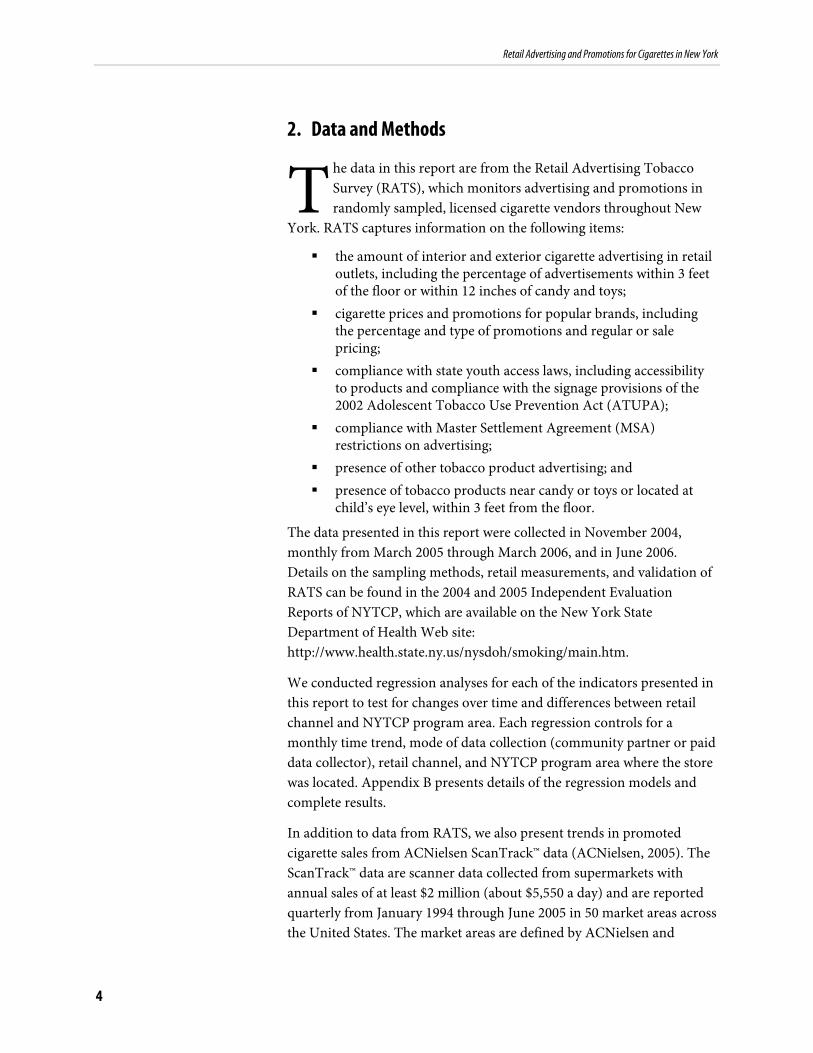
Retail advertising for cigarettes in New York is widespread, with only 4.2% of licensed cigarette retailers being completely free of interior and exterior cigarette advertising from November 2004 to June 2006. Exhibit 3-1 shows the trend in the percentage of New York retailers with no cigarette advertisements.
Exhibit 3-1. Percentage of Licensed Cigarette Retailers Without Any Cigarette Advertising, New York, November 2004– June 2006
100%
80%
60%
40%
20% 7.1% 6.6% 7.8% 6.3% 4.8% 3.9% 3.0% 4.1% 3.9% 5.2% 4.8% 1.3% 1.8% 1.9% 1.5%
0% Nov Dec Jan Feb Mar Apr May Jun Jul Aug Sep Oct Nov Dec Jan Feb Mar Apr May Jun
2004 2005 2006
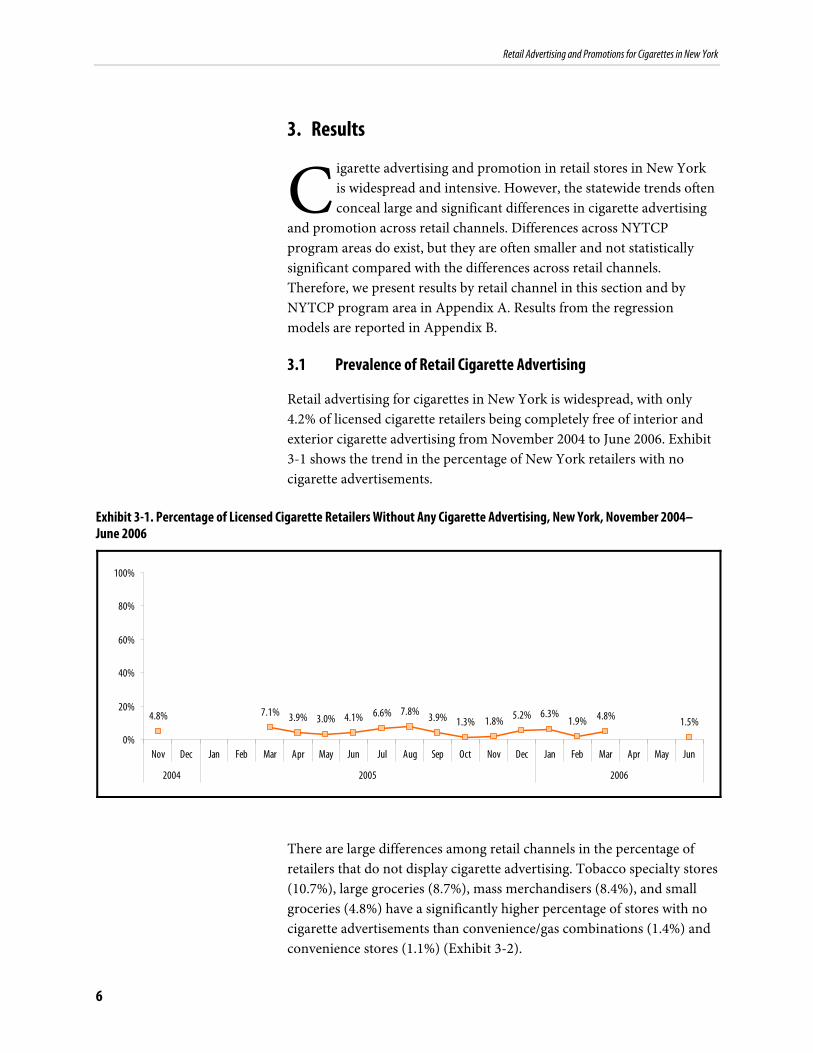
There are large differences among retail channels in the percentage of retailers that do not display cigarette advertising. Tobacco specialty stores (10.7%), large groceries (8.7%), mass merchandisers (8.4%), and small groceries (4.8%) have a significantly higher percentage of stores with no cigarette advertisements than convenience/gas combinations (1.4%) and convenience stores (1.1%) (Exhibit 3-2).
6
Retail Advertising and Promotions for Cigarettes in New York
Exhibit 3-2. Percentage of Licensed Cigarette Retailers Without Any Cigarette Advertising by Retail Channel, New York, November 2004–June 2006
6.3%4.2% 8.4%4.8%
8.7% 1.4%
10.7% 2.6% 1.1%
0%
20%
40%
60%
80%
100%
State Convenience Convenience/Gas Pharmacy Large Grocery Small Grocery Mass Merchandiser
Tobacco Only Gas Only
3.2 Prevalence and Number of Interior Cigarette Advertisements
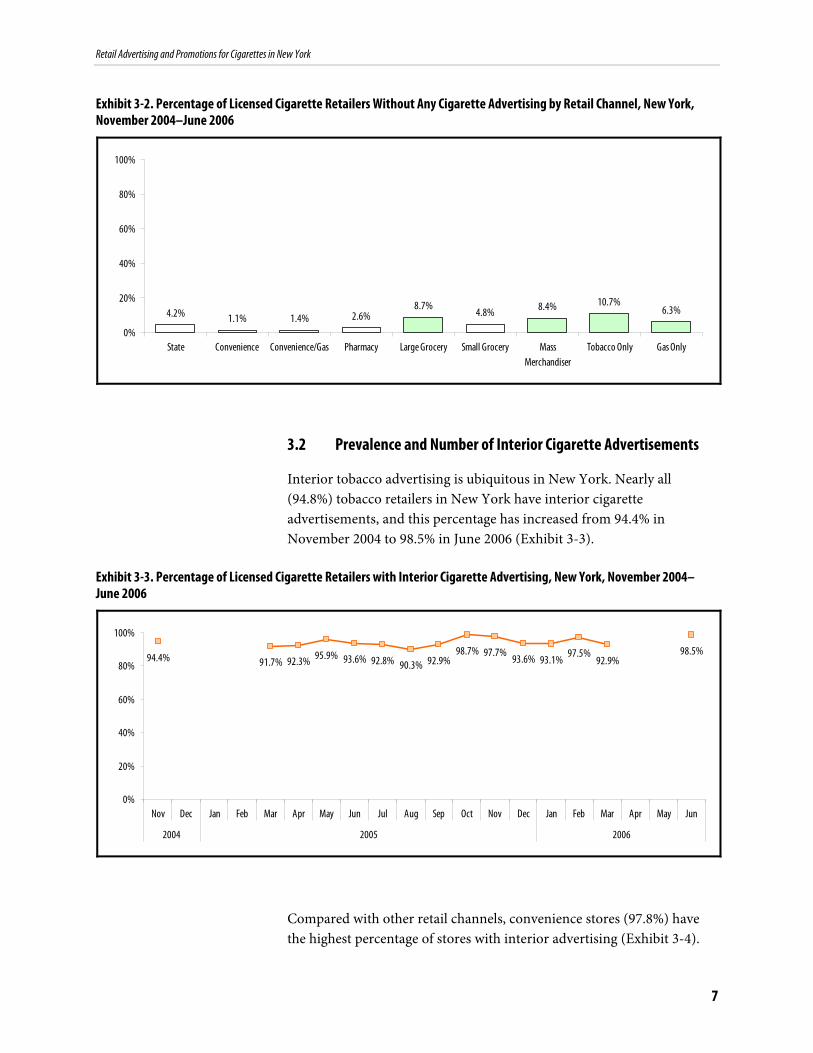
Interior tobacco advertising is ubiquitous in New York. Nearly all (94.8%) tobacco retailers in New York have interior cigarette advertisements, and this percentage has increased from 94.4% in November 2004 to 98.5% in June 2006 (Exhibit 3-3).
Exhibit 3-3. Percentage of Licensed Cigarette Retailers with Interior Cigarette Advertising, New York, November 2004– June 2006
100%
80%
60%
40%
20%
0%
98.5% 98.7% 97.7% 97.5% 95.9% 94.4% 91.7% 92.3% 93.6% 92.8% 90.3% 92.9% 93.6% 93.1% 92.9%
Nov Dec Jan Feb Mar Apr May Jun Jul Aug Sep Oct Nov Dec Jan Feb Mar Apr May Jun
2004 2005 2006
Compared with other retail channels, convenience stores (97.8%) have the highest percentage of stores with interior advertising (Exhibit 3-4).
7
Retail Advertising and Promotions for Cigarettes in New York
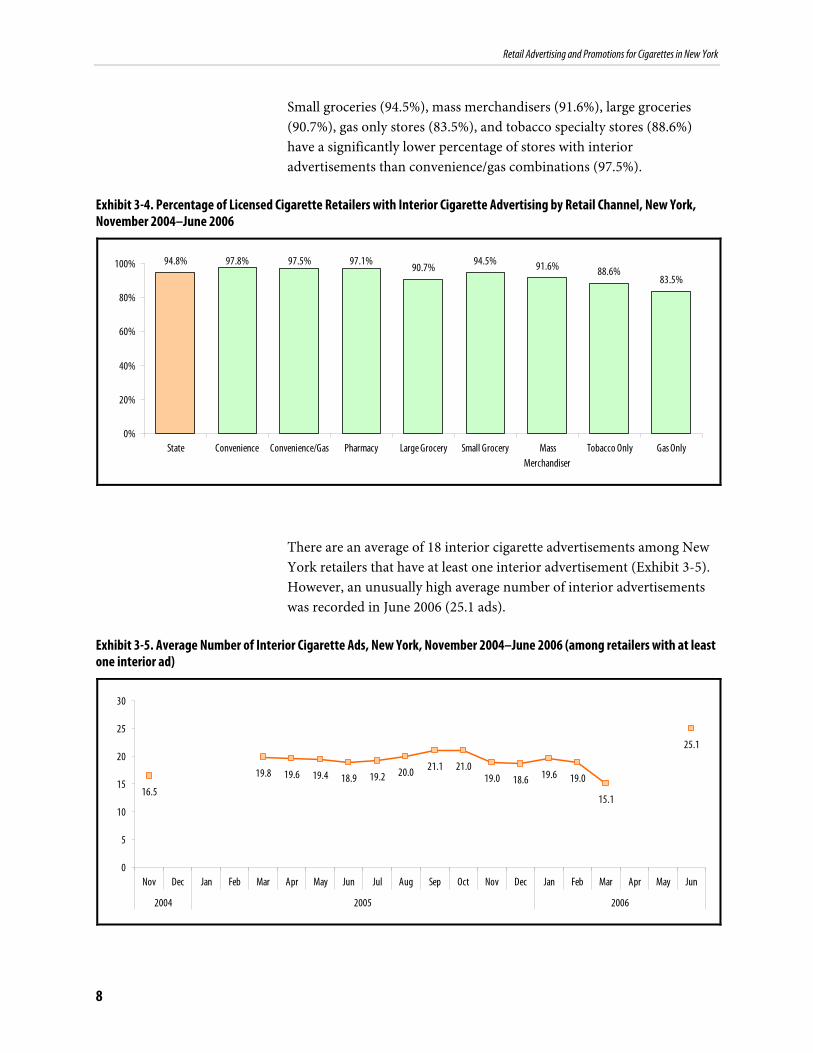
Small groceries (94.5%), mass merchandisers (91.6%), large groceries (90.7%), gas only stores (83.5%), and tobacco specialty stores (88.6%) have a significantly lower percentage of stores with interior advertisements than convenience/gas combinations (97.5%).
Exhibit 3-4. Percentage of Licensed Cigarette Retailers with Interior Cigarette Advertising by Retail Channel, New York, November 2004–June 2006
83.5%
94.8% 91.6% 94.5% 90.7%
97.5% 88.6%
97.1% 97.8%
0%
20%
40%
60%
80%
100%
State Convenience Convenience/Gas Pharmacy Large Grocery Small Grocery Mass Merchandiser
Tobacco Only Gas Only
There are an average of 18 interior cigarette advertisements among New York retailers that have at least one interior advertisement (Exhibit 3-5). However, an unusually high average number of interior advertisements was recorded in June 2006 (25.1 ads).
Exhibit 3-5. Average Number of Interior Cigarette Ads, New York, November 2004–June 2006 (among retailers with at least one interior ad)
30
25
20
15
10
5
0
21.1 21.0 19.8 20.0 19.6 19.4 19.6 18.9 19.2 19.0 18.6 19.0
Nov Dec Jan Feb Mar Apr May Jun Jul Aug Sep Oct Nov Dec Jan Feb Mar Apr May Jun
2004 2005 2006
8
15.1
25.1
16.5
Retail Advertising and Promotions for Cigarettes in New York
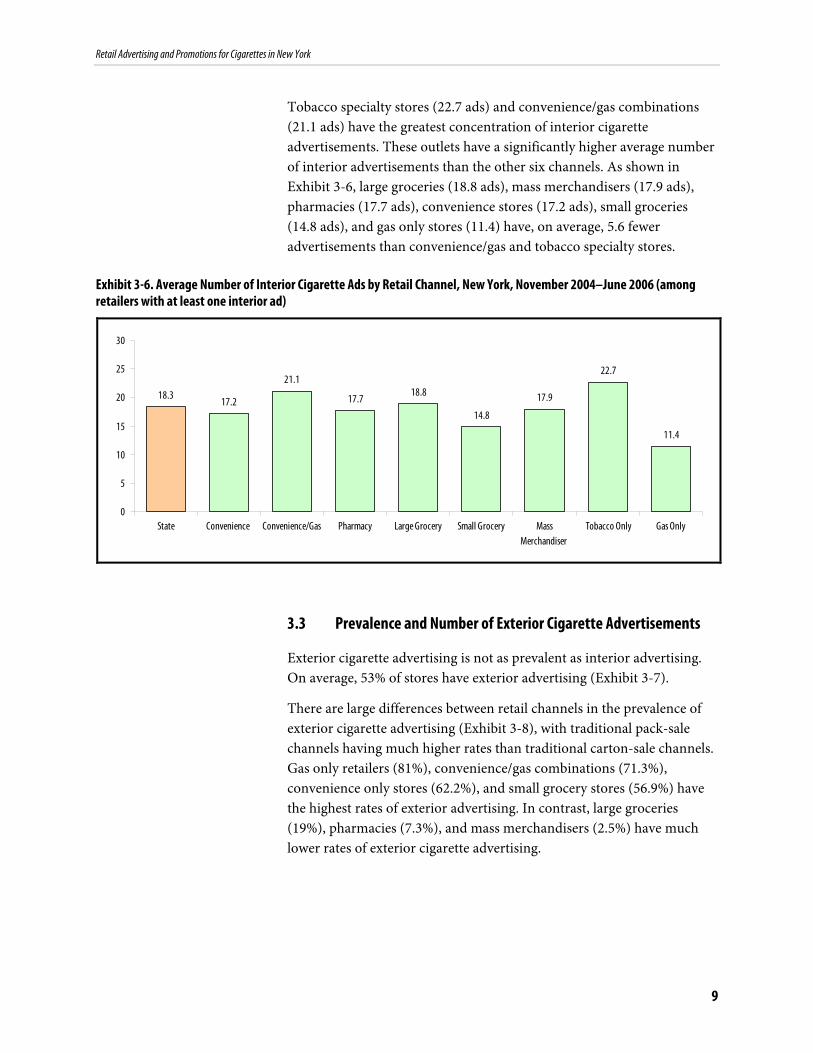
Tobacco specialty stores (22.7 ads) and convenience/gas combinations (21.1 ads) have the greatest concentration of interior cigarette advertisements. These outlets have a significantly higher average number of interior advertisements than the other six channels. As shown in Exhibit 3-6, large groceries (18.8 ads), mass merchandisers (17.9 ads), pharmacies (17.7 ads), convenience stores (17.2 ads), small groceries (14.8 ads), and gas only stores (11.4) have, on average, 5.6 fewer advertisements than convenience/gas and tobacco specialty stores.
Exhibit 3-6. Average Number of Interior Cigarette Ads by Retail Channel, New York, November 2004–June 2006 (among retailers with at least one interior ad)
11.4
18.3 17.9
14.8
18.8 21.1
22.7
17.7 17.2
0
5
10
15
20
25
30
State Convenience Convenience/Gas Pharmacy Large Grocery Small Grocery Mass Merchandiser
Tobacco Only Gas Only
3.3 Prevalence and Number of Exterior Cigarette Advertisements
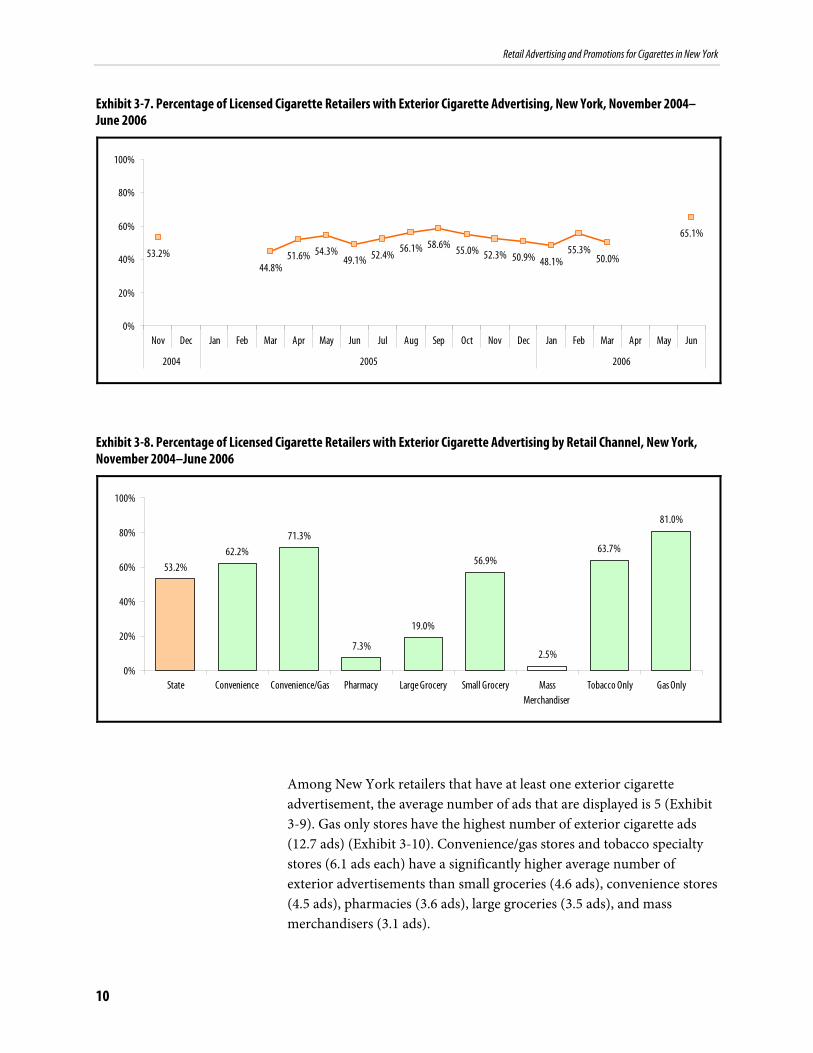
Exterior cigarette advertising is not as prevalent as interior advertising. On average, 53% of stores have exterior advertising (Exhibit 3-7).
There are large differences between retail channels in the prevalence of exterior cigarette advertising (Exhibit 3-8), with traditional pack-sale channels having much higher rates than traditional carton-sale channels. Gas only retailers (81%), convenience/gas combinations (71.3%), convenience only stores (62.2%), and small grocery stores (56.9%) have the highest rates of exterior advertising. In contrast, large groceries (19%), pharmacies (7.3%), and mass merchandisers (2.5%) have much lower rates of exterior cigarette advertising.
9
Retail Advertising and Promotions for Cigarettes in New York
Exhibit 3-7. Percentage of Licensed Cigarette Retailers with Exterior Cigarette Advertising, New York, November 2004– June 2006
100%
80%
60%
40%
20%
0%
65.1% 56.1% 58.6% 55.3% 53.2% 51.6% 54.3% 52.4% 55.0% 52.3% 50.9% 48.1%49.1% 50.0%
44.8%
Nov Dec Jan Feb Mar Apr May Jun Jul Aug Sep Oct Nov Dec Jan Feb Mar Apr May Jun
2004 2005 2006
Exhibit 3-8. Percentage of Licensed Cigarette Retailers with Exterior Cigarette Advertising by Retail Channel, New York, November 2004–June 2006
81.0%
53.2%
2.5%
56.9%
19.0%
71.3% 63.7%
7.3%
62.2%
0%
20%
40%
60%
80%
100%
State Convenience Convenience/Gas Pharmacy Large Grocery Small Grocery Mass Merchandiser
Tobacco Only Gas Only
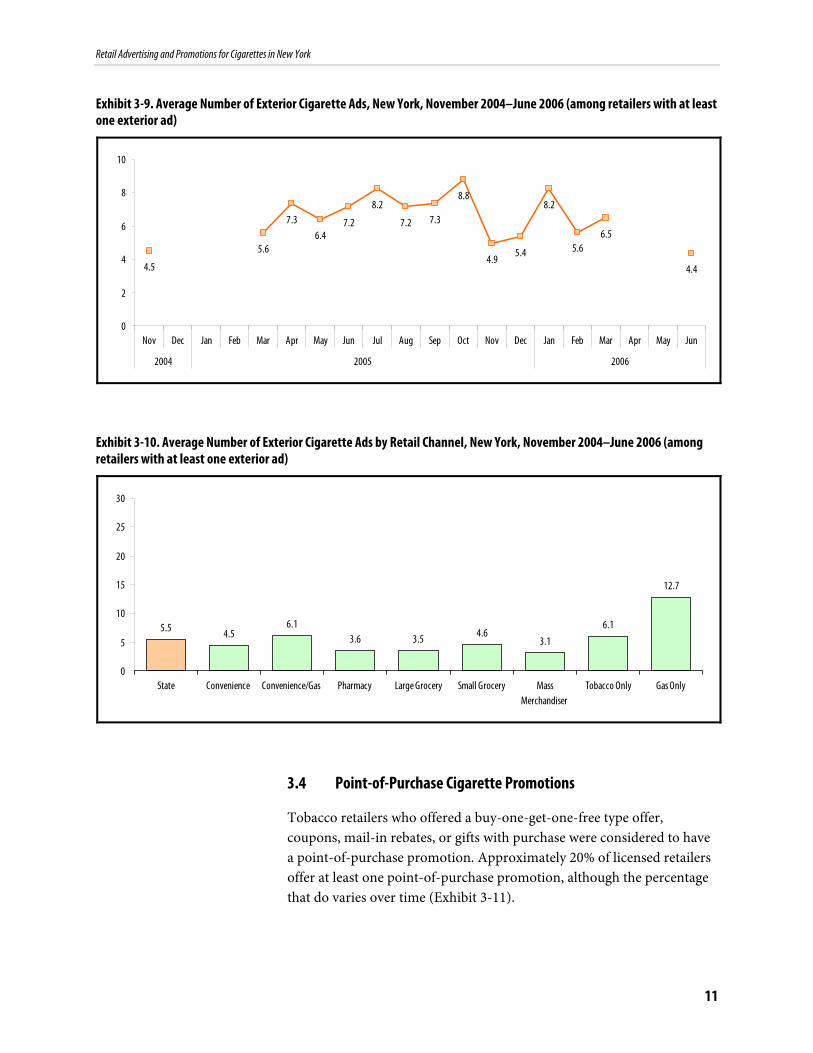
Among New York retailers that have at least one exterior cigarette advertisement, the average number of ads that are displayed is 5 (Exhibit 3-9). Gas only stores have the highest number of exterior cigarette ads (12.7 ads) (Exhibit 3-10). Convenience/gas stores and tobacco specialty stores (6.1 ads each) have a significantly higher average number of exterior advertisements than small groceries (4.6 ads), convenience stores (4.5 ads), pharmacies (3.6 ads), large groceries (3.5 ads), and mass merchandisers (3.1 ads).
10
Retail Advertising and Promotions for Cigarettes in New York
Exhibit 3-9. Average Number of Exterior Cigarette Ads, New York, November 2004–June 2006 (among retailers with at least one exterior ad)
10
8
6
4
2
0
8.8 8.2 8.2
7.3 7.3 7.2 7.2 6.56.4
5.6 5.6 5.4 4.9
4.5
Nov Dec Jan Feb Mar Apr May Jun Jul Aug Sep Oct Nov Dec Jan Feb Mar Apr May Jun
2004 2005 2006
Exhibit 3-10. Average Number of Exterior Cigarette Ads by Retail Channel, New York, November 2004–June 2006 (among retailers with at least one exterior ad)
12.7
5.5 3.1
4.6 3.5 6.1 6.1
3.64.5
0
5
10
15
20
25
30
State Convenience Convenience/Gas Pharmacy Large Grocery Small Grocery Mass Merchandiser
Tobacco Only Gas Only
3.4 Point-of-Purchase Cigarette Promotions
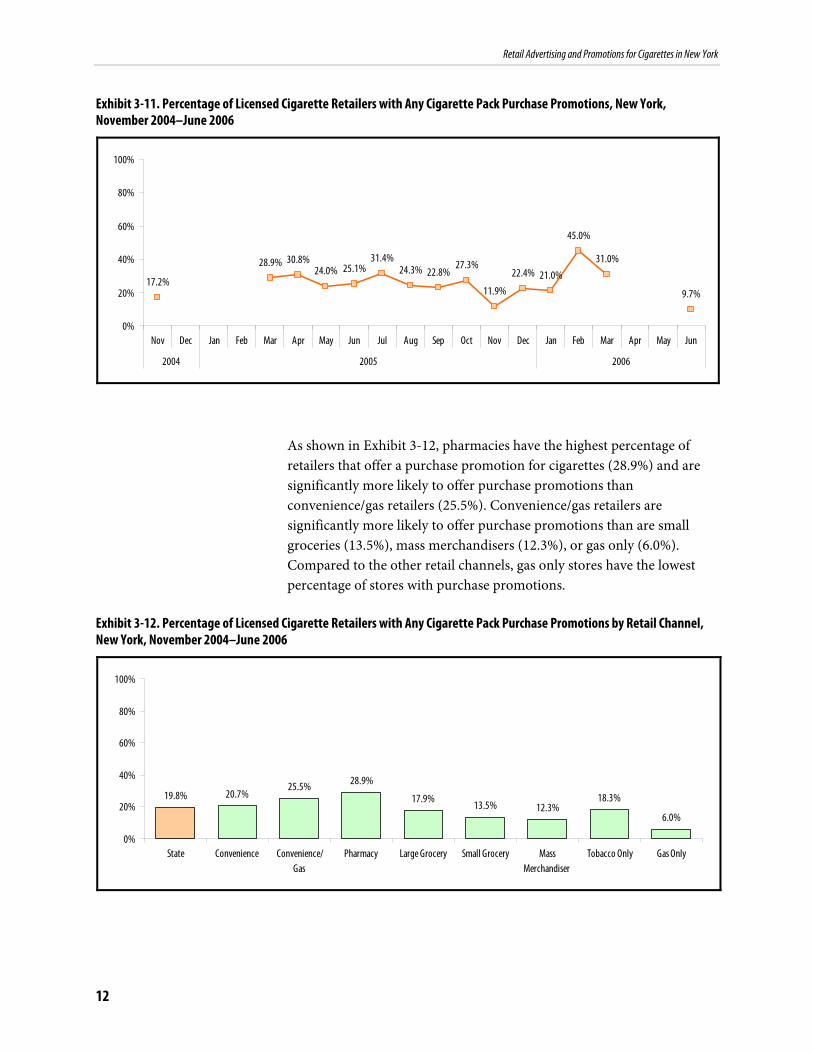
Tobacco retailers who offered a buy-one-get-one-free type offer, coupons, mail-in rebates, or gifts with purchase were considered to have a point-of-purchase promotion. Approximately 20% of licensed retailers offer at least one point-of-purchase promotion, although the percentage that do varies over time (Exhibit 3-11).
11
4.4
Retail Advertising and Promotions for Cigarettes in New York
Exhibit 3-11. Percentage of Licensed Cigarette Retailers with Any Cigarette Pack Purchase Promotions, New York, November 2004–June 2006
100%
80%
60%
40%
20%
0%
45.0%
31.4% 31.0%28.9% 30.8% 27.3% 25.1% 24.0% 24.3% 22.8% 22.4% 21.0%17.2%
11.9% 9.7%
Nov Dec Jan Feb Mar Apr May Jun Jul Aug Sep Oct Nov Dec Jan Feb Mar Apr May Jun
2004 2005 2006
As shown in Exhibit 3-12, pharmacies have the highest percentage of retailers that offer a purchase promotion for cigarettes (28.9%) and are significantly more likely to offer purchase promotions than convenience/gas retailers (25.5%). Convenience/gas retailers are significantly more likely to offer purchase promotions than are small groceries (13.5%), mass merchandisers (12.3%), or gas only (6.0%). Compared to the other retail channels, gas only stores have the lowest percentage of stores with purchase promotions.
Exhibit 3-12. Percentage of Licensed Cigarette Retailers with Any Cigarette Pack Purchase Promotions by Retail Channel, New York, November 2004–June 2006
6.0%
19.8% 12.3%13.5%
17.9% 25.5%
18.3%
28.9% 20.7%
0%
20%
40%
60%
80%
100%
State Convenience Convenience/ Gas
Pharmacy Large Grocery Small Grocery Mass Merchandiser
Tobacco Only Gas Only
12
Retail Advertising and Promotions for Cigarettes in New York
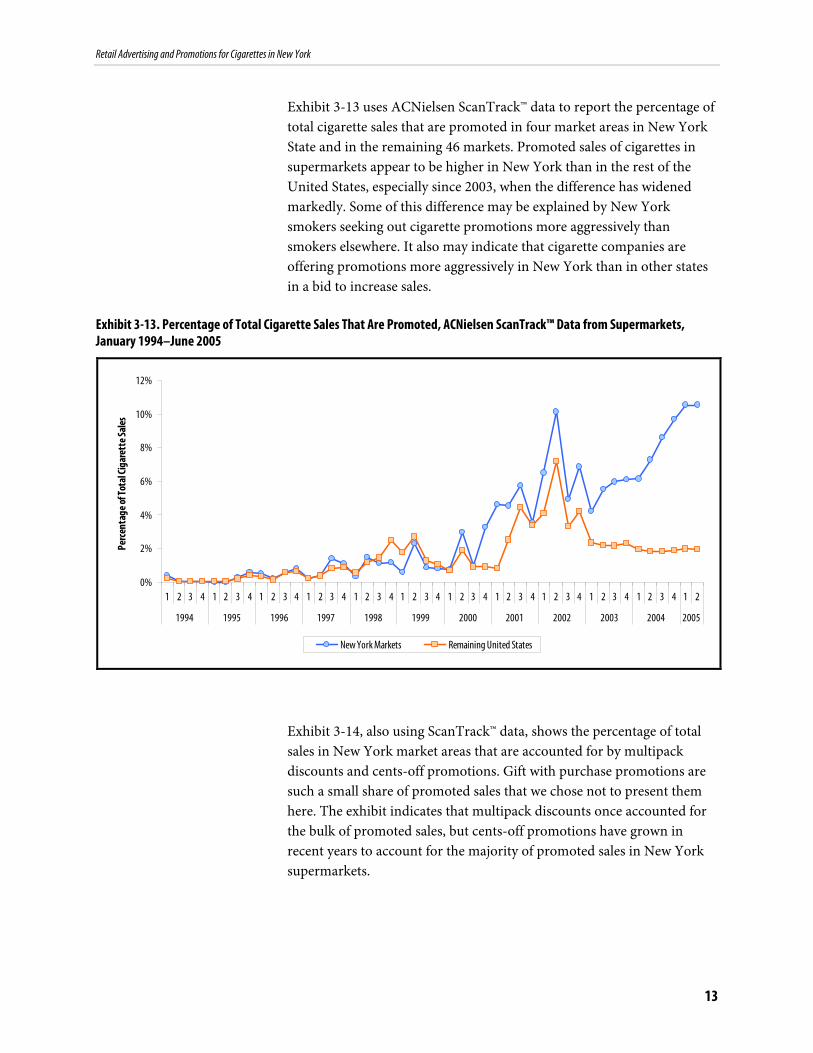
Exhibit 3-13 uses ACNielsen ScanTrack™ data to report the percentage of total cigarette sales that are promoted in four market areas in New York State and in the remaining 46 markets. Promoted sales of cigarettes in supermarkets appear to be higher in New York than in the rest of the United States, especially since 2003, when the difference has widened markedly. Some of this difference may be explained by New York smokers seeking out cigarette promotions more aggressively than smokers elsewhere. It also may indicate that cigarette companies are offering promotions more aggressively in New York than in other states in a bid to increase sales.
Exhibit 3-13. Percentage of Total Cigarette Sales That Are Promoted, ACNielsen ScanTrack™ Data from Supermarkets, January 1994–June 2005
0%
2%
4%
6%
8%
10%
12%
1 2 3 4 1 2 3 4 1 2 3 4 1 2 3 4 1 2 3 4 1 2 3 4 1 2 3 4 1 2 3 4 1 2 3 4 1 2 3 4 1 2 3 4 1 2
1994 1995 1996 1997 1998 1999 2000 2001 2002 2003 2004 2005
Perc
enta
ge of
Tota
l Cig
aret
te Sa
les
New York Markets Remaining United States
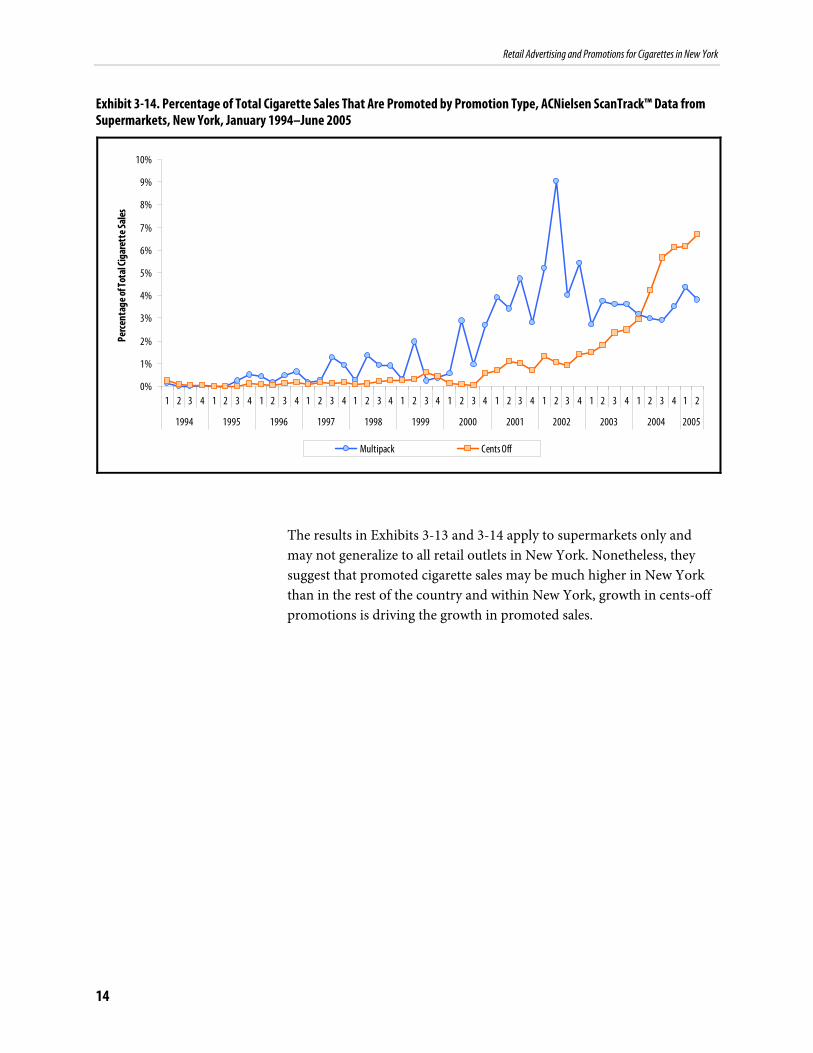
Exhibit 3-14, also using ScanTrack™ data, shows the percentage of total sales in New York market areas that are accounted for by multipack discounts and cents-off promotions. Gift with purchase promotions are such a small share of promoted sales that we chose not to present them here. The exhibit indicates that multipack discounts once accounted for the bulk of promoted sales, but cents-off promotions have grown in recent years to account for the majority of promoted sales in New York supermarkets.
13
Retail Advertising and Promotions for Cigarettes in New York
Exhibit 3-14. Percentage of Total Cigarette Sales That Are Promoted by Promotion Type, ACNielsen ScanTrack™ Data from Supermarkets, New York, January 1994–June 2005
0%
1%
2%
3%
4%
5%
6%
7%
8%
9%
10%
1 2 3 4 1 2 3 4 1 2 3 4 1 2 3 4 1 2 3 4 1 2 3 4 1 2 3 4 1 2 3 4 1 2 3 4 1 2 3 4 1 2 3 4 1 2
1994 1995 1996 1997 1998 1999 2000 2001 2002 2003 2004 2005
Perc
enta
ge of
Tota
l Cig
aret
te Sa
les
Multipack Cents Off
The results in Exhibits 3-13 and 3-14 apply to supermarkets only and may not generalize to all retail outlets in New York. Nonetheless, they suggest that promoted cigarette sales may be much higher in New York than in the rest of the country and within New York, growth in cents-off promotions is driving the growth in promoted sales.
14
Retail Advertising and Promotions for Cigarettes in New York
4. Discussion
Retail tobacco advertising and promotions are widespread throughout New York State. Ninety-five percent of licensed cigarette retailers have interior cigarette advertising, and 53%
have exterior cigarette advertising. Point-of-purchase promotions are also common, being present in 20% of stores surveyed. New York is not alone; these results are consistent with retail tracking studies from other states (Celebucki and Diskin, 2002; Feighery et al., 2001). Scanner data from ACNielsen suggest that promoted sales, as a share of total cigarette sales, may be much higher in New York than in the rest of the United States. The fact that retail cigarette advertising is so widespread is a testament to the marketing power and reach of the tobacco industry and also presents a significant challenge for public health.
There were some significant differences across retail channels. Pack only outlets, such as convenience stores, convenience/gas combinations, and gas only stores, have the fewest retailers that are completely free of any cigarette advertising and the highest levels of exterior cigarette advertising. Exterior cigarette advertising was dominated by gas only outlets, which have the highest rate of participation (81% of stores have at least one exterior cigarette ad) and an average of 12 ads per store (compared with an average of 5.5 ads per store for other outlets).
Because retail cigarette advertising and promotion likely increase cigarette sales, they may undermine the reductions in tobacco use achieved by comprehensive tobacco control programs and policies. NYTCP’s ASP initiative is addressing this problem by working with community partners to collect information on the prevalence and impact of retail advertising and to intervene with individual retailers to reduce, rearrange, or eliminate interior and exterior advertising. Community partners are also working to educate the public and to identify and mobilize allies.
Achieving reductions in retail cigarette advertising and promotions is a worthy goal, but it will be difficult to achieve. The majority of cigarette retailers participate in cigarette company incentive programs that pay the retailers nearly $2,500 per year on average (Feighery et al., 1999). In exchange for these payments, cigarette companies exercise considerable control over the placement of advertisements and product displays. Community partners have only just begun the difficult task of fielding interventions directed at retailers. This report therefore represents an initial assessment of the extent and prevalence of retail cigarette
15

Retail Advertising and Promotions for Cigarettes in New York
advertising and promotion in New York State and a benchmark against which to measure future progress.
16
Retail Advertising and Promotions for Cigarettes in New York
References
ACNielsen. 2005. ScanTrack™, Grocery Channel, 50 Retail Markets, Cigarette Category, 1/94–6/05.
Biener, L., and M. Siegel. 2000. “Tobacco Marketing and Adolescent Smoking: More Support for a Causal Inference.” American Journal of Public Health 90:407-411.
Celebucki, C.C., and K. Diskin. 2002. “A Longitudinal Study of Externally Visible Cigarette Advertising on Retail Storefronts in Massachusetts Before and After the Master Settlement Agreement.” Tobacco Control 11(Suppl II):ii47-53.
Federal Trade Commission. August 2005. Federal Trade Commission Cigarette Report for 2003. <http://www.ftc.gov/reports/cigarette05/050809cigrpt.pdf> (Accessed September 11, 2005).
Feighery, E.C., D.L.G. Borzekowski, C. Schooler, and J. Flora. 1998. “Seeing, Wanting, Owning: The Relationship between Receptivity to Tobacco Marketing and Smoking Susceptibility in Young People.” Tobacco Control 7:123-128.
Feighery, E.C., K.M. Ribisl, D.D. Achabal, and T. Tyebjee. 1999. “Retail Trade Incentives: How Tobacco Industry Practices Compare with Those of Other Industries.” American Journal of Public Health 89(10):1564-1566.
Feighery, E.C., K.M. Ribisl, N.C. Schleicher, and P.I. Clark. 2004. “Retailer Participation in Cigarette Company Incentive Programs is Related to Increased Levels of Cigarette Advertising and Cheaper Cigarette Prices in Stores.” Preventive Medicine 38:876-884.
Feighery, E.C., K.M. Ribisl, N.C. Schleicher, R.E. Lee, and S. Halvorson. 2001. “Cigarette Advertising and Promotional Strategies in Retail Outlets: Results of a Statewide Survey in California.” Tobacco Control 10:184188.
Henriksen, L., E.C. Feighery, N.C. Schleicher, H.H. Haladjian, and S.P. Fortmann. 2004a. “Reaching Youth at the Point of Sale: Cigarette Marketing is More Prevalent in Stores Where Adolescents Shop Frequently.” Tobacco Control 13:315-318.
Henriksen, L., E.C. Feighery, Y. Wang, and S.P. Fortmann. 2004b. “Association of Retail Tobacco Marketing with Adolescent Smoking.” American Journal of Public Health 94:2081-2083.
Loomis, B.R., M.C. Farrelly, and N.H. Mann. 2006. “The Association of Retail Promotions for Cigarettes with the Master Settlement Agreement, Tobacco Control Programs, and Cigarette Excise Taxes.” Tobacco Control 15:458-463.
17

Retail Advertising and Promotions for Cigarettes in New York
Pierce, J.P., W.S. Choi, E.A. Gilpin, A.J. Farkas, and C.C. Berry. 1998. “Tobacco Industry Promotion of Cigarettes and Adolescent Smoking.” Journal of the American Medical Association 279:511-515.
Pierce, J.P., T.P. Gilmer, L. Lee, E.A. Gilpin, J. de Beyer, and K. Messer. 2005. “Tobacco Industry Price-Subsidizing Promotions May Overcome the Downward Pressure of Higher Prices on Initiation of Regular Smoking.” Health Economics 14:1061-1071.
RTI International. 2006. “Third Annual Independent Evaluation of New York’s Tobacco Control Program.” <http://www.health.state.ny.us/prevention/tobacco_control/docs/indep endent_evaluation_report_2006.pdf>. Accessed 11/1/2006.
Slater, S., F.J. Chaloupka, M. Wakefield. 2001. “State Variation in Retail Promotions and Advertising for Marlboro Cigarettes.” Tobacco Control 10(4):337-9.
Terry-McElrath, Y., M. Wakefield, G. Giovino, A. Hyland, D. Barker, F. Chaloupka, et al. 2002. “Point-of-Purchase Tobacco Environments and Variation by Store Type—United States, 1999.” Morbidity and Mortality Weekly Report 51(9):4-7.
White, V.M., M.M. White, K. Freeman, E.A. Gilpin, and J.P. Pierce. 2006. “Cigarette Promotional Offers: Who Takes Advantage?” American Journal of Preventive Medicine 30(3):225-231.
18
Retail Advertising and Promotions for Cigarettes in New York
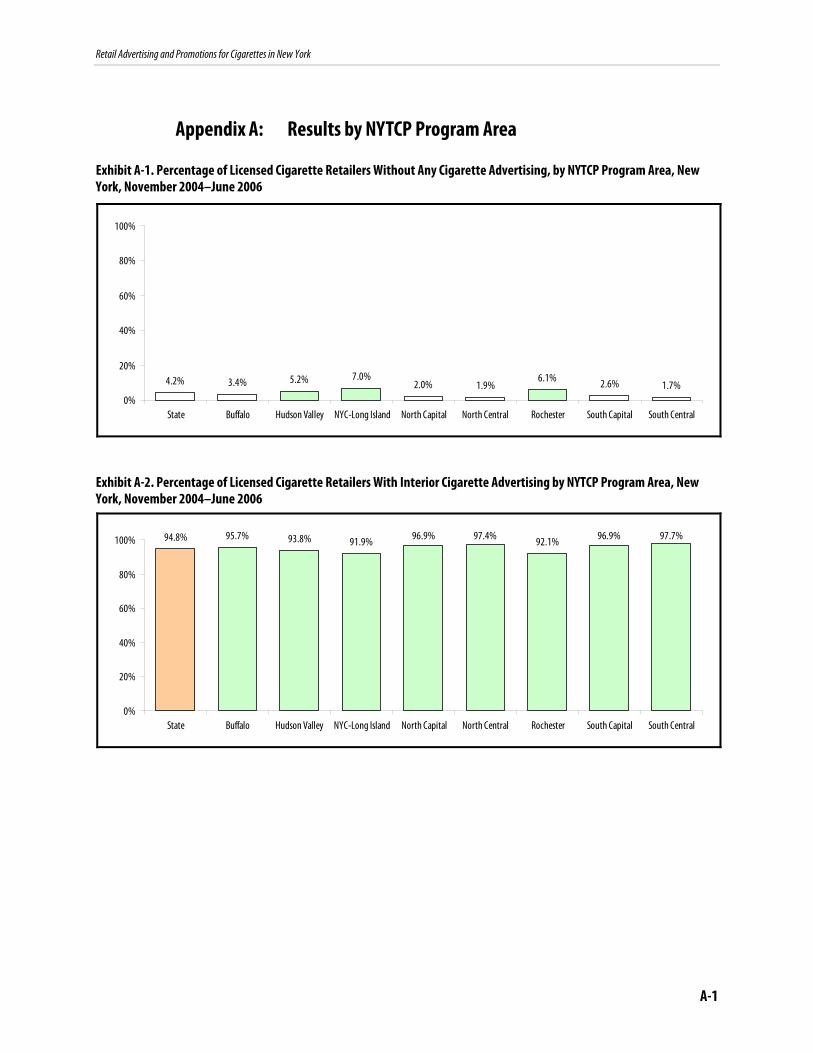
Appendix A: Results by NYTCP Program Area
Exhibit A-1. Percentage of Licensed Cigarette Retailers Without Any Cigarette Advertising, by NYTCP Program Area, New York, November 2004–June 2006
1.7%4.2% 6.1% 1.9% 2.0% 5.2% 2.6%
7.0% 3.4%
0%
20%
40%
60%
80%
100%
State Buffalo Hudson Valley NYC-Long Island North Capital North Central Rochester South Capital South Central
Exhibit A-2. Percentage of Licensed Cigarette Retailers With Interior Cigarette Advertising by NYTCP Program Area, New York, November 2004–June 2006
97.7% 94.8% 92.1% 97.4% 96.9% 93.8% 96.9%91.9% 95.7%
0%
20%
40%
60%
80%
100%
State Buffalo Hudson Valley NYC-Long Island North Capital North Central Rochester South Capital South Central
A-1
Retail Advertising and Promotions for Cigarettes in New York
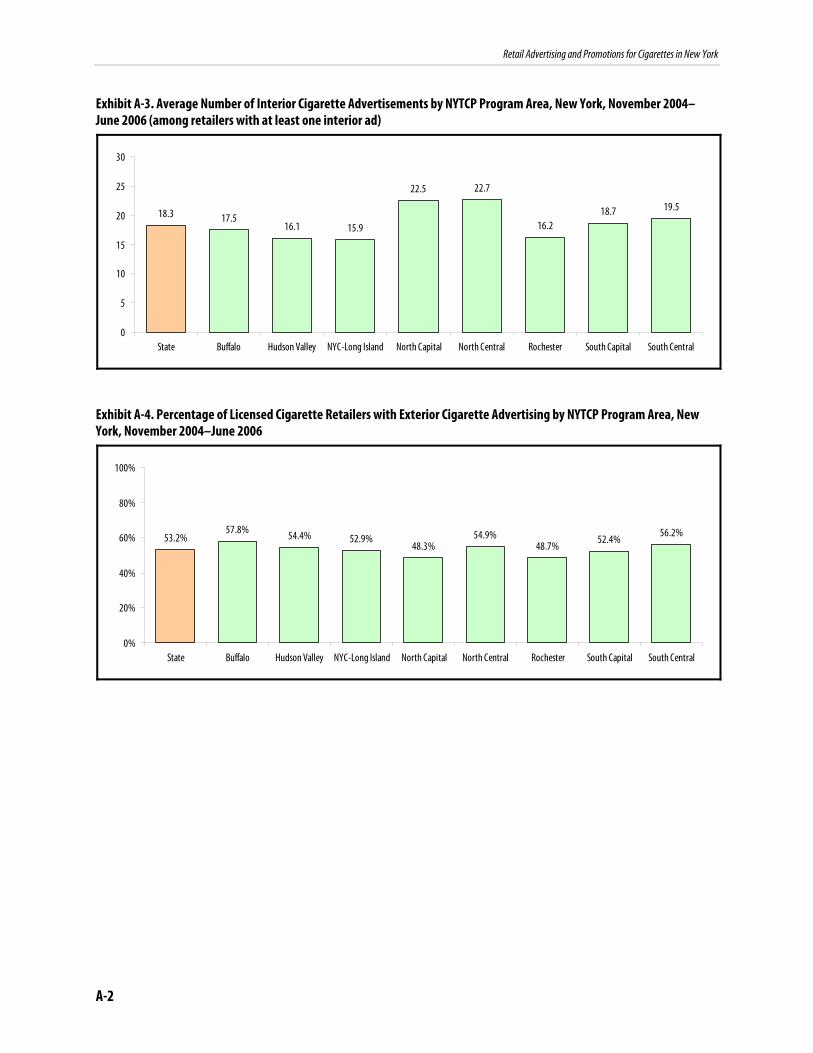
Exhibit A-3. Average Number of Interior Cigarette Advertisements by NYTCP Program Area, New York, November 2004– June 2006 (among retailers with at least one interior ad)
19.5 18.3
16.2
22.7 22.5
16.1 18.7
15.9 17.5
0
5
10
15
20
25
30
State Buffalo Hudson Valley NYC-Long Island North Capital North Central Rochester South Capital South Central
Exhibit A-4. Percentage of Licensed Cigarette Retailers with Exterior Cigarette Advertising by NYTCP Program Area, New York, November 2004–June 2006
56.2% 53.2% 48.7%
54.9% 48.3%
54.4% 52.4%52.9% 57.8%
0%
20%
40%
60%
80%
100%
State Buffalo Hudson Valley NYC-Long Island North Capital North Central Rochester South Capital South Central
A-2
Retail Advertising and Promotions for Cigarettes in New York
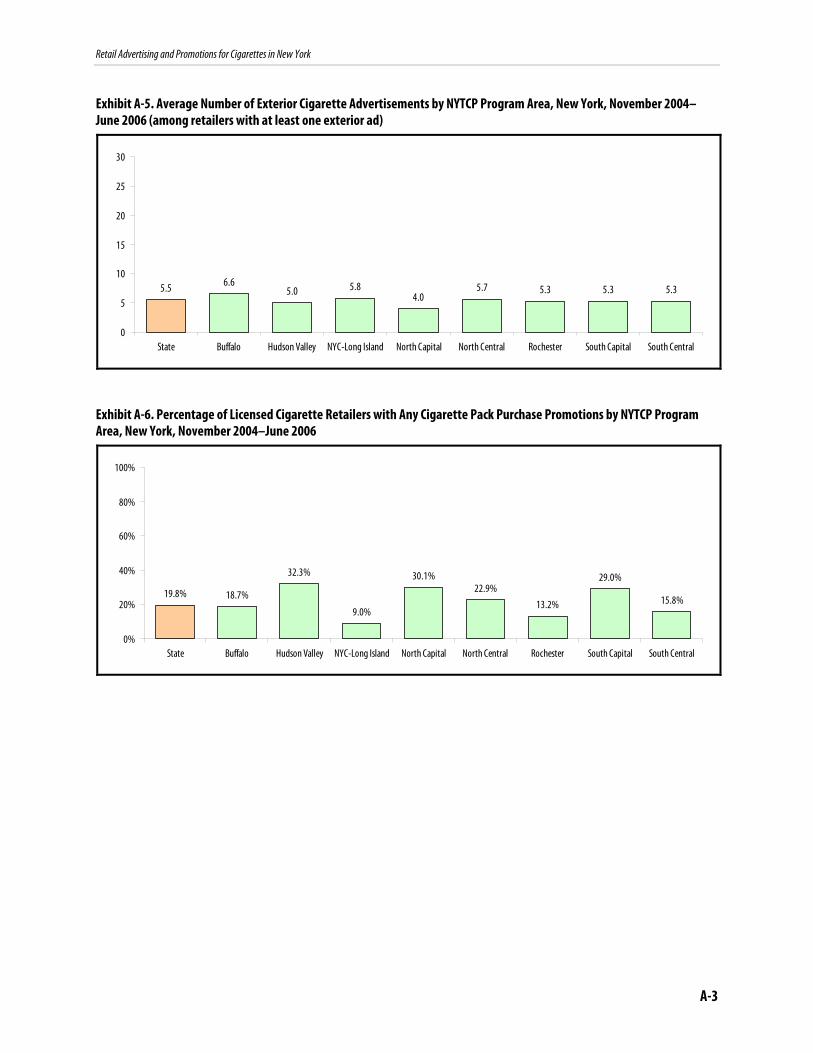
Exhibit A-5. Average Number of Exterior Cigarette Advertisements by NYTCP Program Area, New York, November 2004– June 2006 (among retailers with at least one exterior ad)
5.35.5 5.35.7 4.0 5.0 5.3 5.86.6
0
5
10
15
20
25
30
State Buffalo Hudson Valley NYC-Long Island North Capital North Central Rochester South Capital South Central
Exhibit A-6. Percentage of Licensed Cigarette Retailers with Any Cigarette Pack Purchase Promotions by NYTCP Program Area, New York, November 2004–June 2006
15.8% 19.8%
13.2%
22.9% 30.1% 32.3% 29.0%
9.0%
18.7%
0%
20%
40%
60%
80%
100%
State Buffalo Hudson Valley NYC-Long Island North Capital North Central Rochester South Capital South Central
A-3
Retail Advertising and Promotions for Cigarettes in New York
Appendix B: Multivariate Regression Results
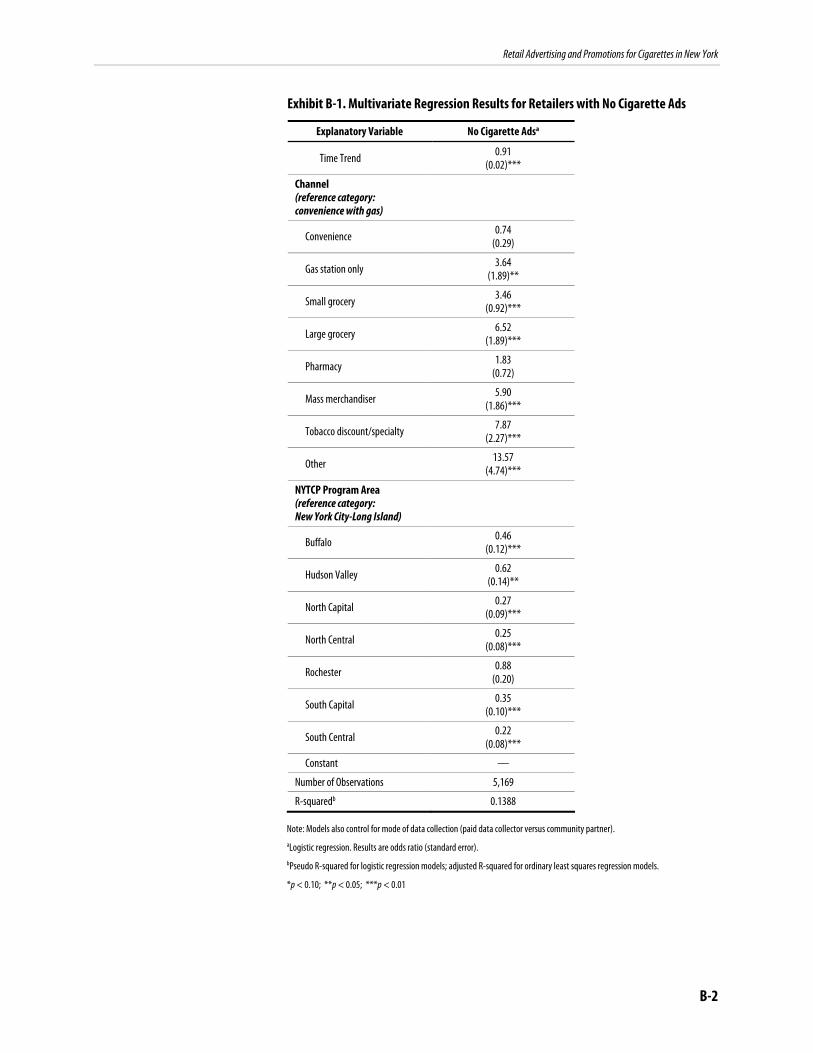
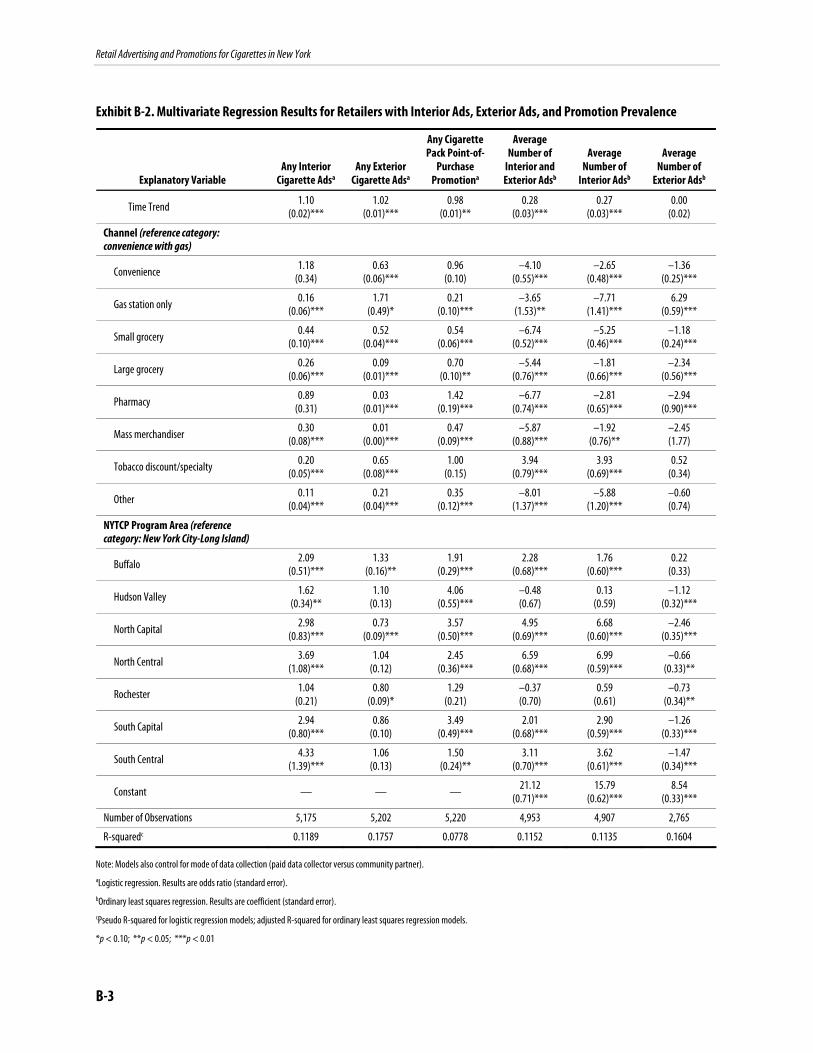
Logistic regression was used to model four outcomes: the prevalence of licensed tobacco retailers in New York with (1) no cigarette advertisements, (2) any interior advertisements, (3) any exterior advertisements, and (4) any point-of-purchase price promotion. For these models, the dependent variable was coded as 1 if the store had no ads, at least one interior ad, at least one exterior ad, or any promotion, respectively; or 0 if the store had at least one interior or exterior ad, no interior ads, no exterior ads, or no promotions, respectively. Results from the logistic regressions are reported in column 2 of Exhibit B-1 and columns 2, 3, and 4 of Exhibit B-2.
Least squares regression was used to model three outcomes: (1) total number of interior and exterior ads among retailers with at least one ad of any type, (2) number of interior ads among retailers with at least one interior ad, and (3) number of exterior ads among retailers with at least one exterior ad. Results from the linear regressions are reported in columns 5 through 7 of Exhibit B-2.
All models are estimated using monthly data for November 2004, March 2005 through March 2006, and June 2006. Explanatory variables include a time trend that starts at 1 in November 2004 and increments by 1 each month through June 2006; a 1/0 indicator for mode of data collection (paid data collector versus community partner data collector); 1/0 indicators for retail channel (convenience, convenience with gas, gas only, small grocery, large grocery, pharmacy, mass merchandiser, tobacco specialty, and other) with convenience with gas as the referent category; and 1/0 indicators for NYTCP Program Area (Buffalo, Hudson Valley, New York City-Long Island, North Capital, North Central, Rochester, South Capital, and South Central).
B-1
Retail Advertising and Promotions for Cigarettes in New York
Exhibit B-1. Multivariate Regression Results for Retailers with No Cigarette Ads
Explanatory Variable No Cigarette Adsa
0.91Time Trend (0.02)***
Channel (reference category: convenience with gas)
0.74Convenience (0.29)
3.64Gas station only (1.89)**
3.46Small grocery (0.92)***
6.52Large grocery (1.89)***
1.83Pharmacy (0.72)
5.90Mass merchandiser (1.86)***
7.87Tobacco discount/specialty (2.27)***
13.57Other (4.74)***
NYTCP Program Area (reference category: New York City-Long Island)
0.46Buffalo (0.12)***
0.62Hudson Valley (0.14)**
0.27North Capital (0.09)***
0.25North Central (0.08)***
0.88Rochester (0.20)
0.35South Capital (0.10)***
0.22South Central (0.08)***
Constant —
Number of Observations 5,169
R-squaredb 0.1388
Note: Models also control for mode of data collection (paid data collector versus community partner). aLogistic regression. Results are odds ratio (standard error). bPseudo R-squared for logistic regression models; adjusted R-squared for ordinary least squares regression models.
*p < 0.10; **p < 0.05; ***p < 0.01
B-2
Retail Advertising and Promotions for Cigarettes in New York
Exhibit B-2. Multivariate Regression Results for Retailers with Interior Ads, Exterior Ads, and Promotion Prevalence
Any Cigarette Average Pack Point-of- Number of Average Average
Any Interior Any Exterior Purchase Interior and Number of Number of Explanatory Variable Cigarette Adsa Cigarette Adsa Promotiona Exterior Adsb Interior Adsb Exterior Adsb
Time Trend 1.10 (0.02)***
1.02 (0.01)***
0.98 (0.01)**
0.28 (0.03)***
0.27 (0.03)***
0.00 (0.02)
Channel (reference category: convenience with gas)
Convenience 1.18 (0.34)
0.63 (0.06)***
0.96 (0.10)
–4.10 (0.55)***
–2.65 (0.48)***
–1.36 (0.25)***
Gas station only 0.16 (0.06)***
1.71 (0.49)*
0.21 (0.10)***
–3.65 (1.53)**
–7.71 (1.41)***
6.29 (0.59)***
Small grocery 0.44 (0.10)***
0.52 (0.04)***
0.54 (0.06)***
–6.74 (0.52)***
–5.25 (0.46)***
–1.18 (0.24)***
Large grocery 0.26 (0.06)***
0.09 (0.01)***
0.70 (0.10)**
–5.44 (0.76)***
–1.81 (0.66)***
–2.34 (0.56)***
Pharmacy 0.89 (0.31)
0.03 (0.01)***
1.42 (0.19)***
–6.77 (0.74)***
–2.81 (0.65)***
–2.94 (0.90)***
Mass merchandiser 0.30 (0.08)***
0.01 (0.00)***
0.47 (0.09)***
–5.87 (0.88)***
–1.92 (0.76)**
–2.45 (1.77)
Tobacco discount/specialty
Other
NYTCP Program Area (reference category: New York City-Long Island)
Buffalo
0.20 (0.05)***
0.11 (0.04)***
2.09 (0.51)***
0.65 (0.08)***
0.21 (0.04)***
1.33 (0.16)**
1.00 (0.15)
0.35 (0.12)***
1.91 (0.29)***
3.94 (0.79)***
–8.01 (1.37)***
2.28 (0.68)***
3.93 (0.69)***
–5.88 (1.20)***
1.76 (0.60)***
0.52 (0.34)
–0.60 (0.74)
0.22 (0.33)
Hudson Valley 1.62 (0.34)**
1.10 (0.13)
4.06 (0.55)***
–0.48 (0.67)
0.13 (0.59)
–1.12 (0.32)***
North Capital 2.98 (0.83)***
0.73 (0.09)***
3.57 (0.50)***
4.95 (0.69)***
6.68 (0.60)***
–2.46 (0.35)***
North Central 3.69 (1.08)***
1.04 (0.12)
2.45 (0.36)***
6.59 (0.68)***
6.99 (0.59)***
–0.66 (0.33)**
Rochester 1.04 (0.21)
0.80 (0.09)*
1.29 (0.21)
–0.37 (0.70)
0.59 (0.61)
–0.73 (0.34)**
South Capital 2.94 (0.80)***
0.86 (0.10)
3.49 (0.49)***
2.01 (0.68)***
2.90 (0.59)***
–1.26 (0.33)***
South Central 4.33 (1.39)***
1.06 (0.13)
1.50 (0.24)**
3.11 (0.70)***
3.62 (0.61)***
–1.47 (0.34)***
Constant — — — 21.12 (0.71)***
15.79 (0.62)***
8.54 (0.33)***
Number of Observations 5,175 5,202 5,220 4,953 4,907 2,765
R-squaredc 0.1189 0.1757 0.0778 0.1152 0.1135 0.1604
Note: Models also control for mode of data collection (paid data collector versus community partner). aLogistic regression. Results are odds ratio (standard error). bOrdinary least squares regression. Results are coefficient (standard error). cPseudo R-squared for logistic regression models; adjusted R-squared for ordinary least squares regression models.
*p < 0.10; **p < 0.05; ***p < 0.01
B-3

N E W Y O R K S T A T E D E P A R T M E N T O F H E A L T H
T O B A C C O C O N T R O L P R O G R A M
C O R N I N G T O W E R , R O O M 7 1 0
A L B A N Y , N Y 1 2 2 3 7 - 0 6 7 6
w w w . n y h e a l t h . g o v