![Q3 - FY16 Results [Company Update]](https://static.fdocuments.in/doc/165x107/577ca4dc1a28abea748b4c27/q3-fy16-results-company-update.jpg)
Results update – Q4FY08
20
Results update – Q4FY08 April 28, 2008
Transcript of Results update – Q4FY08

Results update – Q4FY08April 28, 2008

2
• Performance highlights- Q4 FY08
• Business review
• Future plans and strategy
• Corporate overview
• Industry overview
Presentation structure
Unless otherwise mentioned, facts and figures in this presentation refer to those for the India Infoline group (consolidated)
Financial performance highlights
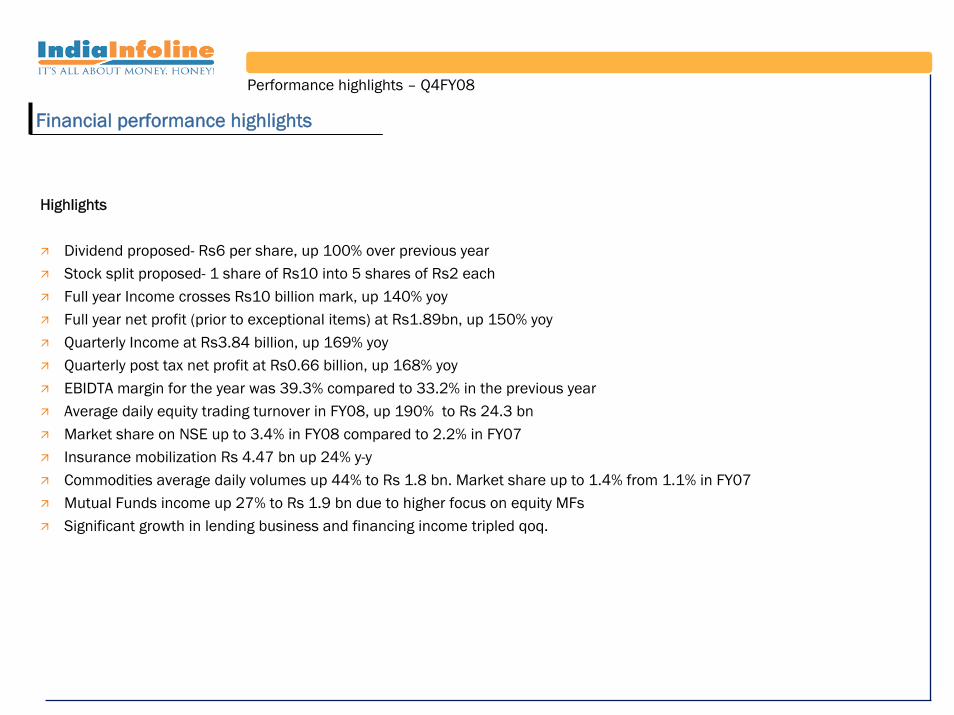
Highlights
Dividend proposed- Rs6 per share, up 100% over previous yearStock split proposed- 1 share of Rs10 into 5 shares of Rs2 eachFull year Income crosses Rs10 billion mark, up 140% yoyFull year net profit (prior to exceptional items) at Rs1.89bn, up 150% yoyQuarterly Income at Rs3.84 billion, up 169% yoyQuarterly post tax net profit at Rs0.66 billion, up 168% yoyEBIDTA margin for the year was 39.3% compared to 33.2% in the previous yearAverage daily equity trading turnover in FY08, up 190% to Rs 24.3 bnMarket share on NSE up to 3.4% in FY08 compared to 2.2% in FY07 Insurance mobilization Rs 4.47 bn up 24% y-yCommodities average daily volumes up 44% to Rs 1.8 bn. Market share up to 1.4% from 1.1% in FY07Mutual Funds income up 27% to Rs 1.9 bn due to higher focus on equity MFsSignificant growth in lending business and financing income tripled qoq.
Performance highlights – Q4FY08
Financial highlights
Performance highlights – Q4FY08
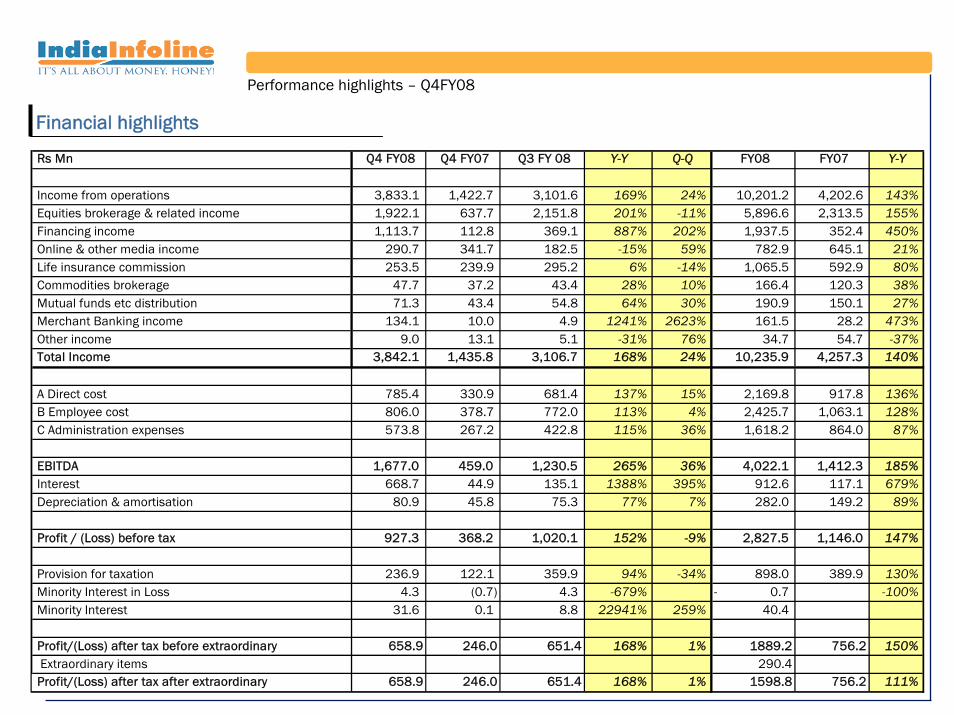
Rs Mn Q4 FY08 Q4 FY07 Q3 FY 08 Y-Y Q-Q FY08 FY07 Y-Y
Income from operations 3,833.1 1,422.7 3,101.6 169% 24% 10,201.2 4,202.6 143%Equities brokerage & related income 1,922.1 637.7 2,151.8 201% -11% 5,896.6 2,313.5 155%Financing income 1,113.7 112.8 369.1 887% 202% 1,937.5 352.4 450%Online & other media income 290.7 341.7 182.5 -15% 59% 782.9 645.1 21%Life insurance commission 253.5 239.9 295.2 6% -14% 1,065.5 592.9 80%Commodities brokerage 47.7 37.2 43.4 28% 10% 166.4 120.3 38%Mutual funds etc distribution 71.3 43.4 54.8 64% 30% 190.9 150.1 27%Merchant Banking income 134.1 10.0 4.9 1241% 2623% 161.5 28.2 473%Other income 9.0 13.1 5.1 -31% 76% 34.7 54.7 -37%Total Income 3,842.1 1,435.8 3,106.7 168% 24% 10,235.9 4,257.3 140%
A Direct cost 785.4 330.9 681.4 137% 15% 2,169.8 917.8 136%B Employee cost 806.0 378.7 772.0 113% 4% 2,425.7 1,063.1 128%C Administration expenses 573.8 267.2 422.8 115% 36% 1,618.2 864.0 87%
EBITDA 1,677.0 459.0 1,230.5 265% 36% 4,022.1 1,412.3 185%Interest 668.7 44.9 135.1 1388% 395% 912.6 117.1 679%Depreciation & amortisation 80.9 45.8 75.3 77% 7% 282.0 149.2 89%
Profit / (Loss) before tax 927.3 368.2 1,020.1 152% -9% 2,827.5 1,146.0 147%
Provision for taxation 236.9 122.1 359.9 94% -34% 898.0 389.9 130%Minority Interest in Loss 4.3 (0.7) 4.3 -679% 0.7- -100%Minority Interest 31.6 0.1 8.8 22941% 259% 40.4
Profit/(Loss) after tax before extraordinary 658.9 246.0 651.4 168% 1% 1889.2 756.2 150% Extraordinary items 290.4
Profit/(Loss) after tax after extraordinary 658.9 246.0 651.4 168% 1% 1598.8 756.2 111%

Profit After Tax
Profit Before Tax
Revenues
EBIDTA margins
Performance in pictures
Performance highlights – Q4FY08
Profit After Tax (Rs Mn)
879
EBIDTA Margins(%)Profit Before Tax (Rs Mn)
Revenues (Rs Mn)
Mar-08Mar-06 Jun-06 Sep-06 Dec-06 Mar-07 Jun-07 Sep-07 Dec-070
1000
2000
3000
4000
0
100
200
300
400
500
600
700
Mar-08Mar-06 Jun-06 Sep-06 Dec-06 Mar-07 Jun-07 Sep-07 Dec-07
168187
133172
246
368 361
651 659
7881,136
1,436 1,334
1,953
3,107
3,842
857
0
200
400
600
800
1000
1200
Mar-08Mar-06 Jun-06 Sep-06 Dec-06 Mar-07 Jun-07 Sep-07 Dec-07
255298
201260
368 343
537
1020927
0
5
10
15
20
25
30
35
40
45
50
Mar-08Mar-06 Jun-06 Sep-06 Dec-06 Mar-07 Jun-07 Sep-07 Dec-07
3841
3129
32 33 34
4044
6
• Performance highlights- Q4 FY08
• Business review
• Future plans and strategy
• Corporate overview
• Industry overview
Presentation structure
Unless otherwise mentioned, facts and figures in this presentation refer to those for the India Infoline group (consolidated)

7
Downturn in the capital markets triggered by sub-prime woes and global inflationary pressuresMarket share on NSE at 3.6% in Q4Average daily turnover declines 29% QoQ to Rs 26.7 bn in line with marketWe will continue expansion of network and investment in technology, systems and processes
Equities broking (Cash & FAO)
Business review
Equities broking
IIL market share
IIL locations
4580
152
568
758
0
100
200
300
400
500
600
700
800
2004 2005 2006 2007 2008
Business locations (branches & sub-brokers)
Equities Brokerage Rs Mn (LHS)
Av. Daily Vol (Rs.Mn)
542 568 499606 641 693
1128
2152
1922
0
500
1000
1500
2000
2500
Mar-06 Jun-06 Sep-06 Dec-06 Mar-07 Jun-07 Sep-07 Dec-07 Mar-080
5000
10000
15000
20000
25000
30000
35000
40000
1.90%
3.6%
1.3%
1.9%
2.6%
3.2%
3.8%
Mar-06 Jun-06 Sep-06 Dec-06 Mar-07 Jun-07 Sep-07 Dec-07 Mar-08
NSE Market Share
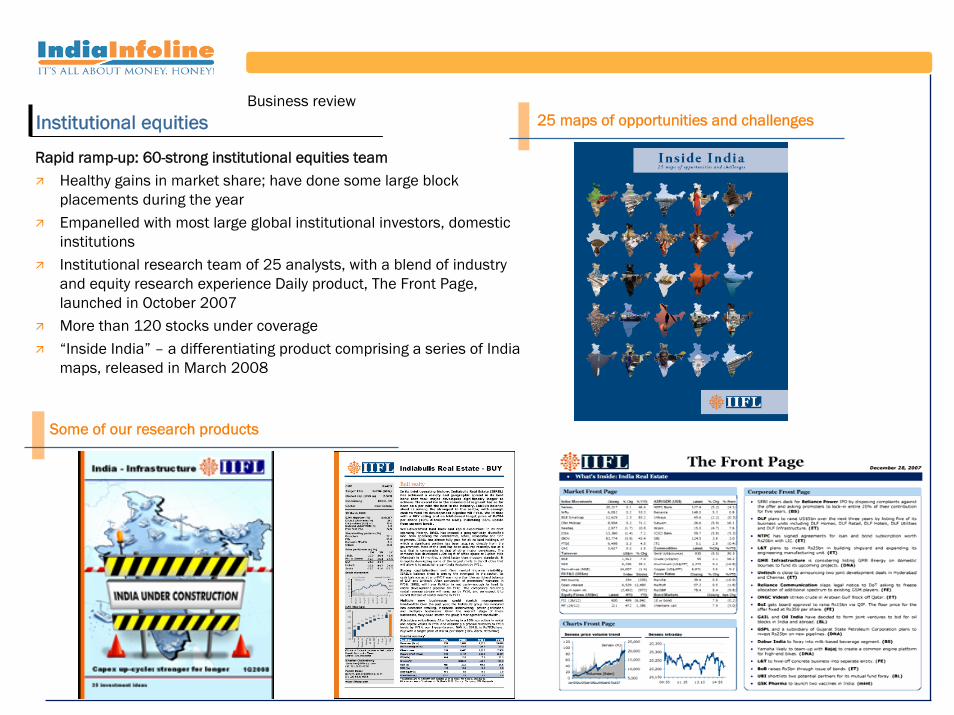
Institutional equities
Rapid ramp-up: 60-strong institutional equities team Healthy gains in market share; have done some large block placements during the yearEmpanelled with most large global institutional investors, domestic institutionsInstitutional research team of 25 analysts, with a blend of industry and equity research experience Daily product, The Front Page, launched in October 2007More than 120 stocks under coverage“Inside India” – a differentiating product comprising a series of India maps, released in March 2008
Some of our research products
25 maps of opportunities and challengesBusiness review
9
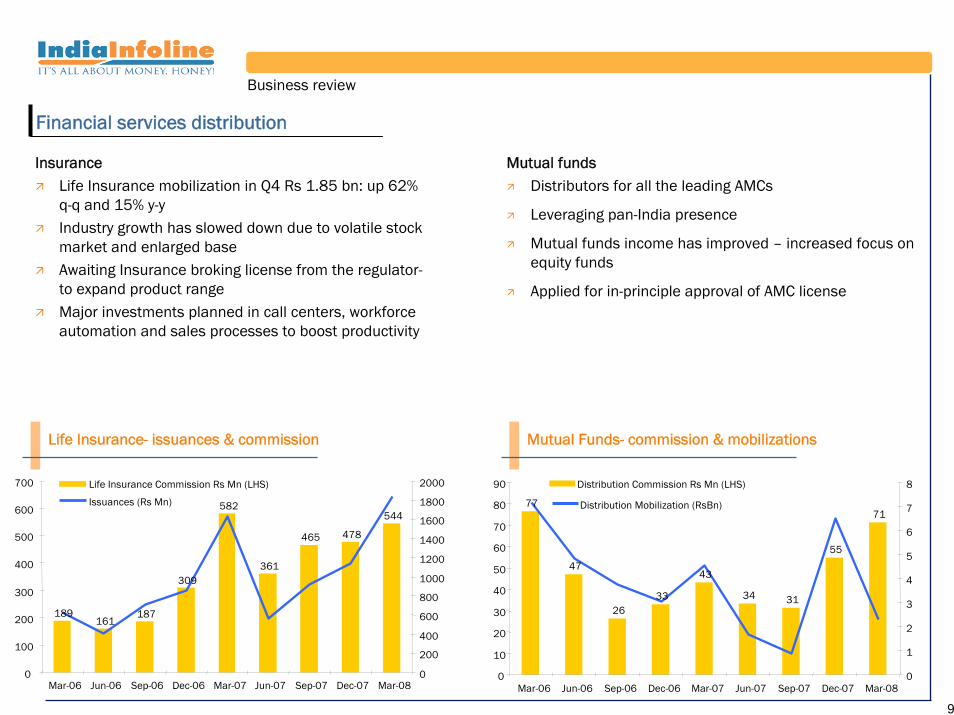
InsuranceLife Insurance mobilization in Q4 Rs 1.85 bn: up 62% q-q and 15% y-yIndustry growth has slowed down due to volatile stock market and enlarged baseAwaiting Insurance broking license from the regulator-to expand product range Major investments planned in call centers, workforce automation and sales processes to boost productivity
Mutual Funds- commission & mobilizationsLife Insurance- issuances & commission
Financial services distribution
Mutual fundsDistributors for all the leading AMCs
Leveraging pan-India presence
Mutual funds income has improved – increased focus on equity funds
Applied for in-principle approval of AMC license
Business review
Distribution Commission Rs Mn (LHS)
Distribution Mobilization (RsBn)
Life Insurance Commission Rs Mn (LHS)
Issuances (Rs Mn)
189161
187
309
582
361
465 478
544
0
100
200
300
400
500
600
700
Mar-06 Jun-06 Sep-06 Dec-06 Mar-07 Jun-07 Sep-07 Dec-07 Mar-080
200
400
600
800
1000
1200
1400
1600
1800
2000
77
47
2633
43
34 31
55
71
0
10
20
30
40
50
60
70
80
90
Mar-06 Jun-06 Sep-06 Dec-06 Mar-07 Jun-07 Sep-07 Dec-07 Mar-080
1
2
3
4
5
6
7
8
10
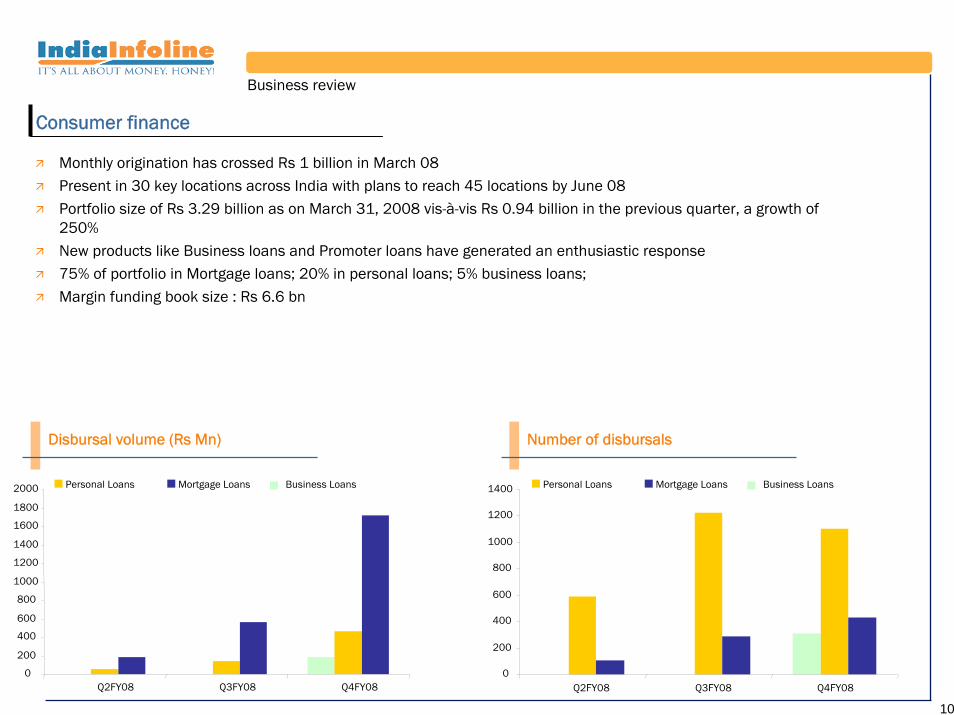
Monthly origination has crossed Rs 1 billion in March 08 Present in 30 key locations across India with plans to reach 45 locations by June 08Portfolio size of Rs 3.29 billion as on March 31, 2008 vis-à-vis Rs 0.94 billion in the previous quarter, a growth of 250%New products like Business loans and Promoter loans have generated an enthusiastic response75% of portfolio in Mortgage loans; 20% in personal loans; 5% business loans; Margin funding book size : Rs 6.6 bn
Consumer finance
Business review
Number of disbursalsDisbursal volume (Rs Mn)
Personal Loans Mortgage Loans
0
200
400
600
800
1000
1200
1400
1600
1800
2000
Q2FY08 Q3FY08 Q4FY08
Business Loans
0
200
400
600
800
1000
1200
1400
Q2FY08 Q3FY08 Q4FY08
Personal Loans Mortgage Loans Business Loans
11
• Performance highlights- Q4 FY08
• Business review
• Future plans and strategy
• Corporate overview
• Industry overview
Presentation structure
Unless otherwise mentioned, facts and figures in this presentation refer to those for the India Infoline group (consolidated)
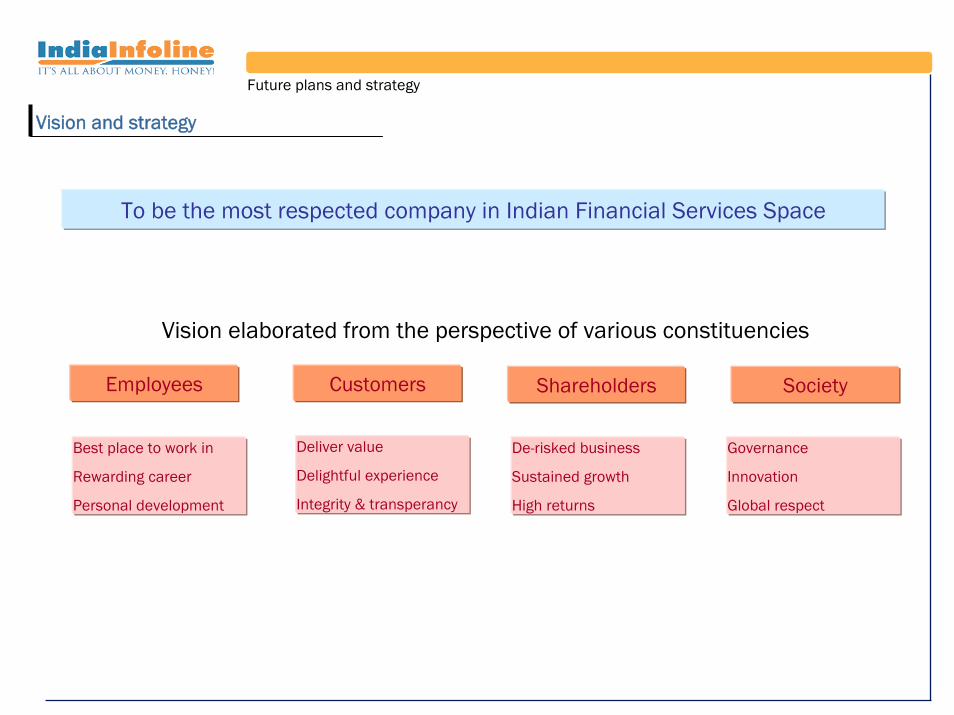
Vision and strategy
Future plans and strategy
To be the most respected company in Indian Financial Services Space
Employees Customers Shareholders Society
Best place to work in
Rewarding career
Personal development
Deliver value
Delightful experience
Integrity & transperancy
De-risked business
Sustained growth
High returns
Governance
Innovation
Global respect
Vision elaborated from the perspective of various constituencies

Business plan
One stop shop for all financial services productsDe-risking business model but not drifting from the coreCritical mass in all key businesses
Strong focus on risk management and complianceBetting on people with proven credentialsFocus on efficient use of capital
Future plans and strategy
Assetmanagement
Investmentbanking
Consumerfinance
Wealthmanagement
Institutionalequities
Life insurance
Retail broking
Financial Services

14
• Performance highlights- Q4 FY08
• Business review
• Future plans and strategy
• Corporate overview
• Industry overview
Presentation structure
Unless otherwise mentioned, facts and figures in this presentation refer to those for the India Infoline group (consolidated)

1995 Incorporated as an Equity Research & Consulting firm
1999Changed business model to embrace the Internet and launch www.indiainfoline.com
2000Started distribution of personal financial products
Launched online equity trading through www.5paisa.com
Started life insurance distribution as Corporate Agent
2005
2004Acquired Commodities broking license
Launched Portfolio Management Service
Debuted on the Indian stock marketsLaunched proprietary trading platform Trader Terminal
2006Acquired membership of DGCXLaunched Wealth Advisory Services
2007CLSA Institutional equities team joins
Formed Singapore subsidiary IIFL (Asia) Pte Ltd
Client base included leading FIIs, Banks, Consulting firms & Corporates
First round of capital raising from reputed Private Equity investors
Evolution
Equity dilution in parent and subsidiaries to raise about USD268Mn
2008Wealth Management launched under the IIFL Wealth brand
Corporate overview
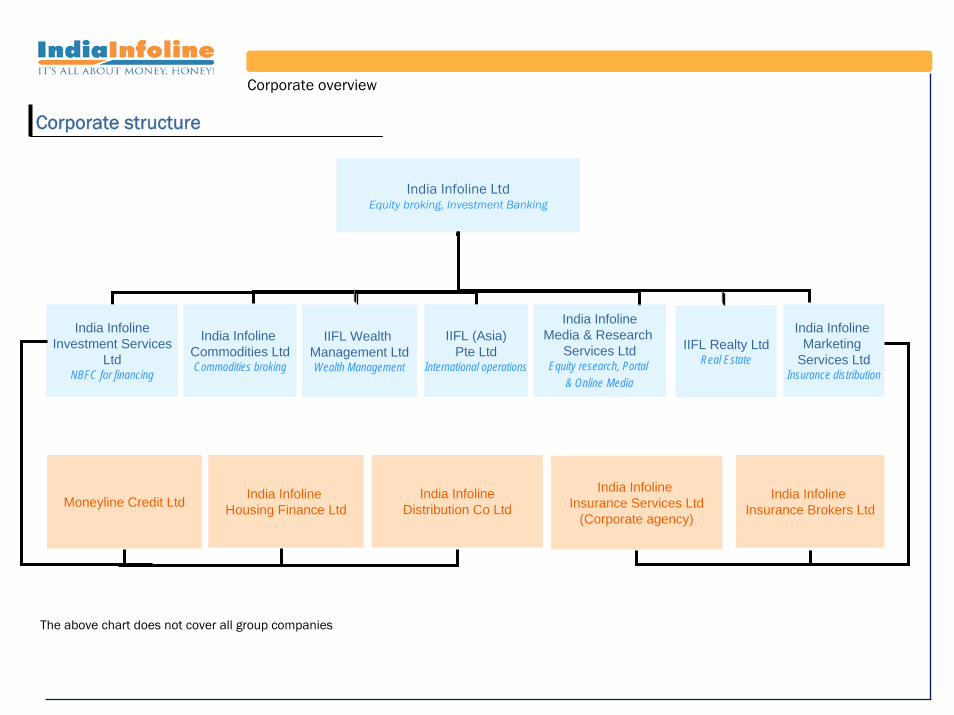
India Infoline LtdEquity broking, Investment Banking
India InfolineInvestment Services
LtdNBFC for financing
India Infoline Commodities LtdCommodities broking
IIFL (Asia)Pte Ltd
International operations
India InfolineMedia & Research
Services LtdEquity research, Portal
& Online Media
India Infoline Marketing
Services LtdInsurance distribution
India Infoline Housing Finance LtdMoneyline Credit Ltd India Infoline
Distribution Co LtdIndia Infoline
Insurance Brokers Ltd
India Infoline Insurance Services Ltd
(Corporate agency)
IIFL Wealth Management LtdWealth Management
IIFL Realty LtdReal Estate
The above chart does not cover all group companies
Corporate structure
Corporate overview

17
• Performance highlights- Q4 FY08
• Business review
• Future plans and strategy
• Corporate overview
• Industry overview
Presentation structure
Unless otherwise mentioned, facts and figures in this presentation refer to those for the India Infoline group (consolidated)
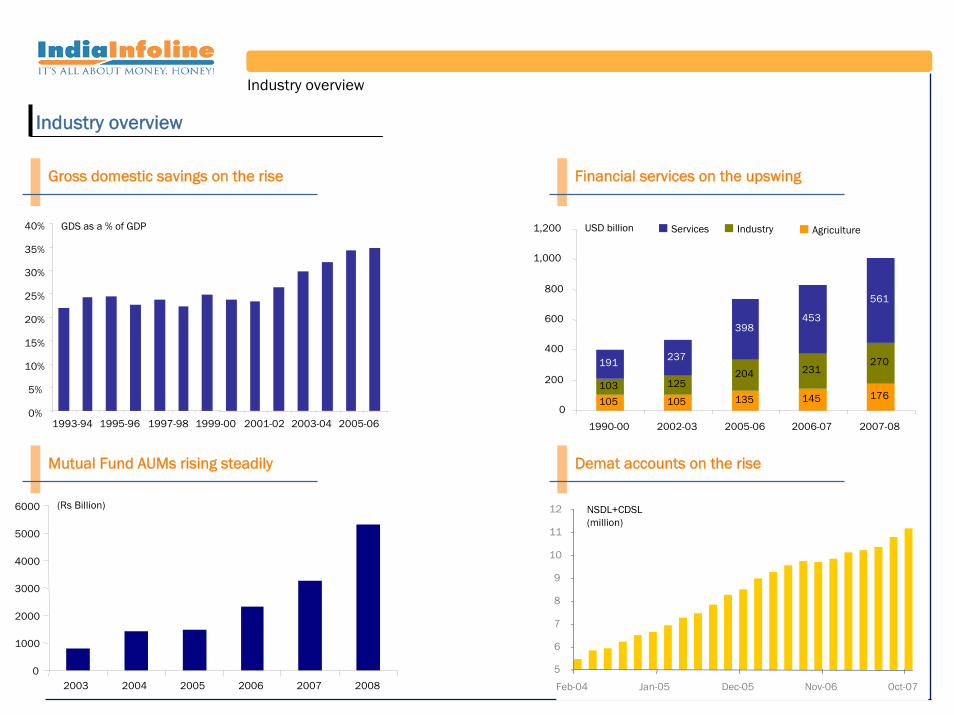
Industry overview
Industry overview
Gross domestic savings on the rise
Mutual Fund AUMs rising steadily
Financial services on the upswing
105 105 135 145 176103 125
204 231270191 237
398453
561
0
200
400
600
800
1,000
1,200
1990-00 2002-03 2005-06 2006-07 2007-08
Services Industry Agriculture
0
1000
2000
3000
4000
5000
6000
2003 2004 2005 2006 2007 2008
(Rs Billion)
0%
5%
10%
15%
20%
25%
30%
35%
40%
1993-94 1995-96 1997-98 1999-00 2001-02 2003-04 2005-06
GDS as a % of GDP USD billion
Demat accounts on the rise
5
6
7
8
9
10
11
12
Feb-04 Jan-05 Dec-05 Nov-06 Oct-07
NSDL+CDSL (million)
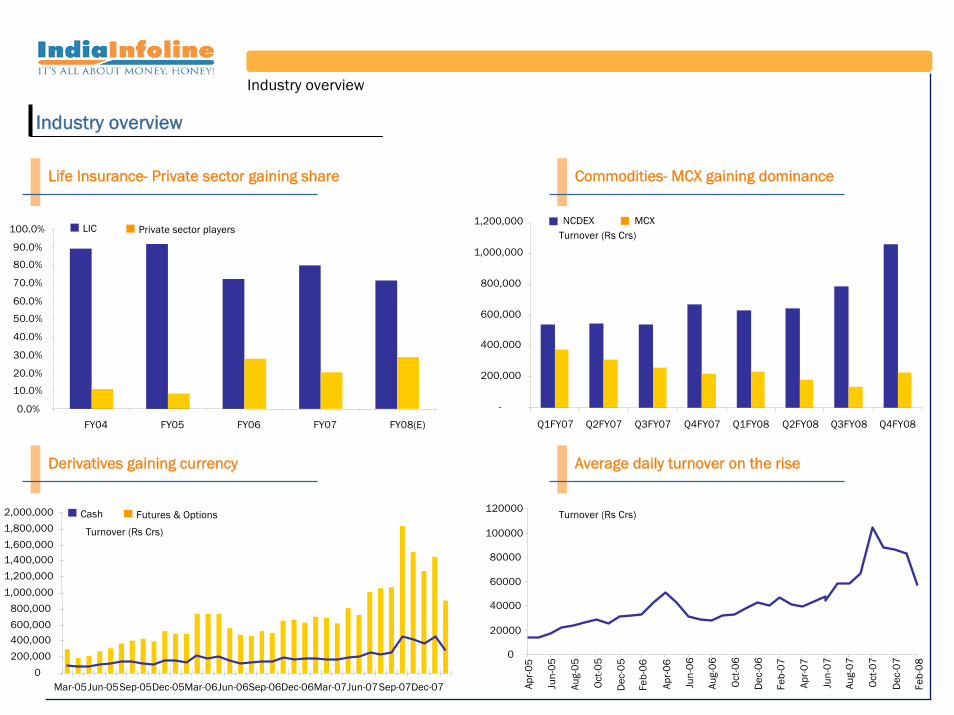
Life Insurance- Private sector gaining share
Derivatives gaining currency
Commodities- MCX gaining dominance
Average daily turnover on the rise
Industry overview
Industry overview
0.0%
10.0%
20.0%
30.0%
40.0%
50.0%
60.0%
70.0%
80.0%
90.0%
100.0%
FY04 FY05 FY06 FY07 FY08(E)
LIC Private sector players
-
200,000
400,000
600,000
800,000
1,000,000
1,200,000
Q1FY07 Q2FY07 Q3FY07 Q4FY07 Q1FY08 Q2FY08 Q3FY08 Q4FY08
NCDEX MCXTurnover (Rs Crs)
0
200,000
400,000600,000
800,000
1,000,000
1,200,000
1,400,0001,600,000
1,800,000
2,000,000
Mar-05Jun-05Sep-05Dec-05Mar-06Jun-06Sep-06Dec-06Mar-07Jun-07Sep-07Dec-07
Cash Futures & Options
Turnover (Rs Crs)
0
20000
40000
60000
80000
100000
120000
Apr-0
5
Jun-
05
Aug-
05
Oct
-05
Dec
-05
Feb-
06
Apr-0
6
Jun-
06
Aug-
06
Oct
-06
Dec
-06
Feb-
07
Apr-0
7
Jun-
07
Aug-
07
Oct
-07
Dec
-07
Feb-
08
Turnover (Rs Crs)
20
Thank you
Published in April 2008. © India Infoline Ltd 2008-09.
India Infoline Ltd. All rights reserved. Regd. Off: 75, Nirlon Complex, Off W E Highway, Goregaon (E) Mumbai-400 063. Tel.: +(91 22)6677 5900 Fax: 2685 0451.
This report is for information purposes only and does not construe to be any investment, legal or taxation advice. It is not intended as an offer or solicitation for the purchase and sale of any financial instrument. Any action taken by you on the basis of the information contained herein is your responsibility alone and India Infoline Ltd (hereinafter referred as IIL) and its subsidiaries or its employees or directors, associates will not be liable in any manner for the consequences of such action taken by you. We have exercised due diligence in checking the correctness and authenticity of the information contained herein, but do not represent that it is accurate or complete. IIL or any of its subsidiaries or associates or employees shall not be in any way responsible for any loss or damage that may arise to any person from any inadvertent error in the information contained in this publication. The recipients of this report should rely on their own investigations. IIL and/or its subsidiaries and/or directors, employees or associates may have interests or positions, financial or otherwise in the securities mentioned in this report.

![Financial Results with Results Press Release, Investor Update & Limited Review Report for June 30, 2015 [Company Update]](https://static.fdocuments.in/doc/165x107/577cb40d1a28aba7118c46c3/financial-results-with-results-press-release-investor-update-limited-review.jpg)
![Results Press Release [Company Update]](https://static.fdocuments.in/doc/165x107/5695cedc1a28ab9b028b8547/results-press-release-company-update-56a6ce492878c.jpg)

![Results of EGM [Company Update]](https://static.fdocuments.in/doc/165x107/577c7f4b1a28abe054a3ef19/results-of-egm-company-update.jpg)


![Results Presentation [Company Update]](https://static.fdocuments.in/doc/165x107/577cb4341a28aba7118c5b10/results-presentation-company-update.jpg)

