RESULTS SECOND QUARTER 2017 - galpenergia.com · maintenance works at FPSO Cidade de Angra dos Reis...
27
Results second quarter 2017 July 31, 2017 1 RESULTS SECOND QUARTER 2017 July 31, 2017
Transcript of RESULTS SECOND QUARTER 2017 - galpenergia.com · maintenance works at FPSO Cidade de Angra dos Reis...

Results second quarter 2017 July 31, 2017
1
RESULTS
SECOND QUARTER
2017
July 31, 2017

Results second quarter 2017 July 31, 2017
2
TABLE OF CONTENTS
1. 2Q17 HIGHLIGHTS ............................................................................................... 3
2. KEY FIGURES ........................................................................................................ 4
3. MARKET ENVIRONMENT ....................................................................................... 5
4. EXPLORATION & PRODUCTION ............................................................................ 6
5. REFINING & MARKETING ..................................................................................... 8
6. GAS & POWER .................................................................................................... 10
7. FINANCIAL DATA ................................................................................................ 12
7.1. Income statement ............................................................................................ 12
7.2. Capital expenditure ........................................................................................... 14
7.3. Cash Flow ........................................................................................................ 15
7.4. Financial position and debt ................................................................................ 17
7.5. RCA turnover by segment .................................................................................. 18
7.6. Reconciliation of IFRS and replacement cost adjusted figures ............................... 19
7.7. IFRS consolidated income statement .................................................................. 21
7.8. Consolidated financial position ........................................................................... 22
8. BASIS OF PRESENTATION .................................................................................. 23
9. DEFINITIONS ..................................................................................................... 24
Results second quarter 2017 July 31, 2017
3
1. 2Q17 highlights
Post-dividend free cash flow was €130 m during the quarter, benefiting from the cash flow
from operating activities and the lower capex in the period.
Consolidated RCA Ebitda increased €136 m year-on-year (YoY) to €473 m, supported by the
performance of the R&M and E&P businesses.
RCA Ebitda for Exploration & Production (E&P) was €188 m, up €101 m YoY supported by
production growth and higher oil and natural gas prices.
The average working interest production reached 89.9 kboepd, up 64% YoY, supported by the
development of the Lula field. FPSO P-66 (FPSO #7) started production and FPSO Cidade de Saquarema
(FPSO #6) reached plateau production in June, only 11 months after its start. Production was impacted by
planned maintenance activities, including the outage at FPSO Cidade de Mangaratiba (FPSO #3) and
maintenance works at FPSO Cidade de Angra dos Reis (FPSO #1).
RCA Ebitda for Refining & Marketing (R&M) rose €90 m YoY to €233 m, benefiting from the
higher realised refining margin of $5.7/boe and from the high availability of the refining
system. It is also worth noting the strong contribution of the oil products marketing business,
supported by the economic context in Iberia and African countries in which Galp operates.
RCA Ebitda for the Gas & Power (G&P) business decreased €51 m YoY to €46 m, due to the
deconsolidation of the regulated infrastructure business and to the lower contribution of LNG trading and
gas marketing in Iberia.
Group RCA Ebit amounted to €253 m. During the second quarter, a €22 m impairment was booked
related to exploration blocks offshore Portugal. As of the beginning of 2017, exploration expenses
written-off started to be accounted for as recurring items.
RCA net income was €151 m, up €18 m YoY despite higher taxes due to better results in the E&P
business. IFRS net income was €99 m. The negative inventory effect amounted to €35 m and
non-recurring items to €17 m.
Capex totalled €184 m during the quarter, of which 85% from the E&P business.
Net debt on June 30 reached €1.3 billion (bn), considering the loan to Sinopec as cash, with a net debt to
Ebitda RCA ratio of 0.9x.
On June 1, the consortium for the development of Area 4 in Mozambique made the final investment
decision (FID) for the Coral South FLNG project. The project will be the first to develop the large
natural gas discoveries made in the Rovuma basin and will consist of a floating liquefied natural gas unit
(FLNG) with a capacity of c.3.4 million tonnes per annum (mtpa). The start of production is expected
during 2022.

Results second quarter 2017 July 31, 2017
4
2. Key figures Financial data €m (RCA)
2Q16 1Q17 2Q17 Var. YoY% Var.
YoY2016 2017 Var. YoY
% Var.
YoY
337 419 473 136 40% Ebitda RCA 631 892 262 41%
86 204 188 101 n.m. Exploration & Production 135 391 257 n.m.
143 187 233 90 63% Refining & Marketing 291 420 129 45%
97 22 46 (51) (53%) Gas & Power 187 68 (119) (64%)
185 220 253 68 37% Ebit RCA 323 473 151 47%
131 286 199 68 52% Ebit IFRS 128 485 357 n.m.
133 99 151 18 14% Net income RCA 247 250 3 1%
(98) (18) (17) 82 83% Non-recurring items (178) (35) 144 81%
31 54 (35) (66) n.m. Inventory effect (61) 18 79 n.m.
66 134 99 34 51% Net income IFRS 8 234 226 n.m.
287 227 184 (103) (36%) Capex 630 411 (219) (35%)
(157) (58) 130 - - Post-dividend free cash flow (253) 73 - -
1,891 1,333 1,329 (562) (30%) Net debt including loan to Sinopec1 1,891 1,329 (562) (30%)
1.6x 1.0x 0.9x - - Net debt to Ebitda RCA2 1.6x 0.9x - -
First HalfQuarter
1 Considering loan to Sinopec as cash. 2As at 30 June 2017, ratio considers net debt including €527 m loan to Sinopec as cash, plus €165 m
of Sinopec MLT shareholder loan to Petrogal Brasil and LTM Ebitda RCA of €1,673 m.
Operational data
2Q16 1Q17 2Q17 Var. YoY% Var.
YoY2016 2017 Var. YoY
% Var.
YoY
54.7 88.0 89.9 35.1 64%Average working interest production
(kboepd)55.5 88.9 33.4 60%
52.2 86.2 88.1 35.9 69% Average net entitlement production (kboepd) 53.0 87.2 34.2 65%
38.3 45.4 43.4 5.1 13% Oil and gas average sale price (USD/boe) 32.1 43.9 11.8 37%
26.3 26.1 30.0 3.7 14% Raw materials processed (mmboe) 51.5 56.1 4.6 9%
4.6 5.1 5.7 1.2 26% Galp refining margin (USD/boe) 4.3 5.5 1.1 26%
2.3 2.1 2.3 0.0 1% Oil sales to direct clients (mton) 4.4 4.4 (0.0) (1%)
881 1,149 1,052 170 19% NG sales to direct clients (mm3) 1,782 2,201 419 23%
712 857 675 (37) (5%) NG/LNG trading sales (mm3) 1,672 1,532 (140) (8%)
First HalfQuarter
Market indicators
2Q16 1Q17 2Q17 Var. YoY% Var.
YoY2016 2017 Var. YoY
% Var.
YoY
1.13 1.06 1.10 (0.03) (2%) Average exchange rate (EUR:USD) 1.12 1.08 (0.03) (3%)
45.6 53.7 49.6 4.1 9% Dated Brent price1 (USD/bbl) 39.8 51.7 11.9 30%
(2.2) (1.8) (1.2) (1.1) (48%) Heavy-light crude price spread1 (USD/bbl) (2.3) (1.5) (0.8) (34%)
4.4 6.0 4.8 0.4 9% U.K. NBP gas price1 (USD/mmbtu) 4.3 5.4 1.1 25%
2.2 3.1 3.1 0.9 40% U.S. Henry Hub gas price2 (USD/mmbtu) 2.1 3.1 1.0 46%
4.7 7.0 5.5 0.9 18% LNG Japan and Korea price1 (USD/mmbtu) 4.8 6.3 1.5 30%
2.9 3.5 4.3 1.4 49% Benchmark refining margin3 (USD/bbl) 3.1 3.9 0.8 26%
15.4 15.2 15.7 0.3 2% Iberian oil market4 (mton) 30.5 30.9 0.4 1.3%
7,020 9,734 7,634 613 9% Iberian natural gas market5 (mm
3) 15,674 17,367 1,694 10.8%
Quarter First Half
1 Source: Platts. Urals NWE dated for heavy crude; dated Brent for light crude. 2 Source: Nymex. 3 For a complete description of the method of calculating the benchmark refining margin see ”Definitions”. 4 Source: APETRO for Portugal; CORES for Spain. 5 Source: Galp and Enagás.

Results second quarter 2017 July 31, 2017
5
3. Market environment
Dated Brent
During the second quarter of 2017, the average
price of dated Brent increased $4.1/bbl YoY to
$49.6/bbl, following expectations of market
rebalancing, particularly following OPEC’s
production restriction agreement, which was
extended until March 2018.
During the first half of 2017, dated Brent
averaged $51.7/bbl, up $11.9/bbl YoY.
During the second quarter of 2017, the average
price spread between Urals and dated Brent
decreased from -$2.2/bbl, in the previous year,
to -$1.2/bbl. The relative valuation of Urals was
due to the lower availability of this and other
similar quality crudes produced by OPEC
members, following the agreed production
limits. During the first half of 2017, this average
price spread narrowed $0.8/bbl YoY to
-$1.5/bbl.
Natural gas
The natural gas price in Europe (NBP) increased
from $4.4/mmbtu the previous year to
$4.8/mmbtu during the second quarter of 2017,
as a result of lower production in Western
Europe, as well as the announcement of the
closure of the largest natural gas storage
facility in the United Kingdom.
During the first half of 2017, NBP averaged
$5.4/mmbtu, up $1.1/mmbtu YoY.
The LNG reference price in the USA (Henry
Hub) increased from $2.2/mmbtu in the second
quarter of 2016 to $3.1/mmbtu. This increase
was due to lower natural gas production and
inventories in the USA, as well as the
development of new LNG export projects.
During the first half of 2017, Henry Hub
increased $1.0/mmbtu YoY to $3.1/mmbtu.
Refining margins
During the second quarter, the benchmark
refining margin went up $1.4/bbl YoY to
$4.3/bbl, as a result of stronger diesel and fuel
oil cracks. During the first half, the benchmark
margin increased $0.8/bbl YoY to $3.9/bbl.
The diesel crack increased $1.0/bbl YoY to
$11.9/bbl in the quarter, due to increased
demand and unplanned outages in refineries in
Central Europe. During the first half of 2017,
the diesel crack was $11.8/bbl, up $1.8/bbl
YoY.
The fuel oil crack was -$3.5/bbl, an
improvement of $9.2/bbl YoY, following lower
inventories, which stemmed primarily from:
lower exports from Russia, as a result of its
upgrade programme and the higher taxes on
fuel exports; and the reduction in the average
residue yield of the crude oil available on the
market, following the OPEC agreement.
During the first half of 2017, the fuel crack
averaged -$4.4/bbl, compared to -$12.3/bbl
during the first half of 2016.
Iberian market
During the second quarter of 2017, the Iberian
market for oil products totalled 15.7 million
tonnes (mton), compared to 15.4 mton the
previous year, as demand for jet increased,
driven by a pick-up in tourism activity.
During the first half of 2017, the Iberian market
for oil products rose 1% YoY to 30.9 mton.
During the second quarter of 2017, the Iberian
natural gas market increased 9% YoY to
7,634 mm³, supported by a 52% increase in
the electrical segment consumption, during a
period of lower hydroelectric power generation.
During the first half, the Iberian natural gas
market increased 11% YoY to 17,367 mm³.

Results second quarter 2017 July 31, 2017
6
4. Exploration & Production €m (RCA, except otherwise stated; unit figures based on net entitlement production)
2Q16 1Q17 2Q17 Var. YoY% Var.
YoY2016 2017 Var. YoY
% Var.
YoY
54.7 88.0 89.9 35.1 64%Average working interest production
1
(kboepd)55.5 88.9 33.4 60%
51.7 76.9 78.0 26.3 51% Oil production (kbpd) 52.3 77.4 25.2 48%
52.2 86.2 88.1 35.9 69%Average net entitlement production
1
(kboepd)53.0 87.2 34.2 65%
7.1 6.9 6.2 (0.9) (13%) Angola 7.5 6.6 (1.0) (13%)
45.0 79.3 81.8 36.8 82% Brazil 45.4 80.6 35.2 77%
38.3 45.4 43.4 5.1 13%Oil and gas average sale price
(USD/boe)32.1 43.9 11.8 37%
3.8 4.6 4.3 0.5 13% Royalties2 (USD/boe) 3.3 4.4 1.1 33%
9.8 8.0 9.2 (0.6) (6%) Production costs (USD/boe) 9.3 8.6 (0.8) (8%)
14.8 13.4 14.2 (0.7) (5%)Depreciation & Amortisation
3
(USD/boe)15.4 13.8 (1.6) (10%)
86 204 188 101 n.m. Ebitda RCA 135 391 257 n.m.
63 97 103 40 64% Depreciation, Amortisation and Impairments3 133 200 67 51%
- - 22 22 n.m. Exploration expenditures written-off4 - 22 22 n.m.
(0) - - 0 n.m. Provisions (0) - 0 n.m.
24 106 63 39 n.m. Ebit RCA 2 169 167 n.m.
(62) 108 59 121 n.m. Ebit IFRS (93) 168 261 n.m.
8 9 8 0 2% Net Income from E&P Associates 11 16 6 54%
First HalfQuarter
1 Includes natural gas exported; excludes natural gas used or reinjected. 2 Based on production in Brazil. 3 Includes abandonment provisions and excludes exploration expenditures written-off. 4 Effective from 1 January 2017, exploration expenses written-off are considered as recurring items.
Operations
Second quarter
During the second quarter of 2017, working
interest production of oil and natural gas
averaged 89.9 kboepd, of which 87% was oil.
Production increased 64% YoY, supported by the
development of the Lula/Iracema projects in
Brazil, and particularly to the start-up of FPSO #6
and #7 and to the ramp-up of FPSOs #4 and #5.
On May 17, FPSO #7, the first replicant unit
allocated to the Brazilian pre-salt, started
production in the Lula South area. In Lula
Central, FPSO Cidade de Saquarema (FPSO #6)
reached plateau production in June, 11 months
after coming onstream.
The planned maintenance works in some units in
Brazil impacted production during the period, in
particular the outage at FPSO #3 in Iracema
South and the maintenance works at FPSO #1 in
the Lula Pilot area.
Regarding the replicant unit to be allocated to
the Lula North area (FPSO #8), the topsides’
integration works proceed at COOEC’s shipyard,
in China. As for the hull of the replicant to
develop the Lula Extreme South area (FPSO #9),
it arrived during the quarter at the Brasfels
shipyard and the integration works are
underway.
In Angola, working interest production from BBLT
and TL amounted to 8.0 kbpd, down 17% YoY as

Results second quarter 2017 July 31, 2017
7
production from fields in block 14 continues to
decline. Net entitlement production decreased
13% YoY, helped by the cost-recovery
mechanism established under the
production-sharing contracts.
Galp’s net entitlement production increased 69%
YoY to 88.1 kboepd, following production growth
in Brazil.
First half
During the first half of 2017, working interest
production was 88.9 kboepd, a 60% increase
YoY, which was due to the increase in production
from Brazil, where seven units are already in
production, compared to five units in the
previous year.
Net entitlement production went up 65% YoY to
87.2 kboepd.
Results
Second quarter
Ebitda RCA amounted to €188 m, up €101 m
YoY, mainly on the back of increased production
and higher sale prices of oil and natural gas. The
average sale price was $43.4/boe, compared to
$38.3/boe in the second quarter of 2016.
Production costs increased €25 m YoY to €67 m,
mainly due to the contribution of FPSOs #6 and
#7, which started production in July 2016 and
May 2017, respectively. In unit terms, and on a
net entitlement basis, production costs decreased
by $0.6/boe YoY to $9.2/boe, benefiting from a
higher production dilution effect.
During the second quarter, amortisation and
depreciation charges (including abandonment
provisions) amounted to €103 m, up €41 m YoY,
on the back of increased producing assets in
Brazil. On a net entitlement basis, depreciation
charges decreased from $14.8/boe to $14.2/boe.
In the quarter, a €22 m impairment was made
regarding the relinquishment of exploration
blocks in Portugal. It should be noted that, as of
1 January 2017, exploration expenses written-off
started to be accounted for as recurring items.
RCA Ebit totalled €63 m, up €39 m YoY. IFRS
Ebit stood at €59 m.
First half
During the first half of 2017, RCA Ebitda
amounted to €391 m, up €257 m YoY, benefiting
from higher production and average sale price,
which reached $43.9/boe, compared to
$32.1/boe in the second quarter of 2016.
Production costs increased €44 m YoY to
€125 m, due to the higher number of operating
units in Brazil. In unit terms, and on a net
entitlement basis, production costs decreased
from $9.3/boe the previous year to $8.6/boe.
Amortisation, depreciation charges and
abandonment provisions amounted to €200 m,
up €68 m YoY following higher production. On a
net entitlement basis, unit depreciation charges
were $13.8/boe, against $15.4/boe in the
previous year.
RCA Ebit went up to €169 m, although impacted
by the exploration impairment in Portugal.

Results second quarter 2017 July 31, 2017
8
5. Refining & Marketing
€m (RCA, except otherwise stated)
2Q16 1Q17 2Q17 Var. YoY% Var.
YoY2016 2017 Var. YoY
% Var.
YoY
4.6 5.1 5.7 1.2 26% Galp refining margin (USD/boe) 4.3 5.5 1.1 26%
1.7 1.7 1.6 (0.1) (7%) Refining cash cost1 (USD/boe) 1.8 1.7 (0.2) (10%)
(0.0) (0.0) (0.2) (0.2) n.m.Impact of hedging on refining margin
2
(USD/boe)0.1 (0.1) (0.2) n.m.
26.3 26.1 30.0 3.7 14% Raw materials processed (mmboe) 51.5 56.1 4.6 9%
23.2 22.9 26.7 3.5 15% Crude processed (mmbbl) 47.1 49.6 2.5 5%
4.5 4.4 4.7 0.3 6% Total refined product sales (mton) 8.5 9.1 0.5 6%
2.3 2.1 2.3 0.0 1% Sales to direct clients (mton) 4.4 4.4 (0.0) (1%)
143 187 233 90 63% Ebitda RCA 291 420 129 45%
65 91 89 24 37% Depreciation, Amortisation and Impairments 130 179 50 38%
7 3 (1) (8) n.m. Provisions 12 2 (11) (85%)
71 94 145 74 n.m. Ebit RCA 149 239 90 61%
103 150 96 (7) (7%) Ebit IFRS 56 245 190 n.m.
(0) (2) 8 8 n.m. Net Income from R&M Associates 0 6 6 n.m.
Quarter First Half
1 Excluding impact of refining margin hedging operations. 2 Impact on Ebitda.
Operations
Second quarter
Raw materials processed during the quarter
increased 14% YoY to 30.0 mmboe, with the
previous year impacted by lower benchmark
refining margins and outages at the Matosinhos
refinery. Crude oil accounted for 89% of raw
materials processed, of which 83%
corresponded to medium and heavy crudes.
During the period, 46% of oil products produced
were middle distillates (diesel and jet) and 22%
corresponded to gasoline. Consumption and
losses accounted for 8% of raw materials
processed.
Volumes sold to direct clients stood at 2.3 mton,
in line with the second quarter of 2016. Volumes
sold in Africa rose 22% YoY, accounting for
c.10% of total volumes sold to direct clients.
First half
Raw materials processed during the first half of
2017 increased 9% YoY to 56.1 mmboe, mainly
as a result of the planned outage of the
hydrocracker at the Sines refinery and in several
units in Matosinhos during the previous year.
Crude oil accounted for 88% of raw materials
processed, of which 83% corresponded to
medium and heavy crudes.
Middle distillates accounted for 47% of total
production, while gasoline accounted for 23%.
Consumption and losses stood at 8%.
Volumes sold to direct clients stood in line YoY
at 4.4 mton, despite the decreased exposure to
lower margin activities in Iberia, namely in the
wholesale segment. Volumes sold in Africa
increased 18% and accounted for 10% of total
volumes sold to direct clients.
Results second quarter 2017 July 31, 2017
9
Results
Second quarter
RCA Ebitda of R&M increased €90 m to €233 m,
due to both the performance of the refining and
oil products marketing activities.
Galp’s refining margin stood at $5.7/boe,
compared to $4.6/boe the previous year. The
spread over the benchmark margin was
$1.4/boe, as the Company benefited from the
high availability of the conversion units and
sourcing opportunities.
Refining cash costs stood at €44 m, or $1.6/boe.
The oil products marketing activity was
supported by the economic environment in
Iberia, which boosted demand, namely in the jet
and marine bunkers segments. Activities in
Africa increased their contribution to results.
Depreciation charges and provisions increased
€16 m YoY to €88 m, following the revision of
the useful life of certain refining assets made at
the end of 2016.
RCA Ebit went up to €145 m, while IFRS Ebit
totalled €96 m. The inventory effect was a
negative €48 m.
First half
Ebitda RCA increased €129 m to €420 m,
supported by the market environment and the
operational availability of the refineries.
Galp’s refining margin stood at $5.5/boe,
compared to $4.3/boe the previous year. The
spread to benchmark margin was $1.6/boe, as
the Company benefited mainly from sourcing
opportunities.
Refining cash costs stood at €86 m, in line YoY.
In unit terms, cash costs were $1.7/boe.
The marketing of oil products benefited from the
higher demand in the retail segment and in the
wholesale segment, related to the increased
economic activity.
Depreciation charges and provisions totalled
€181 m, up €39 m YoY.
RCA Ebit was €239 m, while IFRS Ebit increased
to €245 m. The inventory effect was positive by
€12 m.
Results second quarter 2017 July 31, 2017
10
6. Gas & Power €m (RCA except otherwise stated)
2Q16 1Q17 2Q17 Var. YoY% Var.
YoY2016 2017 Var. YoY
% Var.
YoY
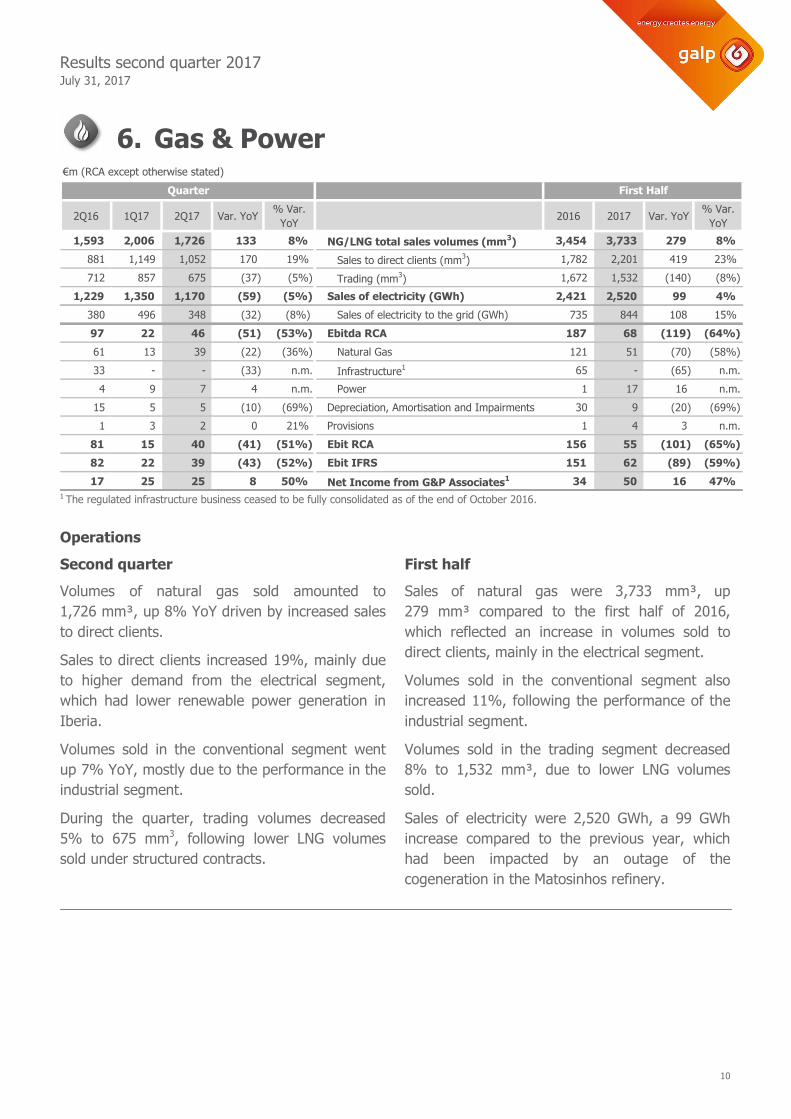
1,593 2,006 1,726 133 8% NG/LNG total sales volumes (mm3) 3,454 3,733 279 8%
881 1,149 1,052 170 19% Sales to direct clients (mm3) 1,782 2,201 419 23%
712 857 675 (37) (5%) Trading (mm3) 1,672 1,532 (140) (8%)
1,229 1,350 1,170 (59) (5%) Sales of electricity (GWh) 2,421 2,520 99 4%
380 496 348 (32) (8%) Sales of electricity to the grid (GWh) 735 844 108 15%
97 22 46 (51) (53%) Ebitda RCA 187 68 (119) (64%)
61 13 39 (22) (36%) Natural Gas 121 51 (70) (58%)
33 - - (33) n.m. Infrastructure1 65 - (65) n.m.
4 9 7 4 n.m. Power 1 17 16 n.m.
15 5 5 (10) (69%) Depreciation, Amortisation and Impairments 30 9 (20) (69%)
1 3 2 0 21% Provisions 1 4 3 n.m.
81 15 40 (41) (51%) Ebit RCA 156 55 (101) (65%)
82 22 39 (43) (52%) Ebit IFRS 151 62 (89) (59%)
17 25 25 8 50% Net Income from G&P Associates1 34 50 16 47%
First HalfQuarter
1 The regulated infrastructure business ceased to be fully consolidated as of the end of October 2016.
Operations
Second quarter
Volumes of natural gas sold amounted to
1,726 mm³, up 8% YoY driven by increased sales
to direct clients.
Sales to direct clients increased 19%, mainly due
to higher demand from the electrical segment,
which had lower renewable power generation in
Iberia.
Volumes sold in the conventional segment went
up 7% YoY, mostly due to the performance in the
industrial segment.
During the quarter, trading volumes decreased
5% to 675 mm3, following lower LNG volumes
sold under structured contracts.
First half
Sales of natural gas were 3,733 mm³, up
279 mm³ compared to the first half of 2016,
which reflected an increase in volumes sold to
direct clients, mainly in the electrical segment.
Volumes sold in the conventional segment also
increased 11%, following the performance of the
industrial segment.
Volumes sold in the trading segment decreased
8% to 1,532 mm³, due to lower LNG volumes
sold.
Sales of electricity were 2,520 GWh, a 99 GWh
increase compared to the previous year, which
had been impacted by an outage of the
cogeneration in the Matosinhos refinery.

Results second quarter 2017 July 31, 2017
11
Results
Second quarter
RCA Ebitda for the G&P business was down
€51 m YoY to €46 m, following the
deconsolidation of the regulated infrastructure
business and the lower contribution from trading
and the gas marketing activity in Iberia. Ebitda
for the natural gas segment decreased €22 m
YoY to €39 m.
Ebitda for the power business rose €4 m YoY to
€7 m, benefiting from the time lag of the natural
gas purchase price and the sale price of energy
produced.
RCA Ebit decreased €41 m to €40 m, while IFRS
Ebit was down to €39 m.
Results from associated companies reached
€25 m, up €8 m YoY, reflecting the contribution
in this caption of the 77.5% stake in Galp Gás
Natural Distribuição S.A (GGND).
First half
Ebitda was €68 m during the first half of 2017,
down €119 m YoY, mainly following lower results
from the natural gas activity and the
deconsolidation of GGND.
Ebitda for the natural gas segment decreased
€70 m YoY to €51 m, due to the lower
contribution of LNG trading and the gas
marketing activity in Iberia, and considering the
negative sourcing impact during the first quarter
of 2017.
Ebitda for the power business was €17 m,
compared to €1 m in the first half of 2016, which
had been impacted by the outage of the
cogeneration unit in the Matosinhos refinery and
by the negative lag of the natural gas purchase
price and the sale price of energy produced.
RCA Ebit decreased €101 m YoY to €55 m. IFRS
Ebit was €62 m, compared to €151 m the
previous year.
Results from associated companies related to the
G&P business reached €50 m, up €16 m YoY.

Results second quarter 2017 July 31, 2017
12
7. Financial data 7.1. Income statement
€m (RCA, except otherwise stated)
2Q16 1Q17 2Q17 Var. YoY% Var.
YoY2016 2017 Var. YoY
% Var.
YoY
3,267 3,844 3,779 512 16% Turnover 6,081 7,623 1,542 25%
(2,554) (2,975) (2,865) 310 12% Cost of goods sold (4,710) (5,840) 1,131 24%
(310) (376) (383) 73 24% Supply & Services (608) (759) 151 25%
(73) (79) (70) (3) (4%) Personnel costs (148) (150) 2 1%
8 6 13 5 58% Other operating revenues (expenses) 16 18 2 13%
337 419 473 136 40% Ebitda RCA 631 892 262 41%
366 485 422 56 15% Ebitda IFRS 530 908 378 71%
(144) (194) (219) 75 53% Depreciation, Amortisation and Impairments (295) (413) 118 40%
(8) (5) (1) (8) (89%) Provisions (13) (6) (7) (54%)
185 220 253 68 37% Ebit RCA 323 473 151 47%
131 286 199 68 52% Ebit IFRS 128 485 357 n.m.
24 32 41 17 69% Net income from associated companies 45 73 27 61%
15 (12) (10) (25) n.m. Financial results 18 (22) (40) n.m.
(28) (21) (19) (9) (32%) Net interests (55) (40) (15) (28%)
25 24 27 2 10% Interest capitalised 46 51 5 11%
(0) (3) (10) (10) n.m. Exchange gain (loss) (7) (13) (7) (96%)
23 (4) (4) (26) n.m. Mark-to-market of hedging derivatives 44 (7) (52) n.m.
(4) (7) (4) (0) 13% Other financial costs/income (9) (12) (3) (27%)
224 241 283 59 26%Net income RCA before taxes and non-
controlling interests386 524 138 36%
(79) (123) (120) 41 52% Taxes¹ (118) (243) 125 n.m.
(12) (18) (12) 0 1% Non-controlling interests (21) (31) 10 47%
133 99 151 18 14% Net income RCA 247 250 3 1%
(98) (18) (17) 82 83% Non recurring items (178) (35) 144 81%
35 81 135 100 n.m. Net income RC 69 215 147 n.m.
31 54 (35) (66) n.m. Inventory effect (61) 18 79 n.m.
66 134 99 34 51% Net income IFRS 8 234 226 n.m.
First HalfQuarter
1 Includes corporate income taxes and taxes payable on oil and gas production.
Second quarter
RCA Ebitda increased 40% YoY to €473 m,
following a higher contribution from E&P and
R&M. IFRS Ebitda rose €56 m to €422 m.
Considering the increase in depreciation and
exploration impairments, RCA Ebit stood at
€253 m. IFRS Ebit rose €68 m to €199 m.
Results from associated companies increased to
€41 m, following the deconsolidation of the
regulated infrastructure business.
Financial results were negative €10 m, down
€25 m YoY, mainly due to a €26 m change in the
mark-to-market of hedging derivatives, mainly
related to refining margin hedging.
RCA taxes increased to €120 m, following the
increase in the Group's operating results. Taxes
on oil and gas production stood at €61 m,
compared to €25 m in the previous year.
RCA net income reached €151 m, while IFRS net
income was €99 m. The inventory effect was

Results second quarter 2017 July 31, 2017
13
negative by €35 m and non-recurring items
amounted to €17 m.
First half
RCA Ebitda was €892 m during the first half of
2017, a 41% increase YoY, due to the enhanced
performance of E&P and R&M. IFRS Ebitda rose
€378 m to €908 m.
Considering the increase in depreciation, namely
in E&P and R&M, RCA Ebit was up to €473 m.
IFRS Ebit was up to €485 m.
Results from associated companies increased to
€73 m.
Financial results were negative €22 m, down
€40 m YoY, mainly due to a €52 m change in
mark-to-market of hedging derivatives, namely
related to refining margin hedging.
RCA taxes reached €243 m, mainly due to higher
results in the E&P business, with taxes on oil and
gas production reaching €130 m.
Non-controlling interests, mainly attributable to
Sinopec's stake in Petrogal Brasil, reached
€31 m.
RCA net income reached €250 m, while IFRS net
income was €234 m. The inventory effect was
€18 m and non-recurring items stood at €35 m.
CESE tax in Portugal had a negative impact on
IFRS results of around €33 m, including €16 m
related to CESE I, whose annual impact is fully
accounted for in the first quarter of the year.
This provision related to CESE results from the
strict applicability of accounting standards.
However, in Galp’s opinion, based on the opinion
of renowned national legal experts, the laws
regarding CESE have no legal grounds and,
accordingly, such amounts are not due.

Results second quarter 2017 July 31, 2017
14
7.2. Capital expenditure
€m
2Q16 1Q17 2Q17 Var. YoY% Var.
YoY2016 2017 Var. YoY
% Var.
YoY
245 209 157 (88) (36%) Exploration & Production 561 366 (195) (35%)
12 17 9 (3) (24%) Exploration and appraisal activities 21 26 4 20%
233 192 148 (85) (36%) Development and production activities 540 340 (200) (37%)
35 16 24 (11) (32%) Refining & Marketing 59 40 (19) (32%)
7 2 2 (4) (62%) Gas & Power 9 4 (5) (56%)
0 0 1 0 n.m. Others 1 1 0 17%
287 227 184 (103) (36%) Capex 630 411 (219) (35%)
First HalfQuarter
Second quarter
Capital expenditure during the quarter amounted
to €184 m, down €103 m YoY, mainly due to the
lesser intensity of drilling activities in Brazil.
Of the total investment, 85% was allocated to
development and production activities in E&P,
namely to the development of block BM-S-11 in
Brazil and block 32 in Angola. Within the
exploration and appraisal activities, it is worth
highlighting the 3D seismic data campaign
ongoing in São Tomé and Príncipe.
Investment in downstream activities (R&M and
G&P) amounted to €26 m, and was allocated to
refining maintenance and energy efficiency, as
well as to the renovation of downstream retail
assets.
First half
Capital expenditure during the first half of 2017
amounted to €411 m, down 35% YoY, mainly
due to the progress in the execution of
Lula/Iracema.
E&P activities accounted for 89% of the total,
with development activities in the BM-S-11 block
accounting for 72% of the investment in E&P.
The €44 m investment in downstream activities
was mainly aimed at refining maintenance
activities, expansion of the downstream network
and customer relationship management (CRM)
programmes.
Results second quarter 2017 July 31, 2017
15
7.3. Cash Flow
Indirect method
€m (IFRS figures)
2Q16 1Q17 2Q17 2016 2017
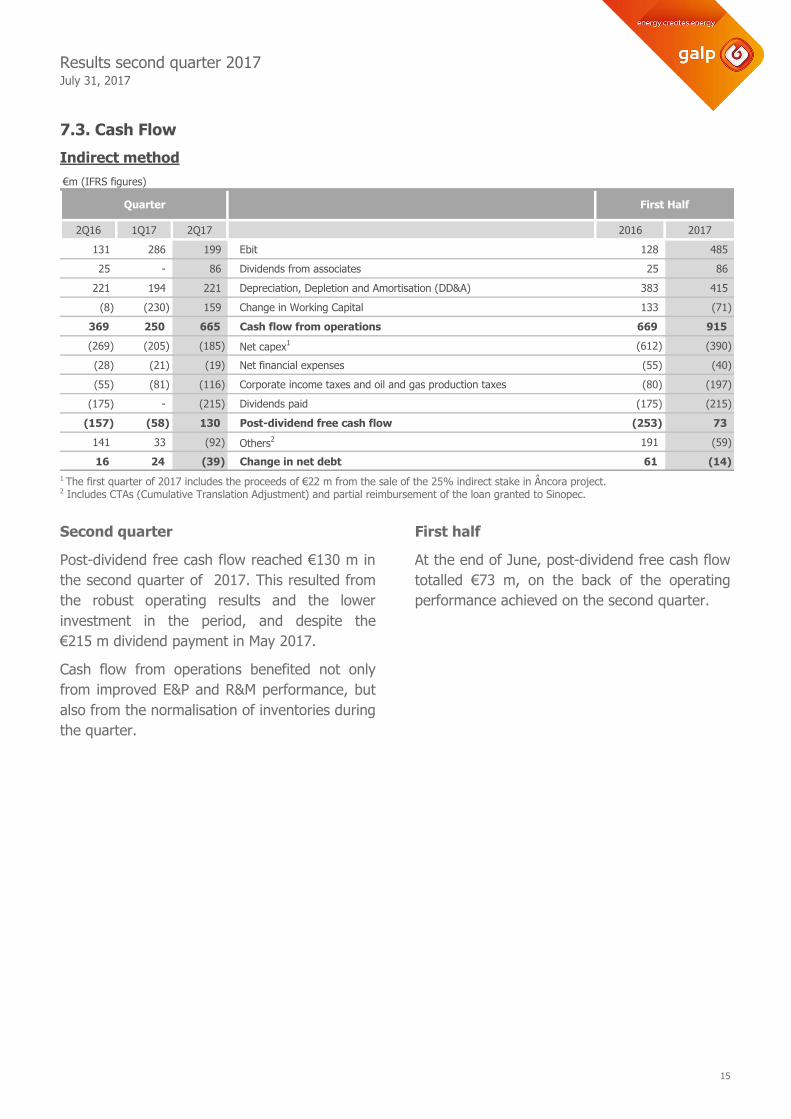
131 286 199 Ebit 128 485
25 - 86 Dividends from associates 25 86
221 194 221 Depreciation, Depletion and Amortisation (DD&A) 383 415
(8) (230) 159 Change in Working Capital 133 (71)
369 250 665 Cash flow from operations 669 915
(269) (205) (185) Net capex1 (612) (390)
(28) (21) (19) Net financial expenses (55) (40)
(55) (81) (116) Corporate income taxes and oil and gas production taxes (80) (197)
(175) - (215) Dividends paid (175) (215)
(157) (58) 130 Post-dividend free cash flow (253) 73
141 33 (92) Others2 191 (59)
16 24 (39) Change in net debt 61 (14)
Quarter First Half
1 The first quarter of 2017 includes the proceeds of €22 m from the sale of the 25% indirect stake in Âncora project. 2 Includes CTAs (Cumulative Translation Adjustment) and partial reimbursement of the loan granted to Sinopec.
Second quarter
Post-dividend free cash flow reached €130 m in
the second quarter of 2017. This resulted from
the robust operating results and the lower
investment in the period, and despite the
€215 m dividend payment in May 2017.
Cash flow from operations benefited not only
from improved E&P and R&M performance, but
also from the normalisation of inventories during
the quarter.
First half
At the end of June, post-dividend free cash flow
totalled €73 m, on the back of the operating
performance achieved on the second quarter.

Results second quarter 2017 July 31, 2017
16
Direct method
€m
2Q16 1Q17 2Q17 2016 2017
954 923 858 Cash and equivalents at the beginning of the period1 1,045 923
3,762 4,363 4,348 Received from customers 7,027 8,711
(2,226) (3,013) (2,543) Paid to suppliers (4,062) (5,556)
(106) (71) (98) Staff related costs (182) (169)
25 - 86 Dividends from associated companies 25 86
(649) (612) (739) Taxes on oil products (ISP) (1,253) (1,352)
(410) (376) (433) VAT, Royalties, PIS, Cofins, Others (790) (808)
395 290 620 Total operating flows 764 912
(273) (238) (150) Net capex2 (652) (367)
(32) (50) (23) Net Financial Expenses (84) (73)
(175) - (215) Dividends paid (175) (215)
(55) (81) (116) SPT and Corporate taxes (80) (197)
(86) (19) 8 Net new loans (130) (32)
66 42 - Sinopec loan reimbursement 134 42
60 (11) (79) FX changes on cash and equivalents 32 (91)
856 858 902 Cash and equivalents at the end of the period1 856 902
Quarter First Half
1 Cash and equivalents differ from the Balance Sheet amounts due to IAS 7 classification rules. The difference refers to overdrafts which are considered as debt in the Balance Sheet and as a deduction to cash in the Cash Flow Statement. 2 The first quarter of 2017 includes the proceeds of €22 m from the sale of the 25% indirect stake in Âncora project.

Results second quarter 2017 July 31, 2017
17
7.4. Financial position and debt
€m (IFRS figures)
31 Dec.,
2016
31 Mar.,
2017
30 Jun.,
2017
Var. vs 31
Dec.,
2016
Var. vs 31
Mar.,
2017
Net fixed assets 7,721 7,901 7,458 (263) (442)
Working capital 512 742 583 71 (159)
Loan to Sinopec 610 561 527 (83) (34)
Other assets (liabilities) (428) (635) (595) (167) 40
Non-current assets/liabilities held for sale (1) - - 1 -
Capital employed 8,414 8,569 7,974 (440) (595)
Short term debt 325 672 808 483 136
Medium-Long term debt 2,578 2,181 2,068 (510) (114)
Total debt 2,903 2,853 2,876 (27) 22
Cash and equivalents 1,032 959 1,020 (13) 61
Net debt 1,870 1,895 1,856 (14) (39)
Total equity 6,543 6,674 6,118 (426) (557)
Total equity and net debt 8,414 8,569 7,974 (440) (595)
On June 30, 2017, net fixed assets stood at
€7,458 m, down €442 m compared to the end of
March as both the US Dollar and the Brazilian
Real depreciated against the Euro during the
second quarter.
Work-in-progress, mainly related to the E&P
business, was €2,460 m at the end of the period. O
Financial debt
€m (except otherwise stated)
31 Dec.,
2016
31 Mar.,
2017
30 Jun.,
2017
Var. vs 31
Dec.,
2016
Var. vs 31
Mar.,
2017
Bonds 1,683 1,684 1,663 19 (21)
Bank loans and other debt 1,220 1,169 1,212 8 43
Cash and equivalents (1,032) (959) (1,020) (13) (61)
Net debt 1,870 1,895 1,856 14 (39)
Net debt including loan to Sinopec1 1,260 1,333 1,329 (68) (5)
Average life (years) 2.6 2.4 2.3 0.3 (0.1)
Average debt interest rate 3.5% 3.5% 3.5% 0.0 p.p. (0.0 p.p.)
Net debt to Ebitda RCA2 1.0x 1.0x 0.9x - -
1 Net debt of €1,329 m adjusted for the €527 m loan to Sinopec. 2 As at 30 June 2017, ratio considers net debt including loan to Sinopec as cash, plus €165 m corresponding Sinopec MLT Shareholder Loan to Petrogal Brasil, and LTM RCA Ebitda of €1,673 m
On June 30, 2017, net debt stood at €1,856 m,
down €39 m compared to the end of the first
quarter.
Considering the €527 m balance of the Sinopec
loan as cash, net debt at the end of the period
totalled €1,329 m, resulting in a net debt to
Ebitda ratio of 0.9x. This ratio also considers
Sinopec’s €165 m shareholder loan to Petrogal
Brasil as of the end of the period.
The average interest rate was 3.48% during the
period.
At the end of June, around 49% of total debt
was on a fixed-rate basis. Debt had an average

Results second quarter 2017 July 31, 2017
18
maturity of 2.28 years, and medium and
long-term debt accounted for 72% of total debt.
At the end of the first half, Galp had unused
credit lines of approximately €1.3 bn. Of this
amount, around 70% was contractually
guaranteed.
Debt maturity profile €m
-
200
400
600
800
2017 2018 2019 2020 2021 2022+
@ 30 jun 2017
@ 31 mar 2017
7.5. RCA turnover by segment €m
2Q16 1Q17 2Q17 Var. YoY% Var.
YoY2016 2017 Var. YoY
% Var.
YoY
3,267 3,844 3,779 512 16% RCA Turnover 6,081 7,623 1,542 25%
165 308 307 142 86% Exploration & Production1 276 615 339 n.m.
2,657 2,869 2,899 242 9% Refining & Marketing 4,809 5,768 959 20%
545 713 614 69 13% Gas & Power 1,221 1,327 106 9%
31 30 33 2 5% Other 59 62 3 5%
(131) (75) (74) 57 43% Consolidation adjustments (284) (149) 135 47%
First HalfQuarter
1 Does not include change in production. RCA turnover in the E&P segment, including change in production, amounted to €322 m during the
second quarter and €653 m during the first half of 2017.

Results second quarter 2017 July 31, 2017
19
7.6. Reconciliation of IFRS and replacement cost adjusted figures
Ebitda by segment
€ m
2017
Ebitda
IFRS
Inventory
effect
Ebitda
RC
Non-
recurring
items
Ebitda
RCA
Ebitda
IFRS
Inventory
effect
Ebitda
RC
Non-
recurring
items
Ebitda
RCA
422 50 472 1 473 Galp 908 (18) 890 3 892
188 - 188 (0) 188 E&P 391 - 391 (0) 391
184 48 232 1 233 R&M 430 (12) 418 3 420
45 1 46 - 46 G&P 74 (6) 68 - 68
6 - 6 (0) 6 Others 12 - 12 (0) 12
Second Quarter First Half
2016
Ebitda
IFRS
Inventory
effect
Ebitda
RC
Non-
recurring
items
Ebitda
RCA
Ebitda
IFRS
Inventory
effect
Ebitda
RC
Non-
recurring
items
Ebitda
RCA
366 (36) 330 7 337 Galp 530 79 609 22 631
82 - 82 5 86 E&P 124 - 124 11 135
177 (38) 139 4 143 R&M 207 71 278 13 291
98 2 100 (2) 97 G&P 181 8 189 (2) 187
10 - 10 0 10 Others 17 - 17 1 18
Second Quarter First Half
€m
Ebit by segment
2017
Ebit
IFRS
Inventory
effect
Ebit
RC
Non-
recurring
items
Ebit
RCA
Ebit
IFRS
Inventory
effect
Ebit
RC
Non-
recurring
items
Ebit
RCA
199 50 249 4 253 Galp 485 (18) 467 6 473
59 - 59 4 63 E&P 168 - 168 2 169
96 48 144 1 145 R&M 245 (12) 233 6 239
39 1 41 (1) 40 G&P 62 (6) 56 (1) 55
5 - 5 (0) 5 Others 10 - 10 (0) 10
Second Quarter First Half
€m
2016
Ebit
IFRS
Inventory
effect
Ebit
RC
Non-
recurring
items
Ebit
RCA
Ebit
IFRS
Inventory
effect
Ebit
RC
Non-
recurring
items
Ebit
RCA
131 (36) 95 90 185 Galp 128 79 207 116 323
(62) - (62) 86 24 E&P (93) - (93) 95 2
103 (38) 65 6 71 R&M 56 71 126 23 149
82 2 84 (3) 81 G&P 151 8 159 (3) 156
9 - 9 0 9 Others 15 - 15 1 16
€m
Second Quarter First Half

Results second quarter 2017 July 31, 2017
20
Non-recurring items
€m
2Q16 1Q17 2Q17 2016 2017
7.0 1.3 1.2 Non-recurring items impacting Ebitda 22.0 2.6
(2.2) 0.0 0.0 Accidents caused by natural events and insurance compensation (2.2) 0.0
(0.2) (0.1) (0.6) Gains/losses on disposal of assets (0.7) (0.7)
0.6 0.1 (0.1) Asset write-offs 0.6 0.0
4.7 - - Employee restructuring charges 9.7 -
4.1 - - Compensation early termination agreement for service and equipment 10.0 -
- 1.4 1.9 Litigation costs 4.5 3.2
82.9 0.4 3.2 Non-recurring items impacting non-cash costs 93.7 3.6
5.4 0.0 1.1 Provisions for environmental charges and others 5.5 1.1
77.4 0.4 2.1 Asset impairments 88.2 2.5
5.3 (17.9) 3.8 Non-recurring items impacting financial results 19.4 (14.1)
5.3 (17.9) 3.8 Gains/losses on financial investments 19.4 (14.1)
3.4 34.2 8.2 Non-recurring items impacting taxes 43.2 42.4
(2.4) (0.9) (0.6) Income taxes on non-recurring items (7.8) (1.5)
5.8 35.2 8.8 Energy sector contribution taxes 51.0 43.9
(0.2) 0.1 0.1 Non-controlling interests (0.2) 0.2
98.4 18.1 16.5 Total non-recurring items 178.1 34.6
Quarter Fist Half

Results second quarter 2017 July 31, 2017
21
7.7. IFRS consolidated income statement € m
2Q16 1Q17 2Q17 2016 2017
3,110 3,684 3,630 Sales 5,751 7,314
157 160 149 Services rendered 329 309
34 28 28 Other operating income 52 56
3,301 3,872 3,807 Total operating income 6,133 7,679
(2,518) (2,908) (2,914) Inventories consumed and sold (4,788) (5,822)
(314) (377) (385) Materials and services consumed (623) (762)
(78) (79) (70) Personnel costs (158) (150)
(25) (23) (15) Other operating costs (34) (37)
(2,935) (3,387) (3,385) Total operating costs (5,603) (6,771)
366 485 422 Ebitda 530 908
(221) (194) (221) Amortisation, depreciation and impairments (383) (415)
(14) (5) (2) Provision and impairment of receivables (19) (7)
131 286 199 Ebit 128 485
19 50 37 Net income from associated companies 26 87
15 (12) (10) Financial results 18 (22)
5 8 7 Interest income 11 15
(33) (29) (26) Interest expenses (67) (55)
25 24 27 Interest capitalised 46 51
(0) (3) (10) Exchange gain (loss) (7) (13)
23 (4) (4) Mark-to-market of hedging derivatives 44 (7)
(4) (7) (4) Other financial costs/income (9) (12)
165 324 226 Income before taxes 172 550
(82) (136) (105) Taxes1 (93) (241)
(6) (35) (9) Energy sector contribution taxes2 (51) (44)
78 153 112 Income before non-controlling interests 29 265
(12) (19) (12) Profit attributable to non-controlling interests (21) (31)
66 134 99 Net income 8 234
Quarter First Half
1 Includes corporate income taxes and taxes payable on oil and gas production, namely Special Participation Tax (Brazil) and IRP (Angola). 2 Includes €16.3 m, €17.0 m and €10.6 m related to the CESE I, CESE II and Fondo Eficiencia Energética, respectively, in the first half of 2017.

Results second quarter 2017 July 31, 2017
22
7.8. Consolidated financial position €m
31 December,
2016
31 March,
2017
30 June,
2017
Assets
Non-current assets
Tangible fixed assets 5,910 6,021 5,693
Goodwill 87 86 85
Other intangible fixed assets 268 266 258
Investments in associates 1,432 1,501 1,391
Investments in other participated companies 3 3 3
Receivables 247 261 246
Deferred tax assets 335 317 339
Financial investments 26 26 31
Total non-current assets 8,307 8,481 8,046
Current assets
Inventories1 869 1,049 894
Trade receivables 1,041 1,077 959
Receivables 556 530 457
Loan to Sinopec 610 561 527
Financial investments 19 13 12
Cash and equivalents 1,033 959 1,020
Sub-total current assets 4,128 4,189 3,869
Non-current assets held for sale 4 - -
Total current assets 4,132 4,189 3,869
Total assets 12,439 12,671 11,915
Equity and liabilities
Equity
Share capital 829 829 829
Share premium 82 82 82
Translation reserve 404 386 41
Other reserves 2,687 2,687 2,687
Hedging reserves 4 5 5
Retained earnings 795 973 776
Profit attributable to equity holders of the parent 179 134 234
Equity attributable to equity holders of the parent 4,980 5,097 4,654
Non-controlling interests 1,563 1,577 1,464
Total equity 6,543 6,674 6,118
Liabilities
Non-current liabilities
Bank loans and overdrafts 912 885 971
Bonds 1,666 1,297 1,097
Other payables2 305 301 297
Retirement and other benefit obligations 359 359 348
Liabilities from financial leases 0 0 0
Deferred tax liabilities 66 69 99
Other financial instruments 1 3 10
Provisions 429 565 558
Total non-current liabilities 3,738 3,479 3,380
Current liabilities
Bank loans and overdrafts 308 284 242
Bonds 17 388 566
Trade payables 850 837 726
Other payables3 884 883 811
Other financial instruments 17 10 18
Income tax payable 75 115 55
Sub-total current liabilities 2,152 2,517 2,418
Non-current liabilities associated with non-current assets held for sale 5 - -
Total current liabilities 2,157 2,517 2,418
Total liabilities 5,896 5,996 5,797
Total equity and liabilities 12,439 12,671 11,915 1 Includes €91 m in inventories from third parties on 30 June 2017. 2 Includes €165 m long-term loan from Sinopec to subsidiary Petrogal Brasil on 30 June 2017. 3 Includes €14 m in advance payments related to inventory from third parties on 30 June 2017.

Results second quarter 2017 July 31, 2017
23
8. Basis of presentation
Galp’s consolidated financial statements have
been prepared in accordance with IFRS, and
subject to limited review. The financial
information in the consolidated income statement
is reported for the quarters ended on 30 June
2017 and 2016, and 31 March 2017. The financial
information in the consolidated financial position
is reported on 30 June 2017 and on 31 December
2016.
Galp’s financial statements are prepared in
accordance with IFRS, and the cost of goods sold
is valued at weighted-average cost. When goods
and commodity prices fluctuate, the use of this
valuation method may cause volatility in results
through gains or losses in inventories, which do
not reflect the Company’s operating performance.
This is called the inventory effect.
Another factor that may affect the Company’s
results, without being an indicator of its true
performance, is the set of non-recurring items,
namely gains or losses on the disposal of assets,
impairments or reinstatements of fixed assets,
and environmental or restructuring charges.
For the purpose of evaluating Galp’s operating
performance, RCA profit measures exclude non-
recurring items and the inventory effect, the latter
because the cost of goods sold and materials
consumed has been calculated according to the
Replacement Cost (RC) valuation method.
Recent changes
Effective on 1 January 2017, exploration expenses
written-off in the E&P business are considered as
recurring items.
Effective on 1 October 2016, the contribution of
the trading activity of oil produced, which was
previously accounted for in the R&M business,
has been accounted for in the E&P business.
During the fourth quarter of 2016, the operating
life of some refining assets was revised,
contributing to an increase in depreciation and
amortisation charges starting from the second
half of 2016.
Results second quarter 2017 July 31, 2017
24
9. Definitions
Benchmark refining margin
The benchmark refining margin is calculated with the following weighting: 45% hydrocracking margin + 42.5%
cracking margin + 7% base oils + 5.5% Aromatics.
Rotterdam hydrocracking margin
45% Rotterdam Hydrocraking margin: -100% Brent dated, +2.2% LPG FOB Seagoing (50% Butane + 50%
Propane), +19.1% EuroBob NWE FOB Bg, +8.7% Naphtha NWE FOB Bg, +8.5% Jet NWE CIF, +45.1% ULSD 10
ppm NWE CIF, +9.0% LSFO 1% FOB Cg; C&L: 7.4%; Terminal rate: $1/ton; Ocean loss: 0.15% over Brent;
Freight 2017: WS Aframax (80 kts) Route Sullom Voe / Rotterdam – Flat $7.66/ton. Yields in % of weight.
Rotterdam cracking margin
42.5% Rotterdam cracking margin: -100% Brent dated, +2.3% LPG FOB Seagoing (50% Butane + 50%
Propane), +25.4% EuroBob NWE FOB Bg, +7.5% Naphtha NWE FOB Bg, +8.5% Jet NWE CIF, +33.3% ULSD 10
ppm NWE CIF, +15.3% LSFO 1% FOB Cg; C&L: 7.7%; Terminal rate: $1/ton; Ocean loss: 0.15% over Brent;
Freight 2017: WS Aframax (80 kts) Route Sullom Voe / Rotterdam – Flat $7.66/ton. Yields in % of weight.
Rotterdam base oils margin
7% Rotterdam Base Oil margin: -100% Arabian Light, +3.5% LGP FOB Seagoing (50% Butane + 50% Propane),
+13% Naphtha NWE FOB Bg, +4.4% Jet NWE CIF, 34% ULSD 10 ppm NWE CIF, +4.5% VGO 1.6% NWE FOB
Cg,+ 14% Base Oils FOB, +26% HSFO 3.5% NWE Bg; Consumptions: -6.8% LSFO 1% CIF NWE Cg; C&L: 7.4%;
Terminal rate: $1/ton; Ocean loss: 0.15% over Arabian Light; Freight 2017: WS Aframax (80 kts) Route Sullom
Voe / Rotterdam – Flat $7.66/ton. Yields in % of weight.
Rotterdam aromatics margin
5.5% Rotterdam aromatics margin: -60% EuroBob NWE FOB Bg, -40% Naphtha NWE FOB Bg, +37% Naphtha
NWE FOB Bg, +16.5% EuroBob NWE FOB Bg, +6.5% Benzene Rotterdam FOB Bg, +18.5% Toluene Rotterdam
FOB Bg, +16.6% Paraxylene Rotterdam FOB Bg, +4.9% Ortoxylene Rotterdam FOB Bg; Consumption: -18%
LSFO 1% CIF NEW. Yields in % of weight.
Replacement cost (RC)
According to this method of valuing inventories, the cost of goods sold is valued at the cost of replacement, i.e.
at the average cost of raw materials on the month when sales materialise irrespective of inventories at the start
or end of the period. The Replacement Cost Method is not accepted by the Portuguese IFRS and is consequently
not adopted for valuing inventories. This method does not reflect the cost of replacing other assets.
Replacement cost adjusted (RCA)
In addition to using the replacement cost method, RCA items exclude non-recurrent events such as capital gains
or losses on the disposal of assets, impairment or reinstatement of fixed assets and environmental or
restructuring charges which may affect the analysis of the Company’s profit and do not reflect its operational
performance.

Results second quarter 2017 July 31, 2017
25
ABBREVIATIONS
APETRO: Associação Portuguesa de Empresas
Petrolíferas (Portuguese association of oil companies)
bbl: barrel of oil
BBLT: Benguela-Belize-Lobito-Tomboco
Bg: Barges
bn: billion
boe: barrels of oil equivalent
CESE: Contribuição Extraordinária sobre o Sector
Energético (Portuguese Extraordinary Energy Sector
Contribution)
Cg: Cargoes
CIF: Costs, Insurance and Freights
CORES: Corporación de Reservas Estratégicas de
Produtos Petrolíferos
COOEC: Offshore Oil Engineering Co. Ltd.
CTA: Cumulative Translation Adjustment
D&P: Development & Production
E&P: Exploration & Production
Ebit Earnings before interest and taxes
Ebitda: Ebit plus depreciation, amortisation and
provisions
EUR/€: Euro
FLNG: floating liquefied natural gas unit
FOB: Free on Board
FPSO: Floating, production, storage and offloading
unit
Galp, Company or Group: Galp Energia, SGPS,
S.A., subsidiaries and participated companies
G&P: Gas & Power
GGND: Galp Gás Natural Distribuição, S.A.
GWh Gigawatt per hour
IAS: International Accounting Standards
IFRS: International Financial Reporting Standards
IRP: Oil income tax (Oil tax payable in Angola)
ISP: Tax on oil products
k: thousand
kboepd: thousands of barrels of oil equivalent per
day
kbpd: thousands of barrels of oil per day
LNG: liquid natural gas
LSFO: low sulphur fuel oil
m: million
mmbbl: millions of barrels
mmboe: millions of barrels of oil equivalent
mmbtu: million British thermal units
mm³: million cubic metres
mton: millions of tonnes
MW: megawatt
NBP: National Balancing Point
NG: natural gas
n.m.: not meaningful
NWE: Northwestern Europe
OPEC: Organisation of Petroleum Exporting Countries
R&M: Refining & Marketing
RC: Replacement Cost
RCA: Replacement Cost Adjusted
T: tonnes
TL: Tômbua-Lândana
USA: United States of America
USD/$: Dollar of the United States of America
VAT: value-added tax
YoY: year-on-year

26
CAUTIONARY STATEMENT
This report has been prepared by Galp Energia SGPS, S.A. (“Galp” or the “Company”) and may be amended and
supplemented.
This report does not constitute or form part of and should not be construed as, an offer to sell or issue or the
solicitation of an offer to buy or otherwise acquire securities of the Company or any of its subsidiaries or affiliates
in any jurisdiction or an inducement to enter into investment activity in any jurisdiction. Neither this report nor any
part thereof, nor the fact of its distribution, shall form the basis of, or be relied on in connection with, any contract
or commitment or investment decision whatsoever in any jurisdiction.
This report may include forward-looking statements. Forward-looking statements are statements other than in
respect of historical facts. The words “believe”, “expect”, “anticipate”, “intends”, “estimate”, “will”, “may”,
"continue”, “should” and similar expressions usually identify forward-looking statements. Forward-looking
statements may include statements regarding: objectives, goals, strategies, outlook and growth prospects; future
plans, events or performance and potential for future growth; liquidity, capital resources and capital expenditures;
economic outlook and industry trends; energy demand and supply; developments of Galp’s markets; the impact of
regulatory initiatives; and the strength of Galp’s competitors.
The forward-looking statements in this report are based upon various assumptions, many of which are based, in
turn, upon further assumptions, including without limitation, management’s examination of historical operating
trends, data contained in the Company’s records and other data available from third parties. Although Galp
believes that these assumptions were reasonable when made, these assumptions are inherently subject to
significant known and unknown risks, uncertainties, contingencies and other important factors which are difficult
or impossible to predict and are beyond its control. No assurance, however, can be given that such expectations
will prove to have been correct. Important factors that may lead to significant differences between the actual
results and the statements of expectations about future events or results include the Company’s business strategy,
industry developments, financial market conditions, uncertainty of the results of future projects and operations,
plans, objectives, expectations and intentions, among others. Such risks, uncertainties, contingencies and other
important factors could cause the actual results of Galp or the industry to differ materially from those results
expressed or implied in this report by such forward-looking statements.
Real future income, both financial and operating; an increase in demand and change to the energy mix; an
increase in production and changes to Galp's portfolio; the amount and various costs of capital, future
distributions; increased resources and recoveries; project plans, timing, costs and capacities; efficiency gains; cost
reductions; integration benefits; ranges and sale of products; production rates; and the impact of technology can
differ substantially due to a number of factors. These factors may include changes in oil or gas prices or other
market conditions affecting the oil, gas, and petrochemical industries; reservoir performance; timely completion of
development projects; war and other political or security disturbances; changes in law or government regulation,
including environmental regulations and political sanctions; the outcome of commercial negotiations; the actions of
competitors and customers; unexpected technological developments; general economic conditions, including the
occurrence and duration of economic recessions; unforeseen technical difficulties; and other factors.
The information, opinions and forward-looking statements contained in this report speak only as at the date of this
report, and are subject to change without notice. Galp and its respective representatives, agents, employees or
advisors do not intend to, and expressly disclaim any duty, undertaking or obligation to, make or disseminate any
supplement, amendment, update or revision to any of the information, opinions or forward-looking statements
contained in this report to reflect any change in events, conditions or circumstances.

27
Galp Energia, SGPS, S.A. Investor Relations:
Pedro Dias, Head
Otelo Ruivo, IRO
Cátia Lopes
João G. Pereira
João P. Pereira
Teresa Rodrigues
Contacts:
Tel: +351 21 724 08 66
Fax: +351 21 724 29 65
Address:
Rua Tomás da Fonseca,
Torre A, 1600-209 Lisboa, Portugal
Website: www.galp.com
Email:[email protected]
Reuters: GALP.LS
Bloomberg: GALP PL