Results Presentation 9M 2015 - · PDF fileResults Presentation 9M 2015 ... 9M 2015 EBIT up by...
29
Herbert K. Haas, CEO Dr. Immo Querner, CFO Results Presentation 9M 2015 12 November 2015
Transcript of Results Presentation 9M 2015 - · PDF fileResults Presentation 9M 2015 ... 9M 2015 EBIT up by...
Herbert K. Haas, CEO Dr. Immo Querner, CFO
Results Presentation 9M 2015 12 November 2015

Results Presentation 9M 2015, 12 November 20152
Agenda
Group HighlightsI
Investments / CapitalIII
SegmentsII
OutlookIV
Appendix
Mid-term Target Matrix
9M 2015 Additional Information

Results Presentation 9M 2015, 12 November 20153
9M 2015 – Operating result improvedI
Adjusted for currency effects, 9M 2015 GWP increased by 6.5%. All segments contributed to this increase, nearly exclusively via organic growth
FY2015 net income outlook of €600-650m reiterated. The board’s dividend proposal will be unaffected by the goodwill impairment and, from today’s perspective, will be based on the adjusted calculation base of €755-805m
FY2016 net income outlook stands at above €700m. This includes already ~€70m of anticipated restructuring costs (after tax) for the Non-Life business in Retail Germany
End of September 2015, shareholders’ equity stood at €8,078m or €31.96 per share. Despite the dividend payment of €316m, goodwill impairment and higher interest rates, this is above the FY2014 level of €7,998m (€31.64 per share)
Inspite of the extraordinary goodwill charge of €155m in the previous quarter, Talanx achieved a Group net income of €488m in 9M 2015 (9M 2014: €530m). The EBIT on Group level of €1,507m in 9M 2015 was even ahead of the 9M 2014 level (€1,444m)
Results Presentation 9M 2015, 12 November 20154
Summary of 9M 2015
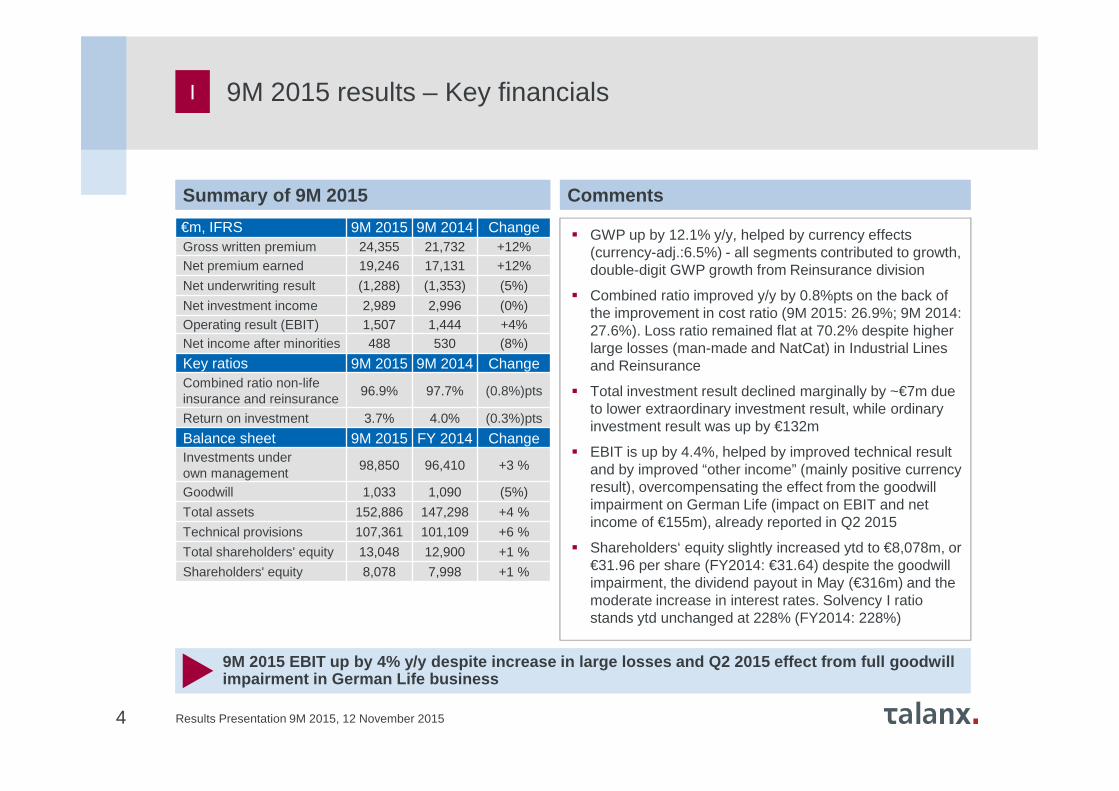
9M 2015 EBIT up by 4% y/y despite increase in large losses and Q2 2015 effect from full goodwill impairment in German Life business
€m, IFRS 9M 2015 9M 2014 ChangeGross written premium 24,355 21,732 +12%Net premium earned 19,246 17,131 +12%
Net underwriting result (1,288) (1,353) (5%)
Net investment income 2,989 2,996 (0%)Operating result (EBIT) 1,507 1,444 +4%Net income after minorities 488 530 (8%)
Key ratios 9M 2015 9M 2014 ChangeCombined ratio non-lifeinsurance and reinsurance
96.9% 97.7% (0.8%)pts
Return on investment 3.7% 4.0% (0.3%)pts
Balance sheet 9M 2015 FY 2014 ChangeInvestments underown management
98,850 96,410 +3 %
Goodwill 1,033 1,090 (5%)
Total assets 152,886 147,298 +4 %
Technical provisions 107,361 101,109 +6 %
Total shareholders' equity 13,048 12,900 +1 %
Shareholders' equity 8,078 7,998 +1 %
I
Comments
� GWP up by 12.1% y/y, helped by currency effects (currency-adj.:6.5%) - all segments contributed to growth, double-digit GWP growth from Reinsurance division
� Combined ratio improved y/y by 0.8%pts on the back of the improvement in cost ratio (9M 2015: 26.9%; 9M 2014: 27.6%). Loss ratio remained flat at 70.2% despite higher large losses (man-made and NatCat) in Industrial Lines and Reinsurance
� Total investment result declined marginally by ~€7m due to lower extraordinary investment result, while ordinary investment result was up by €132m
� EBIT is up by 4.4%, helped by improved technical result and by improved “other income” (mainly positive currency result), overcompensating the effect from the goodwill impairment on German Life (impact on EBIT and net income of €155m), already reported in Q2 2015
� Shareholders‘ equity slightly increased ytd to €8,078m, or€31.96 per share (FY2014: €31.64) despite the goodwillimpairment, the dividend payout in May (€316m) and themoderate increase in interest rates. Solvency I ratiostands ytd unchanged at 228% (FY2014: 228%)
9M 2015 results – Key financials

Results Presentation 9M 2015, 12 November 2015
1 Definition „large loss“: in excess of €10m gross in either Primary Insurance or Reinsurance
Note: 9M 2015 Primary Insurance large losses (net) are split as follows: Industrial Lines: €253.3m; Retail Germany: €20.1m; Retail International: €10.8m, Group Functions: €3.2m
€m, netPrimary
insuranceReinsurance Talanx Group
Storms, Northern Europe Jan./Apr./July 2015 32.7 50.1 82.8
Winterstorm, USA February 2015 0.0 12.8 12.8
Cyclone/Storm, Australia Feb./April 2015 8.3 21.9 30.2
Storm/Flood; USA May/June 2015 0.7 7.0 7.7
Storm „Erika“, Carribean August 2015 0.0 11.1 11.1
Earthquake, Chile September 2015 0.9 43.6 44.5
Total Nat Cat 42.7 146.5 189.2
Aviation 6.3 49.4 55.7
Transport 0.0 77.1 77.1
Fire / Property 208.9 67.6 276.5
Explosion Tianjin Harbour, China 18.3 95.9 114.2
Other 11.2 0.0 11.2
Total other large losses 244.7 289.9 534.7
Total large losses 287.4 436.4 723.9
Impact on Combined Ratio (incurred) 6.2%pts 7.3%pts 6.8 %pts
Total large losses 9M 2014 258.5 242.2 500.7
Impact on Combined Ratio (incurred) 6.1%pts 4.7.%pts 5.4%pts
5
I
� Total large lossburden of €724m (9M 2014: €501m) -slightly below theGroup‘s 9M large loss budget (€737m)
� Q3 net burden of€122m in Primary and €239m in Reinsurance - bothaffected by theTianjin blast (Primary: €18m; Reinsurance: €96m) and a mix of NatCatand man-made losses
� YTD, Reinsuranceremains below its9M 2015 large lossbudget, Primary isabove
Large losses1 in 9M 2015

Results Presentation 9M 2015, 12 November 2015
26.7% 27.7% 28.2% 26.4% 26.0% 27.8% 26.8%
67.7%70.8% 72.0% 72.3% 70.7% 68.6% 71.4%
94.3%98.4% 100.0% 98.5% 96.5% 96.2% 98.0%
Q1 Q2 Q3 Q4 Q1 Q2 Q3
6
Combined ratios
Development of net combined ratio 1 Combined ratio 1 by segment/selected carrier
9M 2015 combined ratios remain well below 100% in m ost of our international retail carriers and in Reinsurance
I
9M 2015 9M 2014 Q3 2015 Q3 2014
Industrial Lines 100.2% 104.7% 103.0% 115.0%
Retail Germany 101.0% 101.7% 100.8% 102.7%
Retail International 96.3% 96.5% 98.5% 98.6%
HDI Seguros S.A., Brazil 98.9% 98.6% 100.5% 100.2%
HDI Seguros S.A., Mexico 92.2% 91.1% 95.0% 90.4%
TUiR Warta S.A., Poland 96.6% 96.7% 98.0% 100.4%
TU Europa S.A., Poland 84.7% 81.5% 85.3% 81.7%
HDI Sigorta A.Ş., Turkey 102.7% 103.6% 102.6% 102.8%
HDI Assicurazioni S.p.A., Italy
95.7% 96.7% 101.6% 99.3%
Non-Life Reinsurance 95.6% 95.3% 95.8% 95.7%Expense ratio Loss ratio
2014 2015
1 Incl. net interest income on funds withheld and contract depositsNote: numbers adjusted on the basis of IAS8

Results Presentation 9M 2015, 12 November 2015
1.8
0.7 0.7 0.8
1.9
0.7 0.8
2.0
1.5 1.51.8
2.1
1.5 1.5
1.2
1.1 1.11.1
1.2
1.2 1.1
2.1
2.0 2.01.8
2.6
2.4 2.3
1.5
1.5 1.71.8
1.8
1.8 2.0
(0.2) (0.2) (0.2) (0.2) (0.2) (0.3) (0.2)
8.4
6.6 6.87.3
9.4
7.3 7.5
Q1 Q2 Q3 Q4 Q1 Q2 Q3
7
GWP trend
GWP development (€bn)
� Q3 2015 showed double-digit top-line growth (+11.4% vs. Q3 2014). Curr.-adj. GWP up 5.0%
� Reinsurance andIndustrial Lines main beneficiariesof currency impact
� Retail International is negativelyimpacted by thedepreciation ofBrazilian Real
� All segments apart from Retail Germany contri-buted to quarterly GWP growth y/y
Q3 2015 with double-digit GWP growth, helped by ove rall currency impact
I
Industrial Lines
Non-Life Reinsurance
Retail Germany
Life/Health Reinsurance
Retail International
Corporate Functions and Consolidation
2014 2015

Results Presentation 9M 2015, 12 November 20158
Summary of Q3 2015
Q3 2015 bottom-line result up by €28m y/y despite s ignificant large loss level
€m, IFRS Q3 2015 Q3 2014 ChangeGross written premium 7,528 6,757 +11%Net premium earned 6,495 5,823 +12%
Net underwriting result (437) (578) n/m
Net investment income 952 1,048 (9%)Operating result (EBIT) 492 439 +12%Net income after minorities 177 149 +19%
Key ratios Q3 2015 Q3 2014 ChangeCombined ratio non-life insurance and reinsurance
98.0% 100.0% (2.0%)pts
Return on investment 3.5% 4.1% (0.6%)pts
Balance sheet 9M 2015 FY 2014 ChangeInvestments under own management
98,850 96,410 +3%
Goodwill 1,033 1,090 (5%)
Total assets 152,886 147,298 +4%
Technical provisions 107,361 101,109 +6%
Total shareholders' equity 13,048 12,900 +1%
Shareholders' equity 8,078 7,998 +1%
I
Comments
� Gross written premium up by 11.4% y/y, helped by currency effects (currency-adj.: +5.0%); all segments apart from Retail Germany contributed to growth
� Combined ratio of 98% improved by 2.0%pts y/y due to improvement in Industrial Lines and Retail Germany. Please note that Q3 2014 in Industrial Lines had been affected by a high large loss burden and a higher reinstatement premium. Remaining segments broadly unchanged in terms of combined ratio
� Improvement in net underwriting result predominantly driven by lower realisation of capital gains in German Life, but also due to improved combined ratio in Industrial Lines - compared to a loss-rich Q3 2014 – and strong profitable growth in Non-Life Reinsurance
� Lower investment income (-€96m) results predominantly from lower extraordinary gains(-€60m), which are mainly used to finance ZZR contribution
Q3 2015 results – Key financials
Results Presentation 9M 2015, 12 November 20159
Agenda
Group HighlightsI
Investments / CapitalIII
SegmentsII
OutlookIV
Appendix
Mid-term Target Matrix
9M 2015 Additional Information

Results Presentation 9M 2015, 12 November 2015
€m, IFRS 9M 2015 9M 2014 ∆ Q3 2015 Q3 2014 ∆
Gross writtenpremium 3,434 3,213 +7% 809 716 +13%
Net premium earned 1,581 1,401 +13% 560 474 +18%
Net underwriting result (4) (66) n/m (17) (72) n/m
Net investment income 158 209 (24%) 45 58 (22%)
Operating result (EBIT) 152 125 +22% 10 (16) n/m
Group net income 103 85 +21% 6 (4) n/m
Return on investment (annualised)
2.8% 4.0% (1.2%)pts 2.3% 3.2% (0.9%)pts
10
P&L for Industrial Lines Comments
II
Underlying operating performance improved vs. a los s-rich Q3 2014
� 9M 2015 GWP grew by 6.9% y/y, backed by currency effects (currency-adj.:+2.7%). In Q3 2015, GWP grew by even 13.0% (+6.8%). Main growth effects from international business (e.g. France, Netherlands, North America)
� Retention rate (9M 2015: 51.4%) slightly up y/y (9M 2014: 50.5%) despite higher fronting business in the US and a lower contribution from high-rentention lines due to a change in portfolio structure (e.g. restructuring Motor)
� Combined ratio in Q3 2015 is affected by large losses of €104m, predominantly from man-made (e.g. from Tianjin blast and general Property) and reinstatement premium (Q3 2015: €25m, 9M 2015: €88m)
� Progress in implementing „Balanced Book“ measures
� Decline in 9M 2015 investment result mainly due to lower realised capital gains
Segments – Industrial Lines
Combined ratio 1
Expense ratio Loss ratio
FY2014: 103%
1Incl. net interest income on funds withheld and contract deposits
9M 2015: 100%
19% 27% 23% 18% 18% 25% 22%
69% 81% 92% 81% 81% 73% 81%
88%109% 115%
99% 99% 99% 103%
Q1 2014 Q2 2014 Q3 2014 Q4 2014 Q1 2015 Q2 2015 Q32015

Results Presentation 9M 2015, 12 November 2015
FY2014: 109%
11
II
CommentsP&L for Retail Germany
Adjusting for the goodwill impairment effect from Q 2 2015, results improved vs. previous year
� GWP in Life up by 1.9% in 9M 2015. Decline in Q3 2015 of 5.7% results from a normalisation effect after front-loaded single-premium business in H1 2015. In Non-Life, improved momentum in GWP in Q3 2015 largely on the back of profitabilisationmeasures in Motor
� Net underwriting result improved on a y/y basis, mainly due to some decline in the investment result. The latter is primarily due to a lower extraordinary investment result, in particular in Q3 2015
� 9M 2015 ZZR allocation – according to HGB – of €362m (Q3 2015: €142m). Total ZZR stock expected to reach €1.55bn until FY2015
� The negative 9M 2015 net income on segment level is explained by the write-down of the complete goodwill (€155m) attributable to the Life business already reported with the 6M 2015 results
Segments – Retail Germany
Combined ratio 1
Expense ratio Loss ratio1Incl. net interest income on funds withheld and contract deposits
€m, IFRS 9M 2015 9M 2014 ∆ Q3 2015 Q3 2014 ∆
Gross written premium 5,143 5,079 +1% 1,475 1,516 (3%)
of which Life 3,864 3,793 +2% 1,185 1,257 (6%)
of which Non-Life 1,279 1,286 (1%) 291 259 +12%
Net premium earned 4,062 3,917 +4% 1,273 1,305 (2%)
Net underwriting result (1,201) (1,264) n/m (361) (456) n/m
of which Life (1,189) (1,247) n/m (357) (447) n/m
of which Non-Life (12) (17) n/m (4) (10) n/m
Net investment income 1,351 1,430 (6%) 403 493 (18%)
Operating result (EBIT) (16) 119 n/m 45 22 +97%
Group net income (73) 72 n/m 31 15 +115%
Return on investment(annualised)
3.9% 4.4% (0.5%)pts 3.4% 4.4% (1.0%)pts
9M 2015: 101%
33% 32% 34% 37% 33% 34% 35%
67% 70% 69% 89% 67% 67% 66%
100% 102% 103% 127% 100% 102% 101%
Q1 2014 Q2 2014 Q3 2014 Q4 2014 Q1 2015 Q2 2015 Q3 2015

Results Presentation 9M 2015, 12 November 201512
II
P&L for Retail International Comments
Sound profitable growth in all Retail International markets overcompensates currency effects
Segments – Retail International
Combined ratio 1
Expense ratio Loss ratio
FY2014: 96%
1Incl. net interest income on funds withheld and contract deposits
€m, IFRS 9M 2015 9M 2014 Change Q3 2015 Q3 2014 Change
Gross written premium 3,463 3,307 +5% 1,071 1,052 +2%
of which Life 1,008 1,162 (13%) 277 336 (17%)
of which Non-Life 2,455 2,144 +14% 793 716 +11%
Net premium earned 2,755 2,820 (2%) 852 908 (6%)
Net underwriting result 1 (6) n/m (18) (20) n/m
of which Life (71) (69) n/m (27) (29) n/m
of which Non-Life 72 62 +16% 10 9 +11%
Net investment income 250 241 +4% 83 85 (3%)
Operating result (EBIT) 174 164 +6% 47 41 +15%
Group net income 106 96 +10% 28 22 +31%
Return on investment (annualised)
4.4% 4.7% (0.3%)pts 4.2% 4.6% (0.4%)pts
9M 2015: 96%
2 Magallanes acquisition is consolidated from 13 February 2015
30% 30% 31% 31% 31% 31% 31%
65% 65% 68% 65% 63% 65% 68%
95% 96% 99% 96% 95% 96% 98%
Q1 2014 Q2 2014 Q3 2014 Q4 2014 Q1 2015 Q2 2015 Q3 2015
� 9M GWP grew by 4.7% y/y (currency-adj.: +6.9%), negatively impacted by currency effects from Brazil and Turkey over the last months. Non-Life currency-adj. +18.6% y/y. Q3 2015 GWP grew by 1.8% y/y (currency-adj.: +4.1%).
� Main growth drivers are businesses in Brazil, Mexico and Turkey (double-digit GWP growth in local terms) and strong Life business at Warta/Poland
� Premium-wise, organic growth (excl. Magallanes acquisition) in P&C business (9M 2015: +6.8%) is partly compensated by decline in single-premium business in Italy and at TU Europa
� Total business in Chile2 contributed ~€198m GWP and ~€6.5m EBIT in 9M 2015, including a negative consolidation effect in Q3 2015
� Combined ratios for 9M and Q3 2015 remained broadly stable despite some uptick in distribution cost from portfolio diversification and some large-loss exposure in Q3 2015 (Chile, fire in Poland)
� Turkey contributed ~€3.7m EBIT to 9M 2015 (Q3 2015: €1.1m)

Results Presentation 9M 2015, 12 November 2015
26% 26% 27% 25% 25% 26% 25%
69% 70% 69% 68% 71% 69% 71%
95% 96% 96% 93% 96% 95% 96%
Q1 2014 Q2 2014 Q3 2014 Q4 2014 Q1 2015 Q2 2015 Q3 2015
€m, IFRS 9M 2015 9M 2014 Change Q3 2015 Q3 2014 Change
Gross written premium 7,319 6,060 +21% 2,347 1,982 +18%
Net premium earned 5,965 5,104 +17% 2,071 1,734 +19%
Net underwriting result 248 224 +11% 81 68 +19%
Net investment income 689 666 +3% 252 254 (1%)
Operating result (EBIT) 975 868 +12% 359 335 +7%
Group net income 320 271 +18% 114 106 +8%
Return on investment (annualised)
3.1% 3.3% (0.2%)pts 3.4% 3.8% (0.4%)pts
FY2014: 95%
13
Segments – Non-Life Reinsurance
Favourable underwriting result in a competitive
II
P&L for Non-Life Reinsurance Comments
� 9M 2015 GWP up by 20.8% y/y (adjusted for currency effects: +9.8%), mainly from US, Asia, Specialty lines and Agro business. Q3 2015 GWP grew by 18.4% y/y (adjusted for currency effects: +7.1%)
� Major losses of €436m (7.3% of net premium earned) below budget of €519m for 9M 2015
� Expected run-off reserves without extraordinary effects
� Increased ordinary investment income despite low yield environment
� Other income & expenses improved due to positive currency effects
� Favorable 9M 2015 EBIT margin2 of 16.3% (9M 2014: 17.0%) well above target
� 9M 2015 net income increased by 18.1%
Combined ratio 1
1Incl. net interest income on funds withheld and contract deposits 2 EBIT margins reflect a Talanx Group viewExpense ratio Loss ratio
9M 2015: 96%

Results Presentation 9M 2015, 12 November 2015
€m, IFRS 9M 2015 9M 2014 Change Q3 2015 Q3 2014 Change
Gross written premium 5,627 4,644 +21% 2,013 1,657 +21%
Net premium earned 4,864 3,861 +26% 1,739 1,392 +25%
Net underwriting result (334) (242) n/m (118) (95) n/m
Net investment income 542 461 +18% 176 162 +9%
Operating result (EBIT) 238 237 +1% 44 85 (48%)
Group net income 84 86 (2%) 15 29 (48%)
Return on investment 4.7% 3.7% +.1.0%pts 4.4% 3.3% +1.1%pts
14
Segments – Life/Health Reinsurance
Attractive premium growth and significantly improve d earnings
II
P&L for Life/Health Reinsurance Comments
� 9M 2015 GWP up by 21.2% (adjusted for currency effects: +10.1%), mainly from Longevity, Emerging Markets, especially China as well as Australia. Q3 2015 grew by 21.5% y/y (adjusted for currency effects: +9.6%)
� 9M net premium earned grew by 14.3% on currency-adjusted basis
� Technical result from US mortality and French branch below expectation
� Improved 9M 2015 net investment income supported by one-off in Q1 2015; €-18.9m effect from ModCo derivatives
� Other income improved to currency effects
� 9M 2015 EBIT margin1 of 4.9% (9M 2014: 6.1%) for the segment. Financial Solutions/Longevity above margin target, Mortality/Morbidity below
EBIT (€m)
1 EBIT margin reflects a Talanx Group view
FY2014: 268 9M 2015: 238
64 88 8532
176
18 44
Q1 2014 Q2 2014 Q3 2014 Q4 2014 Q1 2015 Q2 2015 Q3 2015

Results Presentation 9M 2015, 12 November 201515
Agenda
Group HighlightsI
Investments / CapitalIII
SegmentsII
OutlookIV
Appendix
Mid-term Target Matrix
9M 2015 Additional Information

Results Presentation 9M 2015, 12 November 2015
31%
69%
Euro
Non-Euro
Total: €98.9bn
90%
1%9%
Other
Equities
Fixed incomesecurities
40%
33%
26%
1%
Other
Covered bonds
Corporate bonds
Government bonds
16
Fixed-income-portfolio split Comments
� Investments under own management up by ~3% vs. FY2014 (+5% vs Q3 2014)
� Strong dominance of the investment portfolio by fixed-income securities: Q3 2015: ~90% portfolio share
� Close to 80% of fixed-income portfolio invested in “A” or higher-rated bonds – broadly stable over recent quarters
� 19% of “investments under own management” are held in USD, 31% overall in non-euro currencies
� 50% writedown on bonds of Heta Asset Resolution (netincome effect: ~€4m), alreadyreported in Q1 2015
Investment portfolio as of 30 Sept 2015
Investments – Breakdown of investment portfolioIII
Conservative investment strategy – portfolio remains dominated by fixed-income securities
Breakdown by rating
Breakdown by type
Total: €89.1bn
Asset allocation
Currency split
37%
23%
19%
21%
BBB and below
A
AA
AAA

Results Presentation 9M 2015, 12 November 2015
€m, IFRS 9M 2015 9M 2014 Change Q3 2015 Q3 2014 Change
Ordinary investment income 2,531 2,400 +5% 831 845 (2)%
thereof current investment income from interest 2,176 2,162 +1% 720 724 (1)%
thereof profit/loss from shares in associated companies
8 11 (27)% 2 5 (60)%
Realised net gains/losses on investments
466 477 (2)% 122 173 (29)%
Write-ups/write-downs on investments
(124) (28) n/m (28) (11) n/m
Unrealised net gains/losses on investments
(12) 22 n/m (12) (18) n/m
Investment expenses (159) (153) n/m (56) (51) n/m
Income from investments under own management 2,702 2,718 (1)% 858 937 (9)%
Income from investment contracts 6 7 (14)% 2 5 (60)%
Interest income on funds withheld and contract deposits
281 271 +4% 92 106 (12)%
Total 2,989 2,996 (0)% 952 1,048 (9)%
17
III
9M 2015 ROI reached 3.7% - despite significantly low er realisations in Q3 2015
Net investment income Talanx Group Comments
� Ordinary investment income up by 5% in 9M 2015, benefitting from higher assets under management, structured sourcing of illiquidity spreads, and an one-off payment following a withdrawal from a US transaction in Life & Health Reinsurance (~€40m)1
� Current investment income slightly up y/y in 9M 2015, mainly due to higher asset base and positive currency effects, Q3 2015 slightly affected by lower interest rates
� Realised investment net gains of €466m include realisations in Retail Germany to finance ZZR (allocation according to German GAAP in 9M 2015: €362m of which Q3 2015: €142m)
� Writedowns include a 50% impairment of the bond position in Heta Asset Ressolution (mid double-digit €m amount)1
� Impact from results in reinsurance derivatives in 9M 2015: ModCo: €-19m (9M 2014: €-2m) and inflation swaps: €-14m (€-4m); in Q3 2015: ModCo: €-13m (Q3 2014: €-6m) and inflation swaps: €0m (Q3 2014: €-9m)
Net investment income
1 Already reported in Q1 2015

Results Presentation 9M 2015, 12 November 2015
7.5 7.6 7.9 8.0 8.7 8.0 8.1
4.2 4.3 4.6 4.95.4
4.9 5.0
2.4 2.42.7 2.7
2.7
1.9 1.914.0 14.2
15.2 15.616.8
14.9 15.0
31 Mar 14 30 June 14 30 Sep 14 31 Dec 14 31 Mrz 15 30 Jun 15 30 Sep 15
18
Capital breakdown (€bn)
� End of September 2015, shareholders’ equity stood at €8,078 million or €31.96 per share. Despite the dividend payment in May (€316m), the goodwill writedown on German Life in Q2 2015 (€155m) and somewhat higher interest rates, this is above the FY2014 level of €7,998m (€31.64 per share). Compared to Q2 2015, shareholders’ equity is slightly up by €56m
� Book value per share stands at €31.96 (FY2014: €31.64), while NAV (excl. goodwill) per share is €27.87 (€27.33) end of September 2015
� Neither book value per share nor NAV contain off-balance sheet reserves. These amount to €437m (see next page), or €1.73 per share (shareholder share only). This adds up to an adjusted book value of €33.69 per share
III
Note: Figures adjusted due to IAS8
Shareholders’ equity marginally up by ~€80m vs. FY2 014 and by €56m vs. Q2 2015 by
Shareholders‘ equity Minorities Subordinated liabilities
Equity and capitalisation – Our equity base
Comments

Results Presentation 9M 2015, 12 November 201519
∆ market value vs. book value
III
Off-balance sheet reserves of ~€5.2bn – about €440m (€1.73 per share) attributable to shareholders (net of policyholders, taxes & minorities)
Unrealised gains and losses (off and on balance she et) as of 30 September 2015 (€m)
Equity and capitalisation – Unrealised gains
Note: Differences due to rounding error may occur
31 Dec 14 5,870 175120 93 (363) 5,797 4,779 482 5,262 11,059(98)
5,176
74 203 89 (255) (71)
5,218
3,412
539
3,951
9,169
Loans andreceivables
Held tomaturity
Investmentproperty
Real estateown use
Subordinatedloans
Notespayable and
loans
Off balancesheet
reserves
Available forsale
Other assets On balancesheet
reserves
Totalunrealised
gains (losses)

Results Presentation 9M 2015, 12 November 201520
Agenda
Group HighlightsI
Investments / CapitalIII
SegmentsII
OutlookIV
Appendix
Mid-term Target Matrix
9M 2015 Additional Information

Results Presentation 9M 2015, 12 November 201521
Targets are subject to no large losses exceeding bu dget ( cat ), no turbulences on capital markets ( capital ), and no material currency fluctuations ( currency )
Gross written premium 2 + 1-3%
Return on investment > 3.0%
Group net income 3 €600 - 650m
Return on equity 7-8%
Dividend payout ratio 4 35-45% target range
1 The targets are based on an increased large loss budget of €290m (from €185m in 2014) in Primary Insurance
2 On divisional level, Talanx expects gross written premium growth of +2-5% in Industrial Lines, -5% premium decline in RetailGermany, +4-8% premium growth in Retail International and moderate growth in Reinsurance
3 Taking the impairment loss of goodwill into account, Talanx is expecting a Group net income of between €600m and €650m forFY2015
4 The Board of Management‘s proposed dividend for FY2015 will remain unaffected by the goodwill impairment. From today‘sperspective, it will thus be based on an as-if IFRS net income of between €755m and €805m
V Outlook for Talanx Group 20151

Results Presentation 9M 2015, 12 November 2015
Targets are subject to no large losses exceeding bu dget ( cat ), no turbulences on capital markets ( capital ), and no material currency fluctuations ( currency )
Gross written premium stable
Group net income 2 > €700m
1 The targets are based on an unchanged large loss budget of €290m in Primary Insurance, of which €260m in Industrial Lines. The large loss budget in Reinsurance has been raised to €825m from €690m
2 The outlook contains ~€70m restructuring charges (after tax) for the Non-Life business in Retail Germany in 2016
22
Dividend payout ratio 35-45% target range
V Outlook for Talanx Group 20161

Results Presentation 9M 2015, 12 November 201523
Agenda
Group HighlightsI
Investments / CapitalIII
SegmentsII
OutlookIV
Appendix
Mid-term Target Matrix
9M 2015 Additional Information

Results Presentation 9M 2015, 12 November 2015
Mid-term Target Matrix
1 Organic growth only; currency-neutral2 Risk-free rate is defined as the 5-year rolling average of the 10-year German
government bond yield3 Talanx definition: incl. net interest income on funds withheld and contract deposits
4 EBIT/net premium earned, 5 Reflects Hannover Re target of at least €180m6 Average throughout the cycle; currency-neutral, 7 Targets reflect Hannover Re‘stargets for 2015-2017 strategy cycleNote: growth targets are based on 2014 results. Growth rates, combined ratios andEBIT margins are average annual targets
Group
Primary Insurance
Non-Life Reinsurance 7
Life & Health Reinsurance 7
Segments
Gross premium growth1
Return on equity
Group net income growth
Dividend payout ratio
Return on investment
3 - 5%
≥ 750 bps above risk free2
mid single-digit percentage growth rate
35 - 45%
≥ risk free + (150 to 200) bps2
Key figures Strategic targets (2015 - 2019)
Gross premium growth1
Retention rate
Gross premium growth
Gross premium growth1
Combined ratio3
EBIT margin4
Gross premium growth6
Combined ratio3
EBIT margin4
3 - 5%
60 - 65%
≥ 0%
≥ 10%
~ 96%
~ 6%
3 - 5%
≤ 96%
≥ 10%
Gross premium growth1
Average value of New Business (VNB) after minorities5
EBIT margin4 financing and longevity business
EBIT margin4 mortality and health business
5 - 7%
> € 90m
≥ 2%
≥ 6%
Industrial Lines
Retail Germany
Retail International
24
A

Results Presentation 9M 2015, 12 November 201525
€m, IFRS 9M 2015 9M 2014 Change
P&L
Gross written premium 3,434 3,213 +7%
Net premium earned 1,581 1,401 +13%
Net underwriting result (4) (66) n/m
Net investment income 158 209 (24%)
Operating result (EBIT) 152 125 +22%
Net income after minorities 103 85 +21%
Key ratios
Combined ratio non-life insurance and reinsurance
100.2% 104.7% (4.5%)pts
Return on investment 2.8% 4.0% (1.2%)pts
Industrial Lines
9M 2015 9M 2014 Change
5,143 5,079 +1%
4,062 3,917 +4%
(1,201) (1,264) n/m
1,351 1,430 (6%)
(16) 119 n/m
(73) 72 n/m
101.0% 101.7% (0.7%)pts
3.9% 4.4% (0.5%)pts
9M 2015 9M 2014 Change
3,463 3,307 +5%
2,755 2,820 (2%)
1 (6) n/m
250 241 +4%
173 164 +5%
106 96 +10%
96.3% 96.5% (0.2%)pts
4.4% 4.7% (0.3%)pts
Retail Germany Retail International
Note: Differences due to rounding may occur
9M 2015 Additional Information - SegmentsA

Results Presentation 9M 2015, 12 November 201526
€m, IFRS 9M 2015 9M 2014 Change
P&L
Gross written premium 7,319 6,060 +21%
Net premium earned 5,965 5,105 +17%
Net underwriting result 248 224 +11%
Net investment income 689 666 +3%
Operating result (EBIT) 975 868 +12%
Net income after minorities 320 271 +18%
Key ratios
Combined ratio non-life insurance and reinsurance
95.6% 95.3% 0.3%pts
Return on investment 3.1% 3.3% (0.2%)pts
Note: Differences due to rounding may occur
9M 2015 9M 2014 Change
5,627 4,644 +21%
4,864 3,861 +26%
(334) (242) n/m
542 461 +18%
238 237 0%
84 86 (2%)
--- --- ---
4.7% 3.7% 1.0%pts
9M 2015 9M 2014 Change
24,355 21,732 +12%
19,246 17,131 +12%
(1,288) (1,353) n/m
2,989 2,996 (0%)
1,507 1,444 +4%
488 530 (8%)
96.9% 97.7% (0.8%)pts
3.7% 4.0% (0.3%)pts
Non-Life Reinsurance Life and Health Reinsurance
Group
9M 2015 Additional Information - Segments (continued)A

Results Presentation 9M 2015, 12 November 201527
Retail Germany Retail International
GWP, €m, IFRS 9M 2015 9M 2014 Change
Non-life Insurance 1,279 1,286 (1%)
HDI Versicherung AG 1,172 1,180 (1%)
Life Insurance 3,864 3,793 +2%
HDI Lebensversicherung AG 1,561 1,677 (7%)
neue leben Lebensversicherung AG1 860 699 +23%
TARGO Lebensversicherung AG 764 711 +8%
PB Lebensversicherung AG 585 570 +3%
Total 5,143 5,079 +1%
GWP, €m, IFRS 9M 2015 9M 2014 Change
Non-life Insurance 2,455 2,144 +14%
HDI Seguros S.A., Brazil 663 640 +4%
TUiR Warta S.A.2, Poland 675 621 +9%
TU Europa S.A.3, Poland 116 146 (21%)
HDI Assicurazioni S. p. A., Italy (P&C) 257 246 +4%
HDI Seguros S.A. De C.V., Mexico 189 130 +45%
HDI Sigorta A.Ş., Turkey 169 142 +19%
Life Insurance 1,008 1,162 (13%)
TU Warta Zycie S.A., Poland2 298 196 +52%
TU Europa Zycie, Poland3 123 155 (21%)
Open Life3 15 16 (5%)
HDI Assicurazioni S. p. A., Italy (Life) 320 512 (38%)
Total 3,463 3,307 +5%
9M 2015 Additional Information – GWP of main risk carriersA
1 Talanx ownership 67.5%2 Talanx ownership of 75.74% 3 Talanx ownership 50% + 1 share
Numbers for main carriers represent data entry values, fully consolidated

Results Presentation 9M 2015, 12 November 201528
Q3 2015 Additional Information – Details on GIIPS exposure
Total GIIPS exposure (30 September 2015)
� Total GIIPS exposure incl. private sector assets at ~4.4% of total assets (30.12.2014:~4.8%)
� GIIPS sovereign exposure at 1.8% of total assets (Q3 2014: 1.7%, FY2014: 1.8%)
� Corporate sector fixed income assets down by~€340m to 2.3% (FY 2014: 2.6%) of total assets
� Total unrealised gains down by ~€20m vs. Q3 2014 and ~€100m since FY 2014, mainly due to increase of interest rate levels in Europe until end of September 2015
A
Comments
GIIPS sovereign exposure just slightly up to ~1.8% of total assets
Details on sovereign exposure in €m
Total: €2,464m (amortized cost), €2,748m (fair value)
Total unrealised gain: €283m
€m Government bonds Corporate bonds
GIIPS exposure SovereignSemi-
SovereignFinancial Corporate Covered Other Total
Greece 4 - - - - - 4
Ireland 288 - 32 76 522 363 1,281
Italy 1,624 - 547 625 398 - 3194
Portugal 39 - 4 21 17 - 82
Spain 793 528 208 415 235 - 2,179
Total 2,748 528 791 1,137 1,171 363 6,739
4244
1,455
34
727
4288
1,624
39
793
Greece Ireland Italy Portugal Spain
Amortized cost Fair value

Results Presentation 9M 2015, 12 November 201529
This presentation contains forward-looking statements which are based on certain assumptions, expectations and opinions of the management of Talanx AG (the "Company") or cited from third-party sources. These statements are, therefore, subject to certain known or unknown risks and uncertainties. A variety of factors, many of which are beyond the Company’s control, affect the Company’s business activities, business strategy, results, performance and achievements. Should one or more of these factors or risks or uncertainties materialize, actual results, performance or achievements of the Company may vary materially from those expressed or implied as being expected, anticipated, intended, planned, believed, sought, estimated or projected.in the relevant forward-looking statement.
The Company does not guarantee that the assumptions underlying such forward-looking statements are free from errors nor does theCompany accept any responsibility for the actual occurrence of the forecasted developments. The Company neither intends, nor assumes any obligation, to update or revise these forward-looking statements in light of developments which differ from those anticipated.
Where any information and statistics are quoted from any external source, such information or statistics should not be interpreted as having been adopted or endorsed by the Company as being accurate. Presentations of the company usually contain supplemental financial measures (e.g., return on investment, return on equity, gross/net combined ratios, solvency ratios) which the Company believes to be useful performance measures but which are not recognised as measures under International Financial Reporting Standards, as adopted by the European Union ("IFRS"). Therefore, such measures should be viewed as supplemental to, but not as substitute for, balance sheet, statement of income or cash flow statement data determined in accordance with IFRS. Since not allcompanies define such measures in the same way, the respective measures may not be comparable to similarly-titled measures used by other companies. This presentation is dated as of 12 November 2015. Neither the delivery of this presentation nor any further discussions of the Company with any of the recipients shall, under any circumstances, create any implication that there has been no change in the affairs of the Company since such date. This material is being delivered in conjunction with an oral presentation by the Company and should not be taken out of context.
Disclaimer