Results Presentation 1Q 2013 - Bankia · Results Presentation 1Q 2013 April 2013 1Q 2013 April 2013...
28
Results Presentation 1Q 2013 April 2013 1Q 2013 April 2013
Transcript of Results Presentation 1Q 2013 - Bankia · Results Presentation 1Q 2013 April 2013 1Q 2013 April 2013...

Results Presentation 1Q 2013
April 2013 1Q 2013
April 2013

2 of 28 / April 2013
Disclaimer
This document has been prepared by Bankia, S.A. (“Bankia”) and is presented exclusively for information purposes. It is not a prospectus and does not constitute an offer or recommendation to invest.
This document does not constitute a commitment to subscribe, or an offer to finance, or an offer to sell, or a solicitation of offers to buy securities of Bankia, all of which are subject to internal approval by Bankia.
Bankia does not guarantee the accuracy or completeness of the information contained in this document. The information contained herein has been obtained from sources that Bankia considers reliable, but BANKIA does not represent or warrant that the information is complete or accurate, in particular with respect to data provided by third parties. This document may contain abridged or unaudited information and recipients are invited to consult the public documents and information submitted by Bankia to the financial market supervisory authorities. All opinions and estimates are given as of the date stated in the document and so may be subject to change. The value of any investment may fluctuate as a result of changes in the market. The information in this document is not intended to predict future results and no guarantee is given in that respect.
Distribution of this document in other jurisdictions may be prohibited, and therefore recipients of this document or any persons who may eventually obtain a copy of it are responsible for being aware of and complying with said restrictions. By accepting this document you accept the foregoing restrictions and warnings.
This document does not reveal all the risks or other material factors relating to investments in the securities/transactions of Bankia. Before entering into any transaction, potential investors must ensure that they fully understand the terms of the securities/transactions and the risks inherent in them. This document is not a prospectus for the securities described in it. Potential investors should only subscribe for securities of Bankia on the basis of the information published in the appropriate Bankia prospectus, not on the basis of the information contained in this document.

3 of 28 / April 2013
Contents
1. 1Q 2013 highlights
2. 1Q 2013 results
3. Asset quality and risk management
4. Liquidity and solvency
5. Conclusions

4 of 28 / April 2013
1Q 2013 highlights
Profit generation
FINANCIAL PERFORMANCE
Comfortable liquidity position
RESTRUCTURING PLAN PROGRESS
NPLs stabilisation
Cost reduction
1 2
Organic capital generation
Capital increase in progress
Workforce agreement (ERE)
Branch closure plan accelerated
IT integration completed

5 of 28 / April 2013
1Q 2013 highlights
FINANCIAL PERFORMANCE – BFA GROUP 1
Net profit generation: €213 million in BFA Group
Operating costs reduction: down 11.6% on 4Q 2012 Results
Asset quality
Liquidity and solvency
NPLs and NPL ratio stable
High provision coverage over credit portfolios
LTD ratio and commercial gap unchanged vs. Q4 2012.
Organic capital generation: 57 bps, reaching 9.97% EBA Core Tier 1 pro
forma in BFA Group
6 of 28 / April 2013
1Q 2013 highlights
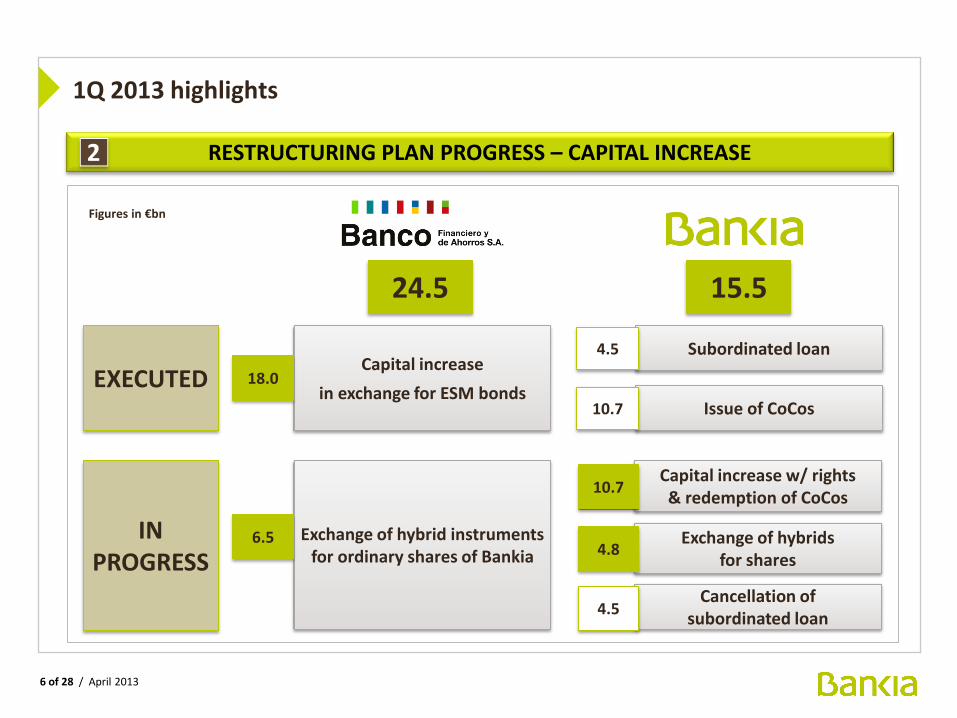
RESTRUCTURING PLAN PROGRESS – CAPITAL INCREASE 2
24.5
EXECUTED Capital increase
in exchange for ESM bonds
IN PROGRESS
18.0
Exchange of hybrid instruments for ordinary shares of Bankia
6.5
Issue of CoCos
Exchange of hybrids for shares
Capital increase w/ rights & redemption of CoCos
Cancellation of subordinated loan
Subordinated loan
15.5
10.7
4.5
10.7
4.5
4.8
Figures in €bn

7 of 28 / April 2013
1Q 2013 highlights
RESTRUCTURING PLAN PROGRESS – CAPITAL INCREASE 2
Reduction of par value from €2 to €0.01
1x100 reverse split
New par value: €1
COMPLETED
€10,700 million
Rights issue in Bankia
Capital increase in Bankia for up to €5,210
(1) million without subscription rights
(exchange of hybrids)
IN PROGRESS
CAPITAL INCREASE FIGURES AVERAGE HAIRCUT ON HYBRIDS EXCHANGE
Shares to be issued (million) 11,762
Subscription price (€)
Maximum amount (€m)
1.3527
15,910
Preferred shares
Perpetual subordinated debt
Dated subordinated debt
38%
36%
13% (1)
(1) Maximum amount of capital increase for exchange. In the baseline scenario the exchange of hybrids will generate €4,841 million of capital and therefore an estimated maximum amount of €15,541 million

8 of 28 / April 2013
1Q 2013 highlights
ESTIMATED TIMELINE (subject to supervision and register of the Issuance Prospectus and Securities Note by the CNMV)
FROB Steering Committee approves agreements for par value reduction, reverse split, capital increase w/ rights and hybrid conversion
16 April
Shares start trading after reverse split 22 April
Expected date for the Prospectus to be registered by CNMV 25/26 April (e)
New shares start trading Last week May(e)
Rights trading period
Senior debt exchange (LT2) offer period
26/28 April – 10/13 May (e)
21/24 May (e) Allotment of shares and exchange of hybrids
RESTRUCTURING PLAN PROGRESS – CAPITAL INCREASE 2
Redemption of CoCos

9 of 28 / April 2013
1Q 2013 highlights
BANKIA GROUP EXPECTED SHAREHOLDERS STRUCTURE
PRE-CAPITAL INCREASE POST-CAPITAL INCREASE AND EXCHANGE (e)
BFA 48%
Free Float 52% BFA
~69%
Free Float ~31%
0
FINAL NO. OF SHARES (MILL.) 11,509
RESTRUCTURING PLAN PROGRESS – CAPITAL INCREASE 2
(1)
(1) Estimate based on €4,841 million of capital generation

10 of 28 / April 2013
1Q 2013 highlights
BRANCH CLOSURES UP TO 1Q 2013
PLANNED CLOSURES BY 2015 1,143
CLOSURES COMPLETED BY 1Q 2013 197
% OF TARGET 17%
Branch closures envisaged in Strategic Plan to be accelerated
Madrid and Valencia networks (60% of total) to be fully restructured by June 2013
All planned closures are expected to have been completed by 1Q 2014
RESTRUCTURING PLAN PROGRESS – FASTER IMPLEMENTATION 2
PLANNED CUMULATIVE CLOSURES
1Q13 2Q13 1Q14
197
607
1,143

11 of 28 / April 2013
Contents
1. 1Q 2013 highlights
2. 1Q 2013 results
3. Asset quality and risk management
4. Liquidity and solvency
5. Conclusions

12 of 28 / April 2013
BFA and Bankia P&L – Key figures
1Q 2013 results
Net interest income
Gross income
Operating expenses
Pre-provision profit
587
1,027
(498)
529
Provisions and other expenses
Profit before tax
(266)
263
Profit after tax 213
Taxes (50)
Dividends
Other revenue
101
339
512
868
(494)
374
(272)
102
72
(30)
1
355
Figures in €m

13 of 28 / April 2013
Bankia pro forma P&L – Key figures
A
B
C
D
Mar 2013
Pro forma income statement excludes €89 million interest expense for the quarter from the subordinated loan granted by BFA to Bankia, to be cancelled after the capital increase.
1Q 2013 results
Bankia Group data. €m
Net interest income
Gross income
Operating expenses
Pre-provision profit
601
957
(494)
463
Provisions and other expenses
Profit before tax
(272)
191 E
14 of 28 / April 2013
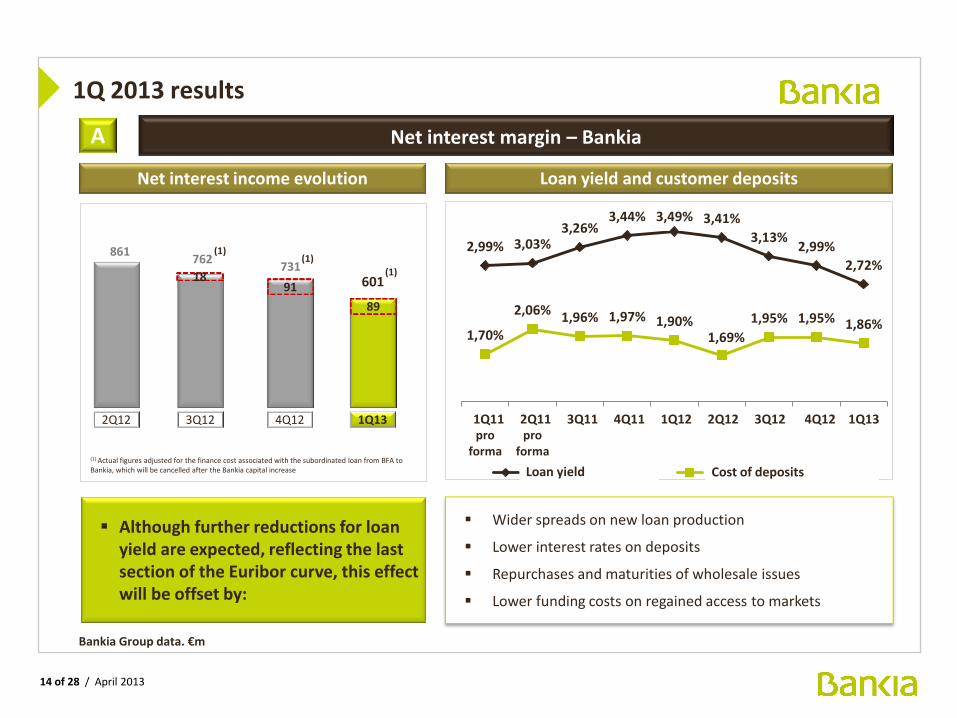
Net interest margin – Bankia
Bankia Group data. €m
Net interest income evolution
2Q12 3Q12 4Q12 1Q13
Although further reductions for loan yield are expected, reflecting the last section of the Euribor curve, this effect will be offset by:
18 91
861 762
731 601
89
1Q 2013 results
(1) Actual figures adjusted for the finance cost associated with the subordinated loan from BFA to Bankia, which will be cancelled after the Bankia capital increase
A
Loan yield and customer deposits
Wider spreads on new loan production
Lower interest rates on deposits
Repurchases and maturities of wholesale issues
Lower funding costs on regained access to markets
(1) (1)
(1)
2,99% 3,03% 3,26%
3,44% 3,49% 3,41%
3,13% 2,99%
2,72%
1,70%
2,06% 1,96% 1,97% 1,90% 1,69%
1,95% 1,95% 1,86%
1T 2011pro
forma
2T 2011pro
forma
3T 2011 4T 2011 1T 2012 2T 2012 3T 2012 4T 2012 1T 2013
Rendimiento créditos Coste depósitos de clientes Loan yield Cost of deposits
1Q11 2Q11 3Q11 4Q11 1Q12 2Q12 3Q12 4Q12 1Q13

15 of 28 / April 2013
Net interest margin – Bankia A
Non-developer SMEs and
corporates
1Q13
4.00
Spreads on new production
+32 bps
Third-party mortgages
Loans and advances to customers Customer deposits
Wider LOAN SPREADS
1Q 2013 results
NEW PRODUCTION
Lower DEPOSIT INTEREST
RATES
2012
3.68
1Q13
2.81
+66 bps
2012
2.15
Sight deposits
1Q13
0.34
-9 bps
2012
0.43
Time deposits
1Q13 2012
2.43
-46 bps
2.89
IMPROVEMENT IN SPREADS
Bankia Group data. bps

16 of 28 / April 2013
Gross Income in 1Q 2013 reflects the low interest rate environment and slowdown in banking activity
Gross income – Bankia
Composition and growth of Gross Income
B
Bankia Group data. €m
1Q 2013 results
(1) Actual figures adjusted for the funding cost associated with the subordinated loan from BFA to Bankia, which will be cancelled after Bankia’s capital increase
GROSS INCOME 1Q 2013
957 (1)
1,020
GROSS INCOME 2Q 2012
884 (1)
GROSS INCOME 3Q 2012
904 (1)
GROSS INCOME 4Q 2012
601 (1)
Net interest income
225
161
16 (45)
Net fees Trading
income & exch. diffs.
Dividends and eq. method
Other
(DGF)
GROSS INCOME 1Q 2013
957 (1)
89

17 of 28 / April 2013
Operating expenses – Bankia
Quarterly operating expenses evolution
C
Despite the fall in interest income, cost reduction has kept the basic cost-to-income ratio down (1)
Q2 2012
592
1Q 2013
494
Bankia Group data. €m
1Q 2013 results
Q4 2012
553
Q3 2012
560 - 10.7%
(1) Cost-to-income ratio excluding trading income and exchange differences
Q2 2012 1Q 2013 Q4 2012 Q3 2012
59.5%
62.1% 63.3% 62.1%
Operating expenses/Gross income (ex tr. income)

18 of 28 / April 2013
1Q 2013 results
Pre-provision profit D
Bankia Group data. €m
2Q12 3Q12 4Q12 1Q13
428 324 351 463
Pre-provision profit up compared to three previous quarters
(1) (1)
(1) Actual figures adjusted for the funding cost associated with the subordinated loan from BFA to Bankia, which will be cancelled after Bankia’s capital increase
18 91
89
306 260
374
(1)

19 of 28 / April 2013
Profit before tax
Pre-provision profit
Financial asset impairment and provisions
Non-financial asset impairment
463 (1)
-218
-3
Provision for real estate assets -51
1Q 2013
1Q 2013 results
Profit/(loss) before tax 191
(1) Including €89m of net interest income due to the impact of the subordinated loan
E
Risk management covered and financeable by pre-provision profit
Bankia Group data. €m

20 of 28 / April 2013
Contents
1. 1Q 2013 highlights
2. 1Q 2013 results
3. Asset quality and risk management
4. Liquidity and solvency
5. Conclusions

21 of 28 / April 2013
Asset quality and risk management
Portfolios
Retail
Corporates and SMEs
87.6
43.0
Gross amount
Developers 4.8
Credit quality
Bankia Group data. €bn
Total loan portfolio 145.8
Provisions as % gross loans
3.3%
14.8%
44.8%
8.0%
High portfolio coverage ratios maintained
Dec 2012
Loans and coverage ratios on loan portfolios
86.4
41.8
Gross amount
4.8
142.6
Mar 2013
Provisions as % gross loans
3.2%
15.0%
46.7%
8.1%
Total without developers 141.0 6.7% 137.8 6.7%

22 of 28 / April 2013
Asset quality and risk management
Credit quality
Bankia Group data. €bn
Dec 2012
Total gross assets 152.5
NPLs 19.8
NPL ratio
NPL coverage
13.0%
61.8%
Stable NPL ratio and coverage
NPLs and coverage NPLs evolution
Mar 2013
149.6
19.6
13.1%
61.9%
NPLs Dec 2012
+ Gross additions
- Recoveries
19.8
- Written-off
NPLs 1Q 2013
+ 0.7
- 0.8
-0.1
19.6
Net additions - 0.1

23 of 28 / April 2013
Contents
1. 1Q 2013 highlights
2. 1Q 2013 results
3. Asset quality and risk management
4. Liquidity and solvency
5. Conclusions

24 of 28 / April 2013
Main liquidity indicators - Bankia
Commercial gap
LTD stable around 120%
Liquidity and solvency
Commercial gap: Net credit – mediation loans – retail commercial paper – strict customer deposits
LTD ratio: (Net credit / (retail commercial paper + strict customer deposits + ICO/EIB deposits + single-certificate covered bonds))
2Q 2012
60.2
1Q 2013
32.8
4Q 2012
33.3
3Q 2012
60.4
Bankia Group data. €bn
Transfer of deposits to investment funds seeking higher returns
Acceleration of branch closures
Change in policy on deposit interest rates
Continued reduction in the Commercial gap in the following context:

25 of 28 / April 2013
Liquidity and solvency
Organic capital generation
Self-sustaining capital generation
Bankia Group – EBA CORE TIER 1
5.67%
9.44% 10.3
BFA Group – EBA CORE TIER 1
DEC 2012
+ 19 bps
MAR 2013
+ 38 bps 9.40% 9.97%
Actual December 2012
Capital increase(1)
Generated organically
+ 7 bps + 36 bps 9.63%
10.06%
DEC 2012 MAR 2013 ↑Prof. ↓RWAs ↑Prof. ↓RWAs
3.52 %
5.88%
3.52 %
5.88%
0,57%
4.94 %
4.69%
4.94 %
4.69%
0.43%
(1) Estimate based on €4,841 million of exchange of hybrid instruments into new Bankia shares

26 of 28 / April 2013
Contents
1. 1Q 2013 highlights
2. 1Q 2013 results
3. Asset quality and risk management
4. Liquidity and solvency
5. Conclusions

27 of 28 / April 2013
Conclusions
Income statement getting “back to normality”
1
3
4
Pressure on net interest income (as we expected)
2
Intensive Group restructuring: process completed in 4 quarters
Pricing and business policies focused on margin and fee management
Reinforced NPL monitoring and management

Results Presentation 1Q 2013
April 2013 1Q 2013
April 2013