RESULTS OF THE U.S. GEOLOGICAL SURVEY'S ANALYTICAL EVALUATION … · 2018. 8. 23. · results of...
110
RESULTS OF THE U.S. GEOLOGICAL SURVEY'S ANALYTICAL EVALUATION PROGRAM FOR STANDARD REFERENCE SAMPLES DISTRIBUTED IN OCTOBER 1999 U.S. GEOLOGICAL SURVEY Open-File Report 00-227
Transcript of RESULTS OF THE U.S. GEOLOGICAL SURVEY'S ANALYTICAL EVALUATION … · 2018. 8. 23. · results of...

RESULTS OF THE U.S. GEOLOGICAL SURVEY'S ANALYTICAL EVALUATION PROGRAM FOR STANDARD REFERENCE SAMPLES
DISTRIBUTED IN OCTOBER 1999
U.S. GEOLOGICAL SURVEY Open-File Report 00-227

RESULTS OF THE U.S. GEOLOGICAL SURVEY'S ANALYTICAL EVALUATION PROGRAM FOR STANDARD REFERENCE SAMPLES
DISTRIBUTED IN OCTOBER 1999
By Jerry W. Farrar U.S. GEOLOGICAL SURVEY Open-File Report 00-227
Lakewood, Colorado 1999

DEPARTMENT OF THE INTERIOR
BRUCE BABBITT, Secretary
U.S. GEOLOGICAL SURVEY
Charles G. Groat, Director
For additional information Copies of this report can be write to: purchased from: Chief, Branch of Quality Systems U.S. Geological Survey U.S. Geological Survey Branch of Information Services Box 25046, Mail Stop 401 Box 25286 Denver Federal Center Denver, Colorado 80225-0286 Denver, Colorado 80225-0046

1
RESULTS OF THE U.S. GEOLOGICAL SURVEY'S ANALYTICAL EVALUATION PROGRAM FOR STANDARD REFERENCE SAMPLES
DISTRIBUTED IN OCTOBER 1999
By Jerry W. Farrar
ABSTRACT
This report presents the results of the U.S. Geological Survey's analytical evaluation program for six standard reference samples -- T-159 (trace constituents), M-152 (major constituents), N-63 (nutrient constituents), N-64 (nutrient constituents), P-33 (low ionic strength constituents), and Hg-29 (mercury) -- that were distributed in October 1999 to 149 laboratories enrolled in the U.S. Geological Survey sponsored interlaboratory testing program. Analytical data that were received from 131 of the laboratories were evaluated with respect to overall laboratory performance and relative laboratory performance for each analyte in the six reference samples. Results of these evaluations are presented in tabular form. Also presented are tables and graphs summarizing the analytical data provided by each laboratory for each analyte in the six standard reference samples. The most probable value for each analyte was determined using nonparametric statistics.
INTRODUCTION
The U.S. Geological Survey (USGS) conducts an interlaboratory analytical evaluation program semiannually. This program provides a variety of standard reference samples (SRSs) to accomplish quality assurance testing of laboratories and to provide an adequate supply of samples that contribute to quality control programs of participating laboratories. Natural-matrix reference materials are preferred for use in this interlaboratory evaluation program. A series of samples are prepared and distributed each spring and fall. The program began in 1962 with a single sample containing major constituents that was prepared from distilled water and reagent grade chemicals. Twenty-three USGS laboratories participated in the first analytical evaluation program. Since that time, objectives of the program have been to: (1) evaluate and improve the performance of USGS and other participating laboratories; (2) provide a library of carefully prepared, homogeneous, stable reference materials for use in the quality control programs of laboratories; (3) identify analytical problem areas; (4) identify quality assurance needs with respect to environmental analyses and develop new reference materials to meet these needs; and (5) evaluate the accuracy and precision of analytical methods.

2
A total of 195 USGS and non-USGS laboratories are enrolled in the program, which can currently provide 9 different types of SRSs:
1. Trace constituents. 2. Major constituents. 3. Nutrient constituents. 4. Low ionic-strength constituents. 5. Mercury. 6. Whole water (water with suspended sediment). 7. Acid mine water constituents. 8. Ground-water trace constituents. 9. Ground-water major constituents.
Though this is not a laboratory certification program, participation in this continuing quality assurance program is mandatory for all laboratories providing water-quality data for USGS sponsored reports or storage in the USGS national data bases. Federal, State, Municipal, and University laboratories can participate even though they do not provide data to the USGS. The results from this study can be used to alert participating laboratories of possible deficiencies in their analytical operations and provide reference materials for laboratory quality-control programs. Participating laboratories are identified only by a confidential laboratory code number.
A library of SRSs, from previous evaluations, is available. USGS offices and participating laboratories can request these SRSs for further testing, continuing quality assurance, and quality-control programs by contacting: U.S. Geological Survey Branch of Quality Systems Denver Federal Center, Bldg. 53 P. O. Box 25046 MS 401 Denver, Colorado 80225-0046 (303) 236-1876
This report summarizes the analytical results submitted by 131 of the 149 laboratories that requested and were shipped SRSs for the October 1999 evaluation (table 1). Not all SRSs are requested or necessarily analyzed by all the laboratories; nor do all laboratories enrolled in the program participate in each evaluation. Analytical results for the following, which were mailed the week of October 5, 1999, are presented in this report. T-159 Trace constituents N-64 Nutrient constituents M-152 Major constituents P-33 Low ionic strength constituents N-63 Nutrient constituents Hg-29 Mercury The USGS requested that analytical results be returned by November 14, 1999 for evaluation and preparation of this report. Laboratories that are providing analytical services to USGS offices are requested to analyze the appropriate SRSs for the same analytes requested by the USGS offices. All laboratories are requested to include the analytical methods used to determine the concentration of each analyte. When analytical method information was provided, it has been included in tables 11 - 16.

3
Table 1.-Laboratory participants in the analyses of standard reference samples distributed in October 1999 State City Participating Laboratory Alabama Tuscaloosa Geological Survey of Alabama Alaska Soldotna Alaska Department of Fish and Game Arkansas Arkadelphia Ouachita Baptist University, Department of Biology Fayetteville University of Arkansas, Arkansas Water Resources Center Little Rock Arkansas Department of Pollution Control and Ecology California Davis University of California, Davis, Division of Environmental Studies Los Angeles Metropolitan Water District, Water Quality Laboratory Martinez Central Contra Costa Sanitary District Menlo Park U.S. Geological Survey, Branch of Regional Research, Western Region Oakland East Bay Municipal Utility District San Diego U.S. Geological Survey, Water Resources Division Santa Fe Springs West Coast Analytical Service, Inc. Tahoe City Tahoe Research Group Three Rivers U.S. Geological Survey, Sequoia Field Station West Sacremento California Department of Water Resources Colorado Alamosa Bureau of Reclamation Arvada Quanterra Environmental Services Aurora Core Laboratories, Inc. Boulder U.S. Geological Survey, Branch of Regional Research, Central Region Boulder U.S. Geological Survey, Branch of Regional Research, Aqueous Crystal Growth Colorado Springs City of Colorado Springs, Environmental Quality Laboratory Denver Metro Wastewater Reclamation Denver U.S.Geological Survey, Mineral Resources Chemistry Project Denver U.S.Geological Survey, Earth Science Investment Program Denver U.S. Geological Survey, National Water Quality Laboratory Fort Collins City of Fort Collins - Water Quality Fort Collins U.S. Department of Agriculture, Forest Service Greeley Central Colorado Water Conservatory District Loveland Northern Colorado Water Conservation Northglenn Northglenn Waste Water Treatment Plant Pueblo City of Pueblo Waste Water Treatment Plant Westminster City of Westminster, Semper Water Treatment Plant Florida Bradenton Manatee County Environmental Management Brooksville Southwest Florida Water Management District Ocala U.S. Geological Survey, Water Resources Division, Quality Water Service Unit Orlando Post, Buckley, Schuh, and Jernigan, Inc. Ormond Beach Environmental Laboratory Tallahassee City of Tallahassee, Water Quality Division Tallahassee Florida Department of Environmental Protection Tallahassee Savannah Laboratories and Environmental Services Tampa Hillsborough County Environmental Protection Commission West Palm Beach South Florida Water Management District Georgia Athens University of Georgia Atlanta U.S. Geological Survey, Water Resources Division Marietta Cobb County Water System Stone Mountain Dekalb County Public Works Department Hawaii Honolulu University of Hawaii, SOEST Analytical Services Idaho Boise U.S. Bureau of Reclamation, Pacific Northwest Regional Laboratory Boise Boise City Water Quality Laboratory Illinois Champaign Illinois Environmental Protection Agency

4
Table 1-Laboratory participants in the analyses of standard reference samples distributed in October 1999 --continued State City Participating Laboratory ______ _ Iowa Des Moines University of Iowa Hygienic Laboratory, Des Moines Branch Kansas Lawrence Kansas Geological Survey Wichita City of Wichita, Water and Sewer Department Kentucky Frankfort Division of Environmental Studies Lexington Kentucky Geological Survey Maine Orono University of Maine, Environmental Chemistry Laboratory Maryland Baltimore Maryland Department of Health and Mental Hygiene Cambridge University of Maryland,Horn Point Laboratory Ft. Meade District of Columbia Department of Health Solomons University of Maryland, Chesapeake Biology Laboratory Michigan Detroit Detroit Water and Sewerage Department, Analytical Laboratory Minnesota Minneapolis University of Minnesota, Department of Geology and Geophysics St. Paul Metropolitan Council Environmental Services St. Paul University of Minnesota, Department of Soil Science Missouri Jefferson City Missouri Department of Health Montana Butte Montana Bureau of Mines & Geology Helena State of Montana, Laboratory Services Bureau Jefferson City Montana Tunnels Laboratory Nebraska McCook Olsen Laboratory Nevada Las Vegas University of Nevada, Las Vegas Reno Desert Research Institute Reno Truckee Meadows Water Reclamation New Jersey Trenton Suffolk CountyWater Authority New York Bolton Landing Darrin Freshwater Institute Brewster New York City Department of Environmental Protection, Brewster Laboratory Buffalo Erie County Public Health Laboratory Grahamsville New York City Department of Environmental Protection, Grahamsville Laboratory Hempstead Nassau County Department of Health Milbrook Institute of Ecosystem Studies North Babylon EcoTest Laboratories Rochester Monroe County Department of Health Rochester Columbia Analytical Services Shokan New York City Department of Environmental Protection, Ben Nessin Laboratory Syracuse Onondaga County DDS Syracuse State University of New York, College of Environmental Science and Forestry Troy U.S. Geological Survey, Water Resources Division Troy Rensselar Polytechnic Institute Valhalla New York City Department of Environmental Protection, Kensico Laboratory Yorktown New York City Department of Environmental Protection, Croton Gatehouse Lab North Carolina Chapel Hill City of Durham Water Resources Department Charlotte Mecklenburg County Department of Environmental Protection Durham Duke University Rocky Mount Tar River Regional Wastewater Treatment Facility North Dakota Bismarck North Dakota Department of Health, East Laboratory Bismarck North Dakota State Water Commission Ohio Cincinnati U.S. Environmental Protection Agency Cincinnati U.S. Environmental Protection Agency, NERL Columbus City of Columbus Cuyahoga Heights Northeast Ohio Regional Sewer District Tiffin Heidelberg College Wooster Ohio State University, Ohio Agricultural Research and Developmental Center Oklahoma Norman Oklahoma Geological Survey Oregon Corvallis U.S. Department of Agriculture, Forestry Services Laboratory Hillsboro Unified Sewerage Agency of Washington County

5
Table 1-Laboratory participants in the analyses of standard reference samples distributed in October 1999 --continued State City Participating Laboratory ______ _ Pennsylvania Harrisburg Pennsylvania Department of Environmental Protection Somerset Geochemical Testing, Energy Center, Inc. South Carolina Cayce Shealy Environmental Services Charleston College of Charleston-Department of Geology South Dakota Brookings Water Resources Institute-South Dakota State University Tennesse Knoxville University of Tennesse Texas College Station Albion Environmental College Station Intermountain Labs Laredo City of Laredo Virginia Chesapeak City of Chesapeake Lorton Fairfax Co. System Engineering and Monitoring Division Norfolk Old Dominion University-Applied Marine Research Richmond Division Consolidated Lab Service Vermont Waterbury Vermont Agency of Natural Resources Washington Richland Battelle Pacific Northwest Wisconsin Madison Wisconsin State Lab of Hygiene Madison Madison Department of Public Health Middleton U.S. Geological Survey Wyoming Laramie Wyoming Department of Public Health
Middle East Laboratories Location Participating Laboratory Gaza Islamic University of Gaza, Water & Environment Research Center Ministry of Agriculture Laboratory Israel Israeli Hydrologic Service Laboratory Geological Survey of Israel Laboratory Mekeroth Water Company, Eylat Laboratory Public Health Laboratory Beer Shiva Public Health Lab, Tel-Aviv Water Resources Research Center, Institute for Desert Research Jordan Royal Scientific Society, Environmental Research Centre Water Authority of Jordan West Bank Al-Quds University, College of Science and Technology, Water Research Center Bethlehem University, Water and Soil Environmental Research Unit Birzeit University, Center for Environmental & Occupational Health Sciences Birzeit University, Gaza Branch Najah University, Water & Environmental Studies Center Palestinian Water Authority Laboratory

6
PREPARATION OF STANDARD REFERENCE SAMPLES All of the SRSs used in this evaluation were prepared by USGS personnel located in Lakewood, Colorado, and were analyzed for analyte concentrations and physical property values before mailing. A library of these SRSs is maintained, and these SRSs can be requested by participating laboratories and USGS offices for use in their quality-control programs. Trace constituents sample T-159 was prepared using water collected from the Big Thompson River near Drake, Colorado. The water was pumped through 0.45-, 0.2-, and 0.1-micrometer (µm) filters, in series, into a 1200-liter (L) polypropylene drum. The water was continuously circulated and passed through a 0.1-µm filter and ultraviolet sterilizer for 24 hours. Following this circulation, the water was acidified to pH 1.5 with nitric acid and chlorinated to 5 parts per million (ppm) free chlorine with sodium hypochlorite. The trace constituent concentrations were adjusted by adding reagent grade chemicals. The sample was circulated an additional 24 hours prior to bottling. During bottling, the sample was pumped through an ultraviolet sterilizer and a 0.1- µm filter. The polypropylene and fluorinated ethylene propylene bottles and caps used were acid leached with 0.2N HNO3 , deionized-water rinsed, and autoclave sterilized. Major constituents sample M-152 was prepared using water collected from the Fall River near Idaho Springs, Colorado. The water was pumped through 0.45- 0.2- and 0.1-µm filters, in series, into a 1200-L polypropylene drum. The water was chlorinated to 5-ppm free chlorine with sodium hypochlorite, continuously circulated, and passed through an ultraviolet sterilizer for 24 hours prior to bottling. The major constituent concentrations were adjusted by adding reagent grade chemicals. The sample was circulated an additional 24 hours prior to bottling. During bottling the sample was pumped through an ultraviolet sterilizer and a 0.1-µm filter. The polypropylene bottles and caps used were acid leached with 0.2N HNO3, deionized-water rinsed, and autoclave sterilized. Nutrient constituents sample N-63 was prepared using deionized water. These samples were prepared the week prior to the mailing for this SRS evaluation. The water was pumped through 0.45-, 0.2-, and 0.1-µm filters, in series, into a 25-L polypropylene drum. The desired nutrient concentrations were obtained by adding reagent-grade chemicals. The sample was continuously circulated through an ultraviolet sterilizer for 24 hours prior to being bottled. The 30-milliliter (mL) glass vials used were new, amber, acid leached with 0.2N HCl, deionized-water rinsed, and autoclave sterilized. Nutrient constituents sample N-64 was prepared using water collected from the Fall River near Idaho Springs, Colorado. These samples were prepared the week prior to the mailing for this SRS evaluation. The water was pumped through 0.45- 0.2- and 0.1-µm filters, in series, into a 200-L polypropylene drum and continuously circulated and passed through an ultraviolet sterilizer for 24 hours. The desired nutrient concentrations were obtained by adding reagent-grade chemicals. The sample was passed through a 0.1-µm filter while bottling. The 250-mL polyethylene bottles used were new, amber, acid leached 0.2N HCl, deionized-water rinsed, and autoclave sterilized. Low ionic strength constituents sample P-33 was prepared in a 400-L polypropylene drum using snowmelt from Alice, Colorado. The water was pumped into the drum through 0.45- 0.2- and 0.1-µm filters in series. The desired phosphate and fluoride concentrations were obtained by adding reagent-grade chemicals. Prior to bottling, the sample was continuously mixed for 24 hours while being circulated through a 0.1-µm filter and an ultraviolet sterilizer. During bottling the sample was pumped through an ultraviolet sterilizer and a 0.1-µm filter. The 500-mL polypropylene bottles used were acid leached with 0.2N HNO3, deionized-water rinsed, and autoclave sterilized. .

7
Mercury sample Hg-29 was prepared using water collected from the Fall River near Idaho Springs, Colorado. The sample was prepared in a 200-L polypropylene drum. The river water was pumped into this drum through 0.45-, 0.2-, and 0.1-µm filters in series. The water was continuously circulated and passed through a 0.1-µm filter and ultraviolet sterilizer for 48 hours. Nitric acid (5-percent, by volume) and dichromate compound (0.05-percent, by weight) were added to stabilize the sample. The desired mercury concentration was obtained by adding a mercury standard solution. Following an additional 24 hours of circulation, the sample was bottled. The 250-mL glass bottles and tetrafluoroethylene fluorocarbon resin caps used were new, acid leached with 0.2N HNO3, and deionized-water rinsed, and autoclave sterilized.

8
LABORATORY ANALYSES
The participating laboratories were asked to determine constituents that are summarized in table 2. The number of analytes varied from 28 in T-159 (trace constituents) to 1 in Hg-29 (mercury). Table 2. -Analytes determined in standard reference samples distributed in October 1999
[mg/L, milligrams per liter; µg/L, micrograms per liter; µS/cm, microsiemens per centimeter at 25 degrees Celsius ]
Constituent or property Units T-159 M-152 N-63 N-64 P-33 Hg-29 Acidity Acidity as CaCO3 mg/L X Alk Alkalinity as CaCO3 mg/L X Ag Silver µg/L X Al Aluminum µg/L X As Arsenic µg/L X B Boron µg/L X X X Ba Barium µg/L X Be Beryllium µg/L X Ca Calcium mg/L X X X Cd Cadmium µg/L X Cl Chloride mg/L X X Co Cobalt µg/L X Cr Chromium µg/L X Cu Copper µg/L X DSRD Dissolved solids mg/L X F Fluoride mg/L X X Fe Iron µg/L X Hg Mercury µg/L X K Potassium mg/L X X X Li Lithium µg/L X Mg Magnesium mg/L X X X Mn Manganese µg/L X Mo Molybdenum µg/L X Na Sodium mg/L X X X NH3 as N Ammonia mg/L X X NH3+Org N as N Ammonia + Organic N mg/L X X Ni Nickel µg/L X NO3 as N Nitrate mg/L X X Pb Lead µg/L X pH unit X X PO4 as P Orthophosphate mg/L X X X total P as P Phosphorus mg/L X X X Sb Antimony µg/L X Se Selenium µg/L X SiO2 Silica mg/L X X __________________________________________________________________________________________________________ SO4 Sulfate mg/L X X Sp Cond Specific conductance µS/cm X X Sr Strontium µg/L X X Tl Thallium µg/L X U Uranium µg/L X V Vanadium µg/L X X Zn Zinc µg/L X

9
Laboratories were requested to identify the method used for each constituent according to analytical method codes in table 3. Table 3. Analytical method codes Code Method 0 Other 1 Atomic absorption: direct, air 2 Atomic absorption: direct, nitrous oxide 3 Atomic absorption: graphite furnace 4 Inductively coupled plasma 5 Direct current plasma 6 Inductively coupled plasma/mass spectrometry 7 Ion chromatography 8 Atomic absorption: cold vapor 9 Atomic fluoresence 10 Atomic absorption: extraction [specify chelating agents ] 11 Atomic absorption: hydride [specify reducing agent ] 12 Flame emission 20 Titration: colorimetric [specify color reagent ] 21 Titration: electrometric [specify reducing or oxidizing agent/color reagent ] 22 Colorimetric: [specify reducing or oxidizing agent/color reagent ] 40 Ion selective electrode 41 Electrometric [pH and specific conductance] 50 Gravimetric: [specify filtration, evaporation,and so forth ] 51 Turbidimetric Participating laboratories were also asked to identify the method used, such as those references listed next, to further define the methods. 1. American Public Health Association, American Water Works Association, and Water Environment Federation, 1995, Standard methods for the examination of water and wastewater (19th ed.): Washington, D.C., American Public Health Association, variable pagination. 2. American Society for Testing and Materials, 1995, Annual book of ASTM standards: Philadelphia, v. 11.0, and v. 11.02. 3. Kopp, J.F., and McKee, G.F., 1979, Methods for chemical analysis of water and wastes: Cincinnati, U.S. Environmental Protection Agency, EPA 600/4-79-020, rev. 1983, 460 p. 4. Fishman, M.J., and Friedman, L.C., eds., 1989. Methods for determination of inorganic substances in water and fluvial sediments (3rd ed.): U.S. Geological Survey Techniques of Water-Resources Investigations, Book 5, Chapter A1, 545 p. 5. Miscellaneous manufacturer's instrument manuals or references.

10
LABORATORY PERFORMANCE RATINGS
To facilitate laboratory intercomparison, laboratory performance ratings that are based on the analyses reported for each SRS are included in tables 4 through 17 in this report. For each SRS, averages of all the analyte ratings and the number of analyte values reported are given for each participating laboratory. In some cases, laboratory reported values in tables 4 - 17 might have been reformatted in terms of significant figures to meet publication criteria. For example, a reported value of 15 may have been changed to 15.0 or a value of 102.86 may have been changed to 102.9 in these tables. However, the actual reported values by all the laboratories were used to calculate the statistical results and performance ratings presented in the report. Laboratory determination of each analyte is rated on a scale 4 to 0, based on the absolute Z-value, as listed below: Rating Absolute Z-value 4 (Excellent) 0.00 to 0.50 3 (Good) 0.51 to 1.00 2 (Satisfactory) 1.01 to 1.50 1 (Marginal) 1.51 to 2.00 0 (Unsatisfactory) Greater than 2.00 A weighted laboratory rating greater than 2.0 is considered satisfactory, and ratings less than 2.0 are considered unsatisfactory. Ratings are based on the relative performance of laboratories on specific samples and should be reviewed and evaluated on a case-by-case basis for each laboratory considering such factors as methods used and data needs of specific USGS projects using the laboratory data.
STATISTICAL PRESENTATION OF DATA
Data in this report have been evaluated using nonparametric statistics as described by Hoaglin and others (1983). This statistical approach is a resistant statistic because outliers do not influence the median, as they influence the mean in traditional parametric statistics. Analytical data for each analyte are presented in tabular and graphical forms in tables 11 through 16. Tabulated data for each analyte include the laboratory code number; reported values; analytical method; most probable value (MPV); number of reported analyses; excluding less than values (N); data range; Z-value; and the F-pseudosigma. The Z-value is equivalent to the Z-score of traditional statistics, being the number of deviations the reported value is from the MPV. The F-pseudosigma is equivalent to the standard deviation (σ) of traditional statistics when the data has a Gaussian distribution. If an analyte has a sufficient number of analyses by a given method, usually 7, the F-pseudosigma for that analytical method is reported in the block of data listed for each analyte. The median value is considered the MPV. The median (midpoint) divides the ordered data into halves and is designated the MPV. The hinges include the middle 50-percent of the data and are the mid-values of the upper and lower halves of the data. The hinges are similar to quartiles, but are not mathematically equivalent. The range of data between the upper hinge (Uh) and the lower hinge (Lh) by comparison of the H-spr value to the Gaussian distribution relation; 67.45 percent of the data "hinges" between plus and minus 1σ, resulting in a H-spr of 2 x 0.6745 = 1.349σ. This relation allows the calculation of the F-pseudosigma = (H-spr)/1.349. Laboratories reporting "less than" values are not performance rated unless their reported "less than" values are greater than two Z-values from the MPV.

11
The graphical plot of the reported data is shown in figure 1. The upper and lower boundaries of the graphical plots generally are +3 and -3 F-pseudosigma deviations from the median. Computer-program scaling constraints do not permit these boundaries to always be graphed at exactly these values as shown in the graphical plot. Reported values are grouped by analytical method in ascending order of value. Lines designate the MPV, Uh, Lh, and the UWL and LWL at +2 and -2 F-pseudosigma, respectively. "Less than" values are not plotted. In some cases, if the F-pseudosigma is less than 5 percent of the MPV, the rating criterion is set to 5 percent of the MPV, as shown in Table 11, page 41. The term “insufficient data” is included in some of the tables and is used when the number of analyses is less than seven or the calculated F-pseudosigma is greater than the MPV. In some cases the F-pseudosigma is equal to or greater than the MPV. This results in an MPV = insufficient data. An estimated MPV may be calculated from the available data for a single analytical method, this estimated concentration is denoted by MPV = Estimated. Estimated values are not used to rate laboratories.
NOTE: vertical scale is the concentration value of the individual analyte in appropriate units (see table 2). Horizontal scale is the laboratory reported values separated by method (different symbols) and plotted by increasing values. Numbers next to each symbol at the bottom of the figure are analytical method codes that are described in table 3.
Laboratory-reported results greater than 3 F-pseudosigma from the median are not shown on the graphs.
Figure 1. -Statistical parameters shown on reported-data graphs in tables 13 - 20
REFERENCE Hoaglin, D.C., Mosteller, F., and Tukey, J.W., Eds. 1983, Understanding robust and exploratory data analysis: New York, NY, John Wiley, Inc., p. 38-41.
Median - Most Probable Value (MPV)Hinge -upper & lower, 1 pseudosigma (Uh, Lh)Warning limits - upper & lower, 2 pseudosigma (Uwl, Lwl)Control limits -upper & lower, 3 pseudosigma(Ucl, Lcl)
9.0
10.0
11.0
12.0
13.0
14.0
ANALYTICAL METHOD CODE
CO
NC
EN
TR
AT
ION
0 1 3 4 6
0 Other 1 Atomic absorption: direct air 3 Atomic absorption: graphite furnace 4 Inductively coupled plasma 6 Inductively coupled plasma/mass spectrometry
+ 2 F- pseudosigma - Upper warning limit (Uwl)
-2 F- pseudosigma - Lower warning limit (Lwl)
Median - Most Probable Value (MPV)
- 1 F- pseudosigma - Lower hinge (Lh)
+ 1 F- pseudosigma Upper hinge (Uh)
- 3 F- pseudosigma Lower control limit (Lcl)
+ 3 F- pseudosigma - Upper control limit (Ucl)

Table 4. Overall laboratory performance ratings for standard reference samples distributed in October 1999 [SRS, standard reference sample; Lab, laboratory number; OWR, overall weighted rating for all sample types; OLR, overall laboratory rating for reported values of a sample type;
V/64, number of reported values of 65 total possible values from all sample types; V/28,V/15,V/5,V/5,V/10 and V/1 are number of reported values possible for T-159, M-152, N-63, N-64, P-33 and Hg-29 respectively; NR, not rated; --, not reported.]
SRS = T-159 M-152 N-63 N-64 P-33 Hg-29Lab OWR V/64 OLR V/28 OLR V/15 OLR V/5 OLR V/5 OLR V/10 OLR V/1
1 3.7 63 3.7 28 3.9 14 4.0 5 3.6 5 3.1 10 4 12 2.3 8 2.3 83 3.1 55 3.2 26 3.4 14 3.0 5 2.0 9 4 1
10 3.2 31 2.2 9 3.5 11 4.0 5 3.8 5 1 111 2.5 62 2.8 26 2.9 15 1.2 5 2.2 5 1.5 10 4 112 1.9 25 2.4 7 2.0 6 2.0 3 1.4 5 2.0 3 0 113 2.7 45 2.6 24 2.8 13 2.0 4 3.3 4 NR18 3.0 10 2.6 5 3.4 521 3.7 6 3.0 1 3.8 523 2.6 37 2.4 21 3.3 6 1.8 5 3.8 524 3.0 29 3.1 17 2.8 1225 2.6 21 1.7 7 3.8 4 2.3 4 3.0 626 2.2 32 2.3 18 2.1 12 1.5 232 3.6 35 3.7 26 3.8 8 1 133 3.2 34 2.3 10 3.8 11 2.7 3 3.7 1036 1.8 10 1.4 5 2.2 538 3.7 27 3.7 9 4.0 5 3.4 5 3.8 839 2.2 35 2.1 22 2.1 12 4 142 3.0 50 3.4 25 2.6 14 1.5 2 3.5 2 2.4 743 3.5 4 3.5 445 2.2 26 2.4 8 2.5 10 2.0 7 0 146 2.9 54 3.2 22 2.1 12 2.6 5 3.2 5 2.9 9 4 148 2.5 50 3.0 24 2.7 11 0.6 5 2.1 9 2 150 3.3 40 3.4 22 3.1 12 3.8 5 2 151 2.8 19 2.3 4 3.0 10 3.0 553 3.8 4 4.0 2 3.5 257 3.0 40 3.1 27 2.6 1359 2.8 44 2.6 25 3.5 2 2.4 5 2.6 5 3.5 6 4 164 3.0 32 2.2 5 3.7 10 4.0 4 3.5 4 2.1 969 3.5 2 4.0 1 3.0 170 2.5 51 2.8 26 2.4 14 1.0 5 2.2 5 4 176 3.4 28 3.6 15 3.8 8 3.0 2 2.0 381 2.3 55 2.2 24 2.0 14 2.2 5 3.1 11 2 183 3.7 6 3.5 2 4.0 2 3.5 285 3.1 20 2.9 12 3.8 4 2.8 486 2.8 49 2.5 24 3.4 13 1.7 3 3.0 8 4 187 2.2 32 2.4 17 1.6 9 3.0 5 0 189 2.5 57 2.1 22 2.2 13 3.6 5 3.4 5 2.7 11 4 190 3.5 6 4.0 3 3.0 393 2.5 47 1.8 18 2.8 11 2.5 4 2.3 4 3.6 1096 2.8 32 2.8 15 2.8 6 2.4 5 3.2 5 4 197 2.7 27 2.5 12 2.8 11 2.8 4
102 1.4 53 1.3 22 1.7 12 1.8 5 1.8 5 0.9 9105 1.9 9 1.8 4 2.0 5107 3.1 15 2.2 6 4.0 3 3.5 4 4.0 2109 2.6 16 2.8 6 2.4 10110 3.0 1 3.0 1113 3.4 51 3.4 19 3.3 12 4.0 4 3.8 5 3.0 10 4 1114 1.8 24 1.5 11 2.3 7 2.0 3 1.7 3121 3.1 27 3.0 20 3.3 7126 2.1 13 2.1 12 2 1127 3.4 63 3.3 26 3.9 15 3.0 5 3.4 5 3.5 11 3 1129 3.2 10 4.0 5 2.4 5131 2.2 31 2.2 20 2.2 11134 3.7 64 3.7 28 3.8 15 3.6 5 2.6 5 3.9 10 4 1138 3.7 60 3.7 25 3.7 15 4.0 5 3.6 5 3.9 9 3 1140 2.4 47 2.9 15 1.9 12 2.2 5 1.4 5 3.0 10141 2.1 50 2.3 26 1.8 13 2.0 10 2 1142 2.7 45 2.8 26 2.3 13 3.2 5 4 1143 3.5 19 3.4 5 3.8 5 3.2 5 3.5 4144 2.2 15 2.3 14 1 1145 2.4 54 1.7 20 3.0 14 3.6 5 2.8 5 2.1 9 2 1146 2.8 45 3.5 20 2.1 9 2.2 5 2.6 5 3.0 5 0 1147 3.6 8 3.6 7 4 1151 3.2 42 3.4 23 3.3 12 2.0 3 1.3 3 4 1154 2.8 50 2.9 26 3.1 13 2.2 5 2.8 5 0 1155 2.9 15 3.0 5 3.2 5 2.4 5158 2.4 10 2.4 5 2.4 5180 2.4 46 1.6 16 2.6 10 3.0 5 3.2 5 3.1 9 0 1183 2.2 17 2.2 5 2.0 4 2.3 3 2.2 5
12

Table 4. Overall laboratory performance ratings for standard reference samples distributed in October 1999--Continued [SRS, standard reference sample; Lab, laboratory number; OWR, overall weighted rating for all sample types; OLR, overall laboratory rating for reported values of a sample type;
V/64, number of reported values of 65 total possible values from all sample types; V/28,V/15,V/5,V/5,V/10 and V/1 are number of reported values possible for T-159, M-152, N-63, N-64, P-33 and Hg-29 respectively; NR, not rated; --, not reported.]
SRS = T-159 M-152 N-63 N-64 P-33 Hg-29Lab OWR V/64 OLR V/28 OLR V/15 OLR V/5 OLR V/5 OLR V/10 OLR V/1185 3.2 29 3.3 4 3.4 9 3.3 4 3.3 4 3.0 8190 2.7 40 3.0 14 2.5 12 3.0 2 2.5 2 2.3 10191 3.2 41 3.4 23 3.2 10 2.9 8193 2.5 33 2.4 14 2.8 6 2.7 3 2.0 4 2.8 5 4 1196 3.1 7 3.0 3 3.3 4198 2.7 21 2.4 12 2.8 4 3.3 4 3 1200 3.3 4 3.3 4203 2.9 36 2.8 18 2.9 10 2.9 7 3 1204 2.3 28 2.1 20 4.0 1 2.2 5 4.0 2205 2.5 4 1.0 2 4.0 2208 2.5 6 3.5 2 3.0 2 1.0 2209 2.9 25 2.4 5 2.9 7 3.0 3 3.3 3 3.1 7212 2.6 52 3.0 26 2.9 15 1.2 5 1.8 5 0 1213 3.0 10 3.3 3 3.0 2 2.8 4 3 1215 1.7 50 1.8 20 1.9 12 0.8 4 3.4 5 0.9 8 0 1219 3.0 36 3.3 26 2.3 9 3 1224 2.5 10 2.4 5 2.6 5227 3.0 34 3.0 10 3.5 8 3.6 5 2.2 5 2.5 6228 2.0 9 2.0 9234 3.2 51 3.2 27 3.5 15 3.3 4 1.8 4 4 1236 2.2 34 2.1 22 2.4 12237 3.5 8 3.5 8238 3.4 5 3.4 5241 2.9 49 3.0 23 3.4 11 3.3 4 2.1 10 2 1243 2.8 11 2.7 3 2.3 3 2.7 3 4.0 2244 3.8 4 3.5 2 4.0 2247 2.7 61 2.4 27 2.7 15 2.0 5 3.0 5 3.5 8 4 1253 2.4 13 2.2 5 2.0 4 3.0 4254 3.3 23 3.1 15 3.5 8255 3.1 33 2.8 15 3.3 6 4.0 3 3.8 4 3.0 4 1 1259 3.1 34 3.1 21 3.5 12 0 1265 3.4 48 3.3 28 3.7 12 2.9 7 4 1268 2.7 20 1.8 4 3.0 8 2.8 8273 1.7 44 1.8 20 1.0 13 2.4 11274 1.1 27 1.6 5 1.4 11 0.6 11275 1.4 11 1.4 11277 1.7 24 1.6 13 1.5 10 4 1279 2.6 20 3.3 4 2.5 8 2.4 8282 2.3 61 2.6 26 2.3 14 0.2 5 2.4 5 2.7 10 3 1285 0.4 8 0.8 4 0.0 4287 1.6 39 1.6 15 1.6 8 0.0 3 1.0 3 2.1 10291 4.0 1 4.0 1292 2.6 34 2.6 16 3.0 10 2.3 4 2.3 4298 4.0 1 4 1301 2.6 11 3.0 4 2.4 7302 1.8 13 2.3 4 1.7 9304 3.3 22 3.1 14 3.6 7 4 1305 1.6 13 1.6 9 1.8 4306 1.6 8 2.5 4 0.8 4307 2.3 27 2.5 14 2.3 8 2.0 4 0 1308 1.3 9 1.0 6 4.0 1 0.0 1 2 1309 0.3 14 0.4 8 0.2 6312 2.3 10 0.0 1 1.3 3 3.5 2 0.0 1 4.0 3313 3.5 10 3.0 5 4.0 5314 1.6 5 1.6 5316 3.8 10 3.8 5 3.8 5317 2.7 3 2.7 3318 4.0 5 4.0 5319 1.8 10 1.6 5 2.0 5320 2.5 10 2.8 5 2.2 5321 2.9 11 3.3 4 2.7 7
13

Table 5. Laboratory performance ratings for standard reference sample T-159 (trace constituents)
[MPV, most probable value; µg/L, micrograms per liter; mg/L, milligrams per liter; Lab, laboratory number; OLR, overall laboratory rating for all reported values;V/28, number of reported values of 28 possible values; RV, reported value; <, less than; NR, not rated --, not reported.]Rating Absolute Z-value Rating Absolute Z-value4 (Excellent) 0.00 - 0.50 1 (Marginal) 1.51 - 2.003 (Good) 0.51 - 1.00 0 (Unsatisfactory) greater than 2.002 (Satisfactory) 1.01 - 1.50 NR (Not Rated)
Analyte = Ag (Silver) Al (Aluminum) As (Arsenic) B (Boron) Ba (Barium) Be (Beryllium) Ca (Calcium)MPV = 9.67 µ g/L 31.9 µ g/L 28.4 µ g/L 26.4 µ g/L 38.1 µ g/L 10.8 µ g/L 25.5 mg/L
F-pseudosigma = 0.91 3.7 1.6 3.0 1.9 0.4 0.8Lab OLR V/28 RV Rating RV Rating RV Rating RV Rating RV Rating RV Rating RV Rating
1 3.7 28 9.49 4 31.2 4 29.3 3 28.2 3 38.1 4 11.0 4 25.9 43 3.2 26 9.48 4 31.0 4 28.1 4 31.9 1 35.4 2 10.7 4 24.9 4
10 2.2 9 -- -- -- -- 31.0 1 -- -- -- -- -- -- -- --11 2.8 26 10.00 4 120.0 0 28.0 4 26.0 4 37.0 3 11.0 4 26.0 412 2.4 7 9.40 4 -- -- -- -- -- -- -- -- -- -- 26.0 413 2.6 24 9.99 4 31.0 4 27.7 4 -- -- 37.3 4 11.0 4 25.0 421 3.0 1 -- -- -- -- -- -- -- -- -- -- -- -- -- --23 2.4 21 11.60 0 32.2 4 24.2 0 -- -- 37.8 4 9.7 0 27.4 224 3.1 17 -- -- -- -- -- -- 25.0 4 39.5 3 -- -- 25.4 426 2.3 18 -- -- 33.1 4 27.5 3 24.2 3 38.5 4 11.2 3 15.5 032 3.7 26 9.40 4 30.2 4 28.6 4 27.1 4 38.2 4 10.4 3 25.7 433 2.3 10 -- -- 70.0 0 -- -- -- -- 43.0 0 -- -- 27.0 239 2.1 22 8.91 3 48.5 0 28.0 4 17.5 0 36.6 3 -- -- 24.0 242 3.4 25 9.67 4 < 30 NR 29.6 3 < 30 NR 38.0 4 -- -- 26.3 345 2.4 8 -- -- -- -- -- -- -- -- -- -- -- -- 23.9 246 3.2 22 10.10 4 34.6 3 26.2 2 25.5 4 39.1 3 10.7 4 25.1 448 3.0 24 9.40 4 31.0 4 27.9 4 26.3 4 38.0 4 10.7 4 29.2 050 3.4 22 9.90 4 31.9 4 27.8 4 28.0 3 40.5 2 10.6 4 -- --51 2.3 4 -- -- -- -- -- -- -- -- -- -- -- -- 27.2 257 3.1 27 10.30 3 32.1 4 31.3 1 27.4 4 37.3 4 11.2 3 25.2 459 2.6 25 9.00 3 32.2 4 31.4 1 -- -- 38.9 4 11.8 1 27.3 264 2.2 5 -- -- -- -- -- -- -- -- -- -- -- -- 33.4 070 2.8 26 8.00 1 31.4 4 29.6 3 < 50 NR 38.1 4 12.0 0 26.5 376 3.6 15 -- -- 31.1 4 -- -- -- -- 38.7 4 11.3 3 25.1 481 2.2 24 7.00 0 42.0 0 30.0 3 -- -- 36.0 2 10.0 2 26.3 386 2.5 24 8.90 3 -- -- 26.6 2 13.0 0 37.6 4 10.6 4 25.8 487 2.4 17 10.30 3 -- -- 25.6 1 -- -- 38.5 4 -- -- 24.9 489 2.1 22 8.91 3 36.0 2 28.4 4 -- -- < 50 NR 13.5 0 24.7 393 1.8 18 10.10 4 24.9 1 26.3 2 -- -- -- -- 9.9 1 24.6 396 2.8 15 10.70 2 -- -- 28.3 4 -- -- < 100 NR 10.4 3 -- --97 2.5 12 -- -- -- -- 29.2 4 -- -- 40.8 2 -- -- -- --
102 1.3 22 40.00 0 29.4 3 22.6 0 -- -- 43.9 0 10.2 2 27.0 2107 2.2 6 -- -- -- -- -- -- -- -- -- -- -- -- 25.2 4109 2.8 6 -- -- -- -- -- -- -- -- -- -- -- -- 25.0 4113 3.4 19 10.45 3 -- -- 30.0 3 -- -- 37.8 4 11.1 3 25.9 4114 1.5 11 12.00 0 -- -- -- -- -- -- -- -- 12.0 0121 3.0 20 9.10 3 -- -- 28.5 4 -- -- 37.0 3 -- -- 25.4 4126 2.1 12 11.00 2 -- -- 31.0 1 -- -- < 200 NR 10.6 4 25.0 4127 3.3 26 9.45 4 103.0 0 26.6 2 25.5 4 36.4 3 10.7 4 25.4 4131 2.2 20 < 30 NR 24.0 0 < 40 NR 24.0 3 35.0 1 -- -- 25.3 4134 3.7 28 9.56 4 32.0 4 29.7 3 26.5 4 37.3 4 10.5 3 25.3 4138 3.7 25 9.43 4 30.7 4 28.4 4 27.3 4 38.2 4 10.5 3 25.2 4140 2.9 15 8.60 2 -- -- -- -- -- -- 50.0 0 -- -- 25.5 4141 2.3 26 10.70 2 26.6 2 32.1 0 50.1 0 40.8 2 11.6 2 26.9 2142 2.8 26 12.70 0 < 30 NR 29.0 4 < 30 NR 40.1 2 10.8 4 27.0 2144 2.3 14 9.20 3 -- -- 24.5 0 -- -- -- -- 8.9 0 -- --145 1.7 20 -- -- < 180 NR 46.0 0 34.0 0 39.0 3 11.0 4 26.6 3146 3.5 20 11.40 1 < 36.9 NR 29.4 3 -- -- 39.6 3 10.9 4 25.2 4147 3.6 7 -- -- 32.3 4 28.0 4 -- -- -- -- -- -- -- --151 3.4 23 9.60 4 27.4 2 27.8 4 -- -- 37.6 4 10.1 2 25.7 4154 2.9 26 9.90 4 29.5 3 28.8 4 29.0 3 35.7 2 10.9 4 25.2 4180 1.6 16 10.70 2 < 51.6 NR -- -- 63.2 0 40.8 2 13.0 0 26.5 3185 3.3 4 -- -- -- -- -- -- -- -- -- -- -- -- 25.1 4190 3.0 14 9.20 3 32.8 4 28.7 4 -- -- -- -- -- -- 33.1 0191 3.4 23 -- -- 32.0 4 29.2 4 25.0 4 39.0 3 10.9 4 26.3 3
14

Table 5. Laboratory performance ratings for standard reference sample T-159 (trace constituents)--Continued
[MPV, most probable value; µg/L, micrograms per liter; mg/L, milligrams per liter; Lab, laboratory number; OLR, overall laboratory rating for all reported values;V/28, number of reported values of 28 possible values; RV, reported value; <, less than; NR, not rated --, not reported.]Rating Absolute Z-value Rating Absolute Z-value4 (Excellent) 0.00 - 0.50 1 (Marginal) 1.51 - 2.003 (Good) 0.51 - 1.00 0 (Unsatisfactory) greater than 2.002 (Satisfactory) 1.01 - 1.50 NR (Not Rated)
Analyte = Ag (Silver) Al (Aluminum) As (Arsenic) B (Boron) Ba (Barium) Be (Beryllium) Ca (Calcium)MPV = 9.67 µ g/L 31.9 µ g/L 28.4 µ g/L 26.4 µ g/L 38.1 µ g/L 10.8 µ g/L 25.5 mg/L
F-pseudosigma = 0.91 3.7 1.6 3.0 1.9 0.4 0.8Lab OLR V/28 RV Rating RV Rating RV Rating RV Rating RV Rating RV Rating RV Rating
193 2.4 14 10.20 3 -- -- 23.2 0 -- -- -- -- 10.5 3 25.8 4198 2.4 12 < 50 NR < 50 NR 29.1 4 -- -- < 50 NR 11.4 2 26.3 3203 2.8 18 9.00 3 29.0 3 27.5 3 -- -- 40.0 2 -- -- 24.8 3204 2.1 20 5.00 0 28.2 2 26.0 1 -- -- 35.7 2 8.0 0 25.8 4209 2.4 5 -- -- 32.5 4 -- -- -- -- -- -- -- -- 25.2 4212 3.0 26 9.83 4 68.0 0 27.4 3 28.2 3 38.7 4 11.7 1 24.2 2215 1.8 20 8.00 1 -- -- 25.0 0 -- -- 37.0 3 11.0 4 25.5 4219 3.3 26 11.00 2 28.0 2 30.0 3 -- -- 36.0 2 11.0 4 25.7 4227 3.0 10 -- -- 30.5 4 -- -- -- -- -- -- -- -- 25.2 4234 3.2 27 10.00 4 38.4 1 29.4 3 27.0 4 37.6 4 10.8 4 25.2 4236 2.1 22 10.00 4 55.0 0 < 45 NR 24.0 3 39.0 3 11.0 4 24.4 3241 3.0 23 9.38 4 28.7 3 31.2 1 -- -- 39.5 3 9.9 1 25.8 4247 2.4 27 9.84 4 31.4 4 31.0 1 64.0 0 40.9 1 13.0 0 24.8 3254 3.1 15 -- -- 30.7 4 -- -- -- -- -- -- -- -- 26.1 4255 2.8 15 10.80 2 33.1 4 30.3 2 22.8 2 -- -- -- -- 25.3 4259 3.1 21 9.60 4 37.1 2 27.5 3 12.0 0 38.0 4 -- -- 25.4 4265 3.3 28 9.00 3 27.0 2 28.5 4 25.0 4 38.0 4 11.0 4 25.5 4268 1.8 4 -- -- -- -- -- -- -- -- -- -- -- -- 25.5 4273 1.8 20 9.10 3 31.6 4 -- -- 19.5 0 46.9 0 -- -- 27.4 2274 1.6 5 -- -- -- -- -- -- -- -- -- -- -- -- 25.6 4277 1.6 13 9.30 4 -- -- 27.6 4 -- -- 34.1 0 -- -- -- --279 3.3 4 -- -- -- -- -- -- -- -- -- -- -- -- 25.8 4282 2.6 26 12.20 0 47.0 0 31.6 1 27.4 4 36.8 3 10.7 4 25.8 4287 1.6 15 -- -- 71.6 0 19.0 0 < 1 0 -- -- -- -- 26.5 3292 2.6 16 17.00 0 -- -- -- -- -- -- 35.0 1 9.0 0 25.8 4302 2.3 4 -- -- -- -- -- -- -- -- -- -- -- -- 25.2 4304 3.1 14 7.70 0 -- -- -- -- -- -- 37.2 4 10.7 4 -- --305 1.6 9 9.04 3 -- -- 20.2 0 -- -- -- -- -- -- 26.2 3307 2.5 14 9.75 4 -- -- 27.7 4 -- -- -- -- -- -- 24.0 2308 1.0 6 -- -- -- -- -- -- -- -- -- -- -- -- -- --309 0.4 8 11.00 2 -- -- 54.0 0 -- -- -- -- -- -- 27.6 1312 0.0 1 -- -- -- -- -- -- -- -- -- -- -- -- -- --
15

Table 5. Laboratory performance ratings for standard reference sample T-159 (trace constituents)--Continued
[MPV, most probable value; µg/L, micrograms per liter; mg/L, milligrams per liter; Lab, laboratory number; OLR, overall laboratory rating for all reported values;V/28, number of reported values of 28 possible values; RV, reported value; <, less than; NR, not rated --, not reported.]Rating Absolute Z-value Rating Absolute Z-value4 (Excellent) 0.00 - 0.50 1 (Marginal) 1.51 - 2.003 (Good) 0.51 - 1.00 0 (Unsatisfactory) greater than 2.002 (Satisfactory) 1.01 - 1.50 NR (Not Rated)
Analyte = Cd (Cadmium) Co (Cobalt) Cr (Chromium) Cu (Copper) Fe (Iron) K (Potassium) Li (Lithium)MPV = 24.0 µg/L 13.3 µ g/L 26.8 µ g/L 33.4 µ g/L 48.9 µ g/L 1.52 mg/L 8.97 µ g/L
F-pseudosigma = 1.6 0.9 1.8 2.5 6.2 0.13 1.53Lab RV Rating RV Rating RV Rating RV Rating RV Rating RV Rating RV Rating
1 23.8 4 13.3 4 28.0 3 32.7 4 50.9 4 1.47 4 7.92 43 22.7 3 12.8 3 27.1 4 32.7 4 73.7 0 1.57 4 < 10 NR
10 24.0 4 -- -- 28.0 3 35.0 3 56.0 2 -- -- -- --11 25.0 3 13.0 4 28.0 3 35.0 3 90.0 0 1.61 3 11.00 212 24.5 4 -- -- -- -- 31.0 3 -- -- -- -- -- --13 20.5 0 16.3 0 26.6 4 19.3 0 44.3 3 1.57 4 -- --21 -- -- -- -- -- -- -- -- 54.8 3 -- -- -- --23 19.0 0 -- -- 26.0 4 31.1 3 44.2 3 1.48 4 -- --24 24.2 4 14.2 2 31.9 0 37.9 1 50.2 4 1.48 4 -- --26 -- -- 14.5 2 -- -- < 2 0 38.4 1 1.00 0 8.00 432 24.1 4 13.6 4 26.4 4 35.0 3 -- -- 1.50 4 -- --33 -- -- -- -- -- -- -- -- 50.0 4 1.52 4 -- --39 22.0 2 11.0 0 26.0 4 32.7 4 40.7 2 1.42 3 -- --42 24.0 4 13.6 4 27.5 4 33.6 4 40.9 2 1.45 3 9.23 445 -- -- -- -- 41.9 0 34.0 4 -- -- 1.69 2 -- --46 22.5 3 -- -- 27.1 4 34.4 4 45.9 4 1.50 4 -- --48 23.7 4 12.3 2 26.1 4 30.3 2 46.0 4 1.47 4 -- --50 25.2 3 13.3 4 28.8 2 35.2 3 47.2 4 -- -- 7.60 451 -- -- -- -- -- -- -- -- -- -- 2.25 0 -- --57 23.2 4 13.0 4 25.0 3 34.4 4 49.0 4 2.70 0 11.10 259 25.4 3 13.3 4 29.5 2 34.9 3 34.5 0 1.60 3 7.15 364 -- -- -- -- -- -- -- -- -- -- 1.47 4 -- --70 23.4 4 12.4 2 26.0 4 29.4 1 51.2 4 1.48 4 -- --76 24.4 4 13.1 4 28.2 3 -- -- -- -- -- -- -- --81 24.0 4 14.0 3 30.0 1 37.0 2 42.0 2 1.77 1 -- --86 22.6 3 12.4 2 26.6 4 32.6 4 33.8 0 1.50 4 -- --87 25.1 3 -- -- 26.8 4 34.8 3 45.9 4 1.49 4 -- --89 26.3 2 15.6 0 25.1 3 31.3 3 43.9 3 1.54 4 -- --93 21.7 2 -- -- 26.4 4 -- -- 42.9 3 1.23 0 -- --96 24.6 4 12.9 4 25.7 3 32.7 4 60.0 1 -- -- -- --97 -- -- -- -- 35.5 3 41.0 2 1.45 3 -- --
102 25.4 3 15.0 1 28.2 3 32.0 3 54.7 3 1.14 0 -- --107 -- -- -- -- -- -- -- -- 60.0 1 1.84 0 -- --109 -- -- -- -- -- -- -- -- 52.6 3 1.71 2 -- --113 24.8 4 -- -- -- -- 34.2 4 46.7 4 1.57 4 -- --114 26.0 2 -- -- 33.0 0 30.5 2 42.2 2 -- -- -- --121 25.1 3 11.6 1 24.5 2 30.4 2 53.0 3 1.47 4 -- --126 27.9 0 -- -- 25.3 3 41.0 0 -- -- -- -- -- --127 26.0 2 13.0 4 27.3 4 34.6 4 49.7 4 1.57 4 < 10 NR131 22.0 2 12.0 2 24.0 1 47.0 0 50.0 4 1.60 3 8.90 4134 23.7 4 13.4 4 26.9 4 32.4 4 48.8 4 1.50 4 8.66 4138 23.8 4 14.0 3 27.1 4 33.2 4 51.5 4 1.43 3 -- --140 22.9 3 -- -- 30.0 1 34.3 4 50.0 4 1.40 3 -- --141 26.4 1 14.1 3 25.0 3 35.4 3 39.4 1 1.67 2 10.50 3142 24.9 3 12.8 3 26.8 4 31.5 3 40.0 2 1.49 4 8.47 4144 26.6 1 12.2 2 29.9 1 30.5 2 56.0 2 -- -- -- --145 27.0 1 18.0 0 32.0 0 41.0 0 80.0 0 1.61 3 < 20 NR146 23.9 4 13.5 4 27.8 3 32.5 4 < 50 NR 1.58 4 -- --147 23.1 3 -- -- -- -- 32.1 3 53.0 3 -- -- -- --151 24.1 4 -- -- 23.6 1 33.4 4 32.5 0 1.47 4 7.60 4154 23.0 3 13.1 4 26.8 4 36.6 2 46.5 4 2.10 0 -- --180 26.8 1 17.6 0 26.8 4 37.1 2 56.5 2 < 1.63 NR -- --185 -- -- -- -- -- -- -- -- -- -- 1.69 2 -- --190 26.0 2 -- -- 26.4 4 33.4 4 56.8 2 -- -- -- --191 23.5 4 13.7 4 27.7 4 32.3 4 38.0 1 1.37 2 -- --
16

Table 5. Laboratory performance ratings for standard reference sample T-159 (trace constituents)--Continued
[MPV, most probable value; µg/L, micrograms per liter; mg/L, milligrams per liter; Lab, laboratory number; OLR, overall laboratory rating for all reported values;V/28, number of reported values of 28 possible values; RV, reported value; <, less than; NR, not rated --, not reported.]Rating Absolute Z-value Rating Absolute Z-value4 (Excellent) 0.00 - 0.50 1 (Marginal) 1.51 - 2.003 (Good) 0.51 - 1.00 0 (Unsatisfactory) greater than 2.002 (Satisfactory) 1.01 - 1.50 NR (Not Rated)
Analyte = Cd (Cadmium) Co (Cobalt) Cr (Chromium) Cu (Copper) Fe (Iron) K (Potassium) Li (Lithium)MPV = 24.0 µg/L 13.3 µ g/L 26.8 µ g/L 33.4 µ g/L 48.9 µ g/L 1.52 mg/L 8.97 µ g/L
F-pseudosigma = 1.6 0.9 1.8 2.5 6.2 0.13 1.53Lab RV Rating RV Rating RV Rating RV Rating RV Rating RV Rating RV Rating
193 20.5 0 -- -- 22.9 0 34.4 4 71.8 0 1.72 2 -- --198 27.5 0 -- -- < 50 NR < 50 NR 51.0 4 2.01 0 -- --203 21.8 2 -- -- 4.8 0 33.0 4 48.0 4 1.62 3 -- --204 21.6 1 -- -- 25.6 3 27.8 0 46.5 4 1.51 4 -- --209 -- -- -- -- -- -- -- -- -- -- 2.06 0 -- --212 23.7 4 12.6 3 27.6 4 30.0 2 51.3 4 1.42 3 -- --215 24.0 4 12.0 2 22.0 0 13.0 0 27.0 0 -- -- -- --219 24.0 4 14.0 3 28.0 3 33.0 4 -- -- 1.40 3 7.90 4227 24.8 4 -- -- -- -- 37.5 1 52.1 3 -- -- -- --234 25.0 3 13.0 4 26.6 4 34.5 4 49.6 4 1.50 4 13.20 0236 20.0 0 16.0 0 27.0 4 30.0 2 47.0 4 1.42 3 < 10 NR241 25.4 3 -- -- 26.4 4 32.5 4 49.0 4 1.78 1 -- --247 27.0 1 13.7 4 28.5 3 35.6 3 37.0 1 1.47 4 9.15 4254 -- -- 14.0 3 -- -- 33.2 4 50.4 4 1.58 4 7.30 3255 24.5 4 -- -- 29.8 1 32.9 4 50.9 4 -- -- -- --259 24.0 4 13.0 4 35.2 0 27.0 0 47.8 4 1.47 4 -- --265 23.0 3 13.0 4 27.0 4 35.0 3 50.0 4 1.55 4 8.00 4268 -- -- -- -- -- -- -- -- 1.96 0 -- --273 23.3 4 14.1 3 18.0 0 35.3 3 42.4 2 1.49 4 17.80 0274 -- -- -- -- -- -- -- -- -- -- 1.70 2 -- --277 21.2 1 11.8 1 25.2 3 30.8 2 43.3 3 -- -- -- --279 -- -- -- -- -- -- -- -- -- -- 1.50 4 -- --282 25.0 3 14.9 1 28.9 2 36.1 2 47.7 4 1.63 3 -- --287 29.0 0 -- -- 28.3 3 35.0 3 40.0 2 1.73 1 -- --292 -- -- -- -- 25.0 3 34.0 4 46.0 4 1.60 3 -- --302 -- -- -- -- -- -- -- -- -- -- 1.54 4 -- --304 23.0 3 -- -- 26.0 4 35.0 3 49.0 4 1.50 4 -- --305 11.9 0 -- -- 24.4 2 31.6 3 -- -- -- -- -- --307 20.8 1 -- -- 24.5 2 31.5 3 50.0 4 -- -- -- --308 20.7 0 -- -- -- -- 37.0 2 -- -- -- -- -- --309 -- -- -- -- -- -- -- -- -- -- 2.32 0 -- --312 -- -- -- -- -- -- -- -- -- -- -- -- -- --
17

Table 5. Laboratory performance ratings for standard reference sample T-159 (trace constituents)--Continued
[MPV, most probable value; µg/L, micrograms per liter; mg/L, milligrams per liter; Lab, laboratory number; OLR, overall laboratory rating for all reported values;V/28, number of reported values of 28 possible values; RV, reported value; <, less than; NR, not rated --, not reported.]Rating Absolute Z-value Rating Absolute Z-value4 (Excellent) 0.00 - 0.50 1 (Marginal) 1.51 - 2.003 (Good) 0.51 - 1.00 0 (Unsatisfactory) greater than 2.002 (Satisfactory) 1.01 - 1.50 NR (Not Rated)
Analyte = Mg (Magnesium) Mn (Manganese) Mo (Molybdenum) Na (Sodium) Ni (Nickel) Pb (Lead) Sb (Antimony)MPV = 5.60 mg/L 22.0 µ g/L 41.4 µ g/L 100 mg/L 22.2 µ g/L 16.6 µ g/L 13.9 µ g/L
F-pseudosigma = 0.21 1.6 2.6 5 1.6 1.2 1.1Lab RV Rating RV Rating RV Rating RV Rating RV Rating RV Rating RV Rating
1 5.62 4 23.5 3 42.0 4 99 4 21.9 4 16.2 4 14.0 43 5.58 4 21.4 4 41.6 4 99 4 21.7 4 16.5 4 13.4 4
10 -- -- 25.0 1 -- -- -- -- -- -- 16.0 3 -- --11 5.52 4 23.0 3 41.0 4 87 0 22.0 4 15.0 2 15.0 212 6.60 0 -- -- 94 2 -- --13 5.55 4 24.2 2 42.9 3 110 1 27.9 0 18.2 2 13.1 321 -- -- -- -- -- -- -- -- -- -- -- -- -- --23 5.40 3 21.0 3 41.1 4 93 2 18.6 0 16.0 3 14.2 424 5.49 4 23.1 3 42.5 4 103 3 23.1 3 -- -- -- --26 3.20 0 23.2 3 41.6 4 85 0 -- -- -- --32 5.50 4 21.8 4 39.5 3 97 3 23.9 2 17.9 2 13.9 433 5.90 2 20.0 2 -- -- 100 4 -- -- -- -- -- --39 4.97 0 18.5 0 -- -- 97 3 22.2 4 16.0 3 14.0 442 5.41 3 22.2 4 42.4 4 93 2 22.9 4 17.7 3 14.2 445 5.27 2 -- -- -- -- 103 3 -- -- -- -- 14.6 346 5.50 4 21.9 4 39.2 3 104 3 16.9 0 15.7 3 11.9 148 6.33 0 21.2 4 44.0 3 113 0 20.6 2 17.6 3 14.7 350 21.7 4 45.6 1 -- -- 22.5 4 16.1 4 15.0 251 5.76 3 -- -- -- -- 101 4 -- -- -- -- -- --57 5.56 4 21.7 4 35.0 0 97 3 23.7 3 16.1 4 14.0 459 6.17 0 24.4 2 41.2 4 106 2 23.9 2 16.7 4 15.9 164 4.92 0 -- -- -- -- 96 3 -- -- -- -- -- --70 5.50 4 20.6 3 44.2 2 100 4 21.2 3 18.9 1 13.8 476 5.64 4 23.7 2 41.2 4 -- -- 22.8 4 17.3 3 -- --81 5.43 3 22.0 4 38.0 2 99 4 20.0 2 17.0 4 11.0 086 5.80 3 21.0 3 34.9 0 100 4 21.3 3 17.4 3 22.0 087 5.40 3 < 2.0 0 34.7 0 99 4 28.8 0 17.6 3 -- --89 5.59 4 18.9 1 -- -- 42 0 23.3 3 15.6 3 11.9 193 5.17 1 17.4 0 -- -- 109 1 19.5 1 15.5 3 11.1 096 -- -- 20.0 2 -- -- -- -- 23.3 3 17.6 3 13.9 497 -- -- -- -- 45.9 1 98 4 -- -- 17.6 3 15.0 2
102 6.95 0 23.9 2 -- -- 85 0 26.4 0 18.6 1 10.0 0107 5.57 4 30.0 0 -- -- 102 4 -- -- -- -- -- --109 5.50 4 21.5 4 -- -- 20 0 -- -- -- -- -- --113 5.78 3 22.9 3 -- -- 100 4 20.8 3 18.9 1 12.5 2114 -- -- 21.5 4 -- -- -- -- 20.6 2 26.5 0 -- --121 5.60 4 23.0 3 -- -- 100 4 19.9 2 18.7 1 -- --126 -- -- 24.0 2 -- -- 102 4 23.3 3 18.0 2 -- --127 5.55 4 21.8 4 53.5 0 99 4 21.4 3 15.5 3 13.8 4131 5.60 4 21.0 3 42.0 4 100 4 30.0 0 14.0 0 -- --134 5.40 3 22.0 4 39.8 3 105 3 22.8 4 16.9 4 13.0 3138 5.57 4 21.4 4 39.5 3 100 4 21.5 4 16.3 4 15.4 2140 5.60 4 20.0 2 -- -- 101 4 21.4 3 17.1 4 -- --141 5.75 3 23.5 3 41.0 4 101 4 23.4 3 15.7 3 11.4 0142 5.95 2 13.0 0 42.3 4 107 2 22.1 4 16.4 4 16.6 0144 -- -- -- -- -- -- -- -- 21.9 4 17.0 4 12.2 2145 5.85 3 23.0 3 46.0 1 101 4 29.0 0 < 84 NR -- --146 5.45 3 22.2 4 40.4 4 95 3 22.6 4 17.0 4 < 15.4 NR147 -- -- -- -- -- -- -- -- -- -- 16.7 4 -- --151 5.71 4 21.2 4 42.7 4 104 3 21.2 3 16.6 4 13.6 4154 5.50 4 21.6 4 38.7 2 92 1 22.0 4 16.8 4 12.4 2180 5.75 3 23.2 3 45.5 1 103 3 28.8 0 < 40.2 NR < 40.7 NR185 5.69 4 -- -- -- -- 105 3 -- -- -- -- -- --190 -- -- 23.0 3 -- -- -- -- 22.8 4 15.9 3 -- --191 5.78 3 24.0 2 -- -- 102 4 22.6 4 16.2 4 -- --
18

Table 5. Laboratory performance ratings for standard reference sample T-159 (trace constituents)--Continued
[MPV, most probable value; µg/L, micrograms per liter; mg/L, milligrams per liter; Lab, laboratory number; OLR, overall laboratory rating for all reported values;V/28, number of reported values of 28 possible values; RV, reported value; <, less than; NR, not rated --, not reported.]Rating Absolute Z-value Rating Absolute Z-value4 (Excellent) 0.00 - 0.50 1 (Marginal) 1.51 - 2.003 (Good) 0.51 - 1.00 0 (Unsatisfactory) greater than 2.002 (Satisfactory) 1.01 - 1.50 NR (Not Rated)
Analyte = Mg (Magnesium) Mn (Manganese) Mo (Molybdenum) Na (Sodium) Ni (Nickel) Pb (Lead) Sb (Antimony)MPV = 5.60 mg/L 22.0 µ g/L 41.4 µ g/L 100 mg/L 22.2 µ g/L 16.6 µ g/L 13.9 µ g/L
F-pseudosigma = 0.21 1.6 2.6 5 1.6 1.2 1.1Lab RV Rating RV Rating RV Rating RV Rating RV Rating RV Rating RV Rating
193 5.55 4 -- -- -- -- 102 4 < 25 NR 17.6 3 13.4 4198 5.87 3 30.3 0 -- -- 106 2 < 50 NR 16.2 4 14.9 3203 5.82 3 22.0 4 -- -- 97 3 30.0 0 15.8 3 -- --204 5.73 4 19.1 1 -- -- 102 4 17.6 0 14.8 1 13.2 3209 5.62 4 -- -- -- -- 112 0 -- -- -- -- -- --212 5.50 4 21.7 4 43.7 3 103 3 20.5 2 17.3 3 14.0 4215 5.60 4 22.0 4 38.0 2 107 2 19.0 0 16.0 3 10.0 0219 5.00 0 21.0 3 39.0 3 99 4 22.0 4 16.0 3 14.0 4227 5.46 4 23.2 3 -- -- -- -- -- -- 17.0 4 -- --234 5.73 4 19.5 1 39.7 3 99 4 22.4 4 15.5 3 13.3 3236 5.43 3 22.0 4 35.0 0 97 3 20.0 2 < 20 NR 64.0 0241 5.25 2 21.3 4 42.3 4 103 3 21.5 4 16.1 4 13.9 4247 5.67 4 22.4 4 45.2 2 99 4 24.6 1 19.2 0 14.2 4254 5.78 3 23.1 3 -- -- 105 2 22.3 4 -- -- -- --255 5.60 4 23.3 3 -- -- -- -- 24.9 1 17.2 3 -- --259 5.55 4 20.5 3 38.4 2 101 4 22.7 4 16.7 4 -- --265 5.75 3 23.5 3 42.0 4 100 4 22.0 4 16.5 4 13.0 3268 5.80 3 -- -- -- -- 72 0 -- -- -- -- -- --273 6.10 1 23.6 3 -- -- 110 1 35.7 0 14.4 1 -- --274 5.03 0 -- -- -- -- 117 0 -- -- -- -- -- --277 -- -- 18.3 0 -- -- -- -- 20.7 3 11.2 0 -- --279 5.80 3 -- -- -- -- 93 2 -- -- -- -- -- --282 5.78 3 23.3 3 42.5 4 101 4 22.0 4 16.0 3 13.1 3287 4.99 0 23.0 3 -- -- 94 2 -- -- 19.8 0 -- --292 5.50 4 21.0 3 37.0 1 97 3 25.0 1 16.0 3 -- --302 6.40 0 -- -- -- -- 109 1 -- -- -- -- -- --304 5.60 4 -- -- -- -- -- -- 23.0 3 28.0 0 -- --305 -- -- -- -- -- -- -- -- 20.5 2 14.2 1 -- --307 6.25 0 12.0 0 -- -- 100 4 22.5 4 16.5 4 -- --308 5.36 3 24.7 1 -- -- -- -- -- -- 19.2 0 -- --309 -- -- 5.5 0 -- -- 40 0 -- -- 29.0 0 -- --312 -- -- -- -- -- -- -- -- -- -- -- -- -- --
19

Table 5. Laboratory performance ratings for standard reference sample T-159 (trace constituents)--Continued
[MPV, most probable value; µg/L, micrograms per liter; mg/L, milligrams per liter; Lab, laboratory number; OLR, overall laboratory rating for all reported values;V/28, number of reported values of 28 possible values; RV, reported value; <, less than; NR, not rated --, not reported.]Rating Absolute Z-value Rating Absolute Z-value4 (Excellent) 0.00 - 0.50 1 (Marginal) 1.51 - 2.003 (Good) 0.51 - 1.00 0 (Unsatisfactory) greater than 2.002 (Satisfactory) 1.01 - 1.50 NR (Not Rated)
Analyte = Se (Selenium) SiO2 (Silica) Sr (Strontium) Tl (Thallium) U (Uranium) V (Vanadium) Zn (Zinc)MPV = 5.49 µ g/L 11.5 mg/L 190 µ g/L 13.8 µ g/L 5.04 µ g/L 14.4 µ g/L 19.2 µ g/L
F-pseudosigma = 0.83 0.7 7 1.6 0.32 1.7 1.9Lab RV Rating RV Rating RV Rating RV Rating RV Rating RV Rating RV Rating
1 5.40 4 11.8 4 186 4 13.3 4 4.81 3 17.0 1 18.8 43 7.22 0 10.9 3 179 2 12.7 3 -- -- 14.1 4 17.6 3
10 4.60 2 -- -- -- -- -- -- -- -- -- -- 22.0 111 6.00 3 12.5 2 200 2 12.0 2 -- -- 14.0 4 < 25 NR12 -- -- -- -- -- -- -- -- -- -- -- -- 35.0 013 8.00 0 11.4 4 -- -- 13.9 4 -- -- 13.2 3 17.3 221 -- -- -- -- -- -- -- -- -- -- -- -- -- --23 4.90 3 -- -- -- -- 9.7 0 -- -- -- -- 18.8 424 -- -- 12.1 3 196 3 -- -- -- -- -- -- 18.8 426 12.0 3 -- -- -- -- -- -- 15.6 3 18.6 432 5.40 4 11.8 4 189 4 14.0 4 5.35 3 13.6 4 19.0 433 -- -- 11.2 4 206 1 -- -- -- -- -- -- -- --39 5.10 4 -- -- -- -- 18.2 0 -- -- 10.8 0 21.9 242 6.19 3 10.7 2 187 4 14.9 3 -- -- 15.1 4 20.2 345 -- -- -- -- -- -- -- -- -- -- -- -- 21.0 346 5.61 4 -- -- -- -- -- -- -- -- 15.2 3 17.3 248 4.90 3 -- -- -- -- 13.7 4 -- -- 13.9 4 16.8 250 5.40 4 -- -- 195 3 13.9 4 -- -- 14.7 4 18.0 351 -- -- -- -- -- -- -- -- -- -- -- -- -- --57 4.30 2 11.2 4 190 4 14.6 3 -- -- 14.0 4 21.5 259 5.90 4 -- -- 187 4 14.9 3 -- -- 15.4 3 20.2 364 -- -- 11.4 4 -- -- -- -- -- -- -- -- -- --70 5.55 4 12.1 3 201 2 15.7 2 5.60 1 13.6 4 17.3 276 -- -- 12.1 3 -- -- 13.5 4 5.12 4 -- -- -- --81 4.00 1 -- -- 181 3 15.0 3 -- -- 13.0 3 22.0 186 4.67 3 -- -- 192 4 9.5 0 -- -- 16.9 1 17.1 287 < 2 0 -- -- -- -- -- -- -- -- -- -- 23.7 089 2.00 0 11.0 3 -- -- 25.2 0 -- -- 16.3 2 18.0 393 4.10 1 -- -- -- -- -- -- -- -- 13.0 3 17.2 296 5.50 4 -- -- -- -- -- -- -- -- 16.9 1 < 10 097 -- -- 11.4 4 -- -- 15.7 2 -- -- 18.0 0 -- --
102 3.50 0 -- -- 197 3 -- -- -- -- 16.6 2 11.0 0107 -- -- -- -- -- -- -- -- -- -- -- -- -- --109 -- -- -- -- -- -- -- -- -- -- -- -- -- --113 5.19 4 -- -- 189 4 13.8 4 -- -- -- -- 20.4 3114 -- -- -- -- -- -- 34.3 0 -- -- -- -- 19.5 4121 -- -- -- -- 190 4 -- -- 4.80 3 12.2 2 19.0 4126 -- -- -- -- -- -- 9.8 0 -- -- -- -- -- --127 4.99 3 11.4 4 181 3 12.3 3 < 200 NR 14.2 4 18.7 4131 < 60 NR 10.6 2 163 0 -- -- -- -- -- -- 20.5 3134 5.80 4 11.3 4 183 3 13.2 4 5.00 4 13.9 4 20.2 3138 5.47 4 -- -- 183 3 13.9 4 -- -- 14.0 4 19.0 4140 -- -- 12.4 2 -- -- -- -- -- -- -- -- 20.0 4141 6.60 2 -- -- 201 2 13.6 4 -- -- 14.3 4 20.9 3142 6.04 3 11.4 4 198 3 13.6 4 5.08 4 13.8 4 14.8 0144 5.60 4 -- -- -- -- 15.0 3 -- -- -- -- 20.0 4145 -- -- 11.8 4 192 4 -- -- -- -- 20.0 0 23.0 0146 5.28 4 -- -- -- -- 11.7 2 -- -- 15.2 3 20.0 4147 -- -- -- -- -- -- -- -- -- -- -- -- 18.5 4151 5.50 4 -- -- 188 4 13.6 4 -- -- -- -- 19.2 4154 6.50 2 10.9 3 175 1 12.9 3 -- -- 16.0 3 16.5 2180 < 67.9 NR -- -- -- -- < 54.9 NR -- -- 19.3 0 < 24.4 NR185 -- -- -- -- -- -- -- -- -- -- -- -- -- --190 4.81 3 12.3 2 -- -- -- -- -- -- -- -- 19.9 4191 6.80 1 11.7 4 191 4 12.7 3 5.10 4 -- -- 18.3 4
20

Table 5. Laboratory performance ratings for standard reference sample T-159 (trace constituents)--Continued
[MPV, most probable value; µg/L, micrograms per liter; mg/L, milligrams per liter; Lab, laboratory number; OLR, overall laboratory rating for all reported values;V/28, number of reported values of 28 possible values; RV, reported value; <, less than; NR, not rated --, not reported.]Rating Absolute Z-value Rating Absolute Z-value4 (Excellent) 0.00 - 0.50 1 (Marginal) 1.51 - 2.003 (Good) 0.51 - 1.00 0 (Unsatisfactory) greater than 2.002 (Satisfactory) 1.01 - 1.50 NR (Not Rated)
Analyte = Se (Selenium) SiO2 (Silica) Sr (Strontium) Tl (Thallium) U (Uranium) V (Vanadium) Zn (Zinc)MPV = 5.49 µ g/L 11.5 mg/L 190 µ g/L 13.8 µ g/L 5.04 µ g/L 14.4 µ g/L 19.2 µ g/L
F-pseudosigma = 0.83 0.7 7 1.6 0.32 1.7 1.9Lab RV Rating RV Rating RV Rating RV Rating RV Rating RV Rating RV Rating
193 4.57 2 -- -- -- -- -- -- -- -- -- -- < 25 NR198 <10 NR -- -- -- -- 14.3 4 -- -- -- -- < 50 NR203 5.30 4 11.7 4 -- -- -- -- -- -- -- -- 18.0 3204 5.30 4 -- -- -- -- 12.1 2 -- -- -- -- 16.5 2209 -- -- -- -- -- -- -- -- -- -- -- -- -- --212 5.21 4 12.2 2 189 4 13.9 4 -- -- 11.7 1 19.4 4215 6.00 3 -- -- -- -- -- -- -- -- 24.0 0 38.0 0219 5.50 4 11.0 3 193 4 14.0 4 4.80 3 14.0 4 20.0 4227 -- -- 5.8 0 -- -- -- -- 20.5 3234 6.60 2 11.6 4 182 3 15.1 3 -- -- 14.4 4 22.4 1236 <10 NR 6.0 0 192 4 -- -- < 10 0 16.0 1241 6.55 2 11.1 4 -- -- 12.8 3 -- -- 16.2 2 22.4 1247 6.19 3 13.0 0 192 4 15.7 2 -- -- 15.0 4 23.3 0254 -- -- 11.9 3 199 3 -- -- 4.16 0 -- -- 20.2 3255 7.15 1 -- -- -- -- -- -- -- -- -- -- 20.2 3259 -- -- 11.7 4 190 4 -- -- -- -- -- -- 18.2 3265 9.00 0 5.8 0 190 4 13.0 4 4.70 2 14.0 4 18.0 3268 -- -- -- -- -- -- -- -- -- -- -- -- -- --273 -- -- 12.8 1 211 0 -- -- -- -- -- -- 18.7 4274 -- -- 10.6 2 -- -- -- -- -- -- -- -- -- --277 1.07 0 -- -- -- -- -- -- -- -- -- -- 9.5 0279 -- -- -- -- -- -- -- -- -- -- -- -- -- --282 5.60 4 5.5 0 -- -- 8.5 0 6.80 0 14.4 4 19.8 4287 5.20 4 -- -- -- -- -- -- -- -- -- -- 18.0 3292 6.00 3 -- -- -- -- -- -- -- -- -- -- 19.0 4302 -- -- -- -- -- -- -- -- -- -- -- -- -- --304 -- -- 11.5 4 -- -- -- -- -- -- 12.0 2 19.9 4305 -- -- -- -- -- -- -- -- -- -- -- -- 15.4 0307 4.82 3 -- -- -- -- -- -- -- -- -- -- 25.0 0308 -- -- -- -- -- -- -- -- -- -- -- -- 26.5 0309 -- -- 5.9 0 -- -- -- -- -- -- -- -- -- --312 -- -- 15.1 0 -- -- -- -- -- -- -- -- -- --
21

Table 6. Laboratory performance ratings for standard reference sample M-152 (major constituents)
[MPV, most probable value; mg/L, micrograms per liter; mg/L, milligrams per liter; mS/cm, microsiemens per centimeter; Lab, laboratory number; OLR, overall laboratory rating for all reported values; V/15, number of reported values of 15 possible values; RV, reported value; <, less than: NR, not rated; --, not reported.]Rating Absolute Z-value Rating Absolute Z-value4 (Excellent) 0.00 - 0.50 1 (Marginal) 1.51 - 2.003 (Good) 0.51 - 1.00 0 (Unsatisfactory) greater than 2.002 (Satisfactory) 1.01 - 1.50 NR (Not Rated)
Analyte = Alkalinity 1 B (Boron) Ca (Calcium) Cl (Chloride) DSRD (Dissolved Solids)
MPV = 6.00 mg/L 92.2 µg/L 3.63 mg/L 17.3 mg/L 66.5 mg/LF-pseudosigma = 1.49 7.8 0.18 0.9 8.2
Lab OLR V/15 RV Rating RV Rating RV Rating RV Rating RV Rating1 3.9 14 5.86 NR 93.0 4 3.69 4 16.9 4 66.0 43 3.4 14 6.00 NR 91.0 4 3.69 4 18.4 2 71.0 3
10 3.5 11 4.10 NR -- -- 3.60 4 17.5 4 66.0 411 2.9 15 5.00 NR 93.0 4 3.77 3 18.0 3 68.0 412 2.0 6 -- -- -- -- -- -- 14.0 0 72.0 313 2.8 13 7.55 NR -- -- 3.59 4 16.7 3 61.3 323 3.3 6 6.10 NR -- -- -- -- 17.5 4 -- --24 2.8 12 6.74 NR 97.0 3 3.88 2 17.0 4 -- --25 1.7 7 11.00 NR -- -- -- -- 17.8 3 36.0 026 2.1 12 8.40 NR 85.6 3 2.60 0 19.1 1 66.0 432 3.8 8 -- -- 91.5 4 3.70 4 -- -- -- --33 3.8 11 3.74 NR -- -- 3.70 4 16.8 3 -- --38 3.7 9 6.34 NR -- -- 3.58 4 -- -- 63.0 439 2.1 12 6.50 NR 74.2 0 3.31 1 20.0 0 -- --42 2.6 14 7.56 NR 91.4 4 3.55 4 17.5 4 -- --43 3.5 4 < 20 NR -- -- -- -- 17.0 4 74.0 345 2.5 10 < 20 NR -- -- 3.41 2 18.5 2 70.0 446 2.1 12 0.22 NR 92.2 4 3.58 4 -- -- 106.0 048 2.7 11 < 5 NR 94.0 4 3.98 1 18.0 3 71.0 350 3.1 12 4.99 NR 96.7 3 3.79 3 16.6 3 63.0 451 3.0 10 4.30 NR -- -- 3.31 1 17.9 3 74.0 357 2.6 13 6.00 NR 96.9 3 3.63 4 22.0 0 -- --59 3.5 2 4.60 NR -- -- -- -- -- -- -- --64 3.7 10 -- -- -- -- 3.67 4 17.5 4 -- --70 2.4 14 7.00 NR 129.0 0 3.98 1 17.3 4 70.0 476 3.8 8 -- -- -- -- 3.58 4 17.4 4 72.0 381 2.0 14 5.15 NR -- -- 3.36 1 17.2 4 40.0 085 2.9 12 4.75 NR -- -- 4.19 0 18.4 2 55.0 286 3.4 13 -- -- 81.2 2 3.60 4 17.3 4 -- --87 1.6 9 -- -- -- -- 2.40 0 16.0 2 88.0 089 2.2 13 6.10 NR -- -- 2.39 0 16.8 3 72.0 393 2.8 11 4.81 NR -- -- 3.58 4 19.0 1 -- --96 2.8 6 4.50 NR -- -- -- -- 16.0 2 71.0 397 2.8 11 6.30 NR -- -- -- -- 16.4 2 74.0 3
102 1.7 12 -- -- -- -- 3.97 1 17.7 4 -- --107 4.0 3 10.80 NR -- -- -- -- 17.3 4 -- --109 2.4 10 7.91 NR -- -- 3.80 3 18.0 3 55.0 2113 3.3 12 6.00 NR -- -- 3.75 3 17.9 3 55.0 2114 2.3 7 5.00 NR -- -- -- -- 16.6 3 46.0 0121 3.3 7 -- -- -- -- 3.60 4 -- -- -- --127 3.9 15 6.45 NR 93.6 4 3.61 4 17.4 4 64.5 4131 2.2 11 -- -- 90.0 4 3.60 4 18.3 2 -- --134 3.8 15 6.83 NR 92.1 4 3.72 3 17.1 4 68.4 4138 3.7 15 6.50 NR 93.8 4 3.67 4 17.3 4 70.0 4140 1.9 12 -- -- -- -- 3.60 4 15.2 0 100.0 0141 1.8 13 5.95 NR 81.5 2 3.81 2 18.2 3 44.5 0142 2.3 13 7.00 NR 97.9 3 2.98 0 18.2 3 64.0 4143 3.4 5 4.00 NR -- -- -- -- 16.8 3 72.0 3145 3.0 14 4.80 NR 104.0 1 3.85 2 17.7 4 -- --146 2.1 9 4.66 NR -- -- 3.35 1 17.2 4 44.0 0
1 Laboratories were not rated for alkalinity because the long term stability needs to be verified. The MPV for alkalinity is provided as an estimated value.
22

Table 6. Laboratory performance ratings for standard reference sample M-152 (major constituents)--Continued
[MPV, most probable value; mg/L, micrograms per liter; mg/L, milligrams per liter; mS/cm, microsiemens per centimeter; Lab, laboratory number; OLR, overall laboratory rating for all reported values; V/15, number of reported values of 15 possible values; RV, reported value; <, less than: NR, not rated; --, not reported.]Rating Absolute Z-value Rating Absolute Z-value4 (Excellent) 0.00 - 0.50 1 (Marginal) 1.51 - 2.003 (Good) 0.51 - 1.00 0 (Unsatisfactory) greater than 2.002 (Satisfactory) 1.01 - 1.50 NR (Not Rated)
Analyte = Alkalinity 1 B (Boron) Ca (Calcium) Cl (Chloride) DSRD (Dissolved Solids)
MPV = 6.00 mg/L 92.2 µg/L 3.63 mg/L 17.3 mg/L 66.5 mg/LF-pseudosigma = 1.49 7.8 0.18 0.9 8.2
Lab OLR V/15 RV Rating RV Rating RV Rating RV Rating RV Rating151 3.3 12 6.00 NR -- -- 3.88 2 17.1 4 61.0 3154 3.1 13 10.00 NR -- -- 3.60 4 17.2 4 -- --180 2.6 10 6.90 NR < 12.6 0 3.80 3 18.5 2 -- --183 2.2 5 -- -- -- -- -- -- 21.2 0 -- --185 3.4 9 5.05 NR -- -- 3.61 4 17.5 4 -- --190 2.5 12 5.60 NR -- -- 5.24 0 16.2 2 73.5 3191 3.2 10 -- -- -- -- 3.79 3 17.4 4 -- --193 2.8 6 4.00 NR -- -- 3.27 1 -- -- -- --196 3.0 3 -- -- -- -- -- -- 16.7 3 -- --203 2.9 10 3.80 NR -- -- 3.60 4 17.6 4 -- --204 4.0 1 3.65 NR -- -- -- -- 17.0 4 -- --208 3.5 2 -- -- -- -- -- -- 17.3 4 -- --209 2.9 7 -- -- -- -- 3.06 0 18.7 1 -- --212 2.9 15 6.02 NR 91.9 4 3.55 4 16.7 3 78.0 2213 3.3 3 5.00 NR -- -- -- -- 16.3 2 -- --215 1.9 12 6.00 NR 80.0 1 3.70 4 18.7 1 66.0 4219 2.3 9 -- -- -- -- 3.63 4 16.0 2 -- --227 3.5 8 6.00 NR -- -- 3.48 3 16.5 3 61.0 3234 3.5 15 7.80 NR 84.6 3 3.65 4 17.6 4 67.0 4236 2.4 12 6.40 NR 83.0 2 3.47 3 -- -- 72.0 3241 3.4 11 5.00 NR -- -- 3.80 3 17.7 4 -- --243 2.7 3 -- -- -- -- -- -- -- -- -- --244 3.5 2 13.10 NR -- -- -- -- -- -- -- --247 2.7 15 5.98 NR 143.0 0 3.58 4 17.4 4 63.0 4253 2.2 5 3.60 NR -- -- -- -- 17.0 4 -- --254 3.5 8 -- -- -- -- 3.78 3 17.4 4 -- --255 3.3 6 -- -- 93.8 4 3.64 4 -- -- -- --259 3.5 12 4.00 NR 85.0 3 3.70 4 17.6 4 -- --265 3.7 12 -- -- 94.0 4 3.65 4 17.8 3 -- --268 3.0 8 24.40 NR -- -- 2.95 0 16.6 3 -- --273 1.0 13 9.10 NR 61.4 0 4.34 0 15.7 1 66.0 4274 1.4 11 9.86 NR -- -- 2.37 0 34.4 0 -- --275 1.4 11 10.00 NR -- -- 3.00 0 20.0 0 60.0 3277 1.5 10 5.35 NR -- -- 3.73 3 14.9 0 -- --279 2.5 8 -- -- -- -- 3.00 0 17.0 4 -- --282 2.3 14 5.08 NR 97.5 3 3.58 4 15.8 1 102.0 0287 1.6 8 7.00 NR -- -- 2.58 0 16.2 2 -- --292 3.0 10 6.50 NR -- -- 5.40 0 17.3 4 -- --302 1.7 9 6.00 NR -- -- 3.91 1 15.3 0 -- --304 3.6 7 -- -- -- -- 3.70 4 -- -- -- --305 1.8 4 -- -- -- -- -- -- -- -- 31.0 0307 2.3 8 6.00 NR -- -- 4.95 0 19.0 1 -- --308 4.0 1 -- -- -- -- -- -- -- -- -- --309 0.2 6 11.60 NR -- -- 3.91 1 -- -- -- --312 1.3 3 11.50 NR -- -- -- -- -- -- -- --
1 Laboratories were not rated for alkalinity because the long term stability needs to be verified. The MPV for alkalinity is provided as an estimated value.
23

Table 6. Laboratory performance ratings for standard reference sample M-152 (major constituents)--Continued
[MPV, most probable value; mg/L, micrograms per liter; mg/L, milligrams per liter; mS/cm, microsiemens per centimeter; Lab, laboratory number; OLR, overall laboratory rating for all reported values; V/15, number of reported values of 15 possible values; RV, reported value; <, less than: NR, not rated; --, not reported.]Rating Absolute Z-value Rating Absolute Z-value4 (Excellent) 0.00 - 0.50 1 (Marginal) 1.51 - 2.003 (Good) 0.51 - 1.00 0 (Unsatisfactory) greater than 2.002 (Satisfactory) 1.01 - 1.50 NR (Not Rated)
Analyte = F (Fluoride) K (Potassium) Mg (Magnesium) Na (Sodium) (total Phosphorus) as PMPV = 1.98 mg/L 0.92 mg/L 0.722 mg/L 16.3 mg/L 0.386
F-pseudosigma = 0.12 0.09 0.047 0.9 0.024Lab RV Rating RV Rating RV Rating RV Rating RV Rating
1 1.98 4 0.89 4 0.730 4 16.9 3 -- --3 2.04 4 1.39 0 0.719 4 16.1 4 0.378 4
10 2.05 3 0.92 4 0.750 3 16.1 4 -- --11 1.60 0 0.64 0 0.700 4 15.5 3 0.390 412 -- -- -- -- -- -- 14.0 0 0.420 213 1.83 2 0.69 0 0.740 4 17.2 2 0.366 323 2.08 3 -- -- -- -- -- -- 0.348 124 -- -- 0.96 4 0.740 4 16.4 4 -- --25 1.64 0 -- -- -- -- 0.390 426 -- -- 0.57 0 0.450 0 13.2 0 -- --32 -- -- 0.96 4 0.730 4 16.7 4 -- --33 1.88 3 0.88 4 0.710 4 16.1 4 -- --38 -- -- 0.92 4 0.746 3 15.3 2 0.381 439 1.98 4 0.89 4 0.591 0 15.6 3 0.370 342 1.96 4 0.89 4 0.616 0 15.5 3 0.316 043 -- -- -- -- -- -- -- -- -- --45 2.00 4 1.02 2 0.630 1 18.2 0 -- --46 2.03 4 23.00 0 0.692 3 16.6 4 0.416 248 -- -- 0.95 4 0.770 2 17.0 3 -- --50 1.93 4 1.04 2 0.740 4 17.0 3 -- --51 -- -- 1.19 0 0.730 4 16.0 4 0.385 457 1.70 0 1.15 0 0.736 4 15.4 3 0.410 259 2.00 4 -- -- -- -- -- -- -- --64 -- -- 0.89 4 0.700 4 15.8 4 0.400 370 1.96 4 1.05 2 0.746 3 17.0 3 0.300 076 2.04 4 -- -- 0.743 4 15.6 3 -- --81 1.98 4 0.80 2 0.623 0 15.3 2 0.391 485 1.99 4 0.98 3 0.734 4 16.3 4 0.409 386 2.06 3 0.90 4 0.759 3 16.4 4 0.388 487 -- -- 0.98 3 0.600 0 16.6 4 0.393 489 1.85 2 0.88 4 0.613 0 13.7 0 0.387 493 0.92 0 0.79 2 0.720 4 15.4 3 0.430 196 2.07 3 -- -- -- -- -- -- -- --97 2.09 3 0.88 4 -- -- 16.0 4 0.380 4
102 3.17 0 0.52 0 0.940 0 50.7 0 0.371 3107 2.00 4 -- -- -- -- -- -- -- --109 1.95 4 0.77 1 0.650 1 16.0 4 -- --113 2.00 4 1.02 2 0.784 2 16.9 3 0.376 4114 1.93 4 -- -- -- -- -- -- 0.370 3121 -- -- 0.94 4 0.700 4 15.6 3 -- --127 2.05 3 0.84 3 0.745 4 16.1 4 0.394 4131 2.21 1 1.00 3 0.640 1 15.0 2 0.530 0134 1.96 4 0.90 4 0.709 4 16.8 3 0.390 4138 1.95 4 0.87 3 0.706 4 16.3 4 0.401 3140 2.03 4 0.83 2 0.700 4 16.4 4 0.260 0141 2.10 3 1.02 2 0.806 1 17.9 1 -- --142 2.09 3 < 1 NR < 1 NR 16.9 3 0.173 0143 -- -- -- -- -- -- -- -- 0.375 4145 2.00 4 1.01 3 0.790 2 16.5 4 0.390 4146 2.06 3 < 0.860 NR 0.675 2 15.2 2 -- --
24

Table 6. Laboratory performance ratings for standard reference sample M-152 (major constituents)--Continued
[MPV, most probable value; mg/L, micrograms per liter; mg/L, milligrams per liter; mS/cm, microsiemens per centimeter; Lab, laboratory number; OLR, overall laboratory rating for all reported values; V/15, number of reported values of 15 possible values; RV, reported value; <, less than: NR, not rated; --, not reported.]Rating Absolute Z-value Rating Absolute Z-value4 (Excellent) 0.00 - 0.50 1 (Marginal) 1.51 - 2.003 (Good) 0.51 - 1.00 0 (Unsatisfactory) greater than 2.002 (Satisfactory) 1.01 - 1.50 NR (Not Rated)
Analyte = F (Fluoride) K (Potassium) Mg (Magnesium) Na (Sodium) (total Phosphorus) as PMPV = 1.98 mg/L 0.92 mg/L 0.722 mg/L 16.3 mg/L 0.386
F-pseudosigma = 0.12 0.09 0.047 0.9 0.024Lab RV Rating RV Rating RV Rating RV Rating RV Rating151 2.04 4 0.92 4 0.830 0 16.4 4 -- --154 1.88 3 1.00 3 0.730 4 15.5 3 0.450 0180 2.08 3 < 1.63 NR 0.735 4 16.8 3 -- --183 2.00 4 -- -- -- -- -- -- 0.371 3185 -- -- 0.90 4 0.715 4 16.9 3 0.382 4190 1.96 4 0.91 4 0.910 0 16.2 4 0.367 3191 1.99 4 0.83 3 0.770 2 17.0 3 0.360 2193 -- -- 0.95 4 0.677 3 16.5 4 -- --196 1.80 2 -- -- -- -- -- -- -- --203 -- -- 0.92 4 0.620 0 15.0 2 0.374 4204 -- -- -- -- -- -- -- -- -- --208 -- -- -- -- -- -- -- -- -- --209 -- -- 0.95 4 0.683 3 16.2 4 -- --212 1.71 0 0.85 3 0.731 4 15.5 3 0.302 0213 -- -- -- -- -- -- -- -- 0.390 4215 1.87 3 -- -- 0.660 2 17.2 2 0.420 2219 1.63 0 0.91 4 0.700 4 16.0 4 -- --227 -- -- -- -- 0.698 3 -- -- 0.376 4234 2.18 1 0.81 2 0.722 4 16.2 4 0.380 4236 -- -- 0.84 3 0.670 2 15.6 3 0.410 2241 1.90 3 0.70 0 0.720 4 16.5 4 -- --243 -- -- -- -- -- -- -- -- 0.320 0244 -- -- -- -- -- -- -- -- -- --247 1.73 1 0.94 4 0.737 4 16.3 4 0.327 0253 -- -- -- -- -- -- -- -- 0.453 0254 -- -- 0.95 4 0.740 4 17.0 3 -- --255 2.04 4 -- -- 0.716 4 -- -- 0.416 2259 2.00 4 0.66 0 0.700 4 16.5 4 -- --265 2.10 3 0.88 4 0.740 4 16.2 4 -- --268 -- -- 1.10 1 0.740 4 16.2 4 -- --273 1.48 0 1.03 2 0.810 1 18.8 0 0.260 0274 1.79 1 0.98 3 0.950 0 12.3 0 0.390 4275 2.00 4 1.00 3 0.800 1 15.0 2 0.050 0277 1.00 0 0.98 3 1.100 0 14.0 0 0.280 0279 -- -- 0.94 4 0.600 0 16.8 3 -- --282 2.14 2 1.25 0 0.747 3 16.6 4 0.405 3287 1.79 1 0.82 2 0.641 1 14.3 0 -- --292 1.92 4 1.00 3 0.600 0 16.5 4 0.400 3302 1.94 4 1.05 2 0.899 0 18.2 0 -- --304 -- -- 0.90 4 0.690 3 16.7 4 -- --305 1.72 0 -- -- -- -- -- -- 0.386 4307 -- -- -- -- 0.750 3 16.5 4 0.410 2308 -- -- -- -- -- -- -- -- -- --309 -- -- 1.44 0 0.520 0 5.1 0 -- --312 -- -- -- -- -- -- -- -- -- --
25

Table 6. Laboratory performance ratings for standard reference sample M-152 (major constituents)--Continued
[MPV, most probable value; mg/L, micrograms per liter; mg/L, milligrams per liter; mS/cm, microsiemens per centimeter; Lab, laboratory number; OLR, overall laboratory rating for all reported values; V/15, number of reported values of 15 possible values; RV, reported value; <, less than: NR, not rated; --, not reported.]Rating Absolute Z-value Rating Absolute Z-value4 (Excellent) 0.00 - 0.50 1 (Marginal) 1.51 - 2.003 (Good) 0.51 - 1.00 0 (Unsatisfactory) greater than 2.002 (Satisfactory) 1.01 - 1.50 NR (Not Rated)
Analyte = pH SiO2 (Silica) SO4 (Sulfate) Sp Cond Sr (Strontium) V (Vanadium)MPV = 6.60 4.50 mg/L 3.76 mg/L 113 µS/cm 18.3 µg/L 30.0 µg/L
F-pseudosigma = 0.22 0.39 0.33 3 0.9 1.9Lab RV Rating RV Rating RV Rating RV Rating RV Rating RV Rating
1 6.71 4 4.58 4 3.71 4 114 4 17.8 3 30.5 43 6.69 4 4.12 3 < 10 NR 113 4 17.9 4 28.6 3
10 6.67 4 4.87 3 4.10 2 113 4 -- -- -- --11 6.92 3 4.53 4 4.00 3 110 3 19.0 3 29.0 312 6.35 3 -- -- -- -- 114 4 -- -- -- --13 6.83 3 22.50 0 3.85 4 115 4 -- -- 30.6 423 6.64 4 -- -- 3.72 4 111 4 -- -- -- --24 6.60 4 4.68 4 4.58 0 106 2 22.0 0 31.7 325 6.80 3 -- -- 5.00 0 120 2 -- -- -- --26 7.03 2 4.40 4 3.90 4 112 4 -- -- 31.6 332 -- -- 4.80 3 -- -- -- -- 18.9 3 30.2 433 6.72 4 4.56 4 3.78 4 115 4 18.6 4 -- --38 6.70 4 4.57 4 -- -- 112 4 -- -- -- --39 6.59 4 4.09 2 3.60 4 -- -- -- -- 19.9 042 6.37 3 4.09 2 4.20 2 119 2 17.1 2 31.7 343 6.34 3 -- -- < 10 NR 113 4 -- -- -- --45 6.57 4 -- -- 4.21 2 114 4 -- -- -- --46 7.43 0 -- -- 2.06 0 207 0 -- -- 30.0 448 6.40 3 -- -- 3.00 0 108 3 -- -- 30.0 450 6.30 3 4.41 4 3.02 0 113 4 -- -- -- --51 6.58 4 -- -- 3.93 3 113 4 -- -- -- --57 6.70 4 4.30 3 < 5 NR 110 3 18.7 4 29.1 459 -- -- 4.80 3 -- -- -- -- -- -- -- --64 6.80 3 4.15 3 3.82 4 112 4 -- -- -- --70 5.98 1 4.67 4 3.82 4 109 3 21.6 0 < 50 NR76 -- -- -- -- 3.79 4 113 4 -- -- -- --81 6.58 4 4.79 3 3.06 0 112 4 16.0 0 26.0 085 6.80 3 4.80 3 3.60 4 110 3 -- -- -- --86 6.62 4 -- -- 3.74 4 107 2 17.8 3 31.5 387 6.01 1 -- -- < 5 NR 70 0 -- -- -- --89 5.58 0 4.20 3 3.73 4 118 3 -- -- 32.1 293 6.68 4 -- -- 3.80 4 111 4 -- -- 29.1 496 6.75 4 -- -- 4.20 2 116 3 -- --97 6.74 4 4.45 4 2.87 0 117 3 -- -- 38.7 0
102 -- -- 4.84 3 3.44 3 117 3 20.5 0 31.7 3107 -- -- 4.41 4 -- -- -- -- -- -- -- --109 6.00 1 -- -- 3.29 2 116 3 -- -- -- --113 6.54 4 4.38 4 -- -- 114 4 18.1 4 -- --114 6.41 3 -- -- 5.69 0 117 3 -- -- -- --121 -- -- 4.49 4 -- -- -- -- 18.0 4 36.0 0127 6.60 4 4.43 4 3.66 4 114 4 18.2 4 29.9 4131 -- -- 4.10 2 4.12 2 -- -- 17.5 3 -- --134 6.64 4 4.37 4 3.48 3 113 4 18.3 4 29.7 4138 6.80 3 4.66 4 3.78 4 113 4 17.4 3 29.0 3140 5.31 0 4.93 2 1.00 0 110 3 -- -- -- --141 5.96 1 -- -- 3.70 4 100 0 20.6 0 30.6 4142 6.18 2 3.86 1 3.93 3 115 4 21.9 0 30.0 4143 6.58 4 -- -- -- -- 108 3 -- -- -- --145 6.75 4 4.26 3 3.69 4 111 4 19.0 3 35.0 0146 6.72 4 -- -- < 5 NR 127 0 -- -- 28.3 3
26

Table 6. Laboratory performance ratings for standard reference sample M-152 (major constituents)--Continued
[MPV, most probable value; mg/L, micrograms per liter; mg/L, milligrams per liter; mS/cm, microsiemens per centimeter; Lab, laboratory number; OLR, overall laboratory rating for all reported values; V/15, number of reported values of 15 possible values; RV, reported value; <, less than: NR, not rated; --, not reported.]Rating Absolute Z-value Rating Absolute Z-value4 (Excellent) 0.00 - 0.50 1 (Marginal) 1.51 - 2.003 (Good) 0.51 - 1.00 0 (Unsatisfactory) greater than 2.002 (Satisfactory) 1.01 - 1.50 NR (Not Rated)
Analyte = pH SiO2 (Silica) SO4 (Sulfate) Sp Cond Sr (Strontium) V (Vanadium)MPV = 6.60 4.50 mg/L 3.76 mg/L 113 µS/cm 18.3 µg/L 30.0 µg/L
F-pseudosigma = 0.22 0.39 0.33 3 0.9 1.9Lab RV Rating RV Rating RV Rating RV Rating RV Rating RV Rating151 6.65 4 4.49 4 3.76 4 112 4 17.4 3 -- --154 6.62 4 4.20 3 4.59 0 114 4 18.0 4 30.0 4180 6.60 4 -- -- 3.91 4 108 3 -- -- 63.8 0183 6.92 3 -- -- -- -- 103 1 -- -- -- --185 6.52 4 -- -- 3.78 4 132 0 -- -- -- --190 6.43 3 4.86 3 3.20 1 116 3 -- -- -- --191 -- -- 4.22 3 3.74 4 -- -- 18.0 4 -- --193 -- -- 4.91 2 -- -- 117 3 -- -- -- --196 -- -- -- -- 3.74 4 -- -- -- -- -- --203 6.55 4 5.13 1 3.31 2 114 4 -- -- -- --204 -- -- -- -- -- -- -- -- -- -- -- --208 -- -- -- -- 4.00 3 -- -- -- -- -- --209 6.70 4 -- -- 3.69 4 -- -- -- -- -- --212 6.71 4 4.66 4 3.96 3 118 3 18.8 3 28.9 3213 6.51 4 -- -- -- -- -- -- -- -- -- --215 6.60 4 -- -- 6.00 0 98 0 -- -- 24.0 0219 -- -- 4.00 2 4.77 0 -- -- 19.7 1 -- --227 6.56 4 -- -- 3.84 4 111 4 -- --234 6.44 4 4.55 4 4.05 3 114 4 18.2 4 28.1 3236 6.23 2 2.30 0 -- -- 113 4 18.0 4 27.0 1241 6.50 4 4.51 4 3.64 4 110 3 -- -- 30.2 4243 6.74 4 -- -- -- -- 114 4 -- -- -- --244 6.77 3 -- -- -- -- 112 4 -- -- -- --247 6.76 4 4.60 4 3.01 0 113 4 17.0 2 33.0 1253 6.81 3 -- -- < 1 0 113 4 -- -- -- --254 -- -- 4.59 4 3.80 4 -- -- 19.5 2 -- --255 -- -- -- -- 3.40 2 -- -- -- -- -- --259 6.50 4 4.48 4 3.80 4 114 4 19.0 3 -- --265 7.00 2 4.50 4 3.70 4 -- -- 18.5 4 30.0 4268 6.46 4 -- -- 3.77 4 112 4 -- -- -- --273 7.10 1 6.83 0 8.54 0 115 4 -- -- -- --274 5.70 0 4.11 3 0.32 0 114 4 -- -- -- --275 6.00 1 -- -- 3.10 1 125 0 -- -- -- --277 6.31 3 -- -- 3.81 4 120 2 -- -- -- --279 6.24 2 -- -- 3.68 4 108 3 -- -- -- --282 6.47 4 2.17 0 3.79 4 127 0 -- -- 29.2 4287 6.76 4 -- -- 3.46 3 -- -- -- -- -- --292 6.75 4 -- -- 3.70 4 113 4 -- -- -- --302 6.76 4 -- -- 1.64 0 115 4 -- -- -- --304 -- -- 4.30 3 -- -- -- -- 17.5 3 30.0 4305 6.82 3 -- -- -- -- -- -- -- -- -- --307 6.56 4 8.00 0 -- -- 113 4 -- -- -- --308 6.51 4 -- -- -- -- -- -- -- -- -- --309 7.74 0 -- -- 1.83 0 -- -- -- -- -- --312 6.51 4 5.54 0 -- -- 100 0 -- -- -- --
27

Table 7. Laboratory performance ratings for standard reference sample N-63 (nutrient constituents)
[MPV, most probable value mg/L, milligrams per liter; Lab, laboratory number; OLR, overall laboratory rating for all reported values;V/5, number of reported values of 5 possible values; RV, reported value; <, less than; NR, not rated; --, not reported.]Rating Absolute Z-value Rating Absolute Z-value4 (Excellent) 0.00 - 0.50 1 (Marginal) 1.51 - 2.003 (Good) 0.51 - 1.00 0 (Unsatisfactory) greater than 2.002 (Satisfactory) 1.01 - 1.50 NR (Not Rated)
Analyte = NH3 as N NH3 + Org N as N NO3 as N total P as P PO4 as P(Ammonia) (Ammonia + Organic N) (Nitrate) (total Phosphorus) (Orthophosphate as P)
MPV = 0.150 mg/L 0.200 mg/L 0.084 mg/L 0.158 mg/L 0.142 mg/LF-pseudosigma = 0.021 0.066 0.008 0.010 0.010
Lab OLR V/5 RV Rating RV Rating RV Rating RV Rating RV Rating
1 4.0 5 0.149 4 0.188 4 0.084 4 0.158 4 0.142 410 4.0 5 0.140 4 0.190 4 0.080 4 0.158 4 0.145 411 1.2 5 0.430 0 0.300 1 0.080 4 0.140 1 0.190 012 2.0 3 -- -- -- -- 0.090 3 0.130 0 0.134 313 2.0 4 0.123 2 -- -- 0.072 1 0.162 4 0.158 118 2.6 5 0.262 0 0.267 2 0.077 3 0.157 4 0.143 421 3.8 5 0.151 4 0.164 3 0.085 4 0.157 4 0.140 423 1.8 5 0.152 4 0.700 0 0.085 4 0.271 0 0.127 125 3.8 4 0.130 3 -- -- 0.080 4 0.160 4 0.138 433 2.7 3 0.150 4 -- -- 0.070 1 -- -- 0.150 336 1.4 5 1.227 0 0.260 3 0.086 4 0.180 0 0.120 038 4.0 5 0.150 4 0.170 4 0.084 4 0.163 4 0.139 442 1.5 2 -- -- -- -- 0.107 0 -- -- 0.134 346 2.6 5 0.128 2 0.260 3 0.100 0 0.158 4 0.146 448 0.6 5 0.400 0 0.530 0 0.160 0 0.150 3 0.074 050 3.8 5 0.143 4 0.230 4 0.082 4 0.158 4 0.135 351 3.0 5 0.160 4 0.160 3 0.100 0 0.153 4 0.144 453 4.0 2 -- -- -- -- 0.080 4 -- -- 0.138 459 2.4 5 0.110 1 0.200 4 0.090 3 0.100 0 0.140 464 4.0 4 0.150 4 -- -- 0.080 4 0.158 4 0.141 469 4.0 1 -- -- -- -- 0.080 4 -- -- -- --70 1.0 5 0.105 0 0.450 0 0.090 3 0.205 0 0.152 276 3.0 2 0.149 4 -- -- 0.075 2 -- --81 2.2 5 0.173 2 0.131 2 0.092 2 0.138 1 0.138 483 3.5 2 0.130 3 -- -- -- -- -- -- 0.140 485 3.8 4 0.152 4 -- -- 0.087 4 0.168 3 0.143 486 1.7 3 0.187 1 -- -- 0.017 0 0.159 4 -- --89 3.6 5 0.144 4 0.240 3 0.085 4 0.161 4 0.147 390 4.0 3 0.156 4 0.181 4 0.080 4 -- -- -- --93 2.5 4 0.130 3 -- -- 0.080 4 0.150 3 0.167 096 2.4 5 0.132 3 0.166 3 0.089 3 0.142 1 0.129 297 2.8 4 0.150 4 0.120 2 0.080 4 < 0.18 NR 0.160 1
102 1.8 5 0.170 3 0.200 4 0.000 0 0.147 2 0.116 0105 1.8 4 0.140 4 < 1 NR 0.070 1 0.220 0 0.152 2110 3.0 1 0.165 3 -- -- -- -- -- -- -- --113 4.0 4 0.145 4 < 0.5 NR 0.082 4 0.160 4 0.146 4114 2.0 3 0.120 2 -- -- 0.100 0 0.160 4127 3.0 5 0.133 3 0.178 4 0.093 2 0.155 4 0.131 2129 4.0 5 0.144 4 0.187 4 0.081 4 0.162 4 0.145 4134 3.6 5 0.148 4 0.135 3 0.090 3 0.158 4 0.139 4138 4.0 5 0.152 4 0.226 4 0.086 4 0.158 4 0.139 4140 2.2 5 0.160 4 0.190 4 0.078 3 0.110 0 0.110 0142 3.2 5 0.156 4 0.156 3 0.086 4 0.148 3 0.132 2143 3.8 5 0.170 3 0.200 4 0.086 4 0.154 4 0.143 4145 3.6 5 0.160 4 0.200 4 0.090 3 0.160 4 0.150 3146 2.2 5 0.100 0 0.230 4 0.082 4 0.150 3 1.800 0151 2.0 3 0.140 4 -- -- 0.093 2 -- -- 0.420 0154 2.2 5 0.149 4 0.308 1 0.050 0 0.164 3 0.137 3155 3.0 5 0.129 2 0.210 4 0.097 1 0.161 4 0.144 4158 2.4 5 0.157 4 0.156 3 0.146 0 0.142 1 0.142 4180 3.0 5 0.152 4 0.226 4 0.088 3 0.179 1 0.151 3183 2.0 4 0.340 0 -- -- 0.680 0 0.158 4 0.144 4185 3.3 4 0.129 2 -- -- 0.083 4 0.157 4 0.135 3190 3.0 2 0.171 2 -- -- -- -- -- -- 0.139 4193 2.7 3 0.101 0 < 0.2 NR 0.080 4 0.159 4 -- --
28

Table 7. Laboratory performance ratings for standard reference sample N-63 (nutrient constituents)--Continued
[MPV, most probable value mg/L, milligrams per liter; Lab, laboratory number; OLR, overall laboratory rating for all reported values;V/5, number of reported values of 5 possible values; RV, reported value; <, less than; NR, not rated; --, not reported.]Rating Absolute Z-value Rating Absolute Z-value4 (Excellent) 0.00 - 0.50 1 (Marginal) 1.51 - 2.003 (Good) 0.51 - 1.00 0 (Unsatisfactory) greater than 2.002 (Satisfactory) 1.01 - 1.50 NR (Not Rated)
Analyte = NH3 as N NH3 + Org N as N NO3 as N total P as P PO4 as P(Ammonia) (Ammonia + Organic N) (Nitrate) (total Phosphorus) (Orthophosphate as P)
MPV = 0.150 mg/L 0.200 mg/L 0.084 mg/L 0.158 mg/L 0.142 mg/LF-pseudosigma = 0.021 0.066 0.008 0.010 0.010
Lab OLR V/5 RV Rating RV Rating RV Rating RV Rating RV Rating
198 2.8 4 0.145 4 -- -- 0.084 4 0.139 1 0.132 2205 1.0 2 0.124 2 -- -- 0.128 0 -- -- -- --209 3.0 3 0.163 3 0.157 3 0.088 3 -- -- -- --212 1.2 5 0.150 4 0.444 0 0.240 0 0.135 0 0.154 2213 3.0 2 < 1 NR < 1 NR -- -- 0.160 4 0.130 2215 0.8 4 0.120 2 -- -- 0.070 1 0.220 0 0.180 0224 2.4 5 0.181 2 0.459 0 0.088 3 0.150 3 0.144 4227 3.6 5 0.141 4 0.168 4 0.081 4 0.156 4 0.132 2234 3.3 4 0.152 4 -- -- 0.080 4 0.150 3 0.152 2241 3.3 4 0.133 3 -- -- 0.077 3 0.160 4 0.137 3243 2.3 3 0.198 0 -- -- 0.080 4 0.150 3 -- --247 2.0 5 0.073 0 0.187 4 0.076 3 0.127 0 0.134 3253 2.0 4 0.151 4 -- -- 0.102 0 0.249 0 0.144 4255 4.0 3 0.145 4 -- -- < 0.1 NR 0.158 4 0.140 4282 0.2 5 0.380 0 0.370 0 0.104 0 0.178 1 0.176 0285 0.8 4 0.648 0 0.698 0 0.069 1 0.144 2 -- --287 0.0 3 0.248 0 -- -- 0.250 0 -- -- 0.190 0292 2.3 4 0.100 0 -- -- 0.080 4 0.170 2 0.135 3301 3.0 4 0.144 4 -- -- 0.068 1 0.165 3 0.140 4306 2.5 4 0.165 3 0.192 4 0.063 0 0.166 3 -- --307 2.0 4 0.127 2 -- -- 0.093 2 0.178 1 0.148 3308 0.0 1 < 0.15 NR 0.520 0 < 0.15 NR < 0.15 NR < O.15 NR312 3.5 2 0.134 3 -- -- -- -- -- -- 0.143 4313 3.0 5 0.163 3 0.278 2 0.081 4 0.164 3 0.136 3314 1.6 5 0.165 3 0.487 0 0.091 3 0.170 2 0.166 0316 3.8 5 0.154 4 0.199 4 0.084 4 0.166 3 0.140 4317 2.7 3 0.157 4 -- -- 0.115 0 -- -- 0.142 4318 4.0 5 0.156 4 0.200 4 0.081 4 0.155 4 0.145 4319 1.6 5 0.060 0 0.230 4 0.100 0 0.180 0 0.146 4320 2.8 5 0.120 2 0.214 4 0.081 4 0.148 3 0.127 1321 3.3 4 0.150 4 -- -- 0.078 3 0.158 4 0.156 2
29

Table 8. Laboratory performance ratings for standard reference sample N-64 (nutrient constituents)
[MPV, most probable value mg/L, milligrams per liter; Lab, laboratory number; OLR, overall laboratory rating for all reported values;V/5, number of reported values of 5 possible values; RV, reported value; <, less than; --, not reported.]Rating Absolute Z-value Rating Absolute Z-value
4 (Excellent) 0.00 - 0.50 1 (Marginal) 1.51 - 2.003 (Good) 0.51 - 1.00 0 (Unsatisfactory) greater than 2.002 (Satisfactory) 1.01 - 1.50 NR (Not Rated)
Analyte = NH3 as N NH3 + Org N as N NO3 as N total P as P PO4 as P(Ammonia) (Ammonia + Organic N) (Nitrate) (total Phosphorus) (Orthophosphate as P)
MPV = 1.38 mg/L 1.54 mg/L 1.26 mg/L 0.883 mg/L 0.860 mg/LF-pseudosigma = 0.08 0.13 0.04 0.041 0.034
Lab OLR V/5 RV Rating RV Rating RV Rating RV Rating RV Rating1 3.6 5 1.43 3 1.51 4 1.25 4 0.862 4 0.891 33 3.0 5 1.28 2 1.52 4 1.31 2 0.884 4 0.826 3
10 3.8 5 1.38 4 1.49 4 1.24 3 0.877 4 0.867 411 2.2 5 1.63 0 1.80 1 1.29 3 0.900 4 0.900 312 1.4 5 1.10 0 2.40 0 1.24 3 0.787 0 0.840 413 3.3 4 1.33 3 -- -- 1.26 4 0.889 4 0.816 218 3.4 5 1.32 3 1.65 3 1.23 3 0.887 4 0.869 423 3.8 5 1.35 4 1.57 4 1.26 4 0.860 3 0.850 425 2.3 4 1.31 3 -- -- 1.24 3 0.810 1 0.909 226 1.5 2 -- -- -- -- 1.65 0 -- -- 0.830 336 2.2 5 0.02 0 1.60 4 1.24 3 1.610 0 0.840 438 3.4 5 1.41 4 1.41 3 1.26 4 0.920 3 0.836 342 3.5 2 -- -- -- -- 1.29 3 -- -- 0.871 446 3.2 5 1.34 3 1.66 3 1.26 4 0.894 4 0.904 253 3.5 2 -- -- -- -- 1.24 3 -- -- 0.856 459 2.6 5 1.39 4 1.50 4 1.34 0 0.800 1 0.840 464 3.5 4 1.36 4 -- -- 1.21 2 0.875 4 0.846 469 3.0 1 -- -- -- -- 1.24 3 -- -- -- --70 2.2 5 0.76 0 1.90 0 1.26 4 0.885 4 0.901 376 2.0 3 1.40 4 -- -- 1.16 0 -- -- 0.799 283 4.0 2 1.38 4 -- -- -- -- -- -- 0.860 485 2.8 4 1.41 4 -- -- 1.32 1 0.947 2 0.880 487 3.0 5 1.42 4 1.64 3 1.26 4 0.988 0 0.881 489 3.4 5 1.34 3 1.50 4 1.29 3 0.889 4 0.884 390 3.0 3 1.50 2 1.46 3 1.25 4 -- -- -- --93 2.3 4 1.30 2 -- -- 1.29 3 0.880 4 1.040 096 3.2 5 1.30 3 1.52 4 1.31 2 0.851 3 0.869 4
102 1.8 5 1.22 1 1.48 4 1.21 2 0.831 2 0.717 0105 2.0 5 1.34 3 1.56 4 1.24 3 1.120 0 1.230 0107 3.5 4 1.40 4 -- -- 1.29 3 0.856 3 0.848 4113 3.8 5 1.38 4 1.44 3 1.27 4 0.871 4 0.855 4114 1.7 3 1.28 2 -- -- 1.36 0 0.840 3127 3.4 5 1.39 4 1.64 3 1.24 3 0.920 3 0.863 4129 2.4 5 1.28 2 2.09 0 1.31 2 0.877 4 0.855 4134 2.6 5 1.51 1 1.32 1 1.27 4 0.911 3 0.859 4138 3.6 5 1.35 4 1.60 4 1.25 4 0.886 4 0.815 2140 1.4 5 1.65 0 1.68 2 1.20 1 0.770 0 0.850 4143 3.2 5 1.35 4 1.49 4 1.16 0 0.877 4 0.861 4145 2.8 5 1.45 3 1.65 3 1.25 4 0.910 3 0.925 1146 2.6 5 1.40 4 1.60 4 1.30 2 0.860 3 0.700 0151 1.3 3 1.50 2 -- -- 1.31 2 -- -- 2.720 0154 2.8 5 1.37 4 1.54 4 1.24 3 0.981 0 0.891 3155 3.2 5 1.40 4 1.57 4 1.09 0 0.904 4 0.860 4158 2.4 5 1.46 3 1.30 1 1.32 1 0.878 4 0.893 3180 3.2 5 1.43 3 1.56 4 1.30 2 0.883 4 0.888 3183 2.3 3 1.50 2 -- -- -- -- 0.830 2 0.830 3185 3.3 4 1.39 4 -- -- 1.27 4 0.907 3 0.912 2190 2.5 2 1.51 1 -- -- -- -- -- -- 0.878 4193 2.0 4 1.08 0 1.54 4 1.28 3 0.803 1 -- --198 3.3 4 1.37 4 -- -- 1.26 4 0.882 4 0.782 1200 3.3 4 1.40 4 -- -- 1.22 2 0.910 3 0.850 4204 2.2 5 1.43 3 1.87 0 1.31 2 0.871 4 0.904 2205 4.0 2 1.42 4 -- -- 1.26 4 -- -- -- --208 3.0 2 -- -- -- -- 1.31 2 -- -- 0.850 4209 3.3 3 1.43 3 1.43 3 1.25 4 -- -- -- --
30

Table 8. Laboratory performance ratings for standard reference sample N-64 (nutrient constituents)--Continued
[MPV, most probable value mg/L, milligrams per liter; Lab, laboratory number; OLR, overall laboratory rating for all reported values;V/5, number of reported values of 5 possible values; RV, reported value; <, less than; --, not reported.]Rating Absolute Z-value Rating Absolute Z-value
4 (Excellent) 0.00 - 0.50 1 (Marginal) 1.51 - 2.003 (Good) 0.51 - 1.00 0 (Unsatisfactory) greater than 2.002 (Satisfactory) 1.01 - 1.50 NR (Not Rated)
Analyte = NH3 as N NH3 + Org N as N NO3 as N total P as P PO4 as P(Ammonia) (Ammonia + Organic N) (Nitrate) (total Phosphorus) (Orthophosphate as P)
MPV = 1.38 mg/L 1.54 mg/L 1.26 mg/L 0.883 mg/L 0.860 mg/LF-pseudosigma = 0.08 0.13 0.04 0.041 0.034
Lab OLR V/5 RV Rating RV Rating RV Rating RV Rating RV Rating212 1.8 5 1.44 3 1.44 3 1.16 0 0.800 1 0.904 2213 2.8 4 1.40 4 2.30 0 -- -- 0.850 3 0.850 4215 3.4 5 1.37 4 1.50 4 1.25 4 0.920 3 0.920 2224 2.6 5 1.54 1 1.51 4 1.32 1 0.875 4 0.896 3227 2.2 5 1.49 2 2.35 0 1.22 2 0.858 3 0.866 4234 1.8 4 1.42 4 -- -- 1.32 1 0.820 2 0.670 0243 2.7 3 1.47 2 -- -- 1.27 4 0.830 2 -- --247 3.0 5 1.31 3 1.45 3 1.24 3 0.822 2 0.846 4253 3.0 4 1.41 4 -- -- 1.38 0 0.883 4 0.855 4255 3.8 4 1.42 4 -- -- 1.27 4 0.920 3 0.856 4282 2.4 5 1.30 2 1.21 0 1.27 4 0.842 3 0.831 3285 0.0 4 0.70 0 0.72 0 1.18 0 0.987 0 -- --287 1.0 3 2.28 0 -- -- 1.17 0 -- -- 0.830 3291 4.0 1 -- -- -- -- 1.27 4 -- -- -- --292 2.3 4 0.98 0 -- -- 1.30 2 0.920 3 0.845 4306 0.8 4 0.78 0 0.89 0 0.62 0 0.911 3 -- --312 0.0 1 1.03 0 -- -- -- -- -- -- -- --313 4.0 5 1.38 4 1.56 4 1.27 4 0.899 4 0.863 4316 3.8 5 1.42 4 1.49 4 1.26 4 0.913 3 0.865 4319 2.0 5 1.38 4 1.46 3 1.23 3 1.070 0 1.000 0320 2.2 5 1.37 4 2.66 0 1.28 3 2.000 0 0.876 4
31

Table 9. Laboratory performance ratings for standard reference sample P-33 (low ionic strength constituents)
[MPV, most probable value; mg/L, milligrams per liter; µs/cm, microseimens per centimeter at 25 o C; Lab, laboratory number; OLR, overall laboratory rating
for all reported values; V/10, number of reported values of 10 possible values; RV, reported value; <, less than; NR, not rated; --, not reported.]Rating Absolute Z-value Rating Absolute Z-value4 (Excellent) 0.00 - 0.50 1 (Marginal) 1.51 - 2.003 (Good) 0.51 - 1.00 0 (Unsatisfactory) greater than 2.002 (Satisfactory) 1.01 - 1.50 NR (Not Rated)
Analyte = Acidity as CaCO3 Ca (Calcium) Cl (Chloride) F (Fluoride) K (Potassium) Mg (Magnesium)MPV = Insufficient data 0.322 mg/L 2.38 mg/L 0.105 mg/L 0.110 mg/L 0.100 mg/L
F-pseudosigma = 0.043 0.18 0.039 0.015 0.015Lab OLR V/10 RV Rating RV Rating RV Rating RV Rating RV Rating RV Rating
1 3.1 10 2.50 4 0.319 4 2.51 3 < 0.1 NR 0.117 4 0.099 42 2.3 8 -- -- 0.242 1 1.79 0 0.112 4 0.112 4 0.119 23 2.0 9 < 10 NR 0.354 3 1.69 0 0.137 3 0.532 0 0.134 0
11 1.5 10 -- -- 0.400 1 2.00 0 0.080 3 < 0.05 0 0.100 412 2.0 3 -- -- -- -- -- -- -- -- -- -- -- --25 3.0 6 3.00 4 -- -- 2.40 4 0.090 4 -- -- -- --33 3.7 10 -- -- 0.310 4 2.39 4 0.100 4 0.100 3 0.090 338 3.8 8 0.31 4 0.320 4 -- -- 0.120 3 0.099 442 2.4 7 -- -- 0.302 4 2.31 4 0.110 4 0.107 4 0.068 045 2.0 7 -- -- -- -- 2.46 4 0.085 3 0.280 0 -- --46 2.9 9 -- -- 0.322 4 2.35 4 0.075 3 0.157 0 0.102 448 2.1 9 -- -- 0.346 3 2.00 0 -- -- 0.132 2 0.116 259 3.5 6 -- -- -- -- 2.38 4 0.150 2 -- -- -- --64 2.1 9 -- -- 0.390 1 2.43 4 -- -- 0.060 0 0.110 381 3.1 11 1.40 4 0.321 4 2.46 4 0.105 4 0.082 1 0.094 483 3.5 2 -- -- -- -- -- -- 0.140 3 -- --86 3.0 8 -- -- 0.281 3 2.29 3 0.100 4 -- -- 0.111 389 2.7 11 3.53 4 0.170 0 2.36 4 0.100 4 0.100 3 0.100 493 3.6 10 -- -- 0.310 4 2.38 4 0.070 3 0.120 3 0.080 2
102 0.9 9 -- -- 0.230 0 4.77 0 0.820 0 0.060 0 0.130 1107 4.0 2 -- -- -- -- -- -- -- -- -- -- -- --113 3.0 10 -- -- 0.362 3 2.46 4 0.114 4 0.145 0 0.111 3127 3.5 11 4.10 4 0.337 4 2.18 2 0.094 4 0.106 4 0.115 2134 3.9 10 -- -- 0.320 4 2.30 4 0.115 4 0.111 4 0.100 4138 3.9 9 -- -- 0.340 4 2.36 4 < 0.10 NR 0.110 4 0.095 4140 3.0 10 -- -- 0.337 4 2.28 3 0.138 3 0.091 2 0.100 4141 2.0 10 61.00 0 0.357 3 2.30 4 0.110 4 0.177 0 0.140 0143 3.5 4 -- -- -- -- 2.59 2 -- -- -- -- -- --145 2.1 9 -- -- 0.350 3 2.38 4 0.070 3 0.040 0 < 0.19 NR146 3.0 5 < 5.79 NR < 0.313 NR 2.13 2 0.130 3 < 1 NR < 0.5 NR155 2.4 5 -- -- 0.468 0 -- -- -- -- -- -- 0.211 0180 3.1 9 -- -- 0.358 3 2.43 4 0.171 1 < 1.63 NR 0.115 2183 2.2 5 -- -- -- -- 5.04 0 0.140 3 -- -- -- --185 3.0 8 -- -- 0.326 4 2.42 4 -- -- 0.109 4 0.098 4190 2.3 10 -- -- 0.800 0 1.81 0 0.103 4 0.120 3 0.190 0191 2.9 8 -- -- 0.320 4 2.34 4 0.080 3 0.080 1 0.100 4193 2.8 5 -- -- 0.290 3 -- -- -- -- 0.100 3 0.095 4196 3.3 4 -- -- -- -- 2.21 3 0.074 3 -- --203 2.9 7 -- -- 0.260 2 2.60 2 -- -- 0.120 3 < 0.10 NR204 4.0 2 -- -- -- -- -- -- -- -- -- -- -- --208 1.0 2 -- -- -- -- 2.60 2 -- -- -- -- -- --209 3.1 7 -- -- 0.247 1 2.30 4 -- -- 0.098 3 0.094 4215 0.9 8 2.00 4 0.230 0 2.70 1 -- -- -- -- -- --227 2.5 6 -- -- 0.322 4 2.77 0 -- -- -- -- 0.096 4228 2.0 9 20.70 0 0.240 1 2.44 4 -- -- 0.040 0 0.050 0237 3.5 8 1.01 4 0.320 4 2.58 2 -- -- 0.110 4 0.090 3238 3.4 5 -- -- 0.320 4 2.58 2 -- -- 0.110 4 0.100 4241 2.1 10 -- -- 0.292 3 2.08 1 0.100 4 0.128 2 0.126 1243 4.0 2 -- -- -- -- -- -- -- -- -- -- -- --244 4.0 2 -- -- -- -- -- -- -- -- -- -- -- --247 3.5 8 -- -- 0.335 4 2.22 3 0.080 3 < 0.20 NR < 0.2 NR255 3.0 4 -- -- 0.334 4 -- -- < 0.5 NR -- -- 0.098 4265 2.9 7 -- -- 0.340 4 2.10 1 <0.1 NR 0.110 4 0.100 4268 2.8 8 -- -- 0.400 1 2.39 4 -- -- 0.150 0 0.110 3273 2.4 11 3.05 4 0.290 3 2.21 3 0.119 4 0.110 4 0.100 4274 0.6 11 15.99 0 1.980 0 19.68 0 0.002 0 0.100 3 0.950 0279 2.4 8 -- -- 0.950 0 2.30 4 -- -- 0.130 2 0.180 0282 2.7 10 9.85 2 0.310 4 1.63 0 0.160 2 0.095 4287 2.1 10 1.00 4 0.403 1 3.80 0 0.240 0 0.098 3 0.110 3301 2.4 7 -- -- 0.291 3 -- -- -- -- 0.110 4 0.089 3312 4.0 3 -- -- -- -- -- -- -- -- -- -- -- --321 2.7 7 -- -- 0.370 2 2.40 4 -- -- -- -- -- --
32

Table 9. Laboratory performance ratings for standard reference sample P-33 (low ionic strength constituents)--Continued
[MPV, most probable value; mg/L, milligrams per liter; µs/cm, microseimens per centimeter at 25 o C; Lab, laboratory number; OLR, overall laboratory rating
for all reported values; V/10, number of reported values of 10 possible values; RV, reported value; <, less than; NR, not rated; --, not reported.]Rating Absolute Z-value Rating Absolute Z-value4 (Excellent) 0.00 - 0.50 1 (Marginal) 1.51 - 2.003 (Good) 0.51 - 1.00 0 (Unsatisfactory) greater than 2.002 (Satisfactory) 1.01 - 1.50 NR (Not Rated)
Analyte = Na (Sodium) pH PO4 as P SO4 (Sulfate) Specific ConductanceMPV = 1.42 mg/L 4.67 0.045 mg/L 1.41 mg/L 20.8 µS/cm
F-pseudosigma = 0.10 0.13 0.007 0.17 2.4Lab RV Rating RV Rating RV Rating RV Rating RV Rating
1 1.37 4 5.01 2 0.025 0 1.43 4 18.1 22 1.93 0 4.50 3 -- -- 1.42 4 -- --3 1.53 2 4.39 2 0.046 4 < 10 NR 20.8 4
11 0.41 0 5.58 0 0.040 3 2.00 0 19.7 412 -- -- 4.04 0 0.039 3 -- -- 19.1 325 -- -- 4.84 3 0.038 3 -- -- 28.0 033 1.37 4 4.64 4 0.050 3 1.39 4 20.7 438 1.31 3 4.70 4 0.042 4 -- -- 21.6 442 1.21 1 -- -- < 0.05 NR 2.32 0 -- --45 4.09 0 4.44 3 -- -- 1.84 0 20.9 446 1.40 4 4.90 3 0.047 4 -- -- 61.0 048 1.46 4 6.00 0 0.045 4 1.00 0 21.0 459 -- -- 4.70 4 0.050 3 1.39 4 21.0 464 1.31 3 5.01 2 0.032 1 1.37 4 17.1 181 1.50 3 4.60 4 0.037 2 1.20 2 17.2 283 -- -- -- -- 0.042 4 -- -- -- --86 1.35 3 4.67 4 -- -- 1.61 2 18.0 289 1.16 0 4.39 2 0.042 4 1.44 4 25.0 193 1.39 4 4.78 4 0.045 4 1.37 4 20.6 4
102 50.06 0 -- -- 0.039 3 1.99 0 22.0 4107 -- -- 4.67 4 -- -- -- -- 20.8 4113 1.60 1 4.70 4 0.047 4 1.39 4 19.0 3127 1.42 4 4.66 4 0.053 2 1.43 4 22.0 4134 1.45 4 4.67 4 0.040 3 1.45 4 21.0 4138 1.40 4 4.67 4 0.043 4 1.32 3 20.6 4140 1.48 3 4.69 4 0.050 3 1.00 0 21.0 4141 1.57 2 4.50 3 -- -- 1.30 3 16.0 1143 -- -- 4.68 4 0.048 4 -- -- 20.0 4145 1.42 4 4.50 3 < 0.01 0 1.60 2 < 1 0146 1.45 4 4.61 4 < 0.021 NR < 5 NR 24.0 2155 -- -- 4.56 4 0.044 4 -- -- 20.8 4180 1.46 4 4.70 4 0.044 4 1.41 4 18.0 2183 -- -- 4.80 3 0.039 3 -- -- 18.0 2185 1.47 3 4.26 1 -- -- 1.37 4 64.5 0190 1.47 3 4.60 4 0.051 3 1.21 2 21.0 4191 1.46 4 -- -- 0.110 0 1.55 3 -- --193 1.28 2 -- -- -- -- -- -- 17.3 2196 -- -- -- -- 0.048 4 1.52 3 -- --203 1.22 1 4.58 4 0.045 4 < 2.5 NR 19.7 4204 -- -- 4.67 4 -- -- -- -- 21.4 4208 -- -- -- -- -- -- 2.00 0 -- --209 1.29 2 4.69 4 -- -- 1.45 4 -- --215 0.86 0 5.20 0 0.060 1 2.00 0 16.9 1227 -- -- 4.70 4 -- -- 1.82 0 19.5 3228 1.55 2 4.59 4 -- -- 1.28 3 21.5 4237 1.39 4 4.55 3 -- -- 1.39 4 -- --238 1.50 3 -- -- -- -- -- -- -- --241 1.36 3 4.42 2 0.036 2 1.29 3 11.0 0243 -- -- 4.63 4 -- -- -- -- 20.8 4244 -- -- 4.67 4 -- -- -- -- 20.8 4247 1.43 4 4.70 4 0.040 3 1.30 3 21.0 4255 -- -- -- -- 0.045 4 2.30 0 -- --265 1.40 4 7.00 0 -- -- 1.30 3 -- --268 1.45 4 4.68 4 -- -- 1.41 4 18.0 2273 0.14 0 6.31 0 0.289 0 1.11 1 22.7 3274 4.94 0 3.58 0 0.065 0 0.32 0 19.9 4279 1.54 2 4.75 4 -- -- 1.48 4 18.9 3282 1.37 4 4.35 2 0.041 3 1.30 3 22.4 3287 1.32 3 4.75 4 0.580 0 1.27 3 -- --301 1.33 3 4.75 4 0.256 0 -- -- 0.1 0312 -- -- 4.67 4 0.045 4 -- -- 21.7 4321 1.41 4 5.15 0 0.048 4 1.46 4 17.0 1
33

Table 10. Laboratory performance ratings for standard reference sample Hg-29 (Mercury)
[MPV, most probable value; ug/L, micrograms per liter; Lab, laboratory number; V/1, number of reported values of 1 value; RV, reported value; <, less than; NR, not rated.]Rating Absolute Z-value Rating Absolute Z-value4 (Excellent) 0.00 - 0.50 1 (Marginal) 1.51 - 2.003 (Good) 0.51 - 1.00 0 (Unsatisfactory) greater than 2.002 (Satisfactory) 1.01 - 1.50 NR (Not Rated)
Analyte = Hg (Mercury)MPV = 0.463 µg/L
F-pseudosigma = 0.052Lab V/1 RV Rating
1 1 0.438 43 1 0.463 4
10 1 0.560 111 1 0.440 412 1 0.600 013 < 4 NR32 1 0.550 139 1 0.457 445 1 0.110 046 1 0.448 448 1 0.390 250 1 0.540 259 1 0.480 470 1 0.474 481 1 0.388 286 1 0.453 487 1 0.600 089 1 0.470 496 1 0.460 4
113 1 0.450 4126 1 0.540 2127 1 0.419 3134 1 0.470 4138 1 0.420 3141 1 0.530 2142 1 0.460 4144 1 0.550 1145 1 0.390 2146 1 0.584 0147 1 0.437 4151 1 0.450 4154 1 0.200 0180 1 0.300 0193 1 0.466 4198 1 0.508 3203 1 0.500 3212 1 0.569 0213 1 0.500 3215 1 0.600 0219 1 0.490 3234 1 0.440 4241 1 0.410 2247 1 0.480 4255 1 0.359 1259 1 0.680 0265 1 0.470 4277 1 0.475 4282 1 0.432 3298 1 0.480 4304 1 0.440 4307 1 0.340 0308 1 0.390 2
34

Table 11. Statistical summary of reported data for standard reference sample T-159 (trace constituents)
Definition of analytical methods, abbreviations, and symbols
Analytical methods and codes
0. Other/Not reported
1. AA: direct, air = atomic absorption: direct air
2. AA: direct, N2O = atomic absorption: direct, nitrous oxide
3. AA: graphite furnace = atomic absorption: graphite furnace
4. ICP = inductively coupled plasma
5. DCP = direct current plasma
6. ICP/MS = inductively coupled plasma / mass spectrometry
7. IC = ion chromatography
8. AA: cold vapor = atomic absorption: cold vapor
11. AA: hydride = atomic absorption: hydride (reducing agent specified)
12. AA: flame emission = atomic absorption: flame emission
20. Titration color = Titration colorimetric (specify color reagent)
22. Color = colorimetric (color reagent specified)
Abbreviations and figure symbols
N = number of analyses--(excluding less than values)
MPV = most probable value
F-pseudosigma = nonparametric statistic deviation
Uh = upper hinge value
Lh = lower hinge value
Uwl = upper warning limit
Lwl = lower warning limit
Ucl = upper warning limit
Lcl = lower warning limitµg/L = micrograms per liter
mg/L = milligrams per liter
Lab = laboratory code number
NR = not rated, less than value reported or insufficient data
< = less than
-- = not reported
Constituent page Constituent pageAg Silver 36 Mg Magnesium 50
Al Aluminum 37 Mn Manganese 51
As Arsenic 38 Mo Molybdenum 52
B Boron 39 Na Sodium 53
Ba Barium 40 Ni Nickel 54
Be Beryllium 41 Pb Lead 55
Ca Calcium 42 Sb Antimony 56
Cd Cadmium 43 Se Selenium 57
Co Cobalt 44 SiO2 Silica 58
Cr Chromium 45 Sr Strontium 59
Cu Copper 46 Tl Thallium 60
Fe Iron 47 U Uranium 61
K Potassium 48 V Vanadium 62
Li Lithium 49 Zn Zinc 63
35

Table 11. Statistical summary of reported data for standard reference water sample T-159 (trace constituents)--ContinuedAnalyte : Ag (Silver) Concentration Unit : µg/L
SUMMARY
N = 3 16 24 16 1. AA: direct, air MPV = 9.67Minimum = 8.60 7.00 7.70 5.00 3. AA: graphite furnace F-pseudosigma = 0.91
Maximum = 12.00 12.20 40.00 12.70 4. ICP N = 59Median = 9.30 10.00 9.46 6. ICP/MS Uh = 10.38
F-pseudosigma = 1.02 0.87 0.44 Lh = 9.15
Lab Rating Z-value 1 3 4 6 Lab Rating Z-value 1 3 4 61 4 -0.20 -- -- -- 9.49 255 2 1.24 -- 10.80 -- --3 4 -0.21 -- -- 9.48 -- 259 4 -0.08 -- -- 9.60 --
11 4 0.36 -- -- 10.00 -- 265 3 -0.74 -- -- -- 9.0012 4 -0.30 -- 9.40 -- -- 273 3 -0.63 -- -- 9.10 --13 4 0.35 -- -- 9.99 -- 277 4 -0.41 -- -- 9.30 --23 0 2.13 -- -- 11.60 -- 282 0 2.79 -- 12.20 -- --32 4 -0.30 -- -- -- 9.40 292 0 8.07 -- -- 17.00 --39 3 -0.84 -- -- 8.91 -- 304 0 -2.17 -- -- 7.70 --42 4 0.00 -- -- -- 9.67 305 3 -0.69 -- 9.04 -- --46 4 0.47 -- -- 10.10 -- 307 4 0.09 -- 9.75 -- --48 4 -0.30 -- -- -- 9.40 309 2 1.46 -- -- 11.00 --50 4 0.25 -- -- -- 9.9057 3 0.69 -- -- 10.30 --59 3 -0.74 -- -- -- 9.0070 1 -1.84 -- 8.00 -- --81 0 -2.94 -- 7.00 -- --86 3 -0.85 -- -- 8.90 --87 3 0.69 -- -- 10.30 --89 3 -0.84 -- 8.91 -- --93 4 0.47 -- -- 10.10 --96 2 1.13 -- 10.70 -- --
102 0 33.40 -- -- 40.00 --113 3 0.86 -- 10.45 -- --114 0 2.57 12.00 -- -- --121 3 -0.63 -- -- -- 9.10126 2 1.46 11.00 -- -- --127 4 -0.24 -- 9.45 -- --131 NR -- -- -- < 30 --134 4 -0.12 -- -- 9.56 --138 4 -0.26 -- -- -- 9.43140 2 -1.18 8.60 -- -- --141 2 1.13 -- -- 10.70 --142 0 3.34 -- -- -- 12.70144 3 -0.52 -- 9.20 -- --146 1 1.91 -- -- 11.40 --151 4 -0.08 -- -- -- 9.60154 4 0.25 -- -- 9.90 --180 2 1.13 -- -- 10.70 --190 3 -0.52 -- 9.20 -- --193 3 0.58 -- 10.20 -- --198 NR -- -- -- < 50 --203 3 -0.74 -- 9.00 -- --204 0 -5.14 -- -- -- 5.00212 4 0.18 -- -- -- 9.83215 1 -1.84 -- 8.00 -- --219 2 1.46 -- -- -- 11.00234 4 0.36 -- -- 10.00 --236 4 0.36 -- -- 10.00 --241 4 -0.32 -- -- -- 9.38247 4 0.19 -- -- -- 9.84
7.008.009.00
10.0011.0012.00
ANALYTICAL METHOD CODE
CO
NC
EN
TRA
TIO
N
1 3 4 6
36

Table 11. Statistical summary of reported data for standard reference water sample T-159 (trace constituents)--ContinuedAnalyte : Al (Aluminum) Concentration Unit : µg/L
SUMMARY
N = 4 24 1 18 3. AA: graphite furnace MPV = 31.9Minimum = 31.0 24.0 70.0 27.0 4. ICP F-pseudosigma = 3.7
Maximum = 71.6 120.0 47.0 5. DCP N = 47Median = 32.2 31.2 6. ICP/MS Uh = 35.3
F-pseudosigma = 7.6 2.4 Lh = 30.4
Lab Rating Z-value 3 4 5 6 Lab Rating Z-value 3 4 5 61 4 -0.19 -- -- -- 31.2 273 4 -0.08 -- 31.6 -- --3 4 -0.25 -- 31.0 -- -- 282 0 4.12 -- -- -- 47.0
11 0 24.01 -- 120.0 -- -- 287 0 10.82 71.6 -- -- --13 4 -0.25 31.0 -- -- --23 4 0.08 -- 32.2 -- --26 4 0.33 -- 33.1 -- --32 4 -0.46 -- -- -- 30.233 0 10.38 -- -- 70.0 --39 0 4.52 -- 48.5 -- --42 NR -- -- -- < 3046 3 0.74 -- 34.6 -- --48 4 -0.25 -- -- -- 31.050 4 0.00 -- -- -- 31.957 4 0.05 -- 32.1 -- --59 4 0.08 -- -- -- 32.270 4 -0.14 -- -- -- 31.476 4 -0.22 -- -- -- 31.181 0 2.75 -- 42.0 -- --89 2 1.12 36.0 -- -- --93 1 -1.91 -- 24.9 -- --
102 3 -0.68 -- 29.4 -- --127 0 19.38 -- 103.0 -- --131 0 -2.15 -- 24.0 -- --134 4 0.03 -- 32.0 -- --138 4 -0.33 -- -- -- 30.7141 2 -1.44 -- 26.6 -- --142 NR -- -- < 30 -- --145 NR -- -- < 180 -- --146 NR -- -- < 36.9 -- --147 4 0.11 -- -- -- 32.3151 2 -1.23 -- -- -- 27.4154 3 -0.65 -- 29.5 -- --180 NR -- -- < 51.6 -- --190 4 0.25 32.8 -- -- --191 4 0.03 -- -- -- 32.0198 NR -- -- < 50 -- --203 3 -0.79 -- 29.0 -- --204 2 -1.01 -- -- -- 28.2209 4 0.16 -- 32.5 -- --212 0 9.84 -- 68.0 -- --219 2 -1.06 -- -- -- 28.0227 4 -0.38 -- 30.5 -- --234 1 1.77 -- 38.4 -- --236 0 6.30 -- 55.0 -- --241 3 -0.87 -- -- -- 28.7247 4 -0.14 -- -- -- 31.4254 4 -0.33 -- 30.7 -- --255 4 0.33 -- -- -- 33.1259 2 1.42 -- 37.1 -- --265 2 -1.34 -- -- -- 27.0
21.025.029.033.037.041.0
ANALYTICAL METHOD CODE
CO
NC
EN
TRA
TIO
N
3 4 6
37

Table 11. Statistical summary of reported data for standard reference water sample T-159 (trace constituents)--ContinuedAnalyte : As (Arsenic) Concentration Unit : µg/L
SUMMARY
N = 22 13 19 5 3. AA: graphite furnace MPV = 28.4Minimum = 19.0 22.6 26.0 25.6 4. ICP F-pseudosigma = 1.6
Maximum = 31.0 54.0 31.4 31.6 6. ICP/MS N = 59Median = 28.2 28.1 28.6 11na. AA: hydride NaBH4 Uh = 29.7
F-pseudosigma = 2.2 2.8 1.4 Lh = 27.5
Lab Rating Z-value 3 4 6 11na Lab Rating Z-value 3 4 6 11na1 3 0.56 29.3 -- -- -- 241 1 1.76 -- -- 31.2 --3 4 -0.19 -- 28.1 -- -- 247 1 1.63 -- -- 31.0 --
10 1 1.63 -- -- -- 31.0 255 2 1.19 -- -- 30.3 --11 4 -0.25 -- 28.0 -- -- 259 3 -0.56 -- 27.5 -- --13 4 -0.44 27.7 -- -- -- 265 4 0.06 -- -- 28.5 --23 0 -2.64 -- 24.2 -- -- 277 4 -0.50 -- 27.6 -- --26 3 -0.56 -- -- -- 27.5 282 1 2.01 -- -- -- 31.632 4 0.13 -- -- 28.6 -- 292 0 -5.90 19.0 -- -- --39 4 -0.25 28.0 -- -- -- 305 0 -5.12 20.2 -- -- --42 3 0.75 -- -- 29.6 -- 307 4 -0.44 27.7 -- -- --46 2 -1.38 26.2 -- -- -- 309 0 16.06 -- 54.0 -- --48 4 -0.31 -- -- 27.9 --50 4 -0.38 -- -- 27.8 --57 1 1.82 -- 31.3 -- --59 1 1.88 -- -- 31.4 --70 3 0.75 -- -- 29.6 --81 3 1.00 30.0 -- -- --86 2 -1.13 -- -- -- 26.687 1 -1.76 -- -- -- 25.689 4 0.00 28.4 -- -- --93 2 -1.32 -- 26.3 -- --96 4 -0.06 28.3 -- -- --97 4 0.50 29.2 -- -- --
102 0 -3.64 -- 22.6 -- --113 3 1.00 30.0 -- -- --121 4 0.06 -- -- 28.5 --126 1 1.63 31.0 -- -- --127 2 -1.13 26.6 -- -- --131 NR -- -- < 40 -- --134 3 0.82 -- 29.7 -- --138 4 0.00 -- -- 28.4 --141 0 2.32 -- 32.1 -- --142 4 0.38 -- -- 29.0 --144 0 -2.45 24.5 -- -- --145 0 11.04 -- 46.0 -- --146 3 0.63 -- 29.4 -- --147 4 -0.25 -- -- 28.0 --151 4 -0.38 -- -- 27.8 --154 4 0.25 28.8 -- -- --190 4 0.19 28.7 -- -- --191 4 0.50 -- -- 29.2 --193 0 -3.26 23.2 -- -- --198 4 0.44 29.1 -- -- --203 3 -0.56 27.5 -- -- --204 1 -1.51 -- -- 26.0 --212 3 -0.63 -- -- 27.4 --215 0 -2.13 25.0 -- -- --219 3 1.00 -- -- 30.0 --234 3 0.63 29.4 -- -- --236 NR -- -- < 45 -- --
23.5
25.5
27.5
29.5
31.5
33.5
ANALYTICAL METHOD CODE
CO
NC
EN
TRA
TIO
N
3 4 6 11na
38

Table 11. Statistical summary of reported data for standard reference water sample T-159 (trace constituents)--ContinuedAnalyte : B (Boron) Concentration Unit : µg/L
SUMMARY
N = 0 24 6 3. AA: graphite furnace MPV = 26.4Minimum = 12.0 25.0 4. ICP F-pseudosigma = 3.0
Maximum = 64.0 28.0 6. ICP/MS N = 30Median = 26.3 Uh = 28.2
F-pseudosigma = 3.4 Lh = 24.2
Lab Rating Z-value 3 4 61 3 0.61 -- 28.2 --3 1 1.85 -- 31.9 --
11 4 -0.13 -- 26.0 --24 4 -0.47 -- 25.0 --26 3 -0.74 -- 24.2 --32 4 0.24 -- -- 27.139 0 -3.00 -- 17.5 --42 NR -- -- -- < 3046 4 -0.30 -- 25.5 --48 4 -0.03 -- -- 26.350 3 0.54 -- -- 28.057 4 0.34 -- 27.4 --70 NR -- -- < 50 --86 0 -4.52 -- 13.0 --
127 4 -0.30 -- 25.5 --131 3 -0.81 -- 24.0 --134 4 0.03 -- 26.5 --138 4 0.30 -- 27.3 --141 0 7.99 -- 50.1 --142 NR -- -- < 30 --145 0 2.56 -- 34.0 --154 3 0.88 -- 29.0 --180 0 12.41 -- 63.2 --191 4 -0.47 -- -- 25.0212 3 0.61 -- 28.2 --234 4 0.20 -- 27.0 --236 3 -0.81 -- 24.0 --247 0 12.68 -- 64.0 --255 2 -1.21 -- 22.8 --259 0 -4.86 -- 12.0 --265 4 -0.47 -- -- 25.0273 0 -2.33 -- 19.5 --282 4 0.34 -- -- 27.4287 0 -8.47 < 1 -- --
17.519.521.523.525.527.529.531.533.535.5
ANALYTICAL METHOD CODE
CO
NC
EN
TRA
TIO
N
4 6
39

Table 11. Statistical summary of reported data for standard reference water sample T-159 (trace constituents)--ContinuedAnalyte: Ba (Barium) Concentration Unit : µg/L
1. AA: direct, air 4. ICP SUMMARY2. AA: direct, nitrous oxide 5. DCP3. AA: graphite furnace 6. ICP/MS 1. AA: direct, air MPV = 38.1
N = 1 0 2 34 1 16 2. AA: direct, nitrous oxide F-pseudosigma = 1.9Minimum = 50.0 38.5 34.1 43.0 35.7 3. AA: graphite furnace N = 54
Maximum = 40.8 46.9 40.9 4. ICP Uh = 39.5Median = 37.8 38.2 5. DCP Lh = 37.0
F-pseudosigma = 1.5 1.4 6. ICP/MSLab Rating Z-value 1 2 3 4 5 6 Lab Rating Z-value 1 2 3 4 5 6
1 4 0.03 -- -- -- 38.1 -- -- 247 1 1.54 -- -- -- -- -- 40.93 2 -1.43 -- -- -- 35.4 -- -- 259 4 -0.03 -- -- -- 38.0 -- --
11 3 -0.57 -- -- -- 37.0 -- -- 265 4 -0.03 -- -- -- 38.0 -- --13 4 -0.40 -- -- -- 37.3 -- -- 273 0 4.78 -- -- -- 46.9 -- --23 4 -0.13 -- -- -- 37.8 -- -- 277 0 -2.13 -- -- -- 34.1 -- --24 3 0.78 -- -- -- 39.5 -- -- 282 3 -0.67 -- -- -- -- -- 36.826 4 0.24 -- -- -- 38.5 -- -- 292 1 -1.65 -- -- -- 35.0 -- --32 4 0.08 -- -- -- -- -- 38.2 304 4 -0.46 -- -- -- 37.2 -- --33 0 2.67 -- -- -- -- 43.0 --39 3 -0.78 -- -- -- 36.6 -- --42 4 -0.03 -- -- -- -- -- 38.046 3 0.57 -- -- -- 39.1 -- --48 4 -0.03 -- -- -- -- -- 38.050 2 1.32 -- -- -- -- -- 40.557 4 -0.40 -- -- -- 37.3 -- --59 4 0.46 -- -- -- -- -- 38.970 4 0.03 -- -- -- -- -- 38.176 4 0.33 -- -- -- -- -- 38.781 2 -1.11 -- -- -- 36.0 -- --86 4 -0.24 -- -- -- 37.6 -- --87 4 0.24 -- -- 38.5 -- -- --89 NR -- -- < 50 -- -- --96 NR -- < 100 -- -- -- --97 2 1.48 -- -- 40.8 -- -- --
102 0 3.16 -- -- -- 43.9 -- --113 4 -0.13 -- -- -- 37.8 -- --121 3 -0.57 -- -- -- -- -- 37.0126 NR -- < 200 -- -- -- --127 3 -0.89 -- -- -- 36.4 -- --131 1 -1.65 -- -- -- 35.0 -- --134 4 -0.40 -- -- -- 37.3 -- --138 4 0.08 -- -- -- 38.2 -- --140 0 6.45 50.0 -- -- -- -- --141 2 1.48 -- -- -- 40.8 -- --142 2 1.11 -- -- -- -- -- 40.1145 3 0.51 -- -- -- 39.0 -- --146 3 0.84 -- -- -- 39.6 -- --151 4 -0.24 -- -- -- -- -- 37.6154 2 -1.27 -- -- -- 35.7 -- --180 2 1.48 -- -- -- 40.8 -- --191 3 0.51 -- -- -- -- -- 39.0198 NR -- -- -- < 50 -- --203 2 1.05 -- -- -- 40.0 -- --204 2 -1.27 -- -- -- -- -- 35.7212 4 0.35 -- -- -- 38.7 -- --215 3 -0.57 -- -- -- 37.0 -- --219 2 -1.11 -- -- -- -- -- 36.0234 4 -0.24 -- -- -- 37.6 -- --236 3 0.51 -- -- -- 39.0 -- --241 3 0.78 -- -- -- -- -- 39.5
32.534.536.538.540.542.5
ANALYTICAL METHOD CODE
CO
NC
EN
TRA
TIO
N
3 4 5 6
40

Table 11. Statistical summary of reported data for standard reference water sample T-159 (trace constituents)--ContinuedAnalyte : Be (Beryllium) Concentration Unit : µg/L
SUMMARY
N = 1 7 26 16 2. AA: direct, nitrous oxide MPV = 10.8Minimum = 12.0 8.9 9.0 8.0 3. AA: graphite furnace F-pseudosigma = 0.4
Maximum = 13.5 13.0 13.0 4. ICP Rating Criterion = 0.5Median = 10.5 10.9 10.8 6. ICP/MS N = 50
F-pseudosigma = 0.6 0.3 0.5 Uh = 11.1Lh = 10.5
Lab Rating Z-value 2 3 4 61 4 0.31 -- -- -- 11.03 4 -0.19 -- -- 10.7 --
11 4 0.37 -- -- 11.0 --13 4 0.37 -- -- 11.0 --23 0 -2.02 -- -- 9.7 --26 3 0.74 -- -- 11.2 --32 3 -0.74 -- -- -- 10.442 4 0.00 -- -- -- 10.846 4 -0.19 -- -- 10.7 --48 4 -0.19 -- -- -- 10.750 4 -0.37 -- -- -- 10.657 3 0.74 -- -- 11.2 --59 1 1.85 -- -- -- 11.870 0 2.22 -- -- -- 12.076 3 0.96 -- -- -- 11.381 2 -1.48 -- 10.0 -- --86 4 -0.37 -- -- 10.6 --89 0 5.00 -- 13.5 -- --93 1 -1.59 -- -- 9.9 --96 3 -0.74 -- 10.4 -- --
102 2 -1.11 -- -- 10.2 --113 3 0.56 -- -- 11.1 --114 0 2.22 12.0 -- -- --126 4 -0.37 -- 10.6 -- --127 4 -0.19 -- -- 10.7 --134 3 -0.56 -- -- 10.5 --138 3 -0.56 -- -- 10.5 --141 2 1.48 -- -- 11.6 --142 4 0.00 -- -- -- 10.8144 0 -3.52 -- 8.9 -- --145 4 0.37 -- -- 11.0 --146 4 0.19 -- -- 10.9 --151 2 -1.30 -- -- -- 10.1154 4 0.19 -- -- 10.9 --180 0 4.07 -- -- 13.0 --191 4 0.19 -- -- -- 10.9193 3 -0.56 -- 10.5 -- --198 2 1.11 -- 11.4 -- --204 0 -5.19 -- -- -- 8.0212 1 1.67 -- -- 11.7 --215 4 0.37 -- -- 11.0 --219 4 0.37 -- -- -- 11.0234 4 0.00 -- -- 10.8 --236 4 0.37 -- -- 11.0 --241 1 -1.76 -- -- -- 9.9247 0 4.07 -- -- -- 13.0265 4 0.37 -- -- 11.0 --282 4 -0.19 -- -- -- 10.7292 0 -3.33 -- -- 9.0 --304 4 -0.19 -- -- 10.7 --
9.5
10.0
10.5
11.0
11.5
12.0
ANALYTICAL METHOD CODE
CO
NC
EN
TRA
TIO
N
2 3 4 6
41

Table 11. Statistical summary of reported data for standard reference water sample T-159 (trace constituents)--ContinuedAnalyte : Ca (Calcium) Concentration Unit : mg/L
SUMMARY
N = 5 14 46 6 2 2 0. Other MPV = 25.5Minimum = 15.5 23.9 24.0 25.7 24.7 25.6 1. AA: direct, air F-pseudosigma = 0.8
Maximum = 33.1 27.4 33.4 29.2 25.8 25.8 4. ICP Rating Criterion = 1.3Median = 25.4 25.5 6. ICP/MS N = 75
F-pseudosigma = 0.6 0.8 12. Flame emission Uh = 26.320. Titrate: colorimetric Lh = 25.2
Lab Rating Z-value 0 1 4 6 12 20 Lab Rating Z-value 0 1 4 6 12 201 4 0.31 -- -- 25.9 -- -- -- 204 4 0.24 -- -- 25.8 -- -- --3 4 -0.47 -- -- 24.9 -- -- -- 209 4 -0.24 -- -- 25.2 -- -- --
11 4 0.39 -- -- 26.0 -- -- -- 212 2 -1.02 -- -- 24.2 -- -- --12 4 0.39 -- -- 26.0 -- -- -- 215 4 0.00 -- -- 25.5 -- -- --13 4 -0.39 -- -- 25.0 -- -- -- 219 4 0.16 -- -- -- 25.7 -- --23 2 1.49 -- 27.4 -- -- -- -- 227 4 -0.24 -- -- 25.2 -- -- --24 4 -0.08 -- -- 25.4 -- -- -- 234 4 -0.24 -- -- 25.2 -- -- --26 0 -7.84 15.5 -- -- -- -- -- 236 3 -0.88 -- -- 24.4 -- -- --32 4 0.16 -- -- -- 25.7 -- -- 241 4 0.24 -- -- -- -- 25.8 --33 2 1.18 27.0 -- -- -- -- -- 247 3 -0.55 -- -- 24.8 -- -- --39 2 -1.18 -- -- 24.0 -- -- -- 254 4 0.43 -- -- 26.1 -- -- --42 3 0.63 -- -- 26.3 -- -- -- 255 4 -0.16 -- -- 25.3 -- -- --45 2 -1.25 -- 23.9 -- -- -- -- 259 4 -0.08 -- -- 25.4 -- -- --46 4 -0.31 -- -- 25.1 -- -- -- 265 4 0.00 -- -- 25.5 -- -- --48 0 2.90 -- -- -- 29.2 -- -- 268 4 0.00 -- 25.5 -- -- -- --51 2 1.33 -- 27.2 -- -- -- -- 273 2 1.49 -- -- 27.4 -- -- --57 4 -0.24 -- -- 25.2 -- -- -- 274 4 0.09 -- -- -- -- -- 25.659 2 1.41 -- -- -- 27.3 -- -- 279 4 0.24 -- -- -- -- -- 25.864 0 6.20 -- -- 33.4 -- -- -- 282 4 0.24 -- -- -- 25.8 -- --70 3 0.78 -- -- 26.5 -- -- -- 287 3 0.75 -- 26.5 -- -- -- --76 4 -0.31 -- 25.1 -- -- -- -- 292 4 0.24 -- 25.8 -- -- -- --81 3 0.63 -- -- 26.3 -- -- -- 302 4 -0.26 25.2 -- -- -- -- --86 4 0.24 -- -- 25.8 -- -- -- 304 3 0.55 -- -- 26.2 -- -- --87 4 -0.47 24.9 -- -- -- -- -- 307 2 -1.18 -- 24.0 -- -- -- --89 3 -0.63 -- -- -- -- 24.7 -- 309 1 1.65 -- -- 27.6 -- -- --93 3 -0.71 -- -- 24.6 -- -- --
102 2 1.18 -- -- 27.0 -- -- --107 4 -0.24 -- 25.2 -- -- -- --109 4 -0.39 -- 25.0 -- -- -- --113 4 0.31 -- -- 25.9 -- -- --121 4 -0.08 -- -- 25.4 -- -- --126 4 -0.39 -- 25.0 -- -- -- --127 4 -0.08 -- -- 25.4 -- -- --131 4 -0.16 -- -- 25.3 -- -- --134 4 -0.16 -- -- 25.3 -- -- --138 4 -0.24 -- -- 25.2 -- -- --140 4 0.00 -- 25.5 -- -- -- --141 2 1.10 -- -- 26.9 -- -- --142 2 1.18 -- -- 27.0 -- -- --145 3 0.86 -- -- 26.6 -- -- --146 4 -0.24 -- -- 25.2 -- -- --151 4 0.16 -- 25.7 -- -- -- --154 4 -0.24 -- -- 25.2 -- -- --180 3 0.78 -- -- 26.5 -- -- --185 4 -0.32 -- 25.1 -- -- -- --190 0 5.96 33.1 -- -- -- -- --191 3 0.63 -- -- -- 26.3 -- --193 4 0.24 -- -- 25.8 -- -- --198 3 0.63 -- -- 26.3 -- -- --203 3 -0.57 -- -- 24.8 -- -- --
23.0
24.0
25.0
26.0
27.0
28.0
ANALYTICAL METHOD CODE
CO
NC
EN
TRA
TIO
N
0 1 4 6 12 20
42
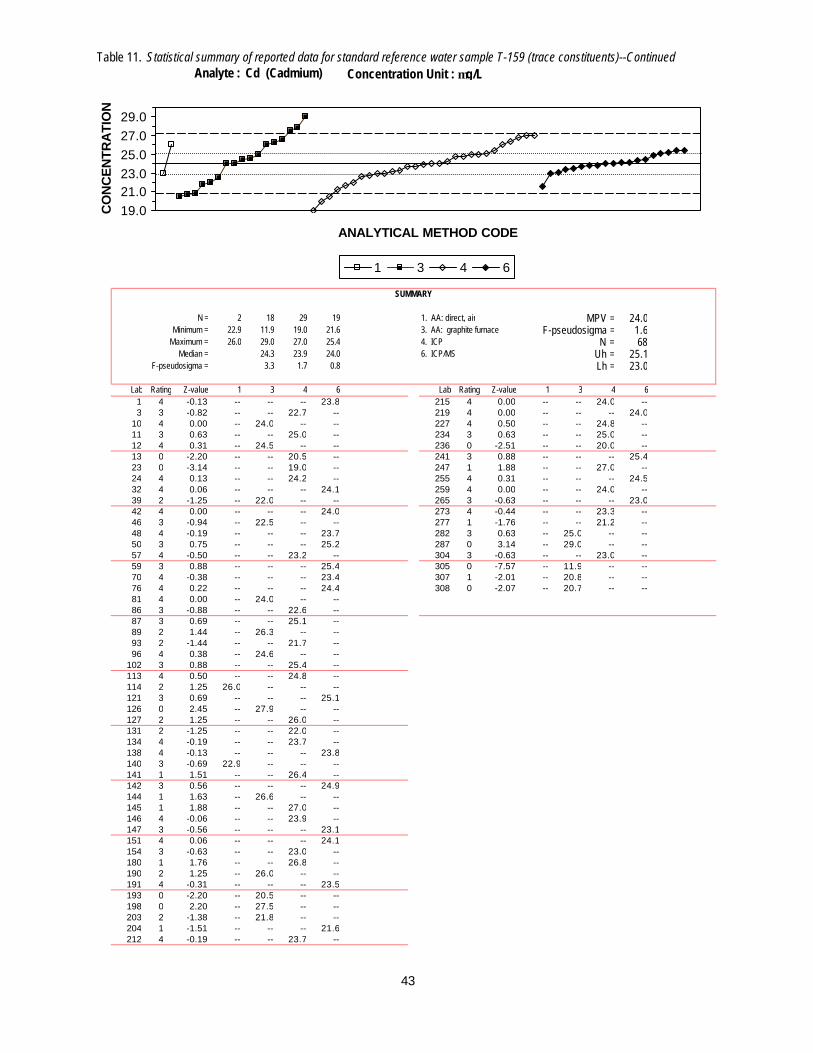
Table 11. Statistical summary of reported data for standard reference water sample T-159 (trace constituents)--ContinuedAnalyte : Cd (Cadmium) Concentration Unit : µg/L
SUMMARY
N = 2 18 29 19 1. AA: direct, air MPV = 24.0Minimum = 22.9 11.9 19.0 21.6 3. AA: graphite furnace F-pseudosigma = 1.6
Maximum = 26.0 29.0 27.0 25.4 4. ICP N = 68Median = 24.3 23.9 24.0 6. ICP/MS Uh = 25.1
F-pseudosigma = 3.3 1.7 0.8 Lh = 23.0
Lab Rating Z-value 1 3 4 6 Lab Rating Z-value 1 3 4 61 4 -0.13 -- -- -- 23.8 215 4 0.00 -- -- 24.0 --3 3 -0.82 -- -- 22.7 -- 219 4 0.00 -- -- -- 24.0
10 4 0.00 -- 24.0 -- -- 227 4 0.50 -- -- 24.8 --11 3 0.63 -- -- 25.0 -- 234 3 0.63 -- -- 25.0 --12 4 0.31 -- 24.5 -- -- 236 0 -2.51 -- -- 20.0 --13 0 -2.20 -- -- 20.5 -- 241 3 0.88 -- -- -- 25.423 0 -3.14 -- -- 19.0 -- 247 1 1.88 -- -- 27.0 --24 4 0.13 -- -- 24.2 -- 255 4 0.31 -- -- -- 24.532 4 0.06 -- -- -- 24.1 259 4 0.00 -- -- 24.0 --39 2 -1.25 -- 22.0 -- -- 265 3 -0.63 -- -- -- 23.042 4 0.00 -- -- -- 24.0 273 4 -0.44 -- -- 23.3 --46 3 -0.94 -- 22.5 -- -- 277 1 -1.76 -- -- 21.2 --48 4 -0.19 -- -- -- 23.7 282 3 0.63 -- 25.0 -- --50 3 0.75 -- -- -- 25.2 287 0 3.14 -- 29.0 -- --57 4 -0.50 -- -- 23.2 -- 304 3 -0.63 -- -- 23.0 --59 3 0.88 -- -- -- 25.4 305 0 -7.57 -- 11.9 -- --70 4 -0.38 -- -- -- 23.4 307 1 -2.01 -- 20.8 -- --76 4 0.22 -- -- -- 24.4 308 0 -2.07 -- 20.7 -- --81 4 0.00 -- 24.0 -- --86 3 -0.88 -- -- 22.6 --87 3 0.69 -- -- 25.1 --89 2 1.44 -- 26.3 -- --93 2 -1.44 -- -- 21.7 --96 4 0.38 -- 24.6 -- --
102 3 0.88 -- -- 25.4 --113 4 0.50 -- -- 24.8 --114 2 1.25 26.0 -- -- --121 3 0.69 -- -- -- 25.1126 0 2.45 -- 27.9 -- --127 2 1.25 -- -- 26.0 --131 2 -1.25 -- -- 22.0 --134 4 -0.19 -- -- 23.7 --138 4 -0.13 -- -- -- 23.8140 3 -0.69 22.9 -- -- --141 1 1.51 -- -- 26.4 --142 3 0.56 -- -- -- 24.9144 1 1.63 -- 26.6 -- --145 1 1.88 -- -- 27.0 --146 4 -0.06 -- -- 23.9 --147 3 -0.56 -- -- -- 23.1151 4 0.06 -- -- -- 24.1154 3 -0.63 -- -- 23.0 --180 1 1.76 -- -- 26.8 --190 2 1.25 -- 26.0 -- --191 4 -0.31 -- -- -- 23.5193 0 -2.20 -- 20.5 -- --198 0 2.20 -- 27.5 -- --203 2 -1.38 -- 21.8 -- --204 1 -1.51 -- -- -- 21.6212 4 -0.19 -- -- 23.7 --
19.021.023.025.027.029.0
ANALYTICAL METHOD CODE
CO
NC
EN
TRA
TIO
N
1 3 4 6
43

Table 11. Statistical summary of reported data for standard reference water sample T-159 (trace constituents)--ContinuedAnalyte : Co (Cobalt) Concentration Unit : µg/L
SUMMARY
N = 4 25 16 3. AA: graphite furnace MPV = 13.3Minimum = 12.0 11.0 11.6 4. ICP F-pseudosigma = 0.9
Maximum = 15.6 18.0 14.9 6. ICP/MS N = 45Median = 13.5 13.3 Uh = 14.0
F-pseudosigma = 0.9 0.7 Lh = 12.8
Lab Rating Z-value 3 4 61 4 0.00 -- -- 13.33 3 -0.56 -- 12.8 --
11 4 -0.34 -- 13.0 --13 0 3.37 -- 16.3 --24 2 1.01 -- 14.2 --26 2 1.35 -- 14.5 --32 4 0.34 -- -- 13.639 0 -2.59 -- 11.0 --42 4 0.34 -- -- 13.648 2 -1.12 -- -- 12.350 4 0.00 -- -- 13.357 4 -0.34 -- 13.0 --59 4 0.00 -- -- 13.370 2 -1.01 -- -- 12.476 4 -0.25 -- -- 13.181 3 0.79 -- 14.0 --86 2 -1.01 -- 12.4 --89 0 2.59 15.6 -- --96 4 -0.45 12.9 -- --
102 1 1.91 -- 15.0 --121 1 -1.91 -- -- 11.6127 4 -0.34 -- 13.0 --131 2 -1.46 -- 12.0 --134 4 0.11 -- 13.4 --138 3 0.79 -- 14.0 --141 3 0.90 -- 14.1 --142 3 -0.56 -- -- 12.8144 2 -1.24 12.2 -- --145 0 5.28 -- 18.0 --146 4 0.22 -- 13.5 --154 4 -0.22 -- 13.1 --180 0 4.83 -- 17.6 --191 4 0.45 -- -- 13.7212 3 -0.79 -- -- 12.6215 2 -1.46 12.0 -- --219 3 0.79 -- -- 14.0234 4 -0.34 -- 13.0 --236 0 3.04 -- 16.0 --247 4 0.45 -- -- 13.7254 3 0.79 -- 14.0 --259 4 -0.34 -- 13.0 --265 4 -0.34 -- -- 13.0273 3 0.90 -- 14.1 --277 1 -1.69 -- 11.8 --282 1 1.80 -- -- 14.9
10.511.512.513.514.515.5
ANALYTICAL METHOD CODE
CO
NC
EN
TRA
TIO
N
3 4 6
44

Table 11. Statistical summary of reported data for standard reference water sample T-159 (trace constituents)--ContinuedAnalyte : Cr (Chromium) Concentration Unit : µg/L
SUMMARY
N = 2 14 28 20 2. AA: direct, nitrous oxide MPV = 26.8Minimum = 30.0 4.8 18.0 23.6 3. AA: graphite furnace F-pseudosigma = 1.8
Maximum = 33.0 41.9 35.2 29.8 4. ICP N = 64Median = 25.5 26.8 27.6 6. ICP/MS Uh = 28.1
F-pseudosigma = 2.9 0.9 1.5 Lh = 25.7
Lab Rating Z-value 2 3 4 6 Lab Rating Z-value 2 3 4 61 3 0.66 -- -- -- 28.0 234 4 -0.11 -- -- 26.6 --3 4 0.17 -- -- 27.1 -- 236 4 0.11 -- -- 27.0 --
10 3 0.66 -- 28.0 -- -- 241 4 -0.22 -- -- -- 26.411 3 0.66 -- -- 28.0 -- 247 3 0.91 -- -- -- 28.513 4 -0.11 -- -- 26.6 -- 255 1 1.65 -- -- -- 29.823 4 -0.44 -- -- 26.0 -- 259 0 4.63 -- -- 35.2 --24 0 2.81 -- -- 31.9 -- 265 4 0.11 -- -- -- 27.032 4 -0.22 -- -- -- 26.4 273 0 -4.85 -- -- 18.0 --39 4 -0.44 -- -- 26.0 -- 277 3 -0.88 -- -- 25.2 --42 4 0.39 -- -- -- 27.5 282 2 1.16 -- -- -- 28.945 0 8.31 -- 41.9 -- -- 287 3 0.83 -- 28.3 -- --46 4 0.17 -- -- 27.1 -- 292 3 -0.99 -- -- 25.0 --48 4 -0.39 -- -- -- 26.1 304 4 -0.44 -- -- 26.0 --50 2 1.10 -- -- -- 28.8 305 2 -1.34 -- 24.4 -- --57 3 -0.99 -- -- 25.0 -- 307 2 -1.27 -- 24.5 -- --59 2 1.49 -- -- -- 29.570 4 -0.44 -- -- -- 26.076 3 0.78 -- -- -- 28.281 1 1.76 -- 30.0 -- --86 4 -0.11 -- -- 26.6 --87 4 0.00 -- -- 26.8 --89 3 -0.94 -- 25.1 -- --93 4 -0.22 -- -- 26.4 --96 3 -0.61 -- 25.7 -- --
102 3 0.77 -- -- 28.2 --114 0 3.41 33.0 -- -- --121 2 -1.27 -- -- -- 24.5126 3 -0.83 -- 25.3 -- --127 4 0.28 -- -- 27.3 --131 1 -1.54 -- -- 24.0 --134 4 0.06 -- -- 26.9 --138 4 0.17 -- -- 27.1 --140 1 1.76 30.0 -- -- --141 3 -0.99 -- -- 25.0 --142 4 0.00 -- -- -- 26.8144 1 1.71 -- 29.9 -- --145 0 2.86 -- -- 32.0 --146 3 0.55 -- -- 27.8 --151 1 -1.76 -- -- -- 23.6154 4 0.00 -- -- 26.8 --180 4 0.00 -- -- 26.8 --190 4 -0.22 -- 26.4 -- --191 4 0.50 -- -- -- 27.7193 0 -2.15 -- 22.9 -- --198 NR -- -- -- < 50 --203 0 -12.11 -- 4.8 -- --204 3 -0.66 -- -- -- 25.6212 4 0.44 -- -- -- 27.6215 0 -2.64 -- 22.0 -- --219 3 0.66 -- -- -- 28.0
21.023.025.027.029.031.0
ANALYTICAL METHOD CODE
CO
NC
EN
TRA
TIO
N
2 3 4 6
45

Table 11. Statistical summary of reported data for standard reference water sample T-159 (trace constituents)--ContinuedAnalyte : Cu (Copper) Concentration Unit : µg/L
SUMMARY
N = 1 5 12 32 19 0. Other MPV = 33.4Minimum = 31.0 30.5 30.5 13.0 27.8 1. AA: direct, air F-pseudosigma = 2.5
Maximum = 41.0 37.0 47.0 36.1 3. AA: graphite furnace N = 69Median = 33.1 34.1 32.9 4. ICP Uh = 35.0
F-pseudosigma = 2.7 2.0 3.0 6. ICP/MS Lh = 31.6
Lab Rating Z-value 0 1 3 4 6 Lab Rating Z-value 0 1 3 4 61 4 -0.28 -- -- 32.7 -- -- 212 2 -1.36 -- -- -- -- 30.03 4 -0.28 -- -- -- 32.7 -- 215 0 -8.17 -- -- -- 13.0 --
10 3 0.64 -- -- 35.0 -- -- 219 4 -0.16 -- -- -- -- 33.011 3 0.64 -- -- -- 35.0 -- 227 1 1.64 -- -- -- 37.5 --12 3 -0.96 31.0 -- -- -- -- 234 4 0.44 -- -- -- 34.5 --13 0 -5.64 -- -- -- 19.3 -- 236 2 -1.36 -- -- -- 30.0 --23 3 -0.92 -- -- -- 31.1 -- 241 4 -0.36 -- -- -- -- 32.524 1 1.80 -- -- -- 37.9 -- 247 3 0.86 -- -- -- -- 35.626 0 -12.56 -- -- -- < 2 -- 254 4 -0.08 -- -- -- 33.2 --32 3 0.64 -- -- -- -- 35.0 255 4 -0.20 -- -- -- -- 32.939 4 -0.28 -- -- -- 32.7 -- 259 0 -2.56 -- -- -- 27.0 --42 4 0.08 -- -- -- -- 33.6 265 3 0.64 -- -- -- -- 35.045 4 0.24 -- 34.0 -- -- -- 273 3 0.76 -- -- -- 35.3 --46 4 0.40 -- -- -- 34.4 -- 277 2 -1.06 -- -- -- 30.8 --48 2 -1.24 -- -- -- -- 30.3 282 2 1.08 -- -- -- -- 36.150 3 0.72 -- -- -- -- 35.2 287 3 0.64 -- 35.0 -- -- --57 4 0.40 -- -- -- 34.4 -- 292 4 0.24 -- -- -- 34.0 --59 3 0.60 -- -- -- -- 34.9 304 3 0.64 -- -- -- 35.0 --70 1 -1.60 -- -- -- -- 29.4 305 3 -0.71 -- -- 31.6 -- --81 2 1.44 -- -- 37.0 -- -- 307 3 -0.76 -- -- 31.5 -- --86 4 -0.32 -- -- -- 32.6 -- 308 2 1.44 -- -- 37.0 -- --87 3 0.56 -- -- -- 34.8 --89 3 -0.84 -- -- 31.3 -- --96 4 -0.28 -- -- 32.7 -- --97 3 0.84 -- -- 35.5 -- --
102 3 -0.56 -- -- -- 32.0 --113 4 0.32 -- -- -- 34.2 --114 2 -1.16 -- 30.5 -- -- --121 2 -1.20 -- -- -- -- 30.4126 0 3.04 -- 41.0 -- -- --127 4 0.48 -- -- -- 34.6 --131 0 5.44 -- -- -- 47.0 --134 4 -0.40 -- -- -- 32.4 --138 4 -0.08 -- -- -- 33.2 --140 4 0.36 -- 34.3 -- -- --141 3 0.80 -- -- -- 35.4 --142 3 -0.76 -- -- -- -- 31.5144 2 -1.16 -- -- 30.5 -- --145 0 3.04 -- -- -- 41.0 --146 4 -0.36 -- -- -- 32.5 --147 3 -0.52 -- -- -- -- 32.1151 4 0.00 -- -- -- -- 33.4154 2 1.28 -- -- -- 36.6 --180 2 1.48 -- -- -- 37.1 --190 4 0.00 -- -- 33.4 -- --191 4 -0.44 -- -- -- -- 32.3193 4 0.40 -- -- 34.4 -- --198 NR -- -- -- -- < 50 --203 4 -0.16 -- -- -- 33.0 --204 0 -2.24 -- -- -- -- 27.8
26.028.030.032.034.036.038.040.0
ANALYTICAL METHOD CODE
CO
NC
EN
TRA
TIO
N
0 1 3 4 6
46

Table 11. Statistical summary of reported data for standard reference water sample T-159 (trace constituents)--ContinuedAnalyte : Fe (Iron) Concentration Unit : µg/L
SUMMARY
N = 2 10 3 47 1 5 0. Other MPV = 48.9Minimum = 49.0 32.5 41.0 27.0 50.0 34.5 1. AA: direct, air F-pseudosigma = 6.2
Maximum = 54.8 60.0 56.0 90.0 47.7 3. AA: graphite furnace N = 68Median = 51.3 48.8 4. ICP Uh = 51.4
F-pseudosigma = 10.8 5.4 5. DCP Lh = 43.16. ICP/MS
Lab Rating Z-value 0 1 3 4 5 6 Lab Rating Z-value 0 1 3 4 5 61 4 0.33 -- -- -- 50.9 -- -- 204 4 -0.39 -- -- -- 46.5 -- --3 0 4.03 -- -- -- 73.7 -- -- 212 4 0.39 -- -- -- 51.3 -- --
10 2 1.15 -- 56.0 -- -- -- -- 215 0 -3.56 -- -- -- 27.0 -- --11 0 6.68 -- -- -- 90.0 -- -- 227 3 0.52 -- -- -- 52.1 -- --13 3 -0.75 -- -- -- 44.3 -- -- 234 4 0.11 -- -- -- 49.6 -- --21 3 0.96 54.8 -- -- -- -- -- 236 4 -0.31 -- -- -- 47.0 -- --23 3 -0.76 -- -- -- 44.2 -- -- 241 4 0.02 49.0 -- -- -- -- --24 4 0.21 -- -- -- 50.2 -- -- 247 1 -1.93 -- -- -- 37.0 -- --26 1 -1.71 -- -- -- 38.4 -- -- 254 4 0.24 -- -- -- 50.4 -- --33 4 0.18 -- -- -- 50.0 -- 255 4 0.33 -- -- -- 50.9 -- --39 2 -1.33 -- -- -- 40.7 -- -- 259 4 -0.18 -- -- -- 47.8 -- --42 2 -1.30 -- -- -- 40.9 -- -- 265 4 0.18 -- -- -- 50.0 -- --46 4 -0.49 -- -- -- 45.9 -- -- 273 2 -1.06 -- -- -- 42.4 -- --48 4 -0.47 -- -- -- -- -- 46.0 277 3 -0.91 -- -- -- 43.3 -- --50 4 -0.28 -- -- -- -- -- 47.2 282 4 -0.20 -- -- -- -- -- 47.757 4 0.02 -- -- -- 49.0 -- -- 287 2 -1.45 -- 40.0 -- -- -- --59 0 -2.34 -- -- -- -- -- 34.5 292 4 -0.47 -- -- -- 46.0 -- --70 4 0.37 -- -- -- 51.2 -- -- 304 4 0.02 -- -- -- 49.0 -- --81 2 -1.12 -- -- -- 42.0 -- -- 307 4 0.18 -- 50.0 -- -- -- --86 0 -2.45 -- -- -- 33.8 -- --87 4 -0.49 -- -- -- 45.9 -- --89 3 -0.81 -- -- 43.9 -- -- --93 3 -0.98 -- -- -- 42.9 -- --96 1 1.80 -- 60.0 -- -- -- --97 2 -1.28 -- -- 41.0 -- -- --
102 3 0.94 -- -- -- 54.7 -- --107 1 1.80 -- 60.0 -- -- -- --109 3 0.60 -- 52.6 -- -- -- --113 4 -0.36 -- -- -- 46.7 -- --114 2 -1.09 -- 42.2 -- -- -- --121 3 0.67 -- -- -- 53.0 -- --127 4 0.13 -- -- -- 49.7 -- --131 4 0.18 -- -- -- 50.0 -- --134 4 -0.02 -- -- -- 48.8 -- --138 4 0.42 -- -- -- 51.5 -- --140 4 0.18 -- 50.0 -- -- -- --141 1 -1.54 -- -- -- 39.4 -- --142 2 -1.45 -- -- -- 40.0 -- --144 2 1.15 -- -- 56.0 -- -- --145 0 5.05 -- -- -- 80.0 -- --146 NR -- -- -- -- < 50 -- --147 3 0.67 -- -- -- 53.0 -- --151 0 -2.67 -- 32.5 -- -- -- --154 4 -0.39 -- -- -- 46.5 -- --180 2 1.24 -- -- -- 56.5 -- --190 2 1.28 -- 56.8 -- -- -- --191 1 -1.77 -- -- -- -- -- 38.0193 0 3.72 -- -- -- 71.8 -- --198 4 0.34 -- -- -- 51.0 -- --203 4 -0.15 -- -- -- 48.0 -- --
30.535.540.545.550.555.560.565.5
ANALYTICAL METHOD CODE
CO
MC
EN
TRA
TIO
N
0 1 3 4 5 6
47

Table 11. Statistical summary of reported data for standard reference water sample T-159 (trace constituents)--ContinuedAnalyte : K (Potassium) Concentration Unit : mg/L
SUMMARY
N = 17 35 1 6 2 6 1. AA: direct, air MPV = 1.52Minimum = 1.40 1.14 1.52 1.37 1.00 1.50 4. ICP F-pseudosigma = 0.13
Maximum = 1.96 2.70 1.63 1.54 2.25 5. DCP N = 67Median = 1.58 1.50 6. ICP/MS Uh = 1.65
F-pseudosigma = 0.18 0.10 7. Ion chromatography Lh = 1.4712. Flame emission
Lab Rating Z-value 1 4 5 6 7 12 Lab Rating Z-value 1 4 5 6 7 121 4 -0.37 1.47 -- -- -- -- -- 219 3 -0.90 -- -- -- 1.40 -- --3 4 0.37 -- 1.57 -- -- -- -- 234 4 -0.15 -- 1.50 -- -- -- --
11 3 0.67 -- 1.61 -- -- -- -- 236 3 -0.75 -- 1.42 -- -- -- --13 4 0.37 -- 1.57 -- -- -- -- 241 1 1.95 -- -- -- -- -- 1.7823 4 -0.30 -- 1.48 -- -- -- -- 247 4 -0.37 -- 1.47 -- -- -- --24 4 -0.30 -- 1.48 -- -- -- -- 254 4 0.45 1.58 -- -- -- -- --26 0 -3.90 -- -- -- -- 1.00 -- 259 4 -0.37 -- 1.47 -- -- -- --32 4 -0.15 -- -- -- 1.50 -- -- 265 4 0.22 -- 1.55 -- -- -- --33 4 0.00 -- -- 1.52 -- -- -- 268 0 3.30 1.96 -- -- -- -- --39 3 -0.75 -- 1.42 -- -- -- -- 273 4 -0.22 -- 1.49 -- -- -- --42 3 -0.52 -- 1.45 -- -- -- -- 274 2 1.35 -- -- -- -- -- 1.7045 2 1.27 1.69 -- -- -- -- -- 279 4 -0.15 -- -- -- -- -- 1.5046 4 -0.15 -- 1.50 -- -- -- -- 282 3 0.82 -- -- -- 1.63 -- --48 4 -0.37 -- -- -- 1.47 -- -- 287 1 1.57 1.73 -- -- -- -- --51 0 5.47 -- -- -- -- -- 2.25 292 3 0.60 1.60 -- -- -- -- --57 0 8.84 -- 2.70 -- -- -- -- 302 4 0.11 -- -- -- -- 1.54 --59 3 0.60 -- -- -- 1.60 -- -- 304 4 -0.15 -- 1.50 -- -- -- --64 4 -0.37 1.47 -- -- -- -- -- 309 0 6.00 -- 2.32 -- -- -- --70 4 -0.30 -- 1.48 -- -- -- --81 1 1.87 -- 1.77 -- -- -- --86 4 -0.15 -- 1.50 -- -- -- --87 4 -0.22 1.49 -- -- -- -- --89 4 0.15 -- -- -- -- -- 1.5493 0 -2.17 -- 1.23 -- -- -- --97 3 -0.52 1.45 -- -- -- -- --
102 0 -2.85 -- 1.14 -- -- -- --107 0 2.40 1.84 -- -- -- -- --109 2 1.42 1.71 -- -- -- -- --113 4 0.37 -- 1.57 -- -- -- --121 4 -0.37 1.47 -- -- -- -- --127 4 0.37 -- 1.57 -- -- -- --131 3 0.60 -- 1.60 -- -- -- --134 4 -0.19 1.50 -- -- -- -- --138 3 -0.67 -- 1.43 -- -- -- --140 3 -0.90 1.40 -- -- -- -- --141 2 1.12 -- 1.67 -- -- -- --142 4 -0.22 -- 1.49 -- -- -- --145 3 0.67 -- 1.61 -- -- -- --146 4 0.45 -- 1.58 -- -- -- --151 4 -0.37 1.47 -- -- -- -- --154 0 4.35 -- 2.10 -- -- -- --180 NR -- -- < 1.63 -- -- -- --185 2 1.27 1.69 -- -- -- -- --191 2 -1.12 -- -- -- 1.37 -- --193 2 1.50 1.72 -- -- -- -- --198 0 3.67 -- 2.01 -- -- -- --203 3 0.75 -- -- -- -- -- 1.62204 4 -0.07 -- 1.51 -- -- -- --209 0 4.04 -- 2.06 -- -- -- --212 3 -0.75 -- 1.42 -- -- -- --
1.101.201.301.401.501.601.701.801.90
ANALYTICAL METHOD CODE
CO
NC
EN
TRA
TIO
N
1 4 5 6 7 12
48

Table 11. Statistical summary of reported data for standard reference water sample T-159 (trace constituents)--ContinuedAnalyte : Li (Lithium) Concentration Unit : µg/L
SUMMARY
N = 12 6 4. ICP MPV = 8.57Minimum = 7.30 7.15 6. ICP/MS F-pseudosigma = 1.93
Maximum = 17.80 8.00 N = 18Median = 9.19 Uh = 10.50
F-pseudosigma = 1.84 Lh = 7.90
Lab Rating Z-value 4 61 4 -0.33 -- 7.923 NR -- < 10 --
11 2 1.26 11.00 --26 4 -0.29 8.00 --42 4 0.35 9.23 --50 4 -0.50 -- 7.6057 2 1.32 11.10 --59 3 -0.73 -- 7.15
127 NR -- < 10 --131 4 0.17 8.90 --134 4 0.05 8.66 --141 3 1.00 10.50 --142 4 -0.05 8.47 --145 NR -- < 20 --151 4 -0.50 -- 7.60219 4 -0.35 -- 7.90234 0 2.40 13.20 --236 NR -- < 10 --247 4 0.30 9.15 --254 3 -0.66 7.30 --265 4 -0.29 -- 8.00273 0 4.79 17.80 --
2.504.506.508.50
10.5012.5014.50
ANALYTICAL METHOD CODE
CO
NC
EN
TRA
TIO
N
4 6
49

Table 11. Statistical summary of reported data for standard reference water sample T-159 (trace constituents)--ContinuedAnalyte : Mg (Magnesium) Concentration Unit : mg/L
SUMMARY
N = 4 15 45 1 6 2 0. Other MPV = 5.60Minimum = 3.20 4.99 4.92 5.90 5.00 5.25 1. AA: direct, air F-pseudosigma = 0.21
Maximum = 6.40 6.25 6.95 6.33 5.59 4. ICP Rating Criterion = 0.28Median = 5.57 5.60 5. DCP N = 73
F-pseudosigma = 0.22 0.19 6. ICP/MS Uh = 5.7812. Flame emission Lh = 5.49
Lab Rating Z-value 0 1 4 5 6 12 Lab Rating Z-value 0 1 4 5 6 121 4 0.07 -- -- 5.62 -- -- -- 212 4 -0.36 -- -- 5.50 -- -- --3 4 -0.07 -- -- 5.58 -- -- -- 215 4 0.00 -- -- 5.60 -- -- --
11 4 -0.29 -- -- 5.52 -- -- -- 219 0 -2.14 -- -- -- -- 5.00 --12 0 3.57 -- -- 6.60 -- -- -- 227 4 -0.50 -- -- 5.46 -- -- --13 4 -0.18 -- -- 5.55 -- -- -- 234 4 0.46 -- -- 5.73 -- -- --23 3 -0.71 -- 5.40 -- -- -- -- 236 3 -0.61 -- -- 5.43 -- -- --24 4 -0.39 -- -- 5.49 -- -- -- 241 2 -1.25 -- -- -- -- -- 5.2526 0 -8.57 3.20 -- -- -- -- -- 247 4 0.25 -- -- 5.67 -- -- --32 4 -0.36 -- -- -- -- 5.50 -- 254 3 0.64 -- -- 5.78 -- -- --33 2 1.07 -- -- -- 5.90 -- -- 255 4 0.00 -- -- 5.60 -- -- --39 0 -2.25 -- -- 4.97 -- -- -- 259 4 -0.18 -- -- 5.55 -- -- --42 3 -0.68 -- -- 5.41 -- -- -- 265 3 0.54 -- -- 5.75 -- -- --45 2 -1.18 -- 5.27 -- -- -- -- 268 3 0.71 -- 5.80 -- -- -- --46 4 -0.36 -- -- 5.50 -- -- -- 273 1 1.79 -- -- 6.10 -- -- --48 0 2.61 -- -- -- -- 6.33 -- 274 0 -2.04 5.03 -- -- -- -- --51 3 0.57 -- 5.76 -- -- -- -- 279 3 0.71 5.80 -- -- -- -- --57 4 -0.14 -- -- 5.56 -- -- -- 282 3 0.64 -- -- -- -- 5.78 --59 0 2.04 -- -- -- -- 6.17 -- 287 0 -2.18 -- 4.99 -- -- -- --64 0 -2.43 -- -- 4.92 -- -- -- 292 4 -0.36 -- 5.50 -- -- -- --70 4 -0.36 -- -- 5.50 -- -- -- 302 0 2.85 6.40 -- -- -- -- --76 4 0.15 -- 5.64 -- -- -- -- 304 4 0.00 -- -- 5.60 -- -- --81 3 -0.61 -- -- 5.43 -- -- -- 307 0 2.32 -- 6.25 -- -- -- --86 3 0.71 -- -- 5.80 -- -- -- 308 3 -0.86 -- 5.36 -- -- -- --87 3 -0.71 -- 5.40 -- -- -- --89 4 -0.04 -- -- -- -- -- 5.5993 1 -1.54 -- -- 5.17 -- -- --
102 0 4.82 -- -- 6.95 -- -- --107 4 -0.11 -- 5.57 -- -- -- --109 4 -0.36 -- 5.50 -- -- -- --113 3 0.64 -- -- 5.78 -- -- --121 4 0.00 -- -- 5.60 -- -- --127 4 -0.18 -- -- 5.55 -- -- --131 4 0.00 -- -- 5.60 -- -- --134 3 -0.71 -- -- 5.40 -- -- --138 4 -0.11 -- -- 5.57 -- -- --140 4 0.00 -- 5.60 -- -- -- --141 3 0.54 -- -- 5.75 -- -- --142 2 1.25 -- -- 5.95 -- -- --145 3 0.89 -- -- 5.85 -- -- --146 3 -0.54 -- -- 5.45 -- -- --151 4 0.39 -- 5.71 -- -- -- --154 4 -0.36 -- -- 5.50 -- -- --180 3 0.54 -- -- 5.75 -- -- --185 4 0.32 -- 5.69 -- -- -- --191 3 0.64 -- -- -- -- 5.78 --193 4 -0.18 -- -- 5.55 -- -- --198 3 0.96 -- -- 5.87 -- -- --203 3 0.79 -- -- 5.82 -- -- --204 4 0.46 -- -- 5.73 -- -- --209 4 0.07 -- -- 5.62 -- -- --
5.00
5.25
5.50
5.75
6.00
6.25
ANALYTICAL METHOD CODE
CO
NC
EN
TRA
TIO
N
0 1 4 5 6 12
50

Table 11. Statistical summary of reported data for standard reference water sample T-159 (trace constituents)--ContinuedAnalyte : Mn (Manganese) Concentration Unit : µg/L
SUMMARY
N = 1 10 2 39 1 15 0. Other MPV = 22.0Minimum = 17.4 12.0 18.9 5.5 20.0 19.1 1. AA: direct, air F-pseudosigma = 1.6
Maximum = 30.0 23.0 30.3 24.4 3. AA: graphite furnace N = 68Median = 22.3 22.0 21.8 4. ICP Uh = 23.2
F-pseudosigma = 3.5 1.4 1.6 5. DCP Lh = 21.06. ICP/MS
Lab Rating Z-value 0 1 3 4 5 6 Lab Rating Z-value 0 1 3 4 5 61 3 0.92 -- -- -- -- -- 23.5 215 4 0.00 -- -- -- 22.0 -- --3 4 -0.36 -- -- -- 21.4 -- -- 219 3 -0.61 -- -- -- -- -- 21.0
10 1 1.84 -- 25.0 -- -- -- -- 227 3 0.74 -- -- -- 23.2 -- --11 3 0.62 -- -- -- 23.0 -- -- 234 1 -1.53 -- -- -- 19.5 -- --13 2 1.35 -- -- -- 24.2 -- -- 236 4 0.00 -- -- -- 22.0 -- --23 3 -0.61 -- -- -- 21.0 -- -- 241 4 -0.43 -- -- -- -- -- 21.324 3 0.68 -- -- -- 23.1 -- -- 247 4 0.27 -- -- -- -- -- 22.426 3 0.74 -- -- -- 23.2 -- -- 254 3 0.68 -- -- -- 23.1 -- --32 4 -0.12 -- -- -- -- -- 21.8 255 3 0.80 -- -- -- -- -- 23.333 2 -1.22 -- -- -- -- 20.0 -- 259 3 -0.92 -- -- -- 20.5 -- --39 0 -2.14 -- -- -- 18.5 -- -- 265 3 0.92 -- -- -- 23.5 -- --42 4 0.13 -- -- -- 22.2 -- -- 273 3 0.98 -- -- -- 23.6 -- --46 4 -0.06 -- -- -- 21.9 -- -- 277 0 -2.27 -- -- -- 18.3 -- --48 4 -0.49 -- -- -- -- -- 21.2 282 3 0.80 -- -- -- -- -- 23.350 4 -0.18 -- -- -- -- -- 21.7 287 3 0.62 -- 23.0 -- -- -- --57 4 -0.18 -- -- -- 21.7 -- -- 292 3 -0.61 -- -- -- 21.0 -- --59 2 1.47 -- -- -- -- -- 24.4 307 0 -6.13 -- 12.0 -- -- -- --70 3 -0.86 -- -- -- -- -- 20.6 308 1 1.66 -- 24.7 -- -- -- --76 2 1.01 -- -- -- -- -- 23.7 309 0 -10.11 -- -- -- 5.5 -- --81 4 0.00 -- -- -- 22.0 -- --86 3 -0.61 -- -- -- 21.0 -- --87 0 -12.50 -- -- -- < 2.0 -- --89 1 -1.90 -- -- 18.9 -- -- --93 0 -2.82 17.4 -- -- -- -- --96 2 -1.22 -- 20.0 -- -- -- --
102 2 1.17 -- -- -- 23.9 -- --107 0 4.91 -- 30.0 -- -- -- --109 4 -0.33 -- 21.5 -- -- -- --113 3 0.55 -- -- -- 22.9 -- --114 4 -0.30 -- 21.5 -- -- -- --121 3 0.62 -- -- -- 23.0 -- --126 2 1.23 -- 24.0 -- -- -- --127 4 -0.12 -- -- -- 21.8 -- --131 3 -0.61 -- -- -- 21.0 -- --134 4 0.00 -- -- -- 22.0 -- --138 4 -0.36 -- -- -- 21.4 -- --140 2 -1.22 -- 20.0 -- -- -- --141 3 0.92 -- -- -- 23.5 -- --142 0 -5.52 -- -- -- 13.0 -- --145 3 0.62 -- -- -- 23.0 -- --146 4 0.13 -- -- -- 22.2 -- --151 4 -0.49 -- -- -- -- -- 21.2154 4 -0.24 -- -- -- 21.6 -- --180 3 0.74 -- -- -- 23.2 -- --190 3 0.62 -- -- 23.0 -- -- --191 2 1.23 -- -- -- -- -- 24.0198 0 5.09 -- -- -- 30.3 -- --203 4 0.00 -- -- -- 22.0 -- --204 1 -1.78 -- -- -- -- -- 19.1212 4 -0.18 -- -- -- 21.7 -- --
17.0
19.0
21.0
23.0
25.0
27.0
ANALYTICAL METHOD CODE
CO
NC
EN
TRA
TIO
N
0 1 3 4 5 6
51

Table 11. Statistical summary of reported data for standard reference water sample T-159 (trace constituents)--ContinuedAnalyte : Mo (Molybdenum) Concentration Unit : µg/L
SUMMARY
N = 1 24 17 3. AA: graphite furnace MPV = 41.4Minimum = 45.9 34.7 39.0 4. ICP F-pseudosigma = 2.6
Maximum = 53.5 45.6 6. ICP/MS N = 42Median = 40.1 42.3 Uh = 42.7
F-pseudosigma = 2.8 1.8 Lh = 39.2
Lab Rating Z-value 3 4 61 4 0.21 -- -- 42.03 4 0.07 -- 41.6 --
11 4 -0.16 -- 41.0 --13 3 0.57 -- 42.9 --23 4 -0.12 -- 41.1 --24 4 0.42 -- 42.5 --26 4 0.07 -- 41.6 --32 3 -0.74 -- -- 39.542 4 0.38 -- -- 42.446 3 -0.86 -- 39.2 --48 3 0.99 -- -- 44.050 1 1.61 -- -- 45.657 0 -2.47 -- 35.0 --59 4 -0.08 -- -- 41.270 2 1.07 -- -- 44.276 4 -0.07 -- -- 41.281 2 -1.32 -- 38.0 --86 0 -2.51 -- 34.9 --87 0 -2.59 -- 34.7 --97 1 1.73 45.9 -- --
127 0 4.66 -- 53.5 --131 4 0.22 -- 42.0 --134 3 -0.62 -- 39.8 --138 3 -0.74 -- -- 39.5141 4 -0.16 -- 41.0 --142 4 0.34 -- -- 42.3145 1 1.77 -- 46.0 --146 4 -0.39 -- 40.4 --151 4 0.49 -- -- 42.7154 2 -1.05 -- 38.7 --180 1 1.57 -- 45.5 --212 3 0.88 -- -- 43.7215 2 -1.32 -- 38.0 --219 3 -0.93 -- -- 39.0234 3 -0.66 -- 39.7 --236 0 -2.47 -- 35.0 --241 4 0.34 -- -- 42.3247 2 1.47 -- -- 45.2259 2 -1.16 -- 38.4 --265 4 0.22 -- -- 42.0282 4 0.42 -- -- 42.5292 1 -1.70 -- 37.0 --
33.5
38.5
43.5
48.5
ANALYTICAL METHOD CODE
CO
NC
EN
TRA
TIO
N
3 4 6
52

Table 11. Statistical summary of reported data for standard reference water sample T-159 (trace constituents)--ContinuedAnalyte : Na (Sodium) Concentration Unit : mg/L
SUMMARY
N = 14 41 1 7 2 6 1. AA: direct, air MPV = 100Minimum = 20 40 100 97 85 42 4. ICP F-pseudosigma = 4
Maximum = 105 112 113 109 117 5. DCP Rating Criterion = 5Median = 99 100 102 6. ICP/MS N = 71
F-pseudosigma = 6 4 4 7. Ion chromatography Uh = 10312. Flame emission Lh = 97
Lab Rating Z-value 1 4 5 6 7 12 Lab Rating Z-value 1 4 5 6 7 121 4 -0.24 -- 99 -- -- -- -- 209 0 2.40 -- 112 -- -- -- --3 4 -0.12 -- 99 -- -- -- -- 212 3 0.60 -- 103 -- -- -- --
11 0 -2.58 -- 87 -- -- -- -- 215 2 1.40 -- 107 -- -- -- --12 2 -1.20 -- 94 -- -- -- -- 219 4 -0.20 -- -- -- 99 -- --13 1 2.00 -- 110 -- -- -- -- 234 4 -0.20 -- 99 -- -- -- --23 2 -1.44 93 -- -- -- -- -- 236 3 -0.66 -- 97 -- -- -- --24 3 0.60 -- 103 -- -- -- -- 241 3 0.60 -- -- -- -- -- 10326 0 -2.92 -- -- -- -- 85 -- 247 4 -0.25 -- 99 -- -- -- --32 3 -0.70 -- -- -- 97 -- -- 254 2 1.02 -- 105 -- -- -- --33 4 0.00 -- -- 100 -- -- -- 259 4 0.10 -- 101 -- -- -- --39 3 -0.62 -- 97 -- -- -- -- 265 4 -0.06 -- 100 -- -- -- --42 2 -1.32 -- 93 -- -- -- -- 268 0 -5.70 72 -- -- -- -- --45 3 0.60 103 -- -- -- -- -- 273 1 2.00 -- 110 -- -- -- --46 3 0.80 -- 104 -- -- -- -- 274 0 3.46 -- -- -- -- -- 11748 0 2.60 -- -- -- 113 -- -- 279 2 -1.50 -- -- -- -- -- 9351 4 0.24 -- -- -- -- -- 101 282 4 0.20 -- -- -- 101 -- --57 3 -0.60 -- 97 -- -- -- -- 287 2 -1.24 94 -- -- -- -- --59 2 1.20 -- -- -- 106 -- -- 292 3 -0.52 97 -- -- -- -- --64 3 -0.74 96 -- -- -- -- -- 302 1 1.76 -- -- -- -- 109 --70 4 0.00 -- 100 -- -- -- -- 307 4 -0.08 100 -- -- -- -- --81 4 -0.24 -- 99 -- -- -- -- 309 0 -11.96 -- 40 -- -- -- --86 4 0.00 -- 100 -- -- -- --87 4 -0.24 99 -- -- -- -- --89 0 -11.68 -- -- -- -- -- 4293 1 1.80 -- 109 -- -- -- --97 4 -0.32 98 -- -- -- -- --
102 0 -3.00 -- 85 -- -- -- --107 4 0.40 102 -- -- -- -- --109 0 -16.07 20 -- -- -- -- --113 4 0.02 -- 100 -- -- -- --121 4 0.00 -- 100 -- -- -- --126 4 0.40 102 -- -- -- -- --127 4 -0.26 -- 99 -- -- -- --131 4 0.00 -- 100 -- -- -- --134 3 1.00 105 -- -- -- -- --138 4 0.00 -- 100 -- -- -- --140 4 0.20 101 -- -- -- -- --141 4 0.16 -- 101 -- -- -- --142 2 1.40 -- 107 -- -- -- --145 4 0.24 -- 101 -- -- -- --146 3 -1.00 -- 95 -- -- -- --151 3 0.86 -- -- -- 104 -- --154 1 -1.60 -- 92 -- -- -- --180 3 0.60 -- 103 -- -- -- --185 3 0.90 -- -- -- -- -- 105191 4 0.40 -- -- -- 102 -- --193 4 0.40 -- 102 -- -- -- --198 2 1.20 -- 106 -- -- -- --203 3 -0.56 -- 97 -- -- -- --204 4 0.40 -- 102 -- -- -- --
879297
102107112
ANALYTICAL METHOD CODE
CO
NC
EN
TRA
TIO
N
1 4 5 6 7 12
53

Table 11. Statistical summary of reported data for standard reference water sample T-159 (trace constituents)--ContinuedAnalyte : Ni (Nickel) Concentration Unit : µg/L
SUMMARY
N = 2 11 29 20 1. AA: direct, air MPV = 22.2Minimum = 20.6 19.0 16.9 17.6 3. AA: graphite furnace F-pseudosigma = 1.6
Maximum = 21.4 23.3 35.7 24.9 4. ICP N = 61Median = 22.0 22.7 22.0 6. ICP/MS Uh = 23.3
F-pseudosigma = 1.5 3.5 1.2 Lh = 21.2
Lab Rating Z-value 1 3 4 6 Lab Rating Z-value 1 3 4 61 4 -0.19 -- -- -- 21.9 236 2 -1.41 -- -- 20.0 --3 4 -0.32 -- -- 21.7 -- 241 4 -0.45 -- -- -- 21.5
11 4 -0.13 -- -- 22.0 -- 247 1 1.54 -- -- -- 24.613 0 3.66 -- -- 27.9 -- 254 4 0.06 -- -- 22.3 --23 0 -2.31 -- -- 18.6 -- 255 1 1.73 -- -- -- 24.924 3 0.58 -- -- 23.1 -- 259 4 0.32 -- -- 22.7 --32 2 1.09 -- -- -- 23.9 265 4 -0.13 -- -- -- 22.039 4 0.00 -- -- 22.2 -- 273 0 8.67 -- -- 35.7 --42 4 0.45 -- -- -- 22.9 277 3 -0.96 -- -- 20.7 --46 0 -3.40 -- -- 16.9 -- 282 4 -0.13 -- 22.0 -- --48 2 -1.03 -- -- -- 20.6 292 1 1.80 -- -- 25.0 --50 4 0.19 -- -- -- 22.5 304 3 0.51 -- -- 23.0 --57 3 0.96 -- -- 23.7 -- 305 2 -1.08 -- 20.5 -- --59 2 1.09 -- -- -- 23.9 307 4 0.19 -- 22.5 -- --70 3 -0.64 -- -- -- 21.276 4 0.39 -- -- -- 22.881 2 -1.41 -- 20.0 -- --86 3 -0.58 -- -- 21.3 --87 0 4.24 -- -- 28.8 --89 3 0.71 -- 23.3 -- --93 1 -1.73 -- -- 19.5 --96 3 0.71 -- 23.3 -- --
102 0 2.70 -- -- 26.4 --113 3 -0.90 -- -- 20.8 --114 2 -1.03 20.6 -- -- --121 2 -1.48 -- -- -- 19.9126 3 0.71 -- 23.3 -- --127 3 -0.51 -- 21.4 -- --131 0 5.01 -- -- 30.0 --134 4 0.39 -- -- 22.8 --138 4 -0.45 -- -- -- 21.5140 3 -0.51 21.4 -- -- --141 3 0.77 -- -- 23.4 --142 4 -0.06 -- -- -- 22.1144 4 -0.19 -- 21.9 -- --145 0 4.37 -- -- 29.0 --146 4 0.26 -- -- 22.6 --151 3 -0.64 -- -- -- 21.2154 4 -0.13 -- -- 22.0 --180 0 4.24 -- -- 28.8 --190 4 0.39 -- 22.8 -- --191 4 0.26 -- -- -- 22.6193 NR -- < 25 -- --198 NR -- -- < 50 --203 0 5.01 -- -- 30.0 --204 0 -2.95 -- -- -- 17.6212 2 -1.09 -- -- -- 20.5215 0 -2.06 -- 19.0 -- --219 4 -0.13 -- -- -- 22.0234 4 0.13 -- -- 22.4 --
17.518.519.520.521.522.523.524.525.526.5
ANALYTICAL METHOD CODE
CO
NC
EN
TRA
TIO
N
1 3 4 6
54

Table 11. Statistical summary of reported data for standard reference water sample T-159 (trace constituents)--ContinuedAnalyte : Pb (Lead) Concentration Unit : µg/L
SUMMARY
N = 1 2 25 18 20 0. Other MPV = 16.6Minimum = 17.0 17.1 14.2 11.2 14.8 1. AA: direct, air F-pseudosigma = 1.2
Maximum = 26.5 19.8 29.0 19.2 3. AA: graphite furnace N = 66Median = 16.5 16.3 16.7 4. ICP Uh = 17.6
F-pseudosigma = 1.2 1.3 1.1 6. ICP/MS Lh = 16.0
Lab Rating Z-value 0 1 3 4 6 Lab Rating Z-value 0 1 3 4 61 4 -0.34 -- -- -- -- 16.2 219 3 -0.51 -- -- -- -- 16.03 4 -0.08 -- -- -- 16.5 -- 227 4 0.34 17.0 -- -- -- --
10 3 -0.51 -- -- 16.0 -- -- 234 3 -0.93 -- -- -- 15.5 --11 2 -1.35 -- -- -- 15.0 -- 236 NR -- -- -- < 20 --13 2 1.35 -- -- 18.2 -- -- 241 4 -0.42 -- -- -- -- 16.123 3 -0.51 -- -- -- 16.0 -- 247 0 2.15 -- -- -- -- 19.232 2 1.10 -- -- -- -- 17.9 255 3 0.51 -- -- -- -- 17.239 3 -0.51 -- -- 16.0 -- -- 259 4 0.08 -- -- -- 16.7 --42 3 0.93 -- -- -- -- 17.7 265 4 -0.08 -- -- -- -- 16.546 3 -0.76 -- -- 15.7 -- -- 273 1 -1.85 -- -- -- 14.4 --48 3 0.84 -- -- -- -- 17.6 277 0 -4.55 -- -- -- 11.2 --50 4 -0.42 -- -- -- -- 16.1 282 3 -0.51 -- -- 16.0 -- --57 4 -0.42 -- -- -- 16.1 -- 287 0 2.70 -- -- 19.8 -- --59 4 0.08 -- -- -- -- 16.7 292 3 -0.51 -- -- 16.0 -- --70 1 1.94 -- -- -- -- 18.9 304 0 9.61 -- -- -- 28.0 --76 3 0.59 -- -- -- -- 17.3 305 1 -2.03 -- -- 14.2 -- --81 4 0.34 -- -- 17.0 -- -- 307 4 -0.08 -- -- 16.5 -- --86 3 0.67 -- -- 17.4 -- -- 308 0 2.19 -- -- 19.2 -- --87 3 0.84 -- -- -- 17.6 -- 309 0 10.45 -- -- -- 29.0 --89 3 -0.84 -- -- 15.6 -- --93 3 -0.93 -- -- -- 15.5 --96 3 0.84 -- -- 17.6 -- --97 3 0.84 -- -- 17.6 -- --
102 1 1.69 -- -- -- 18.6 --113 1 1.94 -- -- 18.9 -- --114 0 8.35 -- 26.5 -- -- --121 1 1.77 -- -- -- -- 18.7126 2 1.18 -- -- 18.0 -- --127 3 -0.93 -- -- 15.5 -- --131 0 -2.19 -- -- -- 14.0 --134 4 0.25 -- -- -- 16.9 --138 4 -0.25 -- -- -- -- 16.3140 4 0.42 -- 17.1 -- -- --141 3 -0.76 -- -- -- 15.7 --142 4 -0.17 -- -- -- -- 16.4144 4 0.34 -- -- 17.0 -- --145 NR -- -- -- < 84 --146 4 0.34 -- -- -- 17.0 --147 4 0.08 -- -- -- -- 16.7151 4 0.00 -- -- -- -- 16.6154 4 0.17 -- -- 16.8 -- --180 NR -- -- -- < 40.2 --190 3 -0.59 -- -- 15.9 -- --191 4 -0.34 -- -- -- -- 16.2193 3 0.84 -- -- 17.6 -- --198 4 -0.34 -- -- 16.2 -- --203 3 -0.67 -- -- 15.8 -- --204 1 -1.52 -- -- -- -- 14.8212 3 0.59 -- -- -- 17.3 --215 3 -0.51 -- -- 16.0 -- --
13.014.015.016.017.018.019.020.0
ANALYTICAL METHOD CODE
CO
NC
EN
TRA
TIO
N
0 1 3 4 6
55

Table 11. Statistical summary of reported data for standard reference water sample T-159 (trace constituents)--ContinuedAnalyte : Sb (Antimony) Concentration Unit : µg/L
SUMMARY
N = 16 11 15 1 3. AA: graphite furnace MPV = 13.9Minimum = 10.0 10.0 13.0 13.1 4. ICP F-pseudosigma = 1.1
Maximum = 22.0 64.0 16.6 6. ICP/MS N = 43Median = 13.3 13.4 14.0 11na. AA: hydride NaBH4 Uh = 14.4
F-pseudosigma = 1.7 1.6 0.7 Lh = 13.0
Lab Rating Z-value 3 4 6 11na1 4 0.09 14.0 -- -- --3 4 -0.47 -- 13.4 -- --
11 2 1.04 -- 15.0 -- --13 3 -0.76 13.1 -- -- --23 4 0.28 -- 14.2 -- --32 4 0.00 -- -- 13.9 --39 4 0.09 -- 14.0 -- --42 4 0.28 -- -- 14.2 --45 3 0.66 14.6 -- -- --46 1 -1.90 11.9 -- -- --48 3 0.76 -- -- 14.7 --50 2 1.04 -- -- 15.0 --57 4 0.09 -- 14.0 -- --59 1 1.90 -- -- 15.9 --70 4 -0.09 -- -- 13.8 --81 0 -2.75 11.0 -- -- --86 0 7.69 22.0 -- -- --89 1 -1.90 11.9 -- -- --93 0 -2.66 -- 11.1 -- --96 4 0.00 13.9 -- -- --97 2 1.04 15.0 -- -- --
102 0 -3.70 -- 10.0 -- --113 2 -1.33 -- 12.5 -- --127 4 -0.09 13.8 -- -- --134 3 -0.85 13.0 -- -- --138 2 1.42 -- -- 15.4 --141 0 -2.37 -- 11.4 -- --142 0 2.56 -- -- 16.6 --144 2 -1.61 12.2 -- -- --146 NR -- < 15.4 -- --151 4 -0.28 -- -- 13.6 --154 2 -1.42 12.4 -- -- --180 NR -- < 40.7 -- --193 4 -0.47 13.4 -- -- --198 3 0.95 14.9 -- -- --204 3 -0.66 -- -- 13.2 --212 4 0.09 -- -- 14.0 --215 0 -3.70 10.0 -- -- --219 4 0.09 -- -- 14.0 --234 3 -0.57 -- 13.3 -- --236 0 47.58 -- 64.0 -- --241 4 0.00 -- -- 13.9 --247 4 0.32 -- -- 14.2 --265 3 -0.85 -- -- 13.0 --282 3 -0.76 -- -- -- 13.1
10.511.512.513.514.515.516.517.5
ANALYTICAL METHOD CODE
CO
NC
EN
TRA
TIO
N
3 4 6 11na
56

Table 11. Statistical summary of reported data for standard reference water sample T-159 (trace constituents)--ContinuedAnalyte : Se (Selenium) Concentration Unit : µg/L
SUMMARY
N = 18 10 16 5 3. AA: graphite furnace MPV = 5.49Minimum = 4.00 1.07 4.90 2.00 4. ICP F-pseudosigma = 0.83
Maximum = 8.00 7.22 7.15 9.00 6. ICP/MS N = 49Median = 5.35 5.19 5.53 11na. AA: hydride NaBH4 Uh = 6.02
F-pseudosigma = 0.73 1.85 0.59 Lh = 4.90
Lab Rating Z-value 3 4 6 11na Lab Rating Z-value 3 4 6 11na1 4 -0.10 5.40 -- -- -- 282 4 0.14 -- -- -- 5.603 0 2.09 -- 7.22 -- -- 287 4 -0.34 5.20 -- -- --
10 2 -1.07 -- -- -- 4.60 292 3 0.62 6.00 -- -- --11 3 0.62 -- 6.00 -- -- 307 3 -0.80 4.82 -- -- --13 0 3.03 8.00 -- -- --23 3 -0.70 -- 4.90 -- --32 4 -0.10 -- -- 5.40 --39 4 -0.46 -- 5.10 -- --42 3 0.85 -- -- 6.19 --46 4 0.15 5.61 -- -- --48 3 -0.70 -- -- 4.90 --50 4 -0.10 -- -- 5.40 --57 2 -1.43 4.30 -- -- --59 4 0.50 -- -- 5.90 --70 4 0.08 -- -- 5.55 --81 1 -1.79 4.00 -- -- --86 3 -0.98 -- -- -- 4.6787 0 -4.20 -- -- -- < 289 0 -4.20 -- -- -- 2.0093 1 -1.67 -- 4.10 -- --96 4 0.02 5.50 -- -- --
102 0 -2.39 -- 3.50 -- --113 4 -0.36 5.19 -- -- --127 3 -0.60 4.99 -- -- --131 NR -- < 60 -- --134 4 0.38 5.80 -- -- --138 4 -0.02 -- -- 5.47 --141 2 1.34 -- 6.60 -- --142 3 0.67 -- -- 6.04 --144 4 0.14 5.60 -- -- --146 4 -0.25 -- 5.28 -- --151 4 0.02 -- -- 5.50 --154 2 1.22 6.50 -- -- --180 NR -- < 67.9 -- --190 3 -0.81 4.81 -- -- --191 1 1.58 -- -- 6.80 --193 2 -1.10 4.57 -- -- --198 NR <10 -- -- --203 4 -0.22 5.30 -- -- --204 4 -0.22 -- -- 5.30 --212 4 -0.33 -- -- 5.21 --215 3 0.62 6.00 -- -- --219 4 0.02 -- -- 5.50 --234 2 1.34 -- 6.60 -- --236 NR -- <10 -- --241 2 1.28 -- -- 6.55 --247 3 0.85 -- -- 6.19 --255 1 2.01 -- -- 7.15 --265 0 4.23 -- -- -- 9.00277 0 -5.32 -- 1.07 -- --
3.00
4.00
5.00
6.00
7.00
8.00
ANALYTICAL METHOD CODE
CO
NC
EN
TRA
TIO
N
3 4 6 11
57

Table 11. Statistical summary of reported data for standard reference water sample T-159 (trace constituents)--ContinuedAnalyte : SiO2 (Silica) Concentration Unit : mg/L
SUMMARYMPV = 11.5
N = 1 25 1 6 9 0. Other F-pseudosigma = 0.7Minimum = 12.8 5.8 11.2 5.5 10.6 4. ICP N = 42
Maximum = 12.5 12.1 15.1 5. DCP Uh = 12.0Median = 11.4 12.1 6. ICP/MS Lh = 11.0
F-pseudosigma = 0.7 0.7 22mb. Color: molybdate blue
Lab Rating Z-value 0 4 5 6 22mb1 4 0.47 -- 11.8 -- -- --3 3 -0.74 -- 10.9 -- -- --
11 2 1.42 -- 12.5 -- -- --13 4 -0.07 -- 11.4 -- -- --24 3 0.88 -- 12.1 -- -- --26 3 0.74 -- 12.0 -- -- --32 4 0.47 -- -- -- 11.8 --33 4 -0.34 -- -- 11.2 -- --42 2 -1.01 -- 10.7 -- -- --57 4 -0.34 -- 11.2 -- -- --64 4 -0.07 -- 11.4 -- -- --70 3 0.88 -- -- -- -- 12.176 3 0.84 -- -- -- 12.1 --89 3 -0.61 -- -- -- -- 11.097 4 -0.07 -- -- -- -- 11.4
121 4 0.47 -- 11.8 -- -- --127 4 -0.07 -- 11.4 -- -- --131 2 -1.15 -- 10.6 -- -- --134 4 -0.15 -- 11.3 -- -- --140 2 1.24 -- -- -- -- 12.4142 4 -0.07 -- 11.4 -- -- --145 4 0.42 -- 11.8 -- -- --154 3 -0.74 -- 10.9 -- -- --190 2 1.15 -- -- -- -- 12.3191 4 0.34 -- -- -- 11.7 --203 4 0.31 -- -- -- -- 11.7212 2 1.01 -- 12.2 -- -- --219 3 -0.61 -- -- -- 11.0 --227 0 -7.62 -- 5.8 -- -- --234 4 0.20 -- 11.6 -- -- --236 0 -7.42 -- 6.0 -- -- --241 4 -0.47 -- -- -- 11.1 --247 0 2.09 -- -- -- -- 13.0254 3 0.54 -- 11.9 -- -- --259 4 0.28 -- 11.7 -- -- --265 0 -7.62 -- 5.8 -- -- --273 1 1.75 12.8 -- -- -- --274 2 -1.17 -- -- -- -- 10.6282 0 -7.99 -- -- -- 5.5 --304 4 0.07 -- 11.5 -- -- --309 0 -7.49 -- 5.9 -- -- --312 0 4.87 -- -- -- -- 15.1
9.0
10.0
11.0
12.0
13.0
14.0
ANALYTICAL METHOD CODE
CO
NC
EN
TRA
TIO
N
0 4 5 6 22m
58

Table 11. Statistical summary of reported data for standard reference water sample T-159 (trace constituents)--ContinuedAnalyte : Sr (Strontium) Concentration Unit : µg/L
SUMMARY
N = 27 1 7 4. ICP MPV = 190Minimum = 163 206 186 5. DCP F-pseudosigma = 7
Maximum = 211 195 6. ICP/MS Rating Criterion = 10Median = 190 189 N = 35
F-pseudosigma = 10 3 Uh = 196Lh = 187
Lab Rating Z-value 4 5 61 4 -0.42 -- -- 1863 2 -1.16 179 -- --
11 2 1.05 200 -- --24 3 0.63 196 -- --32 4 -0.11 -- -- 18933 1 1.68 -- 206 --42 4 -0.32 187 -- --50 3 0.53 -- -- 19557 4 0.00 190 -- --59 4 -0.32 -- -- 18770 2 1.16 201 -- --81 3 -0.95 181 -- --86 4 0.21 192 -- --
102 3 0.69 197 -- --113 4 -0.11 189 -- --121 4 0.00 190 -- --127 3 -0.95 181 -- --131 0 -2.84 163 -- --134 3 -0.74 183 -- --138 3 -0.74 183 -- --141 2 1.16 201 -- --142 3 0.84 198 -- --145 4 0.21 192 -- --151 4 -0.21 -- -- 188154 1 -1.58 175 -- --191 4 0.11 -- -- 191212 4 -0.11 189 -- --219 4 0.32 -- -- 193234 3 -0.84 182 -- --236 4 0.21 192 -- --247 4 0.21 192 -- --254 3 0.89 199 -- --259 4 0.00 190 -- --265 4 0.00 190 -- --273 0 2.21 211 -- --
170
180
190
200
210
ANALYTICAL METHOD CODE
CO
NC
EN
TRA
TIO
N
4 5 6
59

Table 11. Statistical summary of reported data for standard reference water sample T-159 (trace constituents)--ContinuedAnalyte : Tl (Thallium) Concentration Unit : µg/L
SUMMARY
N = 1 12 9 18 0. Other MPV = 13.8Minimum = 34.3 8.5 9.7 12.1 3. AA: graphite furnace F-pseudosigma = 1.6
Maximum = 25.2 18.2 15.7 4. ICP N = 40Median = 13.9 12.7 13.8 6. ICP/MS Uh = 14.9
F-pseudosigma = 2.7 1.9 0.5 Lh = 12.8
Lab Rating Z-value 0 3 4 61 4 -0.29 -- -- -- 13.33 3 -0.67 -- -- 12.7 --
11 2 -1.10 -- -- 12.0 --13 4 0.09 -- 13.9 -- --23 0 -2.54 -- -- 9.7 --32 4 0.15 -- -- -- 14.039 0 2.79 -- -- 18.2 --42 3 0.72 -- -- -- 14.948 4 -0.04 -- -- -- 13.750 4 0.09 -- -- -- 13.957 3 0.53 -- -- 14.6 --59 3 0.72 -- -- -- 14.970 2 1.22 -- -- -- 15.776 4 -0.14 -- -- -- 13.581 3 0.78 -- 15.0 -- --86 0 -2.70 -- 9.5 -- --89 0 7.18 -- 25.2 -- --97 2 1.22 -- 15.7 -- --
113 4 0.04 -- 13.8 -- --114 0 12.89 34.3 -- -- --126 0 -2.48 -- 9.8 -- --127 3 -0.92 -- -- 12.3 --134 4 -0.35 -- 13.2 -- --138 4 0.09 -- -- -- 13.9141 4 -0.10 -- -- 13.6 --142 4 -0.10 -- -- -- 13.6144 3 0.78 -- 15.0 -- --146 2 -1.29 -- -- 11.7 --151 4 -0.10 -- -- -- 13.6154 3 -0.54 -- 12.9 -- --180 NR -- -- -- < 54.9 --191 3 -0.67 -- -- -- 12.7198 4 0.34 -- 14.3 -- --204 2 -1.04 -- -- -- 12.1212 4 0.09 -- -- -- 13.9219 4 0.15 -- -- -- 14.0234 3 0.84 -- -- 15.1 --241 3 -0.60 -- -- -- 12.8247 2 1.22 -- -- -- 15.7265 4 -0.48 -- -- -- 13.0282 0 -3.30 -- 8.5 -- --
9.0
11.0
13.0
15.0
17.0
19.0
ANALYTICAL METHOD CODE
CO
NC
EN
TRA
TIO
N
3 4 6
60

Table 11. Statistical summary of reported data for standard reference water sample T-159 (trace constituents)--ContinuedAnalyte : U (Uranium) Concentration Unit : µg/L
SUMMARY
N = 1 0 10 1 0. Other MPV = 5.04Minimum = 4.16 4.70 6.80 4. ICP F-pseudosigma = 0.32
Maximum = 5.60 6. ICP/MS N = 12Median = 5.04 9. Atomic fluoresence Uh = 5.24
F-pseudosigma = 0.24 Lh = 4.80
Lab Rating Z-value 0 4 6 91 3 -0.71 -- -- 4.81 --
32 3 0.96 -- -- 5.35 --70 1 1.74 -- -- 5.60 --76 4 0.25 -- -- 5.12 --
121 3 -0.74 -- -- 4.80 --127 NR -- < 200 -- --134 4 -0.12 -- -- 5.00 --142 4 0.12 -- -- 5.08 --191 4 0.19 -- -- 5.10 --219 3 -0.74 -- -- 4.80 --254 0 -2.73 4.16 -- -- --265 2 -1.05 -- -- 4.70 --282 0 5.46 -- -- -- 6.80
4.00
4.50
5.00
5.50
6.00
ANALYTICAL METHOD CODE
CO
NC
EN
TRA
TIO
N
0 6
61

Table 11. Statistical summary of reported data for standard reference water sample T-159 (trace constituents)--ContinuedAnalyte : V (Vanadium) Concentration Unit : µg/L
SUMMARY
N = 4 23 13 3. AA: graphite furnace MPV = 14.4Minimum = 14.2 10.8 11.7 4. ICP F-pseudosigma = 1.7
Maximum = 18.0 24.0 17.0 6. ICP/MS N = 40Median = 14.1 14.4 Uh = 16.1
F-pseudosigma = 1.7 1.0 Lh = 13.9
Lab Rating Z-value 3 4 61 1 1.57 -- -- 17.03 4 -0.15 -- 14.1 --
11 4 -0.21 -- 14.0 --13 3 -0.69 -- 13.2 --26 3 0.75 -- 15.6 --32 4 -0.45 -- -- 13.639 0 -2.13 -- 10.8 --42 4 0.45 -- -- 15.146 3 0.51 -- 15.2 --48 4 -0.27 -- -- 13.950 4 0.21 -- -- 14.757 4 -0.21 -- 14.0 --59 3 0.63 -- -- 15.470 4 -0.45 -- -- 13.681 3 -0.81 -- 13.0 --86 1 1.53 -- 16.9 --89 2 1.17 16.3 -- --93 3 -0.81 -- 13.0 --96 1 1.53 16.9 -- --97 0 2.19 18.0 -- --
102 2 1.35 -- 16.6 --121 2 -1.29 -- 12.2 --127 4 -0.09 14.2 -- --134 4 -0.27 -- 13.9 --138 4 -0.21 -- 14.0 --141 4 -0.03 -- 14.3 --142 4 -0.33 -- -- 13.8145 0 3.39 -- 20.0 --146 3 0.51 -- 15.2 --154 3 0.99 -- 16.0 --180 0 2.97 -- 19.3 --212 1 -1.59 -- -- 11.7215 0 5.79 -- 24.0 --219 4 -0.21 -- -- 14.0234 4 0.03 -- 14.4 --236 0 -2.59 -- < 10 --241 2 1.11 -- -- 16.2247 4 0.39 -- -- 15.0265 4 -0.21 -- 14.0 --282 4 0.03 -- -- 14.4304 2 -1.41 -- 12.0 --
9.5
11.5
13.5
15.5
17.5
19.5
ANALYTICAL METHOD CODE
CO
NC
EN
TRA
TIO
N
3 4 6
62

Table 11. Statistical summary of reported data for standard reference water sample T-159 (trace constituents)--ContinuedAnalyte : Zn (Zinc) Concentration Unit : µg/L
SUMMARY
N = 9 3 31 20 1 1 1. AA: direct, air MPV = 19.2Minimum = 15.4 18.0 9.5 14.8 18.8 20.9 3. AA: graphite furnace F-pseudosigma = 1.9
Maximum = 26.5 35.0 38.0 23.3 4. ICP N = 65Median = 20.0 18.8 19.0 6. ICP/MS Uh = 20.5
F-pseudosigma = 1.1 2.3 1.4 20. Titrate: colorimetric Lh = 18.051. Turbidimetric
Lab Rating Z-value 1 3 4 6 20 51 Lab Rating Z-value 1 3 4 6 20 511 4 -0.22 -- -- -- 18.8 -- -- 215 0 10.14 -- -- 38.0 -- -- --3 3 -0.86 -- -- 17.6 -- -- -- 219 4 0.43 -- -- -- 20.0 -- --
10 1 1.51 -- 22.0 -- -- -- -- 227 3 0.70 -- -- 20.5 -- -- --11 NR -- -- -- < 25 -- -- -- 234 1 1.73 -- -- 22.4 -- -- --12 0 8.53 -- 35.0 -- -- -- -- 236 1 -1.73 -- -- 16.0 -- -- --13 2 -1.03 -- -- 17.3 -- -- -- 241 1 1.73 -- -- -- 22.4 -- --23 4 -0.22 -- -- -- -- 18.8 -- 247 0 2.21 -- -- -- 23.3 -- --24 4 -0.22 -- -- 18.8 -- -- -- 254 3 0.54 -- -- 20.2 -- -- --26 4 -0.32 -- -- 18.6 -- -- -- 255 3 0.54 -- -- -- 20.2 -- --32 4 -0.11 -- -- -- 19.0 -- -- 259 3 -0.54 -- -- 18.2 -- -- --39 2 1.46 -- -- 21.9 -- -- -- 265 3 -0.65 -- -- 18.0 -- -- --42 3 0.54 -- -- -- 20.2 -- -- 273 4 -0.27 -- -- 18.7 -- -- --45 3 0.97 21.0 -- -- -- -- -- 277 0 -5.23 -- -- 9.5 -- -- --46 2 -1.03 -- -- 17.3 -- -- -- 282 4 0.32 -- -- -- 19.8 -- --48 2 -1.30 -- -- -- 16.8 -- -- 287 3 -0.65 18.0 -- -- -- -- --50 3 -0.65 -- -- -- 18.0 -- -- 292 4 -0.11 -- -- 19.0 -- -- --57 2 1.24 -- -- 21.5 -- -- -- 304 4 0.38 -- -- 19.9 -- -- --59 3 0.54 -- -- -- 20.2 -- -- 305 0 -2.05 15.4 -- -- -- -- --70 2 -1.03 -- -- -- 17.3 -- -- 307 0 3.13 25.0 -- -- -- -- --81 1 1.51 -- -- 22.0 -- -- -- 308 0 3.94 26.5 -- -- -- -- --86 2 -1.13 -- -- 17.1 -- -- --87 0 2.43 -- -- 23.7 -- -- --89 3 -0.65 -- 18.0 -- -- -- --93 2 -1.08 -- -- 17.2 -- -- --96 0 -5.21 < 10 -- -- -- -- --
102 0 -4.42 -- -- 11.0 -- -- --113 3 0.65 -- -- 20.4 -- -- --114 4 0.16 19.5 -- -- -- -- --121 4 -0.11 -- -- -- 19.0 -- --127 4 -0.27 -- -- 18.7 -- -- --131 3 0.70 -- -- 20.5 -- -- --134 3 0.54 -- -- 20.2 -- -- --138 4 -0.11 -- -- -- 19.0 -- --140 4 0.43 20.0 -- -- -- -- --141 3 0.92 -- -- -- -- -- 20.9142 0 -2.37 -- -- -- 14.8 -- --144 4 0.43 20.0 -- -- -- -- --145 0 2.05 -- -- 23.0 -- -- --146 4 0.43 -- -- 20.0 -- -- --147 4 -0.38 -- -- -- 18.5 -- --151 4 0.00 -- -- -- 19.2 -- --154 2 -1.46 -- -- 16.5 -- -- --180 NR -- -- -- < 24.4 -- -- --190 4 0.38 19.9 -- -- -- -- --191 4 -0.49 -- -- -- 18.3 -- --193 NR -- < 25 -- -- -- -- --198 NR -- -- -- < 50 -- -- --203 3 -0.65 -- -- 18.0 -- -- --204 2 -1.46 -- -- -- 16.5 -- --212 4 0.11 -- -- -- 19.4 -- --
13.515.517.519.521.523.5
ANALYTICAL METHOD CODE
CO
NC
EN
TRA
TIO
N
1 3 4 6 20 51
63

Table 12. Statistical summary of reported data for standard reference sample M-152 (major constituents)
Definition of analytical methods, abbreviations, and symbols
Analytical methods
0. Other/Not reported
1. AA: direct, air = atomic absorption: direct, air
2. AA: direct, N2O = atomic absorption: direct, nitrous oxide
3. AA: graphite furnace = atomic absorption: graphite furnace
4. ICP = inductively coupled plasma
5. DCP = direct current plasma
6. ICP/MS = inductively coupled plasma / mass spectrometry
7. IC = ion chromatography
12. Flame emission = flame emission
20. Titrate: color = titration: colorimetric (color reagent specified)
21. Titrate: electro = titration: electrometric
22. Color: = colorimetric (color reagent specified)
40. Ion electrode = ion selective electrode
41. Electro = electrometric: (type meter specified)
50. Gravimetric = gravimetric: (precipitate specified)
51. Turbidimetric = turbidimetric: (precipitate specified)
Abbreviations and figure symbols
N = number of analyses--(excluding less than values)
MPV = most probable value
F-pseudosigma = nonparametric statistic deviation
Uh = upper hinge value
Lh = lower hinge value
Uwl = upper warning limit
Lwl = lower warning limit
Ucl = upper warning limit
Lcl = lower warning limitµg/L = micrograms per liter
mg/L = milligrams per literµS/cm = microsiemens per centimeter at 250 C
Lab = laboratory code number
NR = not rated, less than value reported or insufficient data
< = less than
-- = not reported
Constituent pageAlk Alkalinity as CaCO3 65
B Boron 66
Ca Calcium 67
Cl Chloride 68
DSRD Dissolved solids 69
F Fluoride 70
K Potassium 71
Mg Magnesium 72
Na Sodium 73
total P Phosphorus 74
pH 75SiO2 Silica 76SO4 Sulfate 77
Sp CondSpecific Conductance 78
Sr Strontium 79
V Vanadium 80
64

Table 12. Statistical summary of reported data for standard reference water sample M-152 (major constituents)--ContinuedAnalyte : Alkalinity (as CaCO3) Concentration Unit : mg/L
SUMMARY
N = 1 8 53 2 4 0. Other MPV = 6.00Minimum = 11.50 3.60 3.65 4.80 0.22 20. Titrate: colorimetric F-pseudosigma = 1.49Maximum = 11.60 24.40 7.80 6.90 21. Titrate: electrometric N = 68
Median = 6.05 6.00 22. Colorimetric Uh = 7.00F-pseudosigma = 2.91 1.30 41. Direct reading Lh = 5.00
Lab Rating Z-value 0 20 21 22 41 Lab Rating Z-value 0 20 21 22 411 NR -0.09 -- -- 5.86 -- -- 215 NR 0.00 -- -- 6.00 -- --3 NR 0.00 -- -- 6.00 -- -- 227 NR 0.00 -- -- 6.00 -- --
10 NR -1.28 -- -- 4.10 -- -- 234 NR 1.21 -- -- -- 7.80 --11 NR -0.67 -- -- 5.00 -- -- 236 NR 0.27 -- -- 6.40 -- --13 NR 1.04 -- -- 7.55 -- -- 241 NR -0.67 -- -- 5.00 -- --23 NR 0.07 -- 6.10 -- -- -- 244 NR 4.78 -- -- 13.10 -- --24 NR 0.50 -- -- 6.74 -- -- 247 NR -0.01 -- -- 5.98 -- --25 NR 3.36 -- -- 11.00 -- -- 253 NR -1.61 -- 3.60 -- -- --26 NR 1.61 -- -- 8.40 -- -- 259 NR -1.35 -- -- 4.00 -- --33 NR -1.52 -- -- 3.74 -- -- 268 NR 12.38 -- -- 24.40 -- --38 NR 0.23 -- -- 6.34 -- -- 273 NR 2.09 -- -- 9.10 -- --39 NR 0.34 -- -- 6.50 -- -- 274 NR 2.60 -- 9.86 -- -- --42 NR 1.05 -- -- 7.56 -- -- 275 NR 2.69 -- 10.00 -- -- --43 NR -- -- -- < 20 -- -- 277 NR -0.44 -- -- 5.35 -- --45 NR -- -- -- < 20 -- -- 282 NR -0.62 -- -- 5.08 -- --46 NR -3.89 -- -- -- -- 0.22 287 NR 0.67 -- -- 7.00 -- --48 NR -- < 5 -- -- -- -- 292 NR 0.34 -- -- 6.50 -- --50 NR -0.68 -- -- 4.99 -- -- 302 NR 0.00 -- 6.00 -- -- --51 NR -1.14 -- -- 4.30 -- -- 307 NR 0.00 -- 6.00 -- -- --57 NR 0.00 -- 6.00 -- -- -- 309 NR 3.77 -- 11.60 -- -- --59 NR -0.94 -- -- 4.60 -- -- 312 NR 3.70 11.50 -- -- -- --70 NR 0.67 -- -- 7.00 -- --81 NR -0.57 -- -- 5.15 -- --85 NR -0.84 -- -- 4.75 -- --89 NR 0.07 -- -- 6.10 -- --93 NR -0.80 -- -- 4.81 -- --96 NR -1.01 -- -- 4.50 -- -- Laboratories were not rated for alkalinity because the97 NR 0.20 -- -- 6.30 -- -- long term stability of alkalinity needs to be verified.
107 NR 3.23 -- -- 10.80 -- -- The MPV for alkalinity is provided as an estimated value.109 NR 1.29 -- -- 7.91 -- --113 NR 0.00 -- -- 6.00 -- --114 NR -0.67 -- -- 5.00 -- --127 NR 0.30 -- -- 6.45 -- --134 NR 0.56 -- -- -- -- 6.83138 NR 0.34 -- -- 6.50 -- --141 NR -0.03 -- -- 5.95 -- --142 NR 0.67 -- -- 7.00 -- --143 NR -1.35 -- -- 4.00 -- --145 NR -0.81 -- -- -- 4.80 --146 NR -0.90 -- -- 4.66 -- --151 NR 0.00 -- -- 6.00 -- --154 NR 2.69 -- -- 10.00 -- --180 NR 0.61 -- -- -- -- 6.90185 NR -0.64 -- -- 5.05 -- --190 NR -0.27 -- -- -- -- 5.60193 NR -1.35 -- -- 4.00 -- --203 NR -1.48 -- -- 3.80 -- --204 NR -1.58 -- -- 3.65 -- --212 NR 0.01 -- -- 6.02 -- --213 NR -0.67 -- -- 5.00 -- --
1.502.503.504.505.506.507.508.509.50
10.50
ANALYTICAL METHOD CODE
CO
NC
EN
TR
AT
ION
20 21 22 41
65

Table 12. Statistical summary of reported data for standard reference water sample M-152 (major constituents)--ContinuedAnalyte : B (Boron) Concentration Unit : µg/L
SUMMARY
N = 1 28 3 0. Other MPV = 92.2Minimum = 74.2 12.6 93.0 4. ICP F-pseudosigma = 7.8
Maximum = 143.0 94.0 6. ICP/MS N = 32Median = 92.0 Uh = 95.4
F-pseudosigma = 8.9 Lh = 84.8
Lab Rating Z-value 0 4 61 4 0.10 -- -- 93.03 4 -0.15 -- 91.0 --
11 4 0.11 -- 93.0 --24 3 0.62 -- 97.0 --26 3 -0.84 -- 85.6 --32 4 -0.09 -- 91.5 --39 0 -2.30 74.2 -- --42 4 -0.10 -- 91.4 --46 4 0.00 -- 92.2 --48 4 0.23 -- -- 94.050 3 0.58 -- 96.7 --57 3 0.61 -- 96.9 --70 0 4.71 -- 129.0 --86 2 -1.40 -- 81.2 --
127 4 0.18 -- 93.6 --131 4 -0.28 -- 90.0 --134 4 0.00 -- 92.1 --138 4 0.21 -- 93.8 --141 2 -1.36 -- 81.5 --142 3 0.73 -- 97.9 --145 1 1.51 -- 104.0 --180 0 -10.17 -- < 12.6 --212 4 -0.03 -- 91.9 --215 1 -1.56 -- 80.0 --234 3 -0.97 -- 84.6 --236 2 -1.17 -- 83.0 --247 0 6.50 -- 143.0 --255 4 0.21 -- 93.8 --259 3 -0.92 -- 85.0 --265 4 0.23 -- -- 94.0273 0 -3.93 -- 61.4 --282 3 0.68 -- 97.5 --
66.0
76.0
86.0
96.0
106.0
116.0
ANALYTICAL METHOD CODE
CO
NC
EN
TRA
TIO
N
0 4 6
66

Table 12. Statistical summary of reported data for standard reference water sample M-152 (major constituents)--ContinuedAnalyte : Ca (Calcium) Concentration Unit : mg/L
SUMMARYMPV = 3.63
N = 6 14 2 45 4 3 0. Other F-pseudosigma = 0.18Minimum = 2.37 2.58 2.40 2.98 3.63 2.60 1. AA: direct, air N = 74
Maximum = 3.70 5.40 3.58 4.34 3.98 5.24 2. AA: direct, nitrous oxide Uh = 3.79Median = 3.61 3.65 4. ICP Lh = 3.55
F-pseudosigma = 0.29 0.13 6. ICP/MS7. Ion chromatography
Lab Rating Z-value 0 1 2 4 6 7 Lab Rating Z-value 0 1 2 4 6 71 4 0.34 -- -- -- 3.69 -- -- 215 4 0.39 -- -- -- 3.70 -- --3 4 0.34 -- -- -- 3.69 -- -- 219 4 0.00 -- -- -- -- 3.63 --
10 4 -0.17 -- 3.60 -- -- -- -- 227 3 -0.84 -- -- -- 3.48 -- --11 3 0.79 -- -- -- 3.77 -- -- 234 4 0.11 -- -- -- 3.65 -- --13 4 -0.22 -- -- -- 3.59 -- -- 236 3 -0.90 -- -- -- 3.47 -- --24 2 1.41 -- -- -- 3.88 -- -- 241 3 0.96 -- 3.80 -- -- -- --26 0 -5.79 -- -- -- -- -- 2.60 247 4 -0.28 -- -- -- 3.58 -- --32 4 0.39 -- -- -- -- 3.70 -- 254 3 0.84 -- -- -- 3.78 -- --33 4 0.39 3.70 -- -- -- -- -- 255 4 0.06 -- -- -- 3.64 -- --38 4 -0.28 -- -- 3.58 -- -- -- 259 4 0.39 -- -- -- 3.70 -- --39 1 -1.80 3.31 -- -- -- -- -- 265 4 0.11 -- -- -- 3.65 -- --42 4 -0.45 -- -- -- 3.55 -- -- 268 0 -3.82 -- 2.95 -- -- -- --45 2 -1.24 -- 3.41 -- -- -- -- 273 0 3.99 -- -- -- 4.34 -- --46 4 -0.28 -- -- -- 3.58 -- -- 274 0 -7.08 2.37 -- -- -- -- --48 1 1.97 -- -- -- -- 3.98 -- 275 0 -3.54 3.00 -- -- -- -- --50 3 0.90 -- -- -- 3.79 -- -- 277 3 0.56 -- -- -- 3.73 -- --51 1 -1.80 -- 3.31 -- -- -- -- 279 0 -3.54 3.00 -- -- -- -- --57 4 0.00 -- -- -- 3.63 -- -- 282 4 -0.28 -- -- -- 3.58 -- --64 4 0.22 -- -- -- 3.67 -- -- 287 0 -5.90 -- 2.58 -- -- -- --70 1 1.97 -- -- -- 3.98 -- -- 292 0 9.95 -- 5.40 -- -- -- --76 4 -0.31 -- 3.58 -- -- -- -- 302 1 1.60 -- -- -- -- -- 3.9181 1 -1.52 -- -- -- 3.36 -- -- 304 4 0.39 -- -- -- 3.70 -- --85 0 3.15 -- 4.19 -- -- -- -- 307 0 7.42 -- 4.95 -- -- -- --86 4 -0.17 -- -- -- 3.60 -- -- 309 1 1.57 -- -- -- 3.91 -- --87 0 -6.91 -- -- 2.40 -- -- --89 0 -6.97 2.39 -- -- -- -- --93 4 -0.28 -- -- -- 3.58 -- --
102 1 1.91 -- -- -- 3.97 -- --109 3 0.96 -- 3.80 -- -- -- --113 3 0.67 -- -- -- 3.75 -- --121 4 -0.17 -- -- -- 3.60 -- --127 4 -0.11 -- -- -- 3.61 -- --131 4 -0.17 -- -- -- 3.60 -- --134 3 0.51 -- -- -- 3.72 -- --138 4 0.22 -- -- -- 3.67 -- --140 4 -0.17 -- 3.60 -- -- -- --141 2 1.01 -- -- -- 3.81 -- --142 0 -3.65 -- -- -- 2.98 -- --145 2 1.24 -- -- -- 3.85 -- --146 1 -1.57 -- -- -- 3.35 -- --151 2 1.41 -- 3.88 -- -- -- --154 4 -0.17 -- -- -- 3.60 -- --180 3 0.96 -- -- -- 3.80 -- --185 4 -0.11 -- 3.61 -- -- -- --190 0 9.05 -- -- -- -- -- 5.24191 3 0.90 -- -- -- -- 3.79 --193 1 -2.02 -- -- -- 3.27 -- --203 4 -0.17 -- -- -- 3.60 -- --209 0 -3.19 -- -- -- 3.06 -- --212 4 -0.45 -- -- -- 3.55 -- --
3.103.303.503.703.904.10
ANALYTICAL METHOD CODE
CO
NC
EN
TRA
TIO
N
0 1 2 4 6 7
67

Table 12. Statistical summary of reported data for standard reference water sample M-152 (major constituents)--ContinuedAnalyte : Cl (Chloride) Concentration Unit : mg/L
SUMMARY
N = 1 49 10 5 13 2 0. Other MPV = 17.3Minimum = 18.0 14.9 16.3 17.0 14.0 16.6 7. Ion chromatography F-pseudosigma = 0.9
Maximum = 19.1 34.4 18.0 21.2 17.0 20. Titrate: colorimetric N = 80Median = 17.4 18.9 16.8 21. Titrate: electrometric Uh = 18.0
F-pseudosigma = 0.7 2.2 0.9 22. Colorimetric Lh = 16.840. Ion selective electrode
Lab Rating Z-value 0 7 20 21 22 40 Lab Rating Z-value 0 7 20 21 22 401 4 -0.48 -- 16.9 -- -- -- -- 190 2 -1.26 -- 16.2 -- -- -- --3 2 1.21 -- -- -- -- 18.4 -- 191 4 0.03 -- 17.4 -- -- -- --
10 4 0.20 -- -- -- -- 17.5 -- 196 3 -0.70 -- 16.7 -- -- -- --11 3 0.76 -- -- 18.0 -- -- -- 203 4 0.31 -- -- -- 17.6 -- --12 0 -3.74 -- -- -- -- 14.0 -- 204 4 -0.37 -- -- -- 17.0 -- --13 3 -0.70 -- 16.7 -- -- -- -- 208 4 -0.03 -- 17.3 -- -- -- --23 4 0.20 -- 17.5 -- -- -- -- 209 1 1.59 -- 18.7 -- -- -- --24 4 -0.37 -- -- -- -- 17.0 -- 212 3 -0.70 -- 16.7 -- -- -- --25 3 0.53 -- 17.8 -- -- -- -- 213 2 -1.15 -- -- 16.3 -- -- --26 1 2.00 -- 19.1 -- -- -- -- 215 1 1.55 -- -- 18.7 -- -- --33 3 -0.59 -- 16.8 -- -- -- -- 219 2 -1.49 -- 16.0 -- -- -- --39 0 3.01 -- -- 20.0 -- -- -- 227 3 -0.88 -- 16.5 -- -- -- --42 4 0.20 -- 17.5 -- -- -- -- 234 4 0.31 -- 17.6 -- -- -- --43 4 -0.37 -- -- -- -- -- 17.0 241 4 0.42 -- 17.7 -- -- -- --45 2 1.32 -- 18.5 -- -- -- -- 247 4 0.08 -- 17.4 -- -- -- --48 3 0.76 18.0 -- -- -- -- -- 253 4 -0.40 -- -- 17.0 -- -- --50 3 -0.82 -- -- -- -- 16.6 -- 254 4 0.08 -- 17.4 -- -- -- --51 3 0.60 -- 17.9 -- -- -- -- 259 4 0.31 -- 17.6 -- -- -- --57 0 5.26 -- -- 22.0 -- -- -- 265 3 0.53 -- 17.8 -- -- -- --64 4 0.20 -- 17.5 -- -- -- -- 268 3 -0.82 -- 16.6 -- -- -- --70 4 -0.03 -- 17.3 -- -- -- -- 273 1 -1.86 -- 15.7 -- -- -- --76 4 0.06 -- 17.4 -- -- -- -- 274 0 19.23 -- -- 34.4 -- -- --81 4 -0.14 -- -- -- 17.2 -- -- 275 0 3.01 -- -- 20.0 -- -- --85 2 1.21 -- 18.4 -- -- -- -- 277 0 -2.73 -- 14.9 -- -- -- --86 4 -0.03 -- 17.3 -- -- -- -- 279 4 -0.42 -- -- 17.0 -- -- --87 2 -1.49 -- -- -- -- 16.0 -- 282 1 -1.71 -- 15.8 -- -- -- --89 3 -0.59 -- 16.8 -- -- -- -- 287 2 -1.23 -- 16.2 -- -- -- --93 1 1.88 -- 19.0 -- -- -- -- 292 4 -0.03 -- 17.3 -- -- -- --96 2 -1.49 -- -- -- -- 16.0 -- 302 0 -2.31 -- 15.3 -- -- -- --97 2 -1.04 -- -- -- -- 16.4 -- 307 1 1.88 -- -- 19.0 -- -- --
102 4 0.46 -- 17.7 -- -- -- --107 4 -0.03 -- -- -- 17.3 -- --109 3 0.76 -- -- -- 18.0 -- --113 3 0.65 -- 17.9 -- -- -- --114 3 -0.82 -- -- -- -- -- 16.6127 4 0.08 -- 17.4 -- -- -- --131 2 1.10 -- 18.3 -- -- -- --134 4 -0.24 -- 17.1 -- -- -- --138 4 -0.03 -- 17.3 -- -- -- --140 0 -2.37 -- -- -- -- 15.2 --141 3 0.98 -- 18.2 -- -- -- --142 3 0.98 -- 18.2 -- -- -- --143 3 -0.59 -- -- -- -- 16.8 --145 4 0.40 -- 17.7 -- -- -- --146 4 -0.14 -- -- -- -- 17.2 --151 4 -0.25 -- 17.1 -- -- -- --154 4 -0.14 -- -- -- -- 17.2 --180 2 1.32 -- 18.5 -- -- -- --183 0 4.31 -- -- -- -- 21.2 --185 4 0.17 -- 17.5 -- -- -- --
14.515.516.517.518.519.5
ANALYTICAL METHOD CODE
CO
NC
EN
TRA
TIO
N
0 7 20 21 22 40
68

Table 12. Statistical summary of reported data for standard reference water sample M-152 (major constituents)--ContinuedAnalyte : DSRD (Dissolved solids)Concentration Unit : mg/L
SUMMARY
N = 1 45 4. ICP MPV = 66.5Minimum = 68.0 31.0 50. Gravimetric F-pseudosigma = 8.2
Maximum = 106.0 N = 46Median = 66.0 Uh = 72.0
F-pseudosigma = 8.2 Lh = 61.0
Lab Rating Z-value 4 501 4 -0.06 -- 66.03 3 0.55 -- 71.0
10 4 -0.06 -- 66.011 4 0.18 68.0 --12 3 0.67 -- 72.013 3 -0.64 -- 61.325 0 -3.74 -- 36.026 4 -0.06 -- 66.038 4 -0.43 -- 63.043 3 0.92 -- 74.045 4 0.43 -- 70.046 0 4.84 -- 106.048 3 0.55 -- 71.050 4 -0.43 -- 63.057 3 0.92 -- 74.070 4 0.43 -- 70.076 3 0.67 -- 72.081 0 -3.25 -- 40.085 2 -1.41 -- 55.087 0 2.64 -- 88.089 3 0.67 -- 72.096 3 0.55 -- 71.097 3 0.92 -- 74.0
109 2 -1.41 -- 55.0113 2 -1.41 -- 55.0114 0 -2.51 -- 46.0127 4 -0.25 -- 64.5134 4 0.23 -- 68.4138 4 0.43 -- 70.0140 0 4.11 -- 100.0141 0 -2.70 -- 44.5142 4 -0.31 -- 64.0143 3 0.67 -- 72.0146 0 -2.76 -- 44.0151 3 -0.67 -- 61.0190 3 0.86 -- 73.5212 2 1.41 -- 78.0215 4 -0.06 -- 66.0227 3 -0.67 -- 61.0234 4 0.06 -- 67.0236 3 0.67 -- 72.0247 4 -0.43 -- 63.0273 4 -0.06 -- 66.0275 3 -0.80 -- 60.0282 0 4.35 -- 102.0305 0 -4.35 -- 31.0
42.047.052.057.062.067.072.077.082.087.092.0
ANALYTICAL METHOD CODE
CO
NC
EN
TRA
TIO
N
4 50
69

Table 12. Statistical summary of reported data for standard reference water sample M-152 (major constituents)--ContinuedAnalyte : F (Fluoride) Concentration Unit : mg/L
SUMMARY
N = 28 1 34 7. Ion chromatography MPV = 1.98Minimum = 0.92 1.79 1.60 20. Titrate: colorimetric F-pseudosigma = 0.12
Maximum = 3.17 2.09 40. Ion selective electrode N = 63Median = 1.99 1.99 Uh = 2.04
F-pseudosigma = 0.21 0.07 Lh = 1.88
Lab Rating Z-value 7 20 40 Lab Rating Z-value 7 20 401 4 0.00 -- -- 1.98 247 1 -2.04 1.73 -- --3 4 0.49 -- -- 2.04 255 4 0.49 -- -- 2.04
10 3 0.57 -- -- 2.05 259 4 0.16 -- -- 2.0011 0 -3.10 -- -- 1.60 265 3 0.98 2.10 -- --13 2 -1.22 1.83 -- -- 273 0 -4.08 1.48 -- --23 3 0.82 2.08 -- -- 274 1 -1.55 -- 1.79 --25 0 -2.77 1.64 -- -- 275 4 0.16 -- -- 2.0033 3 -0.82 1.88 -- -- 277 0 -7.99 1.00 -- --39 4 0.00 -- -- 1.98 282 2 1.30 2.14 -- --42 4 -0.16 1.96 -- -- 287 1 -1.55 1.79 -- --45 4 0.16 2.00 -- -- 292 4 -0.49 1.92 -- --46 4 0.41 -- -- 2.03 302 4 -0.36 1.94 -- --50 4 -0.41 -- -- 1.93 305 0 -2.12 -- -- 1.7257 0 -2.28 -- -- 1.7059 4 0.16 -- -- 2.0070 4 -0.16 -- -- 1.9676 4 0.50 2.04 -- --81 4 0.00 1.98 -- --85 4 0.08 -- -- 1.9986 3 0.65 2.06 -- --89 2 -1.06 -- -- 1.8593 0 -8.64 0.92 -- --96 3 0.73 -- -- 2.0797 3 0.90 -- -- 2.09
102 0 9.70 3.17 -- --107 4 0.16 -- -- 2.00109 4 -0.24 -- -- 1.95113 4 0.16 -- -- 2.00114 4 -0.41 -- -- 1.93127 3 0.57 2.05 -- --131 1 1.87 2.21 -- --134 4 -0.16 -- -- 1.96138 4 -0.24 -- -- 1.95140 4 0.41 -- -- 2.03141 3 0.98 2.10 -- --142 3 0.90 -- -- 2.09145 4 0.16 2.00 -- --146 3 0.65 -- -- 2.06151 4 0.49 -- -- 2.04154 3 -0.82 -- -- 1.88180 3 0.82 2.08 -- --183 4 0.16 -- -- 2.00190 4 -0.16 -- -- 1.96191 4 0.08 1.99 -- --196 2 -1.47 1.80 -- --212 0 -2.20 -- -- 1.71215 3 -0.90 -- -- 1.87219 0 -2.85 1.63 -- --234 1 1.63 2.18 -- --241 3 -0.65 -- -- 1.90
1.601.701.801.902.002.102.202.30
ANALYTICAL METHOD CODE
CO
NC
EN
TRA
TIO
N
7 20 40
70

Table 12. Statistical summary of reported data for standard reference water sample M-152 (major constituents)--ContinuedAnalyte : K (Potassium) Concentration Unit : mg/L
SUMMARY
N = 2 21 32 4 3 5 0. Other MPV = 0.92Minimum = 0.88 0.70 0.52 0.83 0.57 0.88 1. AA: direct, air F-pseudosigma = 0.09
Maximum = 1.00 4.00 23.00 0.96 1.05 1.19 4. ICP N = 67Median = 0.92 0.94 6. ICP/MS Uh = 1.00
F-pseudosigma = 0.05 0.13 7. Ion chromatography Lh = 0.8812. Flame emission
Lab Rating Z-value 0 1 4 6 7 12 Lab Rating Z-value 0 1 4 6 7 121 4 -0.33 -- 0.89 -- -- -- -- 219 4 -0.11 -- -- -- 0.91 -- --3 0 5.13 -- -- 1.39 -- -- -- 234 2 -1.16 -- -- 0.81 -- -- --
10 4 0.00 -- 0.92 -- -- -- -- 236 3 -0.87 -- -- 0.84 -- -- --11 0 -3.06 -- -- 0.64 -- -- -- 241 0 -2.40 -- 0.70 -- -- -- --13 0 -2.51 -- -- 0.69 -- -- -- 247 4 0.17 -- -- 0.94 -- -- --24 4 0.44 -- -- 0.96 -- -- -- 254 4 0.33 -- 0.95 -- -- -- --26 0 -3.82 -- -- -- -- 0.57 -- 259 0 -2.84 -- -- 0.66 -- -- --32 4 0.44 -- -- -- 0.96 -- -- 265 4 -0.44 -- -- 0.88 -- -- --33 4 -0.44 0.88 -- -- -- -- -- 268 1 1.97 -- 1.10 -- -- -- --38 4 0.00 -- 0.92 -- -- -- -- 273 2 1.20 -- -- 1.03 -- -- --39 4 -0.33 -- -- 0.89 -- -- -- 274 3 0.66 -- -- -- -- -- 0.9842 4 -0.34 -- -- 0.89 -- -- -- 275 3 0.87 1.00 -- -- -- -- --45 2 1.09 -- 1.02 -- -- -- -- 277 3 0.66 -- -- 0.98 -- -- --46 0 241.18 -- -- 23.00 -- -- -- 279 4 0.22 -- -- -- -- -- 0.9448 4 0.31 -- -- -- 0.95 -- -- 282 0 3.60 -- -- 1.25 -- -- --50 2 1.31 -- -- 1.04 -- -- -- 287 2 -1.13 -- 0.82 -- -- -- --51 0 2.95 -- -- -- -- -- 1.19 292 3 0.87 -- 1.00 -- -- -- --57 0 2.51 -- -- 1.15 -- -- -- 302 2 1.46 -- -- -- -- 1.05 --64 4 -0.33 -- 0.89 -- -- -- -- 304 4 -0.22 -- -- 0.90 -- -- --70 2 1.42 -- -- 1.05 -- -- -- 309 0 5.68 -- -- 1.44 -- -- --81 2 -1.35 -- -- 0.80 -- -- --85 3 0.60 -- 0.98 -- -- -- --86 4 -0.23 -- -- 0.90 -- -- --87 3 0.66 -- 0.98 -- -- -- --89 4 -0.44 -- -- -- -- -- 0.8893 2 -1.42 -- -- 0.79 -- -- --97 4 -0.44 -- 0.88 -- -- -- --
102 0 -4.37 -- 0.52 -- -- --109 1 -1.64 -- 0.77 -- -- -- --113 2 1.05 -- -- 1.02 -- -- --121 4 0.22 -- 0.94 -- -- -- --127 3 -0.92 -- 0.84 -- -- -- --131 3 0.87 -- -- 1.00 -- -- --134 4 -0.27 -- 0.90 -- -- -- --138 3 -0.51 -- -- 0.87 -- -- --140 2 -1.04 -- 0.83 -- -- -- --141 2 1.09 -- -- 1.02 -- -- --142 NR -- -- -- < 1 -- -- --145 3 0.98 -- -- 1.01 -- -- --146 NR -- -- -- < 0.86 -- -- --151 4 0.00 -- 0.92 -- -- -- --154 3 0.87 -- -- 1.00 -- -- --180 NR -- -- -- < 1.63 -- -- --185 4 -0.22 -- 0.90 -- -- -- --190 4 -0.11 -- -- -- -- 0.91 --191 3 -0.98 -- -- -- 0.83 -- --193 4 0.33 -- 0.95 -- -- -- --203 4 0.00 -- -- -- -- -- 0.92209 4 0.36 -- -- 0.95 -- -- --212 3 -0.73 -- -- 0.85 -- -- --
0.650.750.850.951.051.15
ANALYTICAL METHOD CODE
CO
NC
EN
TRA
TIO
N
0 1 4 6 7 12
71

Table 12. Statistical summary of reported data for standard reference water sample M-152 (major constituents)--ContinuedAnalyte : Mg (Magnesium) Concentration Unit : mg/L
SUMMARY
N = 3 16 46 3 3 2 0. Other MPV = 0.722Minimum = 0.613 0.600 0.520 0.730 0.450 0.600 1. AA: direct, air F-pseudosigma = 0.047
Maximum = 0.800 4.000 1.100 0.770 0.910 0.950 4. ICP N = 73Median = 0.725 0.720 6. ICP/MS Uh = 0.746
F-pseudosigma = 0.073 0.037 7. Ion chromatography Lh = 0.68320. Titrate: colorimetric
Lab Rating Z-value 0 1 4 6 7 20 Lab Rating Z-value 0 1 4 6 7 201 4 0.17 -- -- 0.730 -- -- -- 215 2 -1.33 -- -- 0.660 -- -- --3 4 -0.06 -- -- 0.719 -- -- -- 219 4 -0.47 -- -- 0.700 -- -- --
10 3 0.60 -- 0.750 -- -- -- -- 227 3 -0.51 -- -- 0.698 -- -- --11 4 -0.47 -- -- 0.700 -- -- -- 234 4 0.00 -- -- 0.722 -- -- --13 4 0.39 -- -- 0.740 -- -- -- 236 2 -1.11 -- -- 0.670 -- -- --24 4 0.39 -- -- 0.740 -- -- -- 241 4 -0.04 -- 0.720 -- -- -- --26 0 -5.82 -- -- -- -- 0.450 -- 247 4 0.32 -- -- 0.737 -- -- --32 4 0.17 -- -- -- 0.730 -- -- 254 4 0.39 -- -- 0.740 -- -- --33 4 -0.26 0.710 -- -- -- -- 255 4 -0.13 -- -- 0.716 -- -- --38 3 0.51 -- 0.746 -- -- -- -- 259 4 -0.47 -- -- 0.700 -- -- --39 0 -2.81 -- -- 0.591 -- -- -- 265 4 0.39 -- -- 0.740 -- -- --42 0 -2.27 -- -- 0.616 -- -- -- 268 4 0.39 -- 0.740 -- -- -- --45 1 -1.97 -- 0.630 -- -- -- -- 273 1 1.88 -- -- 0.810 -- -- --46 3 -0.64 -- -- 0.692 -- -- -- 274 0 4.88 -- -- -- -- -- 0.95048 2 1.03 -- -- -- 0.770 -- -- 275 1 1.67 0.800 -- -- -- --50 4 0.39 -- -- 0.740 -- -- -- 277 0 8.09 -- -- 1.100 -- -- --51 4 0.17 -- 0.730 -- -- -- -- 279 0 -2.61 -- -- -- -- -- 0.60057 4 0.30 -- -- 0.736 -- -- -- 282 3 0.54 -- -- 0.747 -- -- --64 4 -0.47 -- -- 0.700 -- -- -- 287 1 -1.73 -- 0.641 -- -- -- --70 3 0.51 -- -- 0.746 -- -- -- 292 0 -2.61 -- 0.600 -- -- -- --76 4 0.45 -- 0.743 -- -- -- -- 302 0 3.79 -- -- -- -- 0.899 --81 0 -2.12 -- -- 0.623 -- -- -- 304 3 -0.69 -- -- 0.690 -- -- --85 4 0.26 -- 0.734 -- -- -- -- 307 3 0.60 -- 0.750 -- -- -- --86 3 0.79 -- -- 0.759 -- -- -- 309 0 -4.33 -- -- 0.520 -- -- --87 0 -2.61 -- 0.600 -- -- -- --89 0 -2.33 0.613 -- -- -- --93 4 -0.04 -- -- 0.720 -- -- --
102 0 4.67 -- -- 0.940 -- -- --109 1 -1.54 -- 0.650 -- -- -- --113 2 1.33 -- -- 0.784 -- -- --121 4 -0.47 -- -- 0.700 -- -- --127 4 0.49 -- -- 0.745 -- -- --131 1 -1.76 -- -- 0.640 -- -- --134 4 -0.27 -- -- 0.709 -- -- --138 4 -0.34 -- -- 0.706 -- -- --140 4 -0.47 -- 0.700 -- -- -- --141 1 1.80 -- -- 0.806 -- -- --142 NR -- -- -- < 1 -- -- --145 2 1.46 -- -- 0.790 -- -- --146 2 -1.01 -- -- 0.675 -- -- --151 0 2.31 -- 0.830 -- -- -- --154 4 0.17 -- -- 0.730 -- -- --180 4 0.28 -- -- 0.735 -- -- --185 4 -0.15 -- 0.715 -- -- -- --190 0 4.03 -- -- -- -- 0.910 --191 2 1.03 -- -- -- 0.770 -- --193 3 -0.96 -- -- 0.677 -- -- --203 0 -2.18 -- -- 0.620 -- -- --209 3 -0.84 -- -- 0.683 -- -- --212 4 0.19 -- -- 0.731 -- -- --
0.580
0.630
0.680
0.730
0.780
0.830
ANALYTICAL METHOD CODE
CO
NC
EN
TRA
TIO
N
0 1 4 6 20
72

Table 12. Statistical summary of reported data for standard reference water sample M-152 (major constituents)--ContinuedAnalyte : Na (Sodium) Concentration Unit : mg/L
SUMMARY
N = 17 44 1 3 3 6 1. AA: direct, air MPV = 16.3Minimum = 14.3 5.1 16.1 16.7 13.2 12.3 4. ICP F-pseudosigma = 0.9
Maximum = 18.2 50.7 17.0 18.2 16.9 5. DCP N = 74Median = 16.3 16.3 6. ICP/MS Uh = 16.8
F-pseudosigma = 0.4 1.0 7. Ion chromatography Lh = 15.512. Flame emission
Lab Rating Z-value 1 4 5 6 7 12 Lab Rating Z-value 1 4 5 6 7 121 3 0.70 -- 16.9 -- -- -- -- 209 4 -0.05 -- 16.2 -- -- -- --3 4 -0.16 -- 16.1 -- -- -- -- 212 3 -0.81 -- 15.5 -- -- -- --
10 4 -0.16 16.1 -- -- -- -- -- 215 2 1.03 -- 17.2 -- -- -- --11 3 -0.81 -- 15.5 -- -- -- -- 219 4 -0.27 -- 16.0 -- -- -- --12 0 -2.43 -- 14.0 -- -- -- -- 234 4 -0.05 -- 16.2 -- -- -- --13 2 1.03 -- 17.2 -- -- -- -- 236 3 -0.73 -- 15.6 -- -- -- --24 4 0.16 -- 16.4 -- -- -- -- 241 4 0.27 16.5 -- -- -- -- --26 0 -3.29 -- -- -- -- 13.2 -- 247 4 0.10 -- 16.3 -- -- -- --32 4 0.49 -- -- -- 16.7 -- -- 254 3 0.80 -- 17.0 -- -- -- --33 4 -0.16 -- -- 16.1 -- -- -- 259 4 0.27 -- 16.5 -- -- -- --38 2 -1.03 15.3 -- -- -- -- -- 265 4 -0.05 -- 16.2 -- -- -- --39 3 -0.70 -- 15.6 -- -- -- -- 268 4 -0.05 16.2 -- -- -- -- --42 3 -0.81 -- 15.5 -- -- -- -- 273 0 2.75 -- 18.8 -- -- -- --45 0 2.10 18.2 -- -- -- -- -- 274 0 -4.24 -- -- -- -- -- 12.346 4 0.38 -- 16.6 -- -- -- -- 275 2 -1.35 -- -- -- -- -- 15.048 3 0.81 -- -- -- 17.0 -- -- 277 0 -2.48 -- 14.0 -- -- -- --50 3 0.81 -- 17.0 -- -- -- -- 279 3 0.59 -- -- -- -- -- 16.851 4 -0.27 -- -- -- -- -- 16.0 282 4 0.38 -- 16.6 -- -- -- --57 3 -0.92 -- 15.4 -- -- -- -- 287 0 -2.16 14.3 -- -- -- -- --64 4 -0.49 15.8 -- -- -- -- -- 292 4 0.27 16.5 -- -- -- -- --70 3 0.81 -- 17.0 -- -- -- -- 302 0 2.14 -- -- -- -- 18.2 --76 3 -0.67 15.6 -- -- -- -- -- 304 4 0.49 -- 16.7 -- -- -- --81 2 -1.03 -- 15.3 -- -- -- -- 307 4 0.27 16.5 -- -- -- -- --85 4 0.05 16.3 -- -- -- -- -- 309 0 -11.99 -- 5.1 -- -- -- --86 4 0.16 -- 16.4 -- -- -- --87 4 0.38 16.6 -- -- -- -- --89 0 -2.75 -- -- -- -- -- 13.793 3 -0.92 -- 15.4 -- -- -- --97 4 -0.27 16.0 -- -- -- -- --
102 0 37.15 -- 50.7 -- -- -- --109 4 -0.31 16.0 -- -- -- -- --113 3 0.67 -- 16.9 -- -- -- --121 3 -0.70 -- 15.6 -- -- -- --127 4 -0.16 -- 16.1 -- -- -- --131 2 -1.35 -- 15.0 -- -- -- --134 3 0.54 16.8 -- -- -- -- --138 4 0.05 -- 16.3 -- -- -- --140 4 0.16 16.4 -- -- -- -- --141 1 1.78 -- 17.9 -- -- -- --142 3 0.70 -- 16.9 -- -- -- --145 4 0.27 -- 16.5 -- -- -- --146 2 -1.13 -- 15.2 -- -- -- --151 4 0.16 16.4 -- -- -- -- --154 3 -0.81 -- 15.5 -- -- -- --180 3 0.59 -- 16.8 -- -- -- --185 3 0.71 -- -- -- -- -- 16.9190 4 -0.05 -- -- -- -- 16.2 --191 3 0.81 -- -- -- 17.0 -- --193 4 0.27 -- 16.5 -- -- -- --203 2 -1.40 -- 15.0 -- -- -- --
13.514.014.515.015.516.016.517.017.518.018.519.0
ANALYTICAL METHOD CODE
CO
NC
EN
TRA
TIO
N
1 4 5 6 7 12
73

Table 12. Statistical summary of reported data for standard reference water sample M-152 (major constituents)--ContinuedAnalyte : total P as P (total Phosphorus as Phosphorus) Concentration Unit : mg/L
N = 1 4 3 1 47 0
Hu =
Hl =
F-sig = 0.00 0.00 0.00 0.00 0.00 0.00
SUMMARY
N = 1 4 3 1 47 0. Other MPV = 0.386Minimum = 0.360 0.316 0.260 0.374 0.050 4. ICP F-pseudosigma = 0.024
Maximum = 0.410 0.530 0.453 7. Ion chromatography N = 56Median = 0.387 20. Titrate: colorimetric Uh = 0.401
F-pseudosigma = 0.022 22m. Color:phosphomolybdate Lh = 0.369
Lab Rating Z-value 0 4 7 20 22m Lab Rating Z-value 0 4 7 20 22m3 4 -0.32 -- -- -- -- 0.378 275 0 -14.14 -- -- -- -- 0.050
11 4 0.19 -- -- -- -- 0.390 277 0 -4.45 -- -- 0.280 -- --12 2 1.45 -- -- -- -- 0.420 282 3 0.82 -- -- -- -- 0.40513 3 -0.82 -- -- -- -- 0.366 292 3 0.61 -- -- -- -- 0.40023 1 -1.58 -- -- -- -- 0.348 305 4 0.02 -- -- -- -- 0.38625 4 0.19 -- -- -- -- 0.390 307 2 1.03 -- -- -- -- 0.41038 4 -0.19 -- -- -- -- 0.38139 3 -0.65 -- -- -- -- 0.37042 0 -2.93 -- 0.316 -- -- --46 2 1.29 -- -- -- -- 0.41651 4 -0.02 -- -- -- -- 0.38557 2 1.03 -- -- -- -- 0.41064 3 0.61 -- -- -- -- 0.40070 0 -3.60 -- -- -- -- 0.30081 4 0.23 -- -- -- -- 0.39185 3 0.99 -- -- -- -- 0.40986 4 0.11 -- 0.388 -- -- --87 4 0.32 -- -- -- -- 0.39389 4 0.06 -- -- -- -- 0.38793 1 1.88 -- -- -- -- 0.43097 4 -0.23 -- -- -- -- 0.380
102 3 -0.61 -- -- -- -- 0.371113 4 -0.40 -- -- -- -- 0.376114 3 -0.65 -- -- -- -- 0.370127 4 0.36 -- -- -- -- 0.394131 0 6.09 -- -- 0.530 -- --134 4 0.19 -- -- -- -- 0.390138 3 0.65 -- -- -- -- 0.401140 0 -5.29 -- -- -- -- 0.260142 0 -8.96 -- -- -- -- 0.173143 4 -0.44 -- -- -- -- 0.375145 4 0.19 -- -- -- -- 0.390154 0 2.72 -- -- -- -- 0.450183 3 -0.61 -- -- -- -- 0.371185 4 -0.15 -- -- -- -- 0.382190 3 -0.78 -- -- -- -- 0.367191 2 -1.07 0.360 -- -- -- --203 4 -0.48 -- -- -- 0.374 --212 0 -3.52 -- -- -- -- 0.302213 4 0.19 -- -- -- -- 0.390215 2 1.45 -- -- -- -- 0.420227 4 -0.40 -- 0.376 -- -- --234 4 -0.23 -- -- -- -- 0.380236 2 1.03 -- 0.410 -- -- --243 0 -2.76 -- -- -- -- 0.320247 0 -2.47 -- -- -- -- 0.327253 0 2.85 -- -- -- -- 0.453255 2 1.29 -- -- -- -- 0.416273 0 -5.29 -- -- 0.260 -- --274 4 0.19 -- -- -- -- 0.390
0.3100.3300.3500.3700.3900.4100.4300.450
ANALYTICAL METHOD CODE
CO
NC
EN
TRA
TIO
N
0 4 20 22m
74

Table 12. Statistical summary of reported data for standard reference water sample M-152 (major constituents)--ContinuedAnalyte : pH
SUMMARY
N = 79 41. Direct reading MPV = 6.60Minimum = 5.31 F-pseudosigma = 0.22
Maximum = 7.74 Rating Criterion = 0.33Median = 6.60 N = 79
F-pseudosigma = 0.22 Uh = 6.75Lh = 6.45
Lab Rating Z-value 41 Lab Rating Z-value 411 4 0.33 6.71 209 4 0.30 6.703 4 0.27 6.69 212 4 0.33 6.71
10 4 0.21 6.67 213 4 -0.27 6.5111 3 0.97 6.92 215 4 0.00 6.6012 3 -0.76 6.35 227 4 -0.12 6.5613 3 0.70 6.83 234 4 -0.48 6.4423 4 0.12 6.64 236 2 -1.12 6.2324 4 0.00 6.60 241 4 -0.30 6.5025 3 0.61 6.80 243 4 0.42 6.7426 2 1.30 7.03 244 3 0.52 6.7733 4 0.36 6.72 247 4 0.48 6.7638 4 0.30 6.70 253 3 0.64 6.8139 4 -0.03 6.59 259 4 -0.30 6.5042 3 -0.70 6.37 265 2 1.21 7.0043 3 -0.79 6.34 268 4 -0.42 6.4645 4 -0.09 6.57 273 1 1.52 7.1046 0 2.52 7.43 274 0 -2.73 5.7048 3 -0.61 6.40 275 1 -1.82 6.0050 3 -0.91 6.30 277 3 -0.88 6.3151 4 -0.06 6.58 279 2 -1.09 6.2457 4 0.30 6.70 282 4 -0.39 6.4764 3 0.61 6.80 287 4 0.48 6.7670 1 -1.88 5.98 292 4 0.45 6.7581 4 -0.06 6.58 302 4 0.48 6.7685 3 0.61 6.80 305 3 0.67 6.8286 4 0.06 6.62 307 4 -0.12 6.5687 1 -1.79 6.01 308 4 -0.27 6.5189 0 -3.09 5.58 309 0 3.45 7.7493 4 0.24 6.68 312 4 -0.27 6.5196 4 0.45 6.7597 4 0.42 6.74
109 1 -1.82 6.00113 4 -0.18 6.54114 3 -0.58 6.41127 4 0.00 6.60134 4 0.12 6.64138 3 0.61 6.80140 0 -3.91 5.31141 1 -1.94 5.96142 2 -1.27 6.18143 4 -0.06 6.58145 4 0.45 6.75146 4 0.36 6.72151 4 0.15 6.65154 4 0.06 6.62180 4 0.00 6.60183 3 0.97 6.92185 4 -0.24 6.52190 3 -0.52 6.43203 4 -0.15 6.55
5.95
6.206.45
6.706.95
7.20
ANALYTICAL METHOD CODE
CO
NC
EN
TRA
TIO
N
41
75

Table 12. Statistical summary of reported data for standard reference water sample M-152 (major constituents)--ContinuedAnalyte: SiO2 (Silica) Concentration Unit : mg/L
SUMMARY
N = 1 27 1 3 14 7 0. Other MPV = 4.50Minimum = 8.00 2.17 4.56 4.22 4.11 4.20 4. ICP F-pseudosigma = 0.39
Maximum = 22.50 4.80 5.13 5.54 5. DCP N = 53Median = 4.37 4.74 4.66 6. ICP/MS Uh = 4.79
F-pseudosigma = 0.30 0.28 0.25 22. Colorimetric Lh = 4.2622mb. Color: molybdate blue
Lab Rating Z-value 0 4 5 6 22 22mb Lab Rating Z-value 0 4 5 6 22 22mb1 4 0.20 -- -- -- -- 4.58 -- 304 3 -0.51 -- 4.30 -- -- -- --3 3 -0.97 -- 4.12 -- -- -- -- 307 0 8.91 8.00 -- -- -- -- --
10 3 0.94 -- -- -- -- 4.87 -- 312 0 2.65 -- -- -- -- -- 5.5411 4 0.08 -- 4.53 -- -- -- --13 0 45.82 -- 22.50 -- -- -- --24 4 0.46 -- 4.68 -- -- -- --26 4 -0.25 -- 4.40 -- -- -- --32 3 0.76 -- -- -- 4.80 -- --33 4 0.15 -- -- 4.56 -- -- --38 4 0.18 -- -- -- -- 4.57 --39 2 -1.04 -- 4.09 -- -- -- --42 2 -1.04 -- 4.09 -- -- -- --50 4 -0.23 -- 4.41 -- -- -- --57 3 -0.51 -- 4.30 -- -- -- --59 3 0.76 -- -- -- -- 4.80 --64 3 -0.89 -- 4.15 -- -- -- --70 4 0.43 -- -- -- -- 4.67 --81 3 0.74 -- -- -- -- -- 4.7985 3 0.76 -- -- -- -- 4.80 --89 3 -0.76 -- -- -- -- -- 4.2097 4 -0.13 -- -- -- -- 4.45 --
102 3 0.87 -- -- -- -- 4.84 --107 4 -0.23 -- -- -- -- 4.41 --113 4 -0.31 -- -- -- -- -- 4.38121 4 -0.03 -- 4.49 -- -- -- --127 4 -0.18 -- 4.43 -- -- -- --131 2 -1.02 -- 4.10 -- -- -- --134 4 -0.33 -- 4.37 -- -- -- --138 4 0.41 -- -- -- -- -- 4.66140 2 1.09 -- -- -- -- 4.93 --142 1 -1.63 -- 3.86 -- -- -- --145 3 -0.61 -- 4.26 -- -- -- --151 4 -0.03 -- -- -- -- 4.49 --154 3 -0.76 -- 4.20 -- -- -- --190 3 0.92 -- -- -- -- -- 4.86191 3 -0.71 -- -- -- 4.22 -- --193 2 1.04 -- -- -- -- 4.91 --203 1 1.60 -- -- -- -- 5.13 --212 4 0.41 -- 4.66 -- -- -- --219 2 -1.27 -- 4.00 -- -- -- --234 4 0.13 -- 4.55 -- -- -- --236 0 -5.60 -- 2.30 -- -- -- --241 4 0.03 -- -- -- 4.51 -- --247 4 0.25 -- -- -- -- -- 4.60254 4 0.23 -- 4.59 -- -- -- --259 4 -0.05 -- 4.48 -- -- -- --265 4 0.00 -- 4.50 -- -- -- --273 0 5.93 -- 6.83 -- -- -- --274 3 -0.99 -- -- -- -- 4.11 --282 0 -5.93 -- 2.17 -- -- -- --
3.30
3.80
4.30
4.80
5.30
ANALYTICAL METHOD CODE
CO
NC
EN
TRA
TIO
N
4 5 6 22 22mb
76

Table 12. Statistical summary of reported data for standard reference water sample M-152 (major constituents)--ContinuedSO4 (Sulfate) Concentration Unit : mg/L
SUMMARY
N = 3 1 47 8 1 10 4. ICP MPV = 3.76Minimum = 1.83 4.77 1.64 2.06 3.29 0.32 6. ICP/MS F-pseudosigma = 0.33
Maximum = 4.00 8.54 4.58 3.29 6.00 7. Ion chromatography N = 69Median = 3.78 3.19 4.15 22. Colorimetric Uh = 3.93
F-pseudosigma = 0.13 0.00 1.18 50. Gravimetric Lh = 3.4851. Turbidimetric
Lab Rating Z-value 4 6 7 22 50 51 Lab Rating Z-value 4 6 7 22 50 511 4 -0.15 -- -- 3.71 -- -- -- 208 3 0.72 -- -- 4.00 -- -- --3 NR -- -- -- -- < 10 -- -- 209 4 -0.21 -- -- 3.69 -- -- --
10 2 1.02 -- -- -- -- -- 4.10 212 3 0.60 -- -- 3.96 -- -- --11 3 0.72 4.00 -- -- -- -- -- 215 0 6.72 -- -- -- -- -- 6.0013 4 0.27 -- -- 3.85 -- -- -- 219 0 3.03 -- 4.77 -- -- -- --23 4 -0.12 -- -- 3.72 -- -- -- 227 4 0.24 -- -- 3.84 -- -- --24 0 2.46 -- -- -- 4.58 -- -- 234 3 0.87 -- -- 4.05 -- -- --25 0 3.72 -- -- 5.00 -- -- -- 241 4 -0.36 -- -- 3.64 -- -- --26 4 0.42 -- -- 3.90 -- -- -- 247 0 -2.25 -- -- 3.01 -- -- --33 4 0.06 -- -- 3.78 -- -- -- 253 0 -8.26 -- -- -- -- -- < 139 4 -0.48 -- -- 3.60 -- -- -- 254 4 0.12 -- -- 3.80 -- -- --42 2 1.32 -- -- 4.20 -- -- -- 255 2 -1.08 -- -- -- 3.40 -- --43 NR -- -- -- -- -- < 10 -- 259 4 0.12 -- -- 3.80 -- -- --45 2 1.35 -- -- 4.21 -- -- -- 265 4 -0.18 -- -- 3.70 -- -- --46 0 -5.10 -- -- -- 2.06 -- -- 268 4 0.03 -- -- 3.77 -- -- --48 0 -2.28 -- -- -- -- -- 3.00 273 0 14.33 -- -- 8.54 -- -- --50 0 -2.22 -- -- -- 3.02 -- -- 274 0 -10.31 -- -- -- -- -- 0.3251 3 0.51 -- -- 3.93 -- -- -- 275 1 -1.98 -- -- -- -- -- 3.1057 NR -- -- -- -- < 5 -- -- 277 4 0.15 -- -- 3.81 -- -- --64 4 0.18 -- -- 3.82 -- -- -- 279 4 -0.24 -- -- -- 3.68 -- --70 4 0.18 -- -- 3.82 -- -- -- 282 4 0.09 -- -- 3.79 -- -- --76 4 0.08 -- -- 3.79 -- -- -- 287 3 -0.90 -- -- 3.46 -- -- --81 0 -2.10 -- -- -- 3.06 -- -- 292 4 -0.18 -- -- 3.70 -- -- --85 4 -0.48 -- -- 3.60 -- -- -- 302 0 -6.36 -- -- 1.64 -- -- --86 4 -0.06 -- -- 3.74 -- -- -- 309 0 -5.79 1.83 -- -- -- --87 NR -- -- -- -- -- -- < 589 4 -0.09 -- -- 3.73 -- -- --93 4 0.12 -- -- 3.80 -- -- --96 2 1.32 -- -- -- -- -- 4.2097 0 -2.67 -- -- -- 2.87 -- --
102 3 -0.96 -- -- 3.44 -- -- --109 2 -1.41 -- -- -- -- 3.29 --114 0 5.79 -- -- -- -- -- 5.69127 4 -0.30 3.66 -- -- -- -- --131 2 1.08 -- -- 4.12 -- -- --134 3 -0.84 -- -- 3.48 -- -- --138 4 0.06 -- -- 3.78 -- -- --140 0 -8.27 -- -- -- -- -- 1.00141 4 -0.18 -- -- 3.70 -- -- --142 3 0.51 -- -- 3.93 -- -- --145 4 -0.21 -- -- 3.69 -- -- --146 NR -- -- -- -- -- -- < 5151 4 0.00 -- -- 3.76 -- -- --154 0 2.49 -- -- -- -- -- 4.59180 4 0.45 -- -- 3.91 -- -- --185 4 0.06 -- -- 3.78 -- -- --190 1 -1.68 -- -- 3.20 -- -- --191 4 -0.06 -- -- 3.74 -- -- --196 4 -0.06 -- -- 3.74 -- -- --203 2 -1.35 -- -- -- 3.31 -- --
2.753.003.253.503.754.004.254.504.75
ANALYTICAL METHOD CODE
CO
NC
EN
TRA
TIO
N
4 7 22 50 51
77

Table 12. Statistical summary of reported data for standard reference water sample M-152 (major constituents)--ContinuedAnalyte: Sp Cond (Specific Conductance) Concentration Unit : µS/cm
SUMMARY
N = 1 73 4. ICP MPV = 113Minimum = 110 70 41. Direct reading F-pseudosigma = 3
Maximum = 207 Rating Criterion = 6Median = 113 N = 74
F-pseudosigma = 3 Uh = 115Lh = 111
Lab Rating Z-value 4 41 Lab Rating Z-value 4 411 4 0.18 -- 114 193 3 0.71 -- 1173 4 0.00 -- 113 203 4 0.14 -- 114
10 4 0.00 -- 113 212 3 0.88 -- 11811 3 -0.57 110 -- 215 0 -2.69 -- 9812 4 0.18 -- 114 227 4 -0.35 -- 11113 4 0.35 -- 115 234 4 0.18 -- 11423 4 -0.28 -- 111 236 4 0.00 -- 11324 2 -1.24 -- 106 241 3 -0.53 -- 11025 2 1.24 -- 120 243 4 0.18 -- 11426 4 -0.18 -- 112 244 4 -0.18 -- 11233 4 0.35 -- 115 247 4 0.00 -- 11338 4 -0.16 -- 112 253 4 0.05 -- 11342 2 1.13 -- 119 259 4 0.18 -- 11443 4 0.00 -- 113 268 4 -0.18 -- 11245 4 0.18 -- 114 273 4 0.35 -- 11546 0 16.64 -- 207 274 4 0.16 -- 11448 3 -0.88 -- 108 275 0 2.12 -- 12550 4 0.00 -- 113 277 2 1.24 -- 12051 4 0.00 -- 113 279 3 -0.88 -- 10857 3 -0.53 -- 110 282 0 2.48 -- 12764 4 -0.18 -- 112 292 4 0.00 -- 11370 3 -0.71 -- 109 302 4 0.35 -- 11576 4 -0.07 -- 113 307 4 0.00 -- 11381 4 -0.18 -- 112 312 0 -2.34 -- 10085 3 -0.53 -- 11086 2 -1.06 -- 10787 0 -7.65 -- 7089 3 0.88 -- 11893 4 -0.44 -- 11196 3 0.53 -- 11697 3 0.71 -- 117
102 3 0.71 -- 117109 3 0.53 -- 116113 4 0.11 -- 114114 3 0.71 -- 117127 4 0.18 -- 114134 4 0.02 -- 113138 4 0.00 -- 113140 3 -0.53 -- 110141 0 -2.30 -- 100142 4 0.35 -- 115143 3 -0.88 -- 108145 4 -0.35 -- 111146 0 2.48 -- 127151 4 -0.18 -- 112154 4 0.18 -- 114180 3 -0.88 -- 108183 1 -1.77 -- 103185 0 3.29 -- 132190 3 0.53 -- 116
104106108110112114116118120122
ANALYTICAL METHOD CODE
CO
NC
EN
TRA
TIO
N
4 41
78

Table 12. Statistical summary of reported data for standard reference water sample M-152 (major constituents)--ContinuedAnalyte: Sr (Strontium) Concentration Unit : µg/L
SUMMARY
N = 26 1 6 4. ICP MPV = 18.3Minimum = 16.0 18.6 17.4 5. DCP F-pseudosigma = 0.9
Maximum = 22.0 19.7 6. ICP/MS N = 33Median = 18.2 Uh = 19.0
F-pseudosigma = 0.9 Lh = 17.8
Lab Rating Z-value 4 5 61 3 -0.52 -- -- 17.83 4 -0.40 17.9 -- --
11 3 0.83 19.0 -- --24 0 4.20 22.0 -- --32 3 0.72 -- -- 18.933 4 0.38 -- 18.6 --42 2 -1.30 17.1 -- --57 4 0.49 18.7 -- --70 0 3.75 21.6 -- --81 0 -2.54 16.0 -- --86 3 -0.52 17.8 -- --
102 0 2.52 20.5 -- --113 4 -0.18 18.1 -- --121 4 -0.29 18.0 -- --127 4 -0.07 18.2 -- --131 3 -0.85 17.5 -- --134 4 0.07 18.3 -- --138 3 -0.97 17.4 -- --141 0 2.63 20.6 -- --142 0 4.09 21.9 -- --145 3 0.83 19.0 -- --151 3 -0.97 -- -- 17.4154 4 -0.29 18.0 -- --191 4 -0.29 -- -- 18.0212 3 0.61 18.8 -- --219 1 1.62 -- -- 19.7234 4 -0.07 18.2 -- --236 4 -0.29 18.0 -- --247 2 -1.42 17.0 -- --254 2 1.34 19.5 -- --259 3 0.83 19.0 -- --265 4 0.27 -- -- 18.5304 3 -0.85 17.5 -- --
15.516.517.518.519.520.5
ANALYTICAL METHOD CODE
CO
NC
EN
TRA
TIO
N
4 5 6
79

Table 12. Statistical summary of reported data for standard reference water sample M-152 (major constituents)--ContinuedAnalyte: V (Vanadium) Concentration Unit : µg/L
SUMMARY
N = 3 28 6 3. AA: graphite furnace MPV = 30.0Minimum = 29.9 19.9 30.0 4. ICP F-pseudosigma = 1.9
Maximum = 38.7 63.8 31.7 6. ICP/MS N = 37Median = 29.8 Uh = 31.6
F-pseudosigma = 2.1 Lh = 29.0
Lab Rating Z-value 3 4 61 4 0.26 -- -- 30.53 3 -0.73 -- 28.6 --
11 3 -0.52 -- 29.0 --13 4 0.31 -- 30.6 --24 3 0.88 -- 31.7 --26 3 0.83 -- 31.6 --32 4 0.10 -- -- 30.239 0 -5.24 -- 19.9 --42 3 0.88 -- -- 31.746 4 0.00 -- 30.0 --48 4 0.00 -- -- 30.057 4 -0.47 -- 29.1 --70 NR -- -- < 50 --81 0 -2.08 -- 26.0 --86 3 0.78 -- 31.5 --89 2 1.09 32.1 -- --93 4 -0.47 -- 29.1 --97 0 4.51 38.7 -- --
102 3 0.88 -- 31.7 --121 0 3.11 -- 36.0 --127 4 -0.05 29.9 -- --134 4 -0.18 -- 29.7 --138 3 -0.52 -- 29.0 --141 4 0.31 -- 30.6 --142 4 0.00 -- -- 30.0145 0 2.59 -- 35.0 --146 3 -0.88 -- 28.3 --154 4 0.00 -- 30.0 --180 0 17.54 -- 63.8 --212 3 -0.57 -- 28.9 --215 0 -3.11 -- 24.0 --234 3 -0.99 -- 28.1 --236 1 -1.56 -- 27.0 --241 4 0.10 -- -- 30.2247 1 1.56 -- 33.0 --265 4 0.00 -- 30.0 --282 4 -0.42 -- 29.2 --304 4 0.00 -- 30.0 --
24.026.028.030.032.034.036.0
ANALYTICAL METHOD CODE
CO
NC
EN
TRA
TIO
N
3 4 6
80

Table 13. Statistical summary of reported data for standard reference sample N-63 (nutrient constituents)
Definition of analytical methods, abbreviations, and symbols
Analytical methods
0. Other/Not reported
4. ICP = inductively coupled plasma
5. DCP = direct coupled plasma
7. IC = ion chromatography
20. Titrate: color = titration: colorimetric (color reagent specified)
21. Titrate: electro = titration: electrometric
22. Color = colorimetric (color reagent specified)
40. Ion electrode = ion selective electrode
Abbreviations and figure symbols
N = number of analyses--(excluding less than values)
MPV = most probable value
F-pseudosigma = nonparametric statistic deviation
Uh = upper hinge value
Lh = lower hinge value
Uwl = upper warning limit
Lwl = lower warning limit
Ucl = upper warning limit
Lcl = lower warning limit
mg/L = milligrams per liter
Lab = laboratory code number
NR = not rated, less than value reported or insufficient data
< = less than
-- = not reported
Constituent pageNH3 as N Ammonia as nitrogen 82NH3+Org N as N Ammonia plus organic nitrogen as nitrogen 83NO3 as N Nitrate as nitrogen 84
Total P as P Total Phosphorus as phosphorus 85PO4 as P Orthophosphate as phosphorus 86
81

Table 13. Statistical summary of reported data for standard reference water sample N-63 (nutrient constituents)--ContinuedAnalyte : NH3 as N (Ammonia as nitrogen) Concentration Unit : mg/L
SUMMARY
N = 3 1 12 2 51 11 0. Other MPV = 0.150Minimum = 0.060 0.248 0.130 0.141 0.073 0.100 7. Ion chromatography F-pseudosigma = 0.021
Maximum = 1.227 0.430 0.144 0.262 0.340 22. Colorimetric N = 80Median = 0.155 0.149 0.140 22n. Color: Nesslerization Uh = 0.160
F-pseudosigma = 0.091 0.020 0.024 22p. Color: phenate Lh = 0.13240. Ion selective electrode
Lab Rating Z-value 0 7 22 22n 22p 40 Lab Rating Z-value 0 7 22 22n 22p 401 4 -0.05 -- -- -- -- 0.149 -- 193 0 -2.36 -- -- -- -- 0.101 --
10 4 -0.48 -- -- -- -- -- 0.140 198 4 -0.24 -- -- -- -- 0.145 --11 0 13.49 -- -- 0.430 -- -- -- 205 2 -1.25 -- -- -- -- 0.124 --13 2 -1.30 -- -- -- -- 0.123 -- 209 3 0.63 -- -- -- -- -- 0.16318 0 5.40 -- -- -- -- 0.262 -- 212 4 0.00 -- -- 0.150 -- -- --21 4 0.05 -- -- -- -- 0.151 -- 213 NR < 1 -- -- -- -- --23 4 0.10 -- -- -- -- 0.152 -- 215 2 -1.45 -- -- -- -- 0.120 --25 3 -0.96 -- -- 0.130 -- -- -- 224 2 1.49 -- -- -- -- 0.181 --33 4 0.00 -- -- -- -- 0.150 -- 227 4 -0.43 -- -- -- 0.141 -- --36 0 51.89 1.227 -- -- -- -- -- 234 4 0.10 -- -- -- -- -- 0.15238 4 0.00 -- -- -- -- 0.150 -- 241 3 -0.84 -- -- -- -- -- 0.13346 2 -1.06 -- -- -- -- 0.128 -- 243 0 2.31 -- -- -- -- 0.198 --48 0 12.04 -- -- 0.400 -- -- -- 247 0 -3.71 -- -- -- -- 0.073 --50 4 -0.34 -- -- 0.143 -- -- -- 253 4 0.05 -- -- 0.151 -- -- --51 4 0.48 -- -- -- -- -- 0.160 255 4 -0.24 -- -- -- -- 0.145 --59 1 -1.93 -- -- -- -- 0.110 -- 282 0 11.08 -- -- 0.380 -- -- --64 4 0.00 -- -- -- -- 0.150 -- 285 0 23.99 0.648 -- -- -- -- --70 0 -2.17 -- -- -- -- 0.105 -- 287 0 4.72 0.248 -- -- -- --76 4 -0.07 -- -- -- -- 0.149 -- 292 0 -2.41 -- -- -- -- -- 0.10081 2 1.11 -- -- -- -- 0.173 -- 301 4 -0.29 -- -- -- -- 0.144 --83 3 -0.96 -- -- -- -- 0.130 -- 306 3 0.72 -- -- -- -- -- 0.16585 4 0.10 -- -- -- -- 0.152 -- 307 2 -1.11 -- -- -- -- -- 0.12786 1 1.78 -- -- -- -- 0.187 -- 308 NR -- -- < 0.15 -- -- --89 4 -0.29 -- -- -- -- 0.144 -- 312 3 -0.77 -- -- -- -- 0.134 --90 4 0.29 -- -- -- -- 0.156 -- 313 3 0.63 -- -- -- -- 0.163 --93 3 -0.96 -- -- -- -- 0.130 -- 314 3 0.72 -- -- -- -- 0.165 --96 3 -0.87 -- -- -- -- 0.132 -- 316 4 0.18 -- -- 0.154 -- -- --97 4 0.00 -- -- 0.150 -- -- -- 317 4 0.34 -- -- -- -- 0.157 --
102 3 0.96 -- -- -- -- 0.170 -- 318 4 0.29 -- -- -- -- 0.156 --105 4 -0.48 -- -- -- -- 0.140 -- 319 0 -4.34 0.060 -- -- -- -- --110 3 0.72 -- -- 0.165 -- -- -- 320 2 -1.45 -- -- -- -- 0.120 --113 4 -0.24 -- -- -- -- 0.145 -- 321 4 0.00 -- -- -- -- 0.150 --114 2 -1.45 -- -- -- -- -- 0.120127 3 -0.82 -- -- -- -- 0.133 --129 4 -0.29 -- -- -- 0.144 -- --134 4 -0.10 -- -- -- -- 0.148 --138 4 0.10 -- -- -- -- 0.152 --140 4 0.48 -- -- 0.160 -- -- --142 4 0.29 -- -- 0.156 -- -- --143 3 0.96 -- -- -- -- 0.170 --145 4 0.48 -- -- -- -- 0.160 --146 0 -2.41 -- -- -- -- 0.100 --151 4 -0.48 -- -- -- -- -- 0.140154 4 -0.05 -- -- -- -- 0.149 --155 2 -1.01 -- -- -- -- 0.129 --158 4 0.34 -- -- -- -- 0.157 --180 4 0.10 -- -- -- -- 0.152 --183 0 9.15 -- -- -- -- -- 0.340185 2 -1.01 -- -- -- -- 0.129 --190 2 1.01 -- -- -- -- 0.171 --
0.085
0.135
0.185
ANALYTICAL METHOD CODE
CO
NC
EN
TRA
TIO
N
22 22n 22p 40
82

Table 13. Statistical summary of reported data for standard reference water sample N-63 (nutrient constituents)--ContinuedAnalyte : NH3 + Organic N as N (Ammonia + organic nitrogen as nitrogen) Concentration Unit : mg/L
SUMMARY
N = 3 2 15 2 24 2 0. Other MPV = 0.200Minimum = 0.157 0.192 0.120 0.170 0.131 0.160 20. Titrate: colorimetric F-pseudosigma = 0.066
Maximum = 0.698 0.230 0.530 0.187 0.700 0.190 22. Colorimetric N = 48Median = 0.230 0.200 22n. Color: Nesslerization Uh = 0.267
F-pseudosigma = 0.164 0.053 22p. Color: phenate Lh = 0.17840. Ion selective electrode
Lab Rating Z-value 0 20 22 22n 22p 40 Lab Rating Z-value 0 20 22 22n 22p 401 4 -0.18 -- -- -- -- 0.188 -- 319 4 0.45 -- 0.230 -- -- -- --
10 4 -0.15 -- -- -- -- -- 0.190 320 4 0.21 -- -- 0.214 -- -- --11 1 1.52 -- -- 0.300 -- -- --18 2 1.02 -- -- -- -- 0.267 --21 3 -0.55 -- -- -- -- 0.164 --23 0 7.58 -- -- -- -- 0.700 --36 3 0.91 0.260 -- -- -- -- --38 4 -0.45 -- -- -- 0.170 -- --46 3 0.91 -- -- 0.260 -- -- --48 0 5.00 -- -- 0.530 -- -- --50 4 0.45 -- -- 0.230 -- -- --51 3 -0.61 -- -- -- -- -- 0.16059 4 0.00 -- -- -- -- 0.200 --70 0 3.79 -- -- -- -- 0.450 --81 2 -1.05 -- -- -- -- 0.131 --89 3 0.61 -- -- -- -- 0.240 --90 4 -0.29 -- -- 0.181 -- -- --96 3 -0.52 -- -- -- -- 0.166 --97 2 -1.21 -- -- 0.120 -- -- --
102 4 0.00 -- -- -- -- 0.200 --105 NR -- -- <1 -- -- --113 NR -- -- -- -- <0.5 --127 4 -0.33 -- -- -- -- 0.178 --129 4 -0.20 -- -- -- 0.187 -- --134 3 -0.99 -- -- -- -- 0.135 --138 4 0.39 -- -- -- -- 0.226 --140 4 -0.15 -- -- 0.190 -- -- --142 3 -0.67 -- -- 0.156 -- -- --143 4 0.00 -- -- -- -- 0.200 --145 4 0.00 -- -- -- -- 0.200 --146 4 0.45 -- -- -- -- 0.230 --154 1 1.64 -- -- -- -- 0.308 --155 4 0.15 -- -- -- -- 0.210 --158 3 -0.67 -- -- -- -- 0.156 --180 4 0.39 -- -- -- -- 0.226 --193 NR -- -- < 0.2 -- -- --209 3 -0.65 0.157 -- -- -- -- --212 0 3.70 -- -- 0.444 -- -- --213 NR -- < 1 -- -- -- --224 0 3.93 -- -- -- -- 0.459 --227 4 -0.49 -- -- 0.168 -- -- --247 4 -0.20 -- -- -- -- 0.187 --282 0 2.58 -- -- 0.370 -- -- --285 0 7.55 0.698 -- -- -- -- --306 4 -0.13 -- 0.192 -- -- -- --308 0 4.85 -- -- 0.520 -- -- --313 2 1.18 -- -- -- -- 0.278 --314 0 4.35 -- -- 0.487 -- -- --316 4 -0.01 -- -- 0.199 -- -- --318 4 0.00 -- -- -- -- 0.200 --
0.000
0.100
0.200
0.300
0.400
ANALYTICAL METHOD CODE
CO
NC
EN
TRA
TIO
N
0 20 22 22n 22p 40
83

Table 13. Statistical summary of reported data for standard reference water sample N-63 (nutrient constituents)--ContinuedAnalyte : NO3 as N (Nitrate as nitrogen) Concentration Unit : mg/L
SUMMARY
N = 4 27 9 32 4 3 0. Other MPV = 0.084Minimum = 0.07 0.00 0.07 0.02 0.08 0.05 7. Ion chromatography F-pseudosigma = 0.008
Maximum = 0.68 0.25 0.15 0.13 0.16 0.08 22. Colorimetric N = 79Median = 0.081 0.082 0.086 22cd. Cd diazotization Uh = 0.091
F-pseudosigma = 0.008 0.016 0.007 22h. Color: hydrazine diazotization Lh = 0.08022sulf. Color: Sulfanilamide
Lab Rating Z-value 0 7 22 22cd 22h 22sulf Lab Rating Z-value 0 7 22 22cd 22h 22sulf1 4 0.03 -- -- -- -- -- 0.084 185 4 -0.10 -- 0.083 -- -- -- --
10 4 -0.49 -- -- -- 0.080 -- -- 193 4 -0.49 -- 0.080 -- -- -- --11 4 -0.49 -- -- -- -- -- 0.080 198 4 0.03 -- -- -- 0.084 -- --12 3 0.80 -- -- -- 0.090 -- -- 205 0 5.68 -- -- -- 0.128 -- --13 1 -1.52 -- 0.072 -- -- -- -- 209 3 0.54 -- 0.088 -- -- -- --18 3 -0.87 -- -- -- 0.077 -- -- 212 0 20.07 -- 0.240 -- -- -- --21 4 0.15 -- -- -- -- 0.085 -- 215 1 -1.77 -- -- -- 0.070 -- --23 4 0.15 -- 0.085 -- -- -- -- 224 3 0.54 -- 0.088 -- -- -- --25 4 -0.49 -- 0.080 -- -- -- -- 227 4 -0.36 -- 0.081 -- -- -- --33 1 -1.77 -- 0.070 -- -- -- -- 234 4 -0.49 -- 0.080 -- -- -- --36 4 0.28 0.086 -- -- -- -- -- 241 3 -0.87 -- 0.077 -- -- -- --38 4 0.03 -- -- -- 0.084 -- -- 243 4 -0.49 -- -- -- 0.080 -- --42 0 2.98 -- 0.107 -- -- -- -- 247 3 -1.00 -- 0.076 -- -- -- --46 0 2.08 -- -- -- 0.100 -- -- 253 0 2.34 -- -- 0.102 -- -- --48 0 9.79 -- -- -- -- 0.160 -- 255 NR -- -- -- -- < 0.1 -- --50 4 -0.23 -- -- 0.082 -- -- -- 282 0 2.60 -- -- 0.104 -- -- --51 0 2.08 -- 0.100 -- -- -- -- 285 1 -1.90 0.069 -- -- -- -- --53 4 -0.49 0.080 -- -- -- -- -- 287 0 21.35 -- 0.250 -- -- -- --59 3 0.80 -- -- -- 0.090 -- -- 292 4 -0.49 -- 0.080 -- -- -- --64 4 -0.49 -- -- 0.080 -- -- -- 301 1 -2.03 -- 0.068 -- -- -- --69 4 -0.49 -- -- -- 0.080 -- -- 306 0 -2.65 -- -- -- 0.063 -- --70 3 0.80 -- -- -- 0.090 -- -- 307 2 1.18 -- -- -- 0.093 -- --76 2 -1.13 -- 0.075 -- -- -- -- 308 NR -- -- -- < 0.15 -- -- --81 2 1.05 -- -- -- -- 0.092 -- 313 4 -0.33 -- -- -- 0.081 -- --85 4 0.41 -- -- -- 0.087 -- -- 314 3 0.93 -- -- -- 0.091 -- --86 0 -8.58 -- -- -- 0.017 -- -- 316 4 -0.03 -- -- -- 0.084 -- --89 4 0.15 -- -- -- 0.085 -- -- 317 0 4.01 -- -- -- 0.115 -- --90 4 -0.49 -- -- -- -- 0.080 -- 318 4 -0.36 -- -- -- 0.081 -- --93 4 -0.49 -- 0.080 -- -- -- -- 319 0 2.08 -- -- -- 0.100 -- --96 3 0.67 -- -- -- 0.089 -- -- 320 4 -0.36 -- -- -- 0.081 -- --97 4 -0.49 -- -- 0.080 -- -- -- 321 3 -0.75 -- 0.078 -- -- -- --
102 0 -10.77 -- 0.000 -- -- -- --105 1 -1.77 -- -- 0.070 -- -- --113 4 -0.23 -- -- -- 0.082 -- --114 0 2.08 -- -- -- 0.100 -- --127 2 1.14 -- 0.093 -- -- -- --129 4 -0.36 -- 0.081 -- -- -- --134 3 0.80 -- -- -- 0.090 -- --138 4 0.28 -- 0.086 -- -- -- --140 3 -0.75 -- -- 0.078 -- -- --142 4 0.28 -- -- 0.086 -- -- --143 4 0.28 -- -- -- 0.086 -- --145 3 0.80 -- -- -- 0.090 -- --146 4 -0.23 -- -- -- 0.082 -- --151 2 1.18 -- 0.093 -- -- -- --154 0 -4.34 -- -- -- -- -- 0.050155 1 1.68 -- -- -- 0.097 -- --158 0 7.99 -- -- 0.146 -- -- --180 3 0.54 -- 0.088 -- -- -- --183 0 76.60 0.680 -- -- -- -- --
0.060
0.070
0.080
0.090
0.100
0.110
ANALYTICAL METHOD CODE
CO
MC
EN
TRA
TIO
N
0 7 22 22cd 22h 22sulf
84

Table 13. Statistical summary of reported data for standard reference water sample N-63 (nutrient constituents)--ContinuedAnalyte : total P as P (total Phosphorus as phosphorus) Concentration Unit : mg/L
SUMMARY
N = 2 2 1 64 0. Other MPV = 0.158Minimum = 0.14 0.16 0.08 0.10 4. ICP F-pseudosigma = 0.010
Maximum = 0.18 0.16 0.27 7. Ion chromatography N = 69Median = 0.16 22m. Color:phosphomolybdate Uh = 0.164
F-pseudosigma = 0.010 Lh = 0.150
Lab Rating Z-value 0 4 7 22m Lab Rating Z-value 0 4 7 22m1 4 0.00 -- -- -- 0.158 227 4 -0.19 -- 0.156 -- --
10 4 0.00 -- -- -- 0.158 234 3 -0.77 -- -- -- 0.15011 1 -1.73 -- -- -- 0.140 241 4 0.19 -- -- -- 0.16012 0 -2.70 -- -- -- 0.130 243 3 -0.77 -- -- -- 0.15013 4 0.39 -- -- -- 0.162 247 0 -2.99 -- -- -- 0.12718 4 -0.10 -- -- -- 0.157 253 0 8.77 -- -- -- 0.24921 4 -0.10 -- -- -- 0.157 255 4 0.00 -- -- -- 0.15823 0 10.89 -- -- -- 0.271 282 1 1.93 -- -- -- 0.17825 4 0.19 -- -- -- 0.160 285 2 -1.35 0.144 -- -- --36 0 2.12 0.180 -- -- -- 292 2 1.16 -- -- -- 0.17038 4 0.48 -- -- -- 0.163 301 3 0.67 -- -- -- 0.16546 4 0.00 -- -- -- 0.158 306 3 0.77 -- -- -- 0.16648 3 -0.77 -- -- -- 0.150 307 1 1.93 -- -- -- 0.17850 4 0.00 -- -- -- 0.158 308 NR -- -- -- -- < 0.1551 4 -0.48 -- -- -- 0.153 313 3 0.58 -- -- -- 0.16459 0 -5.59 -- -- -- 0.100 314 2 1.16 -- -- -- 0.17064 4 0.00 -- -- -- 0.158 316 3 0.74 -- -- -- 0.16670 0 4.53 -- -- -- 0.205 318 4 -0.29 -- -- -- 0.15581 1 -1.93 -- -- -- 0.138 319 0 2.12 -- -- -- 0.18085 3 0.96 -- -- -- 0.168 320 3 -0.96 -- -- -- 0.14886 4 0.10 -- 0.159 -- -- 321 4 0.00 -- -- -- 0.15889 4 0.29 -- -- -- 0.16193 3 -0.77 -- -- -- 0.15096 1 -1.54 -- -- -- 0.14297 NR -- -- -- -- < 0.18
102 2 -1.06 -- -- -- 0.147105 0 5.97 -- -- -- 0.220113 4 0.19 -- -- -- 0.160114 4 0.19 -- -- -- 0.160127 4 -0.29 -- -- -- 0.155129 4 0.39 -- -- -- 0.162134 4 0.00 -- -- -- 0.158138 4 0.00 -- -- -- 0.158140 0 -4.63 -- -- -- 0.110142 3 -0.96 -- -- -- 0.148143 4 -0.39 -- -- -- 0.154145 4 0.19 -- -- -- 0.160146 3 -0.77 -- -- -- 0.150154 3 0.58 -- -- -- 0.164155 4 0.30 -- -- -- 0.161158 1 -1.54 -- -- -- 0.142180 1 2.02 -- -- -- 0.179183 4 0.00 -- -- -- 0.158185 4 -0.10 -- -- -- 0.157193 4 0.10 -- -- -- 0.159198 1 -1.83 -- -- -- 0.139212 0 -2.22 -- -- -- 0.135213 4 0.19 -- -- -- 0.160215 0 5.97 -- -- -- 0.220224 3 -0.77 -- -- -- 0.150
0.1250.1350.1450.1550.1650.1750.185
ANALYTICAL METHOD CODE
CO
NC
EN
TRA
TIO
N
0 4 22m
85

Table 13. Statistical summary of reported data for standard reference water sample N-63 (nutrient constituents)--ContinuedAnalyte : PO4 as P (Orthophosphate as phosphorus) Concentration Unit : mg/L
SUMMARY
N = 4 10 59 0. Other MPV = 0.142Minimum = 0.120 0.078 0.074 7. Ion chromatography F-pseudosigma = 0.010
Maximum = 0.145 0.420 1.800 22m. Color:phosphomolybdate N = 73Median = 0.137 0.142 Uh = 0.148
F-pseudosigma = 0.017 0.006 Lh = 0.135
Lab Rating Z-value 0 7 22m Lab Rating Z-value 0 7 22m1 4 0.00 -- -- 0.142 213 2 -1.25 -- -- 0.130
10 4 0.31 -- -- 0.145 215 0 3.94 -- -- 0.18011 0 4.98 -- -- 0.190 224 4 0.21 -- -- 0.14412 3 -0.83 -- -- 0.134 227 2 -1.04 0.132 -- --13 1 1.66 -- 0.158 -- 234 2 1.04 -- 0.152 --18 4 0.10 -- -- 0.143 241 3 -0.52 -- 0.137 --21 4 -0.21 -- -- 0.140 247 3 -0.83 -- 0.134 --23 1 -1.56 -- -- 0.127 253 4 0.21 -- -- 0.14425 4 -0.42 -- -- 0.138 255 4 -0.21 -- -- 0.14033 3 0.83 -- 0.150 -- 282 0 3.53 -- -- 0.17636 0 -2.28 0.120 -- -- 287 0 4.98 -- 0.190 --38 4 -0.31 -- -- 0.139 292 3 -0.73 -- -- 0.13542 3 -0.83 -- 0.134 -- 301 4 -0.21 -- -- 0.14046 4 0.42 -- -- 0.146 307 3 0.62 -- -- 0.14848 0 -7.06 -- -- 0.074 308 NR -- -- < O.1550 3 -0.73 -- -- 0.135 312 4 0.10 -- -- 0.14351 4 0.21 -- -- 0.144 313 3 -0.62 -- -- 0.13653 4 -0.42 -- -- 0.138 314 0 2.49 -- -- 0.16659 4 -0.21 -- -- 0.140 316 4 -0.17 -- -- 0.14064 4 -0.10 -- -- 0.141 317 4 0.00 -- -- 0.14270 2 1.04 -- -- 0.152 318 4 0.31 0.145 -- --81 4 -0.42 -- -- 0.138 319 4 0.42 -- -- 0.14683 4 -0.21 -- -- 0.140 320 1 -1.56 -- -- 0.12785 4 0.10 -- -- 0.143 321 2 1.45 -- -- 0.15689 3 0.52 -- -- 0.14793 0 2.59 -- -- 0.16796 2 -1.35 -- -- 0.12997 1 1.87 -- -- 0.160
102 0 -2.70 -- 0.116 --105 2 1.04 -- -- 0.152113 4 0.42 -- -- 0.146127 2 -1.14 -- 0.131 --129 4 0.31 -- -- 0.145134 4 -0.31 -- -- 0.139138 4 -0.31 -- -- 0.139140 0 -3.32 -- -- 0.110142 2 -1.04 -- -- 0.132143 4 0.10 -- -- 0.143145 3 0.83 -- -- 0.150146 0 172.05 -- -- 1.800151 0 28.85 -- 0.420 --154 3 -0.52 -- -- 0.137155 4 0.22 -- -- 0.144158 4 0.00 -- -- 0.142180 3 0.93 -- -- 0.151183 4 0.21 0.144 -- --185 3 -0.73 -- -- 0.135190 4 -0.31 -- -- 0.139198 2 -1.04 -- -- 0.132212 2 1.25 -- -- 0.154
0.1100.1200.1300.1400.1500.1600.170
ANALYTICAL METHOD CODE
CO
NC
EN
TRA
TIO
N
0 7 22m
86

Table 14. Statistical summary of reported data for standard reference sample N-64 (nutrient constituents)
Definition of analytical methods, abbreviations, and symbols
Analytical methods
0. Other/Not reported
4. ICP = inductively coupled plasma
5. DCP = direct coupled plasma
7. IC = ion chromatography
20. Titrate: color = titration: colorimetric (color reagent specified)
21. Titrate: electro = titration: electrometric
22. Color = colorimetric (color reagent specified)
40. Ion electrode = ion selective electrode
Abbreviations and figure symbols
N = number of analyses--(excluding less than values)
MPV = most probable value
F-pseudosigma = nonparametric statistic deviation
Uh = upper hinge value
Lh = lower hinge value
Uwl = upper warning limit
Lwl = lower warning limit
Ucl = upper warning limit
Lcl = lower warning limit
mg/L = milligrams per liter
Lab = laboratory code number
NR = not rated, less than value reported or insufficient data
< = less than
-- = not reported
Constituent pageNH3 as N Ammonia as nitrogen 88NH3+Org N as N Ammonia plus organic nitrogen as nitrogen 89NO3 as N Nitrate as nitrogen 90
Total P as P Total Phosphorus as phosphorus 91PO4 as P Orthophosphate as phosphorus 92
87

Table 14. Statistical summary of reported data for standard reference water sample N-64 (nutrient constituents)--ContinuedAnalyte : NH3 as N (Ammonia as Nitrogen)Concentration Unit : mg/L
SUMMARY
N = 2 1 30 29 9 0. Other MPV = 1.38Minimum = 0.02 1.40 1.08 0.76 0.70 20. Titrate: colorimetric F-pseudosigma = 0.08
Maximum = 2.28 1.65 1.63 1.50 22. Colorimetric N = 70Median = 1.38 1.39 1.38 22p. Color: phenate Uh = 1.43
F-pseudosigma = 0.05 0.07 0.33 40. Ion selective electrode Lh = 1.32
Lab Rating Z-value 0 20 22 22p 40 Lab Rating Z-value 0 20 22 22p 401 3 0.57 -- -- -- 1.43 -- 212 3 0.69 -- -- 1.44 -- --3 2 -1.25 -- -- -- 1.28 -- 213 4 0.21 -- 1.40 -- -- --
10 4 -0.04 -- -- -- -- 1.38 215 4 -0.16 -- -- 1.37 -- --11 0 3.00 -- -- -- 1.63 -- 224 1 1.86 -- -- -- 1.54 --12 0 -3.43 -- -- -- 1.10 -- 227 2 1.30 -- -- 1.49 -- --13 3 -0.64 -- -- -- 1.33 -- 234 4 0.45 -- -- -- -- 1.4218 3 -0.76 -- -- -- 1.32 -- 243 2 1.01 -- -- -- 1.47 --23 4 -0.40 -- -- -- 1.35 -- 247 3 -0.89 -- -- -- 1.31 --25 3 -0.89 -- -- -- 1.31 -- 253 4 0.36 -- -- 1.41 -- --36 0 -16.60 0.02 -- -- -- -- 255 4 0.45 -- -- 1.42 -- --38 4 0.27 -- -- -- 1.41 -- 282 2 -1.01 -- -- 1.30 -- --46 3 -0.52 -- -- -- 1.34 -- 285 0 -8.33 -- -- -- -- 0.7059 4 0.08 -- -- -- 1.39 -- 287 0 10.88 2.28 -- -- -- --64 4 -0.28 -- -- -- 1.36 -- 292 0 -4.89 -- -- -- -- 0.9870 0 -7.57 -- -- -- 0.76 -- 306 0 -7.27 -- -- -- -- 0.7876 4 0.24 -- -- 1.40 -- -- 312 0 -4.28 -- -- -- 1.03 --83 4 -0.04 -- -- 1.38 -- -- 313 4 -0.04 -- -- 1.38 -- --85 4 0.33 -- -- 1.41 -- -- 316 4 0.50 -- -- 1.42 -- --87 4 0.45 -- -- 1.42 -- -- 319 4 -0.04 -- -- 1.38 -- --89 3 -0.52 -- -- -- 1.34 -- 320 4 -0.16 -- -- 1.37 -- --90 2 1.42 -- -- 1.50 -- --93 2 -1.01 -- -- -- 1.30 --96 3 -0.97 -- -- -- 1.30 --
102 1 -1.98 -- -- 1.22 -- --105 3 -0.52 -- -- 1.34 -- --107 4 0.25 -- -- -- 1.40 --113 4 0.00 -- -- 1.38 -- --114 2 -1.25 -- -- -- -- 1.28127 4 0.08 -- -- -- 1.39 --129 2 -1.24 -- -- 1.28 -- --134 1 1.54 -- -- 1.51 -- --138 4 -0.40 -- -- 1.35 -- --140 0 3.24 -- -- 1.65 -- --143 4 -0.40 -- -- 1.35 -- --145 3 0.81 -- -- -- 1.45 --146 4 0.21 -- -- -- 1.40 --151 2 1.42 -- -- -- -- 1.50154 4 -0.16 -- -- 1.37 -- --155 4 0.23 -- -- -- 1.40 --158 3 0.93 -- -- -- 1.46 --180 3 0.57 -- -- 1.43 -- --183 2 1.42 -- -- -- -- 1.50185 4 0.08 -- -- -- 1.39 --190 1 1.54 -- -- -- 1.51 --193 0 -3.68 -- -- 1.08 -- --198 4 -0.21 -- -- 1.37 -- --200 4 0.21 -- -- -- 1.40 --204 3 0.57 -- -- 1.43 -- --205 4 0.45 -- -- 1.42 -- --209 3 0.55 -- -- -- -- 1.43
1.15
1.25
1.35
1.45
1.55
1.65
ANALYTICAL METHOD CODE
CO
NC
EN
TRA
TIO
N
20 22 22p 40
88

Table 14. Statistical summary of reported data for standard reference water sample N-64 (nutrient constituents)--ContinuedAnalyte : NH3 + Organic N as N (Ammonia + organic nitrogen as nitrogen) Concentration Unit : mg/L
1.005 2
1.505 1
2.050 0
NR
SUMMARY
N = 2 3 31 10 1 0. Other MPV = 1.54Minimum = 1.43 0.89 1.21 1.30 0.72 20. Titrate: colorimetric F-pseudosigma = 0.13
Maximum = 1.60 2.30 2.66 1.65 22. Colorimetric N = 47Median = 1.54 1.54 22p. Color: phenate Uh = 1.65
F-pseudosigma = 0.14 0.10 40. Ion selective electrode Lh = 1.47
Lab Rating Z-value 0 20 22 22p 401 4 -0.23 -- -- 1.51 -- --3 4 -0.15 -- 1.52 -- -- --
10 4 -0.39 -- -- 1.49 -- --11 1 2.00 -- -- 1.80 -- --12 0 6.63 -- -- 2.40 -- --18 3 0.85 -- -- -- 1.65 --23 4 0.23 -- -- 1.57 -- --36 4 0.46 1.60 -- -- -- --38 3 -1.00 -- -- 1.41 -- --46 3 0.93 -- -- 1.66 -- --59 4 -0.31 -- -- 1.50 -- --70 0 2.78 -- -- 1.90 -- --87 3 0.77 -- -- 1.64 -- --89 4 -0.31 -- -- -- 1.50 --90 3 -0.62 -- -- 1.46 -- --96 4 -0.19 -- -- -- 1.52 --
102 4 -0.46 -- -- 1.48 -- --105 4 0.15 -- -- 1.56 -- --113 3 -0.81 -- -- 1.44 -- --127 3 0.77 -- -- -- 1.64 --129 0 4.23 -- -- 2.09 -- --134 1 -1.70 -- -- 1.32 -- --138 4 0.46 -- -- 1.60 -- --140 2 1.08 -- -- 1.68 -- --143 4 -0.39 -- -- 1.49 -- --145 3 0.85 -- -- -- 1.65 --146 4 0.46 -- -- -- 1.60 --154 4 0.00 -- -- 1.54 -- --155 4 0.20 -- -- -- 1.57 --158 1 -1.83 -- -- -- 1.30 --180 4 0.15 -- -- 1.56 -- --193 4 0.00 -- -- 1.54 -- --204 0 2.54 -- -- 1.87 -- --209 3 -0.89 1.43 -- -- --212 3 -0.77 -- -- 1.44 -- --213 0 5.86 -- 2.30 -- -- --215 4 -0.31 -- -- 1.50 -- --224 4 -0.27 -- -- -- 1.51 --227 0 6.27 -- -- 2.35 -- --247 3 -0.69 -- -- -- 1.45 --282 0 -2.54 -- -- 1.21 -- --285 0 -6.36 -- -- -- 0.72306 0 -5.00 -- 0.89 -- -- --313 4 0.15 -- -- 1.56 -- --316 4 -0.36 -- -- 1.49 -- --319 3 -0.62 -- -- 1.46 -- --320 0 8.63 -- -- 2.66 -- --
1.151.251.351.451.551.651.751.851.95
ANALYTICAL METHOD CODE
CO
NC
EN
TRA
TIO
N
0 20 22 22p
89

Table 14. Statistical summary of reported data for standard reference water sample N-64 (low ionic strength constituents)--ContinuedAnalyte : NO3 as N (Nitrate as nitrogen) Concentration Unit : mg/L
SUMMARY
N = 6 22 30 13 0. Other MPV = 1.26Minimum = 1.17 1.16 1.16 0.62 7. Ion chromatography F-pseudosigma = 0.04
Maximum = 1.27 1.65 1.38 1.36 22. Colorimetric Rating Criterion = 0.06Median = 1.27 1.26 1.29 22cd. Cd diazotization N = 71
F-pseudosigma = 0.05 0.02 0.06 Uh = 1.29Lh = 1.24
Lab Rating Z-value 0 7 22 22cd Lab Rating Z-value 0 7 22 22cd1 4 -0.16 -- -- 1.25 -- 208 2 0.79 -- 1.31 -- --3 2 0.79 -- -- -- 1.31 209 4 -0.24 -- 1.25 -- --
10 3 -0.32 -- -- 1.24 -- 212 0 -1.59 -- 1.16 -- --11 3 0.48 -- -- 1.29 -- 215 4 -0.16 -- -- 1.25 --12 3 -0.32 -- -- 1.24 -- 224 1 0.92 -- 1.32 -- --13 4 0.00 -- 1.26 -- -- 227 2 -0.60 -- 1.22 -- --18 3 -0.48 -- -- -- 1.23 234 1 0.95 -- 1.32 -- --23 4 0.00 -- -- 1.26 -- 243 4 0.16 -- -- -- 1.2725 3 -0.32 -- 1.24 -- -- 247 3 -0.32 -- 1.24 -- --26 0 6.19 -- 1.65 -- -- 253 0 1.94 -- -- 1.38 --36 3 -0.32 1.24 -- -- -- 255 4 0.16 -- -- 1.27 --38 4 0.02 -- -- 1.26 -- 282 4 0.16 -- -- 1.27 --42 3 0.41 -- 1.29 -- -- 285 0 -1.27 1.18 -- -- --46 4 0.00 -- -- 1.26 -- 287 0 -1.43 1.17 -- -- --53 3 -0.32 1.24 -- -- -- 291 4 0.16 1.27 -- -- --59 0 1.27 -- -- -- 1.34 292 2 0.63 -- 1.30 -- --64 2 -0.79 -- -- 1.21 -- 306 0 -10.10 -- -- -- 0.6269 3 -0.32 -- -- 1.24 -- 313 4 0.16 -- -- 1.27 --70 4 0.00 -- -- 1.26 -- 316 4 0.07 -- -- 1.26 --76 0 -1.60 -- 1.16 -- -- 319 3 -0.48 1.23 -- -- --85 1 0.95 -- -- 1.32 -- 320 3 0.32 -- -- 1.28 --87 4 0.00 -- -- 1.26 --89 3 0.48 -- -- -- 1.2990 4 -0.16 -- -- 1.25 --93 3 0.48 -- 1.29 -- --96 2 0.73 -- -- -- 1.31
102 2 -0.79 -- 1.21 -- --105 3 -0.32 -- -- 1.24 --107 3 0.41 -- -- -- 1.29113 4 0.10 -- -- 1.27 --114 0 1.59 -- -- -- 1.36127 3 -0.32 -- 1.24 -- --129 2 0.76 -- 1.31 -- --134 4 0.16 -- -- 1.27 --138 4 -0.16 -- 1.25 -- --140 1 -0.89 -- -- 1.20 --143 0 -1.59 -- -- 1.16 --145 4 -0.16 -- -- -- 1.25146 2 0.63 -- -- -- 1.30151 2 0.84 -- 1.31 -- --154 3 -0.32 -- -- 1.24 --155 0 -2.73 -- -- -- 1.09158 1 0.95 -- -- 1.32 --180 2 0.63 -- 1.30 -- --185 4 0.11 -- 1.27 -- --193 3 0.32 -- 1.28 -- --198 4 0.00 -- -- 1.26 --200 2 -0.63 -- -- -- 1.22204 2 0.79 -- -- 1.31 --205 4 0.03 -- -- 1.26 --
1.15
1.20
1.25
1.30
1.35
1.40
ANALYTICAL METHOD CODE
CO
NC
EN
TRA
TIO
N
0 7 22 22cd
90

Table 14. Statistical summary of reported data for standard reference water sample N-64 (nutrient constituents)--ContinuedAnalyte : total P as P (total Phosphorus as phosphorus)Concentration Unit : mg/L
SUMMARY
N = 1 1 59 0. Other MPV = 0.883Minimum = 1.610 0.858 0.770 4. ICP F-pseudosigma = 0.041
Maximum = 2.000 22m. Color:phosphomolybdate Rating Criterion = 0.044Median = 0.883 N = 61
F-pseudosigma = 0.042 Uh = 0.911Lh = 0.856
Lab Rating Z-value 0 4 22m Lab Rating Z-value 0 4 22m1 4 -0.48 -- -- 0.862 247 2 -1.38 -- -- 0.8223 4 0.02 -- -- 0.884 253 4 0.00 -- -- 0.883
10 4 -0.14 -- -- 0.877 255 3 0.84 -- -- 0.92011 4 0.39 -- -- 0.900 282 3 -0.93 -- -- 0.84212 0 -2.17 -- -- 0.787 285 0 2.36 -- -- 0.98713 4 0.14 -- -- 0.889 292 3 0.84 -- -- 0.92018 4 0.09 -- -- 0.887 306 3 0.63 -- -- 0.91123 3 -0.52 -- -- 0.860 313 4 0.36 -- -- 0.89925 1 -1.65 -- -- 0.810 316 3 0.67 -- -- 0.91336 0 16.47 1.610 -- -- 319 0 4.24 -- -- 1.07038 3 0.84 -- -- 0.920 320 0 25.30 -- -- 2.00046 4 0.25 -- -- 0.89459 1 -1.88 -- -- 0.80064 4 -0.18 -- -- 0.87570 4 0.05 -- -- 0.88585 2 1.45 -- -- 0.94787 0 2.38 -- -- 0.98889 4 0.14 -- -- 0.88993 4 -0.07 -- -- 0.88096 3 -0.72 -- -- 0.851
102 2 -1.18 -- -- 0.831105 0 5.37 -- -- 1.120107 3 -0.61 -- -- 0.856113 4 -0.27 -- -- 0.871114 3 -0.97 -- -- 0.840127 3 0.84 -- -- 0.920129 4 -0.14 -- -- 0.877134 3 0.63 -- -- 0.911138 4 0.07 -- -- 0.886140 0 -2.56 -- -- 0.770143 4 -0.14 -- -- 0.877145 3 0.61 -- -- 0.910146 3 -0.52 -- -- 0.860154 0 2.22 -- -- 0.981155 4 0.48 -- -- 0.904158 4 -0.11 -- -- 0.878180 4 0.00 -- -- 0.883183 2 -1.20 -- -- 0.830185 3 0.54 -- -- 0.907193 1 -1.81 -- -- 0.803198 4 -0.02 -- -- 0.882200 3 0.61 -- -- 0.910204 4 -0.27 -- -- 0.871212 1 -1.88 -- -- 0.800213 3 -0.75 -- -- 0.850215 3 0.84 -- -- 0.920224 4 -0.18 -- -- 0.875227 3 -0.57 -- 0.858 --234 2 -1.43 -- -- 0.820243 2 -1.20 -- -- 0.830
0.760
0.810
0.860
0.910
0.960
ANALYTICAL METHOD CODE
CO
NC
EN
TRA
TIO
N
4 22m
91

Table 14. Statistical summary of reported data for standard reference water sample N-64 (nutrient constituents)--ContinuedAnalyte : PO4 as P (Orthophosphate as phosphorus) Concentration Unit : mg/L
SUMMARY
N = 2 9 54 0. Other MPV = 0.860Minimum = 0.830 0.670 0.700 7. Ion chromatography F-pseudosigma = 0.034
Maximum = 0.840 2.720 1.230 22m. Color:phosphomolybdate Rating Criterion = 0.043Median = 0.846 0.864 N = 65
F-pseudosigma = 0.035 0.032 Uh = 0.891Lh = 0.845
Lab Rating Z-value 0 7 22m Lab Rating Z-value 0 7 22m1 3 0.72 -- -- 0.891 213 4 -0.23 -- -- 0.8503 3 -0.79 -- -- 0.826 215 2 1.40 -- -- 0.920
10 4 0.16 -- -- 0.867 224 3 0.84 -- -- 0.89611 3 0.93 -- -- 0.900 227 4 0.14 -- -- 0.86612 4 -0.47 -- -- 0.840 234 0 -4.42 -- 0.670 --13 2 -1.02 -- 0.816 -- 247 4 -0.33 -- 0.846 --18 4 0.21 -- -- 0.869 253 4 -0.12 -- -- 0.85523 4 -0.23 -- -- 0.850 255 4 -0.09 -- -- 0.85625 2 1.14 -- -- 0.909 282 3 -0.67 -- -- 0.83126 3 -0.70 -- 0.830 -- 287 3 -0.70 0.830 -- --36 4 -0.47 0.840 -- -- 292 4 -0.35 -- -- 0.84538 3 -0.56 -- -- 0.836 313 4 0.07 -- -- 0.86342 4 0.26 -- 0.871 -- 316 4 0.10 -- -- 0.86546 2 1.02 -- -- 0.904 319 0 3.26 -- -- 1.00053 4 -0.09 -- -- 0.856 320 4 0.37 -- -- 0.87659 4 -0.47 -- -- 0.84064 4 -0.33 -- -- 0.84670 3 0.95 -- -- 0.90176 2 -1.42 -- 0.799 --83 4 0.00 -- -- 0.86085 4 0.47 -- -- 0.88087 4 0.49 -- -- 0.88189 3 0.56 -- -- 0.88493 0 4.19 -- -- 1.04096 4 0.21 -- -- 0.869
102 0 -3.33 -- -- 0.717105 0 8.60 -- -- 1.230107 4 -0.28 -- -- 0.848113 4 -0.12 -- -- 0.855127 4 0.07 -- 0.863 --129 4 -0.12 -- -- 0.855134 4 -0.02 -- -- 0.859138 2 -1.05 -- -- 0.815140 4 -0.23 -- -- 0.850143 4 0.02 -- -- 0.861145 1 1.51 -- -- 0.925146 0 -3.72 -- -- 0.700151 0 43.26 -- 2.720 --154 3 0.72 -- -- 0.891155 4 0.00 -- -- 0.860158 3 0.77 -- -- 0.893180 3 0.65 -- -- 0.888183 3 -0.70 -- -- 0.830185 2 1.21 -- -- 0.912190 4 0.42 -- -- 0.878198 1 -1.81 -- -- 0.782200 4 -0.23 -- -- 0.850204 2 1.02 -- -- 0.904208 4 -0.23 -- 0.850 --212 2 1.02 -- -- 0.904
0.760
0.810
0.860
0.910
0.960
ANALYTICAL METHOD CODE
CO
NC
EN
TRA
TIO
N
0 7 22m
92

Table 15. Statistical summary of reported data for standard reference sample P-33 (low ionic strength constituents)
Definition of analytical methods, abbreviations, and symbols
Analytical methods
0. Other/Not reported
1. AA: direct, air = atomic absorption: direct, air
2. AA: direct, N2O = atomic absorption: direct, nitrous oxide
3. AA: graphite furnace = atomic absorption: graphite furnace
4. ICP = inductively coupled plasma
5. DCP = direct current plasma
6. ICP/MS = inductively coupled plasma / mass spectrometry
7. IC = ion chromatography
12. Flame emission = flame emission
20. Titrate: color = titration: colorimetric (color reagent specified)
21. Titrate: electro = titration: electrometric
22. Color: = colorimetric (color reagent specified)
40. Ion electrode = ion selective electrode
41. Electro = electrometric: (type meter specified)
50. Gravimetric = gravimetric: (precipitate specified)
51. Turbidimetric = turbidimetric: (precipitate specified)
Abbreviations and figure symbols
N = number of analyses--(excluding less than values)
MPV = most probable value
F-pseudosigma = nonparametric statistic deviation
Uh = upper hinge value
Lh = lower hinge value
Uwl = upper warning limit
Lwl = lower warning limit
Ucl = upper warning limit
Lcl = lower warning limit
mg/L = milligrams per literµS/cm = microsiemens per centimeter at 250 C
Lab = laboratory code number
NR = not rated, less than value reported or insufficient data
< = less than
-- = not reported
Constituent pageAcid Acidity as CaCO3 94
Ca Calcium 95
Cl Chloride 96
F Fluoride 97
K Potassium 98
Mg Magnesium 99
Na Sodium 100
pH 101PO4 as P Orthophosphate as Phosphorus 102SO4 Sulfate 103
Sp Cond Specific Conductance 104
93

Table 15. Statistical summary of reported data for standard reference water sample P-33 (low ionic strength constituents)--ContinuedAnalyte: Acidity (as CaCO3) Concentration Unit : mg/L
INSUFFICIENT DATA
SUMMARY
N = 2 12 20. Titrate: colorimetric MPV = Insufficient dataMinimum = 2.00 0.31 21. Titrate: electrometric N = 14
Maximum = 9.85 61.00Median = 3.03
F-pseudosigma = 6.00
Lab Rating Z-value 20 211 NR -- -- 2.503 NR -- -- < 10
25 NR -- -- 3.0038 NR -- -- 0.3181 NR -- -- 1.4089 NR -- -- 3.53
127 NR -- -- 4.10141 NR -- -- 61.00146 NR -- -- < 5.79215 NR -- 2.00 --228 NR -- -- 20.70237 NR -- -- 1.01273 NR -- -- 3.05274 NR -- -- 15.99282 NR -- 9.85 --287 NR -- -- 1.00
94

Table 15. Statistical summary of reported data for standard reference water sample P-33 (low ionic strength constituents)--ContinuedAnalyte: Ca (Calcium) Concentration Unit : mg/L
SUMMARY
N = 3 6 27 5 3 3 0. Other MPV = 0.322Minimum = 0.320 0.326 0.230 0.240 0.170 0.468 1. AA: direct, air F-pseudosigma = 0.043
Maximum = 0.346 0.403 0.400 0.800 0.292 1.980 4. ICP N = 47Median = 0.321 7. Ion chromatography Uh = 0.356
F-pseudosigma = 0.033 12. Flame emission Lh = 0.29720. Titrate: colorimetric
Lab Rating Z-value 0 1 4 7 12 201 4 -0.07 -- -- 0.319 -- -- --2 1 -1.84 -- -- -- 0.242 -- --3 3 0.74 -- -- 0.354 -- -- --
11 1 1.80 -- -- 0.400 -- -- --33 4 -0.28 -- -- -- 0.310 -- --38 4 -0.05 0.320 -- -- -- -- --42 4 -0.46 -- -- 0.302 -- -- --46 4 0.00 -- -- 0.322 -- -- --48 3 0.55 0.346 -- -- -- -- --64 1 1.57 -- 0.390 -- -- -- --81 4 -0.02 -- -- 0.321 -- -- --86 3 -0.95 -- -- 0.281 -- -- --89 0 -3.51 -- -- -- -- 0.170 --93 4 -0.28 -- -- 0.310 -- -- --
102 0 -2.12 -- -- 0.230 -- -- --113 3 0.92 -- -- 0.362 -- -- --127 4 0.35 -- -- 0.337 -- -- --134 4 -0.05 -- -- 0.320 -- -- --138 4 0.42 -- -- 0.340 -- -- --140 4 0.35 -- 0.337 -- -- -- --141 3 0.81 -- -- 0.357 -- -- --145 3 0.65 -- -- 0.350 -- -- --146 NR -- -- -- < 0.313 -- -- --155 0 3.36 -- -- -- -- -- 0.468180 3 0.83 -- -- 0.358 -- -- --185 4 0.09 -- 0.326 -- -- -- --190 0 11.02 -- -- -- 0.800 -- --191 4 -0.05 0.320 -- -- -- -- --193 3 -0.74 -- -- 0.290 -- -- --203 2 -1.43 -- -- 0.260 -- -- --209 1 -1.73 -- -- 0.247 -- -- --215 0 -2.12 -- -- 0.230 -- -- --227 4 0.00 -- -- 0.322 -- -- --228 1 -1.89 -- -- -- 0.240 -- --237 4 -0.05 -- -- 0.320 -- -- --238 4 -0.05 -- -- -- 0.320 -- --241 3 -0.69 -- -- -- -- 0.292 --247 4 0.30 -- -- 0.335 -- -- --255 4 0.28 -- -- 0.334 -- -- --265 4 0.42 -- -- 0.340 -- -- --268 1 1.80 -- 0.400 -- -- -- --273 3 -0.74 -- -- 0.290 -- -- --274 0 38.23 -- -- -- -- -- 1.980279 0 14.48 -- -- -- -- -- 0.950282 4 -0.28 -- -- 0.310 -- -- --287 1 1.87 -- 0.403 -- -- -- --301 3 -0.71 -- -- -- -- 0.291 --321 2 1.11 -- 0.370 -- -- -- --
0.1700.2200.2700.3200.3700.4200.470
ANALYTICAL METHOD CODE
CO
NC
EN
TRA
TIO
N
0 1 4 7 12
95

Table 15. Statistical summary of reported data for standard reference water sample P-33 (low ionic strength constituents)--ContinuedAnalyte: Cl (Chloride) Concentration Unit : mg/L
SUMMARY
N = 1 37 4 2 6 0. Other MPV = 2.38Minimum = 2.00 1.63 2.00 2.46 1.69 7. Ion chromatography F-pseudosigma = 0.18
Maximum = 4.77 19.68 2.60 5.04 20. Titrate: colorimetric N = 50Median = 2.38 21. Titrate: electrometric Uh = 2.46
F-pseudosigma = 0.13 22. Colorimetric Lh = 2.22
Lab Rating Z-value 0 7 20 21 221 3 0.73 -- 2.51 -- -- --2 0 -3.31 -- 1.79 -- -- --3 0 -3.88 -- -- -- -- 1.69
11 0 -2.14 -- -- 2.00 -- --25 4 0.11 -- 2.40 -- -- --33 4 0.06 -- 2.39 -- -- --42 4 -0.39 -- 2.31 -- -- --45 4 0.45 -- 2.46 -- -- --46 4 -0.17 -- -- -- -- 2.3548 0 -2.14 2.00 -- -- -- --59 4 0.00 -- 2.38 -- -- --64 4 0.28 -- 2.43 -- -- --81 4 0.45 -- -- -- 2.46 --86 3 -0.51 -- 2.29 -- -- --89 4 -0.11 -- 2.36 -- -- --93 4 0.00 -- 2.38 -- -- --
102 0 13.43 -- 4.77 -- -- --113 4 0.45 -- 2.46 -- -- --127 2 -1.12 -- 2.18 -- -- --134 4 -0.45 -- 2.30 -- -- --138 4 -0.11 -- 2.36 -- -- --140 3 -0.56 -- -- -- -- 2.28141 4 -0.45 -- 2.30 -- -- --143 2 1.18 -- -- -- -- 2.59145 4 0.00 -- 2.38 -- -- --146 2 -1.41 -- -- -- -- 2.13180 4 0.28 -- 2.43 -- -- --183 0 14.95 -- -- -- -- 5.04185 4 0.20 -- 2.42 -- -- --190 0 -3.20 -- 1.81 -- -- --191 4 -0.22 -- 2.34 -- -- --196 3 -0.96 -- 2.21 -- -- --203 2 1.24 -- -- -- 2.60 --208 2 1.24 -- 2.60 -- -- --209 4 -0.45 -- 2.30 -- -- --215 1 1.80 -- -- 2.70 -- --227 0 2.19 -- 2.77 -- -- --228 4 0.34 -- 2.44 -- -- --237 2 1.12 -- 2.58 -- -- --238 2 1.12 -- 2.58 -- -- --241 1 -1.69 -- 2.08 -- -- --247 3 -0.90 -- 2.22 -- -- --265 1 -1.57 -- 2.10 -- -- --268 4 0.06 -- 2.39 -- -- --273 3 -0.98 -- 2.21 -- -- --274 0 97.24 -- -- 19.68 -- --279 4 -0.45 -- -- 2.30 -- --282 0 -4.22 -- 1.63 -- -- --287 0 7.98 -- 3.80 -- -- --321 4 0.11 -- 2.40 -- -- --
1.851.952.052.152.252.352.452.552.652.752.85
ANALYTICAL METHOD CODE
CO
NC
EN
TRA
TIO
N
0 7 20 21 22
96

Table 15. Statistical summary of reported data for standard reference water sample P-33 (low ionic strength constituents)--ContinuedAnalyte: F (Fluoride) Concentration Unit : mg/L
SUMMARY
N = 18 1 14 7. Ion chromatography MPV = 0.105Minimum = 0.070 0.002 0.075 22. Colorimetric F-pseudosigma = 0.039
Maximum = 0.820 0.150 40. Ion selective electrode N = 33Median = 0.100 0.115 Uh = 0.137
F-pseudosigma = 0.027 0.028 Lh = 0.085
Lab Rating Z-value 7 22 401 NR -- -- -- < 0.12 4 0.18 0.112 -- --3 3 0.83 -- -- 0.137
11 3 -0.65 -- -- 0.08025 4 -0.39 0.090 -- --33 4 -0.13 0.100 -- --42 4 0.13 0.110 -- --45 3 -0.52 0.085 -- --46 3 -0.78 -- -- 0.07559 2 1.17 -- -- 0.15081 4 0.00 -- -- 0.10583 3 0.91 -- -- 0.14086 4 -0.13 0.100 -- --89 4 -0.13 -- -- 0.10093 3 -0.91 0.070 -- --
102 0 18.55 0.820 -- --113 4 0.23 -- -- 0.114127 4 -0.28 0.094 -- --134 4 0.26 -- -- 0.115138 NR -- -- -- < 0.10140 3 0.86 -- -- 0.138141 4 0.13 -- -- 0.110145 3 -0.91 0.070 -- --146 3 0.65 -- -- 0.130180 1 1.71 0.171 -- --183 3 0.91 -- -- 0.140190 4 -0.05 0.103 -- --191 3 -0.65 0.080 -- --196 3 -0.80 0.074 -- --241 4 -0.13 -- -- 0.100247 3 -0.65 0.080 -- --255 NR -- -- -- < 0.5265 NR -- < 0.1 -- --273 4 0.36 0.119 -- --274 0 -2.67 -- 0.002 --282 2 1.43 0.160 -- --287 0 3.50 0.240 -- --
0.000
0.050
0.100
0.150
0.200
ANALYTICAL METHOD CODE
CO
CN
CE
NTR
ATI
ON
7 22 40
97

Table 15. Statistical summary of reported data for standard reference water sample P-33 (low ionic strength constituents)--ContinuedAnalyte: K (Potassium) Concentration Unit : mg/L
N = 11 13 1 2 5 6 1. AA: direct, air MPV = 0.110Minimum = 0.060 0.040 0.100 0.080 0.040 0.100 4. ICP F-pseudosigma = 0.015
Maximum = 0.280 0.532 0.100 0.132 0.120 0.130 5. DCP N = 38Median = 0.109 0.110 6. ICP/MS Uh = 0.120
F-pseudosigma = 0.014 0.035 7. Ion chromatography Lh = 0.10012. Flame emission
Lab Rating Z-value 1 4 5 6 7 121 4 0.47 0.117 -- -- -- -- --2 4 0.13 -- -- -- -- 0.112 --3 0 28.46 -- 0.532 -- -- -- --
11 0 -4.00 -- < 0.05 -- -- -- --33 3 -0.67 -- -- 0.100 -- -- --38 3 0.67 0.120 -- -- -- --42 4 -0.20 -- 0.107 -- -- -- --45 0 11.47 0.280 -- -- -- --46 0 3.17 -- 0.157 -- -- -- --48 2 1.48 -- -- -- 0.132 -- --64 0 -3.37 0.060 -- -- -- -- --81 1 -1.89 -- 0.082 -- -- -- --89 3 -0.67 -- -- -- -- -- 0.10093 3 0.67 -- 0.120 -- -- -- --
102 0 -3.37 -- 0.060 -- -- -- --113 0 2.36 -- 0.145 -- -- -- --127 4 -0.27 0.106 -- -- -- --134 4 0.07 0.111 -- -- -- --138 4 0.00 -- 0.110 -- -- -- --140 2 -1.28 0.091 -- -- -- -- --141 0 4.52 -- 0.177 -- -- -- --145 0 -4.72 -- 0.040 -- -- -- --146 NR -- -- < 1 -- -- -- --180 NR -- -- < 1.63 -- -- -- --185 4 -0.07 0.109 -- -- -- -- --190 3 0.67 -- -- -- -- 0.120 --191 1 -2.02 -- -- -- 0.080 -- --193 3 -0.67 0.100 -- -- -- -- --203 3 0.67 -- -- -- -- -- 0.120209 3 -0.81 -- 0.098 -- -- -- --228 0 -4.72 -- -- -- -- 0.040 --237 4 0.00 -- -- -- -- 0.110 --238 4 0.00 -- -- -- -- 0.110 --241 2 1.21 -- -- -- -- -- 0.128247 NR -- -- < 0.20 -- -- -- --265 4 0.00 -- 0.110 -- -- -- --268 0 2.70 0.150 -- -- -- -- --273 4 0.00 -- 0.110 -- -- -- --274 3 -0.67 -- -- -- -- -- 0.100279 2 1.35 -- -- -- -- -- 0.130287 3 -0.81 0.098 -- -- -- -- --301 4 0.00 -- -- -- -- -- 0.110
0.065
0.085
0.105
0.125
0.145
ANALYTICAL METHOD CODE
CO
NC
EN
TRA
TIO
N
1 4 5 6 7 12
98
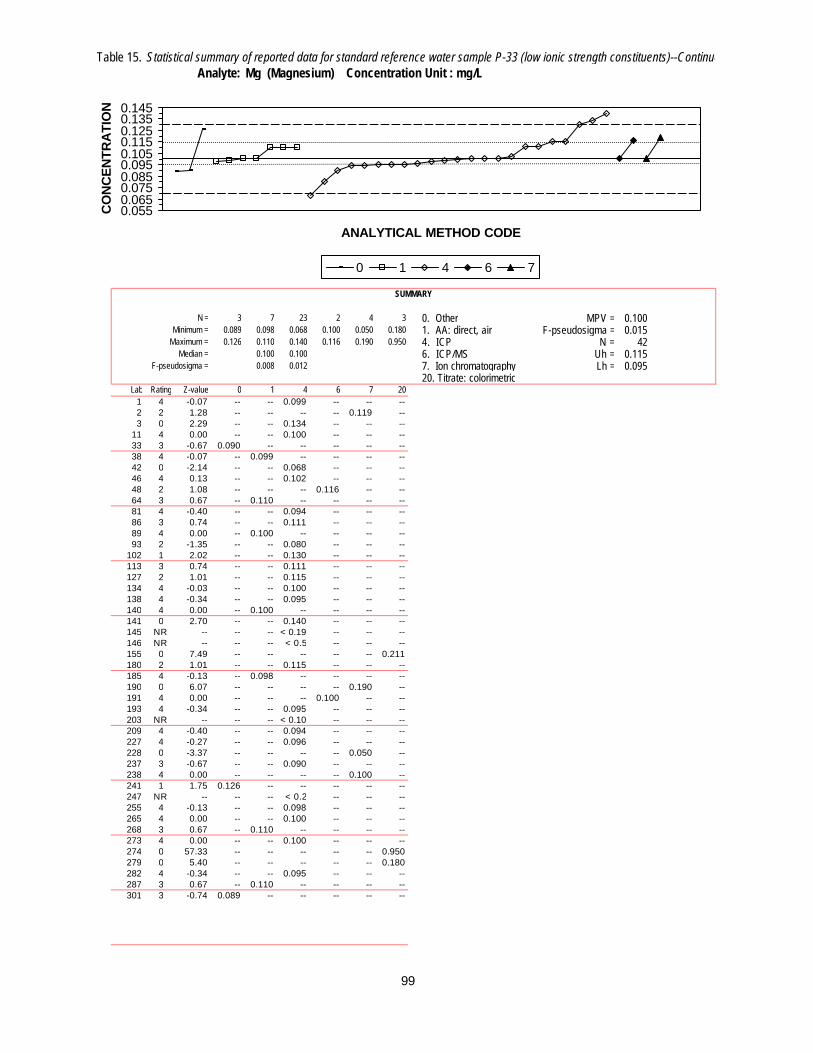
Table 15. Statistical summary of reported data for standard reference water sample P-33 (low ionic strength constituents)--ContinuedAnalyte: Mg (Magnesium) Concentration Unit : mg/L
SUMMARY
N = 3 7 23 2 4 3 0. Other MPV = 0.100Minimum = 0.089 0.098 0.068 0.100 0.050 0.180 1. AA: direct, air F-pseudosigma = 0.015
Maximum = 0.126 0.110 0.140 0.116 0.190 0.950 4. ICP N = 42Median = 0.100 0.100 6. ICP/MS Uh = 0.115
F-pseudosigma = 0.008 0.012 7. Ion chromatography Lh = 0.09520. Titrate: colorimetric
Lab Rating Z-value 0 1 4 6 7 201 4 -0.07 -- -- 0.099 -- -- --2 2 1.28 -- -- -- -- 0.119 --3 0 2.29 -- -- 0.134 -- -- --
11 4 0.00 -- -- 0.100 -- -- --33 3 -0.67 0.090 -- -- -- -- --38 4 -0.07 -- 0.099 -- -- -- --42 0 -2.14 -- -- 0.068 -- -- --46 4 0.13 -- -- 0.102 -- -- --48 2 1.08 -- -- -- 0.116 -- --64 3 0.67 -- 0.110 -- -- -- --81 4 -0.40 -- -- 0.094 -- -- --86 3 0.74 -- -- 0.111 -- -- --89 4 0.00 -- 0.100 -- -- -- --93 2 -1.35 -- -- 0.080 -- -- --
102 1 2.02 -- -- 0.130 -- -- --113 3 0.74 -- -- 0.111 -- -- --127 2 1.01 -- -- 0.115 -- -- --134 4 -0.03 -- -- 0.100 -- -- --138 4 -0.34 -- -- 0.095 -- -- --140 4 0.00 -- 0.100 -- -- -- --141 0 2.70 -- -- 0.140 -- -- --145 NR -- -- -- < 0.19 -- -- --146 NR -- -- -- < 0.5 -- -- --155 0 7.49 -- -- -- -- -- 0.211180 2 1.01 -- -- 0.115 -- -- --185 4 -0.13 -- 0.098 -- -- -- --190 0 6.07 -- -- -- -- 0.190 --191 4 0.00 -- -- -- 0.100 -- --193 4 -0.34 -- -- 0.095 -- -- --203 NR -- -- -- < 0.10 -- -- --209 4 -0.40 -- -- 0.094 -- -- --227 4 -0.27 -- -- 0.096 -- -- --228 0 -3.37 -- -- -- -- 0.050 --237 3 -0.67 -- -- 0.090 -- -- --238 4 0.00 -- -- -- -- 0.100 --241 1 1.75 0.126 -- -- -- -- --247 NR -- -- -- < 0.2 -- -- --255 4 -0.13 -- -- 0.098 -- -- --265 4 0.00 -- -- 0.100 -- -- --268 3 0.67 -- 0.110 -- -- -- --273 4 0.00 -- -- 0.100 -- -- --274 0 57.33 -- -- -- -- -- 0.950279 0 5.40 -- -- -- -- -- 0.180282 4 -0.34 -- -- 0.095 -- -- --287 3 0.67 -- 0.110 -- -- -- --301 3 -0.74 0.089 -- -- -- -- --
0.0550.0650.0750.0850.0950.1050.1150.1250.1350.145
ANALYTICAL METHOD CODE
CO
NC
EN
TRA
TIO
N
0 1 4 6 7
99

Table 15. Statistical summary of reported data for standard reference water sample P-33 (low ionic strength constituents)--ContinuedAnalyte: Na (Sodium) Concentration Unit : mg/L
SUMMARY
N = 8 24 1 2 5 6 1. AA: direct, air MPV = 1.42Minimum = 1.31 0.14 1.37 1.46 1.39 1.16 4. ICP F-pseudosigma = 0.10
Maximum = 4.09 50.06 1.46 1.93 4.94 5. DCP N = 46Median = 1.43 1.40 6. ICP/MS Uh = 1.48
F-pseudosigma = 0.11 0.12 7. Ion chromatography Lh = 1.3312. Flame emission
Lab Rating Z-value 1 4 5 6 7 121 4 -0.43 -- 1.37 -- -- -- --2 0 4.96 -- -- -- -- 1.93 --3 2 1.10 -- 1.53 -- -- -- --
11 0 -9.62 -- 0.41 -- -- -- --33 4 -0.43 -- -- 1.37 -- -- --38 3 -1.00 1.31 -- -- -- -- --42 1 -1.96 -- 1.21 -- -- -- --45 0 25.59 4.09 -- -- -- -- --46 4 -0.14 -- 1.40 -- -- -- --48 4 0.43 -- -- -- 1.46 -- --64 3 -1.00 1.31 -- -- -- -- --81 3 0.81 -- 1.50 -- -- -- --86 3 -0.62 -- 1.35 -- -- -- --89 0 -2.44 -- -- -- -- -- 1.1693 4 -0.24 -- 1.39 -- -- -- --
102 0 465.41 -- 50.06 -- -- -- --113 1 1.77 -- 1.60 -- -- -- --127 4 0.05 -- 1.42 -- -- -- --134 4 0.33 1.45 -- -- -- -- --138 4 -0.14 -- 1.40 -- -- -- --140 3 0.57 1.48 -- -- -- -- --141 2 1.48 -- 1.57 -- -- -- --145 4 0.05 -- 1.42 -- -- -- --146 4 0.33 -- 1.45 -- -- -- --180 4 0.43 -- 1.46 -- -- -- --185 3 0.54 -- -- -- -- -- 1.47190 3 0.53 -- -- -- -- 1.47 --191 4 0.43 -- -- -- 1.46 -- --193 2 -1.29 -- 1.28 -- -- -- --203 1 -1.87 -- 1.22 -- -- -- --209 2 -1.16 -- 1.29 -- -- -- --215 0 -5.31 -- 0.86 -- -- -- --228 2 1.29 -- -- -- -- 1.55 --237 4 -0.24 -- -- -- -- 1.39 --238 3 0.81 -- -- -- -- 1.50 --241 3 -0.53 -- -- -- -- -- 1.36247 4 0.14 -- 1.43 -- -- -- --265 4 -0.14 -- 1.40 -- -- -- --268 4 0.33 1.45 -- -- -- -- --273 0 -12.20 -- 0.14 -- -- -- --274 0 33.73 -- -- -- -- -- 4.94279 2 1.20 -- -- -- -- -- 1.54282 4 -0.43 -- 1.37 -- -- -- --287 3 -0.91 1.32 -- -- -- -- --301 3 -0.77 -- -- -- -- -- 1.33321 4 -0.05 1.41 -- -- -- -- --
1.101.201.301.401.501.601.70
ANALYTICAL METHOD CODE
CO
NC
EN
TRA
TIO
N
1 4 5 6 7 12
100

Table 15. Statistical summary of reported data for standard reference water sample P-33 (low ionic strength constituents)--ContinuedAnalyte: pH
SUMMARY
N = 53 41. Direct reading MPV = 4.67Minimum = 3.58 F-pseudosigma = 0.13
Maximum = 7.00 Rating Criterion = 0.23Median = 4.67 N = 53
F-pseudosigma = 0.13 Uh = 4.75Lh = 4.58
Lab Rating Z-value 41 Lab Rating Z-value 411 2 1.46 5.01 301 4 0.34 4.752 3 -0.72 4.50 312 4 0.00 4.673 2 -1.20 4.39 321 0 2.06 5.15
11 0 3.90 5.5812 0 -2.70 4.0425 3 0.73 4.8433 4 -0.13 4.6438 4 0.13 4.7045 3 -0.99 4.4446 3 0.99 4.9048 0 5.70 6.0059 4 0.13 4.7064 2 1.46 5.0181 4 -0.30 4.6086 4 0.00 4.6789 2 -1.20 4.3993 4 0.47 4.78
107 4 0.00 4.67113 4 0.13 4.70127 4 -0.04 4.66134 4 0.00 4.67138 4 0.00 4.67140 4 0.09 4.69141 3 -0.73 4.50143 4 0.04 4.68145 3 -0.73 4.50146 4 -0.26 4.61155 4 -0.47 4.56180 4 0.13 4.70183 3 0.56 4.80185 1 -1.76 4.26190 4 -0.30 4.60203 4 -0.39 4.58204 4 0.00 4.67209 4 0.09 4.69215 0 2.27 5.20227 4 0.13 4.70228 4 -0.34 4.59237 3 -0.51 4.55241 2 -1.07 4.42243 4 -0.17 4.63244 4 0.00 4.67247 4 0.13 4.70265 0 9.98 7.00268 4 0.04 4.68273 0 7.00 6.31274 0 -4.67 3.58279 4 0.34 4.75282 2 -1.37 4.35287 4 0.34 4.75
4.20
4.40
4.60
4.80
5.00
5.20
ANALYTICAL METHOD CODE
CO
NC
EN
TRA
TIO
N
41
101

Table 15. Statistical summary of reported data for standard reference water sample P-33 (low ionic strength constituents)--ContinuedAnalyte: PO4 as P (Orthosphosphate as Phosphorus) Concentration Unit : mg/L
SUMMARY
N = 1 9 30 0. Other MPV = 0.045Minimum = 0.256 0.036 0.025 7. Ion chromatography F-pseudosigma = 0.007
Maximum = 0.580 0.065 22m. Color:phosphomolybdate N = 40Median = 0.050 0.045 Uh = 0.050
F-pseudosigma = 0.052 0.005 Lh = 0.040
Lab Rating Z-value 0 7 22m1 0 -2.70 -- -- 0.0253 4 0.13 -- -- 0.046
11 3 -0.67 -- -- 0.04012 3 -0.81 -- -- 0.03925 3 -0.94 -- -- 0.03833 3 0.67 -- 0.050 --38 4 -0.40 -- -- 0.04242 NR -- -- < 0.05 --46 4 0.30 -- -- 0.04748 4 0.00 -- -- 0.04559 3 0.67 -- 0.050 --64 1 -1.75 -- -- 0.03281 2 -1.08 -- 0.037 --83 4 -0.40 -- -- 0.04289 4 -0.40 -- -- 0.04293 4 0.00 -- -- 0.045
102 3 -0.86 -- -- 0.039113 4 0.27 -- -- 0.047127 2 1.04 -- -- 0.053134 3 -0.67 -- -- 0.040138 4 -0.28 -- -- 0.043140 3 0.67 -- -- 0.050143 4 0.40 -- -- 0.048145 0 -4.72 -- -- < 0.01146 NR -- < 0.021 -- --155 4 -0.16 -- -- 0.044180 4 -0.13 -- -- 0.044183 3 -0.77 -- -- 0.039190 3 0.81 -- -- 0.051191 0 8.77 -- 0.110 --196 4 0.40 -- 0.048 --203 4 0.00 -- -- 0.045215 1 2.02 -- -- 0.060241 2 -1.21 -- 0.036 --247 3 -0.67 -- 0.040 --255 4 0.00 -- -- 0.045273 0 32.92 -- 0.289 --274 0 2.70 -- -- 0.065282 3 -0.54 -- -- 0.041287 0 72.17 -- 0.580 --301 0 28.46 0.256 -- --312 4 0.00 -- -- 0.045321 4 0.40 -- -- 0.048
0.0250.0300.0350.0400.0450.0500.0550.0600.065
ANALYTICAL METHOD CODE
CO
NC
EN
TRA
TIO
N
7 22m
102

Table 15. Statistical summary of reported data for standard reference water sample P-33 (low ionic strength constituents)--ContinuedAnalyte: SO4 (Sulfate) Concentration Unit : mg/L
SUMMARY
N = 34 4 5 7. Ion chromatography MPV = 1.41Minimum = 1.11 1.20 0.32 22mtb. Color: methyl thymol blue F-pseudosigma = 0.17
Maximum = 2.32 2.30 2.00 51. Turbidimetric N = 43Median = 1.41 Uh = 1.54
F-pseudosigma = 0.13 Lh = 1.30
Lab Rating Z-value 7 22mtb 511 4 0.11 1.43 -- --2 4 0.03 1.42 -- --3 NR -- -- < 10 --
11 0 3.39 2.00 -- --33 4 -0.11 1.39 -- --42 0 5.22 2.32 -- --45 0 2.47 1.84 -- --48 0 -2.35 -- 1.0059 4 -0.11 1.39 -- --64 4 -0.23 1.37 -- --81 2 -1.21 -- 1.20 --86 2 1.15 1.61 -- --89 4 0.17 1.44 -- --93 4 -0.23 1.37 -- --
102 0 3.33 1.99 -- --113 4 -0.11 1.39 -- --127 4 0.11 1.43 -- --134 4 0.23 1.45 -- --138 3 -0.52 1.32 -- --140 0 -2.35 -- -- 1.00141 3 -0.63 -- -- 1.30145 2 1.09 1.60 -- --146 NR -- -- -- < 5180 4 0.00 1.41 -- --185 4 -0.24 1.37 -- --190 2 -1.15 -- 1.21 --191 3 0.80 1.55 -- --196 3 0.63 1.52 -- --203 NR -- -- < 2.5 --208 0 3.39 2.00 -- --209 4 0.23 1.45 -- --215 0 3.39 -- -- 2.00227 0 2.35 1.82 -- --228 3 -0.75 1.28 -- --238 4 -0.11 1.39 -- --241 3 -0.69 1.29 -- --247 3 -0.63 1.30 -- --255 0 5.11 -- 2.30 --265 3 -0.63 1.30 -- --268 4 0.00 1.41 -- --273 1 -1.72 1.11 -- --274 0 -6.26 -- -- 0.32279 4 0.40 -- 1.48 --282 3 -0.63 1.30 -- --287 3 -0.80 1.27 -- --321 4 0.29 1.46 -- --
0.90
1.10
1.30
1.50
1.70
1.90
ANALYTICAL METHOD CODE
CO
NC
EN
TRA
TIO
N
7 22mtb 51
103

Table 15. Statistical summary of reported data for standard reference water sample P-33 (low ionic strength constituents)--ContinuedAnalyte: Sp Cond (Specific Conductance) Concentration Unit : µS/cm
SUMMARY
41. Direct reading MPV = 20.8Minimum = 0.1 F-pseudosigma = 2.4
Maximum = 64.5 N = 49Median = 20.8 Uh = 21.4
F-pseudosigma = 2.4 Lh = 18.1
Lab Rating Z-value 411 2 -1.10 18.13 4 0.00 20.8
11 4 -0.45 19.712 3 -0.69 19.125 0 2.94 28.033 4 -0.04 20.738 4 0.33 21.645 4 0.04 20.946 0 16.43 61.048 4 0.08 21.059 4 0.08 21.064 1 -1.51 17.181 2 -1.47 17.286 2 -1.14 18.089 1 1.72 25.093 4 -0.08 20.6
102 4 0.49 22.0107 4 0.00 20.8113 3 -0.74 19.0127 4 0.49 22.0134 4 0.09 21.0138 4 -0.08 20.6140 4 0.08 21.0141 1 -1.96 16.0143 4 -0.33 20.0145 0 -8.25 < 1146 2 1.31 24.0155 4 0.00 20.8180 2 -1.14 18.0183 2 -1.14 18.0185 0 17.86 64.5190 4 0.08 21.0193 2 -1.43 17.3203 4 -0.45 19.7204 4 0.25 21.4215 1 -1.59 16.9227 3 -0.53 19.5228 4 0.29 21.5241 0 -4.01 11.0243 4 0.00 20.8244 4 0.00 20.8247 4 0.08 21.0268 2 -1.14 18.0273 3 0.78 22.7274 4 -0.37 19.9279 3 -0.78 18.9282 3 0.65 22.4301 0 -8.48 0.1312 4 0.37 21.7321 1 -1.55 17.0
13.515.517.519.521.523.525.527.5
ANALYTICAL METHOD CODE
CO
NC
EN
TRA
TIO
N
41
104

Table 16. Statistical summary of reported data for standard reference sample Hg-29 (mercury)
Definition of analytical methods, abbreviations, and symbols
Analytical methods
0. Other/Not reported
4. ICP = inductively coupled plasma
6. ICP/MS = inductively coupled plasma / mass spectrometry
8. AA: cold vapor = atomic absorption: cold vapor
9. Atomic fluorescence
Abbreviations and figure symbols
N = number of analyses--(excluding less than values)
MPV = most probable value
F-pseudosigma = nonparametric statistic deviation
Uh = upper hinge value
Lh = lower hinge value
Uwl = upper warning limit
Lwl = lower warning limit
Ucl = upper warning limit
Lcl = lower warning limitµg/L = micrograms per liter
Lab = laboratory code number
NR = not rated, less than value reported or insufficient data
< = less than
-- = not reported
Constituent page
Hg Mercury 106
105

Table 16. Statistical summary of reported data for standard reference water sample Hg-29 (mercury)--ContinuedAnalyte: Hg (Mercury) Concentration Unit : µg/L
SUMMARY
N = 2 3 44 2 0. Other MPV = 0.463Minimum = 0.480 0.410 0.110 0.440 6. ICP/MS F-pseudosigma = 0.052
Maximum = 0.490 0.550 0.680 0.453 8. AA: cold vapor N = 51Median = 0.465 9. Atomic fluoresence Uh = 0.504
F-pseudosigma = 0.069 Lh = 0.435
Lab Rating Z-value 0 6 8 9 Lab Rating Z-value 0 6 8 91 4 -0.49 -- -- 0.438 -- 307 0 -2.39 -- -- 0.340 --3 4 0.00 -- -- 0.463 -- 308 2 -1.42 -- -- 0.390 --
10 1 1.88 -- -- 0.560 --11 4 -0.45 -- -- 0.440 --12 0 2.66 -- -- 0.600 --13 NR -- -- -- < 4 --32 1 1.69 -- 0.550 -- --39 4 -0.12 -- -- 0.457 --45 0 -6.85 -- -- 0.110 --46 4 -0.29 -- -- 0.448 --48 2 -1.42 -- -- 0.390 --50 2 1.49 -- -- 0.540 --59 4 0.33 -- -- 0.480 --70 4 0.21 -- -- 0.474 --81 2 -1.46 -- -- 0.388 --86 4 -0.19 -- -- -- 0.45387 0 2.66 -- -- 0.600 --89 4 0.14 -- -- 0.470 --96 4 -0.06 -- -- 0.460 --
113 4 -0.25 -- -- 0.450 --126 2 1.49 -- -- 0.540 --127 3 -0.85 -- -- 0.419 --134 4 0.14 -- -- 0.470 --138 3 -0.83 -- -- 0.420 --141 2 1.30 -- -- 0.530 --142 4 -0.06 -- -- 0.460 --144 1 1.69 -- -- 0.550 --145 2 -1.42 -- -- 0.390 --146 0 2.35 -- -- 0.584 --147 4 -0.50 -- -- 0.437 --151 4 -0.25 -- -- 0.450 --154 0 -5.10 -- -- 0.200 --180 0 -3.16 -- -- 0.300 --193 4 0.06 -- -- 0.466 --198 3 0.87 -- -- 0.508 --203 3 0.72 -- -- 0.500 --212 0 2.06 -- -- 0.569 --213 3 0.72 -- -- 0.500 --215 0 2.66 -- -- 0.600 --219 3 0.52 0.490 -- -- --234 4 -0.45 -- -- 0.440 --241 2 -1.03 -- 0.410 -- --247 4 0.33 -- -- 0.480 --255 1 -2.02 -- -- 0.359 --259 0 4.21 -- -- 0.680 --265 4 0.14 -- 0.470 -- --277 4 0.23 -- -- 0.475 --282 3 -0.60 -- -- 0.432 --298 4 0.33 0.480 -- -- --304 4 -0.45 -- -- -- 0.440
0.3100.3600.4100.4600.5100.5600.610
ANALYTICAL METHOD CODE
CO
NC
EN
TRA
TIO
N
0 6 8 9
106

Table 17. Most probable values for constituents and properties in standard reference samples distributed in October 1999µ µ
Analyte MPV F-pseudosigma N Analyte MPV F-pseudosigma NAg 9.67 µg/L 0.91 59 Mg 5.60 mg/L 0.21 73Al 31.9 µg/L 3.7 47 Mn 22.0 µg/L 1.6 68As 28.4 µg/L 1.6 59 Mo 41.4 µg/L 2.6 42B 26.4 µg/L 3.0 30 Na 100 mg/L 4 71
Ba 38.1 µg/L 1.9 54 Ni 22.2 µg/L 1.6 61Be 10.8 µg/L 0.4 50 Pb 16.6 µg/L 1.2 66Ca 25.5 mg/L 0.8 75 Sb 13.9 µg/L 1.1 43Cd 24.0 µg/L 1.6 68 Se 5.49 µg/L 0.83 49Co 13.3 µg/L 0.9 45 SiO2 11.5 mg/L 0.7 42Cr 26.8 µg/L 1.8 64 Sr 190 µg/L 7 35Cu 33.4 µg/L 2.5 69 Tl 13.8 µg/L 1.6 40Fe 48.9 µg/L 6.2 68 U 5.04 µg/L 0.32 12K 1.52 mg/L 0.13 67 V 14.4 µg/L 1.7 40Li 8.57 µg/L 1.93 18 Zn 19.2 µg/L 1.9 65
Analyte MPV F-pseudosigma N Analyte MPV F-pseudosigma NAlkalinity as CaCO3 6.00 mg/L 1.49 68 Na 16.3 mg/L 0.9 74
B 92.2 µg/L 7.8 32 total P as P 0.386 mg/L 0.024 56Ca 3.63 mg/L 0.18 74 pH 6.60 units 0.22 79Cl 17.3 mg/L 0.9 80 SiO2 4.50 mg/L 0.39 53
DSRD 66.5 mg/L 8.2 46 SO4 3.76 mg/L 0.33 69F 1.98 mg/L 0.12 63 Sp Cond 113 µS/cm 3 74K 0.92 mg/L 0.09 67 Sr 18.3 µg/L 0.9 33
Mg 0.722 mg/L 0.047 73 V 30.0 µg/L 1.9 37
Analyte MPV F-pseudosigma N Analyte MPV F-pseudosigma NNH3 as N 0.150 mg/L 0.021 80 NH3 as N 1.38 mg/L 0.08 70
NH3+OrgN as N 0.200 mg/L 0.066 48 NH3+OrgN as N 1.54 mg/L 0.13 47NO3 as N 0.084 mg/L 0.008 79 NO3 as N 1.26 mg/L 0.04 71
total P as P 0.158 mg/L 0.010 69 total P as P 0.883 mg/L 0.041 61PO4 as P 0.142 mg/L 0.010 73 PO4 as P 0.860 mg/L 0.034 65
Analyte MPV F-pseudosigma N Analyte MPV F-pseudosigma NAcidity Insufficient data Na 1.42 mg/L 0.10 46
Ca 0.322 mg/L 0.043 47 pH 4.67 units 0.13 53Cl 2.38 mg/L 0.18 50 PO4 as P 0.045 mg/L 0.007 40F 0.105 mg/L 0.039 33 SO4 1.41 mg/L 0.17 43K 0.110 mg/L 0.015 38 Sp Cond 20.8 µS/cm 2.4 49
Mg 0.100 mg/L 0.015 42
Analyte MPV F-pseudosigma NHg 0.463 µg/L 0.052 51
107


![GEOLOGICAL SURVEY'S STUDIES AND POTENTIAL RESERVES OF ... · united states department of the interior ]. a. krug, secretary geological survey w. e. wrather, director circular 14 geological](https://static.fdocuments.in/doc/165x107/5f82e2ebad1c002782084854/geological-surveys-studies-and-potential-reserves-of-united-states-department.jpg)