Results of the Multagri project concerning indicators of ... · Results of the Multagri project...
100
System for Environmental and Agricultural Modelling; Linking European Science and Society Report no.: 11 May 2006 Ref: PD2.3.1 ISBN no.: 90-8585-040-1 Results of the Multagri project concerning indicators of multifunctionality and their relevance for SEAMLESS-IF D. Cairol, E. Perret, N. Turpin Partners involved: CEMAGREF Logo’s main partners involved in this publication Sixth Framework Programme
Transcript of Results of the Multagri project concerning indicators of ... · Results of the Multagri project...

System for Environmental and Agricultural Modelling; Linking European Science and Society
Report no.: 11 May 2006 Ref: PD2.3.1 ISBN no.: 90-8585-040-1
Results of the Multagri project concerning indicators of multifunctionality and their
relevance for SEAMLESS-IF
D. Cairol, E. Perret, N. Turpin
Partners involved: CEMAGREF
Logo’s main partners involved in this publication Sixth Framework Programme

SEAMLESS No. 010036 Deliverable number: PD2.3.1 6 February 2006
Page 2 of 100
SEAMLESS integrated project aims at developing an integrated framework that allows ex-ante assessment of agricultural and environmental policies and technological innovations. The framework will have multi-scale capabilities ranging from field and farm to the EU25 and globe; it will be generic, modular and open and using state-of-the art software. The project is carried out by a consortium of 30 partners, led by Wageningen University (NL). Email: [email protected] Internet: www.seamless-ip.org
Authors of this report and contact details:
Dominique Cairol, Partner acronym: Cemagref DGGT Parc de Tourvoie, BP44 92163 Antony cedex France E-mail: [email protected]
Eric Perret, Partner acronym: Cemagref DTGR 2, rue de la Papeterie, BP 76 38402 Saint-Martin-d'Hères France E-mail: [email protected]
Nadine Turpin, Partner acronym: Cemagref UMR Métafort Campus universitaire des Cézeaux 24, avenue des Landais - BP 50085 63172 AUBIERE CEDEX France tél 04 73 44 06 34 fax 04 73 44 06 96 E-mail: [email protected] site web : http://www.clermont.cemagref.fr/

SEAMLESS No. 010036 Deliverable number: PD2.3.1 6 February 2006
Page 3 of 100
Disclaimer 1:
“This publication has been funded under the SEAMLESS integrated project, EU 6th Framework Programme for Research, Technological Development and Demonstration, Priority 1.1.6.3. Global Change and Ecosystems (European Commission, DG Research, contract no. 010036-2). Its content does not represent the official position of the European Commission and is entirely under the responsibility of the authors.”
"The information in this document is provided as is and no guarantee or warranty is given that the information is fit for any particular purpose. The user thereof uses the information at its sole risk and liability."
Disclaimer 2:
Within the SEAMLESS project many reports are published. Some of these reports are intended for public use, others are confidential and intended for use within the SEAMLESS consortium only. As a consequence references in the public reports may refer to internal project deliverables that cannot be made public outside the consortium.
When citing this SEAMLESS report, please do so as:
Cairol, D., Perret, E., Turpin, N., 2006. Results of the Multagri project concerning indicators of multifunctionality and their relevance for SEAMLESS-IF, SEAMLESS Report No.11, SEAMLESS integrated project, EU 6th Framework Programme, contract no. 010036-2, www.SEAMLESS-IP.org, 100 pp, ISBN no. 90-8585-040-1.


SEAMLESS No. 010036 Deliverable number: PD2.3.1 6 February 2006
Page 5 of 100
Table of contents General part ........................................................................................................................................... 7
Objective within the project ................................................................................................................. 7
General Information ............................................................................................................................. 7
Executive summary ............................................................................................................................... 7
Abbreviations......................................................................................................................................... 9
Glossary................................................................................................................................................ 11
1 Introduction................................................................................................................................ 15
2 Multagri contributed to clarify the notion of multifunctionality ........................................... 17
2.1 The Multagri project........................................................................................................... 17
2.2 Multifunctionality of agriculture and rural areas: a frame for analysis ............................ 18 2.2.1 A joint production of commodities and public goods.................................................... 19 2.2.2 Multiple impacts and contributions from agriculture to rural areas............................... 19 2.2.3 A complementary and conflicting connection between commodities and identity goods 19 2.2.4 Farmers strategies and practices: multifunctionality, technical change, livelihood systems 20 2.2.5 Multiple use of rural space and regional planning......................................................... 20 2.2.6 Adjustment between activity systems and societal demands as a way toward sustainable agriculture and rural development (SARD) regulation ................................................................ 21 2.2.7 A social demand towards agriculture............................................................................. 21 2.2.8 Governance, policy and multifunctionality.................................................................... 21 2.2.9 Potential application for SEAMLESS ........................................................................... 22
2.3 Strengths and weakness of the multifunctionality concept ................................................. 22 2.3.1 Some strengths of the multifunctionality concept.......................................................... 23 2.3.2 Some weaknesses of the multifunctionality concept ..................................................... 23
2.4 Multifunctionality: a three components analytical framework........................................... 24 2.4.1 Functions and their interrelations .................................................................................. 24 2.4.2 Re-embedding agriculture in society ............................................................................. 25 2.4.3 Multifunctionality as a pillar of sustainable development? ........................................... 27 2.4.4 Conclusion : Multifunctionality as a framework to study complexity........................... 29

SEAMLESS No. 010036 Deliverable number: PD2.3.1 6 February 2006
Page 6 of 100
3 Overview on existing indicators from Multagri.......................................................................31
3.1 Indicator systems ................................................................................................................32 3.1.1 DPSIR-framework .........................................................................................................32 3.1.2 Characterization of indicators ........................................................................................32
3.2 Indicators............................................................................................................................33 3.2.1 Economic indicators.......................................................................................................33 3.2.2 Environmental indicators ...............................................................................................33 3.2.3 Social indicators .............................................................................................................34 3.2.4 Conclusions....................................................................................................................34
4 Method to identify indicators for SEAMLESS ........................................................................37
4.1 The list of indicators in relation with the different domains ...............................................37
4.2 Selection grid for indicators for SEAMLESS ......................................................................37 4.2.1 Goal of the indicators .....................................................................................................38 4.2.2 Validation of the indicators ............................................................................................38 4.2.3 Intended user groups ......................................................................................................38 4.2.4 Origin of data .................................................................................................................39 4.2.5 Development process of the indicators ..........................................................................39 4.2.6 Integration in an evaluation process of multifunctionality.............................................40 4.2.7 Links with models ..........................................................................................................40 4.2.8 Conclusion .....................................................................................................................40
4.3 Geographical-level of relevancy of indicators for SEAMLESS ..........................................41 4.3.1 At farm level ..................................................................................................................41 4.3.2 At intermediate level (landscape, watershed, territory….).............................................42 4.3.3 At regional level.............................................................................................................42 4.3.4 Conclusion on indicators for different scales .................................................................42
5 Indicators of Multagri for SEAMLESS: contributions and lacks?........................................43
6 A need for further work on indicator systems for multifunctionality ...................................47
References.............................................................................................................................................49 Multagri reports............................................................................................................................49 Other references ...........................................................................................................................49
Appendices............................................................................................................................................53
Annex n° 1 : list of indicators which can be used for multifunctionality ........................................53

SEAMLESS No. 010036 Deliverable number: PD2.3.1 6 February 2006
Page 7 of 100
Economic indicators..................................................................................................................... 53 Social indicators........................................................................................................................... 54 Environmental indicators ............................................................................................................. 55
Annex n° 2 : evaluative framework for indicators............................................................................ 61 Economic indicators..................................................................................................................... 61 Social indicators........................................................................................................................... 63 Environmental indicators ............................................................................................................. 65
Annex n° 3 : Indicators and geographical level ................................................................................ 85 Economic indicators..................................................................................................................... 85 Social indicators........................................................................................................................... 87 Environmental indicators ............................................................................................................. 89


SEAMLESS No. 010036 Deliverable number: PD2.3.1 6 February 2006
Page 9 of 100
General part
Objective within the project
Identify indicators of multifunctionality that should be taken into account in the construction of the model, either as inputs or outputs of the models.
General Information
Task(s) and Activity code(s): Task 2.3
Input from (Task and Activity codes): Multagri SSA project, www.multagri.net
Output to (Task and Activity codes):
Related milestones:
Executive summary
The notion of multifunctionality increasingly gained attention during the nineties in discussions about agricultural policy changes and the future of agriculture, both at national and international levels, particularly within the framework of OECD works and in the WTO multilateral negotiations on agricultural trade. Since the term “Multifunctionality of Agriculture” (MFA) has rapidly emerged into common use in environmental, agricultural and international trade discussions, it covers a wide range of different perceptions in research literature today.
The task that produced this deliverable is principally based on the work performed within the Multagri project, which analysed the existing literature on multifunctionality. Section 2 presents the main developments of the MFA different concepts, as reviewed in the Multagri project and how this conceptual organisation can improve the links between sustainability and multifunctionality. The Multagri project might help to explore to what extent multifunctionality is a concept that can make sustainable development more operational. The workpackage 3 of the Multagri project provided indicators to describe the three main function of agriculture (economic, environmental and social): the section 3 summarizes these developments. Section 4 assesses the relevance of these indicators for the SEAMLESS project in three steps: first, a list of indicators by category and domain is devised; second a selection grid is designed to help selecting indicators that are relevant for SEAMLESS; third a discussion of the accurate geographical level is outlined for each indicator. Sections 5 and 6 discuss the accuracy of MFA indicators for the SEAMLESS project.


SEAMLESS No. 010036 Deliverable number: PD2.3.1 06 February 2006
Abbreviations AEI: Agro-Ecological Indicators
AgriBMPWater: http://www.bordeaux.cemagref.fr/adbx/agribmpwater/index.html
CO: Commodity Output
CORC: Concept Oriented Research Cluster
Demeter is the brand for products from Biodynamic® Agriculture
DPSIR: D =Driving Force; P = Pressure; S = State; I = Impact; R = Response
DSR: D = Driving force; S = State; R = Response
FADN: Farm Accountancy Data Network
IDEA : Indicateurs de Durabilité des Explorations Agricoles
IFOAM : International Federation of Organic Agriculture Movements
INDIGO : registered mark (http://www.inra.fr/presse/mars04/nb2.html)
LP: Linear Programming
MFA: Multifunctionality of Agriculture
MODAM: Multi-Objective Decision support tool for Agroecosystem Management
MultAgri: capitalisation of research results on the multifunctionality of agriculture and rural areas, http://multagri.lyon.cemagref.fr/
NCO: Non Commodity Output
NUTs : nomenclature of statistical territorial units (nomenclature des unités territoriales statistiques)
PPP: Profit, Planet, People
OECD: Organization for Economic Cooperation and Development
Polen model : http://www.sipeaa.it/tools/CropSyst/flichman_coupling.pdf
SARD: Sustainable Agricultural and Rural Development
SCP: Dutch Social and cultural Planning Office
Skal is a non-profit foundation that surveys the organic production in the Netherlands in accordance with the public law, based on EU-Regulation (EEC) nr. 2092/91.


SEAMLESS No. 010036 Deliverable number: PD2.3.1 06 February 2006
Glossary Note: this glossary contains terms from the PD231 of the Seamless project; they have not been validated by the Seamless partners (or glossary group) but should.
Demand side
The demand side is an economic that describe the consumer/society preferences and uses them to determine the desired levels of NCO production and the level of public funds the society may expend for NCOs. In this context, multifunctional agriculture is considered as a consequence of the changing needs and demands of consumers and society at large towards agriculture and rural areas (Cudlinova et al., 2005). Most studies dealing with consumer and societal demand towards agriculture and rural areas address its components separately: demand for quality food production, for environmental, ecological and landscape values, and for social and cultural aspects.
Ref: Cudlinova et al. (2005). Multagri: Summary Report of Consumer and Societal Demands for multifunctionality based on Three Different Secondary Case Studies Aimed at Different Functions of MFA. WP2 summary report, ILE, Czech Republic, 2005.
Ecological functions of agriculture
There is a plethora of planet indicators compiled yearly by state organizations filling lists; indicators and indicator concepts assessing the ecological functions of agriculture are usually divided into abiotic and biotic or biodiversity indicators.
Economic sustainability
According to the classical economic approach, the economic sustainability of an enterprise is achieved, if the following criteria are fulfilled: liquidity, rentability, stability and investment power (Heissenhuber 2000).
Ref: Heissenhuber, (2000): Nachhaltige Landbewirtschaftung – Anforderungen und Kriterien aus wirtschaftlicher Sicht. [Sustainable agriculture – requirements and criteria from economic perspective]. In: VDLUFA, 2000: Kongressband 2000 Stuttgart Hohenheim Generalthema „Nachhaltige Landwirtschaft“. Sept. 2000.
Function
A function is the result of a process delivering factual or potential provision of material or immaterial goods. Different functions of agriculture provide economic, environmental and social goods (Cairol, Seamless PD2.3.1).

SEAMLESS No. 010036 Deliverable number: PD2.3.1 6 February 2006
Page 14 of 100
Indicator
There are three basic roles of indicators: to simplify, to quantify and to communicate (European Environmental Agency, 2004). Thus, indicators are tools to reduce the complexity of system descriptions and to integrate complex system information (Giampietro, 1997), so that information can be communicated.
Ref: European Environmental Agency (2004): An inventory of biodiversity indicators in Europe. Technical report no. 92. Luxembourg: Office of Official Publications of the European Communities. 42pp.
Giampietro, M., (1997): Socioeconomic pressure, demographic pressure, environmental loading and technological changes in agriculture. Agriculture, Ecosystems and Environment 65: 210-229.
Jointness : “joint production refers to situations where a firm produces two or more outputs that are interlinked so that an increase or decrease of the supply of one output affects the levels of the others. Three reasons for jointness are frequently distinguished: 1) technical interdependencies in the production process; 2) non-allocable inputs and/or 3) allocable inputs that are fixed at the firm level” (OECD, 2001). Note that the OECD definition proceeds at the farm level only. The debate focuses on the degree of jointness between commodity and non-commodity outputs: multiple outputs differ from joint products. Moreover, jointness includes private and public goods.
Ref: OECD, 2001, Multifunctionality, towards an analytical framework, OECD, Paris, 27 p.
Supply side
The economic balance for the demand side is the supply side which examines the production possibilities and costs of NCO production at given production circumstances and consumer preferences. The supply side is related to the jointness of agricultural products. Many farmers have engaged in new activities, through new strategies such as diversification, pluriactivity (Renting et al. 2005). Three directions are distinguished: deepening activities (adding more value to products, with organic farming, high quality products, on-farm processing, short supply chains); broadening activities (development of new activities, such as management of nature and landscape, agri-tourism); re-grounding activities (pluriactivity or cost-reduction through alternative use and valorisation of internal farm resources).
Ref: Renting et al. (2005) Multifunctionality of activities, plurality of identities and new institutional arrangements. WP4 synthesis report, WUR, the Netherlands, 2005.
Social indicators for sustainable development

SEAMLESS No. 010036 Deliverable number: PD2.3.1 6 February 2006
Page 15 of 100
the development of social indicators for sustainable development is at a very early stage, ranging from simple education issues to complex issues on human rights, transparency, trust and conflict (Slingerland et al. 2003). Müller and Kächele (2000) propose an approach to quantify the social function of sustainability of agricultural holdings on the basis of categories like employment, possibility of self-expression and social acceptance. In this context the degree of sustainability is an indirect indicator for multifunctionality (Zander et al. 2004).
Ref: Müller, KM. and H. Kächele (2000): Nachhaltige Landbewirtschaftung – Anforderungen und Kriterien aus sozialer Sicht. [Sustainable agriculture – requirements and criteria from a social perspective]. In: VDLUFA, 2000: Kongressband 2000 Stuttgart Hohenheim Generalthema „Nachhaltige Landwirtschaft“. Sept. 2000.
Slingerland, M.A., J.A. Klijn (Eds.), R.H.G. Jongman and J.W. van der Schans, (2003): The unifying power of sustainable development. Towards balanced choices between People, Planet and Profit in agricultural production chains and rural land use: the role of science. WUR-report Sustainable Development, Wageningen University, Wageningen. 94pp.
Zander, P., Meyer, B., Michel, B., Karpinski, I., Uthes, S., Reinhardt, F-.J. (2004). MultAgri: Knowledge, models, techniques and tools that help to explain and forecast multifunctionality of agriculture. WP3 Country report MultAgri /WP3, UFZ Leipzig; ZALF, Müncheberg; 2004


SEAMLESS No. 010036 Deliverable number: PD2.3.1 06 February 2006
1 Introduction
As it emerged in the 1980’s and spread in the 1990’s, the word “multifunctionality” took on several conceptions, according to scientific disciplines, countries and stakeholders. This multiplicity of conceptions and works on multifunctionality was the starting point of the Multagri project. The idea was to clarify the issues raised by the concept of multifunctionality at the European level through the review of a state-of-the-art of existing research, along with the identification of research gaps and needs to build a solid base for future research. The projects starts from the hypothesis that multifunctionality is a way to achieve sustainable development and thus questioned the similarities and differences between these two notions.
SEAMLESS-if is being build to assess whether multifunctionality can be seen as a way to achieve increased sustainability and to what extent it does contribute to equitable regional development, food security and safety, natural resource conservation, rural income diversification and global sustainability, which are explicitly stated as key concerns in the EU Strategy for sustainable Development.
This report summarizes the results of two workpackages of the Multagri project: the WP1 suggests that multifunctionality can be conceptualised as an analytical framework, which contributes to the understanding of sustainable development; the WP3 provides a review of indicators and models addressing the multifunctionality of agriculture.
In this report, we will first offer some perspectives on the concept of multifunctionality, through a consideration on the different ways that multifunctionality is apprehended methodologically and how this has consequences on the types of indicators that are available. Then, we will make a survey of all available indicators from Multagri, and finally analyse which of them are the most relevant in a SEAMLESS perspective.


SEAMLESS No. 010036 Deliverable number: PD2.3.1 06 February 2006
2 Multagri contributed to clarify the notion of multifunctionality
2.1 The Multagri project Multagri is a Specific Support Action undertaken within the 6th Framework Research Programme of the European Commission. With a partnership of 26 research organisations from 15 countries this project will provide a comprehensive overview of existing research, particularly in Europe, on different aspects of the multifunctionality of agriculture and rural areas. The approach adopted in this initiative is based on the premise that the multifunctional character of agriculture must be acknowledged and promoted so that agriculture can fulfil its potential as a central pillar of sustainable development. Multagri is organised in 6 thematic axes (workpackages), designed in an interdisciplinary perspective.
Although the notion of multifunctionality only recently appeared on international political agendas, numerous social, cultural, technical and research practices already refer to it, either explicitly or implicitly. It is important to structure, assess and interpret these works to enable the identification of relevant questions for future research. This was the role of Multagri, in six stages:
1. Evaluating the state-of-the-art of current research. 2. Further analysis and understanding of ongoing research work. 3. Identifying the main institutions and networks involved in this type of research, both
inside and outside Europe, and paying special attention to new EU member countries. 4. Identifying the different disciplines and scientific approaches that are generating
knowledge and conceptual backgrounds in this area. 5. Providing a conceptual and analytical framework that allows for the identification of
approaches and topics for further research. 6. Formulating recommendations for a future research agenda concerning the
multifunctionality of agriculture and rural areas.
Six thematic axes of research have been identified (Figure 1) in order to structure the analysis and guide the development of recommendations for lines of future research (Cairol et al., 2005):
1. Definitions and interpretations of the concept of multifunctionality, and its contribution to sustain-able development.
2. Consumer and societal demands. 3. Models, techniques, tools and indicators that are of value in examining the
multifunctionality of agriculture. 4. Multifunctionality of activities, plurality of identities, and new institutional
arrangements. 5. Establishment and management of public policies aimed at promoting
multifunctionality : con-necting agriculture with new markets and services and rural SMEs.
6. Evaluation of the effects of policies on the multifunctionality of agriculture: observation tools and support for policy formulation and evaluation.
Figure 1 - Conceptual, analytical and diagnostic thematic axes

SEAMLESS No. 010036 Deliverable number: PD2.3.1 6 February 2006
Page 20 of 100
Through the choice of partners and expert, the coordinators of the project tried to extend the geographical coverage to the whole EU-25, and even to a more global perspective (United-States, Southern Countries). The outputs form Multiagri that are useful for SEAMLESS come from different WPs.
2.2 Multifunctionality of agriculture and rural areas: a frame for analysis
Since the term multifunctionality of agriculture (MFA) has rapidly emerged into common use in environmental, agricultural and international trade discussions, this term covers a wide range of different perceptions in research literature today. To present, compare, analyse and classify the different definitions and concepts used in political and theoretical discussions, the Multagri teams empirically choose to define Concept Oriented Research Clusters (Caron et al., 2005). Each CORC is characterized by by a relative homogeneity in the research practices, in the research questions addressed, and in the concepts used or discussed by scientists to lead their work, and by the scientific disciplines, the stream of thought or possibly the epistemic community researchers belong to. The definition of multifunctionality in each cluster can be explicit or not, but the scientific concepts used to qualify it rest on shared ideas. The intention was not to list existing definitions of multifunctionality, nor to classify countries according to the use of the word, but rather to look for a characterization of research practices that help structuring the research perspectives on multifunctionality.
Eight CORCs were identified from a comparative analysis of the five national case studies, which has been later completed by comments from the other Multagri Work Packages and validated during an international experts’ workshop (Caron et al., 2005):
• A joint production of commodities and public goods • Multiple impacts and contributions of agriculture to rural areas • A complementary and conflicting connection between commodities and identity
goods • Farmers strategies and practices
WP1 Concepts and discourses
WP2 Societal and
consumer demands
WP4 Multifunctional
Activities (‘supply’) WP5 Institutional arrangements
WP6 Policy evaluation tools
WP3 Knowledge, models and indicators of MFA
Diagnostic, evaluative research
Descriptive, analytical research
WP3 Knowledge, models and indicators

SEAMLESS No. 010036 Deliverable number: PD2.3.1 6 February 2006
Page 21 of 100
• Multiple use of rural space and regional planning • Adjustment between activity systems and societal demands as a way toward
sustainable agriculture and rural development • A societal demand towards agriculture • Governance, policy and Multifunctionality
2.2.1 A joint production of commodities and public goods
This first CORC is built upon analyses of multifunctionality by neoclassical economists around 2000 in relation with the international debates on trade and domestic support to farmers. The authors in this CORC have adopted a shared and explicit definition of multifunctionality based on the jointness between commodity outputs and public goods or the presence of externalities. They often refer to the concept of non-trade concerns as a synonymous of multifunctionality. This conception of multifunctionality is consistent with the ‘positive’ definition laid down and used by the OECD (2000). This cluster is fairly international, including American works, and uses a limited number of shared hypotheses and concepts arising from neoclassical economics (environmental economics, economics of production and trade, or other sub-areas of welfare economics, neo-institutional economics, etc.). The literature covered here mainly focuses on the efficiency of public policies or institutional arrangements in order to promote joint public goods and positive externalities and on their legitimacy in relation with the international negotiations. In that sense, this CORC often involves a normative dimension too, even if the definition of multifunctionality itself is essentially positive. Analytical firmness is the main strength of this CORC, and the lack of empirical evidence of jointness is its main weakness. In addition, analytical results are applicable in countries with a market economy and significant farm policies, which is not the case in most developing countries.
2.2.2 Multiple impacts and contributions from agriculture to rural areas
CORC 2 gathers interdisciplinary works focusing on the impact analysis of agriculture in a particular area. This cluster’s originality is not the conceptual qualification of multifunctionality. It rather attempts to build an empirical and comprehensive focus of the state of agriculture in an area and its contribution to changes. This CORC deals with the contributions of agriculture at the holding level or at the territory level, with its impact on a community, a territory or a society as a whole. Findings on those aspects of multifunctionality are brought by economists, sociologists and agronomists adopting research questions such as the assessment of the impact itself (on employment, landscape, income, etc.), or how to promote farming diversification in agricultural and non- agricultural activities (important issue in eastern European countries for instance). The empirical relevancy of this CORC is its main strength for decision making whereas the lack of conceptual unity and robustness is its main weakness for research purposes.
2.2.3 A complementary and conflicting connection between commodities and identity goods
CORC 3 mainly includes economists working on an alternative view of multifunctionality in reaction to the common definition. They do not share the dominant opinion that non trade concerns in the field of agricultural multifunctionality should be analysed as resulting of market failures, which would find its solution either by creating new markets or by way of

SEAMLESS No. 010036 Deliverable number: PD2.3.1 6 February 2006
Page 22 of 100
public good production. Researchers in CORC 3 consider that the development of market exchange unavoidably involves the destruction of identity and reciprocity structures. The non market exchange dimension of agricultural production is precisely assigned to restore identities and reciprocity relationships (concerning community and resource management, culture territory, intergenerational link…). This CORC develops another economic rationality (based on identity or reciprocity economy) which sets the limit to the rationality of the market exchange economy.. Empirical works of this analytical stream are conducted in several parts of the world (EU –national implementations of Rural Development Regulation-, North and South America, Africa) and show the way these two complementary and conflicting dimensions of agricultural multifunctionality and sustainable development are implemented or co-existing: on the one hand market exchange organisations and market price systems, on the other hand identity and reciprocity organisations (mainly renewal or new establishment of communities) and framing of non market price systems. Each of these two economic ways tends to overflow the other, resulting in movements and changes. Researchers draw the concrete lesson that there always will remain two different (market and non market) organisation and price systems, and that political task consists in managing and controlling conflicts between them and not to hopelessly keep trying to reduce one dimension to the other. The main strength of this CORC is its ability to account for economical values in farm production that CORC 1 does not account for (cultural dimension in particular). Its main weakness probably lies in its lack of anchorage into the “standard” economic literature and of visibility in the normative side of multifunctionality debates.
2.2.4 Farmers strategies and practices: multifunctionality, technical change, livelihood systems
CORC 4 includes agronomists and economists who work at the farm scale and perceive multifunctionality as a motor that drives agricultural practices. Research activities recognize two major and different focuses: the design or the promotion of “good practices” according to ecological norms on the one hand, and the understanding of practices and farmer’s individual choices by taking into account multifunctionality on the other hand. This CORC and more particularly the second focus actually bring a new dimension into the analysis of farming choices and decision making processes as research objects. For economists, the interest refers to the way non market objectives can be reached through private actors used to react to private signals. Therefore, multifunctionality requires new methods to assess and improve the procedure for farmers decision making, taking into account a wide range of functions and trade-offs. There are two basic research questions in this CORC : (i) what is the interpretation of multifunctionality in terms of farmers decisions and behaviours ? (ii) to what extent has the recognition of multifunctionality (in public policies or in local institutions) led to a change in farmers’ practices and strategies? The main stake here is not to qualify a list of functions of agriculture, but to consider the new functions as factors of change (“environmental protection”, ”landscape management”, family welfare, etc.) trying to further see how producers’ technical choices are moving in this direction. This CORC’s main strength is its potential effectiveness in understanding and promoting principles of multifunctionality at the farm level. Its main weakness is the lack of a common analytical dimension toward these principles.
2.2.5 Multiple use of rural space and regional planning
CORC 5 gathers authors who work on multifunctionality as a policy guide to integrate new objectives in farm policies in complement to the main drive towards agricultural modernisation and productivity. The normative dimension in this CORC is relatively

SEAMLESS No. 010036 Deliverable number: PD2.3.1 6 February 2006
Page 23 of 100
significant, the aim being explicitly to providing a scientific basis for objectives such as redirecting funds to less-favoured areas, reinforcing the diversification of economic activity, promoting alternative values of agriculture like the landscape protection, etc. As in CORC 2, and for the same reasons (empirical relevancy) the conceptual roots of multifunctionality is not at stake, research methods can be rather heterogeneous, and research teams are pluri-disciplinary. CORC 5 includes scientists and experts from urban and rural planning, landscape architecture and social geography, integrates multiple functions of agriculture but also multiple uses of the territory. A typical research question in CORC 5 is : what is the best way to organize spatial planning by taking into account the impact that agriculture may have on the attractiveness and sustainability of rural and urban living areas ? CORC 5 is particularly well represented in the Netherlands, where competition between land users is high, but also in Spain. Its main strength is its direct orientation toward an evolution of policy making. Its weakness, as far as research is being concerned, is a lack of conceptual robustness of the definition of multifunctionality.
2.2.6 Adjustment between activity systems and societal demands as a way toward sustainable agriculture and rural development (SARD) regulation
CORC 6 involves authors who seize the emergence of multifunctionality as an opportunity to build a holistic view of agriculture as a way toward sustainable agriculture and rural development, and therefore as a way to re-embed agriculture within society. The arising of multifunctionality in the debate on sustainable development helps to point out what are the specific contributions of agriculture to rural development, including analyses of its role in food supply chains (notably in the Netherlands), of the compatibility between sustainable development with farm competitiveness (notably in Poland), of its importance for the maintenance of rural population in less favored areas (notably in Spain and Switzerland), etc. Scientists belong to very diverse disciplines, but share the common concern of sustainability that goes beyond the analysis of functions and their relationships. The strength of this CORC is its comprehensive ambition making it possible to analyse agriculture globally in the long run. Its main weakness is a lack of analytical firmness in the characterization of agriculture.
2.2.7 A social demand towards agriculture
CORC 7 includes researchers focusing explicitly on the demand side for multifunctionality. The demand side is largely present in each CORC, but generally as a given matter of fact. For researchers in this CORC, multifunctionality is primarily defined by the multiple expectations or requirements of the society toward agriculture. Fundamentally these expectations are the very justification for agriculture to be oriented in a multifunctional way. These authors develop methods to identify and quantify (in terms of the tax payer willingness to pay for example) these social demands and eventually, the ways agriculture might be able to meet them. The methodological stake in this CORC is very high given the lack of reliable and objective information which is available, and given the high controversies on existing methods. The main strength of this CORC is the value of the pursued information for policy makers. For economists, its main weakness is the contradiction between the wide range of information required to evaluate the full non market value of agriculture and the level of precision required for these empirical econometric studies.
2.2.8 Governance, policy and multifunctionality
CORC 8 includes researchers referring to the functions of agriculture explicitly and objectively recognized in legal or official texts underpinning agricultural policies.

SEAMLESS No. 010036 Deliverable number: PD2.3.1 6 February 2006
Page 24 of 100
Researchers here study the existence of multifunctionality in such texts, and the consistency of new official objectives (regarding the promotion of multifunctionality) with the policy measures or the institutional arrangements implemented (in particular in France the CTE, contrat territorial d’exploitation, or territorial farming contract), using expertise most of the time. Other research question are for example : to what extent does multifunctionality modify the principles and modalities of previous farm policies ? To what extent does it constitute a new paradigm or a new guide for agricultural policies (socio-economists , researchers in political sciences, jurists)? The main strength of this CORC is its ability to help judging if political claims are actually converted into real policy reforms and farming practices and to help providing an impact assessment of such policies, and its main weakness is a lack of analysis of the economic rationale of the policy measures.
2.2.9 Potential application for SEAMLESS
The Integrated Project SEAMLESS aims at the generation of an integrated framework with computer models and approaches for ex-ante assessment of alternative agricultural and environmental policy options for sustainable development in Europe. One of the Multagri project outcomes considers that deepening the analysis of the multifunctionality concept can help to make sustainable development more operational (see details in Section 2.4.3).
Multifunctionality is a characteristic of an activity that can have implications for achieving multiple societal goods. Deepening this analysis first stressed on eight concepts of multifunctionality. Obviously, being au EU project, SEAMLESS should focus primarily on the EU concept of multifunctionality. This concept, included in CORC1, relates to the fact that beyond the production of food and fibres (commodity outputs), agriculture provide important social, environmental and economic functions that manifest themselves in products that are up to now non marketable (non commodity outputs).
But designing policy relevant sets of indicators at different scales may very soon require to consider also which multifunctionality concept is actually accurate, at the appropriate scale, to help improving the sustainability of the local/regional/European development.
For example, a local regulator may want to benefit from a precise description of the demand for non commodity outputs from farms in his region. In this case, indicators from CORC7 work may help her to design policies that do not impede the supply of the requested non commodity outputs.
Considering another scale may lead to examine the competition conditions between regions to redirect funds to less-favoured areas. In this case, CORC5 work may provide interesting things because each region may tend to focus only on its own definition of multifunctionality (see Section 3 for an example of such differing definitions).
It is our opinion that taking the Multagri analysis of CORCs further may be of interest for SEAMLESS : beyond the their homogeneity of research questions and concepts used, the CORCs may provide an operational analysis on how the multifunctionality of agriculture can be useful for policy design.
2.3 Strengths and weakness of the multifunctionality concept
The multifunctionality concept has strengths and weaknesses that need to be emphasised.
SEAMLESS No. 010036 Deliverable number: PD2.3.1 6 February 2006
Page 25 of 100
2.3.1 Some strengths of the multifunctionality concept
The normative conception (according to the OECD terminology) of the MFA (the role of agriculture to be promoted) can help the formalization of actual social concerns towards agriculture at national and local levels. It can provide a basis for thinking about issues and problems that the various agricultures and rural areas face, and can serve as an input for the definition of development strategies.
The positive conception (public goods jointly produced) refers to an analytical framework and to the empirical studies used and recognised in the international political debate. Thus this positive conception can help to renew or improve the literature on the economic justifications of public policies towards agriculture and rural development, on the relative efficiency of the various measures and on the different impacts of the trade liberalization process.
But the multifunctionality concept also allows to recognize a broad range of current and potential contributions from agriculture to sustainable rural development, which include positive (what are these contributions ?) as well as normative (do we have to promote them, and how ?) dimensions.
Further, multifunctionality can be understood as a unifying concept expressing the diversity in national societal demands and concerns, with regards to agricultural and rural development. The concepts allows for the recognition of a broad range of current or potential contributions from agriculture to sustainable rural development.
2.3.2 Some weaknesses of the multifunctionality concept
The concept of multifunctionality is not of the same concern everywhere. In some countries like in Spain or in Poland, it seems that it is actually not explicitly taken into consideration neither by the administration, the farmer unions nor the scientists. Nevertheless, as we already noticed, all national contributors signalled a growing interest for the concept within their country.
The credibility of the concept still suffers from the fact that it has been used by some groups for the defense of their own interest. It has been the case first in the WTO negotiations by the “friends of multifunctionality” group, but also later by some farmer union, to support the current CAP. However, this weakness is not relevant nowadays. Indeed, the intensity of the debate on multifunctionality of agriculture within the WTO trade negotiations has fallen. This debate seems now to be more located at national and regional levels, and focuses more on the issue of rural and agricultural development models, than on the impact of the trade liberalization process.
According to the conception and the theoretical approach adopted, the list of functions obtained and the policy recommendations can vary widely.
There is a scarce empirical evidence on the so-called “joint output relationships” between the marketable private output of agriculture and an assorted variety of public goods of societal concerns. In many cases, environmental functions, landscape, biodiversity,- it seems that the existing evidence is purely local, and subjected to many qualifications, related to the type of technology employed, the intensity of land use etc. This means that it is very difficult to build a general case in favour of a positively linear relationship between aggregate farm output and a “composite public good” representative of highly valued non-commercial functions of agriculture, as some political discourses of the “friends of multifunctionality” take frequently for granted.

SEAMLESS No. 010036 Deliverable number: PD2.3.1 6 February 2006
Page 26 of 100
However, multifunctionality is a promising paradigm to analyse the transformation of agriculture and rural areas. Therefore, we suggest that research should detach itself from multifunctionality as a political goal and only consider multifunctionality as an analytical framework. This supposes to determine the basis of this framework and to strengthen them.
2.4 Multifunctionality: a three components analytical framework The conceptions of multifunctionality and the actual concepts or expressions vary within countries, between countries, among scientific communities and depend as well of the structure and respective importance of scientific communities and disciplines at national level. These difference rely on what is supposed to be multifunctional, the expressions used to qualify multifunctionality, the different functions included in multifunctionality, and the functions that need to be promoted.
What is designate as multifunctional : agriculture, holdings, rural areas or forests. In some countries such as France, the debate is mainly focused on multifunctionality of agriculture, but in others the debate is related to the multiple functions of rural areas. For instance in the case of Poland, one important question is how those areas can contribute to absorb flows of workers coming out from agriculture.
The expression used : multifunctionality (or multiple functions), non-commodities output (coming from the OECD analytical framework), identities goods, multiples roles. Moreover, the national debate can be focused on more or less closely related concepts like “integrated agriculture”, “sustainable agriculture”, “reasoned agriculture” (in France), etc.
The functions identified by researchers or experts (positive works). They differ among countries and within countries among territories, and depend as well on the scientific stream the researcher belongs to. The concerns of some countries and regions are for example more related to water management (Netherlands, Spain, Brittany, Bassin Parisien), soil erosion (Spain, south of France), land abandonment (Spain, France), rural development (Poland, Spain, France).
The functions to be promoted (normative works) : the recommendations on what should be the functions of agriculture or rural areas and the way to enhance them can widely differ, depending on the conception, concept and theoretical framework used. The Netherlands report highlights for example the co-existence of two paradigms on agricultural development. On the one hand, the “rural development paradigm” suggests that the integration of traditional and new rural functions at a farm-level is relevant for rural development and society at large and offers a good economic opportunity for farms. On the other hand, the (neo-) modernization paradigm recommends on the contrary a mono-functional development of the sector to safeguard its competitiveness.
As multifunctionality was progressively adopted by research, three issues emerged as focus points for the scientific debates:
• the interrelations between the different functions of agriculture; • the links between agriculture and society; • the relation between multifunctionality and sustainability.
2.4.1 Functions and their interrelations Multagri did not provide an absolute definition of the different functions of agriculture. Nevertheless, our research position can define them as following : a function is the result of a

SEAMLESS No. 010036 Deliverable number: PD2.3.1 6 February 2006
Page 27 of 100
process delivering factual or potential provision of material or immaterial goods. Different functions of agriculture provide economic, environmental and social goods.
Although the OECD approach, based on jointness, appears as the most prominent approach when dealing with interrelations, most of other research works on multifunctionality also consider interrelations between functions. Nevertheless, from one approach to the other, there are strong differences between the functions considered and the way of considering the interrelations linking them.
No list of functions can be considered as absolute, relevancy of functions is highly contextual. Many studies chose to follow the sustainability concept by distinguishing three groups of functions: economic, ecological and social. The identification of functions is generally very static; almost no works deal with their evolution in the past (historical generation, appearance…) nor the potential development (of further functions) in the future. A survey of future functions (and their combinations) of agriculture and rural areas must be carried out.
Acknowledging that a single activity may simultaneously fulfil several functions is trivial. However, if the interrelation between functions is seriously taken into account in analyses, it profoundly challenges the analysis because it is not easy to conceptualise and modelling (for example modelling of jointnes). Links between functions were already partly considered for the analyses of other approach such as "farming systems" which takes into account production function. The difference introduced by multifunctionality is that it places interrelations in the centre of the analysis for different categories of functions. Many types of interrelations are identified, but their intensity is rarely taken into account in studies, although it is the fundamental point to understand linkages. Intensity of the links can be expressed for example by a economic ratio between retail sales and agri-tourism income.
A few research works in for example in economics have been developed to assess functions and their interrelations, but there is clearly a need for more integrative approaches in this field.
2.4.2 Re-embedding agriculture in society In a neo-classical macro-economic perspective, the political implementation of the MFA “vision” and the consequently increasing non commodity outputs (NCOs) production follows basically three paths: In the case of NCOs with private goods character (1), an increased NCO production leads to a more profitable commodity production. This is called a classical win-win situation since economic, social and ecological aspects are not in conflict. As a result of automatic market regulation, no policy intervention is needed. For NCOs with public goods character, characterized by market failure, two mainstream political strategies, police law intervention (2) and compensation payments (3) are in place to decide between conflictive ecological, economic or social targets (Zander et al, 2004). Therefore, the political application of the concept of MFA requires information on the economic value of NCOs, to define efficient production levels for NCOs.
On the one side, production possibilities and costs of NCO production have to be examined at given production circumstances and consumer preferences (supply side). On the other hand monetary consumer preferences are required, to determine the desired levels of NCO production and the level of public funds the society may expend for NCOs (demand side). Both types of information are needed to formulate efficient policies that realise the desired level of NCO production.
Most studies, which consider that interrelations between functions are the fundamental element of multifunctionality often neglect the demand side of material and immaterial goods

SEAMLESS No. 010036 Deliverable number: PD2.3.1 6 February 2006
Page 28 of 100
and concentrate on the supply side of these goods. From an economic point of view in a joint production process it is hard to evaluate the quantity of goods which are brought forward. Is this quantity adequate with the bid? Does there exist any demand? It is all the more difficult to adjust supply to demand that they are not confronted on a market. When this productions' separation is impossible, we have to think about the way to make gains/loses of well-being linked to monetary activities and gains/loses linked at externalities commensurable.
However, as it concerns functions, multifunctionality opens the field to more integrated analyses, in relation with the evolution of wider societal topics. In general it was a change in style of living connected with greater importance of quality of nutrition, increase of leisure time, as well as more interest in environmental quality including rural landscape and its aesthetical and recreational function.
New views on the demand side
In this context, multifunctional agriculture is considered as a consequence of the changing needs and demands of consumers and society at large towards agriculture and rural areas (Cudlinova et al., 2005). Most studies dealing with consumer and societal demand towards agriculture and rural areas address its components separately: demand for quality food production, for environmental, ecological and landscape values, and for social and cultural aspects. However, there are clear correlations between these three aspects of demand. Therefore, some researchers put forward that this demand is likely to be of multidimensional nature, rather than directed to exclusively one aspect of agriculture and rural areas. Some studies are trying to address demands through a multifunctional framework. One example is the "basket of goods" analysis: a group of complementary goods and services that may be seen as strengthening each other on local markets (traditional regional food production, local craftworks, tourism, typical landscapes) are studied jointly. Few research works have been done on that topic.
New views on the supply side
Parallel to the evolution of demand, many farmers have engaged in new activities, through new strategies such as diversification, pluriactivity (Renting et al. 2005). Three directions are distinguished: deepening activities (adding more value to products, with organic farming, high quality products, on-farm processing, short supply chains); broadening activities (development of new activities, such as management of nature and landscape, agri-tourism); re-grounding activities (pluriactivity or cost-reduction through alternative use and valorisation of internal farm resources). Economic driving forces have some importance in these changes, but these approaches have revealed to be inadequate to explain the perseverance and rationale of pluriactivity and diversification. More recent research material emphasizes that agricultural activities are at least partly to be understood as the outcome of non-economic driving forces and motivations. Indeed, there is a sort of reconfiguration of rural identities, through a change of activities of traditional actors or because of new actors (neo-rurals, SMEs). Therefore, the analysis of multifunctionality presupposes the inclusion of a much broader spectrum of organisational forms than the simple dichotomy between professional and non-professional farms. Much work is still needed to be able to assess the contribution of the "non-productive" actors on the environment, landscape, maintenance of rural areas.
New views on the links between agriculture and society
As agriculture is placed within a more global perspective and re-embedded within society, new ways of taking into account the links between agriculture and society are emerging in

SEAMLESS No. 010036 Deliverable number: PD2.3.1 6 February 2006
Page 29 of 100
research studies. Markets and policies, which are classically considered as connecting points between agriculture and society are still relevant and many studies investigate / study their evolution within a context of multifunctional agriculture (Sumelius et al., 2005). However, new approaches are being adopted, notably in terms of networks and institutional arrangements. Media (notably internet) or education systems are the newest issues emerging: their role of communication and exchange between rural and urban society is often underestimated and much research work still has to be done in this area.
Another promising type of approach considers space as the meeting point between agriculture and wider society, making territory a central category. Rural areas are no longer automatically strongholds of farmers but increasingly represent multiple activities in which farming has to co-exist alongside with other land-uses and interests. In the agriculture paradigm focussing on production and efficiency, production is not linked to space (off farm cattle for example). Some approaches of multifunctionality still insufficiently address the role of context, social networks, transformation processes and dynamics in time. Several research works and impact analysis show that in developing a multifunctional activity, as shorts chains, quality foods, agro-tourism, diversification, nature and landscape management, farms build new relations between agriculture and society, city and countryside. This supposes passing from a sectoral (agricultural) perspective to a territorial one towards more integrative approaches (Knickel et al, 2005), permitting to analyse farm or land uses activities in connection with other activities of the territory, as well as their contribution in building new territories that in return become resources. In no way does this exclude the farm-based approach of multifunctionality. Multifunctionality of agriculture and multifunctionality of rural areas are complementary, they allow analysing different levels.
2.4.3 Multifunctionality as a pillar of sustainable development? If the issues of interrelations between functions and links with society are at the heart of multifunctionality, they only take on a true meaning through a third issue that has been in the centre of many debates: does multifunctionality bring insight to sustainable development?
Initially, the Multagri project was based on the hypothesis that for agriculture to be sustainable, its multifunctional dimension must be acknowledged and promoted. However, as we came to differentiate multifunctionality as a goal and multifunctionality as an analytical framework, this hypothesis evolved: “By understanding more about multifunctionality, it will be possible to better address sustainable development”.
The relation between multifunctionality and sustainability is generally considered implicit and is rarely mentioned explicitly by research, often leading to confusion between both terms. In all countries surveyed, there is a notable lack of scientific attention for the specific interrelations between these two concepts. This led us to clarify both terms:
• Sustainability is a normative approach that has to do with society’s wish and ability to preserve current consumption levels. It is a resource-oriented notion: it requires to maintain some aggregate measure of capital (stocks of physical or economic, natural, and social capital, and the possibility of trade-offs between them), in order to fulfil the needs of future generations. Thus, it has a clear temporal dimension.
• Multifunctionality is an activity/outcome-oriented notion that describes characteristics of farm production or outcomes from lands, focusing on relationship. It lacks a direct or immediate temporal dimension. In many research works, it can have a normative acceptation, but we chose to restrict it to an analytical approach.
Can multifunctionality, defined as such, bring some help and input for making development more sustainable? Multagri researchers consider that multifunctionality can provide a useful
SEAMLESS No. 010036 Deliverable number: PD2.3.1 6 February 2006
Page 30 of 100
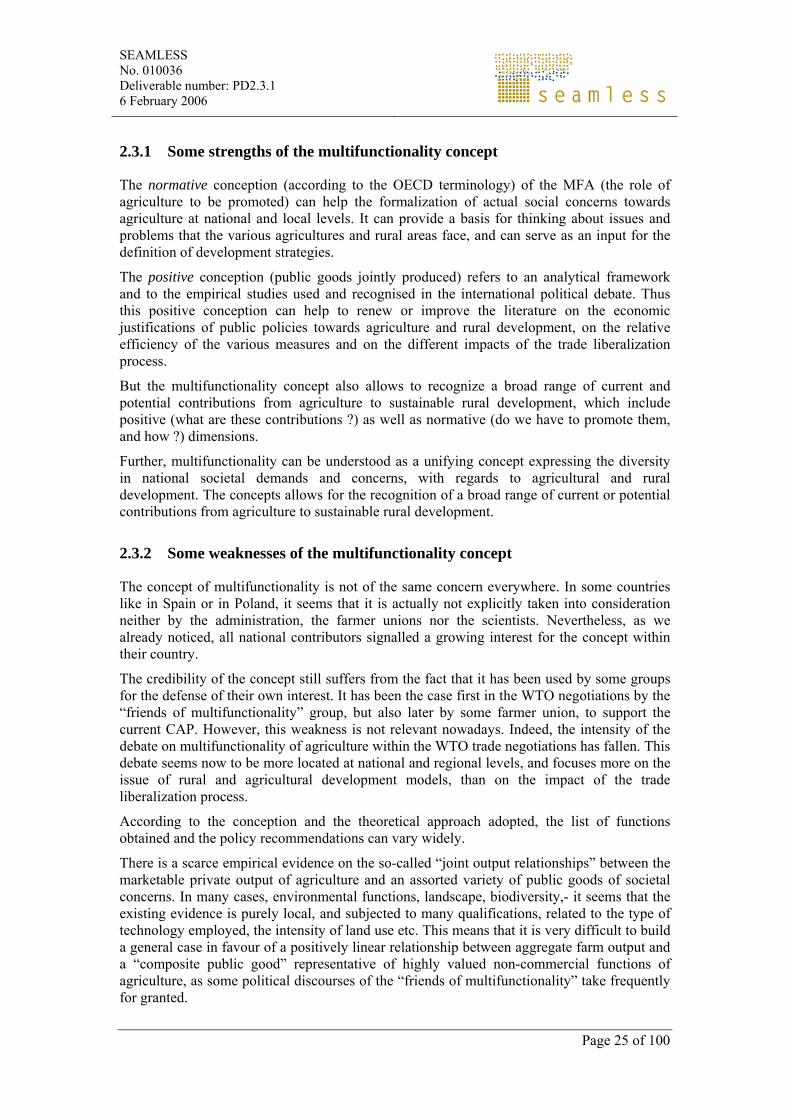
analytical framework that helps to operationalise sustainability, in particular since it is based on activities and functions. This analytical framework based on the ideas of multifunctionality supposes to clearly identify and analyse the functions through activities, their combination and the social demand. As we can see on figure 2 the link between sustainability and multifunctionality is made through the impact activities may have on resources. Attributes of the system included into the functions (for example production, tourism and water conservation at farm level) should help to assess how the combination of attributes can be modified and what could be the impact of the changes a policy can induce within these combinations. But the main contribution lies in the possibility it offers to look at a range of possible changes and at the way of addressing thresholds. In return, sustainability provides the criteria that are needed to make the analytical framework operational. Connecting multifunctionality to sustainability also requires taking into account the time and space dimensions. This could be done by combination of functions in a dynamic perspective.
Figure 2 shows for the analytical concern, the relation between activity and societal demand and their impact on resources. A change for priority from the society can be studied at level of activity and impact. This change provides information for the society, it is the science duty (arrow from impact of resources towards performance with thresholds). If the impact on resources is not convenient,( the policy give this information -normative aspect- arrow from performance with thresholds towards impact of resources), then scientist has to suggest other suitable combinations relevant with social demand.
Figure 2: formalisation of links between multifunctionality and sustainability
With respect to sustainable development goals, the relevant functions have to be assessed with regard to their social, economic and ecological impacts
Is multifunctionality a guaranty towards sustainability? This important question is often asked. With this figure we can understand that multifunctionality does not guaranty sustainability, the combination of functions can be unsustainable if their impacts on resources is negative in regard of criteria defined by society.
Activity (functions, combinations)
impact on resources
societal demand : priority and recognition
performance with thresholds
Multifunctionality Sustainability provides information
(science)
provides objectives and
criteria
(policy)analytical normative
source : Multagri research group

SEAMLESS No. 010036 Deliverable number: PD2.3.1 6 February 2006
Page 31 of 100
The work undertaken in the Multagri project did not bring answers to all the questions raised, maybe because the project arose too soon when the research activities mostly focussed on research questions and definition of concepts. The project stressed that the political definitions of multifunctionality, though of great help for international negotiations and policy objectives definition, is of low interest to achieve sustainable development of the EU agriculture.
On the contrary, the analysis of the combination of the different functions of agriculture, at different scale, is of great help to make sustainable development more operational:
- On the supply side, the main issue concerns the nature and degree of jointness in the production of commodity and non commodity outputs. First, any change in commodity production (market-led or policy driven) is liable to lead a change in the levels of the non commodity outputs that are jointly produced. Early literature reviews suggest that for externalities the degree of jointness may be strong and the consequences of changes in the supply of commodity outputs may have important consequences on the level externalities (Abler, 2001). But the degree of jointness for amenity supply seemed to be weak in this study. Second, the OECD stresses that jointness can create the possibility of cost savings through the joint provision of several outputs compared to their separate provision.
- The demand side considers the evolution of needs and demand of consumers and society. Considering that this demand may have a multidimensional nature could be of interest to consider the potential demand from future generations (but is far over the aims of this report).
2.4.4 Conclusion : Multifunctionality as a framework to study complexity Multifunctionality offers a new way of considering agriculture and rural areas through the interrelations between multiple dimensions, multiple sectors, multiple stakeholders, multiple levels, etc. It places complexity and context within the centre of analysis. The three issues underlined within our state-of-the art (interrelations between functions, place of agriculture within society, relation with sustainable development) could be the components for a future analytical framework as they underline this complexity.


SEAMLESS No. 010036 Deliverable number: PD2.3.1 06 February 2006
3 Overview on existing indicators from Multagri The workpackage 3 of the Multagri project provides a summarizing overview on the tools and methods for examining multifunctionality of agriculture (MFA); it has been elaborated on the basis of a literature review in France, Germany, the Netherlands and Portugal (only for economic valuation in this last country). The integration of the multifunctionality concept into the national policies and its consideration in the official research agendas differs remarkably among these countries. In France, the MFA concept has been legally institutionalised in 1999 (the agricultural orientation law) and accompanied by targeted research efforts in public research units. Agricultural policies changed in Germany due to cabinet reshuffle in 2000, emphasising sustainability and multifunctionality of agricultural land use and orienting political intervention towards more consideration of environmental and rural development related objectives. However, the scientific impetus for research on multifunctionality from this national level was rather low. In the Netherlands, on the other side, multifunctional agriculture has not yet been an explicit policy goal, but the government and especially the ministry of Agriculture gave strong incentives for the scientific development of integrative, multi-dimensional approaches to assess and evaluate the multiple functions of land use for rural and urban populations.
Although the MFA concept is used in many different ways, WP3 chose to restrain its analysis to the most relevant ones for modelling approaches: Taking the viewpoint from the producer of commodity outputs (COs) and non-commodity outputs (NCOs) or the ‘supply side’ view, or from the consumers’ position whose needs and preferences count (and are counted), i.e. the ‘demand side’.
The review of Dutch, French and German scientific literature within the country reports reveals that most indicator concepts have been developed within separate scientific disciplines, frequently related to a sustainability assessment approach. Although some of them can serve as indicators for multifunctionality as well (e.g. when we consider the social, economic and ecological dimension as a field of functions), they have not necessarily the desired orientation and degree of differentiation. Nevertheless, sustainability indicators have been taken into account because of availability. E.g. in the Netherlands and in Germany, indicator sets have been developed and politically applied in order to monitor and evaluate society’s sustainability. However, these approaches describe the MFA only in an indirect way. The comparison shows further that most of the diagnosis tools do not integrate all three domains of agricultural functions. Definitely, the area of social indicators is the least developed in all three countries. There is hence a strong demand to develop valuable social indicators for MFA. Economic and ecological indicators are numerous with a long history, but no general acceptance exists in science about the number, the scope and the spatial dimension of the indicators used. Further research should therefore focus on the linking and integrative validation of existing approaches for the economic and ecological dimension as well as the social dimension. Besides, the problems of aggregation and scaling of indicators are not yet sufficiently solved.
WP3 of the Multagri project has adopted the EU`s understanding of MFA. The term multifunctional agriculture relates to the fact that agriculture beyond the production of food and fibers (= commodities) provides important social, environmental and economic functions to society that manifest themselves in products that are up to now not marketable (= non-commodities). “Exploiting the various functions of agriculture is increasingly seen as an important contribution to achieving sustainable agriculture and rural development” (Barkmann et al. 2004: 6). To support policy decision making, ex ante assessment methods for MFA should, therefore, endeavor to cover the relevant functions of agriculture. Integrated approaches are expected to model economic, ecological and social aspects, in order to

SEAMLESS No. 010036 Deliverable number: PD2.3.1 6 February 2006
Page 34 of 100
examine the jointness of commodity outputs (COs) and non-commodity outputs (NCOs) and to indicate potential supply levels and associated production costs (Zander et al. 2004).
3.1 Indicator systems
There are three basic functions of indicators: to simplify, to quantify and to communicate (European Environmental Agency, 2004). Thus, indicators are tools to reduce the complexity of system descriptions and to integrate complex system information (Giampietro, 1997), so that information can be communicated. Hence, indicators have to be deduced for different systems at diverse spatial and temporal scales. Due to their important role in supporting goal-oriented decision making, indicators necessarily are as dynamic as the developments in society to which political decision-making has to respond (Rossing and Groot, 2004).
Many of the indicators mentioned in the following were conceived as indicators of sustain-ability, not of multifunctionality. They could be used as they – at least in theory – cover the three dimensions society, economy and environment and thus, propose an order for the functions, agriculture potentially provides. However, the sustainability indicators and indica-tor sets have not necessarily the desired orientation and degree of differentiation character-ising multifunctionality of actions. Nevertheless, in WP 3 work, they have been frequently taken into account because of availability.
3.1.1 DPSIR-framework
Indicator sets at a high level of abstraction include the OECD (1993) set that distinguishes indicators for driving forces, states and responses (DSR-frame). This approach was later extended by the European Environmental Agency (NERI 1995) to the DPSIR-model classify-ing driving force, pressure, state, impact and response indicators.
Based on this model, in the Netherlands the people-planet-profit (PPP) approach is used (Serageldin at el. 1994) for describing the three dimensions of agriculture (social-environmental-economic). Considerable attention is given to the PPP-approach among policy makers, entrepreneurs and researchers in The Netherlands (Rossing and Groot (2004)). Equally, indicators in German literature are often classified according to the DPSIR-framework. The three main functions of agriculture correspond to the social, economic and ecological dimension of sustainability.
3.1.2 Characterization of indicators
In Germany in recent years, a multitude of indicator concepts have been developed with the majority referring to sustainability. For example the indicator concepts developed by the Federal Environmental Agency do refer to the whole field of sustainability with it’s multidimensional aspects of ecological, economic and social issues. According to the concept of jointness in production, indicators can be grouped according to landscape or agricultural functions related to commodity outputs (COs) and non-commodity outputs (NCOs) while referring to different scale and aggregation levels (Zander et al. 2004). Specific indicators are characterizing single parts of the system or key functions and processes. State and process indicators are either focusing on stocks and flows or enable monitoring of changes in social behavior. Estimated and analytically deduced indicators, which rely on scientific knowledge, either are formulated by scientists or do result from scientific examination. Many indicators that are in use in Dutch modeling approaches are specific indicators (Rossing and Groot 2004). Another distinction can be made between those indicators that characterize directly the

SEAMLESS No. 010036 Deliverable number: PD2.3.1 6 February 2006
Page 35 of 100
state of the elements and those indicators that are based on a characterization of agricultural practices according to agricultural, environmental and social knowledge. The indicators of the second type, which are linked to the practices and not directly to the state of elements, are the most currently used indicators in France for farm diagnosis tools (Josien et al., 2004).
3.2 Indicators The whole range of indicators for the assessment of the three categories of agriculture economic, environmental and social has been outlined in detail in the country reports of Germany, France (economic, environment/ecology/landscape functions and social) and the Netherlands (profit, planet and people). The following section will therefore provide a comparative overview on the country specific issues for each of the agricultural functions (Zander et al, 2005).
3.2.1 Economic indicators According to the classical economic approach, the economic sustainability of an enterprise is achieved, if the following criteria are fulfilled: liquidity, rentability, stability and investment power (Heissenhuber 2000). In order to quantify these criteria (functions), Heissenhuber (2000) suggests the use of threshold values for a set of nine indicators, which evaluate the monetary performance of farms and characterize their actual and potential chances to survive. Richter et al. (2001) propose an enhanced set of ten indicators to characterize the economic sustainability of agricultural holdings at the regional level. Apart from indicating the farmers’ activities, such as the marketing of NCOs, these indicators provide an insight into the development of the regional agricultural sector in the long term.
The National Dutch Agricultural Economics Institute and the Statistics Bureau provide detailed economic indicators, which can be scaled up to match the RICA FADN data standard of the EU. National policy makers and researchers use these economic indicators. Amongst others, they are calculated in areas such as yearly farm budgets, household budgets, environmental budgets, technical state of the farms, prices and productivity, allocated costs, cash flow data and data in production chains. In recent years, attention has been given to alternative sources of income, originating from multifunctional activities (Rossing and Groot (2004)).
According to the French report economic indicators are provided within the diagnosis tool of “IDEA”. Indicator sets include hereby the main issues of efficiency, transmissibility, independence and viability (Josien et al. 2004).
3.2.2 Environmental indicators Following the Dutch and German reports, indicators and indicator concepts assessing the ecological functions of agriculture are usually divided into abiotic and biotic or biodiversity indicators. In Germany, Tremel and Köhne (2000) introduced a set of 33 environmental indicators for the assessment of the abiotic resources, which refer to crop production and associated aspects. Based on well-founded indicator sets a number of regulations for the conservation of soil, water and atmosphere have been introduced into German legislation. For the assessment of the biotic/biodiversity resources the various approaches proposed by German scientists comprise indicators, such as the abundance of single species, the diversity of species and biocoenosis, the spatio-temporal pattern of habitats, structural and functional aspects of diversity as well as genetic diversity. Roedenbeck (2004) evaluates a number of German modelling tools on the basis of their ability to quantify indicators representing environmental problems as stated in German literature. Roedenbeck thus uses negative externalities to define sustainability of farming systems.

SEAMLESS No. 010036 Deliverable number: PD2.3.1 6 February 2006
Page 36 of 100
The Dutch report distinguishes indicators from various disciplines or policy domains at various scales. There is a plethora of planet indicators compiled yearly by state organizations filling lists with 450 indicators for environment and 300 for nature and landscape. In several government-funded projects at farm scale, thematic indicators have been developed related to resource use in agriculture (e.g. water, pesticides, nutrients) or related to nature conservation benefits and landscape quality. Finally, there are a number of indicators as part of business certification schemes, ranging from the Eurep-gap standard to the IFOAM, Demeter or Skal standards of organic farming (Rossing and Groot, 2004).
According to the French report, the “agri-eco/Indigo” method is mainly based on indicators, which characterize relations between agriculture and environment. Indicator sets are arranged in an evaluation matrix with the agricultural practices in vertical columns and environmental stakes raised by society according to current knowledge in horizontal disposition. This matrix constructs thus two types of indicators: Firstly the Agro-Ecological Indicators (AEI) including management of production factors such as pesticides, water, energy, etc. as well as spatial planning factors and secondly Indicators of Environmental Impact (IEI) dealing mainly with water, air, soil, non renewable resources, fauna/flora and landscapes issues.
3.2.3 Social indicators According to the Dutch report the development of social indicators for sustainable development is at a very early stage, ranging from simple education issues to complex issues on human rights, transparency, trust and conflict (Slingerland et al. 2003). The Dutch Social and Cultural Planning Office (SCP) distinguishes five elements that describe people’s “quality of existence”. To monitor this quality, an index was developed combining indicators within the themes of health, housing, possession of assets, mobility, leisure activities, social participation, sport and holiday. This index is used for the SCP’s regular evaluation of the social state of the country and provides a basis for translation to rural areas (Rossing and Groot, 2004).
Müller and Kächele (2000) propose an approach to quantify the social function of sustainability of agricultural holdings on the basis of categories like employment, possibility of self-expression and social acceptance. In this context the degree of sustainability is an indirect indicator for multifunctionality (Zander et al. 2004).
From France only one example for a social indicator is reported from the farm diagnosis tools of “IDEA”. Ethics and human development, employment and services, quality of products and landscapes represent socio-territorial categories of indicators (Josien et al. 2004).
3.2.4 Conclusions Citing the German report, the most important indicators are those for the evaluation of sustainability of specific farms with respect to the economic domain of agriculture. Only few publications discuss social indicators while the majority uses economic indicators instead to characterize agriculture production. In contrast, ecological indicators are numerous and are discussed mainly in the context of the sustainability concept. Some of the ecological sustainability indicators of agriculture have already been introduced into the German legislation. German research literature on agro-environmental indicators shows in this context a rather specific focus on the landscape approach (Zander et al. 2004).
Among the PPP-indicators of sustainable development in the Netherlands, the social domain is recognised to be the least developed. Subsequently more attention initiated by various Ministries has been paid to this field in recent years. Many profit indicators have a long history. Although the monetarisation of externalities was not very successfully performed in the past, the valuation of non-commodity outputs is recently coming up in Dutch literature.

SEAMLESS No. 010036 Deliverable number: PD2.3.1 6 February 2006
Page 37 of 100
The approaches involved seem at least partially contested. Planet indicators are the most plentiful. Among these, abiotic indicators appear to be more often used in policy than the biotic indicators. Since biotic issues have an impact across scales, new approaches should account for the linking effects of (agricultural) land use to biotic and landscape indicators as well as the aggregation of indicators across spatial scales (Rossing and Groot, 2004).
The analysis of diagnosis tools at farm level in the French report shows that their underlying indicator sets within the technical and economic domain have the longest history. Environmental indicators concerning water pollution are numerous and their application increases, favoured by regulations, breeding norms, etc. Environmental indictors concerning biotic factors are less developed. The evaluation of the social functions of agriculture is a domain, which is the least developed (Josien et al. 2004).
Only acknowledged by the German report, a holistic concept of landscape functions is provided, delivering an indicator set covering all the agricultural functions for the assessment of MFA (Bastian and Röder 2002), which is by now not yet fully consistent (Zander et al. 2004). Only the concept of landscape functions directly refers to the value discussion from the planning perspective.


SEAMLESS No. 010036 Deliverable number: PD2.3.1 06 February 2006
4 Method to identify indicators for SEAMLESS The Multagri work dealing with indicators allowed us to present an overview of existing indicators sets, the different types of indicators, and the indicators available for each domain . We will now assess their relevance for SEAMLESS, through three steps
• First, we will make a list of indicators by categories (point 3.2), • Second, we will devise a grid for helping the selection of relevant indicators, • Third, we will identify the relevant geographical level for each indicator.
4.1 The list of indicators in relation with the different domains The annexe 1 presents the list of indicators in relation with the different domains. Multagri indicators of domains is focused on agricultural or landscape functions. Our selection targeted indicators with close connection to agriculture. For example, indicators of housing pressure were not considered.
These domains (categories) are organized as following:
• economic: indicators that relate to activities that diversify the income base of the farm,
• social indicators that relate to the links between the farm and the surrounding society, • environmental indicators that relate to the pressure on environment and landscape,
that is, positive or negative externalities.
Within each domains different categories (for example services in economic indicators) have been also identified, based on frameworks of WP3 national reports of Multagri.
Only the indicators mentioned explicitly in the Multagri reports were taken into account. Some indicators related to models are used, but these models generally are presented as black boxes and it would be necessary to use the model to sort out indicators. Concerning the names of indicators, they come from the original national reports. For some indicators, the units were indicated with the name of indicator but in some cases they are not mentioned. Some indicators can be used to characterize several categories, such as N-Balance surplus, which is used for water conservation and biodiversity.
As it has been mentioned in the WP3 Comparative report of Multagri, environmental indicators are the most numerous.
4.2 Selection grid for indicators for SEAMLESS In Multagri, WP3 suggested an evaluative framework, which was applied in order to systematise and compare the relevant tools and modelling approaches and how they deal with multifunctionality. By running each model through a list of criteria, this analytical frame helped to identify the key elements of each of them, its limitations and its current level of application. We inspired ourselves from this frame to devise a grid for indicators. Its main elements are:
• the goal of the indicators • the validation procedure of the indicators • intended user groups • origin of data • development process of the indicator • integration in an evaluation process of Multifunctionality • links with models

SEAMLESS No. 010036 Deliverable number: PD2.3.1 6 February 2006
Page 40 of 100
The annex 2 presents the indicators and their characteristics in a SEAMLESS perspective (through the evaluative framework). All the empty cells mean that Multagri does not provide the information.
4.2.1 Goal of the indicators
The indicators have three basic aims: to simplify, to quantify and to communicate (European Environmental Agency, 2004). Thus, indicators are tools to reduce the complexity of system descriptions and to integrate complex system information (Giampietro, 1997) so that information can be communicated.
Criteria for SEAMLESS
Simplification, quantification and communicability principles also apply to indicators of multifunctionality. These three criteria can be retained to appreciate the goal of the indicators of multifunctionality for SEAMLESS.
4.2.2 Validation of the indicators
Two characteristics refer to the evaluation of the indicators in terms of performance and efficiency. Indeed, these indicators must be valid, a topic which is emphasised in the literature but far less developed than for models validation. In the French report, the approach of validation of an indicator is referred to, worked out by Bockstaeller and Giradin and it rests on 3 dimensions: its scientific bases, the intensity of its relationship to reality, and its feasibility. This can be translated through:
- its performance, calculated by the distance between reality and the calculated situation;
- its efficiency, appreciated in term of quality of the observation calculated in connection with the information used.
Criteria for SEAMLESS
the reliability of the results obtained by SEAMLESS-IF at lower cost (the least information possible for its operation) requires to know the performance and the efficiency of the indicators used. Of course the best situation is to choose the indicators, which have the best performance and best efficiency.
4.2.3 Intended user groups
The notion of multifunctionality is used in several countries. Different stakeholders are involved in developing ideas around the future of their national agriculture or the European agriculture. That means that the MF indicators should answer to divergent and convergent requests, coming from the political decision makers, the administrations, the agricultural technicians, the scientists, the environmentalists, the teachers... and from the farmers themselves.
Criteria for SEAMLESS
Flexibility to meet the requirements of user groups with different scales.

SEAMLESS No. 010036 Deliverable number: PD2.3.1 6 February 2006
Page 41 of 100
4.2.4 Origin of data
The identified indicators are based on information of very diverse origins. Indeed, this information can come from the farmer himself (data of a functional unit or a system such as the field, farm, site...), from European and national data bases ( FADN, etc.), from evaluation process of from outputs of models.
For convenience reasons, we retain 3 different origins: statistics (permanent data bases), model outputs and stakeholder values.
Criteria for SEAMLESS
the use of statistics might be limited in the provision of indicators. SEAMLESS-IF offers a modelling tool providing policy relevant outcomes that are largely based on model outputs.
4.2.5 Development process of the indicators
WP3 national reports of Multagri emphasize two distinct processes for developing indicators:
- indicators which correspond only to a description: descriptive indicators or state indicators :
Stake Indicator
Biodiversity numbers individuals met of an animal or vegetable species specific on a given surface
Quality of ground water nitrate concentration (mg/l)
Note that generally physical thresholds for indicators correspond to social acceptable norms.
- indicators based on the concept of causality : analytical indicators Thus while being interested in the same stakes, we can have the following indicators: Stake Indicator
Biodiversity - Surface of meadow of more than 5 years and receiving less than 40 kg of Nitrogen mineral and organic per hectare and per year
- Surfaces of meadow of more than 5 years whose first mowing is unrolled after a certain date
Quality of ground water apparent assessment of nitrogen at the scale of the exploitation, on average by hectare (kg N/ha)
Descriptive indicators can be estimated. These estimations are carried out by the scientists themselves, taking into account their knowledge or through statements of external experts in most of cases. The benefit is the speed of the evaluation of the indicators. But this expert method does not allow much transparency or transferability. Transparency and transferability are obtained with indicators establish by analytical deduction (the analytical indicators above) but the method is heavy (increased need for information) and slow (complete system analysis).
In our framework indicators will be characterised by these two items: descriptive indicators or analytical indicators.

SEAMLESS No. 010036 Deliverable number: PD2.3.1 6 February 2006
Page 42 of 100
Criteria for SEAMLESS
Owing to the fact that SEAMLESS-IF must be interested in the impact of the European policies with various geographical fields, the selected indicators should be of the analytical type.
4.2.6 Integration in an evaluation process of multifunctionality
The indicators of multifunctionality can be established within an evaluation process, either "ex post" or "ex ante".
Criteria for SEAMLESS
In our framework, indicators for SEAMLESS are only concerned by "ex ante" evaluations.
4.2.7 Links with models
WP3 national reports of the Multagri project present various models used to forecast the impact of agricultural policies on the environment and its economical consequences at different scales (farm, territory). These models can use an indicator as an input and produce integrated indicators as outputs. For linking different kind of models (specific in term of topics and scale) it must be possible that the output indicators can be used as input indicators for other models. Concerning models, their outputs can be synthetic such as the ratio between supply and demand of recreational area in the AVANAR model (DeVries et al., 2003), or specific such as arable area in several models using linear programming.
Criteria for SEAMLESS
For the moment, as our knowledge of models used in SEAMLESS is limited, we are not able to define what indicators would allow to connect models.
4.2.8 Conclusion
In the literature analysed through the Multagri project no indicators of multifunctionality were mentioned. So it is quite difficult to validate this grid. Nevertheless this grid allows to identify in each domain, indicators as proxies of multifunctionality which influence the selection of indicators for SEAMLESS. As showed in annex 2, we have assessed the different indicators identified in the Multagri project with this grid. However, as much information was still missing, we do not see this procedure as an eliminative one, but as a suggestion for future work and assessment of indicators of multifunctionality for SEAMLESS.
To take this study further, we may develop indicators sets to describe the way the different function of agriculture are considered (or not) and how they can improve sustainability. In that sense, indicators of multifunctionality stricto sensu may be of no help for SEAMLESS, unless for the cases when the policies are designed to improve sustainability through multifunctionality.
Recent work, like Wiggering et al. (forthcoming), provide promising analysis of the jointness of commodity and non commodity outputs supply and insights on how to match the demand and supply sides.

SEAMLESS No. 010036 Deliverable number: PD2.3.1 6 February 2006
Page 43 of 100
4.3 Geographical-level of relevancy of indicators for SEAMLESS In the previous part, we proposed a grid for selecting the indicators the European Multagri research project for their use in SEAMLESS.
One of the main objective of SEAMLESS is to link various levels of scale with bottom up approaches (consequences of changes at farming systems level for upper scales) and top down (consequences of European policies through lower hierarchical scales). To facilitate the use of the indicators suggested for multifunctionality, we will now try to assess the level at which they are valid and most relevant.
The geographical levels of indicators are presented in annex 3
It is specified that the basic level for the analysis of decision-making is the farm (with the definition of exploitation-types). The analyses can be based on a level lower as for example the level "field" but this level does not correspond to a level of restitution. The higher levels include the national level (and with beyond) and the regional level, such as NUTS2 (Nomenclature of Statistical Territorial Units) or a territorial entity with specific environmental stakes (landscape unit, water catchment area...) or grouped farms. The European level has not been taken into account by a lack of reference in Multagri. MFA indicators at this level must be debated.
The WP3 national reports and synthesis report of Multagri refer to various levels of scale in the definitions of the indicators of agricultural multifunctionality. As it is mentioned in the state of the art, the diagnosis tool performs from the field to the national level while passing by the farm and the regional level. The majority of the French tools are focused on the scales "field" and "farm". The Dutch tools work at higher scales and especially at national ones.
Taking into account the levels of scales retained for the validity of SEAMLESS-IF and noted for the validity of the instruments of diagnoses presented in the Multagri project, three levels were used to specify the level of validity of indicators: the farm level, the intermediate level and the regional levels (NUTS2) (and sometimes also the national level).
4.3.1 At farm level
The farm is the basic unit for the decision-making for the integrated framework SEAMLESS-IF even if inferior units (field, animals) can be taken into account to make the models work.
With regards to the description of the multifunctionality, the farm is also the basic level since it corresponds to the level of decision for the setting up of the economic, environmental and social functions of agriculture. Thus in the comparative report produced by WP3 of Multagri, tools are mentioned for economic, environmental and social diagnoses to optimise the performances at farm scale. Moreover these tools can be used for monitoring the setting-up of the CAP and its second pillar.
Certain models are interesting at a lower level such as the field for the appreciation of the environmental impact (ex.: impact of husbandries). This appeciation can be made on the farm by gathering all the information known on this higher level of observation. The impact appreciated is articulated with the level to which the agricultural practices (and in particular cultures) are selected and carried. It should also be noted that certain tools for higher levels are based on typologies using the farm level.
The authors of the French report underline that these instruments of diagnoses of the farms can be used at the regional level to communicate the impact of the farmers activities to the farmers themselves. .

SEAMLESS No. 010036 Deliverable number: PD2.3.1 6 February 2006
Page 44 of 100
Much information is available at this level because the farm level is considered as a basic economic unit, is submitted to a regular census in the various countries of the European Community (agricultural Census and FADN).
4.3.2 At intermediate level (landscape, watershed, territory….)
SEAMLESS must take into account the sustainable development of territorial entities, where environmental, economic or social stakes are particular. The landscape and/or the quality of water (catchment area) as environmental stakes are pointed out. Concerning the social stakes, one could be interested in employment and the analysis could even be done at the level of a group of employers.
With regard to the multifunctionnality, the state of the art presents various tools, such as POLEN (Flichman G.,1997) and AgriBMPWater (Laplana et al., 2005, Turpin et al., 2005), which combines the agro-ecological models with economic models to define the best practices of management at this level. The outputs of these models can be used as input indicators for others models.
As it was mentioned above, diagnosis tools at farm levels can be used to communicate the impacts of their activities at upper scales.
4.3.3 At regional level
The regional level (and also national level) is registered in SEAMLESS as an intermediate level before reaching the global level in terms of sustainable development.
The comparative report of the WP3 Multagri project mentioned various tools for ex ante and ex post policies assessment whose interpretation is done at the regional level (NUTS2) or on a higher level (national). Most of these tools are Dutch or German because in these countries the debate on MFA is more focused on multifunctional land use. A number of major indicators sets and modelling approaches are devised for this level. Most indicators sets are related to the abiotic environment, but some also measure the biotic environment. Some models perform explorations of relations between the spatial structure of land use and biodiversity and produce output indicators on the previous topics. Some studies explore multi-objective consequences of changes in land use with a long time horizon (20-30 years) to inform debate on policy options for alleviating prevailing problems of unsustainability.
4.3.4 Conclusion on indicators for different scales
At each scale level, there are various indicators available for each domain, environmental and social. However, the indicators to express these domains have very different characteristics from one level to another. This leads to the problem of the linking between scales or scaling up and down. In the literature there is not much help given. One possibility is to identify indicators, which can be used at higher and lower levels through aggregation or similar calculation process. The table constructed in annex 3 gives some perspectives on the possibilities for using the same indicator at different levels. However, the reflection must be pushed much further in order to allow a true up- or down-scaling.

SEAMLESS No. 010036 Deliverable number: PD2.3.1 6 February 2006
Page 45 of 100
5 Indicators of Multagri for SEAMLESS: contributions and lacks?
However, as mentioned in the beginning of this report, Multagri also devised an analytical framework for multifunctionality (Cairol et al., 2005). This brings new insight on the available indicators and questions their relevance for multifunctionality. Referring to this analytical framework, a few conclusions have been made with respect to the limits of indicator systems for multifunctionality. These reflections put indicator systems within larger issues and models to address these issues.
Few indicators for the social and institutional domains
The Multagri project has shown that there is a lack of indicators to describe some domains, such as the social domains. According to the authors of these national reports, this lack originate from the fact that social aspects of SD was taken into consideration at a late stage compared to the economic and environmental As requested by SEAMLESS, the Multagri project has not found in the state of the art any reference as regards to institutional indicators.
No true indicator system for multifunctionality
These same national reports underline the difficulty in finding synthetic indicators to really describe the multifunctionality of agriculture. Multifunctionality is presented in a separate way, through the juxtaposition of the domains and their indicators. This is attributed to the fact that indicator sets have been developed in an independent way without any strong link to the MF-concept. Many of the indicators surveyed were conceived as indicators of sustainability, not as indicators of MF. They could be used as they – at least in theory – cover the three domains and thus, offer a classification for the functions that agriculture potentially provides. However, the sustainability indicators do not necessarily have the desired orientation and degree of differentiation to characterise multifunctionality of activities. At the moment no guidelines for designing indicators of multifunctionality exist with few exceptions, like indicators for landscape functions (Bastian and Röder 2002).
Difficulties to aggregate indicators
Moreover, for all indicator systems, the issue of aggregation of different indicators is a problem. The number of indicators used can rapidly be very high, and consequently, it can be very difficult to use them for synthetic information. Hence the question of simplifying this information is put on the table. Aggregation is even more critical with multifunctionality because different types of dimensions exist, with different measurement systems. One option often chosen is to evaluate indicators monetarily, so as to transform analytical data into one unique value. Other methods summarize multifunctionality into three criteria: agro-ecological, social, economic and compare dimensions with graphs. In other methods, this aggregation focuses on objectives, such as the contribution to landscape, which includes ecological information (presence of hedges or of isolated trees), cultural information (architecture of farms), and visual information (colours of agricultural areas in each season).
Contribution of models for analysing interrelations
Considering the difficulty to combine functions through indicators, models could be more appropriate to understand interrelations. However, few existing models deal with several functions at once. The models examined tackle a limited number of functions, mainly due to their development for specific purposes. This lack is due to the weakness of research on interrelations (technical, biological, social and institutional jointness) between functions, rarely specified and analysed.. Cross modelling between disciplines is at its beginning. If

SEAMLESS No. 010036 Deliverable number: PD2.3.1 6 February 2006
Page 46 of 100
economic functions and environmental functions are linked in models, few of them are linked with social functions.
Models for replacing agriculture within society
No indicators have been designed in that perspective, but models exist witch can express some links. Models reflecting the links between agriculture and society need to take into account at the same time the producer and the consumer (if we are in economics) or citizens, farmers and other stakeholders (in a sociologist perspective).
Macro-economic approaches tend to analyse demand and supply of commodities with the help of modelling approaches like general equilibrium models, which are able to analyse the interdependencies of different sectors with respect to their commodity production and related resource usage. However, these models in general do not include non-commodities, which hinder them to take site specific ecological functions but also community dependent social interdependencies into account.
One group of micro-economic farm level modelling approaches based on programming techniques - the so-called bio-economic models1 - integrate information or models analysing the ecological functions of agriculture( Zander, Karpinski, et al. 2005). Only few approaches tried to include demand information (mostly as external variables).
More in line with the demand form models, reflecting links between agriculture and society, are interactive Multi-agent models, combining citizens, farmers and stakeholders reactions. Some models have been crossed with cellular automats and/or GIS to simulate the evolution of land use. They can be used to compare scenarios with role plays implying different actors. This can facilitate exchanges in a participative process. However, these models are at the beginning and existing studies are concentrated on a limited geographical area. It is still to prove that these approaches can be applied also at larger spatial units (Zander, Karpinski, et al. 2005).
Linking activities and resources to relate multifunctionality and sustainability
Very few indicators of multifunctionality have been identified in research works in relation to activities. Most indicators are indicators of impacts, which are close to indicators of sustainability. Developing such indicators is indeed useful in order to follow the state of resources, but in practice they often reveal to be un-operational since this is done without link to activities. Connecting indicators with activities could allow understanding in a more realistic way the keys to sustainable development, thus enabling a better monitoring of the system. However, few research works have been carried out with this perspective. In Germany, “Kraichgau” and MODAM (Zander, P., and al. 2004) attempt to combine the farm economic approach with environmental issues, i.e. on impact of resources. Kraichgau allows studying nature development areas and includes like MODAM multifunctionality indicators
1 “bio” refers to biophysical models, which can be process based, dynamic models or simple expert
based rules.
SEAMLESS No. 010036 Deliverable number: PD2.3.1 6 February 2006
Page 47 of 100
as a restriction or side effect, where MODAM tries to cover all relevant areas of ecological sustainability based on simple fuzzy evaluation modules analysing production practices.

SEAMLESS No. 010036 Deliverable number: PD2.3.1 06 February 2006
6 A need for further work on indicator systems for multifunctionality
As we have showed in this report, the national reports from WP3 of the Multagri project clarify various indicators for the three main domains attributed to agriculture. Basing ourselves on the indicators identified, we were able give directions for their assessment for SEAMLESS purposes. Valid indicators appear for each geographical scale, but the link between these scales is still a burning issue. Indicators of multifunctionality sensu stricto do not exist for the moment because a clear definition of the concept has not been done. Up until now, indicators cover the different domains of agriculture in a separate way, because they are inspired by SD indicators. For our part, we suggest a clarification, which will permit to build indicators of multifunctionality, which will be different from those of sustainability.
Because Multagri focussed on the analysis on the functions and their interrelations, this project did not provide any specific indicators on multifunctionality, nor on jointness of commodity and non commodity outputs supply. We propose to take this study further in two directions :
- Some new projects (too recent to have been taken into account by the Multagri survey) are currently developing sets of indicators, which are really specific of multifunctionality. These could be suitable for SEAMLESS when the policies to be analysed are designed to improve sustainability through multifunctionality, but its relevance might depend on the scale of the analysis.
- Recent work, like Wiggering et al. (forthcoming), provide promising analysis of the jointness of commodity and non commodity outputs supply and insights on how to match the demand and supply sides. Developing clusters of indicators, or aggregated indicators that consider explicitly jointness opens promising paths towards the assessment of policy options.


SEAMLESS No. 010036 Deliverable number: PD2.3.1 06 February 2006
References
Multagri reports
Caron P., Aumand A, Barthélemy D, ,Hadyńska A., Hediger W.,Le Cotty T., Roep D., Oostindie H., Reig E., Sabourin E., (2005). MultAgri : Concept Oriented Research Clusters: application to the multifonctionnality concept.
Cairol, D; Coudel E; et al. (2005) Multifunctionality of agriculture and rural areas: From trade negotiations to contributing to sustainable development. New challenges for research. Multagri synthesis report (www.multagri.net). CEMAGREF, September 2005.
Cudlinova et al. (2005). Multagri: Summary Report of Consumer and Societal Demands for multifunctionality based on Three Different Secondary Case Studies Aimed at Different Functions of MFA. WP2 summary report, ILE, Czech Republic, 2005.
Flichman G. (1997). Bio-economic models integrating agronomic, environmental and economic issues with agricultural use of water Options Méditerranéennes, Sér. A /n"31, 1997 Séminaires Méditerranéens.
Josien ,E. Léger, F. Rambonilaza, M., (2004). MultAgri: Knowledge, models, techniques and tools that help to explain and forecast multifunctionality of agriculture. WP3 Country report France; Cemagref, INA-PG, France; 2004
Knickel, KH. et al. (2005). Multagri: Evaluation of policies with respect to multifunctionality of agriculture; observation tools and support for policy formulation and evaluation: WP6 summary report, IfLS, Germany, 2005.
Renting et al. (2005) Multifunctionality of activities, plurality of identities and new institutional arrangements. WP4 synthesis report, WUR, the Netherlands, 2005.
Rossing, W.A.H., Groot, J.C.J. (2004). MultAgri: Knowledge, models, techniques and tools that help to explain and forecast multifunctionality of agriculture. WP3 Country report The Netherlands; Biological Farming Systems Group, Wageningen University, 2004
Sumelius, J. et al. (2005). Multagri: Comparative analysis of studies on setting up and management of policies for multifunctionality. WP5 country report, Helsinki University, 2005.
Zander, P., Meyer, B., Michel, B., Karpinski, I., Uthes, S., Reinhardt, F-.J. (2004). MultAgri: Knowledge, models, techniques and tools that help to explain and forecast multifunctionality of agriculture. WP3 Country report MultAgri /WP3, UFZ Leipzig; ZALF, Müncheberg; 2004
Zander, P; Karpinski, I; et al. (2005). MultAgri: Knowledge, models, techniques and tools that help to explain and forecast multifunctionality of agriculture. WP3 Comparative Report, ZALF, 2005.
Other references
Abler D., 2001, Multifunctionality: the question of jointness: applying the OECD framework - a review of literature in the United States, OECD, 25 p.

SEAMLESS No. 010036 Deliverable number: PD2.3.1 6 February 2006
Page 52 of 100
Barkmann, J., K. Helming, K. Müller, and H. Wiggering (2004): MultiLand - Multifunctional Landscapes: towards an analytical framework for sustainability assessment of agriculture and forestry in Europe. European Commission, Fifth Framework Programme 1998-2002, Thematic Programme: Environment and Sustainable Development, Final Report Section 6, Scientific Report, EVK2-CT-2002-800023 ed. Müncheberg: Leibniz Centre for Agricultural Landscape and Land Use Research e.V. (ZALF). 1-96 p.
Bastian, O. and Röder, M. (2002): Landscape functions and natural potentials. In: Bastian, O. and Steinhardt, U. (eds.): Development and Perspectives of Landscape Ecology: 213-230
De Vries, S., M. Hoogerwerf, W.J. de Regt, (2003). Description of sensitivity analysis for the recreation model AVANAR. Natuurplanbureau, Wageningen, 65 pp. Work document 2002/18. (in Dutch)
European Environmental Agency (2004): An inventory of biodiversity indicators in Europe. Technical report no. 92. Luxembourg: Office of Official Publicaions of the European Communities. 42pp.
Heissenhuber, (2000): Nachhaltige Landbewirtschaftung – Anforderungen und Kriterien aus wirtschaftlicher Sicht. [Sustainable agriculture – requirements and criteria from economic perspective]. In: VDLUFA, 2000: Kongressband 2000 Stuttgart Hohenheim Generalthema „Nachhaltige Landwirtschaft“. Sept. 2000.
Josien, E. (2004): MFA assessment and indicators in France. Presentation at the 2nd WP3 workshop of MultAgri. October 2004, ZALF, Müncheberg
Laplana, R., Turpin, N., Bärlund, I., Bioteau, T., Birgand, F., Bontems, P., Bordenave, P., Eklo, O.M., Feichtiger, F., Garnier, M., Haverkamp, R., Kaljonen, M., Leone, A., Lescot, J.M., Lo Porto, A., Piet, L., Ripa, M.N., Romstad, E., Rotillon, G., Strauss, P., Tattari, S., Zahm, F. - 2004. Guidelines to compare best management practices at watershed scale: concepts, methods, demonstration, implementation. 35 p.
Müller, KM. and H. Kächele (2000): Nachhaltige Landbewirtschaftung – Anforderungen und Kriterien aus sozialer Sicht. [Sustainable agriculture – requirements and criteria from a social perspective]. In: VDLUFA, 2000: Kongressband 2000 Stuttgart Hohenheim Generalthema „Nachhaltige Landwirtschaft“. Sept. 2000.
NERI (1995): Recommendations on Integrated Environmental Assessment, EEA/061/95, Copenhagen, 77 pp.
OECD (1993): OECD core set of indicators for environmental performance reviews. OECD Environment Directorate Monographs no. 83.
OECD (2000). “Production, externality and public good aspects of multifunctionality : introduction". 16 February 2000. ( COM/AGR/APM/TD/WP(00)3/PART1). Paris : OCDE, 12 p.
Richter, Toralf.; Andreas. Bosshard; Priska. Müller; Siegfried. Hartnagel Januar (2001): SAGRI ALP - Nachhaltige landwirtschaftliche Nutzung in europäischen Alpenregionen. [Sustainable land use in European mountain area of the Alpes]. Projekt Abschlussbericht.
Roedenbeck, I. (2004): Bewertungskonzepte für eine nachhaltige und umweltverträgliche Landwirtschaft – Fünf Verfahren im Vergleich. [Valuation concepts for a sustainable and ecological agriculture – five procedures in comparison.] BIOGUM-Forschungsbericht FG Landwirtschaft, Nr.8.
Roedenbeck, I. (2004): Bewertungskonzepte für eine nachhaltige und umweltverträgliche Landwirtschaft – Fünf Verfahren im Vergleich. [Valuation concepts for a sustainable and

SEAMLESS No. 010036 Deliverable number: PD2.3.1 6 February 2006
Page 53 of 100
ecological agriculture – five procedures in comparison.] BIOGUM-Forschungsbericht FG Landwirtschaft, Nr.8.
Serageldin, I., A. Steer, M.M. Cernea, J.A. Dixon, E. Lutz (Eds.), (1994): Making development sustainable: from concepts to action. The World Bank, Washington D.C., 40pp.
Slingerland, M.A., J.A. Klijn (Eds.), R.H.G. Jongman and J.W. van der Schans, (2003): The unifying power of sustainable development. Towards balanced choices between People, Planet and Profit in agricultural production chains and rural land use: the role of science. WUR-report Sustainable Development, Wageningen University, Wageningen. 94pp.
Tremel, S. and Köhne, M. (2000): Ökonomische Analyse von Ackerbausystemen und deren ökologische Beurteilung anhand von Umweltindikatoren. In: Steinmann, H.-H. and Gerowitt, B. (Hrsg.): Ackerbau in der Kulturlandschaft – Funktionen und Leistungen: 213-267.
Turpin, N., Bontems, P., Rotillon, G., Barlund, I., Kaljonen, M., Tattari, S., Feichtinger, F., Strauss, P., Haverkamp, R., Garnier, M., Porto, A. L., Benigni G., Leone, A., Ripa M.N., Eklo O.M., Romstad E., Bordenave, P., Bioteau, T., Birgand, F., Laplana, R., Lescot, J.-M., Piet, L., and Zahm, F., 2005, AgriBMPWater: systems approach to environmentally acceptable farming, Environmental Modelling and Software, 20/2 (Policies and Tools for Sustainable Water Management in the European Union - Edited by R.A. Letcher and C. Giupponi), 187-196.
Wiggering H., Dalchow C., Glemnitz M., Helming K., Müller K., Schultz A., Stachow U., Zander P., Indicators for multifunctional land use--Linking socio-economic requirements with landscape potentials, Ecological Indicators, vol. In Press, Corrected Proof.


SEAMLESS No. 010036 Deliverable number: PD2.3.1 06 February 2006
Appendices
Annex n° 1 : list of indicators which can be used for multifunctionality
Economic indicators
Categories of indicators
Name of indicator WP3 country report
Quality of foodstuffs produced (IDEA method) France Quality of products (healthy food, food safety, …) Product quality Germany
Possibilities for the marketing of regional products in the region
Germany
Regional marketing structures Germany
Diversity of products
Production of regional specialities Germany
Non farming activities (income derived from diversification)
Short trade (IDEA method) France
Supply of agro-tourist activities as alternative source of income
Germany
Number of services supplied by the farm : local services (maintaining paths, clearing sow, ….)
France
Agri-tourism, pedagogical farms, social insertion France
Services
Commercial services France
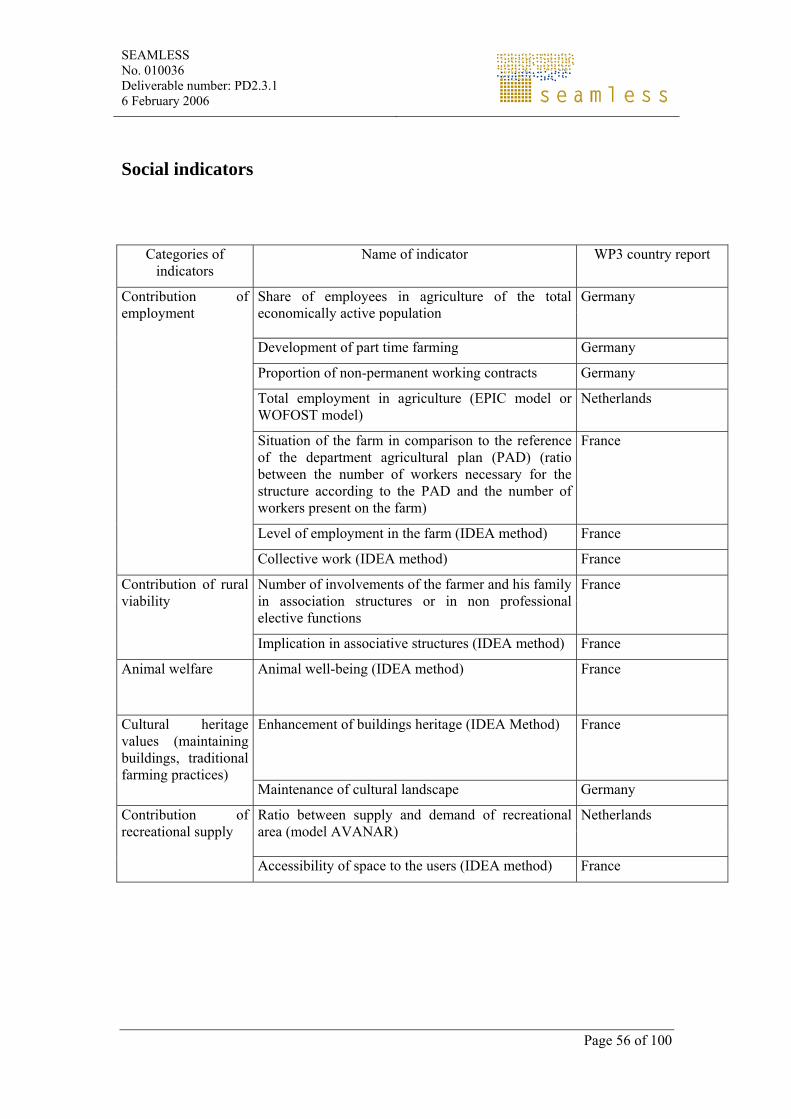
SEAMLESS No. 010036 Deliverable number: PD2.3.1 6 February 2006
Page 56 of 100
Social indicators
Categories of indicators
Name of indicator WP3 country report
Share of employees in agriculture of the total economically active population
Germany
Development of part time farming Germany
Proportion of non-permanent working contracts Germany
Total employment in agriculture (EPIC model or WOFOST model)
Netherlands
Situation of the farm in comparison to the reference of the department agricultural plan (PAD) (ratio between the number of workers necessary for the structure according to the PAD and the number of workers present on the farm)
France
Level of employment in the farm (IDEA method) France
Contribution of employment
Collective work (IDEA method) France
Number of involvements of the farmer and his family in association structures or in non professional elective functions
France Contribution of rural viability
Implication in associative structures (IDEA method) France
Animal welfare Animal well-being (IDEA method) France
Enhancement of buildings heritage (IDEA Method) France Cultural heritage values (maintaining buildings, traditional farming practices)
Maintenance of cultural landscape Germany
Ratio between supply and demand of recreational area (model AVANAR)
Netherlands Contribution of recreational supply
Accessibility of space to the users (IDEA method) France

SEAMLESS No. 010036 Deliverable number: PD2.3.1 6 February 2006
Page 57 of 100
Environmental indicators
Categories of indicators
Name of indicator WP3 country report
N balance (kg/ha*a) for single field Germany
N balance (Kg/ha*a) for entire farm Germany
N min before winter (Kg/ha) Germany
P balance (Kg/ha*a) for single field Germany
P content of the soil Germany
S balance (Kg/ha*a) for single field Germany
Percentage of area of crops with extensive pesticide application (of total cultivation area)
Germany
Percentage of cultivated area without pesticide application (of total cultivation area)
Germany
Percentage of treatments with applications, which prevent beneficial organisms from harm of total pesticide application (in % of total application area)
Germany
Extent to which damage levels have been observed (in % of area for which injury levels are possible)
Germany
Amount of pesticides applied (Kg pesticides/ha of total cultivation area)
Germany
Exposure of the environment to pesticides Germany
Surplus nitrogen - Nitrogen balancing (RAUMIS model)
Germany
Phosphorus fertilizer (RAUMIS model) Germany
N-balance surplus (MODAM model) Germany
N-fertilisation (MODAM model) Germany
Soil surface cover in winter (MODAM model) Germany
Total nitrogen loss (EPIC model)) Netherlands
Total fertilizer N use (EPIC model) Netherlands
Total biocide use (EPIC model) Netherlands
Nitrogen loss (Kg/ha) (WOFOST model) Netherlands
Pesticide input (Kg/ha) (WOFOST model) Netherlands
Water conservation (water quality, water availability, …)
NO3 leaching (experimentally derived equations) Netherlands

SEAMLESS No. 010036 Deliverable number: PD2.3.1 6 February 2006
Page 58 of 100
Nitrogen leaching Netherlands
P surplus (balance equation) Netherlands
N surplus (balance equation) Netherlands
Pesticide use (Kg/ha) Netherlands
Ground water balance in dry season Netherlands
Surface water balance in dry season Netherlands
Irrigated surface of the farm (ha)/% irrigated surface France
Average quantities of water used over e season (m3)/m3 water/ha of usable agriculture area
France
Nitrogen balance used at a farm scale, average per hectare (Kg N /ha)
France
Spreading pressure (Kg N spread / Ha fertilized surface)
France
Nitrogen balance on the surface of the most excedentary cultivation succession (Kg N/ha)
France
Corpen balance (Kg N/ha) France
Corpen balance (KG P2O5/ha) France
Mean number of phytosanitary treatments per hectare (treatment/ha)
France
Polluting pressure index (mean number of treatments at the homologued dose per hectare (number/ha)
France
Ipset (without dimension) France
Length of grass bands (width > 12 m) (linear meters/linear meters/ha)
France
Number of grazing hectares with drinking point directly in a river (ha)
France
Water resource protection (IDEA method) France
Pesticides (IDEA method) France
Effluent processing (IDEA method) France
Fertilisation (IDEA method) France
Stocking rate (IDEA method) France
Percentage of area of crops cultivated in row (of total cultivation area)
Germany
Percentage of area of crops cultivated in rows, which is subject to erosion protection measures
Germany
Soil conservation (soil erosion, organic matter, soil fertility, soil compaction, …)
Mean duration of fallow per area of cultivated land Germany
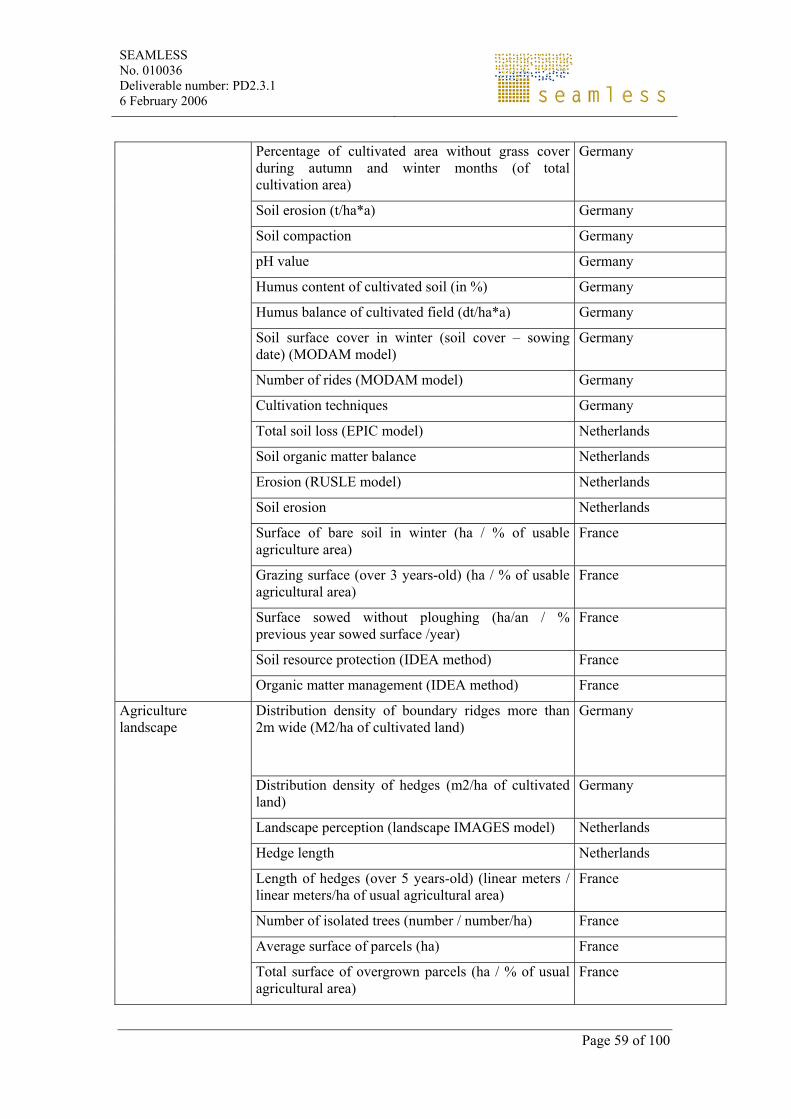
SEAMLESS No. 010036 Deliverable number: PD2.3.1 6 February 2006
Page 59 of 100
Percentage of cultivated area without grass cover during autumn and winter months (of total cultivation area)
Germany
Soil erosion (t/ha*a) Germany
Soil compaction Germany
pH value Germany
Humus content of cultivated soil (in %) Germany
Humus balance of cultivated field (dt/ha*a) Germany
Soil surface cover in winter (soil cover – sowing date) (MODAM model)
Germany
Number of rides (MODAM model) Germany
Cultivation techniques Germany
Total soil loss (EPIC model) Netherlands
Soil organic matter balance Netherlands
Erosion (RUSLE model) Netherlands
Soil erosion Netherlands
Surface of bare soil in winter (ha / % of usable agriculture area)
France
Grazing surface (over 3 years-old) (ha / % of usable agricultural area)
France
Surface sowed without ploughing (ha/an / % previous year sowed surface /year)
France
Soil resource protection (IDEA method) France
Organic matter management (IDEA method) France
Distribution density of boundary ridges more than 2m wide (M2/ha of cultivated land)
Germany
Distribution density of hedges (m2/ha of cultivated land)
Germany
Landscape perception (landscape IMAGES model) Netherlands
Hedge length Netherlands
Length of hedges (over 5 years-old) (linear meters / linear meters/ha of usual agricultural area)
France
Number of isolated trees (number / number/ha) France
Average surface of parcels (ha) France
Agriculture landscape
Total surface of overgrown parcels (ha / % of usual agricultural area)
France

SEAMLESS No. 010036 Deliverable number: PD2.3.1 6 February 2006
Page 60 of 100
Enhancement of landscape heritage (IDEA method) France)
Dimension of fields (IDEA method) France)
Cropping patterns (IDEA method) France
Stocking rate (IDEA method) France
CO2 emissions Germany Contribution of air quality (ammonia emissions, greenhouse gas emissions, ….) Number of livestock units on the farm x 150 m3 of
CH4 /year France
Energy input Germany
Efficiency (energy input / energy output) Germany
Regulation of energy flows Germany
Production of biomass (suitability for cultivation) Germany
Consumption of energy (equivalent litre of fuel/year) France
Use of renewable (alternative) energy
Energy dependence (IDEA method) France
Number of agricultural crops species Germany
Number of different types of grasslands Germany
Number of cultivated plant species/agricultural land use types > 5 % of total cultivation area
Germany
Length of field margins between land use types (ecotones)
Germany
Grassland – number of key species Germany
Grassland – percentage of area with key species 3/3 Germany
Grassland – spatial effectiveness of area with high species diversity (%)
Germany
Arable land – number of key species Germany
Arable land – percentage of area with key species 3/3 Germany
Arable land – effective range of areas with high species diversity (%)
Germany
Total effective range of areas with high species diversity in % of the total cultivation area
Germany
Number of cultivated plant varieties Germany
Biodiversity (spatial diversity, species diversity, genetic diversity, …)
Number of rare varieties and their minimum cultivation area
Germany

SEAMLESS No. 010036 Deliverable number: PD2.3.1 6 February 2006
Page 61 of 100
Percentage of the cultivation area for rare varieties of the farm’s total cultivation area
Germany
Number of productive livestock races Germany
Number of rare races with minimum stock level Germany
Percentage of rare races of the entire livestock Germany
Diversity of cultivated plant (Shannon-index) Germany
Diversity of grasslands (Shannon-index) Germany
Fertilisation (MODAM model) Germany
N-fertilisation (MODAM model) Germany
Insecticides (MODAM model) Germany
Herbicides (MODAM model) Germany
Herbicides during migration of amphibians (MODAM model)
Germany
Denseness of crop (MODAM model) Germany
Cultivation techniques and disturbances during breed Germany
Soil tillage Germany
Number of days of grazing cows Netherlands
Herbaceous plant biodiversity Netherlands
Number and surface occupied on the farm by the different categories (pool, pond, bog, …) (ha)
France
Grazing surface (over 5 years-old and receiving less than 40 Kg N mineral and organic /ha) (ha / % of usable agricultural area)
France
Number of cultivated species, except for permanent grassland (number / number/ha of usual agricultural area)
France
Length of forest border (m / m/ha of usual agricultural area)
France
Enhancement and conservation of genetic heritage (IDEA method)
France
Ecological buffer zones (IDEA method) France
Measures to protect the natural heritage (IDEA method)
France
Diversity of annual or temporary crops (IDEA method)
France
Diversity of perennial crops (IDEA method) France
Diversity of associated vegetation (IDEA method) France
Animal diversity (IDEA method) France

SEAMLESS No. 010036 Deliverable number: PD2.3.1 6 February 2006
Page 62 of 100

SEAMLESS No. 010036 Deliverable number: PD2.3.1 06 February 2006
Page 63 of 100
Annex n° 2 : evaluative framework for indicators
Economic indicators
Categories of indicators Name of indicator goal of indicators
Performance/
Efficiency
Intended user groups
Origin of data Descriptive/
Analytical indicator
Evaluation “ex-ante”/
“ex-post”
Link with models
Quality of foodstuffs produced (IDEA method)
To simplify
To quantify
farmers Stakeholder value
Analytical indicator
/ Quality of products (healthy food, food safety, ….)
Product quality
Possibilities for the marketing of regional products in the region
Statistics
Stakeholder value
Descriptive indicator
/ Diversity of products
Regional marketing structures Statistics
Stakeholder value
Descriptive indicator
/

SEAMLESS No. 010036 Deliverable number: PD2.3.1 6 February 2006
Page 64 of 100
Production of regional specialities Statistics
Stakeholder value
Descriptive indicator
/
Proportion of locally sourced food sold in rural areas
Statistics
Stakeholder value
Descriptive indicator
/
Level of diversification in farm businesses
Statistics Descriptive indicator
/
No farming activities (income derived from diversification)
Short trade (IDEA method) To simplify
To quantify
farmers Stakeholder value
Analytical indicator
/
Supply of agro-touristy activities as alternative source of income
Number of services supplied by the farm : local services (maintaining paths, clearing sow, ….)
Agri-tourism, pedagogical farms, social insertion
Services
Commercial services

SEAMLESS No. 010036 Deliverable number: PD2.3.1 6 February 2006
Page 65 of 100
Social indicators
Categories of indicators Name of indicator goal of indicators
Performance/
Efficiency
Intended user groups
Origin of data
Descriptive/
Analytical indicator
Evaluation “ex-ante”/
“ex-post”
Link with models
Share of employees in agriculture of the total economically active population
Development of part time farming
Proportion of non-permanent working contracts
Total employment in agriculture (EPIC model or WOFOST model)
To quantify Policy makers Statistics Descriptive indicator
Ex-ante /
Situation of the farm in comparison to the reference of the department agricultural plan (PAD) (ratio between the number of workers necessary for the structure according to the PAD and the number of workers present on the farm)
Contribution of employment
Level of employment in the farm (IDEA method)
To simplify
To quantify
farmers Stakeholder value
Analytical indicator
/

SEAMLESS No. 010036 Deliverable number: PD2.3.1 6 February 2006
Page 66 of 100
Collective work (IDEA method) To simplify
To quantify
farmers Stakeholder value
Analytical indicator
/
Number of involvements of the farmer and his family in association structures or in non professional elective functions
Contribution of rural viability
Implication in associative structures (IDEA method)
To simplify
To quantify
farmers Stakeholder value
Analytical indicator
/
Animal welfare Animal well-being (IDEA method) To simplify
To quantify
farmers Stakeholder value
Analytical indicator
/
Enhancement of buildings heritage (IDEA Method)
To simplify
To quantify
farmers Stakeholder value
Analytical indicator
/ Cultural heritage values (maintaining buildings, traditional farming practices)
Maintenance of the cultural landscape
Ratio between supply and demand of recreational area (model AVANAR)
Policy makers Model output
Analytical indicator
Ex-ante
Ex-post
Model output
Contribution of recreational supply
Accessibility of space to the users (IDEA method)
To simplify
To quantify
farmers Stakeholder value
Analytical indicator
/

SEAMLESS No. 010036 Deliverable number: PD2.3.1 6 February 2006
Page 67 of 100
Environmental indicators
Categories of indicators
Name of indicator goal of indicators
Performance/
Efficiency
Intended user groups
Origin of data
Descriptive/
Analytical indicator
Evaluation “ex-ante”/
“ex-post”
Link with models
N balance (kg/ha*a) for single field Analytical indicator
N balance (Kg/ha*a) for entire farm Analytical indicator
N min before winter (Kg/ha) Analytical indicator
P balance (Kg/ha*a) for single field Analytical indicator
P content of the soil Analytical indicator
S balance (Kg/ha*a) for single field Analytical indicator
Water conservation (water quality, water availability, …)
Percentage of area of crops with extensive pesticide application (of total cultivation area)
Analytical indicator

SEAMLESS No. 010036 Deliverable number: PD2.3.1 6 February 2006
Page 68 of 100
Percentage of cultivated area without pesticide application (of total cultivation area)
Analytical indicator
Percentage of treatments with applications, which prevent beneficial organisms from harm of total pesticide application (in % of total application area)
Analytical indicator
Extent to which damage levels have been observed (in % of area for which injury levels are possible)
Analytical indicator
Amount of pesticides applied (Kg pesticides/ha of total cultivation area)
Analytical indicator
Exposure of the environment to pesticides
Analytical indicator
Surplus nitrogen - Nitrogen balancing (RAUMIS model)
To quantify Policy makers
Stakeholder value
Analytical indicator
Ex-ante
Ex-post
Input model
Phosphorus fertilizer (RAUMIS model)
To quantify Policy makers
Stakeholder value
Analytical indicator
Ex-ante
Ex-post
Input model
N-balance surplus (MODAM model) To simplify
To quantify
Policy makers
Others stakeholders
Model input Analytical indicator
Ex-ante

SEAMLESS No. 010036 Deliverable number: PD2.3.1 6 February 2006
Page 69 of 100
N-fertilisation (MODAM model) To simplify
To quantify
Policy makers
Others stakeholders
Model input Analytical indicator
Ex-ante
Soil surface cover in winter (MODAM model)
To simplify
To quantify
Policy makers
Others stakeholders
Model input Analytical input
Ex-ante
Total nitrogen loss (EPIC model)) To quantify Policy makers
Statistics
Stakeholder value
Descriptive indicator
Ex-ante /
Total fertilizer N use (EPIC model) Policy makers
Model input Ex-ante /
Total biocide use (EPIC model) To quantify Policy makers
Statistics
Stakeholder value
Descriptive indicator
Ex-ante /
Nitrogen loss (Kg/ha) (WOFOST model)
Policy makers
Model input Ex-ante /
Pesticide input (Kg/ha) (WOFOST model)
To quantify Policy makers
Statistics
Stakeholder value
Descriptive indicator
Ex-ante /

SEAMLESS No. 010036 Deliverable number: PD2.3.1 6 February 2006
Page 70 of 100
NO3 leaching (experimentally derived equations)
Policy makers
Farmers
Others stakeholders
Model input Ex-ante /
Nitrogen leaching Policy makers
Farmers
Others stakeholders
Model input Ex-ante /
P surplus (balance equation) Policy makers
Farmers
Others stakeholders
Model input Ex-ante /
N surplus (balance equation) Policy makers
Farmers
Others stakeholders
Model input Ex-ante /

SEAMLESS No. 010036 Deliverable number: PD2.3.1 6 February 2006
Page 71 of 100
Pesticide use (Kg/ha) To quantify Policy makers
Farmers
Others stakeholders
Statistics
Stakeholder value
Descriptive indicator
Ex-ante /
Ground water balance in dry season Policy makers
Farmers
Others stakeholders
Model input Ex-ante /
Surface water balance in dry season Policy makers
Farmers
Others stakeholders
Model input Ex-ante /
Irrigated surface of the farm (ha)/% irrigated surface
To quantify Efficient indicator
Policy makers
Farmers
Others stakeholders
Statistics
Stakeholder value
Descriptive indicator
Ex-ante

SEAMLESS No. 010036 Deliverable number: PD2.3.1 6 February 2006
Page 72 of 100
Average quantities of water used over a season (m3)/m3 water/ha of usable agriculture area
To simplify
To quantify
Efficient indicator
Policy makers
Farmers
Others stakeholders
Statistics
Stakeholder value
Descriptive indicator
Ex-ante
Nitrogen balance used at a farm scale, average per hectare (Kg N /ha)
To simplify
To quantify
Farmers
Others stakeholders
Stakeholder value
Analytical indicator
Ex-ante
Spreading pressure (Kg N spread / Ha fertilized surface)
To simplify
To quantify
Farmers
Others stakeholders
Stakeholder value
Model input
Analytical indicator
Ex-ante
Nitrogen balance on the surface of the most excedentary cultivation succession (Kg N/ha)
To simplify
To quantify
Farmers
Others stakeholders
Stakeholder value
Model input
Analytical indicator
Ex-ante
Corpen balance (Kg N/ha) To simplify
To quantify
Policy makers
Farmers
Others stakeholders
Stakeholder value
Analytical indicator
Ex-ante

SEAMLESS No. 010036 Deliverable number: PD2.3.1 6 February 2006
Page 73 of 100
Corpen balance (KG P2O5/ha) To simplify
To quantify
Policy makers
Farmers
Others stakeholders
Stakeholder value
Analytical indicator
Ex-ante
Mean number of phytosanitary treatments per hectare (treatment/ha)
To simplify
To quantify
Efficient indicator
Farmers
Others stakeholders
Stakeholder value
Descriptive indicator
Ex-ante
Polluting pressure index (mean number of treatments at the homologued dose per hectare (number/ha)
To simplify
To quantify
Policy makers
Farmers
Others stakeholders
Stakeholder value
Model input
Analytical indicator
Ex-ante
Ipset (without dimension) To simplify
To quantify
Analytical indicator
Ex-ante
Length of grass bands (width > 12 m) (linear meters/linear meters/ha)
To quantify Efficient indicator
Policy makers
Farmers
Others stakeholders
Stakeholder value
Analytical indicator
Ex-ante

SEAMLESS No. 010036 Deliverable number: PD2.3.1 6 February 2006
Page 74 of 100
Number of grazing hectares with drinking point directly in a river (ha)
To quantify Policy makers
Farmers
Others stakeholders
Stakeholder value
Analytical indicator
Ex-ante
Water resource protection (IDEA method)
To simplify
To quantify
farmers Stakeholder value
Analytical indicator
/
Pesticides (IDEA method) To simplify
To quantify
farmers Stakeholder value
Analytical indicator
/
Effluent processing (IDEA method) To simplify
To quantify
farmers Stakeholder value
Analytical indicator
/
Fertilisation (IDEA method) To simplify
To quantify
farmers Stakeholder value
Analytical indicator
/
Stocking rate (IDEA method) To simplify
To quantify
farmers Stakeholder value
Analytical indicator
/
Percentage of area of crops cultivated in row (of total cultivation area)
Percentage of area of crops cultivated in rows, which is subject to erosion protection measures
Soil conservation (soil erosion, organic matter, soil fertility, soil compaction, …)
Mean duration of fallow per area of cultivated land

SEAMLESS No. 010036 Deliverable number: PD2.3.1 6 February 2006
Page 75 of 100
Percentage of cultivated area without grass cover during autumn and winter months (of total cultivation area)
Soil erosion (t/ha*a)
Soil compaction
pH value
Humus content of cultivated soil (in %)
Humus balance of cultivated field (dt/ha*a)
Soil surface cover in winter (soil cover – sowing date) (MODAM model)
To simplify
To quantify
Policy makers
Farmers
Others stakeholders
Model input Analytical indicator
Ex-ante
Number of rides (MODAM model) To simplify
To quantify
Policy makers
Farmers
Others stakeholders
Model input Analytical indicator
Ex-ante

SEAMLESS No. 010036 Deliverable number: PD2.3.1 6 February 2006
Page 76 of 100
Cultivation techniques To simplify
To quantify
Policy makers
Farmers
Others stakeholders
Model input Analytical indicator
Ex-ante
Total soil loss (EPIC model) To simplify
To quantify
Policy makers
Stakeholder value
Analytical indicator
Ex-ante /
Soil organic matter balance Policy makers
Farmers
Others stakeholders
Model input Analytical indicator
Ex-ante /
Erosion (RUSLE model) Policy makers
Farmers
Others stakeholders
Model input Analytical indicator
Ex-ante /
Soil erosion Policy makers
Farmers
Others stakeholders
Model input Ex-ante /
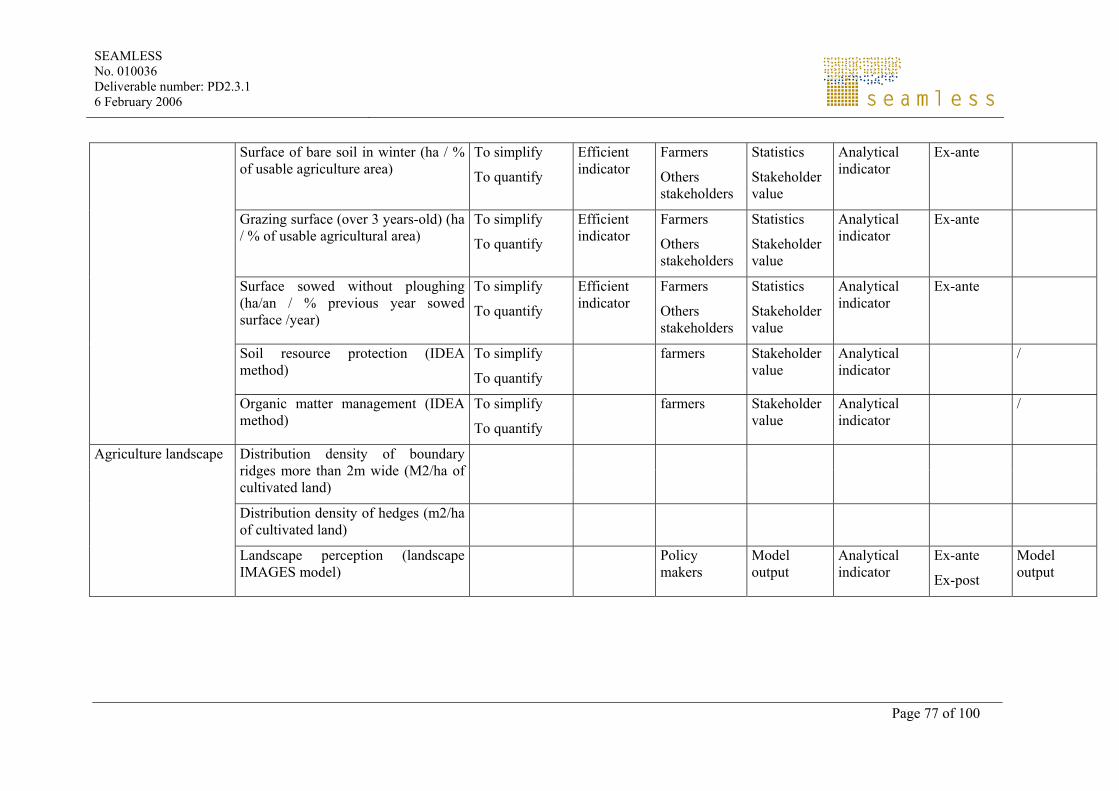
SEAMLESS No. 010036 Deliverable number: PD2.3.1 6 February 2006
Page 77 of 100
Surface of bare soil in winter (ha / % of usable agriculture area)
To simplify
To quantify
Efficient indicator
Farmers
Others stakeholders
Statistics
Stakeholder value
Analytical indicator
Ex-ante
Grazing surface (over 3 years-old) (ha / % of usable agricultural area)
To simplify
To quantify
Efficient indicator
Farmers
Others stakeholders
Statistics
Stakeholder value
Analytical indicator
Ex-ante
Surface sowed without ploughing (ha/an / % previous year sowed surface /year)
To simplify
To quantify
Efficient indicator
Farmers
Others stakeholders
Statistics
Stakeholder value
Analytical indicator
Ex-ante
Soil resource protection (IDEA method)
To simplify
To quantify
farmers Stakeholder value
Analytical indicator
/
Organic matter management (IDEA method)
To simplify
To quantify
farmers Stakeholder value
Analytical indicator
/
Distribution density of boundary ridges more than 2m wide (M2/ha of cultivated land)
Distribution density of hedges (m2/ha of cultivated land)
Agriculture landscape
Landscape perception (landscape IMAGES model)
Policy makers
Model output
Analytical indicator
Ex-ante
Ex-post
Model output

SEAMLESS No. 010036 Deliverable number: PD2.3.1 6 February 2006
Page 78 of 100
Hedge length Policy makers
Farmers
Others stakeholders
statistics Ex-ante
Length of hedges (over 5 years-old) (linear meters / linear meters/ha of usual agricultural area)
To quantify Efficient indicator
Policy makers
Others stakeholders
Stakeholder value
Analytical indicator
Ex-ante
Number of isolated trees (number / number/ha)
To quantify Efficient indicator
Policy makers
Others stakeholders
Stakeholder value
Analytical indicator
Ex-ante
Average surface of parcels (ha) To quantify Efficient indicator
Policy makers
Others stakeholders
Statistics
Stakeholder value
Analytical indicator
Ex-ante
Total surface of overgrown parcels (ha / % of usual agricultural area)
To quantify Efficient indicator
Policy makers
Others stakeholders
Statistics
Stakeholder value
Analytical indicator
Ex-ante
Enhancement of landscape heritage (IDEA method)
To simplify
To quantify
farmers Stakeholder value
Analytical indicator
/

SEAMLESS No. 010036 Deliverable number: PD2.3.1 6 February 2006
Page 79 of 100
Dimension of fields (IDEA method) To simplify
To quantify
farmers Stakeholder value
Analytical indicator
/
Cropping patterns (IDEA method) To simplify
To quantify
farmers Stakeholder value
Analytical indicator
/
Stocking rate (IDEA method) To simplify
To quantify
farmers Stakeholder value
Analytical indicator
/
CO2 emissions Contribution of air quality (ammonia emissions, greenhouse gas emissions, ….) Number of livestock units on the farm
x 150 m3 of CH4 /year To quantify Efficient
indicator Farmers
Others stakeholders
Statistics
Stakeholder value
Descriptive indicator
Ex-ante
Energy input
Efficiency (energy input / energy output)
Regulation of energy flows
Production of biomass (suitability for cultivation)
Consumption of energy (equivalent litre of fuel/year)
Use of renewable (alternative) energy
Energy dependence (IDEA method) To simplify
To quantify
farmers Stakeholder value
Analytical indicator
/
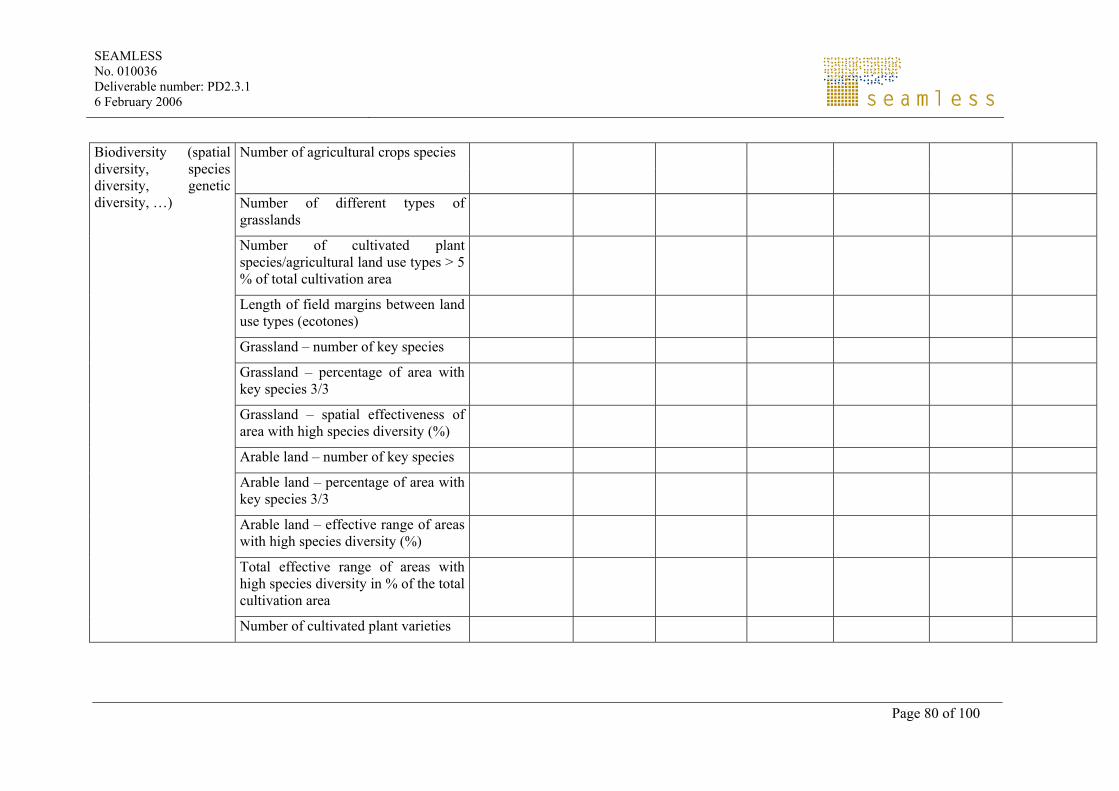
SEAMLESS No. 010036 Deliverable number: PD2.3.1 6 February 2006
Page 80 of 100
Number of agricultural crops species
Number of different types of grasslands
Number of cultivated plant species/agricultural land use types > 5 % of total cultivation area
Length of field margins between land use types (ecotones)
Grassland – number of key species
Grassland – percentage of area with key species 3/3
Grassland – spatial effectiveness of area with high species diversity (%)
Arable land – number of key species
Arable land – percentage of area with key species 3/3
Arable land – effective range of areas with high species diversity (%)
Total effective range of areas with high species diversity in % of the total cultivation area
Biodiversity (spatial diversity, species diversity, genetic diversity, …)
Number of cultivated plant varieties

SEAMLESS No. 010036 Deliverable number: PD2.3.1 6 February 2006
Page 81 of 100
Number of rare varieties and their minimum cultivation area
Percentage of the cultivation area for rare varieties of the farm’s total cultivation area
Number of productive livestock races
Number of rare races with minimum stock level
Percentage of rare races of the entire livestock
Diversity of cultivated plant (Shannon-index)
Diversity of grasslands (Shannon-index)
Fertilisation (MODAM model) To simplify
To quantify
Policy makers
Farmers
Others stakeholders
Model input Analytical indicator
Ex-ante
N-fertilisation (MODAM model) To simplify
To quantify
Policy makers
Farmers
Others stakeholders
Model input Analytical indicator
Ex-ante

SEAMLESS No. 010036 Deliverable number: PD2.3.1 6 February 2006
Page 82 of 100
Insecticides (MODAM model) To simplify
To quantify
Policy makers
Farmers
Others stakeholders
Model input Analytical indicator
Ex-ante
Herbicides (MODAM model) To simplify
To quantify
Policy makers
Farmers
Others stakeholders
Model input Analytical indicator
Ex-ante
Herbicides during migration of amphibians (MODAM model)
To simplify
To quantify
Policy makers
Farmers
Others stakeholders
Model input Analytical indicator
Ex-ante
Denseness of crop (MODAM model) To simplify
To quantify
Policy makers
Farmers
Others stakeholders
Model input Analytical indicator
Ex-ante

SEAMLESS No. 010036 Deliverable number: PD2.3.1 6 February 2006
Page 83 of 100
Cultivation techniques and disturbances during breed
To simplify
To quantify
Policy makers
Farmers
Others stakeholders
Model input Analytical indicator
Ex-ante
Soil tillage To simplify
To quantify
Policy makers
Farmers
Others stakeholders
Model input Analytical indicator
Ex-ante
Number of days of grazing cows To simplify
To quantify
Policy makers
Farmers
Others stakeholders
Stakeholder value
Analytical indicator
Ex-ante
Herbaceous plant biodiversity To simplify
To quantify
Policy makers
Farmers
Others stakeholders
Stakeholder value
Descriptive indicator
Ex-ante
Number and surface occupied on the farm by the different categories (pool, pond, bog, …) (ha)
To simplify
To quantify
Policy makers
Others stakeholders
Statistics
Stakeholder value
Analytical indicator
Ex-ante

SEAMLESS No. 010036 Deliverable number: PD2.3.1 6 February 2006
Page 84 of 100
Grazing surface (over 5 years-old and receiving less than 40 Kg N mineral and organic /ha) (ha / % of usable agricultural area)
To simplify
To quantify
Policy makers
Farmers
Others stakeholders
Stakeholder value
Analytical indicator
Ex-ante
Number of cultivated species, except for permanent grassland (number / number/ha of usual agricultural area)
To simplify
To quantify
Efficient indicator
Policy makers
Others stakeholders
Statistics
Stakeholder value
Analytical indicator
Ex-ante
Length of forest border (m / m/ha of usual agricultural area)
To simplify
To quantify
Efficient indicator
Policy makers
Others stakeholders
Stakeholder value
Analytical indicator
Ex-ante
Enhancement and conservation of genetic heritage (IDEA method)
To simplify
To quantify
farmers Stakeholder value
Analytical indicator
/
Ecological buffer zones (IDEA method)
To simplify
To quantify
farmers Stakeholder value
Analytical indicator
/
Measures to protect the natural heritage (IDEA method)
To simplify
To quantify
farmers Stakeholder value
Analytical indicator
/
Diversity of annual or temporary crops (IDEA method)
To simplify
To quantify
farmers Stakeholder value
Analytical indicator
/

SEAMLESS No. 010036 Deliverable number: PD2.3.1 6 February 2006
Page 85 of 100
Diversity of perennial crops (IDEA method)
To simplify
To quantify
farmers Stakeholder value
Analytical indicator
/
Diversity of associated vegetation (IDEA method)
To simplify
To quantify
farmers Stakeholder value
Analytical indicator
/
Animal diversity (IDEA method) To simplify
To quantify
farmers Stakeholder value
Analytical indicator
/


SEAMLESS No. 010036 Deliverable number: PD2.3.1 06 February 2006
Page 87 of 100
Annex n° 3 : Indicators and geographical level To quantify the level of application, the following coding is used:
♦ X1 = The data is collected at this level and therefore indicators are valid
♦ X2 = The data is not collected at this level but the indicators CAN be valid by aggregation of the information (collected at the lower level)
In this case, it is NECESSARY to find a new unit for the validity of the indicator and to have information and the value of the indicator at lower level. ♦ The empty box means that this indicator does not have any significance at this level .
Economic indicators
Categories of indicators Name of indicator farm level landscape or territory level
regional level (NUTS2)
Quality of foodstuffs produced (IDEA method)
X1 X2 Quality of products (healthy food, food safety, ….)
Product quality X1
Possibilities for the marketing of regional products in the region
X1 X1
Regional marketing structures X1 X1
Diversity of products
Production of regional specialities X1 X1

SEAMLESS No. 010036 Deliverable number: PD2.3.1 6 February 2006
Page 88 of 100
Proportion of locally sourced food sold in rural areas
X1 X1
Level of diversification in farm businesses X1 X2
No farming activities (income derived from diversification)
Short trade (IDEA method) X1 X2
Supply of agro-touristy activities as alternative source of income
X1 X2
Number of services supplied by the farm : local services (maintaining paths, clearing sow, ….)
X1 X2
Agri-tourism, pedagogical farms, social insertion
X1 X2
Services
Commercial services X1 X2

SEAMLESS No. 010036 Deliverable number: PD2.3.1 6 February 2006
Page 89 of 100
Social indicators
Categories of indicators Name of indicator farm level landscape or territory level
regional level
Share of employees in agriculture of the total economically active population
X1 X1
Development of part time farming X1 X1
Proportion of non-permanent working contracts
X1
Total employment in agriculture (EPIC model or WOFOST model)
X1
Situation of the farm in comparison to the reference of the department agricultural plan (PAD) (ratio between the number of workers necessary for the structure according to the PAD and the number of workers present on the farm)
X1
Level of employment in the farm (IDEA method)
X1
Contribution of employment
Collective work (IDEA method) X1
Contribution of rural viability Number of involvements of the farmer and his family in association structures or in non professional elective functions
X1 X2

SEAMLESS No. 010036 Deliverable number: PD2.3.1 6 February 2006
Page 90 of 100
Implication in associative structures (IDEA method)
X1
Animal welfare Animal well-being (IDEA method) X1
Enhancement of buildings heritage (IDEA Method)
X1 Cultural heritage values (maintaining buildings, traditional farming practices)
Maintenance of the cultural landscape X1
Ratio between supply and demand of recreational area (model AVANAR)
X1 Contribution of recreational supply
Accessibility of space to the users (IDEA method)
X1

SEAMLESS No. 010036 Deliverable number: PD2.3.1 6 February 2006
Page 91 of 100
Environmental indicators
Categories of indicators Name of indicator farm level landscape or territory level
regional level
N balance (kg/ha*a) for single field X2
N balance (Kg/ha*a) for entire farm X1
N min before winter (Kg/ha) X1
P balance (Kg/ha*a) for single field X2
P content of the soil
S balance (Kg/ha*a) for single field X2
Percentage of area of crops with extensive pesticide application (of total cultivation area)
X1 X2
Percentage of cultivated area without pesticide application (of total cultivation area)
X1 X2
Water conservation (water quality, water availability, …)
Percentage of treatments with applications, which prevent beneficial organisms from harm of total pesticide application (in % of total application area)
X1 X2

SEAMLESS No. 010036 Deliverable number: PD2.3.1 6 February 2006
Page 92 of 100
Extent to which damage levels have been observed (in % of area for which injury levels are possible)
X1 X2
Amount of pesticides applied (Kg pesticides/ha of total cultivation area)
X1 X2
Exposure of the environment to pesticides X1 X2
Surplus nitrogen - Nitrogen balancing (RAUMIS model)
X1 X1
Phosphorus fertilizer (RAUMIS model) X1 X1
N-balance surplus (MODAM model) X1
N-fertilisation (MODAM model) X1 X2 X2
Soil surface cover in winter (MODAM model)
X1 X2 X2
Total nitrogen loss (EPIC model)) X1 X2 X2
Total fertilizer N use (EPIC model) X1
Total biocide use (EPIC model) X1
Nitrogen loss (Kg/ha) (WOFOST model) X1
Pesticide input (Kg/ha) (WOFOST model) X1
NO3 leaching (experimentally derived equations)
X1
Nitrogen leaching X1
P surplus (balance equation) X1

SEAMLESS No. 010036 Deliverable number: PD2.3.1 6 February 2006
Page 93 of 100
N surplus (balance equation) X1
Pesticide use (Kg/ha) X1 X2
Ground water balance in dry season X1
Surface water balance in dry season X1
Irrigated surface of the farm (ha)/% irrigated surface
X1 X2 X2
Average quantities of water used over a season (m3)/m3 water/ha of usable agriculture area
X1 X2 X2
Nitrogen balance used at a farm scale, average per hectare (Kg N /ha)
X1 X2
Spreading pressure (Kg N spread / Ha fertilized surface)
X1 X2
Nitrogen balance on the surface of the most excedentary cultivation succession (Kg N/ha)
X1 X2
Corpen balance (Kg N/ha)
Corpen balance (KG P2O5/ha)
Mean number of phytosanitary treatments per hectare (treatment/ha)
X1 X2
Polluting pressure index (mean number of treatments at the homologued dose per hectare (number/ha)
X1 X2
Ipset (without dimension)

SEAMLESS No. 010036 Deliverable number: PD2.3.1 6 February 2006
Page 94 of 100
Length of grass bands (width > 12 m) (linear meters/linear meters/ha)
X1 X2
Number of grazing hectares with drinking point directly in a river (ha)
X1 X2
Water resource protection (IDEA method) X1
Pesticides (IDEA method) X1
Effluent processing (IDEA method) X1
Fertilisation (IDEA method) X1
Stocking rate (IDEA method) X1
Percentage of area of crops cultivated in row (of total cultivation area)
X1 X2
Percentage of area of crops cultivated in rows, which is subject to erosion protection measures
X1 X2
Mean duration of fallow per area of cultivated land
Percentage of cultivated area without grass cover during autumn and winter months (of total cultivation area)
X1 X2
Soil erosion (t/ha*a) X1 X2
Soil compaction X1
pH value
Soil conservation (soil erosion, organic matter, soil fertility, soil compaction, …)
Humus content of cultivated soil (in %) X1 X2
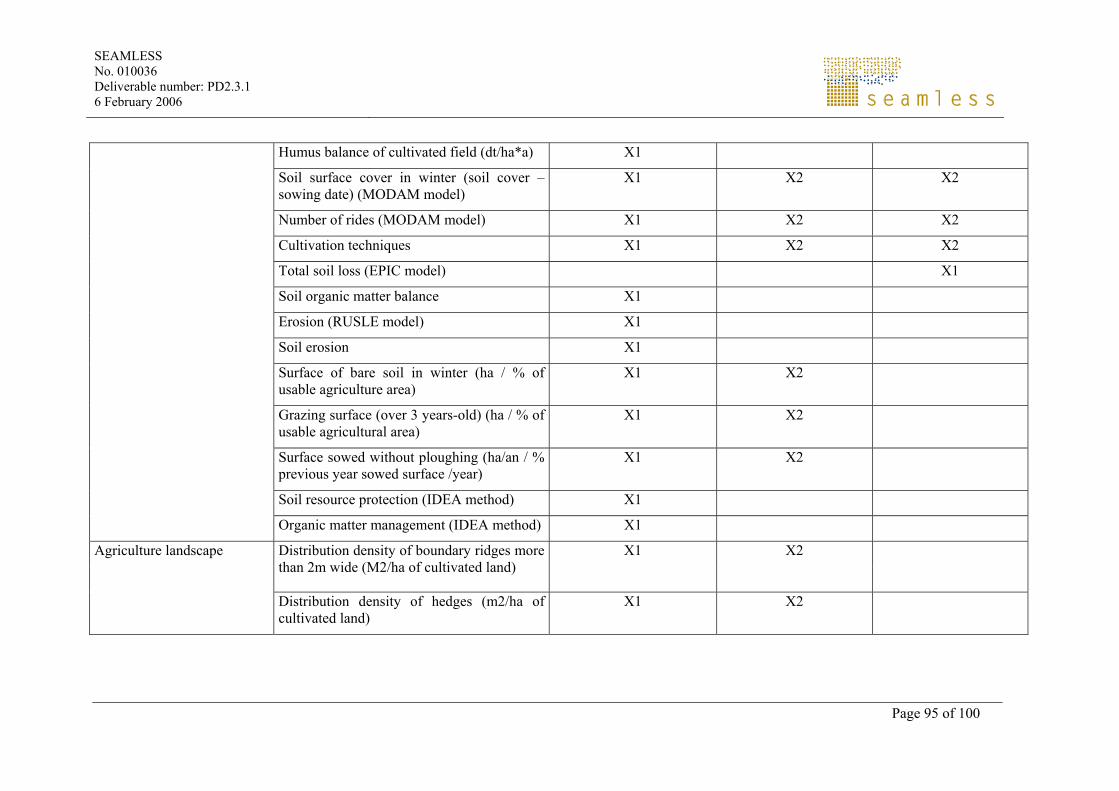
SEAMLESS No. 010036 Deliverable number: PD2.3.1 6 February 2006
Page 95 of 100
Humus balance of cultivated field (dt/ha*a) X1
Soil surface cover in winter (soil cover – sowing date) (MODAM model)
X1 X2 X2
Number of rides (MODAM model) X1 X2 X2
Cultivation techniques X1 X2 X2
Total soil loss (EPIC model) X1
Soil organic matter balance X1
Erosion (RUSLE model) X1
Soil erosion X1
Surface of bare soil in winter (ha / % of usable agriculture area)
X1 X2
Grazing surface (over 3 years-old) (ha / % of usable agricultural area)
X1 X2
Surface sowed without ploughing (ha/an / % previous year sowed surface /year)
X1 X2
Soil resource protection (IDEA method) X1
Organic matter management (IDEA method) X1
Distribution density of boundary ridges more than 2m wide (M2/ha of cultivated land)
X1 X2 Agriculture landscape
Distribution density of hedges (m2/ha of cultivated land)
X1 X2
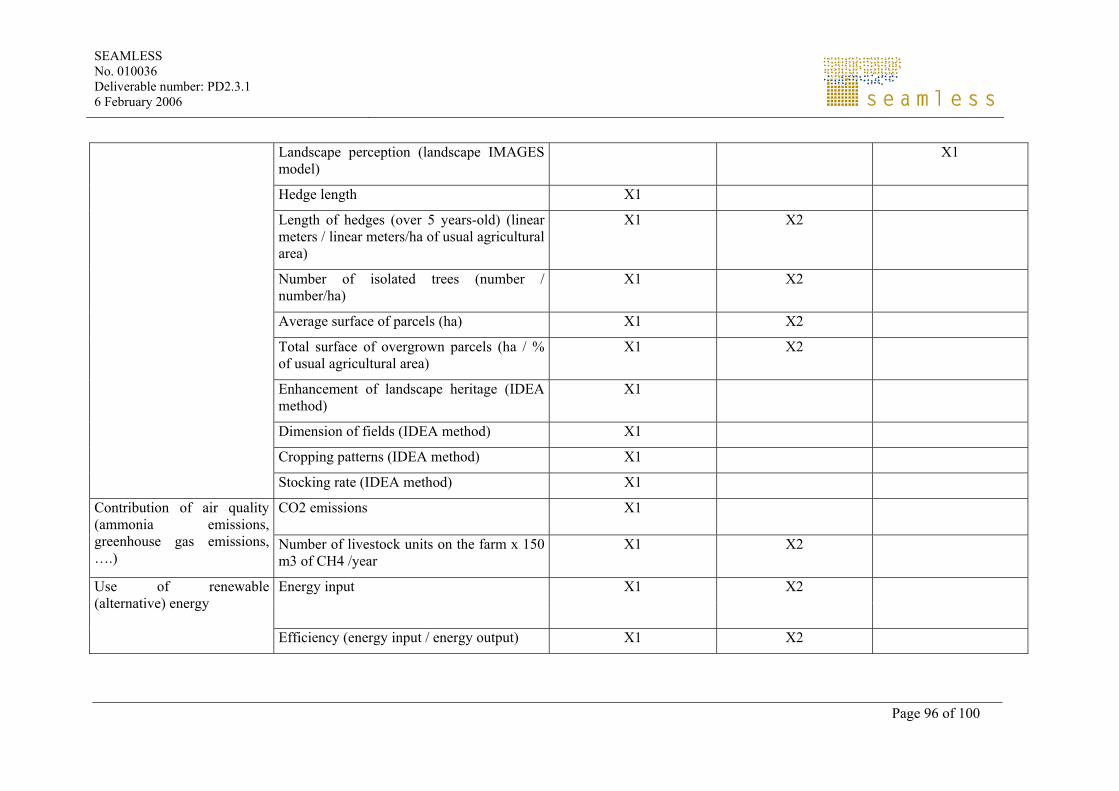
SEAMLESS No. 010036 Deliverable number: PD2.3.1 6 February 2006
Page 96 of 100
Landscape perception (landscape IMAGES model)
X1
Hedge length X1
Length of hedges (over 5 years-old) (linear meters / linear meters/ha of usual agricultural area)
X1 X2
Number of isolated trees (number / number/ha)
X1 X2
Average surface of parcels (ha) X1 X2
Total surface of overgrown parcels (ha / % of usual agricultural area)
X1 X2
Enhancement of landscape heritage (IDEA method)
X1
Dimension of fields (IDEA method) X1
Cropping patterns (IDEA method) X1
Stocking rate (IDEA method) X1
CO2 emissions X1 Contribution of air quality (ammonia emissions, greenhouse gas emissions, ….)
Number of livestock units on the farm x 150 m3 of CH4 /year
X1 X2
Energy input X1 X2 Use of renewable (alternative) energy
Efficiency (energy input / energy output) X1 X2

SEAMLESS No. 010036 Deliverable number: PD2.3.1 6 February 2006
Page 97 of 100
Regulation of energy flows X1 X2
Production of biomass (suitability for cultivation)
X1 X2
Consumption of energy (equivalent litre of fuel/year)
X1 X2
Energy dependence (IDEA method) X1
Number of agricultural crops species X1 X2
Number of different types of grasslands X1 X2
Number of cultivated plant species/agricultural land use types > 5 % of total cultivation area
X1 X2
Length of field margins between land use types (ecotones)
X1 X2
Grassland – number of key species X1 X2
Grassland – percentage of area with key species 3/3
X1 X2
Grassland – spatial effectiveness of area with high species diversity (%)
X1 X2
Arable land – number of key species X1 X2
Biodiversity (spatial diversity, species diversity, genetic diversity, …)
Arable land – percentage of area with key species 3/3
X1 X2

SEAMLESS No. 010036 Deliverable number: PD2.3.1 6 February 2006
Page 98 of 100
Arable land – effective range of areas with high species diversity (%)
X1 X2
Total effective range of areas with high species diversity in % of the total cultivation area
X1 X2
Number of cultivated plant varieties X1 X2
Number of rare varieties and their minimum cultivation area
X1 X2
Percentage of the cultivation area for rare varieties of the farm’s total cultivation area
X1 X2
Number of productive livestock races X1 X2
Number of rare races with minimum stock level
X1
Percentage of rare races of the entire livestock
X1 X2
Diversity of cultivated plant (Shannon-index)
X1
Diversity of grasslands (Shannon-index) X1
Fertilisation (MODAM model) X1 X2 X2
N-fertilisation (MODAM model) X1 X2 X2
Insecticides (MODAM model) X1 X2 X2
Herbicides (MODAM model) X1 X2 X2

SEAMLESS No. 010036 Deliverable number: PD2.3.1 6 February 2006
Page 99 of 100
Herbicides during migration of amphibians (MODAM model)
X1 X2 X2
Denseness of crop (MODAM model) X1 X2 X2
Cultivation techniques and disturbances during breed
X1 X2 X2
Soil tillage X1 X2 X2
Number of days of grazing cows X1 X2
Herbaceous plat diversity X1
Number and surface occupied on the farm by the different categories (pool, pond, bog, …) (ha)
X1 X2
Grazing surface (over 5 years-old and receiving less than 40 Kg N mineral and organic /ha) (ha / % of usable agricultural area)
X1 X2
Number of cultivated species, except for permanent grassland (number / number/ha of usual agricultural area)
X1 X2
Length of forest border (m / m/ha of usual agricultural area)
X1 X2
Enhancement and conservation of genetic heritage (IDEA method)
X1
Ecological buffer zones (IDEA method) X1

SEAMLESS No. 010036 Deliverable number: PD2.3.1 6 February 2006
Page 100 of 100
Measures to protect the natural heritage (IDEA method)
X1
Diversity of annual or temporary crops (IDEA method)
X1
Diversity of perennial crops (IDEA method) X1
Diversity of associated vegetation (IDEA method)
X1
Animal diversity (IDEA method) X1