RESULTS OF THE COMPREHENSIVE...
76
11/3/2017 - 1 - Final PWSA CPE Report RESULTS OF THE COMPREHENSIVE PERFORMANCE EVALUATION FOR THE PITTSBURGH WATER & SEWER AUTHORITY ASPINWALL WATER FILTRATION PLANT PITTSBURGH, PENNSYLVANIA SEPTEMBER 18 – 22, 2017
-
Upload
truongngoc -
Category
Documents
-
view
214 -
download
0
Transcript of RESULTS OF THE COMPREHENSIVE...

11/3/2017 - 1 - Final PWSA CPE Report
RESULTS OF THE
COMPREHENSIVE PERFORMANCE EVALUATION
FOR THE
PITTSBURGH WATER & SEWER AUTHORITY
ASPINWALL WATER FILTRATION PLANT
PITTSBURGH, PENNSYLVANIA
SEPTEMBER 18 – 22, 2017

11/3/2017 - 2 - Final PWSA CPE Report
Prepared By:
Pennsylvania Department of Environmental Protection
Rachel Carson State Office Building
400 Market Street
Harrisburg, Pennsylvania 17101
US Environmental Protection Agency Region III
Water Protection Division
Office of Drinking Water and Source Water Protection
1650 Arch Street
Philadelphia, Pennsylvania 19103
US Environmental Protection Agency Office of Water
Office of Ground Water and Drinking Water
Standards and Risk Management Division
Technical Support Center
26 W. M.L. King Drive
Cincinnati, Ohio 45268
Process Applications, Inc.
2627 Redwing Road, Suite 340
Fort Collins, Colorado 80526
11/3/2017 - 3 - Final PWSA CPE Report
Table of Contents
Page No.
SITE VISIT INFORMATION 6
INTRODUCTION 8
DESCRIPTION OF WATER TREATMENT PLANT 9
Overview 9
Water Treatment Processes 10
PERFORMANCE ASSESSMENT 12
Historical Performance Assessment 12
Performance Summary 27
Special Studies 28
MAJOR UNIT PROCESS EVALUATION 51
PERFORMANCE-LIMITING FACTORS 57
FACTORS SUMMARY CHART 57
“A” FACTOR EXAMPLES 58
“B” FACTOR EXAMPLES 66
“C” FACTOR EXAMPLES 69
APPENDIX
MPA RESULTS 71
PWSA ORGANIZATIONAL CHART 74
11/3/2017 - 4 - Final PWSA CPE Report
List of Figures Page No.
FIGURE 1 Process Flow Schematic of the Aspinwall Plant 10
FIGURE 2 Filter Effluent Configuration 14
FIGURE 3 OAS Turbidity Data Profile 17
FIGURE 4 Daily Maximum Clarified and Settled Turbidity Trends 18
FIGURE 5 Daily Maximum IFE and CFE Turbidity Trends 18
FIGURE 6 Filters 2 and 17 IFE Maximum Daily Turbidity Trends 21
FIGURE 7 Giardia Inactivation Ratio Calculated by CPE Team 25
FIGURE 8 CPE Calculated & PWSA Reported Giardia Inactivation Ratios 26
FIGURE 9 Filter 18 Waste Backwash Water Turbidity Profile 31
FIGURE 10 Example Filter 18 Flow Anomaly During Backwash Event 32
FIGURE 11 Filter 18 Recovery Curve Following Backwash 33
FIGURE 12 Turbidimeter Flow Rate vs. Manufacturer Specifications 37
FIGURE 13 Turbidimeter Sample Detention Time Check 38
FIGURE 14 Filter 12 IFE Turbidity Profile January 24-25, 2017 41
FIGURE 15 North and South CFE Turbidity August 31, 2017 42
FIGURE 16 Raw, Settled, & Clarified Turbidity Comparison 44
FIGURE 17 North CFE, South CFE, Filter 9 and Filter 16 IFE Turbidity 45
FIGURE 18 Water Quality Grab Sample Results 49
FIGURE 19 Total Manganese Trend at Each Unit Process 50
FIGURE 20 Major Unit Process Evaluation 52

11/3/2017 - 5 - Final PWSA CPE Report
List of Tables
TABLE 1 CPE Turbidity Performance Analysis Data Acquisition Description 13
TABLE 2 OAS Summary Statistics 16
TABLE 3 IFE Turbidity 95th Percentile by Month for Each Filter 20
TABLE 4 Backwash Return to Service Performance 22
TABLE 5 Individual Backwash Recovery and Filter Performance 23
TABLE 6 Aspinwall Treatment Plant Performance Summary 27
TABLE 7 Filter 18 Backwash Description 28
TABLE 8 Turbidimeter Settings 39
TABLE 9 Online Chlorine Analyzer Settings Check 46
TABLE 10 Results of Coagulant Dosage Evaluation 47
TABLE 11 Coordinated Water Quality Grab Sample Results 48
TABLE 12 Summary of Performance Limiting Factors 57
11/3/2017 - 6 - Final PWSA CPE Report
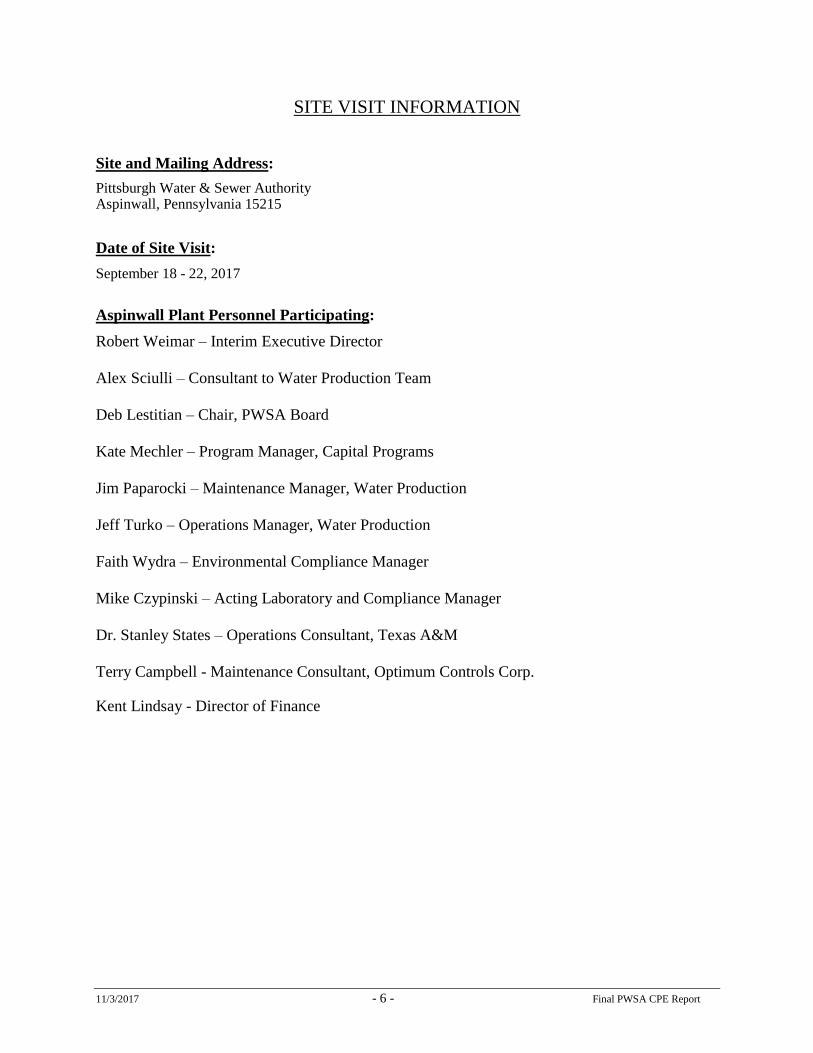
SITE VISIT INFORMATION
Site and Mailing Address:
Pittsburgh Water & Sewer Authority Aspinwall, Pennsylvania 15215
Date of Site Visit:
September 18 - 22, 2017
Aspinwall Plant Personnel Participating:
Robert Weimar – Interim Executive Director
Alex Sciulli – Consultant to Water Production Team
Deb Lestitian – Chair, PWSA Board
Kate Mechler – Program Manager, Capital Programs
Jim Paparocki – Maintenance Manager, Water Production
Jeff Turko – Operations Manager, Water Production
Faith Wydra – Environmental Compliance Manager
Mike Czypinski – Acting Laboratory and Compliance Manager
Dr. Stanley States – Operations Consultant, Texas A&M
Terry Campbell - Maintenance Consultant, Optimum Controls Corp.
Kent Lindsay - Director of Finance

11/3/2017 - 7 - Final PWSA CPE Report
CPE Team:
Larry DeMers – Process Applications, Inc., 2627 Redwing Rd., #340, Ft. Collins, CO 80526
970-223-5787; [email protected]
Bill Davis – Process Applications, Inc., 2627 Redwing Rd., #340, Ft. Collins, CO 80526
469-338-1823; [email protected]
Jennifer Bunton – Process Applications, Inc., 2627 Redwing Rd., #340, Ft. Collins, CO 80526
515-321-3035; [email protected]
Rick Lieberman – US Environmental Protection Agency, Technical Support Center, 26 W. M.L. King
Drive, Cincinnati, OH 45268, 513-569-7604, [email protected]
Alison Dugan – US Environmental Protection Agency, Technical Support Center, 26 W. M.L. King
Drive, Cincinnati, OH 45268, 513-569-7122, [email protected]
Matt Alexander – US Environmental Protection Agency, Technical Support Center, 26 W. M.L. King
Drive, Cincinnati, OH 45268, 513-569-7380, [email protected]
Kelly Moran – US Environmental Protection Agency, Region 3, 1650 Arch Street, Philadelphia, PA
19103-2029, 215-814-2331, [email protected]
Rick Rogers – US Environmental Protection Agency, Region 3, 1650 Arch Street, Philadelphia, PA
19103-2029, 215 814-5711, [email protected]
Ed Chescattie – Pennsylvania Department of Environmental Protection, Rachel Carson State Office
Building, 400 Market Street, Harrisburg, PA 17101, 717-772-2184, [email protected]
Bethany Shrodo – Pennsylvania Department of Environmental Protection, 208 West Third St.
Suite 101, Williamsport, PA 17701, 570-327-3732, [email protected]
Mike Hess – Pennsylvania Department of Environmental Protection, Rachel Carson State Office
Building, 400 Market Street, Harrisburg, PA 17101, 717-772-5679, [email protected]
Kevin Anderson – Pennsylvania Department of Environmental Protection, Rachel Carson State Office
Building, 400 Market Street, Harrisburg, PA 17101, 717-783-9764, [email protected]
Renee Diehl – Pennsylvania Department of Environmental Protection, 400 Waterfront Drive, Pittsburgh,
PA 15222, 412 442-4217, [email protected]
John Paone – Pennsylvania Department of Environmental Protection, 400 Waterfront Drive, Pittsburgh,
PA, 724-925-5408, [email protected]
Laura Blood – Pennsylvania Department of Environmental Protection, Address, 724-925-5547,

11/3/2017 - 8 - Final PWSA CPE Report
INTRODUCTION
The Composite Correction Program (CCP)1 is an approach developed by the U. S. Environmental
Protection Agency (USEPA) and Process Applications, Inc. (PAI) to improve surface water
treatment plant performance and to achieve compliance with the Surface Water Treatment Rule
(SWTR). Its development was initiated by PAI and the State of Montana2, which identified the
need for a program to manage performance problems at its surface water treatment plants.
A Comprehensive Performance Evaluation (CPE) is a thorough evaluation of an existing
treatment plant, resulting in a comprehensive assessment of the unit process capabilities and the
impact of the operation, maintenance, and administrative practices on performance of the plant.
The results of the evaluation establish the plant capability to consistently meet the optimization
goals and list a set of prioritized factors limiting performance. Follow up technical assistance
can be used to improve performance of an existing plant by systematically addressing the factors
limiting performance identified during the CPE.
The federal Surface Water Treatment Rule (SWTR), Interim Enhanced Surface Water Treatment
Rule, and Long-Term 1 Enhanced Surface Water Treatment Rules require plants to achieve less
than 0.3 NTU (nephelometric turbidity units) in 95 percent of the monthly combined filter
effluent samples and to monitor individual filter performance. The enhanced SWTR
requirements have been in effect for all surface water treatment plants since 2005. Research
results and field experience have shown that achieving 0.3 NTU does not guarantee protection
against some pathogenic microorganisms, as evidenced by some waterborne disease outbreaks.
Producing a finished water with a turbidity of less than or equal to 0.10 NTU provides much
greater protection against pathogens like Cryptosporidium. This microorganism passed through
the public water supply and was responsible for a large outbreak of Cryptosporidiosis in
Milwaukee, Wisconsin, in April 1993, where 400,000 people became ill and nearly 100 died.
1 Hegg, B.A., L.D. DeMers, J.H. Bender, E.M. Bissonette, and R.J. Lieberman, Handbook - Optimizing Water Treatment Plant
Performance Using the Composite Correction Program, EPA 625/6-91/027, USEPA, Washington, D.C. (August 1998).
2 Renner, R.C., B.A. Hegg, and D.F. Fraser, Demonstration of the Comprehensive Performance Evaluation Technique to Assess
Montana Surface Water Treatment Plants, Association of State Drinking Water Administration Conference, Tucson, AZ
(February 1989).
11/3/2017 - 9 - Final PWSA CPE Report
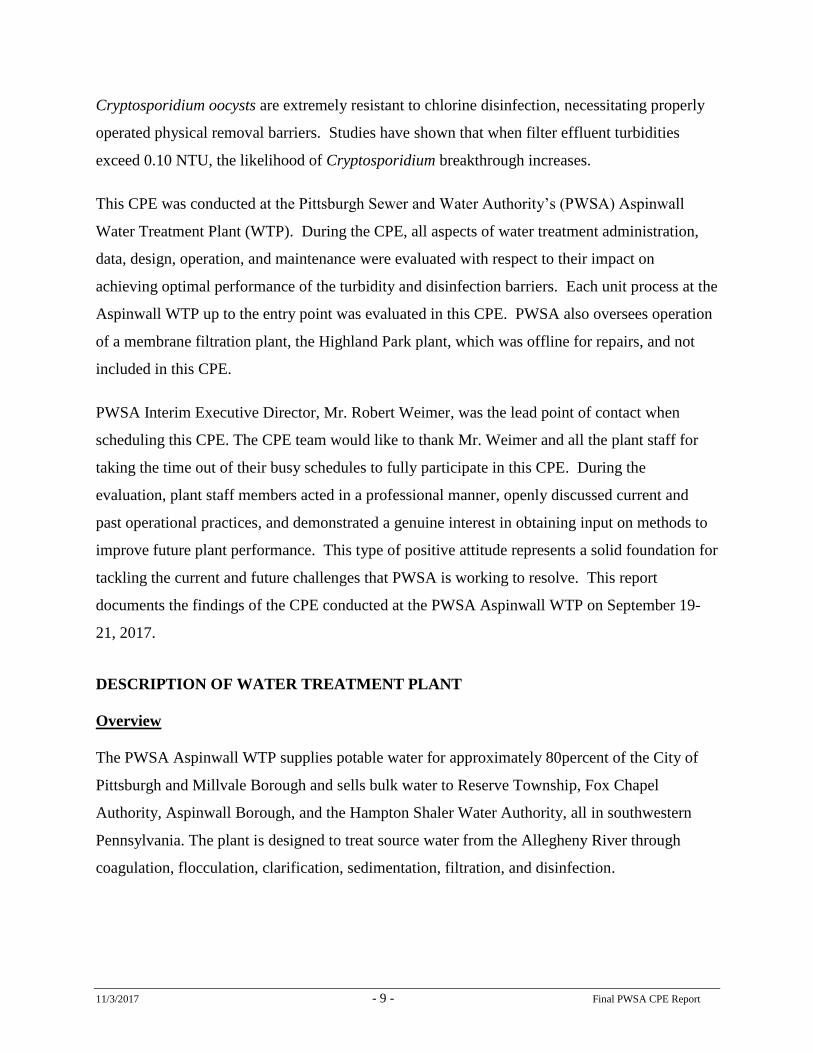
Cryptosporidium oocysts are extremely resistant to chlorine disinfection, necessitating properly
operated physical removal barriers. Studies have shown that when filter effluent turbidities
exceed 0.10 NTU, the likelihood of Cryptosporidium breakthrough increases.
This CPE was conducted at the Pittsburgh Sewer and Water Authority’s (PWSA) Aspinwall
Water Treatment Plant (WTP). During the CPE, all aspects of water treatment administration,
data, design, operation, and maintenance were evaluated with respect to their impact on
achieving optimal performance of the turbidity and disinfection barriers. Each unit process at the
Aspinwall WTP up to the entry point was evaluated in this CPE. PWSA also oversees operation
of a membrane filtration plant, the Highland Park plant, which was offline for repairs, and not
included in this CPE.
PWSA Interim Executive Director, Mr. Robert Weimer, was the lead point of contact when
scheduling this CPE. The CPE team would like to thank Mr. Weimer and all the plant staff for
taking the time out of their busy schedules to fully participate in this CPE. During the
evaluation, plant staff members acted in a professional manner, openly discussed current and
past operational practices, and demonstrated a genuine interest in obtaining input on methods to
improve future plant performance. This type of positive attitude represents a solid foundation for
tackling the current and future challenges that PWSA is working to resolve. This report
documents the findings of the CPE conducted at the PWSA Aspinwall WTP on September 19-
21, 2017.
DESCRIPTION OF WATER TREATMENT PLANT
Overview
The PWSA Aspinwall WTP supplies potable water for approximately 80percent of the City of
Pittsburgh and Millvale Borough and sells bulk water to Reserve Township, Fox Chapel
Authority, Aspinwall Borough, and the Hampton Shaler Water Authority, all in southwestern
Pennsylvania. The plant is designed to treat source water from the Allegheny River through
coagulation, flocculation, clarification, sedimentation, filtration, and disinfection.

11/3/2017 - 11 - Final PWSA CPE Report
From the influent stilling basin, water flows through two traveling screens. After the screens,
ferric chloride is added in a common trough prior to rapid mix. The water then flows through
four constant speed flash mixers in series. Lime is added to the first chamber, and cationic
polymer is added to the third chamber. Caustic soda and/or activated carbon can be fed into each
of the rapid mix chambers. The estimated contact time in each mixer was approximately 30
seconds according to the PWSA engineering consultants.
From the rapid mix basins, water flows by gravity to four flocculation and clarification basins.
Each clarification unit includes two, 2-stage flocculators and a conventional sedimentation basin
(referred to as a “clarifier” by PWSA staff). The flocculators are operated at constant speed.
Waste sludge is scraped from the bottom of the sedimentation basin, via an automated removal
system, and sent to the clarifier residual distribution chamber. Clarifier effluent water flows over
weirs and is sent to a central receiving basin where the flow is split to two large uncovered
concrete sedimentation basins. There is no automated sludge removal mechanism provided for
these basins. From the sedimentation basins, water flows to the filter building; chlorine and
cationic polymer are added prior to the filter splitter box.
From the splitter box, water flows to 18 dual media (18 inches anthracite and 12 inches sand)
filters. Flow onto the filters is controlled by modulating valves on the individual filter effluent
lines. Each filter has two cells. The cells have separate underdrain systems and are washed
independently.
Each filter is backwashed just prior to approximately 100 hours of run time. Filtered water is
used for backwashing, but the distribution system water can also be utilized for backwashing as
long as adequate distribution system pressure is available (e.g. not available while Lamphur
reservoir is offline). Backwash begins with air scour, followed by combined air and water wash,
high rate water only wash, and then ETSW. Spent backwash water is sent to the backwash
storage tank. This plant has always had filter to waste capabilities, but just recently began using
filter to waste; water filtered to waste is sent to the backwash storage tank. Supernatant from the
backwash storage tank is recycled to the East intake stilling basin constantly at a rate of five
percent (capacity exists to recycle at a rate of 10 percent). Each filter has one individual filter
effluent sample line that carries a sample stream to a Hach 1720E turbidimeter. The current

11/3/2017 - 12 - Final PWSA CPE Report
location of sample taps leaves one cell of each filter unmonitored. The filters discharge into an
effluent pipe where chlorine is added for disinfection.
PERFORMANCE ASSESSMENT
Historical Performance Assessment
To achieve optimized performance, a water treatment plant must demonstrate that it can take a
raw water source of variable quality and produce consistent, high quality finished water.
Further, the performance of each unit process must demonstrate its capability to act as a barrier
to the passage of particles at all times.
The CPE team used turbidity data collected from the Aspinwall plant’s continuous reading
turbidimeters and laboratory log sheets (representing grab sampling results) to assess the
effectiveness of the flocculation/clarification/sedimentation and filtration barriers. The turbidity
data used in the performance evaluation were collected over a 12-month period, starting
September 19, 2016 and ending September 18, 2017. The CPE team also used Giardia log
inactivation calculations to assess the performance of the disinfection barrier. The data used to
assess the disinfection barrier were obtained from the spreadsheet PWSA is using to report their
Redacted-Security Issue

11/3/2017 - 13 - Final PWSA CPE Report
daily log inactivation to PA DEP as well as data from the Pennsylvania Drinking Water
Information System (PADWIS). Disinfection data were only available from the time period
May 5 through August 31, 2017. See Table 1 for a discussion of the data sources used in the
CPE performance analysis.
TABLE 1. CPE Performance Analysis Data Acquisition Description
Performance Parameter Data Used in the CPE Performance Analysis
Raw water turbidity Data were taken from daily log sheets kept in the Aspinwall laboratory.
Records were not available for the time period between September 19
and October 31, 2016. Lab personnel collect raw water turbidity grab
samples once per day from a sample location in the river, prior to the
water being exposed to permanganate. There is a continuous analyzer
that measures raw water turbidity prior to coagulant addition but the
continuous data were not used for this analysis due to the presence of
permanganate in the water at the sample point, potentially affecting the
turbidity measurement, and the “capping” of the continuous data at 100
NTU. The grab sample data were not “capped”.
Clarifier turbidity Data were taken from fifteen-minute readings extracted from the plant
Supervisory Control and Data Acquisition (SCADA) system. The
clarifier continuous turbidity sample location is on the combined
clarifier flume prior to leaving the clarification building and prior to the
transmission line to the settling ponds, so the readings represent the
turbidity from the mixed water coming from all the clarifiers in
operation.
Settled water turbidity Data were taken from one-minute readings extracted from the plant
SCADA system. The settled water continuous turbidity sample
location is on the transmission line from the settling ponds, so the
readings represent the turbidity from the mixed water coming from both
ponds.
Individual Filter Effluent
(IFE) turbidity
Data were taken from fifteen-minute readings extracted from the plant
SCADA system. The IFE continuous turbidity sample location at each
filter is located on a manifold line that connects two separate filter
cells. The meter is generally closest to the filter cell furthest from the
filter effluent line. A filter effluent configuration diagram showing the
approximate IFE turbidity sample location for a typical filter is
provided in Figure 2. The data extracted from the SCADA historian
was further processed by the CPE team to attempt to exclude data that
represented turbidity during times when the filter was not in service.
This was done by reviewing the filter flow rate (also extracted from the
SCADA historian) and excluding all turbidity data when the flow rate
seemed to be at or near zero. Due to anomalies in the filter flow rate
data (See Special Study 2 and Figure 10) the turbidity values occurring
when the flow read 1.3 MGD or below were excluded. Post backwash


11/3/2017 - 15 - Final PWSA CPE Report
Turbidity Evaluation
Raw water, settled water, IFE, and CFE turbidity data were entered into an Optimization
Assessment Spreadsheet (OAS), and analyzed through the spreadsheet calculations and charts.
Table 2 shows the OAS summary statistics for the plant.
The statistics in Table 2 show the maximum daily values for raw, settled, IFE, and CFE turbidity
during the September 19, 2016 to September 15, 2017 period, along with a comparison to
optimization goals. For optimization purposes, the maximum daily turbidity readings are used to
show the daily worst case performance by each of the barriers. If the plant can perform within
the optimization goals at the time of its worst daily performance, then the plant staff can be
assured that it is also meeting the goals during the rest of the day and providing the maximum
public health protection. Table 2 shows that the annual average daily maximum raw water
turbidity for the Aspinwall WTP was 16.1 NTU. For raw water conditions such as this, where
the annual average daily maximum raw water turbidity is above 10 Nephelometric Turbidity
Units (NTU), the optimization goal for settled water turbidity is ≤ 2.0 NTU in 95 percent of daily
readings. The daily maximum clarified water and settled water turbidity met the optimization
goal on only 0.3 and 52.2 percent of the days respectively. The daily maximum clarified water
turbidity was ≤ 10.0 NTU in 95percent of the days and the daily maximum settled water turbidity
was ≤ 5.0 NTU on 95 percent of the days during the evaluation period. It should be noted that
both of these statistics were derived from data that had been “capped” by the SCADA system
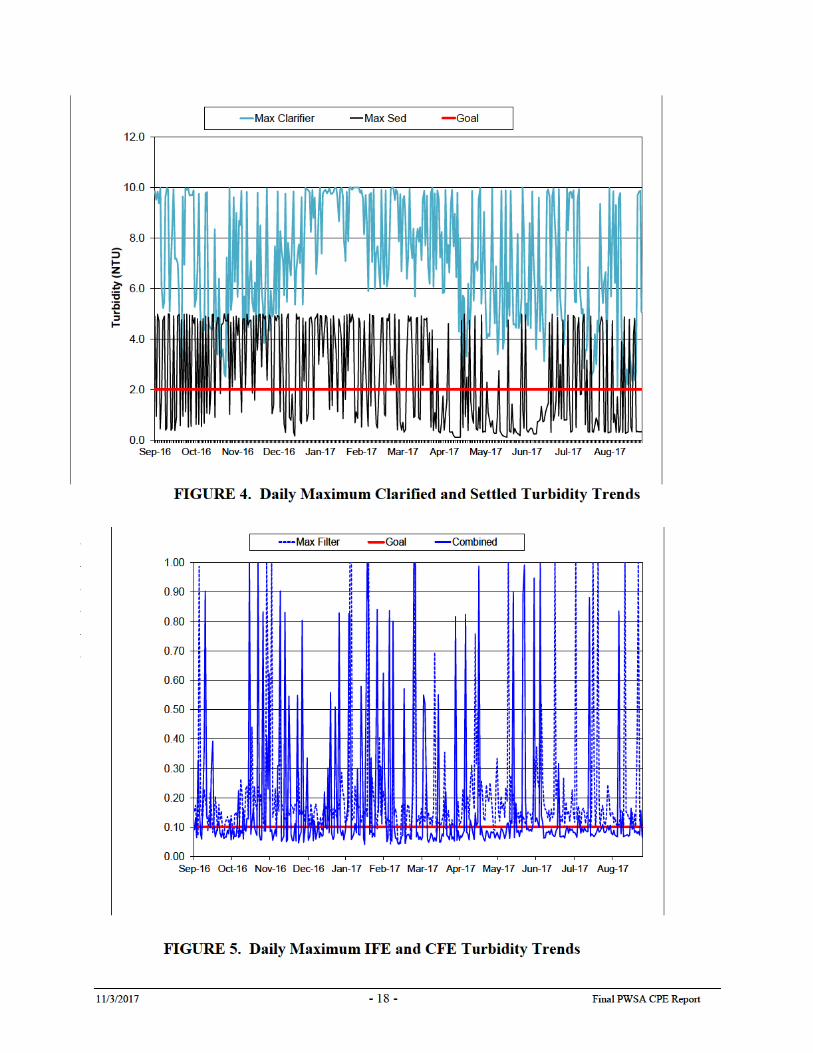
historian so the actual 95th percentile of both readings was higher. Table 2 shows that the daily
maximum IFE turbidity values (labeled as “max. filtered turbidity”) met the optimization goals
on about 10.7 percent of the days analyzed. The daily maximum IFE values were 0.52 NTU or
less on 95 percent of the days analyzed. The daily maximum CFE values (labeled as “combined
filtered turbidity”) met the optimization goal of 0.10 NTU on 66 percent of the days analyzed;
CFE values were 0.83 NTU or less during 95 percent of the days in the period.

11/3/2017 - 16 - Final PWSA CPE Report
TABLE 2. OAS Summary Statistics
RSQ = Correlation Coefficient for two selected data-sets (>0.25 suggests correlation).
95percent = 95th percentile value for data-set.
Opt. Goal = Percent of values in data-set that are less than or equal to the selected optimization turbidity goal.
Reg. = Percent of values in data-set that are less than or equal to the regulated turbidity requirement.
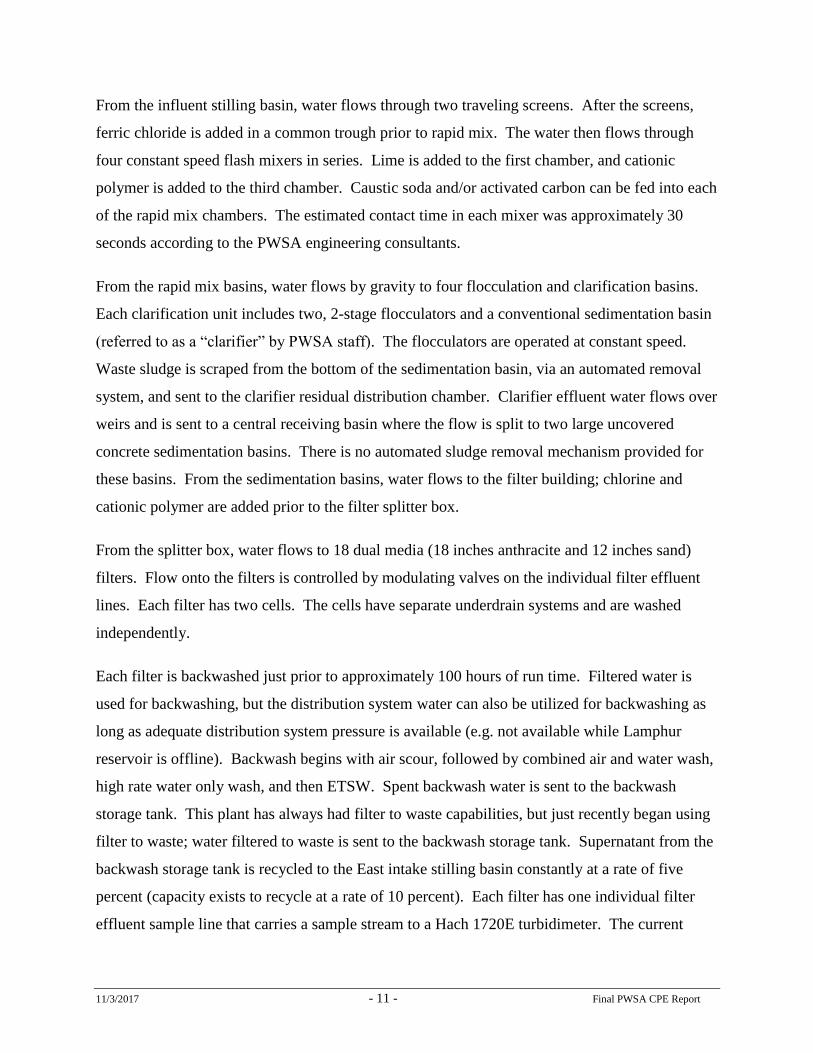
While Table 2 provides a summary of the plant’s turbidity performance compared to the
optimization goals, Figure 3 provides a visual representation of the plant turbidity profile
compared to the optimization goals. The figure shows that higher raw water turbidity values
occurred intermittently throughout the year. The lowest clarified water turbidity values tended to
occur when the raw water turbidity was also low, around late October and early November 2016
but the clarifier performance was inconsistent all year and reached the data cap of 10 NTU on
many occasions. The settled water turbidity tended to be lower than the clarified water turbidity
but it also reached its data cap often, so the maximum settled water turbidities for many days
cannot be reliably verified as lower than the clarified water turbidity. The data cap for clarified
water was 10 NTU and the data cap for settled water was 5 NTU. Capping of these data would
skew the RSQ result such that any correlation between raw water turbidity spikes and clarified
water spikes would not be accurately measured. Passage of turbidity spikes from the raw
through the clarifiers and/or the sedimentation ponds would represent the potential for higher
risk of pathogens passing through the treatment barriers. Data capping prevents the ability of the
PWSA plant staff to assess that risk. The data capping of the clarified turbidity and settled water
turbidity is more evident when those two trends are isolated in Figure 4. Figure 4 also shows
performance relative to the settled water turbidity goal for the settling processes.
Avg Min Max RSQ 95% Opt. Goal Reg.
NTU NTU NTU NTU % Values % Values
Raw Turbidity 16.1 2.0 147.0 n/a 51.7 n/a n/a
Max. Clarifier Turbidity 7.1 2.0 10.0 0.00 10.0 0.3 n/a
Max. Settled Turbidity 2.5 0.1 5.0 0.00 5.0 52.2 n/a
Max. Filtered Turbidity 0.20 0.04 1.03 0.00 0.52 10.7 n/a
Combined Filtered Turbidity 0.17 0.04 1.00 0.02 0.83 66.4 85.8
ANNUAL DATA


11/3/2017 - 19 - Final PWSA CPE Report
Table 3 shows the 95th percentile turbidity values for each filter by month and summarizes the
entire year of the study period. Blank cells in the table indicate no turbidity data was available
from the 15-minute SCADA extraction for that time period. The CPE team assessed the filter
rehabilitation project schedule and confirmed that the lack of turbidity data during those time
periods were due to the filters being out of service for upgrading. The highest 95th percentile
value for each month is shown in red in the table. Table 3 shows filter 2 was the only filter to
meet the ≤ 0.10 NTU optimization goal 95percent of the days evaluated. Filter 17 was the
worst performing filter, meeting the goal only 71.5 percent of the days during the evaluation
period. The 95th percentile for filter 17 was ≤ 0.24 NTU. Filter 12 had the worst performance
for three consecutive months during the December to February period. As a comparison, the
annual maximum daily turbidity data from Filters 2 and 17 are shown in Figure 6. The filter 2
trend line in Figure 6 is less erratic than the trend line for filter 17, indicating more consistent
performance. It also shows a trend that is more consistently below the goal of ≤ 0.10 NTU.

11/3/2017 - 20 - Final PWSA CPE Report
TABLE 3. IFE Turbidity 95th Percentile by Month for Each Filter
Filtered Water Turbidity95th Percentile Values (NTU)
Filter 1 Filter 2 Filter 3 Filter 4 Filter 5 Filter 6 Filter 7 Filter 8 Filter 9 Filter 10 Filter 11 Filter 12 Filter 13 Filter 14 Filter 15 Filter 16 Filter 17 Filter 18 Combined
Sep-16 0.24 0.73 0.15 0.13 0.11 0.15 0.13 0.09 0.12 0.12 0.15 0.11 0.29 0.16 0.35
Oct-16 0.10 0.14 0.19 0.12 0.14 0.12 0.10 0.13 0.15 0.26
Nov-16 0.08 0.17 0.12 0.42 0.16 1.00 0.22 0.28 0.17 0.17 0.28 0.96
Dec-16 0.07 0.12 0.12 0.13 0.14 0.15 0.15 0.18 0.12 0.14 0.17 0.68
Jan-17 0.09 0.12 0.19 0.13 0.15 0.14 0.16 0.61 0.17 0.15 0.15 0.82
Feb-17 0.11 0.16 0.14 0.18 0.11 0.17 0.16 0.30 0.14 0.18 0.11 0.84
Mar-17 0.09 0.14 0.15 0.14 0.12 0.17 0.16 0.11 0.12 0.21 0.11 0.78
Apr-17 0.08 0.12 0.11 0.20 0.12 0.11 0.16 0.11 0.11 0.14 0.17 0.13 0.16 0.13 0.70
May-17 0.09 0.14 0.14 0.21 0.14 0.17 0.14 0.18 0.24 0.22 0.28 0.19 0.25 0.17 0.14
Jun-17 0.10 0.08 0.12 0.23 0.39 0.20 0.20 0.16 0.20 0.17 0.18 0.28 0.32 0.13 0.97
Jul-17 0.08 0.09 0.11 0.14 0.09 0.13 0.17 0.24 0.09 0.14 0.11 0.13 0.16 0.65 0.13
Aug-17 0.10 0.04 0.27 0.13 0.10 0.16 0.17 0.17 0.09 0.10 0.13 0.12 0.16 0.17 0.47
Yr. 95% 0.09 0.14 0.16 0.19 0.13 0.17 0.16 0.18 0.17 0.15 0.17 0.16 0.24 0.17 0.83
Yr. Goal 96.7% 84.7% 82.2% 78.7% 85.5% 80.0% 75.9% 85.1% 88.9% 84.7% 77.8% 80.5% 71.5% 73.7% 66.4%

11/3/2017 - 21 - Final PWSA CPE Report
FIGURE 6. Filters 2 and 17 IFE Maximum Daily Turbidity Trends
The optimization goal for individual filters that have filter to waste capability is to filter to waste
following each filter backwash, and return the filter to service with turbidity less than 0.10 NTU
and for the filter performance to remain less than 0.10 NTU for the entire filter run. The
summary statistics from previously discussed Table 2 revealed poor IFE and CFE performance.
Since filter to waste capability was not being utilized, data from the SCADA historian were
available for analysis of filter performance during the ripening period. The 15-minute data from
the SCADA historian were used to document all the backwashes at the Aspinwall plant during
February 2017 (representing a time when water temperatures would be cold and filter recovery
might be a challenge) and during the August 15 to September 18, 2017 period (representing the
most recent time period prior to the CPE site visit). The data were analyzed by trending the filter
effluent flow and filter turbidity data and finding typical backwash spikes after a period with low
flow.
Table 4 summarizes the backwash return to service performance statistics for the time periods
evaluated.
0.00
0.10
0.20
0.30
0.40
0.50S
ep-1
6
Oct-
16
No
v-1
6
De
c-1
6
Jan
-17
Fe
b-17
Mar-17
Ap
r-1
7
May-1
7
Jun
-17
Jul-
17
Au
g-1
7
Se
p-1
7
Eff
lue
nt
Tu
rb
idit
y (
NT
U)
Filter 2
0.00
0.10
0.20
0.30
0.40
0.50
Se
p-1
6
Oct-
16
No
v-1
6
De
c-1
6
Jan
-17
Fe
b-17
Mar-17
Ap
r-1
7
May-1
7
Jun
-17
Jul-
17
Au
g-1
7
Se
p-1
7
Eff
lue
nt
Tu
rb
idit
y (
NT
U)
Filter 17


11/3/2017 - 24 - Final PWSA CPE Report
to achieve and maintain optimized performance. Optimizing the backwash procedure could
reduce the recovery time of the filters and reduce the time necessary for filter to waste.
Disinfection Evaluation
The disinfection treatment process is an important barrier to microorganisms in any surface
water treatment plant. In addition to maintaining adequate turbidity removal via pretreatment
and filtration, the Aspinwall WTP is also required to maintain an additional 90percent (1-log)
inactivation of Giardia cysts, and 99.99percent (4-log) inactivation of viruses in accordance with
Pennsylvania regulations.
To evaluate the disinfection process, the CPE team collected data from the spreadsheet PWSA is
using to report their daily log inactivation to Pennsylvania Department of Environmental
Protection (PA DEP) and the PADWIS to calculate inactivation ratios. This data included
maximum daily flow, minimum daily temperature, maximum daily pH, minimum daily depth of
the clear well, and minimum daily chlorine residual. The inactivation ratio is the concentration
of disinfectant residual times the contact time through the disinfection zone (C x T or CT)
achieved at the plant on a particular day, divided by the CT required (CTreq) to achieve 1.0 log
inactivation of Giardia cysts. The CPE team calculated the plant inactivation ratios for May 5
through August 31, 2017. Graphical representation of the data is depicted in Figure 7.
During a prior evaluation conducted by the PA DEP in April of 2017, the physical characteristics
of the clear well were observed as they related to the baffling factor of 0.48 being used by PWSA
staff for CT calculations at that time. PA DEP staff determined during that evaluation that a
baffling factor of 0.3 was the maximum that could be allowed without a tracer study, given the
clear well design. The PWSA staff immediately implemented use of the 0.3 baffling factor in
plant disinfection calculations. The Giardia inactivation ratios shown in Figure 7 were generated
using a baffling factor of 0.3, data compiled by PWSA for daily calculation of inactivation ratios
(PWSA Log Inactivation Data spreadsheets), and minimum daily entry point chlorine residuals
reported to PADWIS.
As shown in Figure 7, the plant typically was not challenged to meet the required inactivation
ratio during the evaluation period. The inactivation ratio fell below 2.0 in late June due to low

11/3/2017 - 25 - Final PWSA CPE Report
chlorine residual in the clear well. During a CPE, the inactivation ratio would typically be
assessed over the past year, but the CPE team was not able to locate data needed for CT
calculations prior to May 5, 2017. Ideally, the inactivation ratio should be evaluated during the
winter months when the source water has a lower temperature.
FIGURE 7. Giardia Inactivation Ratio Calculated by CPE Team
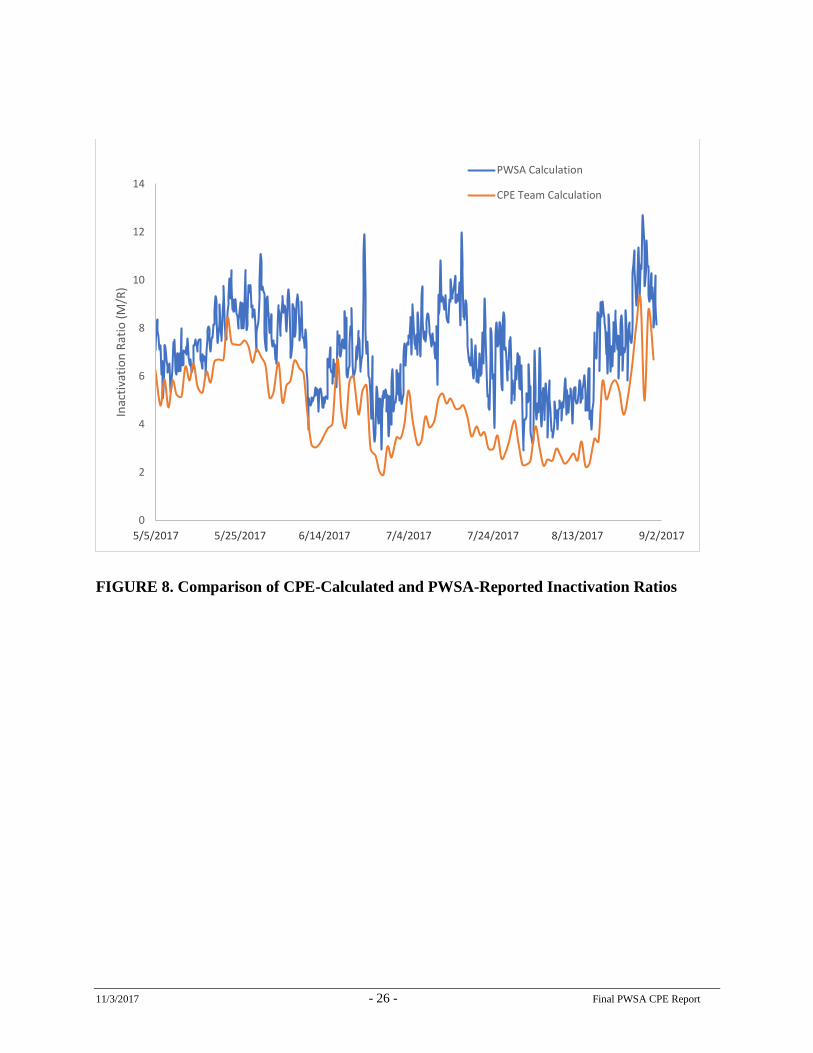
The inactivation ratios calculated by the CPE team were compared to the inactivation ratios
reported to the PA DEP during the same period. This comparison, shown in Figure 8, indicates
that inactivation ratios reported by PWSA for the Aspinwall WTP were consistently higher than
those calculated by the CPE team. Analysis of the data indicates that the discrepancy may be
due to the way the minimum chlorine residual is being determined each day and to minor
differences in the calculation of minimum daily depth or volume of the clear well. As a result,
the method of determining minimum chlorine residual and minimum clear well volume should
be reviewed to ensure that disinfection requirements are met using accurate and representative
data.
11/3/2017 - 26 - Final PWSA CPE Report
FIGURE 8. Comparison of CPE-Calculated and PWSA-Reported Inactivation Ratios
0
2
4
6
8
10
12
14
5/5/2017 5/25/2017 6/14/2017 7/4/2017 7/24/2017 8/13/2017 9/2/2017
Inac
tiva
tio
n R
atio
(M
/R)
PWSA Calculation
CPE Team Calculation

11/3/2017 - 27 - Final PWSA CPE Report
Performance Summary
The performance observations described above are summarized in Table 6.
TABLE 6. Aspinwall Treatment Plant Performance Summary
Barrier Optimization Goal Performance
Sedimentation Settled water turbidity 2 NTU or
less 95 percent of the time based
on daily maximum values.
The clarified water turbidity met the settled
water goal only 0.3 percent of the days in the
most recent year. The 95th percentile
turbidity value of the clarified water was
equal to the data cap of 10 NTU. The settled
water turbidity from the settling ponds met
the goals 52percent of the days with a 95th
percentile turbidity value equal to the data
cap of 5.0 NTU. Capping of data prevented
an accurate assessment of raw water turbidity
spikes passing through the clarification and
sedimentation processes.
Filtration IFE and CFE turbidities 0.10 NTU
or less 95 percent of the time based
on daily maximum values.
The daily maximum turbidity values from
the IFE data set show the filters to meet the
optimization goal in 10.7 percent of the days
in the most recent year. The 95th percentile
turbidity value was 0.52 NTU.
The daily maximum values from the CFE
turbidity records in the last year show the
optimization goal to be achieved at the
Aspinwall plant 66.4percent of the days. The
95th percentile turbidity value over that
period is 0.83 NTU.
Disinfection Inactivation ratio above 1-log
every day that the plant is in
operation.
The disinfection process met the inactivation
ratio goal every day during the period
reviewed (May 5 thru August 31, 2017).
Data prior to May 5 was not evaluated as
PWSA staff only recently started tracking
inactivation ratios using a CT spreadsheet
that was provided by PA DEP.

11/3/2017 - 28 - Final PWSA CPE Report
Special Studies
During the CPE, several special studies were conducted for use in assessing plant performance
and process control. These studies included: 1) a filter bed expansion, 2) filter backwash cleaning
efficiency, 3) post-backwash turbidity recovery; 4) microscopic particulate analysis, and 5) turbidity data
integrity assessment, which consisted of four smaller studies 6) online chlorine analyzer setting check 7)
coagulant dosage evaluation, and 8) coordinated water quality grab sampling
Special Study 1: Filter Bed Expansion
For the filter related studies, Filter 18 was selected because it was close to the maximum filter
run time targeted by the operators (i.e., 100 hours) on the day of the study. All the filters have
been recently renovated, and the filter media includes 12 inches of sand and 18 inches of
anthracite for a total media depth of 30 inches. A recently implemented filter backwash routine
is summarized in Table 7. During the air scour event, even distribution of the air flow was
observed across both halves of filter 18, and during the high rate water wash, similar flow
distribution was observed across both filter cells.
TABLE 7. Filter 18 Backwash Description
Backwash Event Duration
Drain both filter cells to about 0.5 feet above media. ~ 45 min.
Air scour west cell. 5 min.
Combined air and water wash until water level reaches 1.8
feet.
High rate water only wash. 5 min.
ETSW at 66percent of pump speed. 8 min.
Air scour east cell. 5 min.
Combined air and water wash until water level reaches 1.8
feet.
High rate water only wash. 5 min.
ETSW at 66percent of pump speed. ~ 8 min.

11/3/2017 - 29 - Final PWSA CPE Report
Refill filters
Filter to waste (both cells together) - recently implemented
by water quality staff.
60 min.
Return to service.
During the high rate water wash, the filter media expansion was measured using a Secchi type
disk to detect the top of the expanded anthracite media. The measured expansion for the west
filter cell was 5 inches, and the measured expansion for the east cell was 4.5 inches. Based on a
total filter media depth of 30 inches, the bed expansion was approximately 17 percent for the
west cell and 15 percent for the east cell. To achieve good cleaning of the filter media during
backwash, a bed expansion of 20 percent or greater is typically recommended. The design
engineer for the filters commented during the study that the backwash pumping rate was
currently limited to 90 percent capacity due to a pump vibration problem. Once this issue is
resolved, slightly higher bed expansion should be achievable. This special study was only
conducted on both cells of Filter 18 during September water temperatures. Plant operators are
encouraged to complete this study on all the filters to establish baseline information, and
conducting this study on a routine basis is considered an essential component of a filter
maintenance program. Water temperatures in Pennsylvania change significantly throughout the
year, and these changes in temperatures directly impact water density, which in turn impacts bed
expansion. Other filter plants in Pennsylvania have documented that percent bed expansion
increases in winter and decreases in summer.
Special Study 2: Filter 18 Backwash Cleaning Efficiency
The efficiency of the backwash for cleaning a filter was assessed by collecting grab samples
from the wash water trough during backwash and measuring turbidity with a Hach portable
2100Q turbidimeter.
11/3/2017 - 30 - Final PWSA CPE Report
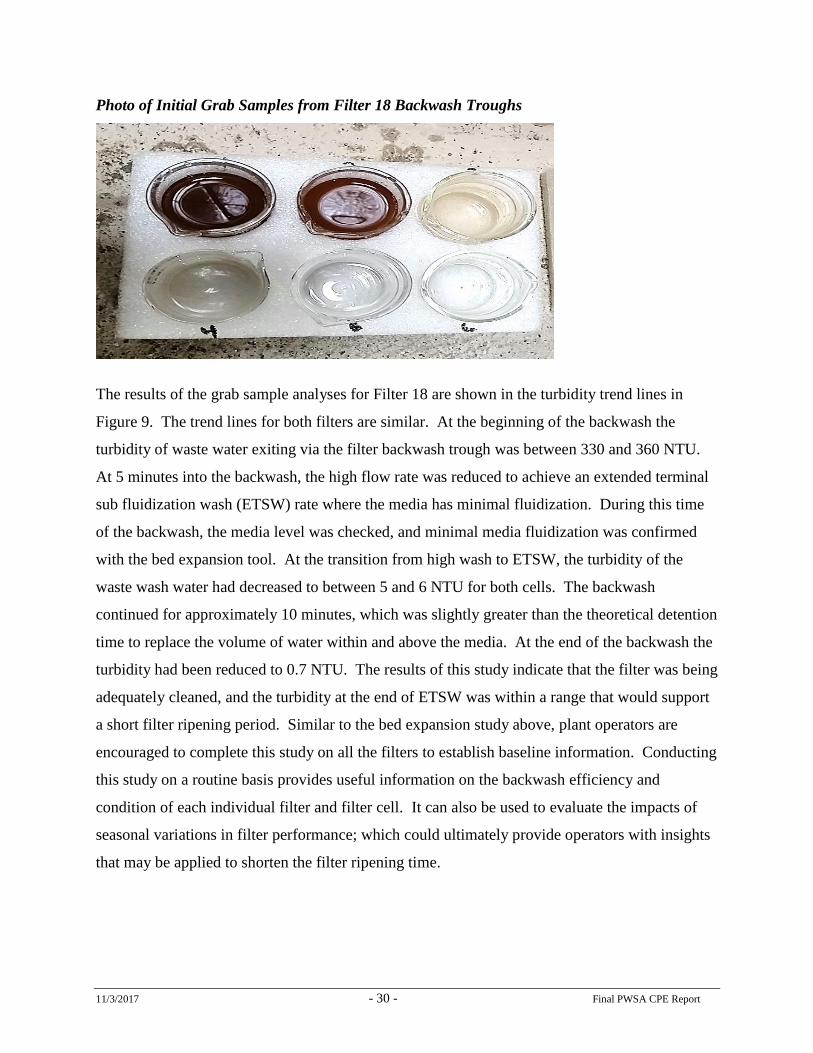
Photo of Initial Grab Samples from Filter 18 Backwash Troughs
The results of the grab sample analyses for Filter 18 are shown in the turbidity trend lines in
Figure 9. The trend lines for both filters are similar. At the beginning of the backwash the
turbidity of waste water exiting via the filter backwash trough was between 330 and 360 NTU.
At 5 minutes into the backwash, the high flow rate was reduced to achieve an extended terminal
sub fluidization wash (ETSW) rate where the media has minimal fluidization. During this time
of the backwash, the media level was checked, and minimal media fluidization was confirmed
with the bed expansion tool. At the transition from high wash to ETSW, the turbidity of the
waste wash water had decreased to between 5 and 6 NTU for both cells. The backwash
continued for approximately 10 minutes, which was slightly greater than the theoretical detention
time to replace the volume of water within and above the media. At the end of the backwash the
turbidity had been reduced to 0.7 NTU. The results of this study indicate that the filter was being
adequately cleaned, and the turbidity at the end of ETSW was within a range that would support
a short filter ripening period. Similar to the bed expansion study above, plant operators are
encouraged to complete this study on all the filters to establish baseline information. Conducting
this study on a routine basis provides useful information on the backwash efficiency and
condition of each individual filter and filter cell. It can also be used to evaluate the impacts of
seasonal variations in filter performance; which could ultimately provide operators with insights
that may be applied to shorten the filter ripening time.


11/3/2017 - 32 - Final PWSA CPE Report
FIGURE 10. Example Filter 18 Filter Flow Anomaly during Backwash Event
Special Study 3: Post Backwash Turbidity Recovery
The performance of filters following backwash is critical because a long filter ripening period
can result in the passage of pathogens (indicated by high turbidity levels) into the finished water.
Even relatively low levels of turbidity can result in large numbers of particles, such as
Cryptosporidium, passing through filters during this period. In addition, plants that are striving
to achieve the filter effluent turbidity optimization goal of 0.10 NTU often experience their
highest daily turbidity level during a filter ripening period. The Aspinwall plant has filter to
waste capability; however, use of this function was only implemented just prior to the time that
the CPE was conducted. In addition, the use of the ETSW as part of the filter backwash
procedure is also very effective for reducing filter ripening times. This practice was also
implemented just prior to the CPE.
The post backwash recovery performance for Filter 18 was recorded from the continuous filter
turbidimeter by the CPE team. This turbidimeter currently represents the performance of only
one of the two cells on filter 18. With the current sampling location, the monitoring does
accurately monitor performance during filter to waste. The post-backwash recovery performance
for Filter 18 is shown in Figure 11. For this backwash, the filter to waste period occurred for
about 55 minutes, and during this period the turbidity was relatively stable with values ranging
from 0.05 to 0.07 NTU. When the filter was returned to service, the turbidity was also stable as
indicated by turbidity values in the 0.06 to 0.07 NTU range. Results from this backwash indicate
that the combination of including the ETSW step at the end of filter backwash with filter to
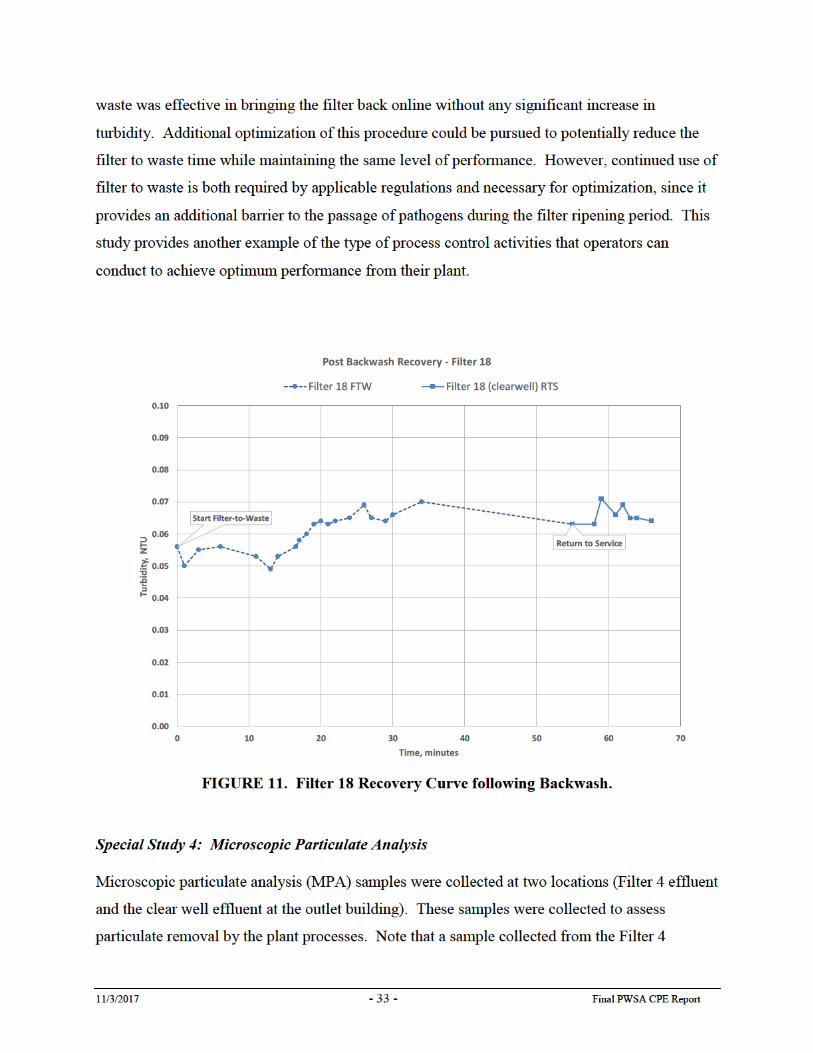

11/3/2017 - 34 - Final PWSA CPE Report
combined effluent (i.e. both filter cells) was disconnected early due to the visual observation that
excessive sediment collected in the filter housing (see photo on page 35). The tap for this sample
was positioned at the bottom of the Filter 4 effluent pipe at a location which included flow from
both the west and east filter cells. Some of the sediment captured within the MPA filter and
housing appeared to be rust, while some appeared to be sand and anthracite. It is possible that
some of the filter media was present from the recent filter renovations, and media replacement.
However, if the presence of filter media within the filter effluent line were to persist, this would
be an indication of a potential underdrain integrity issue. Therefore, PWSA should visually
inspect the condition of each filter following backwash to insure depressions are not present
across the filter surface. The lab was not able to definitively identify the cause of the brown
discoloration of the cartridge; but, this type of discoloration is not typically present when
pretreatment processes are optimized.
To further evaluate performance of Filter 4, and determine the impact of sample location, another
MPA sample filter was connected to a different tap on the effluent line of the West half of Filter
4. The same brown color was noted, but to a lesser degree. Significantly less inorganic sediment
was noted as well. Visual observation of the MPA cartridge resulted in valuable discussion with
PWSA staff regarding the optimal sample tap location within the circumference of the filter
effluent pipe. In summary, Department staff encouraged PWSA to reference the turbidimeter
manufacturer sample tap location guidance. Everyone agreed that the bottom of the pipe should
not be used for future sample tap locations. Overall, the results of both Filter 4 effluent MPA’s
were rated “acceptable” by lab staff due to the determination that particulates were inorganic in
nature, and the fact that no cysts or oocysts were identified and the sample. Complete MPA
sample results are attached at the end of this CPE report.


11/3/2017 - 36 - Final PWSA CPE Report
Photo of Clear Well Effluent MPA Cartridge at Conclusion of Sampling
Special Study 5: Turbidity Data Integrity Assessment
A series of special studies were conducted to assess the integrity of the turbidity data being
collected from the individual filters and combined filter sample locations. This series of studies
focused on turbidimeter flows, turbidimeter operation and settings and the impact of these factors
on data quality. A summary of each study (5A through 5D) which contributed to the overall
assessment of turbidity data integrity follows:

11/3/2017 - 37 - Final PWSA CPE Report
Special Study 5A: Online Turbidimeter Flow Rate and Sample Detention Time Assessment
To assess the flow rate through the online Hach 1720E turbidimeters located at the IFE, CFE,
settled and clarified as well as the Surface Scatter-7 raw water turbidimeter, the CPE team used a
graduated cylinder and a stop watch to measure the flow rates from drain lines. The Filter 9
turbidimeter (2650 mL/min), Filter 16 turbidimeter (2800 mL/min), CFE north turbidimeter (880
mL/min), CFE south turbidimeter (1500 mL/min), raw Surface Scatter 7 turbidimeter (2800
mL/min), and clarified turbidimeter (1450 mL/min) exceeded the manufacturer’s recommended
flow rate range of 250 to 750 mL/minute, as shown in Figure 12. To obtain the most accurate
turbidity data, it is critical that the flow rate is consistently maintained as per the manufacturer’s
recommendations.
FIGURE 12. Turbidimeter Flow Rates vs. Manufacturer Specifications.
*Note that the recommended flow rate for the surface scatter 7 is between 1 L/min and 2 L/min
Additionally, the CPE team calculated the sample line detention time of the online Hach 1720E
turbidimeters on filters 16, Filter 9, CFE north, CFE south, settled, raw water (Surface Scatter 7)

11/3/2017 - 38 - Final PWSA CPE Report
and clarified. The length of piping from the sample ports to the influent ports of the on-line
turbidimeters were measured with a tape measure. Using the calculated sample pipe volume and
flow rates from the sample ports to the turbidimeters, a detention time was calculated for each
turbidimeter as listed Figure 13. The detention times varied between 0 (negligible) and 7.73
minutes. Detention times for Filter 9, Filter 16, and the Settled turbidimeters were one minute or
less allowing rapid responses to water quality changes. Raw, clarified, CFE north and CFE south
turbidimeter sample lines had greater than one minute sample line detention times. Overall filter
plant staff should always attempt to mount all online turbidimeters as close as possible to their
respective sampling location.
FIGURE 13. Turbidimeter Sample Detention Time Check.

11/3/2017 - 39 - Final PWSA CPE Report
Special Study 5B: Online Turbidimeter Settings Check
The CPE team checked the settings on the online Hach 1720E turbidimeter controllers, and the
findings are summarized in Table 8. An output span of 0-1 NTU for IFE and CFE turbidimeters
is not sufficient to determine regulatory compliance. The state of Pennsylvania Safe Drinking
Water Act Title 25 Chapter §109 requires that accurate filter water turbidity data be recorded and
reported. Additionally, specific actions are required in Ch. 109 whenever IFE turbidity exceeds
1 NTU or 2 NTU and when the CFE turbidity exceeds 1 NTU. Therefore, PWSA is required,
for regulatory IFE and CFE turbidity data, to establish a method to record actual turbidity spikes
regardless of their magnitude. According to raw and clarified turbidity data provided by PWSA,
raw turbidity appears to be capped at 100 NTU while clarified turbidity appears to be capped at
10 NTU, and settled turbidities appear to be capped at 5 NTU. Since process controls and
consultant studies may be based on raw and clarified water turbidities, it is also important to
accurately record the magnitude of turbidity spikes for raw, clarified, and settled water. Also,
differences between the turbidimeter output span settings and SCADA data should be
investigated to verify data integrity. Currently the 1720E turbidimeters are set to hold outputs
when communication is lost with the controller. The error hold mode Transfer Outputs setting
allows the operator to send a set value (0-20 NTU) which can be used as a tool to more clearly
identify when communication has been lost which may initiate manual verification and
investigation.
TABLE 8. Turbidimeter Settings
Turbidimeter Location
Raw, clarified, settled, CFE
north (even), CFE south (odd),
IFE 9 and IFE 16
Turbidimeter Model Raw-Surface Scatter 7
All others 1720 E
Controller Model and Data
Logging Setting (1)
SC-100 (clarified, CFE south,
IFE 16). All others SC 200
Time & date setting correct;
15 minutes
Signal Averaging (2) All at 30 seconds
Bubble Reject (3) On

11/3/2017 - 40 - Final PWSA CPE Report
Turbidimeter Location
Raw, clarified, settled, CFE
north (even), CFE south (odd),
IFE 9 and IFE 16
Output Span (4) Raw-0-10,000 NTU
Clarified-0 to 100 NTU
Settled- 0 to 5 NTU
CFE and IFE- 0-1 NTU
Error Hold Mode (5) All set to hold outputs
(1) Check to see if current date and time are correct. Check frequency of data logging. Default is 15
minutes for Hach models.
(2) Default for Hach models is 30 seconds. This is acceptable in most cases.
(3) Default is On for Hach models. This is acceptable in most cases.
(4) The output span should be set to record accurate data to SCADA.
Accessing output span for Hach SC200 controller: Menu/SC200 setup/Output setup (select 1 or 2;
select Source to see which turbidimeter is highlighted and then Back button)/Activation (low
value; high value).
(5) Specific to Hach 1720E and FilterTrak 660 models. Default is to hold outputs and send last known
value to SCADA when turbidimeter loses communication with controller. Better option is
Transfer Outputs (TO) to send an operator-selected value to SCADA (e.g., 0, 20) to make operator
aware of problem.
Special Study 5C: Online Turbidimeter Data Spike Investigations
As part of data integrity review, the CPE team reviewed IFE turbidity spikes using data from
September 2016 to September 2017 to document data integrity procedures used by plant staff.
Since the water system was using two different CFE meters to monitor composite IFEs from the
north (even) and south (odd) filter galleries, the team also investigated a turbidity spike which
was recorded on one CFE turbidimeter but not the other. Figure 14 shows the investigation of an
IFE turbidity spike and Figure 15 shows the comparison between the CFE meters.
Figure 14 shows an abrupt increase in the Filter 12’s IFE turbidity recorded by the SCADA
system on January 24, 2017. If turbidity is high, operators report the value they see on the
turbidimeter's controller (instead of the SCADA screen) and report it every 4 hours on the
monthly operational report (MOR). The first two MOR turbidity values recorded on January 24th
indicated a lower turbidity value measured at the meter than what the SCADA system was
recording. The next two MOR values from January 25th show the same turbidity value as the
SCADA recorded. There was a lack of available information to document this elevated turbidity

11/3/2017 - 41 - Final PWSA CPE Report
event so it remains unclear whether the turbidity values recorded during this period were a result
of a filter performance problem, data integrity issue, or combination of both. In either case,
additional follow-up to this event is warranted and to document any actions taken to address the
turbidity event.
FIGURE 14. Filter 12 IFE Turbidity Profile January 24-25th 2017
The CFE team graphed maximum daily CFE turbidity obtained from the north (even) and south
(odd) composite turbidimeters for the month of August 2017 and identified turbidity spikes.
Figure 15 shows north and south CFE turbidity every minute for August 31st when the turbidity
spiked. SCADA data recorded for the north CFE was higher than the south CFE on August 31st
for approximately one hour, however MOR data did not confirm a difference between north and

11/3/2017 - 42 - Final PWSA CPE Report
south CFE turbidity data. The MOR data indicated a difference between the turbidimeter
controller reading and data recorded by SCADA. When assessing plant performance relative to
meeting the turbidity optimization goals, the highest turbidity values that occur each day should
be recorded. These examples are provided to demonstrate how performance can be significantly
different based on how data is collected, graphed, and interpreted.
Special Study 5D: Online Turbidimeter Verification
A comparison study of the turbidity readings from a Hach 2100Q portable turbidimeter
(provided by the CPE team), the plant Hach TU 5200 benchtop turbidimeter, Surface Scatter 7
on the raw, and the Hach 1720E continuous turbidimeters on the clarified, settled, combined
(north and south), and Filter 9 and 16 effluents was conducted by taking grab samples from the
FIGURE 15. North and South CFE Turbidity Comparison August 31, 2017

11/3/2017 - 43 - Final PWSA CPE Report
drain lines of the continuous turbidimeters or other locations as available. Collecting samples
from the turbidimeter drain line is usually not recommended due to the potential for picking up
particles from the line but there was not a better sampling location for some of the meters. An
optimum grab sampling setup would include a sample tap (i.e., T or Y configuration) off the feed
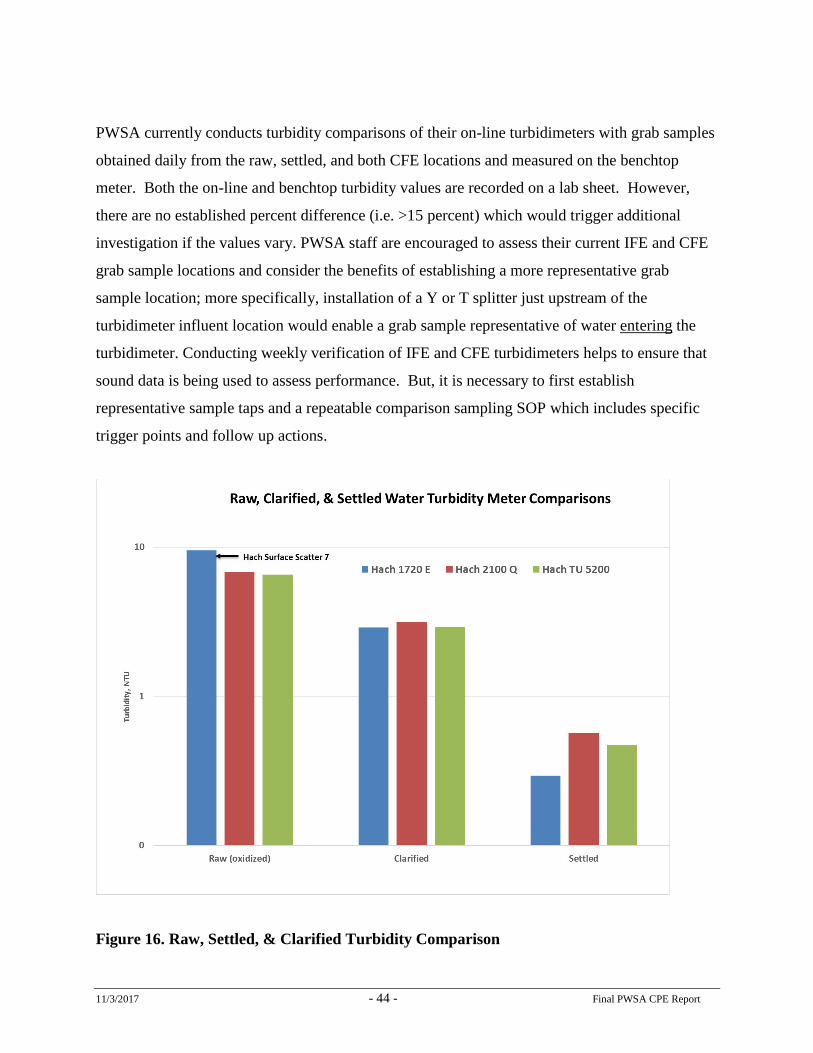
line to the turbidimeter. Results of the comparative study for the raw, clarified, and settled
waters are summarized in Figure 16. Results of the comparative study for the north and south
CFEs, and Filter 9 and 16 turbidimeters are summarized in Figure 17. Readings from the
portable and benchtop turbidimeters are expected to be slightly higher than the continuous
instruments due to sample handling, use of a sample cell, and stray light potential related to the
portable and bench meters, but readings should be within 10 percent of the raw, clarified and
settled meters and +/- 0.05 NTU of the online IFE and CFE meters.
Figure 16 indicates, the raw water grab sample readings analyzed by the portable turbidimeters
were within acceptable ranges for those two portable turbidimeters, but outside the range when
compared to the on-line meter. The clarified water grab sample readings for all the meters were
within acceptable ranges. The settled water grab sample readings analyzed by the portable,
benchtop and on-line meters were outside the acceptable range but the grab sample location was
in the lab while the on-line meter sample tap location is at the settled water line upstream of the
filters which may indicate different water quality between the two locations.
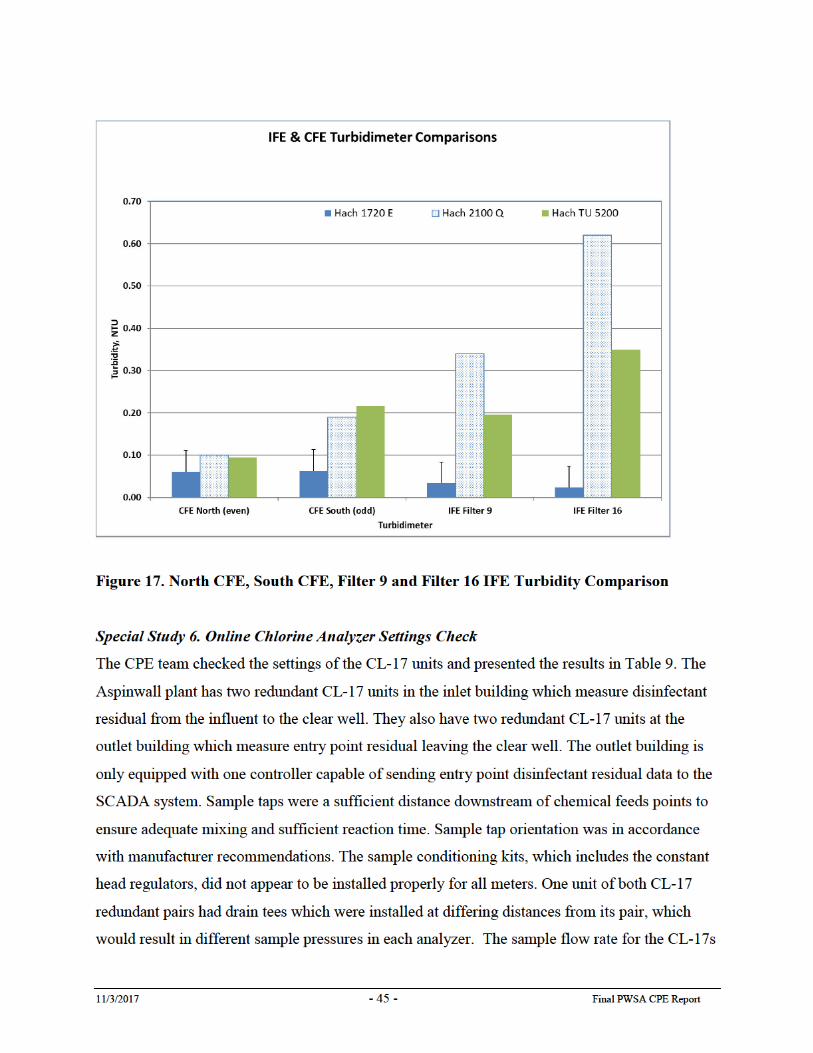
Figure 17 indicates, the CFE and IFE grab sample readings analyzed by the benchtop and
portable turbidimeters from the north and south CFEs and filters 9 and 16 IFEs. All the values
from the grab samples were higher than the on-line instrument values. Values from the benchtop
and portable meters were outside the acceptable range for the South CFE and both IFE samples.
The IFE grab samples were not collected from the same tap as the on-line instruments which
may contribute to the disparity when comparing the values. The north CFE grab sample was
taken from a hose two feet from the turbidimeter; the IFE grab samples were taken at a tap
associated with the flow meter. Currently, the taps for the on-line IFE turbidimeters only
provide water from the west cell of the filters which may not be representative of the turbidity
from both the east and west filter cells combined. The grab sample tap location included both
cells but was from a tap associated with the filter flow meter.
11/3/2017 - 44 - Final PWSA CPE Report
PWSA currently conducts turbidity comparisons of their on-line turbidimeters with grab samples
obtained daily from the raw, settled, and both CFE locations and measured on the benchtop
meter. Both the on-line and benchtop turbidity values are recorded on a lab sheet. However,
there are no established percent difference (i.e. >15 percent) which would trigger additional
investigation if the values vary. PWSA staff are encouraged to assess their current IFE and CFE
grab sample locations and consider the benefits of establishing a more representative grab
sample location; more specifically, installation of a Y or T splitter just upstream of the
turbidimeter influent location would enable a grab sample representative of water entering the
turbidimeter. Conducting weekly verification of IFE and CFE turbidimeters helps to ensure that
sound data is being used to assess performance. But, it is necessary to first establish
representative sample taps and a repeatable comparison sampling SOP which includes specific
trigger points and follow up actions.
Figure 16. Raw, Settled, & Clarified Turbidity Comparison


11/3/2017 - 48 - Final PWSA CPE Report
operators do not account for the change in specific gravity and percent weight in their
calculations when they receive a new batch of chemical. This created a discrepancy of 1.7 mg/L
in the calculated dose on September 20th; the operator calculated dose was 32.3 mg/L, and the
CPE team calculated dose was 34 mg/L
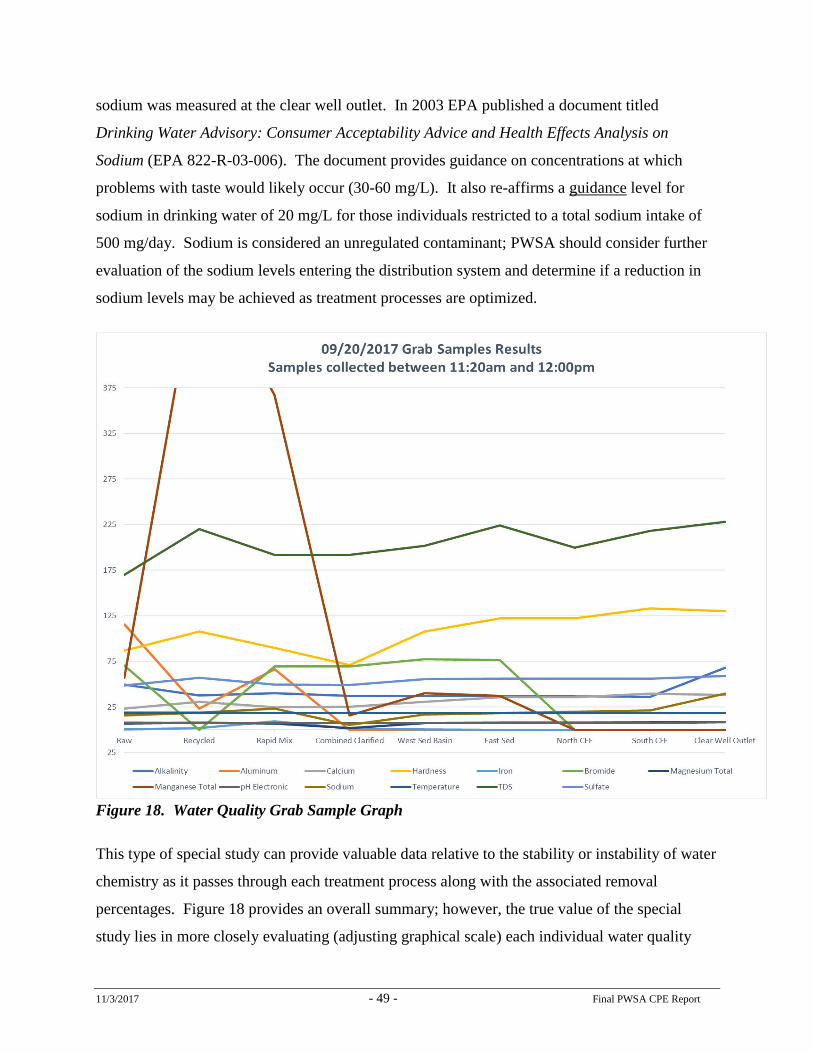
Special Study 8: Coordinated Water Quality Grab Sampling
Several members of the CPE team worked together on a coordinated grab sample event.
Samples were collected between 11:20am and 12:00pm on September 20, 2017 in an attempt to
capture a “snapshot in time” of water quality at specific locations throughout the filter plant.
Following the flow of water through the filter plant, representative samples were collected from
raw water, recycle tank, rapid mix chamber, combined clarifier effluent, west sedimentation
basin, east sedimentation basin, north CFE, south CFE, and clear well effluent. Each sample
location was analyzed by the PA DEP Bureau of Laboratories (BOL) for multiple parameters.
Results are summarized in Table 11 and associated Figure 18. This data indicates that on
September 20, 2017, all parameters evaluated met applicable Safe Drinking Water standards at
the clear well outlet to the distribution system.
Table 11. Coordinated Water Quality Grab Sample Results
In Table 11, “UC” indicates Unregulated Contaminant; concentrations / values that were
reported with a "<" qualifier were assigned a "0" concertation. Fluoride and color were analyzed
but reported with "non-detections" and not included in this table. Please note that 39.6 mg/L
Raw Recycled Rapid Mix Combined Clarified West Sed Basin East Sed North CFE South CFE Clear Well Outlet MCL/MRDL
Alkalinity 49.6 37.8 40.2 37.2 37.2 37 36.8 36.4 68.2 UC mg/L
Aluminum 116 23.4 66.7 0 0 0 0 0 0 200 ug/L
Calcium 23.33 30.555 24.54 25.45 30.9 35.582 35.576 39.841 38.364 UC mg/L
Hardness 87 108 90 71 108 122 122 133 130 UC mg/L
Iron 0.233 1.681 9.171 1.506 0.36 0.157 0 0 0 0.30 mg/l
Bromide 70.53 0 69.48 69.46 77.25 76.5 0 0 0 UC ug/L
Magnesium Total 7.034 7.729 7.07 1.789 7.588 8.04 8.116 8.132 8.262 UC mg/L
Manganese Total 57 523 367 16 40 37 0 0 0 50 ug/l
pH Electronic 7.9 7.5 7.2 7.2 7.4 7.4 7.3 7.4 8.5 6.5 - 8.5
Sodium 16.03 18.94 23.36 5.381 16.9 18.242 19.561 21.328 39.643 UC mg/L
Temperature 18.68 18.62 18.55 18.53 18.48 18.42 18.32 18.22 18.15 UC
TDS 170 220 192 192 202 224 200 218 228 500 mg/l
Sulfate 48.74 56.9 49.65 49.21 55.43 56.15 56.19 56.3 59.01 250 mg/l
11/3/2017 - 49 - Final PWSA CPE Report
sodium was measured at the clear well outlet. In 2003 EPA published a document titled
Drinking Water Advisory: Consumer Acceptability Advice and Health Effects Analysis on
Sodium (EPA 822-R-03-006). The document provides guidance on concentrations at which
problems with taste would likely occur (30-60 mg/L). It also re-affirms a guidance level for
sodium in drinking water of 20 mg/L for those individuals restricted to a total sodium intake of
500 mg/day. Sodium is considered an unregulated contaminant; PWSA should consider further
evaluation of the sodium levels entering the distribution system and determine if a reduction in
sodium levels may be achieved as treatment processes are optimized.
Figure 18. Water Quality Grab Sample Graph
This type of special study can provide valuable data relative to the stability or instability of water
chemistry as it passes through each treatment process along with the associated removal
percentages. Figure 18 provides an overall summary; however, the true value of the special
study lies in more closely evaluating (adjusting graphical scale) each individual water quality

11/3/2017 - 50 - Final PWSA CPE Report
parameter at each unit process. For example, Figure 19 indicates a total manganese baseline raw
water concentration of 57 ug/L, followed by a peak of 523 ug/L within the recycle tank, 367
ug/L at the point of rapid mix, and significant reduction to 16ug/L at the combined clarifier
effluent. Figure 19 shows increases in total manganese through the sedimentation basin, with a
sedimentation basin effluent of approximately 40 ug/L. PWSA should also note that hardness,
calcium, bromide, total dissolved solids, sodium, sulfate, and magnesium also increased, to some
extent, in the settling basins. Additional monitoring should occur to further evaluate these
trends. Documentation of significant increases may indicate recontamination as a result of
surface run-off and/or solids leaching/resuspension. PWSA staff report that solids have not been
removed from the sedimentation basin for approximately 25 years. Zero total manganese was
detected in the north CFE, south CFE, and clear well outlet. In this example, the information can
be useful for assessing the effectiveness of potassium permanganate and chlorine oxidation of
manganese through the treatment processes as well as the impact of manganese recycle through
wash water return.
Figure 19. Total Manganese Trend

11/3/2017 - 51 - Final PWSA CPE Report
MAJOR UNIT PROCESS EVALUATION
Major unit processes were assessed with respect to their capability to meet the optimized settled
and filtered water goals as well as the disinfection goals based on CT (residual concentration
multiplied by contact time prior to the first customer). The capability of each individual unit
process was also assessed to verify its ability to provide consistent optimized performance. This
level of plant performance is considered necessary to help ensure removal or inactivation of
pathogens. Calculation of plant disinfection capability was based on chlorine CT values outlined
in the USEPA Guidance Manual4 for meeting both filtration and disinfection requirements.
Since the treatment processes of the plant must provide multiple effective barriers at all times, a
peak instantaneous operating flow was determined. The peak instantaneous operating flow
represents conditions when the treatment processes are the most vulnerable to the passage of
parasitic cysts and microorganisms. If the treatment processes are adequate at the peak
instantaneous flow, then the major unit processes should be capable of providing the necessary
effective barriers at lower flow rates.
The maximum operating flow rate of 62,500 gpm (90 MGD) was selected by the CPE team as
the peak instantaneous operating flow rate. The peak instantaneous flow corresponds to the
maximum number of pumps that would operate at any given time. The plant achieves various
flow rates by operating various combinations of pumps at various stations. During winter
months, flow rates have approached 62,500 gpm when multiple line breaks occurred in the
distribution system.
Unit process capability was assessed using a performance potential graph, where the projected
treatment capability of each major unit process was compared against the peak instantaneous
operating flow rate. The Major Unit Process Evaluation graph developed for the PWSA
Aspinwall WTP is shown in Figure 20.
4 Guidance Manual for Compliance with the Filtration and Disinfection Requirements for Public Water Systems
Using Surface Water Sources, USEPA, Office of Drinking Water, Washington, D.C. (1989), revised 1991.

11/3/2017 - 52 - Final PWSA CPE Report
Figure 20. Major Unit Process Evaluation Graph

11/3/2017 - 53 - Final PWSA CPE Report.docx
The unit processes evaluated during the CPE are shown along the vertical axis. The horizon-
tal bars on the graph represent the projected peak capability of each unit process that would
support achievement of optimized process performance. These capabilities were projected
based on several factors including the combination of treatment processes at the plant, the
CPE team’s experience with other similar processes, raw water quality, industry guidelines,
the PWSA Aspinwall WTP design, and regulatory standards.
Each unit process can fall into one of three categories:
Type 1: Where the bar for the unit process exceeds the peak instantaneous flow (> 100
percent of peak flow), the plant should be expected to achieve the performance
goals.
Type 2: If the bar for the unit process falls short but close to the peak instantaneous flow
(80 to 100 percent of peak flow), then operational adjustments may still allow
the plant to achieve the performance goals.
Type 3: If the bar for a particular unit process falls far short of the peak instantaneous
flow (< 80 percent of peak flow), then it may not be possible to achieve the per-
formance goals with the existing unit process.
The shortest bar represents the most limiting unit process relative to achieving optimized plant
performance. The major unit processes evaluated included flocculation, clarification,
sedimentation, filtration, and disinfection.
Flocculation and clarification is achieved with four flocculation and clarification basins,
operated in parallel. Each basin includes two, 2-stage flocculators and a conventional
sedimentation basin. The flocculators are operated at constant speed. Basin #3 had been out
of service for several months, so two flocculators and one clarifier were not considered in the
major unit process evaluation. A third flocculator was also not operating at the time of the
CPE, but it was assumed to be functional in the major unit process evaluation because it
would typically be running under normal conditions.
Based upon the flocculation unit design (i.e., a minimum water temperature ≤ 5 °C and
multiple stage mixing), a hydraulic detention time (HDT) of 20 minutes was selected to rate
11/3/2017 - 54 - Final PWSA CPE Report.docx
the process. The combined flocculation basin volume was approximately 1,157,635 gallons
(not including two of the eight flocculation units since Basin #3 was out of service). The
resulting rating of the flocculation process was 83.3 MGD (Vol/HDT x 1440/106). This was
less than the peak instantaneous flow rate of 90 MGD and identifies the flocculation process
as a Type 2 process.
The total surface area of three of the four conventional clarifiers was 29,160 ft2 with an
average water depth greater than 14 feet. The CPE team assigned a surface overflow rating of
0.7 gpm/ft2. Based on this information, the total rated capability for the clarification unit
process was 29.4 MGD. This was considerably less than the peak instantaneous flow rate and
results in categorizing clarification as a Type 3 process.
Settled water from the clarifiers was gravity fed into a central receiving basin and distributed
into the east and west sedimentation basins, operating in parallel. The total surface area for
both basins was 1,000,000 ft2. Water flowed approximately 1,400 feet across each basin into
an effluent conduit surrounded by mud walls, located on the bottom of the basin at the other
end. The CPE assigned a surface overflow rate of 0.5 gpm/ft2 to each basin because the
effluent orifice was located at the bottom of the basin. Based on this information, the total
rated capability for the sedimentation process was 720 MGD. This was considerably greater
than the peak instantaneous flow rate, which identifies sedimentation as a Type 1 process.
Filtration was performed using eighteen dual-media, rapid rate filters each containing two
cells. The dimensions of each cell were 57 by 18 feet, or 1,140 ft2 each. With one filter out
of service, the surface area of seventeen filters was 38,760 ft2. The PA DEP permitted a
hydraulic loading rate of 2 gpm/ft2 for the Aspinwall filters, which was used in the evaluation.
Based on this information, total rated capacity of the filtration process was 111.6 MGD. The
filtration process rating was above the reported peak instantaneous flow and the filters are
therefore rated a Type 1 process.
The disinfection process was assessed based on the PA DEP requirements for inactivation of
1- log (90 percent) of Giardia cysts and 4 log (99.99 percent) of viruses (in addition to
adequate turbidity removal via pretreatment and filtration). For disinfection with chlorine, the
Giardia inactivation requirement is more stringent than the virus disinfection requirement. As
11/3/2017 - 55 - Final PWSA CPE Report.docx
such, Giardia inactivation was used as the basis for the chlorine disinfection evaluation. The
point of chlorine addition at the PWSA Aspinwall plant was in the combined filter effluent
line at the filter pipe gallery, so the only contact time for the chlorine is in the clear well. The
residual disinfectant concentration (C), in mg/L, multiplied by the effective time the water is
in contact with the disinfectant (T), in minutes, comprises CT.
For disinfection in the clear well, a required CT value of 85.5 mg/L-min was obtained from
the USEPA Guidance Manual3 using a chlorine residual of 0.6 mg/L, a maximum pH of 8.5,
and a worst-case temperature of 5 °C. These criteria were selected based on a review of
historical data at the clear well effluent. Although chlorine residuals of less than 0.6 mg/L
were observed on many of the days reviewed by the CPE team, PWSA staff were using a
higher baffling factor prior to April 2017. Using the PA DEP established baffling factor of
0.3 means that chlorine residual level will need to be maintained at a higher level than in the
past to maintain the required inactivation ratio.
The total volume of the clear well was calculated at 31,265,000 gallons assuming a minimum
water level of 13.5 feet. The volume calculation accounted for the reduction in volume due to
structural columns within the clear well. Based on this information, the total rated capacity of
the disinfection process was 91.5 MGD, which was slightly greater than the peak
instantaneous flow rate. As a result, disinfection is considered a Type 1 process
The major unit process evaluation shows that the Aspinwall plant’s major unit processes
should not limit the ability of plant operators to achieve turbidity and disinfection
optimization goals under current flow conditions. The flocculation process is rated Type 2;
however, routine preventative maintenance combined with good operational practices and
application of optimization skills could help to offset this rating. The clarification process is
rated Type 3, but this process is followed by the sedimentation process which is rated Type 1.
The combined use of both settling processes, routine preventative maintenance of these units,
and application of good operational skills will be critical to consistently achieving settled
water optimization goals and protecting the newly renovated filters.
11/3/2017 - 56 - Final PWSA CPE Report.docx
PERFORMANCE-LIMITING FACTORS
The areas of design, operation, maintenance, and administration were evaluated to identify
factors that limit performance. These evaluations, and the resultant list of what appeared to be
performance limiting factors, were based on information obtained from the plant tour,
interviews, performance and design assessments, special studies, and the best professional
judgment of the CPE team. Each of the factors was assessed for a possible classification as A,
B, or C according to the following guidelines:
A Major effect on a long term repetitive basis
B Moderate effect on a routine basis, or major effect on a periodic basis
C Minor effect
After lengthy discussion by the CPE team, the performance-limiting factors identified were
prioritized as to their relative impact on performance, and they are summarized in Table 12
below. While developing the list of factors limiting performance, over 50 potential factors
were reviewed, and their impact on the performance of the Aspinwall WTP was assessed to
the best of the team’s ability using available information. Each of the factors along with
specific examples of why the factor was identified are described in this section.

11/3/2017 - 57 - Final PWSA CPE Report.docx
TABLE 12. Summary of Performance Limiting Factors
Rank Rating Performance Limiting Factor Category
1 A Policies Administrative
2 A Supervision Administrative
3 A Representative Sampling Operations
4 A Application of Concepts and Testing to Process Control Operations
5 A Maintenance Preventative/Corrective Maintenance
6 A Planning Administrative
7 A Complacency Administrative
8 A Reliability Administrative
9 B Disinfection Design
10 B Compensation Administrative
11 B Reserves Administrative
12 B Chemical Storage and Feed Facilities Design
13 B Clarification/Sedimentation Design
14 B Process Controllability and Instrumentation/Automation Design
15 C Operational Guidelines Operations
16 C Work Environment Administrative
17 C Intake Structure Design
11/3/2017 - 58 - Final PWSA CPE Report.docx
Policies – Administration (A)
Existing policies or the lack of policies appear to hinder staff members from making all
necessary operational, maintenance, and management decisions to support optimized plant
performance. Examples of this performance limiting factor include:
• It does not appear that a clear policy to meet a full range of water quality optimization
goals has been established and communicated to staff at all levels.
• Vacancies in key management positions are affecting workloads, impacting stability
and communication within the organization. This leads to uncertainty which hinders
the ability of plant personnel to set priorities necessary to achieve and maintain
optimal water quality. Reference the organizational chart in Attachment 1.
• The existing policy requiring residency within the Pittsburgh city limits for all PWSA
employees limits the pool of available candidates, and sometimes results in highly
qualified candidates declining job offers. Ultimately, some positions remain vacant
because of the residency requirement.
• The policy that only lab staff can establish process control setpoints (e.g. ferric
chloride dosage) has diminished the role that properly certified operators can and
should play in maintaining optimal water quality. Lab staff are currently relied upon
for process control oversight, but a previous policy has reduced lab staffing from ten
to four.
• Operator certification does not appear to be adequately incentivized for existing staff,
or required for new hires.

11/3/2017 - 59 - Final PWSA CPE Report.docx
Supervision – Administration (A)
This factor refers to management styles, organizational capabilities, or communication
practices at any management level which appear to adversely impact the plant
performance. Examples of this performance limiting factor include:
• The Director of Water Production position is vacant. An optimization champion (i.e.
someone who understands safe drinking water requirements and can establish
optimized performance goals) is needed for this position. This vacancy has also
resulted in a lack of clearly defined roles and responsibilities which impacts
completion of specific tasks required to support optimal performance. Reference the
organizational chart in Attachment 1
• Simultaneous compliance does not appear to be a priority; the primary focus is THM
precursor removal and DBP control, with limited focus directed towards turbidity
optimization of each unit process
• Operators are not involved with water quality process control decisions, which limits
their review and ownership of turbidity and disinfectant residual compliance data.
Improperly certified operators routinely make process control decisions relative to
water quantity.
• Compartmentalization of duties within the organization has impacted the overall
ability to make efficient and timely decisions. Roles and responsibilities are not
clearly defined, leading to uncertainty regarding who has primary responsibility for
completion of certain tasks.
• There is a reliance on consultant recommendations with limited input or involvement
from plant staff to develop process control related special studies in the plant.
Communication practices are not ensuring plant staff awareness or actively soliciting
their input for prioritizing and developing consultant’s studies or specific projects.
• An in-house training program has not been established but is desired by operational
staff.

11/3/2017 - 60 - Final PWSA CPE Report.docx
Representative Sampling – Operations (A)
Accurately assessing plant performance requires sampling and instrument settings that can
capture process performance. Some examples of representative sampling issues that were
identified during the CPE include:
• A method to assess turbidity spikes and understand when individual filters are online
(vs. offline) has not been established, which compromises associated turbidity data
integrity.
• Verification of massive amounts of critical water quality/compliance data by only one
individual reduces responsibility of shift operators to routinely vet turbidity/chlorine
data in a timely manner.
• Current IFE online turbidimeter sample tap location does not monitor both sides of
each individual filter, compromising critical regulatory and process control data.
• IFE flow records for some filters indicate up to approximately 1872 gpm of flow
during periods when those filters should be offline for backwash. This appears to
indicate an unresolved problem with the flow meter calibration and/or electrical
“noise” and/or valves not fully closing.
• Grab sample taps for individual filters are not representative of water quality from
each filter cell and filter to waste turbidity.
• IFE and CFE turbidimeters were capped at 1 NTU limiting the ability to assess
magnitude of turbidity spikes for process control and regulatory compliance.
• Filter to waste step was not consistently utilized prior to the CPE.
• Flow rates for turbidimeters evaluated by the CPE team were not within the
manufacturer recommended range (i.e. significantly higher).
• Constant head levels for the CL-17 chlorine analyzer evaluated by the CPE team were
not within the manufacturer-recommended range.

11/3/2017 - 61 - Final PWSA CPE Report.docx
• Clarifier and sedimentation basin turbidity data provided was capped at a maximum
10 NTU and 5 NTU respectively.
• Individual clarifiers and individual sedimentation basin effluent turbidities are not
monitored.
• The continuous online raw water turbidimeter is not representative of Allegheny river
turbidity because it draws a sample after the point of potassium permanganate
injection.
Application of Concepts and Testing to Process Control – Operations (A)
Process control by plant staff is a key activity required to consistently achieve compliance
requirements and optimization goals. Examples of useful process control activities that
are not being completed and operational practices that do not support good process control
include:
• Ferric chloride dosage rates are rarely adjusted due to the perception that the
Allegheny river is a stable source, and the perception that the practice of enhanced
coagulation does not require close control of the coagulant dose.
• Process control tools, such as jar testing, streaming current monitor or zeta potential,
are not utilized to optimize coagulant and polymer doses; historical ferric chloride
dosage data are not routinely utilized to guide current dosing strategies.
• Giardia inactivation ratios reported by PWSA for the Aspinwall WTP were
consistently higher than those calculated by the CPE team. PWSA’s method of
determining minimum chlorine residual and minimum clear well volume data for use
in the CT calculation did not appear to be accurate.
• Operators do not have access to an accurate method to verify actual verses theoretical
ferric chloride dosages. During a special study, CPE team members calculated a dose
of 18.1 mg/L using the coagulant feed pump calibration cylinder; in comparison,
operators calculated a ferric dosage of 32 mg/L using SCADA data. Operators believe

11/3/2017 - 62 - Final PWSA CPE Report.docx
this calibration cylinder is inaccurate due to the plumbing configuration; but, this
theory needs to be evaluated further.
• Operators do not have access to accurate plant flow rate data to calculate ferric
chloride dosages via SCADA.
• Neither clarifier sludge depth nor sludge density are tested; this type of testing could
potentially enhance performance and reduce clarifier breakdowns / maintenance. The
impact of elevated ferric chloride dose on sludge production and clarifier maintenance
has not yet been assessed.
• Clarification followed by sedimentation has resulted in a false sense of security;
clarified and settled water spikes are not investigated to optimize multiple barrier
performance.
• Routine secondary verifications of the individual filter turbidimeters are not conducted
(although turbidimeters are calibrated quarterly via a primary standard).
• Turbidimeter comparisons are conducted, but the data are not utilized to assess
accuracy of the on-line meters.
• An SOP has not been established to test new filter media (AWWA B-100 analysis) to
establish baseline condition and/or monitor change in condition with age.
• Long-term analysis of water quality data trends is not occurring in-house or routinely,
resulting in limited data-based decision making
• Plant staff are not involved in the design of, or conducting, special studies (e.g.,
optimizing permanganate feed locations, individual clarifier basin performance study,
filter backwash evaluation, in-plant DBP formation)
• Staff appear to accept preliminary process control modification recommendations
from consultants without thorough consideration of unintended process control
impacts (e.g. considering stopping raw water potassium permanganate feed and

11/3/2017 - 63 - Final PWSA CPE Report.docx
relying on Mn removal via filtration process). Some recommendations may be based
on plant data that is not representative, due to previously listed data quality concerns.
• The impacts of filter backwash recycle on pretreatment processes or finished water
quality have not been studied. See recycle tank manganese residual (Figure 19)
• Staff were uncertain if east and west raw water intake structures allowed flexibility to
draw water from different depths within the river to target the best available source
water quality. Therefore, this is not a process control consideration.
Maintenance (Preventative/Corrective) – Maintenance (A)
Overall, the frequency and pace of emergencies has resulted in operations and
maintenance staff that are constantly in triage mode, with little to no time to conduct
proactive preventative maintenance. Examples of specific maintenance concerns are
listed below:
• Clear well maintenance and cleaning has not been performed and could lead to water
quality issues or failure.
• Lack of routine removal of sludge from flocculators and clarifiers appears to be
contributing to routine breakdowns. Apparent lack of maintenance resources results in
one of four clarifiers remaining offline for extended periods of time.
• Accumulation of sludge in the sedimentation basins reduces basin volume, likely
contributing to intermittent settled turbidity spikes, increase in some secondary
contaminants as listed in Table 11, and the presence of debris within the filters which
may ultimately result in filter short-circuiting.
• Line clogging (e.g., hypochlorite, soda ash) requires frequent maintenance and/or the
utility to bring chemicals close to the injection point.
11/3/2017 - 64 - Final PWSA CPE Report.docx
• The plant flow meters are not calibrated and data are not accurately transmitted to the
SCADA system, making it difficult to accurately calculate and control chemical feed
rates or perform water accounting.
• Sedimentation basin effluent weir, location, condition and maintenance history appear
to be unknown to utility staff.
• The raw water intake valves do not appear to be adjustable (i.e., stuck in their current
percent open position), limiting flexibility to adjust water contributions from both East
and West intakes.
• Lack of a comprehensive work order system limits the ability to accurately track all
equipment in need of repair.
Planning – Administration (A)
The lack of long-range planning by a utility can have negative impacts on the future
operations and performance of a WTP. Current performance problems at the Aspinwall
WTP have been caused in part by a lack of planning in the past. The following examples
were identified during the CPE:
• A lack of prior long-range planning to build and maintain a sustainable water system
infrastructure has impacted plant performance. Current management has developed a
long-range plan to begin addressing this factor, but it has not yet been fully
implemented.
• A lack of prior planning to generate income sufficient to sustain a WTP capable of
achieving optimal performance goals has impacted performance of the Aspinwall
plant. Current management has developed a plan to address this issue but it has not
yet been fully implemented.

11/3/2017 - 65 - Final PWSA CPE Report.docx
Complacency – Administration (A)
The design of the Aspinwall WTP provides ample capacity to meet the existing demand
flow which contributes to a sense of complacency within the water utility. Some
examples that were identified during the CPE include:
• Staff do not adjust coagulant dosage and clarifiers are not optimized for particle
removal, due to a reliance on the sedimentation basins and a perceived “stable” source.
The perception that the sedimentation ponds will be able to effectively remove
pathogens from all types of incoming water quality challenges has also allowed for the
process control emphasis to be placed almost exclusively on DBP and TOC control.
• PWSA has not adequately reinvested in its aging infrastructure, which has resulted in
breakdowns that impact water quality and redirect operator time and attention.
• Some infrastructure breakdowns have gone unaddressed for extended periods of time.
Maintenance staff cannot keep up with all needed repairs, and limitations force them
to deal with the “emergency of the week,” while other important repairs are on hold
for extended periods of time.
Reliability – Administration (A)
Inadequate facilities, equipment and the depth of staff capability present potential weak
links within the water utility to achieve and sustain optimized performance. Some
examples of this factor that were identified during the CPE include:
• The existing clear-well lacks redundant components and cannot be taken out of service
for maintenance. The ability to apply adequate disinfection is at risk if there is failure
of the current clear-well configuration.
• Redacted-Security Issue

11/3/2017 - 66 - Final PWSA CPE Report.docx
• Some unit processes are not operating, with no identifiable schedule to be placed back
in service. In addition, some equipment and instrumentation is not providing reliable
information needed for optimal particulate removal:
▪ Three flocculators are out of service.
▪ One clarification basin is not operational.
▪ Raw water flow readings are inaccurate.
▪ IFE turbidity data is not reliably reflecting individual filter performance.
• The overall depth of staff capability is not sufficient to consistently and reliably meet
optimization goals. For example, maintenance staffing levels are insufficient to ensure
that current unit processes are operational. The laboratory is also understaffed and
there is a lack of certified operators to support optimal performance of a WTP of this
size. Compartmentalization of staff duties also limits the depth of staff capability and
the engineering department, along with other staff departments are dependent on
outside consultants.
Disinfection Barrier – Design (B)
• Due to the age of the clear well, structural issues with the potential to compromise the
disinfection barrier are developing; significant rehabilitation or replacement of the
clear well will be necessary to maintain the integrity of the disinfection process. The
lack of redundancy for the clear well does not currently allow it to be taken out of
service for maintenance, repair, or replacement. The clear well inlet and outlet wet
wells share a common wall and are covered by improperly sealed hatches that could
potentially allow the introduction of contaminants such as dust, debris, insects, etc.
Due to hydraulic limitations, the clear well water level cannot be lowered below 7.5
feet.

11/3/2017 - 67 - Final PWSA CPE Report.docx
Compensation – Administration (B)
The current compensation structure appears to hinder PWSA’s ability to retain or develop
staff with the necessary qualifications and abilities to pursue optimized WTP
performance. Some examples of this factor that were identified during the CPE include:
• It has been difficult to compete with surrounding utilities for the best available staff,
therefore hindering the ability of PWSA to hire highly qualified individuals with skill
sets necessary to optimize performance. This has also impeded the ability to manage
the water system without relying on outside consultants.
• Historically, minimal incentives for operators to pursue certification appears to have
contributed to the current lack of depth in staff capability. For example, a lack of
compensation to attend training did not promote the importance of training and
certification. Not until recently have staff been allowed overtime to attend training and
this has not yet been fully realized by staff.
Reserves – Administration (B)
It appears that PWSA financial reserves have not been maintained to adequately cover
unexpected expenses or fund needed facility replacement costs. Some potential examples
of this factor that were identified during the CPE include:
• Revenues have been impacted by water accountability inaccuracies that have affected
collections (e.g. plant and customer meters and billing software). High (>50percent)
unaccounted for water also significantly reduces revenue.
• Reserves for capital replacement have not been adequately developed and do not
currently cover needs, resulting in emergency breakdowns that have affected
performance.
• Policies to use PWSA revenue for other city priorities, not necessarily benefiting the
water system, appear to have contributed to a lack of reserves, including:

11/3/2017 - 68 - Final PWSA CPE Report.docx
• Providing free water for certain city needs.
• Contributing funding for city projects outside PWSA.
• The terms of the ALCOSAN contract requires PWSA to perform revenue
collection and payment to ALCOSAN for sewer accounts. PWSA must
compensate ALCOSAN regardless of whether the customer pays water or sewer
charges to PWSA.
• The terms of the PWSA lease agreement requires payment of $130M (water) and
$100M (sewer) to the city of Pittsburgh.
• A long-standing policy to subsidize Pittsburgh customers receiving water from
Pennsylvania American Water Company (PAWC) reportedly costs PWSA $5M
annually, which is paid to PAWC. This amount makes up the difference between
what PAWC charges its customers as compared to the PWSA water rates.
• The debt at the time of the CPE, in the amount of $750M, results in $0.40 of each
revenue $1.00 directed toward paying debt. This reduces the revenues available for
reserves.
Chemical Storage and Feed Facilities – Design (B)
• Chemical storage space for ferric chloride is limited, resulting in the need for frequent
(daily or twice weekly) deliveries. The plant has had to reduce the coagulant dose at
certain times to get by until the next delivery. Due to lack of storage, railcars sit full
of chemicals with no secondary containment.
• The current condition of sodium hypochlorite piping facilities requires the utility to
truck chemical to the filter effluent injection point.
11/3/2017 - 69 - Final PWSA CPE Report.docx
Clarification/Sedimentation – Design (B)
• The clarifier capacity is inadequate, resulting in high surface loading rate and floc
carryover.
•
Process Controllability and Instrumentation/Automation – Design (B)
• Chemical feed rates must be changed manually and do not automatically adjust to
account for changes in plant flow rate, e.g., the chemical feed pumps are not flow-
paced. Raw water pumping flow requires a manual change. This lack of
automation/controllability requires a dedicated operator to staff the chemical feed
building and a dedicated engineer to staff the Ross Pump Station around the clock.
•
Operational Guidelines/ Procedures – Operations (C)
• Standard operating procedures (SOPs), or operational guidelines, are developed for
certain plant activities; however, they are not posted at critical locations (where they
would be utilized/quickly referenced) within the plant. Additionally, SOPs have not
been established to adjust pretreatment to accommodate for seasonal temperature
changes (e.g. floc speeds and associated mixing energy relative to water density).
Redacted-Security Issue
Redacted-Security Issue
11/3/2017 - 70 - Final PWSA CPE Report.docx
Work Environment – Administration (C)
Overall work environment has impacted plant performance by impeding routine activities
needed to support process control decisions. Some examples of this factor that were
identified during the CPE include:
• Electrical, and other safety issues at the plant, have resulted in a dangerous work
environment and necessitated extra resources for emergency repairs and to address this
overall issue.
• The filter decks do not have hand rails which could present a safety hazard when
operators try to observe a backwash or conduct special studies such as bed expansion
measurements.
Intake Structure – Design (C)
•
• The east and west intakes are located very close to one another, which provides
limited resiliency. There does not appear to be functional capability to feed potassium
permanganate at the west intake, potentially limiting contact time for oxidation.
Redacted-Security Issue

11/3/2017 - 71 - Final PWSA CPE Report.docx

11/3/2017 - 72 - Final PWSA CPE Report.docx


11/3/2017 - 74 - Final PWSA CPE Report.docx

11/3/2017 - 75 - Final PWSA CPE Report.docx

11/3/2017 - 76 - Final PWSA CPE Report.docx