Results of the 2014 Homeless Count in the Metro …€¦ · Results of the 2014 Homeless Count in...
69
Results of the 2014 Homeless Count in the Metro Vancouver Region A Report of the Greater Vancouver Regional Steering Committee on Homelessness July 31, 2014
-
Upload
truongngoc -
Category
Documents
-
view
213 -
download
0
Transcript of Results of the 2014 Homeless Count in the Metro …€¦ · Results of the 2014 Homeless Count in...

Results of the 2014 Homeless Count in the Metro Vancouver Region A Report of the Greater Vancouver Regional Steering Committee on Homelessness
July 31, 2014

How to cite this document:
Greater Vancouver Regional Steering Committee on Homelessness. (2014). Results of the 2014 Homeless Count in the Metro Vancouver Region.
Feedback:
We would like to know if you find this report useful and welcome your feedback. Please let us know if you use the information and provide comments to: [email protected]
Report copies:
This report is available at http://stophomelessness.ca

Acknowledgements A project of the size and complexity of the 2014 Homeless Count in the Metro Vancouver region could not have been completed without the participation and support of many individuals and organizations.
The Greater Vancouver Regional Steering Committee on Homelessness would like to thank all the agencies, service providers, government staff and others who helped organize and implement the count. In particular, we would like to thank:
All the individuals who helped organize, coordinate and provide training for the count: Barbara Westlake, Deborah Kraus, Don Rock, Gaye Tims, Jacopo Miro, Jennifer Hales, Jessie Mather-Lingley, Jonquil Hallgate, Judy Graves, Leanne Carmichael, Linda Asgeirsson, Liza Jimenez, Lynda Brummit, Lynne Henshaw, Margaret Eberle, Matt Thompson, Michelle Ninow, Peter Greenwell, Polly Krier, Ryan Gilmore, Susan Keeping, Tamara White, and Wanda Mulholland.
All members of the Youth Steering Committee: Annie Smith, Ashley Crossan, Chris Tait, Cynthia Farnsworth, Devika Ramkhelawan, Heather Lynch, Joe Woodworth, Kali Sedgemore, Kris Archie, Michelle Shaw, Sarah Perrin, Shawnee Gaffney, and Wioletta Krason.
All partners involved in the Aboriginal Strategy: the Aboriginal Homelessness Steering Committee, Infocus Consulting (Dave Baspaly and Lee Faurot) and community agencies who recruited volunteers for the count, including the Aboriginal Mother Centre, Aboriginal Front Door Society, Circle of Eagles Society, Cwenengitel, Fraser Region Aboriginal Friendship Centre, Healing Our Spirit, and Helping Spirit Lodge.
All of the Chairs and Coordinators of the Community Homelessness Tables who supported their local area coordinators and provided feedback on the survey and final report. In particular, thanks to Sandy Burpee for his leadership and feedback on the Homeless Count and all the documents and reports.
All City of Vancouver staff who supported the count and data analysis, including Abi Bond, Cecilia Ledesma, Celine Mauboules, Esfer Morales, Jesse Tarbotton, and Teena Lucas.
All the health care personnel and police officers, including Fraser Health, Vancouver Coastal Health, and Providence Health Care for providing data on people with no fixed address who were in their facilities during the count.
BC Housing for providing shelter data for comparison purposes with the Homeless Count results and in particular to Rebecca Siggner for providing quality control on all the data and analysis for this report.
All 915 volunteers who gave so generously of their time to attend a training session and participate in a Homeless Count shift.
A special thanks to the funders of the 2014 Homeless Count: the Government of Canada’s Homelessness Partnering Strategy, the Homelessness Partnering Strategy Community Entity for the Metro Vancouver region, City of Vancouver, Vancouver Foundation, Real Estate Foundation of British Columbia, Surrey Homelessness and Housing Society, and Translink.


Contents Acknowledgements
Executive Summary ........................................................................................................................................ i
Background ............................................................................................................................................ i
Purpose .................................................................................................................................................. i
Definitions .............................................................................................................................................. i
Methodology .......................................................................................................................................... i
Key Findings .......................................................................................................................................... ii
1. Introduction .......................................................................................................................................... 1
1.1 Purpose ......................................................................................................................................... 1
1.2 Definitions ..................................................................................................................................... 1
1.3 Geographic Scope ......................................................................................................................... 2
1.4 Annual Estimate of Homelessness and the Homelessness Continuum ........................................ 2
1.5 Report Organization ...................................................................................................................... 4
2. Methodology and Implementation ....................................................................................................... 5
2.1 Point-In-Time Approach ................................................................................................................ 5
2.2 Volunteer Interviewers ................................................................................................................. 7
2.3 Project Management and Implementation Team ........................................................................ 7
2.4 Training ......................................................................................................................................... 8
2.5 Community Feedback ................................................................................................................... 9
2.6 Survey Response Rate ................................................................................................................. 10
2.7 Limitations................................................................................................................................... 11
3. Number of Homeless Persons in the Metro Vancouver Region ......................................................... 13
3.1 Total Homeless Population Included in the Count ..................................................................... 13
3.2 People Turned away from Emergency Shelters .......................................................................... 15
4. Profile of the Homeless Population in the Metro Vancouver Region ................................................. 16
4.1 Gender ........................................................................................................................................ 16
4.2 Age .............................................................................................................................................. 17
4.3 Aboriginal Identity ...................................................................................................................... 19
4.4 Accompanying the Homeless ...................................................................................................... 20
4.5 First Language ............................................................................................................................. 21
4.6 Newcomers to Canada ................................................................................................................ 21
4.7 Military Service in Canadian Forces ............................................................................................ 22
4.8 Barriers to Housing ..................................................................................................................... 22
4.9 Sources of Income ....................................................................................................................... 24

4.10 Health Conditions........................................................................................................................ 26
4.11 Length of Time Homeless ............................................................................................................ 28
4.12 Length of Time in Municipality Interviewed ............................................................................... 29
4.13 Episodically Homeless ................................................................................................................. 30
5. Patterns of Service Use ....................................................................................................................... 31
5.1 Services Used by the Sheltered and Unsheltered Homeless ...................................................... 31
5.2 Services Used by the Sheltered Homeless .................................................................................. 33
5.3 Services Used by the Unsheltered Homeless .............................................................................. 33
6. Homelessness among Sub-Populations .............................................................................................. 36
6.1 Women ........................................................................................................................................ 36
6.2 Persons with Aboriginal Identity ................................................................................................. 36
6.3 Unaccompanied Youth (under the age of 25) ............................................................................. 37
6.4 Seniors (55 and older) ................................................................................................................. 38
6.5 The Long-Term Homeless ........................................................................................................... 38
7. Homelessness by Municipal Sub-Region............................................................................................. 42
7.1 Total Homeless Found by Municipal Sub-Region ....................................................................... 42
7.2 Sheltered and Unsheltered Homeless Population ...................................................................... 43
7.3 Mobility of the Homeless Population ......................................................................................... 44
7.4 Age and Municipal Sub-Region ................................................................................................... 45
7.5 Aboriginal Identity and Municipal Sub-Region ........................................................................... 46
8. Conclusions and Recommendations ................................................................................................... 47
Appendix A – Estimate of Annual Prevalence of Homelessness in the Metro Vancouver Region ..... 48
Appendix B – Locations for Shelters, Transition Houses, and Safe Houses ........................................ 49
Appendix C – Locations for People with No Fixed Address (NFA) ...................................................... 51
Appendix D – Shelter Survey ............................................................................................................... 52
Appendix E – Street Survey ................................................................................................................. 54
Appendix F – Homeless Count Volunteers .......................................................................................... 56
Appendix G - Sheltered and Unsheltered Homeless Population Found in Municipal Sub-Regions since 2008 ........................................................................................................................................... 57

List of Tables Table 1: Total Sheltered and Unsheltered Homeless Population, 2014 ..................................................... 13
Table 2: Total Sheltered and Unsheltered Homeless (2002 to 2014) - Trends ........................................... 14
Table 3: Turnaways from Emergency Shelters, Safe Houses, and Transition Houses, 2014 ...................... 15
Table 4: Gender - Sheltered and Unsheltered Homeless, 2014 ................................................................. 16
Table 5: Gender - Total Homeless (2002 to 2014) - Trends ........................................................................ 16
Table 6: Age - Sheltered and Unsheltered Homeless, 2014 ...................................................................... 17
Table 7: Age - Total Homeless (2002 to 2014) - Trends ............................................................................. 17
Table 8: Homeless Children with Parents (2002 to 2014) - Trends ............................................................ 18
Table 9: Aboriginal Identity - Sheltered and Unsheltered Homeless, 2014 ................................................ 19
Table 10: Aboriginal Identity - Total Homeless (2005 to 2014) - Trends ................................................... 19
Table 11: Accompanying the Homeless - Sheltered and Unsheltered Homeless, 2014 ............................ 20
Table 12: Accompanying the Homeless - Total Homeless (2005 to 2014) - Trends .................................. 20
Table 13: First Language – Sheltered and Unsheltered Homeless, 2014 ................................................... 21
Table 14: Newcomers to Canada – Sheltered and Unsheltered Homeless, 2014 ...................................... 21
Table 15: Military Service in the Canadian Forces – Sheltered and Unsheltered Homeless, 2014 ............ 22
Table 16: Barriers to Housing – Sheltered and Unsheltered Homeless, 2014 ............................................ 23
Table 17: Barriers to Housing – Total Homeless (2011 to 2014) - Trends .................................................. 23
Table 18: Sources of Income – Sheltered and Unsheltered Homeless, 2014 ............................................. 24
Table 19: Sources of Income – Total Homeless (2008 to 2014) - Trends ................................................... 25
Table 20: Incidence of Health Conditions – Sheltered and Unsheltered Homeless, 2014 ......................... 26
Table 21: Incidence of Health Conditions – Total Homeless (2005 to 2014) - Trends ................................ 26
Table 22: Types of Health Conditions – Sheltered and Unsheltered Homeless, 2014 ............................... 27
Table 23: Types of Health Conditions – Total Homeless (2002 to 2014) - Trends ..................................... 27
Table 24: Length of Time Homeless – Sheltered and Unsheltered, 2014 ................................................... 28
Table 25: Length of Time Homeless – Total Homeless (2002 to 2014) - Trends ....................................... 29
Table 26: Length of Time in Municipality Interviewed – Sheltered and Unsheltered Homeless, 2014 ..... 29
Table 27: Length of Time in Municipality Interviewed – Total Homeless (2008 – 2014) - Trends ............. 30
Table 28: Episodically Homeless – Sheltered and Unsheltered Homeless, 2014 ....................................... 30
Table 29: Services Used – Sheltered and Unsheltered Homeless, 2014..................................................... 31
Table 30: Services Used – Total Homeless (2011 to 2014) - Trends .......................................................... 32
Table 31: Number of Days in Shelter – Sheltered Homeless (2011 to 2014) ............................................. 33
Table 32: Where the Unsheltered Homeless Stayed, 2014 ........................................................................ 34

Table 33: Reasons for Not Staying in a Shelter (2008 to 2014) .................................................................. 34
Table 34: Previous Stay in a Shelter (2008, 2014) ...................................................................................... 35
Table 35: Sub-Population Profiles, 2014 ..................................................................................................... 40
Table 36: Total Homeless by Municipal Sub-Region Found, 2014 .............................................................. 42
Table 37: Total Homeless by Municipal Sub-Region Found (2002 to 2014) - Trends ................................. 43
Table 38: Sheltered and Unsheltered Homeless by Municipal Sub-Region Found, 2014 ......................... 43
Table 39: Total Homeless by Length of Time in Municipal Sub-Region Found, 2014 ................................. 44
Table 40: Total Homeless by Where From if New to Community Found < 1 year, 2014 ........................... 45
Table 41: Sheltered and Unsheltered Homeless Youth and Children by Municipal Sub-Region, 2014 ...... 45
Table 42: Sheltered and Unsheltered Homeless Seniors by Municipal Sub-Region, 2014 ......................... 46
Table 43: Sheltered and Unsheltered Homeless Aboriginal Peoples by Municipal Sub-Region, 2014....... 46

i
Executive Summary
Background The Homeless Count is an initiative of the Greater Vancouver Regional Steering Committee on Homelessness (RSCH). This year, at the request of the RSCH, the Homelessness Partnering Strategy Community Entity for the Metro Vancouver region, formerly known as the Metro Vancouver Homelessness Secretariat, provided overall project management to implement the count.
The RSCH has conducted a region-wide count of homeless individuals every three years since 2002. The 2014 Homeless Count in the Metro Vancouver region took place on the evening of March 11 and the day of March 12, 2014.
Purpose The purpose of the Homeless Count is to estimate the number of people who are homeless in the Metro Vancouver region, obtain a demographic profile of this population, and identify trends compared to previous counts.
Definitions A person was considered homeless for the purpose of this count if they did not have a place of their own where they could expect to stay for more than 30 days and if they did not pay rent. This included people who:
• Had no physical shelter – who were staying ‘outside’, in alleys, doorways, parkades, parks and vehicles;
• Were staying temporarily in emergency shelters for the homeless, transition houses for women and children fleeing violence, and safe houses for youth;
• Had no fixed address and were staying temporarily in a hospital, jail or detox facility; and • Were staying temporarily at someone else’s place (couch surfing).
The sheltered homeless includes all homeless individuals in the count who were identified as homeless and who stayed overnight in an emergency shelter for the homeless, transition house for women and children fleeing violence, or safe house for youth during the count. It also includes individuals with no fixed address who were staying temporarily in a hospital, jail or detox facility during the count.
The unsheltered homeless includes all homeless individuals in the count who completed a street survey and who had no physical shelter (i.e. were staying ‘outside’, in alleys, doorways, parkades, parks and vehicles). It also includes people who were staying temporarily at someone else’s place (couch surfing) and who were found on the street or at a homeless service on the day of the count.1
Methodology The 2014 Homeless Count followed the same basic methodology and protocols used in previous counts and took place over a 24-hour period to provide a ‘snapshot’ of homelessness in the region during that time. As with previous Homeless Counts, it included both a shelter and street count.
1 Only a small percentage of the hidden homeless population is likely to be identified in a homeless count.

ii
Key Findings
• On the evening of March 11 and the day of March 12, 2014, a total of 2,777 homeless people were counted in the Metro Vancouver region. This included 2,689 adults and unaccompanied youth (under the age of 25) as well as 88 children (under the age of 19) who were accompanied by a parent during the count.2
• The number of homeless people identified in Homeless Counts in the region has remained fairly stable since 2008 – increasing by 4% between 2008 and 2014. This is less than the rate of increase for the population of the Metro Vancouver region as a whole, which increased by 9% in the same period.
• A higher proportion of the homeless population was sheltered in 2014 and 2011 compared to 2005 and 2008.
• Men represented about three quarters of the homeless population in 2014 (73%) and women represented about one quarter (27%). However, women tend to be more represented in the hidden homeless population, often doubling up with families and friends or staying in unsafe situations rather than staying on the street or accessing services for the homeless, and are likely undercounted. Nine people identified as transgendered in 2014 and it has been suggested that this is also likely an undercount.
• Adults aged 45 to 54 comprised the largest group among the homeless (25%), followed by adults aged 35 to 44 (20%), and children and youth under the age of 25 (20%). 410 homeless children and youth were counted in the Metro Vancouver region. This included 88 children who were accompanied by a parent.
• 582 homeless people identified as an Aboriginal person during the count, representing about one third of the total homeless population in the Metro Vancouver region. Aboriginal Peoples are over-represented in the region’s homeless population given they represent 2% of Metro Vancouver’s population. The proportion of the homeless population that identifies as an Aboriginal person has remained virtually unchanged at about one third since 2005. The proportion decreased to 27% in 2011 but increased again to 31% in 2014.
• Survey participants were asked, “What do you think is keeping you from finding a place of your own”. Low income (47%) and high rents (42%) were reported as the main barriers. Respondents also identified having no income (21%) as one of the barriers to finding a place.3 Addiction (27%) was reported as the third main barrier to finding a place, for both the sheltered and unsheltered homeless.
• Respondents were asked to identify their sources of income. The sources of income respondents identified most were income assistance (43%), disability benefit (21%), part-time employment (16%), and binning/bottle collecting (14%). About one in ten homeless individuals reported receiving no income.
2Youth is anyone under the age of 25 who was not accompanied by a parent during the count. Some youth were under the age of 16. ‘Children’ includes anyone under the age of 19 who was accompanied by a parent. 3 Respondents could select more than one response, so numbers for one response cannot be added to another.

iii
• 35% of respondents reported having one health condition, 45% reported two or more health conditions, and 20% reported no health conditions. Nearly half the respondents reported having an addiction (49%). The next most common health issue was a medical condition (41%), while about one third (34%) of respondents reported a mental illness. A total of 21% of respondents reported a concurrent disorder (i.e. both mental illness and addiction).
• About one fifth of respondents (19%) had been homeless for less than one month and are considered ‘newly homeless’. A higher proportion of the sheltered homeless had been homeless for less than a month (23%) compared to the unsheltered homeless (14%).
• 41% of respondents reported being homeless for one year or more and are considered ‘long-term homeless’. The unsheltered homeless were more likely to have been homeless for one year or more (45%) compared to the sheltered homeless (37%).
• The homeless population may not be as transient as is commonly believed. Among respondents, 79% reported living in the city where they were interviewed for at least one year, including half of respondents (51%) who reported living there 10 years or more. More than 200 individuals reported that they had lived in the city where they were interviewed their whole lives and many others had moved to the community at a young age. Very few individuals (2%) reported having just moved to the municipality where they were interviewed within a week before the homeless count.
• Homeless Count participants were asked what services they had used in the past 12 months. The top three services used by homeless individuals were meal programs (46%), hospital emergency rooms (42%), and drop-in centres (40%).
• The sheltered homeless were asked how many nights in a row they had stayed at the shelter where they were being surveyed. The majority of respondents had spent less than one month at the shelter. A higher proportion of respondents reported staying in a shelter for up to one month in 2014 (68%) compared to 2011 (55%).
• As part of the unsheltered survey, respondents were asked where they had stayed the previous night. More than half of respondents (56%) had spent the previous night outside or in a vehicle, while 40% stayed at someone else’s place.4 Other locations included 24-hour restaurants, abandoned buildings, or at a location in an exploitive situation (i.e. with a pimp or client).
• Just over half the unsheltered homeless (54%) reported having stayed in a shelter at some point in the last 12 months. This indicates that gathering information on the homeless population using only shelter data would miss a significant proportion of the homeless population who do not use shelters.
• 80% of the homeless population was found in Vancouver and Surrey, with Vancouver having the largest concentration (65%), followed by Surrey (15%). The rest of the homeless people were found across the other municipal sub-regions.
• In most municipal sub-regions: Burnaby, Delta/White Rock, Langley, Ridge Meadows, Richmond and Surrey, at least 50% of the homeless people who moved there within the year were from
4 This includes data on nine children who were accompanied by a parent.

iv
another community within the Metro Vancouver region. Most of the homeless people who moved to the Tri-Cities within the year were from a part of BC outside the Metro Vancouver region. In Vancouver and the North Shore, most of the homeless people who moved there were from another part of Canada. In Vancouver, 117 out of 208 respondents (56%) who had lived in the City for less than one year were from another part of Canada.
It is understood that homeless counts underestimate the number of people who are homeless on a given day and the 2014 Homeless Count was no exception. Despite best efforts to include everyone who was homeless during the count, service providers reported that the numbers underestimate the true extent of homelessness in the Metro Vancouver region.

1
1. Introduction This report presents the results of the 2014 Homeless Count in the Metro Vancouver region that took place on the evening of March 11 and the day of March 12, 2014. It provides information about people who were identified as homeless during this 24 hour period and compares the results with previous Homeless Counts where possible.5 Homeless Counts have been conducted in the region every three years since 2002.
Both the 2001 Regional Homelessness Plan for Greater Vancouver and the 2003 updated plan, Three Ways to Home, recommended that a regular Homeless Count be undertaken to obtain current information about the homeless population in the Metro Vancouver region, identify trends, and help monitor implementation of the RSCH Regional Homelessness Plan.
Similar to all the previous Homeless Counts conducted in the Metro Vancouver region, the 2014 Homeless Count measured homelessness at a point-in-time. This approach provides a ‘snapshot’ of homelessness on a given day and tells us about the homeless people who were counted in one 24-hour period. It does not include homeless people who were not identified or interviewed during the count.
It is understood that Homeless Counts underestimate the number of people who are homeless on a given day. Not all homeless people are found during the day and some people who are homeless do not wish to participate. Nevertheless, the 24-hour point-in time count is a widely accepted methodology to learn more about the homeless population and monitor tends.
1.1 Purpose The purpose of the Homeless Count is to estimate the number of people who are homeless in the Metro Vancouver region, obtain a demographic profile of this population, and identify trends compared to previous counts.
Since 2002, service providers, planners, community groups, health authorities, municipalities and funders have relied on the regional Homeless Counts to assist in policy development, planning, and prioritizing programs and services to address the needs of people who are homeless.
1.2 Definitions A person was considered homeless for the purpose of this count if they did not have a place of their own where they could expect to stay for more than 30 days and if they did not pay rent. This included people who:
• Had no physical shelter – who were staying ‘outside’, in alleys, doorways, parkades, parks and vehicles;
• Were staying temporarily in emergency shelters for the homeless, transition houses for women and children fleeing violence, and safe houses for youth;
• Had no fixed address and were staying temporarily in a hospital, jail or detox facility; and • Were staying temporarily at someone else’s place (couch surfing).
5 Changes have been made to the homeless count survey over the years – some questions have been modified and some have been added. Therefore, some responses to the 2014 survey cannot be compared with previous Homeless Counts.

2
The sheltered homeless includes all homeless individuals in the count who were identified as homeless and who stayed overnight in an emergency shelter for the homeless, transition house for women and children fleeing violence, or safe house for youth during the count. It also includes individuals with no fixed address who were staying temporarily in a hospital, jail or detox facility during the count.
The unsheltered homeless includes all homeless individuals in the count who completed a street survey and who had no physical shelter (i.e. were staying ‘outside’, in alleys, doorways, parkades, parks and vehicles). It also includes people who were staying temporarily at someone else’s place (couch surfing) and who were found on the street or at a homeless service on the day of the count.6
1.3 Geographic Scope The Homeless Count was conducted in the following communities in the Metro Vancouver region:
• Burnaby • Delta • Langley (City and Township) • New Westminster • North Shore (City and District of North Vancouver and West Vancouver) • Richmond • Ridge Meadows (Maple Ridge and Pit Meadows) • Surrey • Tri-Cities (Coquitlam, Port Coquitlam and Port Moody) • Vancouver (City and Pacific Spirit Regional Park) • White Rock
The Homeless Count was not conducted on First Nations reserves.
1.4 Annual Estimate of Homelessness and the Homelessness Continuum Point-in-time homeless counts estimate the number of sheltered and unsheltered people who are homeless during a 24-hour period. This is not the same as estimating the number of people who move in and out of homelessness throughout the course of a year. Many more people experience homelessness in a year than can be counted on any given day. Over the course of a year, some people will become homeless for the first time, some will exit homelessness, and others will cycle in and out of homelessness.
In the U.S., the Corporation for Supportive Housing (CSH) developed a formula to estimate the number of people who are likely to experience homelessness over the course of a year based on the point-in-time homeless count.7 This approach has been used by several communities in the U.S. and has been approved by the U.S. Department of Housing and Urban Development (HUD) as a method for calculating the annual estimate of homeless individuals based on a point-in-time count. In Vancouver, the Streetohome Foundation used a modified version of the CSH approach in 2009 to develop targets for its 10-Year Community Homelessness Plan. Based on the formula used by Streetohome, while the 2014 Homeless Count identified 2,777 homeless individuals in the Metro Vancouver region on the evening of
6 Only a small percentage of the hidden homeless population is likely to be identified in a homeless count. 7 Burt, Martha and Carol Wilkins. 2005. Estimating the Need: Projecting from Point-in-Time to Annual Estimates of the Number of Homeless People in a Community and Using this Information to Plan for Permanent Supportive Housing. Washington, DC: Corporation for Supportive Housing.

3
March 11 and the day of March 12, 2014, it is estimated that about 5,900 individuals in the region are likely to experience homelessness over the course of a year. The calculation is shown in Appendix A.
It should also be noted that the Homeless Count includes only one segment of the homeless population that is sometimes referred to as the ‘visible’ homeless. This population is shown above the waterline in Figure 1, using the example of an iceberg.8 As can be seen, the visible homeless are just the tip of the iceberg – only a small part of the population in the homeless continuum that includes the hidden homeless and population at risk of homelessness.
The hidden homeless includes people who do not have a regular address of their own where they have security of tenure and who are staying temporarily in another household – often called “couch surfing”. The Homeless Count includes people who are couch surfing only if they are found during the count and complete a survey – which is only a very small proportion of the total hidden homeless population in the Metro Vancouver region. For example, a total of 381 individuals in the 2014 count were identified as couch surfing. However, a 2009 pilot study in the Metro Vancouver region estimated that about 9,000 individuals were hidden homeless at the time of the survey and about 23,500 persons had been hidden homeless in the previous year.9
Based on 2006 census data, about 56,000 Metro Vancouver households are in core housing need10 and spending at least 50% of their income on shelter and are considered to be at risk of homelessness.11
Figure 1: Precarious Housing Iceberg Paradigm
8 Adapted from the Wellesley Institute’s Precarious Housing Iceberg. Wellesley Institute. 2010. Precarious Housing in Canada. 9 Margaret Eberle et al. 2009. Results of the pilot study to estimate the size of the hidden homeless population in Metro Vancouver. Note: the margin of error is 7,650 at the 95% confidence level, which means that 95 times out of 100, the interval from 1,545 persons to 16,846 persons includes the actual number of hidden homeless individuals in Metro Vancouver. 10 A household is said to be in core housing need if its housing falls below at least one of the adequacy, affordability or suitability, standards and it would have to spend 30% or more of its total before-tax income to pay the median rent of alternative local housing that is acceptable (meets all three housing standards). http://cmhc.beyond2020.com/HiCODefinitions_EN.html 11 Metro Vancouver. 2014. Regional Affordable Housing Strategy Update – Discussion Paper March 2014. Note: Core housing need figures for 2011 are not yet available.

4
1.5 Report Organization This report is organized as follows:
• Section 2 describes the methodology to implement the Homeless Count, including community feedback, and limitations of the count.
• Section 3 provides an overview of the total number of people enumerated in the 2014 Homeless Count in the Metro Vancouver region.
• Section 4 provides a profile of the homeless population in the Metro Vancouver region.
• Section 5 provides an overview of services used by the sheltered and unsheltered homeless population.
• Section 6 describes homelessness among sub-populations, including women, Aboriginal Peoples, youth, seniors, and the long-term homeless.
• Section 7 presents the Homeless Count results by municipal sub-regions within the Metro Vancouver region.
• Section 8 provides conclusions and recommendations for consideration in planning the next Homeless Count in 2017. It also suggests questions for further research.

5
2. Methodology and Implementation This section describes the methodology for the Homeless Count in the Metro Vancouver region. It also provides an overview of the project management approach and implementation team, community feedback, the response rate, and limitations of the Homeless Count.
2.1 Point-In-Time Approach The 2014 Homeless Count in the Metro Vancouver region followed the same basic methodology and protocols used in previous counts in the region. It took place over a 24-hour period to provide a ‘snapshot’ of homelessness in the region during that time and included both a shelter and street count as described below. To be consistent with previous years, the count was conducted mid-March.
Shelter Count
The shelter count took place on the evening of Tuesday, March 11, 2014. This part of the count involved obtaining information about individuals staying overnight in emergency shelters for people who are homeless, transition houses for women and children fleeing abuse, youth safe houses, detox facilities, hospitals and jails.
Volunteer interviewers were assigned to emergency shelters unless a shelter wanted their own staff to conduct the interviews. Transition houses, youth safe houses, and detox facilities preferred to have staff conduct the interviews themselves.
To ensure that the count was as accurate as possible, each emergency shelter, transition house for women and children fleeing abuse, youth safe house and detox facility was asked to complete a Shelter Statistics form to record the total number of people who stayed overnight (March 11) and the number of people turned away. Not all clients in the shelters agreed to, or were available to be surveyed, however, because of the Shelter Statistics form, information about the total number of people staying in a shelter facility was available. Hospitals and jails in the Metro Vancouver region were asked to provide information about the age and gender of each individual with No Fixed Address (NFA) who stayed in their facility on the night of March 11. Some facilities were able to provide data about Aboriginal identity.
A complete list of shelter and NFA locations is included in Appendix B and C.
Section 2.6 includes a discussion of the shelter response rate.
Street Count
The street count began early in the morning on Wednesday, March 12, 2014 and was implemented throughout the day and evening. It included a count and brief surveys with homeless people who were found that day and who were homeless according to the definition used by the count, based on a set of screening questions.
The street count focused on finding people in public areas or locations where people who are homeless were likely to be found, including certain streets, alleys, parks, bottle depots, and places where services and programs were available, such as meal programs and drop-in centres. These locations had been identified by community agencies, outreach workers and municipal staff prior to the count. Volunteer interviewers, working in teams of two, were assigned to specific locations and given maps and/or

6
instructions to look for people who were homeless and to conduct a survey. Most volunteer shifts ranged from about 2 to 3 hours.
As part of the street survey, respondents were asked where they had stayed the previous night. The purpose was to determine if the individual ‘screened in’ (i.e. met the definition of homeless being used for the count) and qualified for the rest of the survey. Individuals who reported staying in a shelter, safe house, transition house, detox, or hospital were screened out because they would have been included as part of the shelter count. People who stayed at someone else’s place were considered homeless and ‘screened in’.12
If a volunteer approached someone on the street who they thought might be homeless and the person declined to be interviewed, volunteers recorded this information on a survey form, including the perceived age, gender, reason not interviewed and location. These individuals were not included in the total count number because they could have been in a shelter the night before, may have been interviewed by another volunteer, or may not have been homeless. A total of 311 individuals were observed but not interviewed in the 2014 Homeless Count.
Survey Design and Administration
Two survey instruments were used for the Homeless Count: a street survey and shelter survey. They are similar and can be reviewed in Appendix D and E.
A few new questions were asked for the first time in a Metro Vancouver Homeless Count and these are discussed in the report. Where questions were changed from previous counts, this is also noted in the report.
All volunteers were required to attend a 2-hour training session to learn how to conduct the survey, how to approach people who are homeless, and how to stay safe during the Homeless Count. Volunteers were instructed to pick up their count package 15 minutes before their shift from the Local Area Station. Packages included one button for each volunteer, a clipboard, plastic cover, at least 10 surveys, detailed instructions for completing the survey (which were reviewed during a training session), a blank copy of the waiver volunteers signed at the training session, general information about the count, a pen, instructions about their route and/or a map, as well as some candies and cigarettes – to be used as ice-breakers and thank yous.13 People approached by volunteers were offered cigarettes prior to being asked to participate in a survey, rather than after completing a survey, to ensure nobody had an incentive to complete an interview more than once. Volunteers with the youth strategy were provided with bus tickets to offer to youth instead of cigarettes.
Volunteers were instructed to wear their buttons at all times during their shift – so they could be identified with the count. Similar to Homeless Counts in previous years, other than 2011, volunteers were advised to try and wake up a homeless person who was sleeping so the person would have the opportunity to be included in the count. Volunteers were also instructed to stop an interview immediately if they were approached by the media and to protect the privacy of the person they were interviewing.
12 Youth under the age of 25 who were living at home with a parent were not considered homeless, whereas an adult ‘couch surfing’ at their parent’s home was considered homeless. This was based on the assumption that youth were more likely to be able to live at home with their parents than adults. 13 At most shelters outside Vancouver and for the full street count, volunteers worked in teams of two.

7
2.2 Volunteer Interviewers There were 915 volunteers who participated in the Homeless Count. This included 114 volunteers who were part of the youth strategy and some professional outreach staff who were able to participate in the count as part of their employment. Volunteers were able to register online, using Volunteer Squared software, where data is retained on a Canadian server. Appendix F shows the number of volunteers for each municipal sub-region for the 2008, 2011 and 2014 Homeless Counts.14
2.3 Project Management and Implementation Team The Homeless Count is an initiative of the Greater Vancouver Regional Steering Committee on Homelessness (RSCH). This year, at the request of the RSCH, the Homelessness Partnering Strategy Community Entity for the Metro Vancouver region, formerly known as the Metro Vancouver Homelessness Secretariat, provided overall project management to implement the count instead of engaging an external consulting agency as had been done in previous counts.
As in previous years, Infocus Consulting served as the Aboriginal Coordinator and coordinated the count of Aboriginal people who were homeless in partnership with the Aboriginal Homelessness Steering Committee (AHSC) and Aboriginal service agencies.
The Homeless Count is a complex undertaking that requires several key players. The project team is described below.
a. Homelessness Partnering Strategy Community Entity (HPS CE). The HPS CE was responsible for project management, ensuring the count was carried out as planned and according to budget, analyzing the survey results and preparing the preliminary and final reports (April 2013 to July 2014). It was also responsible for obtaining data from the hospitals and police on homeless persons with no fixed address who stayed in these facilities during the count. In addition, the HPS CE retained part-time support for the period September 1, 2013 – March 31, 2014 to assist with administrative aspects of the Homeless Count.
b. Count Advisor. A Count Advisor provided advice on the count methodology, survey, implementation issues, communications, data entry, data cleaning, analysis, and the preliminary and final reports.
c. CHTs/communities. The nine Community Homelessness Tables (CHTs) played an important role in assisting the HPS CE and project team to recruit volunteers and identify locations for the count. They also provided feedback on the survey and final report. The City of Vancouver assumed these functions for the Homeless Count in Vancouver. Homeless-serving agencies and outreach teams throughout the region also contributed their expertise and knowledge to support the Homeless Count.
d. Area Coordinators. The HPS CE engaged ten Area Coordinators for the nine communities to help recruit volunteer interviewers, identify locations for the street surveys, assign volunteers to the locations and specific shifts for Count Day, participate in the volunteer training sessions, set up Area Stations on Count Day, and return all surveys to the HPS CE after the count. Each community had one Area Coordinator except Surrey, which had two coordinators. Two CHT volunteers, one in Surrey and another in Burnaby were actively involved in supporting their Area
14 954 people completed an on-line registration form for the count. Some of them, however, were unable to participate because they could not attend a training session.

8
Coordinators. In Vancouver, one staff person was assigned to oversee the count in the City with support from four Area Coordinators.
e. Shelter Coordinators. Two Shelter Coordinators were responsible for coordinating the Homeless Count in the emergency shelters, transition houses for women and children fleeing violence, youth safe houses, and detox facilities. One Shelter Coordinator was responsible for Vancouver and the other was responsible for the other communities in the Metro Vancouver region. They worked to ensure that all shelter facilities participated in the count, provided the facilities with all the information, surveys and supplies needed for the count, assigned volunteer interviewers to their locations (if appropriate), participated in the training sessions, facilitated the participation of shelter staff in training, and ensured that all surveys and required forms were returned to the HPS CE after the count.15
f. Youth Coordinator. The 2014 Homeless Count built on the youth strategy pioneered in 2011 to address undercount issues for youth who are homeless. A Youth Coordinator was engaged to implement this strategy and a Youth Steering Committee was created to identify ways to encourage youth to ‘count themselves in’. Close to 40 agencies that work with youth participated in this year’s count. They took an ‘outreach’ approach to identify youth on the street and hosted events within their organizations to encourage youth to participate in the count.
g. Aboriginal Coordinator. As recommended by the AHSC, Infocus Consulting was engaged to work with Aboriginal service providers in Vancouver and Surrey to identify locations where Aboriginal people who are homeless were likely to be found and to recruit Aboriginal volunteers to administer the survey with Aboriginal people. They also worked with an Aboriginal service provider to provide a training session for Aboriginal volunteers in Vancouver.
h. RSCH. The RSCH Constituency Table was responsible for approving the draft Terms of Reference, the methodology and preliminary and final reports on the results of the Homeless Count.
2.4 Training The HPS CE worked with the Area and Shelter Coordinators to organize 16 training sessions for the volunteers registered for the count. This included a designated training session for volunteers with the Aboriginal Strategy in Vancouver. In addition, the Youth Coordinator provided on-site training to many groups around the region, the Surrey coordinators organized a special session for City staff, and the Tri-Cities coordinator held an additional session for volunteers who signed up after the initial training session in that community. These additional sessions worked well and made it possible for more agencies and volunteers to participate in the count. A number of suggestions were made by coordinators to improve the training process in future counts:
• Consider training alternatives for professional staff who work with people who are homeless, e.g. online training and more local/small group sessions.
• Finalize the training schedule before registration starts so volunteers can registration for a training session when they sign up.
• Hold training sessions as close to the count as possible.
15 Some facilities wanted volunteers to conduct surveys while others preferred to have their own staff conduct the interviews.

9
2.5 Community Feedback Community feedback on the Homeless Count was obtained from the volunteer interviewers, the count coordinators, the Youth Steering Committee and AHSC. This feedback is summarized below. A separate report with more detailed comments and recommendations will be available for consideration in planning the next Homeless Count.
Volunteers
After the count, volunteers were asked to complete a brief survey to provide feedback on their experience. Of those who responded, 89% of volunteers reported that they “agreed” or “strongly agreed” that the training session they attended prepared them for the count, 97% “agreed” or “strongly agreed” that they understood their role in the count, 86% “agreed” or “strongly agreed” that they were able to adequately cover their assigned routes during the count, and 92% “agreed” or “strongly agreed” that they felt safe during their shifts. What they liked most was meeting and talking to people who were homeless and hearing their stories. What they liked least was not finding people to interview during their shifts.
Area, Shelter and Youth Coordinators
Area, Shelter and Youth Strategy Coordinators met on April 11, 2014 to discuss their experience with the count. The coordinators expressed a high degree of satisfaction with the process to implement the 2014 Homeless Count. However, most of the coordinators expressed great dissatisfaction with the results of the count – that the numbers do not reflect the true extent of homelessness in the region. A number of concerns were identified and are included as limitations in Section 2.7. The coordinators recommended more research and consultation to find alternatives to the count and to improve the methodology to achieve a more accurate estimate of the number of people who are homeless in the region.
Count coordinators were asked to complete a brief survey to provide feedback on their experience with the count. All the respondents “agreed” or “strongly agreed” that they received enough information from the HPS CE to understand what they were expected to do to implement the count and all the respondents “agreed” or “strongly agreed” that they received prompt answers to their questions from the HPS CE to implement the count. As well, 92% of respondents “agreed” or “strongly agreed” that they received adequate support from the HPS CE for the training sessions. Three quarters of the respondents (76%) “agreed” or “strongly agreed” that the amount of time available to prepare for the count was adequate, while one quarter (24%) disagreed. An important issue to be addressed in planning for future counts is that more than two-thirds of respondents (69%) “disagreed” or “strongly disagreed” that the number of hours estimated for their position was adequate to implement the count.
Youth Strategy
The Youth Steering Committee (YSC) met on April 11, 2014 to provide feedback on the Youth Strategy. Participants agreed that the YSC had contributed to the success of the count by developing the overall strategy, getting the message out for youth to ‘count themselves in’ and suggesting bus tickets as an ice-breaker for survey participants. There was consensus that the posters and cards developed through the Youth Strategy were very well received by everyone involved in the count. YSC members also reported that information-sharing with youth agencies was much better compared to previous counts, which gave agencies more time to prepare for the count and enabled more staff to participate.

10
YSC members also agreed that having both an outreach focus - where youth outreach workers went out on count day to conduct interviews with youth – as well as a ‘hub’ focus that involved activities and on-site volunteers to conduct interviews with the youth had worked well. It also worked well for agencies to build on regular activities that were already taking place during the count – rather than creating new events to attract youth who wouldn’t otherwise be planning to come to the agency during the count. Providing food to young people that they enjoyed was also seen to be an effective way to encourage participation. Concerns were expressed, however, that the count did not reflect the actual number of youth who are homeless and that new approaches should be considered for reaching youth, including on-line surveys, conducting interviews over the phone, and providing for youth to fill out their own survey. It was also suggested that more time is needed to plan and implement the youth strategy.16
Aboriginal Strategy
The results of the Homeless Count were discussed with members of the AHSC at their meeting on June 19, 2014. Concern was expressed that the Homeless Count was an undercount of the Aboriginal homeless population. Agencies reported that many Aboriginal people will not identify as an Aboriginal person for fear of discrimination, and that elders, in particular, are least likely to identify. It was also noted that Aboriginal agencies were not able to know if their clients had been counted and a suggestion was made that count participants be offered a card or some other way for agencies to be able to identify if a person had been interviewed. It was also suggested that count organizers work more closely with Aboriginal organizations for input on locations where Aboriginal people who are homeless are most likely to be found and the times when they are most likely to be at these locations.
2.6 Survey Response Rate Sheltered Homeless
The shelter response rate for the 2014 Homeless Count was 59%. A total of 1,741 adults and unaccompanied youth were counted in a shelter facility, including an emergency shelter, transition house for women and children fleeing abuse, youth safe house and NFA facility (hospital, jail, or detox facility). A total of 1,022 individuals were surveyed. This included 922 adults and unaccompanied youth who were interviewed in an emergency shelter, transition house for women and children fleeing abuse, youth safe house and detox facility and 100 individuals with NFA who were in a hospital or jail.17
This response rate of 59% was an improvement compared to the 2011 Homeless Count when 51% of the sheltered homeless (934 out of 1,824) were surveyed. However, it is less than the response rate in 2008 when 84% of the sheltered homeless (849 out of 1,006) were surveyed.
It has been suggested that finding ways to improve the response rate for the sheltered homeless should be a priority in planning for the next Homeless Count.18
16The Youth Coordinator was engaged the first week in January and the first meeting of the YSC was January 17, 2014. 17 Children who were accompanied by a parent were not interviewed. Data for the 100 individuals with NFA were provided by the hospitals and jails. 18 Offering to place volunteers in each of the emergency shelters was an attempt to improve the response rate. However, more work is needed to address this issue.

11
Unsheltered Homeless
It is not possible to provide a response rate for the unsheltered homeless because the total population is not known.
Volunteers initiated a survey with 1,581 individuals who were ‘screened out’ (see Section 2.1). A respondent was screened out if they reported that they had already answered a survey, currently had a place to stay that they paid rent for, or had stayed in a shelter, safe house, transition house, detox or hospital (in which case they would have been included in the shelter count). These individuals are not included in the count.
Volunteers approached 311 individuals who refused to be interviewed and these individuals are not included in the count (see Section 2.1).
2.7 Limitations As noted previously in this report, homeless counts are inherently undercounts and the 2014 Homeless Count in the Metro Vancouver region was no exception. Despite best efforts to include everyone who was homeless during the count, it is understood that some people who are homeless will be missed and some do not wish to participate. A number of service providers have expressed concern that the numbers underestimate the true extent of homelessness and are not consistent with community perceptions based on the number of people seeking services.
A number of factors, discussed below, have been identified that may have affected the results of the 2014 Homeless Count. Some of them apply to homeless counts in general while others are specific to the 2014 Homeless Count.
• Many people who are homeless do not want to be counted and prefer to remain hidden.
• People who are homeless may be tired of being surveyed and may not be willing to be surveyed since they have participated in several counts and have not benefitted.
• Agencies in suburban communities have said it is particularly difficult to find people who are homeless in low density neighbourhoods, large parks, and forest areas. It was suggested that these communities may need more volunteers or that volunteers/outreach staff should be able to work a longer shift. It was suggested that finding a person who is homeless can be like finding a needle in a haystack, and that interviewers could miss a person who is only a block away.
• Service providers have expressed concern that the Homeless Count numbers underestimate the number of youth who are homeless - or who need services to end and prevent homelessness. Members of the Youth Steering Committee pointed out that homeless youth are not the same as homeless adults - they are much less visible. In addition, homelessness for youth can take many forms: living in unsafe situations, couch surfing – staying temporarily with friends, as well as being out on the streets. It was also observed that many young people don’t consider themselves homeless or don’t want to admit they are homeless.

12
A concern was also expressed that the Homeless Count does not include people in mental health or addiction treatment programs. It was suggested that because the majority of these individuals have no secure housing when they leave the program, they should be counted as homeless.19
A number of other factors were identified that could have affected the results of the 2014 Homeless Count – although it is difficult to determine the exact impact. These are discussed below.
The Weather
The weather during the 2014 Homeless Count was particularly sunny and warm – during the evening on March 11 and all day on March 12. Service providers suggested that the great weather may have affected the survey response rate for the shelters because many people stayed out as late as possible, and many of the volunteers had left by the time the guests arrived. Shelter staff completed surveys with many guests after the volunteers had left, but they were unable to complete surveys with everyone. However, if an individual did stay in a shelter, regardless of the time they arrived, this would have been recorded on the Shelter Statistics form. It was also suggested that the nice weather may have resulted in more people sleeping outside, where they may not have been found during the count, instead of using a shelter. However, most of the shelters were fully occupied.
Agency members on the Youth Steering Committee reported that many of the young people normally served by youth agencies did not seek services on the day of the count. They suggested that this may have been due to the great weather during the count.
Neighbourhood Issues
Agencies reported that movies were being filmed in Fort Langley and at a park in Maple Ridge, which could have displaced some people who were homeless. As well, a community in Surrey had a greater police presence than usual (due to a previous crime in the neighbourhood), which could have displaced some people who were homeless and resulted in finding fewer homeless people than expected.
19 People in the treatment programs are not included in the count because they may remain in the program for more than 30 days – which does not meet the definition of homeless used for the count. The count does, however, include people with no fixed address who are in a detox facility.

13
3. Number of Homeless Persons in the Metro Vancouver Region This section provides an overview of the total number of people enumerated in the 2014 Homeless Count in the Metro Vancouver region. It also includes data from previous years, where available, to identify trends.20
3.1 Total Homeless Population Included in the Count On the evening of March 11 and the day of March 12, 2014, a total of 2,777 homeless people were counted in the Metro Vancouver region. This included 2,689 adults and unaccompanied youth (under the age of 25) as well as 88 children (under the age of 19) who were accompanied by a parent during the count. 21
Two thirds of the homeless population (66%) was sheltered (1,820 individuals). This included 1,504 people staying in an emergency shelter or youth safe house, 116 people in transition houses for women and children fleeing violence, and 200 people with no fixed address who were staying temporarily in a hospital, jail or detox facility on the night of March 11, 2014.22
One third of the homeless population (34%) was unsheltered (957 individuals). This included people living outside23 or staying temporarily with others (couch surfing) and using homelessness services on March 12, 2014.
Table 1: Total Sheltered and Unsheltered Homeless Population, 2014
Homeless Category Adults and Unaccompanied Youth
Accompanied Children Total Homeless
# % # % # % Sheltered Homeless 1,741 65% 79 90% 1,820 66% Shelters/Safe Houses 1,465 54% 39 44% 1,504 54% Transition Houses 76 3% 40 45% 116 4% No Fixed Address 200 7% 0 0% 200 7% Unsheltered Homeless 948 35% 9 10% 957 34% Total Homeless 2,689 100% 88 100% 2,777 100% Source: Survey data and Shelter Statistics forms provided by shelter facilities to the Homeless Count team.
Trends
The number of homeless people identified in Homeless Counts in the region has remained fairly stable since 2008 – increasing by 4% between 2008 and 2014. This is less than the rate of increase for the population of the Metro Vancouver region as a whole, which increased by 9% from 2008 to 2014.24 Another trend is that a higher proportion of the homeless population was sheltered in 2014 and 2011
20 Some data from the 2011 is inconsistent with previous trends and may be less reliable than 2008 data for the purpose of identifying trends and making comparisons. 21 Youth is anyone under the age of 25 who was not accompanied by a parent during the count. Some youth were under the age of 16. ‘Children’ includes anyone under the age of 19 who was accompanied by a parent. 22 Among those with no fixed address, 100 were in a detox facility, 93 were in a hospital, and 7 were in jail. 23 People living outside reported staying on the street, in a park, skytrain, garage or shed. 24 Metro Vancouver Regional Planning Division. 2014. Metro Vancouver’s population was 2,259,000 in 2008 and is estimated to be 2,468,000 in 2014.

14
compared to 2005 and 2008, as illustrated in Figure 2.25 However, the proportion of the sheltered homeless declined from 71% in 2011 to 66% in 2014.
Table 2: Total Sheltered and Unsheltered Homeless (2002 to 2014) - Trends
Number of Homeless 2002 2005 2008 2011
2014
Change 2011 to 2014
# # # # # # % Change Sheltered Homeless 788 1,047 1,086 1,892 1,820 -72 -4% Unsheltered Homeless 333 1,127 1,574 758 957 199 26% Total Homeless 1,121 2,174 2,660 2,650 2,777 127 5%
Figure 2: Proportion of Sheltered and Unsheltered Homeless (2002 to 2014)
25The increase in numbers from 2002 and 2005 could, to some extent, be a function of an improved count methodology, including more volunteers.
788 1,047 1,086
1,892 1,820 333
1,127
1,574
758 957
0
500
1000
1500
2000
2500
3000
2002 2005 2008 2011 2014
Sheltered Homeless Unsheltered Homeless

15
3.2 People Turned away from Emergency Shelters Emergency shelters, safe houses and transition houses were asked to report on how many people were turned away on the evening of March 11, 2014. They reported 317 turnaways, including adults, youth and children.26 Most of the turnaways were from shelters and safe houses (88%). The main reason for turnaways was because the facility was full. In some cases, however, an individual seeking assistance was not appropriate for the facility.27 Some of the turnaways may have been counted on the street on March 12 and included in the street count as part of the unsheltered homeless or they may have found accommodation in another shelter. In addition, the same individual may have been turned away from more than one shelter. Therefore, the number of turnaways is not added to the total of 2,777 homeless people who were counted.
Table 3: Turnaways from Emergency Shelters, Safe Houses, and Transition Houses, 2014
Shelter Category Total Adults, Youth and Children # %
Shelters/Safe Houses 278 88% Transition Houses 39 12% Total Turnaways 317 100% Source: Shelter Statistics forms provided by shelter facilities to the Homeless Count team.
26 The number of turnaways refers to the number of instances when a person was turned away and is not the same as the number of unique individuals turned away. For example, two shelters may have reported the same person being turned away on the same night. 27 Either they were not eligible for the facility or their needs could not be accommodated.

16
4. Profile of the Homeless Population in the Metro Vancouver Region This section provides a profile of the homeless people who were surveyed in the Homeless Count, including people with no fixed address, and identifies trends based on data from previous counts.28
4.1 Gender Men represented about three quarters of the homeless population identified in the 2014 Homeless Count and women represented about one quarter. Previous Homeless Count reports and community agencies have stated that women tend to be more represented in the hidden homeless population and often double up with families and friends or stay in unsafe situations rather than stay on the street or access services for the homeless. As a result, they are likely to be undercounted. It has also been suggested that women with children will often stay in unsafe situations so their children have a bed to sleep in. Among the unsheltered homeless respondents, 57% of women reported staying at someone else’s place compared to 33% of men. Nine people identified as transgendered in 2014 and it has been suggested that this is also likely an undercount.
Table 4: Gender - Sheltered and Unsheltered Homeless, 2014
Gender Sheltered Homeless
Unsheltered Homeless
Total Homeless
# % # % # % Men 733 72% 686 73% 1,419 73% Women 279 27% 248 26% 527 27% Transgendered 6 1% 3 0% 9 0% Total Respondents 1,018 100% 937 100% 1,955 100% No Answer 802 20 822 Total 1,820 957 2,777
Trends Over the years, the proportion of men and women identified in Homeless Counts has remained about the same, with women making up between one quarter and one third of the region’s homeless population.29
Table 5: Gender - Total Homeless (2002 to 2014) - Trends
28 Some data from the 2011 is inconsistent with previous trends and may be less reliable than 2008 data for the purpose of identifying trends and making comparisons. 29 The large number of people for whom there is no data about gender in 2014, compared to previous years, could mean that the actual proportion of men, women, and transgendered persons is slightly different.
Gender 2002 Total Homeless
2005 Total Homeless
2008 Total Homeless
2011 Total Homeless
2014 Total Homeless
# % # % # % # % # % Men 700 68% 1,483 73% 1,679 72% 1,452 69% 1,419 73% Women 333 32% 534 26% 619 27% 652 31% 527 27% Transgendered N/A 9 0% 22 1% 8 0% 9 0% Total Respondents 1,033 2,026 2,320 2,112 1,955 No Answer 88 148 340 538 822 Total 1,121 2,174 2,660 2,650 2,777

17
4.2 Age In 2014, adults aged 45 to 54 comprised the largest group among the homeless in the Metro Vancouver region (25%), followed by adults aged 35 to 44 (20%), and children and youth under the age of 25 (20%). A total of 410 homeless children and youth were identified, including 88 children who were accompanied by a parent.30 A higher proportion of unaccompanied youth 19 to 24 were unsheltered rather than sheltered. Most of these unsheltered youth (56%) were couch surfing.31 A total of 371 homeless seniors (55 and older) were counted in the Metro Vancouver region. Most were sheltered.
Table 6: Age - Sheltered and Unsheltered Homeless, 2014
Age groups Sheltered Homeless
Unsheltered Homeless
Total Homeless
# % # % # % Under 19[1] 106 10% 85 9% 191 9% 19-24 86 8% 133 14% 219 11% 25-34 178 16% 154 16% 332 16% 35-44 220 20% 193 20% 413 20% 45-54 279 26% 233 25% 512 25% 55-64 169 16% 112 12% 281 14% 65+ 52 5% 38 4% 90 4% Total Respondents 1,090 100% 948 100% 2,038 100% No Answer 730 9 739 Total 1,820 957 2,777 [1] Includes 79 sheltered children and 9 unsheltered children accompanied by a parent.
Trends
There were 410 homeless youth and children counted in the Metro Vancouver region during the 2014 Homeless Count. This was a 3% increase compared to 2011. Children and youth represented 20% of the homeless population in 2014 compared to 24% in 2011 and 15% in 2008. The number of homeless children and youth who have been identified in Homeless Counts has increased over the years.
Table 7: Age - Total Homeless (2002 to 2014) - Trends
Age Groups
2002 Total Homeless
2005 Total Homeless
2008 Total Homeless
2011 Total Homeless
2014 Total Homeless
# % # % # % # % # % Under 25 Years 343 32% 370 18% 364 15% 397 24% 410 20% 25-34 Years 216 20% 435 21% 436 18% 275 17% 332 16% 35-44 Years 299 28% 634 31% 726 30% 328 20% 413 20% 45-54 Years 151 14% 443 22% 661 28% 397 24% 512 25% 55-64 Years 37 3% 139 7% 180 8% 210 13% 281 14% 65+ Years 14 1% 32 2% 32 1% 58 3% 90 4% Total Respondents 1,060 100% 2,053 100% 2,399 100% 1,665 100% 2,038 100% No Answer 61 121 261 985 739 Total 1,121 2,174 2,660 2,650 2,777 Note: Totals for all years include children who were accompanied by a parent. 30 Youth is anyone under the age of 25 who was not accompanied by a parent during the count. Some youth were under the age of 16. ‘Children’ includes anyone under the age of 19 who was accompanied by a parent. 3178% of unaccompanied youth under 19 were couch surfing while 44% of youth 19 to 24 years were couch surfing.

18
The number of children under the age of 19 with their parents who identified as homeless in the Metro Vancouver region has ranged from 71 children in 2002 to a high of 94 children in 2008, while 88 children were counted in 2014.
Table 8: Homeless Children with Parents (2002 to 2014) - Trends
Children with Parents 2002 2005 2008 2011 2014 # # # # #
Sheltered 69 52 80 68 79 Unsheltered 2 22 14 6 9 Total 71 74 94 74 88 Note: This table shows a sub-set of Table 7 and should not be added to the numbers in Table 7. Seniors (55 years and older) are an increasing proportion of the total homeless population. There were 371 homeless seniors counted in the Metro Vancouver region on March 12, 2014, representing a 38% increase compared to 2011 when 268 seniors were counted and a 75% increase compared to 2008 when 212 seniors were counted. At the same time, the number of homeless seniors 65+ nearly tripled since 2008. Figure 2 illustrates how the proportion of people in the different age groups has changed since the 2002 Homeless Count.
Figure 3: Changes in the Age of the Homeless Population (2002 to 2014)
0%
10%
20%
30%
40%
50%
60%
70%
80%
90%
100%
2002 2005 2008 2011 2014
Under 25 years 25-34 Years 35-44 Years 45-54 Years 55-64 Years 65+ Years

19
4.3 Aboriginal Identity A total of 582 homeless respondents identified as an Aboriginal person in the Metro Vancouver region during the 2014 Homeless Count, representing about one third of the total homeless population in the region. Agencies have reported that this is likely an undercount as many Aboriginal people will not identify as an Aboriginal person for fear of discrimination, and this is particularly true for Aboriginal people who are elders.
Aboriginal Peoples are over-represented in the region’s homeless population given they represent 2% of Metro Vancouver’s population. Table 9 shows that homeless Aboriginal respondents were less likely to access the shelter system: nearly 60% of respondents who identified as an Aboriginal person were unsheltered compared to 40% who were sheltered. Just over half of the respondents who did not identify as an Aboriginal person were sheltered rather than unsheltered.
Table 9: Aboriginal Identity - Sheltered and Unsheltered Homeless, 2014
Aboriginal identity Sheltered Homeless
Unsheltered Homeless
Total Homeless
# % # % # % Aboriginal 235 25% 347 38% 582 31% Not Aboriginal 724 75% 558 62% 1,282 69% Total Respondents 959 100% 905 100% 1,864 100% No Answer 861 52 913 Total 1,820 957 2,777
Trends
The proportion of respondents who identified as an Aboriginal person has remained virtually unchanged at about one third since 2005. The proportion decreased to 27% in 2011 but increased again to 31% in 2014.
Table 10: Aboriginal Identity - Total Homeless (2005 to 2014) - Trends
Aboriginal Identity 2005 Total Homeless
2008 Total Homeless
2011 Total Homeless
2014 Total Homeless
# % # % # % # % Aboriginal 515 30% 688 32% 394 27% 582 31% Not Aboriginal 1,205 70% 1,453 68% 1074 73% 1282 69% Total Respondents 1,720 100% 2,141 100% 1,468 100% 1,864 100% No Answer 454 519 1,182 913 Total 2,174 2,660 2,650 2,777 The question about Aboriginal identity was not asked in 2002, so data for that year is not included.

20
4.4 Accompanying the Homeless Participants in the Homeless Count were asked if there was anyone with them. If they were with someone, they were asked to identify who. Overall, 79% of respondents reported that they were alone.
Homeless people who were alone were more likely to be sheltered than unsheltered, and parents with children were also more likely to be sheltered than unsheltered. Some individuals may have been unsheltered because they could not be accommodated in a shelter, for example individuals who were with a partner/spouse (8%) or pet (3%).32
Table 11: Accompanying the Homeless - Sheltered and Unsheltered Homeless, 2014
Accompanying the Homeless (more than 1 response possible)
Sheltered Homeless
Unsheltered Homeless
Total Homeless
# % # % # % Alone 796 87% 655 71% 1,451 79% With Partner/Spouse 34 4% 71 8% 105 6% With Children 34 4% 7 1% 41 2% With Friends 30 3% 152 16% 182 10% With Relative 8 1% 16 2% 24 1% With Pet 7 1% 24 3% 31 2% With Other 13 1% 18 2% 31 2% Total Respondents33 915 924 1,839 No Answer 905 33 938 Total 1,820 957 2,777
Trends
The proportion of homeless respondents who were alone has not changed significantly over the years.
Table 12: Accompanying the Homeless - Total Homeless (2005 to 2014) - Trends
Accompanying the Homeless (more than 1 response possible)
2005 Total Homeless
2008 Total Homeless
2011 Total Homeless
2014 Total Homeless
# % # % # % # % Alone 1,502 82% 1,670 76% 1,122 75% 1,451 79% With Partner/Spouse 178 10% 243 11% 113 8% 105 6% With Children 40 2% 43 2% 55 4% 41 2% With Pet 34 2% 59 3% 31 2% 31 2% With Other 76 4% 229 10% 178 12% 237 13% Total Respondents 1,830 2,200 1,504 1,839 No Answer 344 460 1,146 938 Total34 2,174 2,660 2,650 2,777
32 Some shelters are able to accommodate couples and pets while others are not. 33 Percentages do not add up to 100 because respondents could have selected more than one answer e.g. a partner and children. 34 In Table 12, data on friends and relatives is included in “Other” to allow for a comparison with previous years.

21
4.5 First Language A new question was asked in 2014 to learn about the first language of respondents – meaning the language learned at birth or “mother tongue”.35 The vast majority (87%) of respondents reported English as their first language. Four percent of respondents reported that French was their first language, whereas 1.1% of the general population in the Metro Vancouver region has reported French as their mother tongue.36 The most common first languages reported other than English and French were First Nations languages, Spanish, and Chinese.37
Table 13: First Language – Sheltered and Unsheltered Homeless, 2014
First Language Sheltered Homeless
Unsheltered Homeless
Total Homeless
# % # % # % English 771 86% 798 89% 1,569 87% French 32 4% 32 4% 64 4% Other 98 11% 68 8% 166 9% Total Respondents 901 100% 898 100% 1,799 100% No Answer 919 59 978 Total 1,820 957 2,777
4.6 Newcomers to Canada This question was also introduced in 2014 to learn to what extent the homeless population included people who were new to Canada within the last 5 years. Table 14 shows that almost all respondents to this question (97%) answered that they have been in Canada at least 5 years. Respondents who said they were new to Canada were mostly from Asia, Africa, Europe, the United States, the Caribbean, and South America.
Table 14: Newcomers to Canada – Sheltered and Unsheltered Homeless, 2014
New To Canada within last 5 years
Sheltered Homeless
Unsheltered Homeless
Total Homeless
# % # % # % Not New to Canada 794 97% 716 97% 1,510 97% New to Canada 26 3% 20 3% 46 3% Total Respondents 820 100% 736 100% 1,556 100% No Answer 1,000 221 1,221 Total 1,820 957 2,777
35 The 2014 survey did not ask respondents to self-identify their ethnic or cultural group because it was reported that this was a difficult question to answer given that many people are of mixed ethnicity or identify as “Canadian”. In previous reports it had been suggested that findings from this question be treated with caution given a high non-response rate, especially from the unsheltered homeless population. 36 Metro Vancouver Regional Planning Division. 2014. Based on 2011 census data (26,000/2,356,000). 37 Nearly 2% of respondents identified a First Nations language as their first language, while 1% identified Spanish and 1% identified Chinese. The results should be interpreted with caution as respondents could select only one language and they may have learned more than one language at birth. In addition, the survey was conducted only in English, so the count may undercount people who were not comfortable speaking English.

22
4.7 Military Service in Canadian Forces Another new question in 2014 asked respondents if they had any military service in the Canadian Forces. This was the same question used in Toronto’s homeless count in 2013. The proportion of the homeless population indicating they had military service in the Canadian Forces was the same for both counts, with 7% of the homeless population saying they had some experience in the Canadian Forces.38 According to point-in-time homeless counts in the U.S., 12% of homeless adults were identified as veterans in 2013.39 In Canada, it is estimated that 1.7% of the general population are veterans.40
Table 15: Military Service in the Canadian Forces – Sheltered and Unsheltered Homeless, 2014
Military service in Canadian Forces
Sheltered Homeless
Unsheltered Homeless
Total Homeless
# % # % # % Yes 58 6% 60 7% 118 7% No 842 94% 826 93% 1,668 93% Total Respondents 900 100% 886 100% 1,786 100% No Answer 920 71 991 Total 1,820 957 2,777
4.8 Barriers to Housing Survey participants were asked, “What do you think is keeping you from finding a place of your own”. Table 16 identifies the range of barriers identified by respondents. Low income (47%) and high rents (42%) were reported as the main barriers to housing. Respondents also identified having no income (21%) as one of the barriers to finding a place.41 Addiction (27%) was reported as the third main barrier to finding a place, for both the sheltered and unsheltered homeless.
In general, the barriers to finding a place were similar for the sheltered and unsheltered homeless except that ‘rent too high’ was reported by a higher proportion of the sheltered homeless compared to the unsheltered homeless, and discrimination was reported by a higher proportion of the unsheltered homeless.42
38 City of Toronto. 2013 Street Needs Assessment Results. 39 U.S. Department of Housing and Urban Development. The 2013 Annual Homeless Assessment Report (AHAR) to Congress. 40 Estimated veteran population as of March 2013 (594,300/35,158,300. (Veterans Affairs Canada online at http://www.veterans.gc.ca/eng/news/general-statistics 41 Respondents could select more than one response, so numbers for one response cannot be added to another. 42The shelter survey included ‘health or disability issue’ on the list of possible responses, but this was inadvertently omitted from the unsheltered survey. Among the sheltered homeless, 20% of respondents identified health or disability as a barrier to housing. Although it was not listed on the survey, 2% of unsheltered respondents specified this as a barrier as part of the other category. It is likely that this percentage would have been higher if the response had been included on the list of possible responses on the unsheltered survey.

23
Table 16: Barriers to Housing – Sheltered and Unsheltered Homeless, 2014
Barriers to Housing (more than 1 possible)
Sheltered Homeless
Unsheltered Homeless
Total Homeless
# % # % # % Income too low 441 49% 428 46% 869 47% No income/no income assistance 179 20% 197 21% 376 21% Rent too high 410 45% 351 38% 761 42% Addiction 240 26% 261 28% 501 27% Family breakdown/abuse/conflict 155 17% 155 17% 310 17% Poor housing condition 142 16% 171 19% 313 17% Mental health Issue 138 15% 142 15% 280 15% Conflict with the law 55 6% 75 8% 130 7% Evicted 80 9% 117 13% 197 11% Pets 33 4% 46 5% 79 4% Discrimination 93 10% 156 17% 249 14% Other 222 24% 241 26% 463 25% Total Respondents 909 922 1,831 No Answer 911 35 946 Total 1,820 957 2,777 Trends
Table 17 compares the responses in 2014 with 2011. The barriers to housing in 2014 are in the same order of priority as in 2011. The top three barriers to having one’s own place continued to be low income, high rents, and addiction.
It is not possible to compare the 2014 and 2011 results with previous years because the questions were different. In 2008, respondents were asked: “What are the main reasons you do not have your own place.” In addition, the surveys in 2011 and 2014 provided a list of possible responses, whereas a list was not provided in 2008 which could affect the comparability of the results.
Table 17: Barriers to Housing – Total Homeless (2011 to 2014) - Trends
Barriers to Housing (more than 1 possible)
2011 Total Homeless
2014 Total Homeless
# % # % Income too low 857 58% 869 47% No income/no income assistance 331 22% 376 21% Rent too high 803 54% 761 42% Addiction 473 32% 501 27% Family breakdown/abuse/conflict 375 25% 310 17% Poor housing condition 350 24% 313 17% Mental health Issue 277 19% 280 15% Conflict with the law 228 15% 130 7% Evicted 201 13% 197 11% Pets N/A N/A 79 4% Discrimination N/A N/A 249 14% Other 370 25% 463 25% Total Respondents 1,489 1,831 No Answer 1,161 946 Total 2,650 2,777

24
4.9 Sources of Income Respondents were asked to identify their sources of income. They could identify more than one source. The sources of income respondents identified most were income assistance (43%), disability benefit (21%), part-time employment (16%), and binning/bottle collecting (14%).
The sheltered homeless were more likely to report receiving disability benefits, employment, and CPP/pension compared to the unsheltered homeless. The unsheltered homeless were more likely to report receiving income from binning/bottle collecting and panhandling compared to the sheltered homeless.
A higher proportion of the unsheltered homeless reported income assistance (45%) as a source of income compared to the sheltered homeless (40%), while the sheltered homeless were more likely to report disability benefits as a source of income (24%) compared to the unsheltered homeless population (18%).
About one in ten homeless individuals reported receiving no income. Seven respondents reported receiving income through a Youth Agreement.
Table 18: Sources of Income – Sheltered and Unsheltered Homeless, 2014
Sources of income (more than 1 possible)
Sheltered Homeless
Unsheltered Homeless
Total Homeless
# % # % # % Government transfers
Income assistance 364 40% 413 45% 777 43% Disability benefit 216 24% 160 18% 376 21% OAS/GIS 31 3% 11 1% 42 2% CPP or Other Pension 86 9% 29 3% 115 6% Employment Insurance 19 2% 8 1% 27 1% Youth Agreement 1 0% 6 1% 7 0%
Employment Part-time employment 156 17% 131 14% 287 16% Full-time employment 68 7% 14 2% 82 4%
Other sources Binning, bottle collecting 53 6% 199 22% 252 14% Panhandling 30 3% 173 19% 203 11% Friends/family 49 5% 80 9% 129 7% Other 69 8% 135 15% 204 11%
No Income 80 9% 91 10% 171 9% Total Respondents 910 913 1,823 No Answer 910 44 954 Total43 1,820 957 2,777
43 Subtotals for each category are not provided because a person may have selected more than one source of income. The numbers cannot be added.

25
Trends
Table 19 shows that the proportion of respondents receiving income assistance increased from 43% in 2008, to 52% in 2011 but dropped back to 43% again in 2014. There has been a slight increase in the proportion of respondents receiving disability benefits over the three counts. The proportion of respondents receiving OAS/GIS/CPP benefits increased between 2011 and 2014, consistent with a greater proportion of seniors among the homeless.
Table 19: Sources of Income – Total Homeless (2008 to 2014) - Trends
Sources of Income (more than 1 possible)
2008 Total Homeless
2011 Total Homeless
2014 Total Homeless
# % # % # % Government transfers
Income assistance 960 43% 789 52% 777 43% Disability benefit 403 18% 296 20% 376 21% OAS/GIS/CPP 53 2% 53 4% 157 9% Employment Insurance 26 1% 45 3% 27 1% Youth Agreement N/A N/A N/A N/A 7 0%
Employment44 Part-time employment
421 19% 177 12% 287 16%
Full-time employment 63 4% 82 4% Other sources
Binning, bottle collecting 478 22% 306 20% 252 14% Panhandling 277 12% 188 12% 203 11% Friends/family 60 3% 216 14% 129 7% Other 372 17% 247 16% 204 11%
No Income 182 8% 97 6% 171 9% Total Respondents 2,219 1,513 1,823 No Answer 441 1,137 954 Total45 2,660 2,650 2,777
44 There was no distinction between part-time and full-time employment in 2008. 45 It is not possible to compare 2014 responses with responses prior to 2008 because the question was changed in 2008 to allow multiple responses rather than just the main source of income.

26
4.10 Health Conditions Incidence of Health Conditions
The surveys asked respondents about their health, and specifically whether they had a medical condition, physical disability, addiction, and mental illness. Medical condition refers to chronic problems like asthma and diabetes, while physical disability refers to a condition affecting mobility or movement. As in previous counts, the information about health in 2014 includes health conditions self-reported by respondents as well as health conditions observed by interviewers; however, very few observations were recorded on the surveys in 2014.46
Table 20 shows that 80% of respondents reported one or more health conditions while 20% reported no health conditions.
Table 20: Incidence of Health Conditions – Sheltered and Unsheltered Homeless, 2014
Health condition Sheltered Homeless
Unsheltered Homeless
Total Homeless
# % # % # % No Health Conditions 194 22% 166 19% 360 20% One Health Condition 297 33% 317 36% 614 35% Two or More Health Conditions 403 45% 398 45% 801 45%
Total Respondents 894 100% 881 100% 1,775 100% No Answer 926 76 1,002 Total 1,820 957 2,777
Trends
In reviewing data from the previous Homeless Counts, it appears that the health of the homeless population in the Metro Vancouver region has been getting worse. The proportion of respondents with no health conditions has declined since 2005 while the proportion with two or more health conditions has increased.47
Table 21: Incidence of Health Conditions – Total Homeless (2005 to 2014) - Trends
Health condition 2005 Total Homeless
2008 Total Homeless
2011 Total Homeless
2014 Total Homeless
# % # % # % # % No Health Conditions 445 26% 616 28% 3 0% 360 20% One Health Condition 666 39% 601 27% 426 38% 614 35% Two or More Health Conditions 608 35% 1,016 45% 694 62% 801 45%
Total Respondents 1,719 100% 2,233 1,123 100% 1,775 100% No Answer 455 427 1,527 1,002 Total 2,174 2,660 2,650 2,777
46 This is similar to the 2013 Vancouver Homeless Count, where perceived health conditions accounted for a small share of total positive answers, mostly among the unsheltered homeless. 47According to the 2011 Homeless Count report and database, only three respondents in 2011 reported no health conditions. The reliability of this data is questionable.

27
Types of Health Conditions
Nearly half the respondents in 2014 reported having an addiction (49%). The next most common health issue was a medical condition (41%), while about one third (34%) reported a mental illness. According to the data, 21% of respondents reported a concurrent disorder (i.e. both mental illness and addiction).
While the sheltered homeless were more likely to report a medical condition (44%) compared to the unsheltered homeless (37%), the unsheltered homeless were more likely to report an addiction (55%) compared to the sheltered homeless (44%).
Respondents were asked to specify their medical conditions. The most common medical condition reported by respondents in 2014 were Hepatitis C, followed by diabetes, arthritis, spine and back problems, HIV, and heart problems, as well as brain injury, asthma, respiratory problems and cancer.
Table 22: Types of Health Conditions – Sheltered and Unsheltered Homeless, 2014
Health condition (more than 1 possible)
Sheltered Homeless
Unsheltered Homeless
Total Homeless
# % # % # % Addiction 390 44% 481 55% 871 49% Medical Condition 395 44% 328 37% 723 41% Mental Illness 296 33% 314 36% 610 34% Physical Disability 272 30% 235 27% 507 29% Total Respondents 894 881 1,775 No Answer 926 76 1,002 Total 1,820 957 2,777
Trends
Table 23 shows that the proportion of respondents reporting an addiction in 2014 is about the same as in 2005. It is interesting to note that the proportion of respondents reporting an addiction spiked to 61% in 2008 before returning to 49% in 2014. The proportion of respondents with a medical condition and physical disability has increased since 2005 but has not changed significantly since 2008. The proportion of respondents reporting a mental illness increased from about one quarter in 2005 to one third in 2008 and has not changed much since then.
Table 23: Types of Health Conditions – Total Homeless (2002 to 2014) - Trends
Health condition (more than 1 possible)
Total homeless
2002
Total homeless
2005
Total homeless
2008
Total homeless
2011
Total homeless
2014 # % # % # % # % # %
Addiction 337 39% 838 48% 1,365 61% 712 54% 871 49% Medical Condition 256 30% 601 35% 1,023 46% 608 46% 723 41% Mental Illness 195 23% 389 22% 725 33% 463 35% 610 34% Physical Disability 132 15% 364 21% 699 31% 470 36% 507 29% Total Respondents 864 1,731 2,229 1,314 1,775
No Answer 257 443 431 1,336 1,002 Total 1,121 2,174 2,660 2,650 2,777

28
4.11 Length of Time Homeless About one fifth of respondents (19%) who provided information on the length of time homeless had been homeless for less than one month and are considered ‘newly homeless’. A higher proportion of the sheltered homeless had been homeless for less than a month (23%) compared to the unsheltered homeless (14%).
At the same time, 41% of respondents reported being homeless for one year or more and are considered ‘long-term homeless’. The unsheltered homeless were more likely to have been homeless for one year or more (45%) compared to the sheltered homeless (37%).
Table 24: Length of Time Homeless – Sheltered and Unsheltered, 2014
Length of time homeless Sheltered Homeless
Unsheltered Homeless
Total homeless
# % # % # % Less than 1 week 34 4% 31 3% 65 4% 1 week to under 1 month 167 19% 105 11% 272 15% 1 month to under 6 months 302 34% 282 31% 584 32% 6 months to under 1 year 61 7% 84 9% 145 8% 1 year or more 336 37% 415 45% 751 41% Total Respondents 900 100% 917 100% 1,817 100% No Answer 920 40 960 Total 1,820 957 2,777
Trends
Table 25 indicates that the proportion of respondents who reported being homeless for one year or more declined from 48% in 2008 to 41% in 2014.
The proportion of respondents considered newly homeless (less than one month) has increased since 2008, from 13% in 2008 to 15% in 2011 and 19% in 2014. Table 25 also shows that at every count, an average of 300 people became homeless within the month - and that there continues to be a steady flow of people who are newly homeless in the region. We do not know, however, if these individuals are homeless for the first time or if they are episodically homeless (i.e. have experienced a previous episode of homelessness within the year).48
48 This should not be interpreted as a net increase of 300 new homeless individuals each month as some people who are homeless are also likely to exit homelessness each month.

29
Table 25: Length of Time Homeless – Total Homeless (2002 to 2014) - Trends
Length of time homeless
2002 Total Homeless
2005 Total Homeless
2008 Total Homeless
2011 Total Homeless
2014 Total Homeless
# % # % # % # % # % Less than 1 week49 98 12% 149 8% 105 5%
233 15% 65 4%
1 week to under 1 month 222 26% 275 16% 167 8% 272 15%
Sub-Total 320 38% 424 24% 272 13% 233 15% 337 19% 1 month to under 6 months 253 30% 460 26% 556 26% 452 30% 584 32%
6 months to under 1 year 100 12% 262 15% 271 13% 222 15% 145 8%
1 year or more 166 20% 628 35% 1,017 48% 610 40% 751 41% Total Respondents 839 100% 1,774 100% 2,116 100% 1,517 100% 1,817 100% No Answer 282 400 544 1,133 960 Total 1,121 2,174 2,660 2,650 2,777
4.12 Length of Time in Municipality Interviewed Table 26 shows that the homeless population may not be as transient as is commonly believed. Among respondents who reported on the length of time they had lived in the city where they were interviewed, 79% reported living there at least one year, including half of respondents (51%) who reported living there 10 years or more. More than 200 individuals reported that they had lived in the city where they were interviewed their whole lives and many others had moved to the community at a young age. This level of stability is greater among the unsheltered than sheltered homeless population, with 55% of the unsheltered homeless reporting that they had lived in the municipality where interviewed 10 years or more compared to 48% of the sheltered homeless.50
Very few individuals (2%) reported having just moved to the municipality where they were interviewed less than a week before the Homeless Count.
Table 26: Length of Time in Municipality Interviewed – Sheltered and Unsheltered Homeless, 2014
Length of time in city interviewed
Sheltered Homeless
Unsheltered Homeless
Total Homeless
# % # % # % Less than 1 week 21 2% 11 1% 32 2% 1 week to less than 1 year 202 23% 139 16% 341 19% 1 year to under 5 years 139 16% 157 18% 296 17% 5 years to under 10 years 94 11% 95 11% 189 11% 10 years or more 424 48% 487 55% 911 51% Total Respondents 880 100% 889 100% 1,769 100% No Answer 940 68 1,008 Total 1,820 957 2,777
49 In 2011, data was not provided on the number of people who had been homeless for less than 1 week. 50 One of the reasons may be that people who wanted to stay in a shelter needed to move to another community to access a bed.

30
Trends
The degree of stability among the homeless population in 2014 is consistent with previous counts that also showed the majority of the respondents had lived in the municipality where they were interviewed for at least 5 years.
Table 27: Length of Time in Municipality Interviewed – Total Homeless (2008 – 2014) - Trends
Length of time homeless Total homeless 2008
Total homeless 2011
Total homeless 2014
# % # % # % Less than 1 year 416 20% 379 25% 373 21% 1 year to under 5 years 409 19% 296 19% 296 17% 5 years to under 10 years 312 15% 198 13% 189 11% 10 years or more 972 46% 645 42% 911 51% Total Respondents 2,109 100% 1,518 100% 1,769 100% No Answer 551 1,132 1,008 Total 2,660 2,650 2,777
4.13 Episodically Homeless In 2014 a new question was piloted to determine the number of people in the Metro Vancouver region who are episodically homeless – or who experience more than one episode of homelessness within a year. About two-fifths of respondents (669 individuals) reported that they had been homeless more than once. These results should, however, be treated with great caution because volunteers reported that this question was very confusing and the data may not be accurate.51 In addition, the response rate was particularly low for the respondents in shelters.
Table 28: Episodically Homeless – Sheltered and Unsheltered Homeless, 2014
Number of times homeless in past 12 months
Sheltered Homeless
Unsheltered Homeless
Total Homeless
# % # % # % More than once 342 42% 327 44% 669 43% First time homeless 473 58% 415 56% 888 57% Total Respondents 815 100% 742 100% 1,557 100% No Answer 1,005 215 1,220 Total 1,820 957 2,777
51There seemed to be some confusion with the possible response “first time homeless” and how to answer the question if a person had been homeless for a year or more. Many respondents reported on the length of time they had been homeless rather than on the number of times.

31
5. Patterns of Service Use
5.1 Services Used by the Sheltered and Unsheltered Homeless Homeless Count participants were asked what services they have used in the past 12 months. Table 29 shows that meal programs (46%), hospital emergency rooms (42%), and drop-in centres (40%) were the top three services used by homeless individuals.
The unsheltered homeless were more likely to use meal programs, drop-in centres, outreach services, food banks, ambulance, and parole services than the sheltered homeless, while the sheltered homeless were more likely to use health clinics, employment, dental, mental health, and transitional housing than the unsheltered homeless.
Table 29: Services Used – Sheltered and Unsheltered Homeless, 2014
Services used (more than 1 possible)
Sheltered Homeless
Unsheltered Homeless
Total Homeless
# % # % # % Meal Programs/Soup Kitchens 385 43% 440 50% 825 46% Emergency Room 381 42% 365 42% 746 42% Drop-Ins 301 33% 414 47% 715 40% Health Clinic 382 42% 302 34% 684 38% Outreach 263 29% 346 39% 609 34% Hospital (non-emergency) 300 33% 273 31% 573 32% Food Banks 218 24% 317 36% 535 30% Ambulance 258 29% 272 31% 530 30% Addiction 218 24% 207 24% 425 24% Employment/Job Help 242 27% 172 20% 414 23% Dental 194 22% 141 16% 335 19% Mental Health 193 21% 142 16% 335 19% Legal 113 13% 124 14% 237 13% Housing Help/Eviction Prevention 113 13% 113 13% 226 13% Transitional Housing 121 13% 56 6% 177 10% Parole/Services for Ex-Offenders 46 5% 78 9% 124 7% Budgeting/Trusteeship 22 2% 23 3% 45 3% Newcomer Services 11 1% 18 2% 29 2% Other 121 13% 90 10% 211 12% None 57 6% 55 6% 112 6% Total Respondents 900 878 1,778 No Answer 920 79 999 Total 1,820 957 2,777

32
Trends
Table 30 shows that Homeless Count respondents used similar services in 2014 compared to 2011. Whereas in 2014, the top three services respondents said they used were meal programs, hospital emergency rooms, and drop-in centres, in 2011, the top three services respondents said they used were meal programs, health clinics, and drop-in centres.
While 49% of respondents reported using health clinics in 2011, only 38% of respondents reported using this service in 2014. As well, a smaller proportion of respondents reported accessing dental services in 2014 compared to 2011. The proportion of respondents who used hospital emergency rooms remained the same for both years (42%).
Table 30: Services Used – Total Homeless (2011 to 2014) - Trends
Services Used (more than 1 possible)
2011 Total Homeless
2014 Total Homeless
# % # % Meal Programs/Soup Kitchens 783 53% 825 46% Emergency Room 617 42% 746 42% Drop-Ins 706 48% 715 40% Health Clinic 722 49% 684 38% Outreach 537 36% 609 34% Hospital (non-emergency) 518 35% 573 32% Food Banks 612 41% 535 30% Ambulance 400 27% 530 30% Addiction 388 26% 425 24% Employment/Job Help 464 31% 414 23% Dental 387 26% 335 19% Mental Health 325 22% 335 19% Legal 261 18% 237 13% Housing Help/Eviction Prevention 244 16% 226 13% Transitional Housing 201 14% 177 10% Parole/Services for Ex-Offenders 144 10% 124 7% Budgeting/Trusteeship 45 3% 45 3% Newcomer Services 39 3% 29 2% Other 127 9% 211 12% None 63 4% 112 6% Total Respondents 1,484 1,778 No Answer 1,166 999 Total 2,650 2,777

33
5.2 Services Used by the Sheltered Homeless The sheltered homeless were asked how many nights in a row they had stayed at the shelter where they were surveyed. A similar question was asked in 2011.52 Table 31 shows that the majority of respondents spent less than one month at the shelter. A higher proportion of respondents reported staying in a shelter for one month or less in 2014 (68%) compared to 2011 (55%).
Table 31: Number of Days in Shelter – Sheltered Homeless (2011 to 2014)
Number of days in the shelter
2011 2014 # % # %
1 to 30 days 437 55% 590 68% 31 to 90 days 174 22% 157 18% 91 to 180 days 99 13% 70 8% 181 to 365 days 71 9% 20 2% More than 365 days 10 1% 25 3% Total Respondents 791 100% 862 100% No Answer53 1,101 958 Total 1,892 1,820
5.3 Services Used by the Unsheltered Homeless Where the Unsheltered Homeless Stayed
As part of the unsheltered survey, respondents were asked where they had stayed the previous night. Table 32 shows that among the unsheltered homeless population, more than half (56%) had spent the previous night outside or in a vehicle, while 40% stayed at someone else’s place.54 Other locations included 24-hour restaurants, abandoned buildings, or at a location in an exploitive situation (i.e. with a pimp or client).
Table 32 does not provide data for previous years because of differences in how the question was asked and how responses were categorized. However, the data indicates that the proportion of homeless people who were couch surfing in 2014 (40%) was lower compared to 2011 when nearly half of respondents reported staying at someone else’s place, and higher compared to 2008 and 2005 when about one quarter of unsheltered respondents reported staying at someone else’s place.
52 In 2011, the question was: How many nights, including tonight, have you stayed at this shelter in the past 12 months. 53 Facilities for people with no fixed address (hospitals, detox facilities and jails) were not asked to provide information on length of stay and individuals in these facilities are included in the “No Answer”. In 2014, there were 200 individuals in these facilities during the count. 54 This includes data on nine children accompanied by a parent who were unsheltered during the count.

34
Table 32: Where the Unsheltered Homeless Stayed, 2014
Location 2014 Unsheltered Homeless
# % Outside or in a vehicle55 536 56% Someone else's place 381 40% Other 40 4% Total Respondents 957 100% No Answer 0 Total 957
Reason Unsheltered Did Not Stay in Shelter
The unsheltered survey included a question to ask the main reason respondents did not stay in a shelter the previous night. The most frequent reason was that the individual was able to stay with a friend (27%). The second main reason respondents gave for not staying in a shelter was that they dislike them (21%). Many reasons were given for disliking a shelter, including being uncomfortable with the other people, the rules, theft/violence, and finding them dirty/smelly.
Other reasons for not staying in a shelter included not wanting to separate from their spouse/partner or pet, and having an addiction.
Table 33: Reasons for Not Staying in a Shelter (2008 to 2014)
Reason (select only one) 2008 2011 2014 # % # % # %
Able to stay with friend 215 15% 274 39% 206 27% Dislike 450 32% 169 24% 159 21% Turned away - full56 225 16% 28 4% 97 13% Don't feel safe N/A N/A N/A N/A 59 8% Turned away - other reason 36 3% 15 2% 29 4% Bedbugs/pests N/A N/A N/A N/A 23 3% Can't get to shelter 99 7% 13 2% 13 2% Didn't know about shelters 48 3% 11 2% 10 1% Other 322 23% 192 27% 167 22% Total Respondents 1,395 100% 702 100% 763 100% No Answer 179 56 194 Total 1,574 758 957
55 This included staying on the street, in a park, skytrain, garage or shed. 56 The number of people who reported being turned away in Table 32 is not the same as in Table 2. Table 2 reports on the number of times a person was turned away rather than the number of individuals, and an individual may have been turned away more than once. In addition, an individual may have been turned from a shelter but not stated this as the main reason they did not stay in a shelter and so this is not recorded In Table 33.

35
It is difficult to compare the responses provided in 2014 with previous years because the list of possible responses on the survey has changed over time. Nevertheless, a few observations can be made with caution. It appears that the proportion of respondents who reported disliking shelters decreased from 32% in 2008 to 24% in 2011 and 21% in 2014. The proportion of respondents who reported not being able to get to a shelter and not knowing about shelters has also decreased since 2008.
In 2014, 13% of respondents said they did not stay in a shelter because they were turned away. This was much higher compared to 2011 (4%) although less than in 2008 (16%).
Previous Use of Shelters
In 2014 and 2008, the unsheltered survey included a question to ask respondents if they had stayed in a shelter in the last 12 months. This is an important question to determine if the unsheltered homeless ever use a shelter. In 2014, just over half the unsheltered homeless (54%), reported having stayed in a shelter at some point in the last 12 months.57 This indicates that gathering information on the homeless population using only shelter data would miss a significant proportion of the homeless population who do not use shelters.
The proportion of the unsheltered homeless population who reported staying in a shelter in the previous year in 2014 was virtually the same as in 2008 when 53% of respondents reported having stayed in a shelter at some point in the preceding year.
Table 34: Previous Stay in a Shelter (2008, 2014)
Did Person Stay in a Shelter in Past
Year
2008 Unsheltered Homeless
2014 Unsheltered Homeless
# % # % Yes 790 53% 485 54% No 689 47% 420 46% Total Respondents 1,479 100% 905 100% No Answer 95 52 Total 1,574 957
57 About half the respondents who stayed at someone else’s place (49%) said they had stayed in a shelter in the previous year. It may be interesting to do further analysis to compare the homeless population who stayed at someone else’s place with the rest of the unsheltered and sheltered homeless population.

36
6. Homelessness among Sub-Populations This section includes profiles for five priority sub-populations, including women, Aboriginal Peoples, unaccompanied youth under the age of 25, seniors (55+) and the long-term homeless. The information is from respondents who participated in the Homeless Count survey and is shown in Table 35.58 Note that these sub-populations are not mutually exclusive – someone could be a member of two or more groups, such as an Aboriginal person who is a senior.
6.1 Women In 2014, 527 of respondents to the Homeless Count survey were women. More than two-thirds of the women (64%) were adults aged 25 to 54, 23% were youth, and 13% were seniors. The proportion of women respondents who were seniors was higher in 2014 compared to 2008 when 6% of the homeless women were seniors. A significant proportion of the women respondents (41%) identified as an Aboriginal person.
Homeless women were less likely to be alone compared to the total homeless population: 67% of respondents reported being alone compared to 79% of the total homeless population. Twelve percent were with friends, 10% were with a partner/spouse and 7% were with their children.
A smaller proportion of women (36%) were long-term homeless (1 year or more) compared to the total homeless population where 41% of respondents reported being homeless for a year or more.
Similar to the total homeless population, the main sources of income reported by women respondents were income assistance and disability benefits. Forty-five percent of women respondents reported receiving income assistance compared to 43% of the total homeless population and 24% reported receiving disability benefits compared to 21% of the total homeless population. Women were more likely to report income from friends/family (12%) compared to the total homeless population (7%), and less likely to report income from part-time employment (11%) compared to the total homeless population (16%). They were also less likely to report income from binning/bottle collecting (9%) compared to the total homeless population (14%).
The percentage of women reporting health issues was similar to the total homeless population.
Women were more likely to be couch surfing than the total homeless population: 57% of the unsheltered women reported staying at someone else’s place the night of March 11, 2014 compared to 40% of the total homeless population. Women were the least likely sub-population to have slept outside as 37% reported staying outside compared to the total homeless population (56%).
6.2 Persons with Aboriginal Identity A total of 582 homeless respondents identified as an Aboriginal person in the 2014 count. The Aboriginal homeless population had a higher proportion of women (36%) compared to the total homeless population (27%). Similar to 2008, the Aboriginal homeless population had a smaller proportion of seniors (9%) compared to the total homeless population (19%). However, the proportion
58 Total numbers in Table 35 may differ from the numbers provided in other sections of this report. This happens because the information provided in this table is a cross-tabulation and includes only the number of people who are part of the sub-population and who answered the particular question being analyzed. For instance, there were 582 Aboriginal people identified in the count, but the total number of respondents to questions analyzed in this section is less than this (e.g. 576 people who identified as an Aboriginal person reported their age.)

37
of Aboriginal people who were seniors (9%) was higher compared to 2008 when 4% of respondents who identified as an Aboriginal person were seniors. Most of the people who identified as an Aboriginal person were adults aged 25 to 54 (69%). Twenty-two percent of respondents who identified as an Aboriginal person in 2014 were youth, compared to 15% in 2008.
Nearly three quarters of respondents who identified as an Aboriginal person (71%) said they were alone, compared to 79% of the total homeless population. Fifteen percent were with friends, compared to 10% of the total homeless population. Similar to the total homeless population, 7% were with a partner/spouse and 3% were with their children. Another 3% were with a relative – slightly higher than the total homeless population (1%).
Forty-two percent of respondents who identified as an Aboriginal person were long-term homeless (1 year or more), which was similar to the total homeless population (41%).
Similar to the total homeless population, the main sources of income reported by respondents who identified as an Aboriginal person were income assistance (48%), disability benefits (23%), part-time employment (17%), and binning/bottle collecting (16%).
The percentage of Aboriginal respondents reporting health issues was similar to the total homeless population, except that 58% of respondents reported an addiction compared to 49% of the total homeless population.
More than half the Aboriginal respondents who were unsheltered (55%) reported sleeping outside the night of March 11, 2014 while 41% reported staying at someone else’s place. This is similar to the total homeless population as 56% of respondents reported staying outside and 40% reported staying at someone else’s place.
6.3 Unaccompanied Youth (under the age of 25) The 2014 Homeless Count included 322 unaccompanied youth and 88 children under 19 who were with a parent. This section reports only on the unaccompanied youth respondents.
A higher proportion of youth respondents were women (38%) compared to the total homeless population (27%). As well, a significant proportion of homeless youth (40%) identified as Aboriginal, compared to 31% of the total homeless population.
Youth were less likely to be alone compared to the total homeless population as 68% of respondents reported being alone compared to 79% of the total homeless population. Youth were most likely to be with friends, compared to the other sub-populations: 17% reported being with friends compared to 10% of the total homeless population.
Youth were the least likely sub-population to be long-term homeless (1 year or more) compared to the total homeless population as 23% reported being homeless for one year or more compared to 41% of the total homeless population. A higher proportion of youth reported being homeless for less than a month (25%) compared to the total homeless population (19%).
The main source of income reported by youth respondents was income assistance; however, only 28% of youth reported receiving income assistance compared to 43% of the total homeless population. A higher proportion of youth reported receiving income from panhandling (22%) and friends/family (19%) compared to other sub-populations and the total homeless population where 11% reported income

38
from panhandling and 7% from friends/family. A significant proportion of youth, 21%, reported receiving no income. This was much higher compared to the other sub-populations and the total homeless population where 9% reported receiving no income.
The proportion of youth reporting mental illness (32%) and addiction (47%) was similar to the total homeless population (34% and 49% respectively). Fewer homeless youth reported having a medical condition or physical disability. For instance, 17% of youth reported having a medical condition compared to 41% of the total homeless population and 9% reported having a physical disability compared to 29% of the total homeless population.
More than half (56%) of the unsheltered youth respondents reported staying at someone else’s place the night of March 11, 2014, which is higher than the total homeless population (40%). Forty percent of youth respondents reported staying outside compared to 56% of the total homeless population.
6.4 Seniors (55 and older) A total of 371 seniors (55 and older) were identified in the Homeless Count. More homeless seniors were men (81%) compared to 73% for the total homeless population. As well, most were alone (88%) and less likely to report Aboriginal identity (16%) compared to the other sub-populations.
Seniors were more likely to have been homeless more than one year (53%) compared to other sub-populations. At the same time, 14% were newly homeless, and had been homeless less than one month.
The main sources of income reported by senior respondents were income assistance (32%), CPP or other pension (25%), and disability benefits (25%). Other sources of income included binning/bottle collecting (16%) and OAS/GIS (12%).
More than half of all senior respondents (59%) reported having a medical condition, and seniors were more likely to report a medical condition than the total homeless population (41%). A higher proportion of senior respondents also reported a physical disability than the total homeless population (44% of seniors compared to 29% of the total homeless population). Seniors were less likely to report an addiction compared to the other sub-populations: 36% of senior respondents reported an addiction compared to 49% of the total homeless population. About one third of seniors (30%) reported a mental illness – similar to the total homeless population (34%).
The unsheltered senior respondents were more likely than the other sub-populations – except the long-term homeless – to have slept outside the night of March 11, 2014. Sixty-one percent of unsheltered senior respondents reported sleeping outside compared to 56% of the total homeless population.
6.5 The Long-Term Homeless The long-term homeless are individuals who have been homeless for one year or longer. A total of 751 long-term homeless were identified in the 2014 Homeless Count, representing 41% of the total homeless population.
One quarter of the long-term homeless respondents were women (24%). Most of this sub-population (67%) were adults aged 25 to 54, however 9% were youth and 24% were seniors. Eighty-two percent of the long-term homeless reported being alone compared to 79% of the total homeless population, while 10% reported being with friends.

39
About one-third of the long-term homeless (32%) identified as an Aboriginal person, which is similar to the total homeless population (31%).
Similar to the total homeless population, the main sources of income reported by the long-term homeless were income assistance (44%) and disability benefits (23%).
The long-term homeless were more likely to have a medical condition compared to the total homeless population. For example, 35% of the long-term homeless reported a physical disability compared to 29% for the total homeless population. There was a smaller difference between the long-term and total homeless populations for other medical conditions, such as an addiction, medical condition, and mental illness, however, a slightly higher proportion of the long-term homeless reported these issues compared to the total homeless population.
The unsheltered long-term homeless were more likely than all other sub-populations to have slept outside the night of March 11, 2014. Sixty-seven percent of the unsheltered long-term homeless respondents reported sleeping outside compared to 56% of the total homeless population.

40
Table 35: Sub-Population Profiles, 2014
Women Aboriginal Identity Youth (Under 25 years) Seniors (55+) Long-Term Homeless (1+ years) Total Homeless
Sheltered
Unsheltered Total % Shelte
red Unsheltered Total % Shelte
red Unsheltered Total % Shelte
red Unsheltered Total % Shelte
red Unsheltered Total % Shelte
red Unsheltered Total %
Gender Men 137 231 368 64% 74 123 197 62% 179 119 298 81% 253 313 566 76% 733 686 1419 73% Women 279 248 527 100% 94 113 207 36% 37 84 121 38% 42 27 69 19% 81 95 176 24% 279 248 527 27% Transgender N/A N/A N/A N/A N/A N/A N/A N/A N/A N/A N/A N/A N/A N/A N/A N/A 6 3 9 <1% Total Respondents 231 344 575 100% 111 207 318 100% 221 146 367 100% 334 408 742 100% 1,018 937 1,955 100%
Age Groups Youth (up to 24) 37 84 121 23% 34 90 124 22% 113 209 322 100% 14 55 69 9% 113 209 322 17% Adults (25 to 54) 197 135 332 64% 172 226 398 69% 221 277 498 67% 677 580 1,257 64% Seniors (55+) 42 27 69 13% 24 30 54 9% 221 150 371 100% 95 82 177 24% 221 150 371 19% Total Respondents 276 246 522 100% 230 346 576 100% 330 414 744 100% 1,011 939 1,950 100%
Accompanied By Alone 183 146 329 67% 185 218 403 71% 87 121 208 68% 183 120 303 88% 303 304 607 82% 796 655 1,451 79% With partner/spouse 19 28 47 10% 10 31 41 7% 6 24 30 10% 2 5 7 2% 10 28 38 5% 34 71 105 6%
With children 33 3 36 7% 14 1 15 3% 3 0 3 1% 3 1 4 1% 1 1 2 0% 34 7 41 2% With friends 8 49 57 12% 8 74 82 15% 3 49 52 17% 8 14 22 6% 13 65 78 10% 30 152 182 10% With relative 4 8 12 2% 6 10 16 3% 0 7 7 2% 0 0 0 0% 1 3 4 1% 8 16 24 1% With pet 2 8 10 2% 3 7 10 2% 2 10 12 4% 1 4 5 1% 3 8 11 1% 7 24 31 2% With other 4 9 13 3% 8 6 14 2% 2 3 5 2% 0 2 2 1% 6 6 12 2% 13 18 31 2% Total Respondents 250 244 494 228 337 565 100 205 305 197 146 343 335 409 744 915 924 1,839
Aboriginal Identity
Aboriginal 94 113 207 41% 235 347 582 100% 34 90 124 40% 24 30 54 16% 86 151 237 32% 235 347 582 31% Not Aboriginal 169 123 292 59% 71 115 186 60% 180 110 290 84% 248 249 497 68% 724 558 1,282 69% Total Respondents 263 236 499 100% 105 205 310 100% 204 140 344 100% 334 400 734 100% 959 905 1,864 100%
Length of Time Homeless
Short term (<1 mo) 66 37 103 21% 54 48 102 18% 30 46 76 25% 31 16 47 14% 201 136 337 19%
Medium term (1 mo to < 1yr) 101 111 212 43% 86 140 226 40% 51 106 157 52% 68 45 113 34% 363 366 729 40%
Long term (1 yr +) 81 95 176 36% 86 151 237 42% 14 55 69 23% 95 82 177 53% 336 415 751 100% 336 415 751 41% Total Respondents 248 243 491 100% 226 339 565 100% 95 207 302 100% 194 143 337 100% 900 917 1,817 100%
Sources of Income
Income assistance 115 105 220 45% 102 169 271 48% 23 64 87 28% 62 47 109 32% 142 183 325 44% 364 413 777 43% Disability benefit 70 47 117 24% 59 71 130 23% 9 9 18 6% 49 34 83 25% 97 72 169 23% 216 160 376 21% OAS/GIS 8 2 10 2% 3 2 5 1% 0 0 0 0% 29 10 39 12% 19 6 25 3% 31 11 42 2% CPP or other pension 25 4 29 6% 7 5 12 2% 0 0 0 0% 66 23 89 26% 42 19 61 8% 86 29 115 6%
Employment insurance 4 1 5 1% 1 2 3 1% 1 0 1 0% 4 1 5 1% 3 5 8 1% 19 8 27 1%
Youth agreement 1 4 5 1% 0 5 5 1% 1 5 6 2% 0 0 0 0% 0 0 0 0% 1 6 7 0%

41
Women Aboriginal Identity Youth (Under 25 years) Seniors (55+) Long-Term Homeless (1+ years) Total Homeless Employment - part time 22 30 52 11% 45 49 94 17% 20 33 53 17% 22 13 35 10% 43 54 97 13% 156 131 287 16%
Employment - full-time 12 1 13 3% 17 5 22 4% 18 0 18 6% 5 1 6 2% 17 5 22 3% 68 14 82 4%
Binning, bottle collecting 8 36 44 9% 17 75 92 16% 3 24 27 9% 14 40 54 16% 27 113 140 19% 53 199 252 14%
Panhandling 7 46 53 11% 10 65 75 13% 2 67 69 22% 4 13 17 5% 18 86 104 14% 30 173 203 11% Friends/family 19 41 60 12% 16 40 56 10% 18 40 58 19% 4 6 10 3% 13 26 39 5% 49 80 129 7% Other 27 46 73 15% 19 52 71 13% 10 28 38 12% 11 15 26 8% 24 78 102 14% 69 135 204 11% No income 19 26 45 9% 18 26 44 8% 22 44 66 21% 10 10 20 6% 22 32 54 7% 80 91 171 9% Total Respondents 251 233 484 228 338 566 99 208 307 195 141 336 332 405 737 910 913 1,823
Health Condition Addiction 99 125 224 47% 115 203 318 58% 37 100 137 47% 68 49 117 36% 154 222 376 52% 390 481 871 49% Medical condition 116 89 205 43% 101 125 226 41% 14 36 50 17% 121 71 192 59% 168 158 326 45% 395 328 723 41% Mental illness 91 85 176 37% 61 117 178 32% 32 60 92 32% 52 48 100 30% 117 153 270 37% 296 314 610 34% Physical disability 72 56 128 27% 63 86 149 27% 8 17 25 9% 89 55 144 44% 133 122 255 35% 272 235 507 29% Total Respondents 248 226 474 224 326 550 95 196 291 196 132 328 325 399 724 894 881 1,775
Where Stayed Last Night
Outside 92 37% 192 55% 84 40% 91 61% 276 67% 536 56% Someone else's place 142 57% 143 41% 117 56% 54 36% 119 29% 381 40%
Other 14 6% 12 3% 8 4% 5 3% 20 5% 40 4% Total Respondents 248 100% 347 100% 209 100% 150 100% 415 100% 957 100%
Notes: • Youth includes only unaccompanied youth (i.e. does not include 88 children accompanied by a parent, so numbers do not add up to 410). • Transgendered data is not included (except for the total homeless) to protect the privacy of the individuals. • For the Categories: Accompanied By, Sources of Income, and Medical Condition, respondents could select more than one response. Therefore, numbers do not equal total respondents, and
percentages do not add up to 100%. • The total number of respondents is different for different questions because not everyone responded to each question and the data was provided through cross-tabulations.

42
7. Homelessness by Municipal Sub-Region This section presents the Homeless Count results by municipal sub-regions within the Metro Vancouver region.59
7.1 Total Homeless Found by Municipal Sub-Region A total of 2,777 homeless people were counted in the Metro Vancouver region on the night of March 11 and the day of March 12, 2014. Table 36 shows the distribution of this population according to the municipal sub-region where they were found. As can be seen, 80% of the homeless people were found in Vancouver and Surrey, with Vancouver having the largest concentration (65%), followed by Surrey (15%). The rest of the homeless people were found across the other municipal sub-regions.
Table 36: Total Homeless by Municipal Sub-Region Found, 2014
Sub-Region Sheltered Homeless Unsheltered Homeless Total Homeless Adults and
Unaccompanied youth
Accompanied children
No Fixed Address
Adults and Unaccompanied
youth Accompanied
children #
Homeless %
Homeless
Burnaby 9 4 1 44 0 58 2% Delta 10 0 0 5 0 15 1% Langley 34 1 3 54 0 92 3% Ridge Meadows 43 0 2 39 0 84 3% New Westminster 58 12 2 31 3 106 4% North Shore 51 3 5 59 1 119 4% Richmond 11 0 5 22 0 38 1% Surrey 195 15 53 140 0 403 15% Tri-Cities 27 4 1 21 2 55 2% Vancouver 1,103 40 124 533 3 1,803 65% White Rock 0 0 4 0 0 4 0% Total 1,541 79 20060 948 9 2,777 100%
Trends
The number of homeless people identified in Homeless Counts in the region has remained fairly stable since 2008 – increasing by 4% between 2008 and 2014. This is less than the rate of increase for the population of the Metro Vancouver region as a whole, which increased by 9% from 2008 to 2014.61 It is not known whether this is due to greater success in helping people to exit homelessness or if fewer individuals are becoming homeless.
As well, the number of people who were found homeless in each municipal sub-region has not changed significantly since 2008. However, a notable 222 more homeless people were identified in Vancouver in 2014 compared to 2011 – further research is needed to determine why.
59 Some data from the 2011 is inconsistent with previous trends and may be less reliable than 2008 data for the purpose of identifying trends and making comparisons. 60 Among the individuals with no fixed address, 100 were in a detox facility, 93 were in a hospital, and 7 were in jail. 61 Metro Vancouver Regional Planning Division. 2014. Metro Vancouver’s population was 2,259,000 in 2008 and is estimated to be 2,468,000 in 2014.

43
Table 37: Total Homeless by Municipal Sub-Region Found (2002 to 2014) - Trends
Sub-Region 2002 Total Homeless
2005 Total Homeless
2008 Total Homeless
2011 Total Homeless
2014 Total Homeless
Change 2011 to 2014
# # # # # # % Burnaby 18 42 86 78 58 -20 -26% Delta/White Rock 11 12 17 14 19 5 36% Langley 18 57 86 103 92 -11 -11% Ridge Meadows 66 44 90 110 84 -26 -24% New Westminster 74 97 124 132 106 -26 -20% North Shore 47 90 127 122 119 -3 -2% Richmond 31 35 56 49 38 -11 -22% Surrey 171 392 402 400 403 3 1% Tri-Cities 14 40 94 48 55 7 15% Vancouver 670 1,364 1,576 1,581 1,803 222 14% Unspecified 1 1 2 13 0 -13 -100% Total 1,121 2,174 2,660 2,650 2,777 127 5% Note: This table includes children who were accompanied by a parent.
7.2 Sheltered and Unsheltered Homeless Population As shown in Table 38, the distribution of the sheltered and unsheltered homeless shows that Vancouver was home to 70% of the total sheltered homeless population, where most of the shelter facilities are located. Although the actual percentages have not been calculated, Table 38 also shows that a higher proportion of the homeless population in Vancouver was sheltered rather than unsheltered, as was the case in Surrey, New Westminster, Ridge Meadows, and the Tri-Cities. On the other hand, in Burnaby, Langley, the North Shore and Richmond, a higher proportion of the homeless people found in these communities were unsheltered rather than sheltered. Appendix G provides additional tables on the sheltered and unsheltered homeless population found in municipal sub-regions since 2008.
Table 38: Sheltered and Unsheltered Homeless by Municipal Sub-Region Found, 2014
Homeless population by municipal sub-region found
Sheltered Homeless Unsheltered Homeless Total Homeless
# % # % # %
Burnaby 14 1% 44 5% 58 2% Delta 10 1% 5 1% 15 1% Langley 38 2% 54 6% 92 3% Ridge Meadows 45 2% 39 4% 84 3% New Westminster 72 4% 34 4% 106 4% North Shore 59 3% 60 6% 119 4% Richmond 16 1% 22 2% 38 1% Surrey 263 14% 140 15% 403 15% Tri-Cities 32 2% 23 2% 55 2% Vancouver 1,267 70% 536 56% 1,803 65% White Rock 4 0% 0 0% 4 0% Total 1,820 100% 957 100% 2,777 100%
Note: This table includes children who were accompanied by a parent.

44
7.3 Mobility of the Homeless Population Length of Time in Municipality Found
One of the key questions of interest to municipalities is the extent that people who are homeless move around within the region and move from other parts of BC and the country to communities within the Metro Vancouver region.
Table 39 shows that 79% of respondents who reported on the length of time they had lived in the city where they were interviewed had lived there for one year or more, including half (51%) who reported living there 10 years or more. More than 200 individuals reported that they had lived in the city their whole lives. This level of stability is fairly consistent across all the municipal sub-regions although less than half the respondents in Delta/White Rock, Langley, New Westminster, Richmond and the Tri-Cities reported having lived in the city where they were found 10 years or more.
Very few respondents (2%) reported having moved to the city where they were interviewed less than a week before the Homeless Count. Langley showed the highest percentage of homeless people who had just moved to the city where they were interviewed prior to the Homeless Count.
Table 39: Total Homeless by Length of Time in Municipal Sub-Region Found, 2014
Length of time in municipal sub-region found
Less than 1 Week
1 Week to under 1 Year
1 Year to under 5 Years
5 Years to under 10
Years
10 Years or More
Total
# % # % # % # % # % # % Burnaby 1 2% 7 15% 10 22% 3 7% 25 54% 46 100% Delta/White Rock 0 0% 5 42% 0 0% 3 25% 4 33% 12 100% Langley 9 12% 23 31% 15 20% 7 9% 21 28% 75 100% Ridge Meadows 0 0% 11 16% 9 13% 6 9% 42 62% 68 100% New Westminster 2 3% 23 39% 9 15% 7 12% 18 31% 59 100% North Shore 2 2% 8 10% 14 17% 4 5% 53 65% 81 100% Richmond 0 0% 4 14% 8 29% 4 14% 12 43% 28 100% Surrey 2 1% 45 17% 41 15% 40 15% 144 53% 272 100% Tri-Cities 0 0% 11 26% 6 14% 5 12% 20 48% 42 100% Vancouver 16 1% 204 19% 184 17% 110 10% 572 53% 1,086 100% Total Respondents 32 2% 341 19% 296 17% 189 11% 911 51% 1,769 100%
Where From
Another key question of interest to municipalities is where people who were homeless came from if they were new to the municipality where they were interviewed (i.e. had lived there for less than one year). Table 40 shows that in most municipal sub-regions: Burnaby, Delta/White Rock, Langley, Ridge Meadows, Richmond and Surrey, at least 50% of respondents who reported moving there within the year were from another community within the Metro Vancouver region.
Most of the homeless people who moved to the Tri-Cities within the year were from another part of BC outside the Metro Vancouver region. In Vancouver and the North Shore, most of the homeless people who moved there were from another part of Canada. In Vancouver, 117 of the respondents who reported having lived in the City for less than one year (56%) were from another part of Canada.

45
Table 40: Total Homeless by Where From if New to Community Found < 1 year, 2014
Where from if new to community found < 1 year
Within Metro Vancouver Region
Rest of BC Rest of Canada Outside Canada
Total Responses
# % # % # % # % # % Burnaby 4 57% 1 14% 2 29% 0 0% 7 100% Delta/White Rock 5 100% 0 0% 0 0% 0 0% 5 100% Langley 18 56% 9 28% 5 16% 0 0% 32 100% Ridge Meadows 6 60% 3 30% 1 10% 0 0% 10 100% New Westminster 13 65% 1 5% 6 30% 0 0% 20 100% North Shore 2 20% 3 30% 5 50% 0 0% 10 100% Richmond 2 50% 0 0% 1 25% 1 25% 4 100% Surrey 21 50% 13 31% 8 19% 0 0% 42 100% Tri-Cities 4 36% 6 55% 1 9% 0 0% 11 100% Vancouver 30 14% 55 26% 117 56% 6 3% 208 100% Total Respondents62 105 30% 91 26% 146 42% 7 2% 349 100%
7.4 Age and Municipal Sub-Region Youth and Children
A total of 410 homeless children and youth (under the age of 25) were identified in the 2014 Homeless Count.63 Most of these children and youth were found in Vancouver (62%) followed by Surrey (13%). Region-wide, a higher proportion of youth were unsheltered rather than sheltered, but most of the children who were accompanied by a parent were sheltered.
Table 41: Sheltered and Unsheltered Homeless Youth and Children by Municipal Sub-Region, 2014
Sub-Region
Sheltered Homeless Unsheltered Homeless Total Homeless # % # % # %
Burnaby 4 2% 5 2% 9 2% Delta/White Rock 0 0% 0 0% 0 0% Langley 2 1% 18 8% 20 5% Ridge Meadows 7 4% 8 4% 15 4% New Westminster 16 8% 8 4% 24 6% North Shore 14 7% 10 5% 24 6% Richmond 2 1% 0 0% 2 0% Surrey 25 13% 27 12% 52 13% Tri-Cities 6 3% 3 1% 9 2% Vancouver 116 60% 139 64% 255 62% Total 192 100% 218 100% 410 100% Note: This table includes children accompanied by a parent.
62 The total number of respondents in Table 40 (349) is not the same as the total number of respondents who reported being homeless less than one year in Table 39 (373) because not all respondents would have answered the question about how long they had been in the city where they were found. 63 This includes 88 children under the age of 19 who were accompanied by a parent who was homeless (sheltered and unsheltered).

46
Seniors
A total of 371 homeless seniors (55 and older) were identified in the 2014 Homeless Count. Most of these seniors were found in Vancouver (55%) and Surrey (17%). In contrast to the findings for homeless youth, region-wide, a higher proportion of seniors were sheltered rather than unsheltered. However, this was not the case in Burnaby, Langley, New Westminster, the North Shore, and Richmond, where most of the homeless seniors were unsheltered.
Table 42: Sheltered and Unsheltered Homeless Seniors by Municipal Sub-Region, 2014
Sub-Region
Sheltered Homeless Unsheltered Homeless Total Homeless # % # % # %
Burnaby 2 1% 8 5% 10 3% Delta/White Rock 4 2% 1 1% 5 1% Langley 6 3% 8 5% 14 4% Ridge Meadows 9 4% 6 4% 15 4% New Westminster 5 2% 6 4% 11 3% North Shore 8 4% 23 15% 31 8% Richmond 4 2% 7 5% 11 3% Surrey 45 20% 19 13% 64 17% Tri-Cities 3 1% 2 1% 5 1% Vancouver 135 61% 70 47% 205 55% Total 221 100% 150 100% 371 100%
7.5 Aboriginal Identity and Municipal Sub-Region A total of 582 homeless people identified as an Aboriginal person in the 2014 Homeless Count. Most of them were in Vancouver (71%) and Surrey (12%). A higher proportion of Aboriginal Peoples who responded to the survey were unsheltered rather than sheltered, and this was the case throughout the region.
Table 43: Sheltered and Unsheltered Homeless Aboriginal Peoples by Municipal Sub-Region, 2014
Sub-Region
Sheltered Homeless Unsheltered Homeless Total Homeless
# % # % # % Burnaby 2 1% 11 3% 13 2% Delta/White Rock 0 0% 0 0% 0 0% Langley 2 1% 13 4% 15 3% Ridge Meadows 7 3% 14 4% 21 4% New Westminster 7 3% 9 3% 16 3% North Shore 10 4% 13 4% 23 4% Richmond 0 0% 6 2% 6 1% Surrey 27 11% 40 12% 67 12% Tri-Cities 2 1% 4 1% 6 1% Vancouver 178 76% 237 68% 415 71% Total 235 100% 347 100% 582 100%

47
8. Conclusions and Recommendations All homeless counts are undercounts. They are a complex and challenging undertaking, especially on a regional scale. The 2014 Homeless Count built on past experiences and lessons learned from previous counts. According to the project team, the process to implement the count was as good as it could possibly be, and the count was well organized. Nevertheless, many communities have expressed frustration that despite their “extraordinary efforts” to implement the count, the results do not reflect the true extent of homelessness in their communities.
The count coordinators have recommended more research and consultation to find alternatives to the Homeless Count and to improve the methodology to achieve a more accurate estimate of the number of people who are homeless in the region. It has also been recommended that steps be taken to improve the response rate among homeless people in the shelters – since a low survey response rate makes it difficult to draw reliable conclusions about the sheltered homeless population.
While the Homeless Count has provided a great deal of information about the homeless population in the Metro Vancouver region and about changes in the homeless population since 2002, it has also raised several questions. It is suggested that further research be undertaken to address the following questions:
• According to the Homeless Count data, it appears that the proportion of respondents with no health conditions has declined over the years while the proportion with two or more health conditions has increased. Is this because people who first become homeless have more health issues than in the past, do people with more serious health issues face more barriers to housing compared to homeless people with fewer health issues, or is an increase in health conditions due to an aging homeless population?64
• Do the newly homeless get housed quickly or do they become the long-term homeless?
• It appears that among shelter users, a higher proportion stayed for less than 30 days in 2014 compared to 2011. Is this because they found housing or were they unable/unwilling to stay longer?65
• While the number of people identified in Homeless Counts has remained fairly stable since 2008, is this because of greater success in helping people to exit homelessness or are fewer people becoming homeless?
• Looking at all the Homeless Counts in the Metro Vancouver region, an average of 300 people became homeless every month. Are these individuals who are homeless for the first time or are they are episodically homeless (i.e. have experienced a previous episode of homelessness within the year).66
64 It has been suggested that multiple health conditions are a barrier to housing - especially with more visible issues (e.g. teeth and a limp). 65 It has been suggested that outreach workers are having success with first-time homeless individuals. However, it is taking a long time for income assistance applications to be processed. 66 This should not be interpreted as a net increase of 300 new homeless individuals each month as some people who are homeless are also likely to exit homelessness each month.

48
Appendix A – Estimate of Annual Prevalence of Homelessness in the Metro Vancouver Region The Corporation for Supportive Housing in the U.S. developed the following formula to estimate the annual prevalence of homelessness based on point-in-time homeless counts.
Annual Prevalence = A + [(B*51)*(1-C)]
A = Point-in-time count of currently homeless people, including adults and children, found in the street and shelter counts
B = Number of currently homeless adults and children who became homeless within the last 7 days of the count
C = Proportion (expressed in decimals) of currently homeless adults and children who had a previous homeless episode within the past 12 months of the count.
This formula was adjusted by the Streetohome Foundation because data on the episodically homeless was not available. The ratio used by Streetohome to estimate annual prevalence was the number of people homeless one year or more/total number of homeless with information on length of time homeless.67
The following calculation was used to estimate the annual prevalence of homelessness in the Metro Vancouver region based on the 2014 Homeless Count.
Annual Estimate = A + [(B*51)*(1-C)] A = Total number of people identified as homeless in the point-in-time count = 2689 + 88 children = 2,777.
B = Number of individuals who were homeless within 7 days (i.e. up to and including 7 days) = 97 +7 children = 104.
C = Proportion (expressed in decimals) of people homeless one year or more/total number of homeless with information on length of time homeless =
751 + 2 children = 753 = 0.4022435 1817 + 55 children68 1872
Annual estimate = 2,777 + [(104*51)*(1-.4022435)] = 2,777+[5304*.5977565] = 2,777+3171 =5,948
67 The CSH approach states that children should be included in this calculation. The Streetohome calculation may not have included children. 68 Information on length of time homeless is available for 55 children who were accompanied by a parent.

49
Appendix B – Locations for Shelters, Transition Houses, and Safe Houses
Surveyed Shelters, Safe Houses and Transition Houses Municipality Type Capacity Burnaby EWS Burnaby Shelter 27 Fraserdale Short Stay Shelter Burnaby Shelter 10 Dixon House Burnaby Transition 10 Scottsdale House Delta Shelter 10 Salvation Army Gateway of Hope Langley Shelter 32 Ishtar Transition House Langley Transition 12 Iron Horse Youth Safe House Maple Ridge Safe 5 Salvation Army Caring Place Maple Ridge Shelter 40 Cythera Transition House - Closed for maintenance Maple Ridge Transition 0 Elizabeth Gurney House New West Shelter 12 Fraserside Family Shelter New West Shelter 12 New West EWS New West Shelter 27 Russell Housing New West Shelter 16 Stevenson House, Salvation Army New West Shelter 14 Monarch Place New West Transition 12 North Shore Youth Safe House North Vancouver Safe 8 North Shore Shelter - Lookout North Vancouver Shelter 45 Sage Transition House North Vancouver Transition 18 Joys Place Transition House Port Coquitlam Transition 15 Bridge Shelter/Hope for Freedom Port Moody Shelter 30 Richmond House, Salvation Army Richmond Shelter 10 Nova Transition House Richmond Transition 10 All Nations Youth Safe House Surrey Safe 6 Servants Anonymous Surrey Safe 21 Cynthias Place Surrey Shelter 14 Hyland House - Cloverdale Surrey Shelter 10 Hyland House - Newton Surrey Shelter 35 Keys Gateway Surrey Shelter 40 Maxxine Wright Shelter Surrey Shelter 12 Sheenas Place (Family) Surrey Shelter 12 SUMS EWS Surrey Shelter 60 Ama Transition House Surrey Transition 7 Durrant House Surrey Transition 10 Evergreen Transition House Surrey Transition 10 Shimai Transition House Surrey Transition 10 Virginia Sam - Closed for maintenance Surrey Transition 0 Aboriginal Youth Safe House Vancouver Safe 7 Walden Safe House -FSGV Vancouver Safe 9 201 Central St Aboriginal Shelter Vancouver Shelter 100 412 Womens Emergency Shelter Vancouver Shelter 50 Anderson Lodge Vancouver Shelter 10 Belkin House Vancouver Shelter 72 Belkin House Downtown Community Court Vancouver Shelter 11 Catholic Charities Vancouver Shelter 102

50
Covenant House Drake Vancouver Shelter 24 Covenant House Pender Vancouver Shelter 30 First Baptist Church Vancouver Shelter 25 First United Church Vancouver Shelter 60 Lookout Downtown Vancouver Shelter 47 Lookout Yukon Vancouver Shelter 71 New Fountain, PHS Vancouver Shelter 46 Powell Place, Bloom Vancouver Shelter 52 Raincity Ontario Vancouver Shelter 45 Raincity Richards Vancouver Shelter 37 Raincity Triage Vancouver Shelter 28 Salvation Army Beacon Vancouver Shelter 60 Salvation Army Crosswalk Vancouver Shelter 36 Salvation Army Haven Vancouver Shelter 40 Salvation Army Anchor of Hope Vancouver Shelter 40 Springhouse Bloom Vancouver Shelter 32 Union Gospel Mission Vancouver Shelter 72 Union Gospel Mission Day Shelter Vancouver Shelter 20 Vi Fineday Vancouver Shelter 18 Helping Spirit Lodge Vancouver Transition 10 Kate Booth Transition House Vancouver Transition 25 Vancouver Rape Relief Vancouver Transition 10
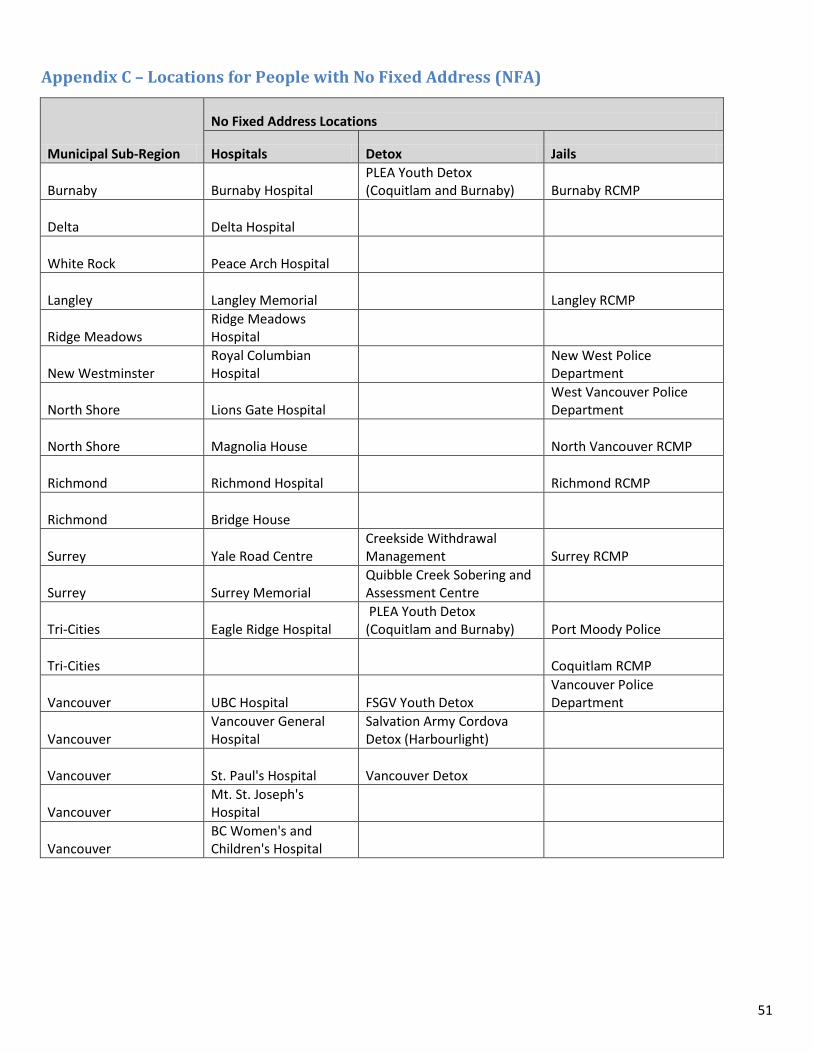
51
Appendix C – Locations for People with No Fixed Address (NFA)
Municipal Sub-Region
No Fixed Address Locations
Hospitals Detox Jails
Burnaby Burnaby Hospital PLEA Youth Detox (Coquitlam and Burnaby) Burnaby RCMP
Delta Delta Hospital
White Rock Peace Arch Hospital
Langley Langley Memorial Langley RCMP
Ridge Meadows Ridge Meadows Hospital
New Westminster Royal Columbian Hospital
New West Police Department
North Shore Lions Gate Hospital West Vancouver Police Department
North Shore Magnolia House North Vancouver RCMP
Richmond Richmond Hospital Richmond RCMP
Richmond Bridge House
Surrey Yale Road Centre Creekside Withdrawal Management Surrey RCMP
Surrey Surrey Memorial Quibble Creek Sobering and Assessment Centre
Tri-Cities Eagle Ridge Hospital PLEA Youth Detox (Coquitlam and Burnaby) Port Moody Police
Tri-Cities
Coquitlam RCMP
Vancouver UBC Hospital FSGV Youth Detox Vancouver Police Department
Vancouver Vancouver General Hospital
Salvation Army Cordova Detox (Harbourlight)
Vancouver St. Paul's Hospital Vancouver Detox
Vancouver Mt. St. Joseph's Hospital
Vancouver BC Women's and Children's Hospital

52
Appendix D – Shelter Survey
Shelter Survey 2014 Metro Vancouver Homeless Count
Interviewer Name: Facility Name: (Name of Shelter, Safe House, Transition House, or Detox Centre)
PART I : SCREENING
1. Will you be sleeping here tonight? Yes No (END)
2. Have you already answered this survey tonight
(with someone wearing a yellow button)? Yes (END) No
3. Do you currently have a place to stay that you pay rent for?
Yes (END) No (Go to Q. 4)
PART II : SURVEY
4. How long have you been without a place of _ _ +++your own?
# Days # Weeks # Months # Years
5. What is your age or year of birth?
9. How long have you lived in this city?
# Days # Weeks # Months # Years 10. Where were you living before you came to this city?
(i.e. what city)?
Age Year of Birth
6. Observed gender. (Youth interviewers ask: How do you identify)? Male Female Transgendered Unknown
7. Including tonight, how many nights in a row have you stayed at this shelter?
# Days # Weeks # Months # Years
8. Is there anybody with you tonight?
No (Go to Q.9) Yes Who?
Check all that apply. � Partner/Spouse � Child(ren) Age(s) � Friend(s) � Pet(s) � Relative(s)
� Other (Specify): 11. What do you think is keeping you from finding ++++a place of your own? Check all that apply.
� Income too low � No income/no income assistance � Rent too high � Family breakdown/abuse/conflict � Evicted � Health or disability issues � Mental health issues � Addiction � Conflict with the law � Poor housing condition � Pets � Discrimination � Other (Specify):

53
Medical condition Specify: Physical disability Addiction Mental illness
PART II : SURVEY ( Continued )
12. Do you consider yourself to be an Aboriginal person?
Yes (Go to Q.14) No
13. Are you new to Canada within the last 5 years? Yes From where?
No
14. What is your first language? � English � French � Other (Specify ):
15. Where do you get your money from?
Check all that apply. � Welfare/income assistance � Disability benefit � Employment insurance � Old age security/guaranteed income
supplement � CPP or other pension � Job full-time � Job part-time or casual � Panhandling � Binning/bottle collecting � Money from family/friends � Youth agreement � Other (Specify): � No income
16. Do you have the following health problems? (Read List) Yes No
17. What services have you used in the past 12 months? Check all that apply. � Ambulance � Emergency room � Hospital (non emergency) � Dental clinic or dentist � Mental health services � Addiction services � Employment/Job help � Parole or services for ex-offenders � Drop-in � Food banks � Meal programs/soup kitchens � Health clinic � Newcomer services � Transitional housing � Housing help/eviction prevention � Outreach � Legal � Budgeting/trusteeship � Other (Specify): � None
18. How many different times in the past 12 months
have you been without a place of your own? (i.e. In and out of homelessness)? � First time homeless � If more than one, how many
times? # times � Don’t know
19. Have you ever had any military service in the
Canadian Forces? (Includes army, navy, airforce). Yes No

54
Appendix E – Street Survey
Street Survey 2014 Metro Vancouver Homeless Count
Interviewer Name (please print):
Individuals observed to be homeless but not interviewed: Perceived Age: Perceived Gender: Reason not interviewed: Nearest Intersection/Facility found:
PART I : SCREENING
1. Have you already answered a survey today (with someone wearing a yellow button)?
Yes (END) No
2. Do you currently have a place
to stay that you pay rent for? Yes (END) No (Go to Q.3)
3. Where did you stay last night? � Outside or in a vehicle
(Go to Q. 4) � Someone else’s place
(Go to Q.4) � Parent(s)/guardian’s
house – If youth (END) � Shelter, Safe House,
Transition House (END) � Detox (END)
PART II : SURVEY
� Recovery house (END) � Hospital (END) � Own place inside (Specify):
(END) � Other (Specify):
(Go to Q.4) � No answer (END)
4. How long have you been without a place of your
own? 8. How long have you lived in this city?
# Days # Weeks # Months # Years
5. What is your age or year of birth?
Age Year of Birth
6. Observed gender. (Youth interviewers ask: How do you identify)? Male Female Transgendered Unknown
7. Is there anybody with you today? No (Go to Q.8) Yes Who?
Check all that apply. � Partner/spouse � Child(ren) Age(s) � Friend(s) � Pet(s) � Relative(s) � Other (Specify):
# Days # Weeks # Months # Years
9. Where were you living before you came to this city (i.e. what city)?
10. What do you think is keeping you from finding a
place of your own? Check all that apply. � Income too low � Evicted � No income/no income assistance � Addiction � Rent too high � Mental health issues � Family breakdown/abuse/conflict � Conflict with law � Pets � Poor housing conditions � Discrimination� Other (Specify):

55
PART II : SURVEY ( Continued )
11. What is the main reason you did not stay in a
shelter last night? Check only one. � Able to stay with a friend � Don’t feel safe � Turned away - Shelter full � Turned away - Other reason � Can’t get to shelter � Didn’t know about shelters � Bedbugs/pests � Dislike (Reason): � Other (Specify):
12. Have you stayed in a shelter in the last 12 months?
Yes No
13. Do you consider yourself to be an Aboriginal
person? Yes (Go to Q.15) No
14. Are you new to Canada within the last 5 years?
Yes From where? No
15. What is your first language?
� English � French � Other (Specify):
16. Where do you get your money from?
Check all that apply. � Welfare/income assistance � Panhandling � Disability benefit � Binning/bottles � Employment insurance � Youth agreement � Money from family/friends � Job full-time � Job part-time or casual � Old age security/guaranteed income supplement � CPP or other pension � No income � Other (Specify):
17. Do you have the following health problems? (Read List) Yes No
Medical condition Specify: Physical disability Addiction Mental illness
18. What services have you used in the past 12
months? Check all that apply. � Ambulance � Emergency room � Hospital (non emergency) � Dental clinic or dentist � Mental health services � Addiction services � Employment/Job help � Parole or services for ex-offenders � Drop-in � Food banks � Meal programs/soup kitchens � Health clinic � Newcomer services � Transitional housing � Housing help/eviction prevention � Outreach � Legal � Budgeting/trusteeship � Other (Specify): � None
19. How many different times in the past 12 months
have you been without a place of our own? (i.e. in and out of homelessness)? � First time homeless � If more than one, how many
times? # of times � Don’t know
20. Have you ever had any military service in the
Canadian Forces? (Includes army, navy, airforce). Yes No
21. Interviewer: Note nearest intersection or facility where interview is taking place. Be specific (i.e. intersection of Davie & Burrard):

56
Appendix F – Homeless Count Volunteers A total of 954 individuals completed an on-line registration form for the Homeless Count in 2014, while 915 completed a training session and signed waivers to participate. This was a 32% increase compared to 2011, and a 14% increase compared to 2008. In 2005, 300 volunteers participated throughout the region.
Table A1. Total Homeless Count Volunteers (2008 to 2014)
Sub-Region 2008 Volunteers
2011 Volunteers
2014 Volunteers
Change 2011 to 2014 # % Change
Burnaby 58 99 90 -9 -9% Delta 0 16 8 -8 -50% Langley 42 37 45 8 22% Ridge Meadows 18 33 40 7 21% New Westminster 48 70 36 -34 -49% North Shore 60 19 51 32 168% Richmond 51 39 54 15 38% Surrey/White Rock 125* 77 162 85 110% Tri-Cities 45 52 39 -13 -25% Vancouver** 252 173 330 157 91% Aboriginal Strategy 71 76 60 -16 -21% Shelter Volunteers 36 Included above Included above
Total 806 691 915 224 32%
*Includes Delta **Includes volunteers for Pacific Spirit Regional Park, in Electoral Area A.

57
Appendix G - Sheltered and Unsheltered Homeless Population Found in Municipal Sub-Regions since 2008
Table 4.1 Sheltered Homeless in Metro Vancouver by Municipal Sub-Region (2008 to 2014) - Trends
Sub-Region 2008 Sheltered Homeless 2011 Sheltered Homeless 2014 Sheltered Homeless # % # % # %
Burnaby 9 1% 8 0% 14 1% Delta/White Rock 6 1% 1 0% 14 1% Langley 12 1% 43 2% 38 2% Ridge Meadows 50 5% 47 2% 45 2% New Westminster 52 5% 91 5% 72 4% North Shore 60 6% 67 4% 59 3% Richmond 19 2% 15 1% 16 1% Surrey 95 9% 170 9% 263 14% Tri-Cities 18 2% 20 1% 32 2% Vancouver 765 70% 1,427 75% 1,267 70% Unspecified 0 0% 3 0% 0 0% Total 1,086 100% 1,892 100% 1,820 100%
Table 4.2: Unsheltered Homeless in Metro Vancouver by Municipal Sub-Region (2008 to 2014) - Trends
Sub-Region 2008 Unsheltered
Homeless 2011 Unsheltered
Homeless 2014 Unsheltered
Homeless # % # % # %
Burnaby 77 5% 70 9% 44 5% Delta/White Rock 11 1% 13 2% 5 1% Langley 74 5% 60 8% 54 6% Ridge Meadows 40 3% 63 8% 39 4% New Westminster 72 5% 41 5% 34 4% North Shore 67 4% 55 7% 60 6% Richmond 37 2% 34 4% 22 2% Surrey 307 20% 230 30% 140 15% Tri-Cities 76 5% 28 4% 23 2% Vancouver 811 52% 154 20% 536 56% Unspecified 2 0% 10 1% 0 0% Total 1,574 100% 758 100% 957 100%