Designing Surveys for Mobile Devices: Pocket-Sized Surveys That Yield Powerful Results
RÖhle, Voigt, Kruse and Torresani: Quality control of determinations of thyrotropin in newborns 813
J. Clin. Chem. Clin. Biochem.Vol. 21, 1983, pp. 813-821
Results of Quality Control Surveys of Radioimmunological Determinationsof Thyrotropin in Newborns
By G. Röhle
Institut für Klinische Biochemie der Universität Bonn,
U. Voigt
Institut für Medizinische Statistik, Dokumentation und Datenverarbeitung der Universität Bonn,
/?. Kruse
Institut für Klinische Biochemie der Universität Bonn und
T. Torresani%
Universitäts-Kinderklinik Zürich
(Received March 12/JuIy 4, 1983)
Summary: Within the quality control scheme of the Deutsche Gesellschaft für Klinische Chemie, seven quali-ty control surveys of thyrotropin (TSH) determinations in blood dried on filter paper have been carried outsince 1980. Ninety-six screening laboratories from 12 European countries took part in these surveys. In asingle survey each participant usually analysed four different samples; each of these consisted of three spots ofdried blood spiked with defined amounts of thyrotropin. For the evaluations of the surveys the participantswere asked to give Information about their analytical results, and from these, their diagnostic classifications.The mediäns of the analytical results correlated well with the given thyrotropin concentrations, but the indi-vidual estimations from different laboratories varied greatly. Major discrepancies of classification were alsoapparent, both in the given thyrotropin concentrations and in the individual estimations.
Two speciäl coHaborative studies with nine selected laboratories showed on the one band that analysis of thelafgest possible part of the dried blood sample can help to optimize the precision of the results; on the otherband, considerable drawbacks related to the reagents and the methods were sometimes observed.
Ergebnisse aus Ringversuchen für radioimmunologische Thyrotropinbestimmungen bei NeugeborenenZusammenfassung: Innerhalb des Systems der Externen Qualitätskontrolle der Deutschen Gesellschaft fürKlinische Chemie wurden seit-l 980 sieben Ringversuche für Bestimmungen von Thyrotropin (TSH) in Blut,das auf Filterpapier getrocknet ist, durchgeführt. An diesen Ringversuchen beteiligten sich 96 Screening-La-boratorien aus 12 europäischen Ländern. In jedem Ringversuch konnten die Teilnehmer durchschnittlich vierverschiedene Proben untersuchen, die jeweils aus einer Filterpapierkarte mit drei Tropfen getrocknetenBlutes bestanden, das mit definierten Mengen von Thyrotropin versetzt war. Für die Auswertungen gaben dieteilnehmenden Laboratorien neben ihren Analysenergebnissen die daraus folgenden individuellen diagnosti-schen Beurteilungen an. Während die Mediane der Analysenergebnisse gut mit den vorgegebenen Thyrotro-pin konzentrationen übereinstimmten, war die Variabilität der individuellen Ergebnisse aus verschiedenenLaboratorien sehr groß. Auch in den diagnostischen Beurteilungen ergaben sich erhebliche Diskrepanzen;sowohl bei Zugrundelegung der vorgegebenen Konzentrationen als auch auf der Basis der individuellen Er-gebnisse.
J. Clin. Chem. Clin. Biochem. / Vol. 21, 1983 / No. 12

814 Röhle, Voigt, Krusc and Torrcsani: Quality control of determinations of thyrotropin in newborns
Zwei gesonderte Studien, an denen sich neun ausgewählte Laboratorien beteiligten, zeigten einerseits, daßdie Verwendung eines möglichst großen Teils des Probenmaterials für die Analysen zu einer Optimierung derPräzision der Ergebnisse beitragen kann, andererseits ließen sie zum Teil erhebliche Mängel der angewende-ten Reagenzien und Methoden erkennen.
Introduction
According to the data (1) available at present, con-genital hypothyroidism shows an average frequencyof occurrence öf one case in every 3,500 births. Forthe early diagnosis of this congenital defect the de-termination of thyrotropin (TSH) by radioimmu-noassay in the blood of newborns is widely accepted.The preferred sample material is blood taken fromthe heel of the newborn on the fourth or fifth day oflife, applied to filter paper and dried. In the analyti-cal laboratory defined fields of the blood-stained fil-ter paper are punched out and the radioimmunoas-say of thyrotropin is performed after elution of thepunch.
From the beginning the kind of Support materialused for the specimens, which is unusual in clinicalchemical analytics, caused certain doubts about thereliability of the analytical results. The classificationof the testing principle äs a semi-quantitative screen-ing method seemed to be justified (2, 3). On the oth-er hand, it is conceivable that a false negative resultwould result in delayed therapy, with irreversibleneurologic defects in the child äs the possible conse-quence. Analysts in Charge were therefore very con-cerned to examine the reliability of the analytical re-sults by means of external quality control. On thebasis of this interest, quality control surveys for de-terminations of thyrotropin from dried blood wereintroduced into the external quality control schemeof the Deutsche Gesellschaft für Klinische Chemie.After a pilot study in May 1980, seven quality con-trol surveys with Professor Ruth Illig, Zürich, äs con-sultant, have now been carried out with the partici-pation of laboratories from 12 JEuropean countries.The evaluatioris comprised the values of the analyti-cal results äs well äs their diagnostic classification bythe participants.
Two separate quality control surveys were designedto detect possible sources of error. The first quaiitycontrol survey examined whether the size of thepunched sample and the precision of the results wereinterdependent within one series of analyses. The se-cond quality control survey was aimed at investigat-ing how far the working Standards of some commef-cial kits corresponded to the reference preparationMRC 68/38.
Materials and MethodsControl samples
The samples for the quality control surveys 1/80, 1/81 and 2/81were provided by Deutsche Pharmacia, Freiburg, and Henning,Berlin. For the next quality control surveys the samples were pre-pared in the laboratory of our Institute. Filter paper fromSchleicher & Schüll, Dassel, product No. 2992, served äs supportmaterial. The specimens themselves were produced from humanEDTA blood with a basic thyrotropin concentration of l m U/l,and in each case mixed with defined amounts of the internationalreference preparation MRC 68/38 (NIBSC-London). This mate-rial was applied to filter paper in portions of 50 and then dried.One sample consisted of filter paper with three Spots of blood.The concentrations of thyrotropin resulting from the preparationare given in table 1.
Qual i ty control surveys
Seven quality control surveys were carried out in the followingmonths: October 1980 (1/80), February 1981 (1/81), September1981 (2/81), December 1981 (3/81), February 1982 (1/82), May1982 (2/82) and November 1982 (3/82), The number of differentsamples for analysis by each participant in each quality controlsurvey is shown in table l, For the analysis of the samples theparticipating laboratories in Germany had one week, the partici-pants from other European countries two weeks because of thelonger mailing time.
Documenta t ion of the results and f i nd ings
Together with control samples, the participants in the quality con-trol surveys received a registration form. The results of two singledeterminations and their mean in mU per l of blood were enteredon these for ms. In addition, a diagnostic classification of the anal-ysis result was required:
(1) normal
(2) a case of congenital hypothyroidism possibly or
(3) probably pathologic.
Participants were also asked what further measures were taken inconsequence of the first analysis result:
(1) None?
(2) Analysis of the third sjpot of blood?
(3) The ordering of a new sample card?
(4) The ordering of a serum sample?
As further Information, the narne of the kit producer was requestred, provided that a commercially available test kit had been usedfor the determinations.
In the quality control survey 3/82 each participant was also askedabout the highest concentration of thyrotropin he would considerto be normal for a 5-days^oId infant, and which välue of thyro-tropin in routine analytics was the lowest that would result in fur-ther measures. . J
J. Clin. Chem. Clin. Biochem. / Vol. 21, 1983 / No. 12

Röhle, Voigt, Kruse and Torresani: Quality contro! of determinations of thyrotropin in newborns 815
DEUTSCHE GESELLSCHAFT F'JK KLINISCHE CHEMIEEXTERNE QUALITÄTSKONTROLLE
QÜALITY CONTROL SURVEY FOR TSH-DETERMINATIONS
SAMPLE: 3
NOV 82
(MU/L)
40 —
30 —
20 —
10 —
0 —
M
I IN * 67XM - 21.2 MU/LSD ·= 6 .49 MU/LCV - 30.7 %
STATISTICS OFCLASSIFICATIONS
( 1 ) NORMAL<2) TECHN.ERROR(3) C.H.POSSIBLE(4) C.H.EVIDENT(5) OTHER
STATISTICS OF IMPLICATIONS FOR EACH CLASSIFICATION
TOTAL23
928
32
203RD SPOT ANOTH.CARD PLASMA SAMPLE OTHER
212 12
32
<C.H.»CONGENITAL HYPOTHYROIDISM)(N-NÜMBER; XM-MEAN; SD«STANDARD DEVIATION; CV=COEFFICIENT OF VARIATION)(THE STATISTICAL PARAMETERS XM,SD,CV WERE CALCULATED EXCLUDING THE 3 SMALLEST AND LARCEST VALUES. }
%
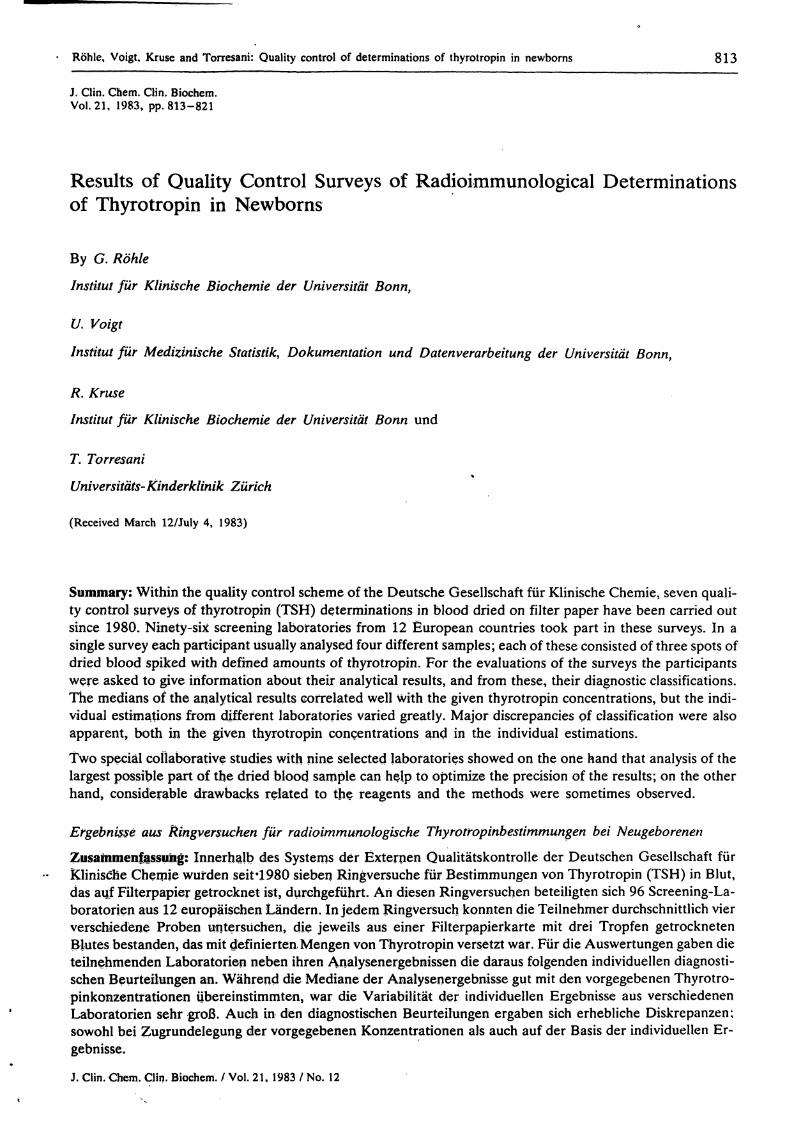
Fig. 1. Example of general evaluation of a survey for thyrotropin determinations (survey 3/82; specimen 3), including statistics ondiagnostical classifications. Each vertical line represents the analytical result of an individual laboratory. MU/L = mU/1.
Evalua t ion
When the survey was finished the data were collected and evaluat-ed by means of electronic data processing. The results of eachsample of the quality control survey were summarized äs shown infigure l. The height of each vertical line represents the value de-termined by one laboratofy. The values were listed in descendingorder. Above the diagram the code numbers for the diagnosticclassification belonging to each value were noted. The summafybelow the diagram took intp account the statistical parameters ofmean, Standard deviation and coefficient of Variation. The statisti-cal values of the diagnostic classifications and of any further mea-sures were also recorded.
Special survey "diameter of paper discs" (May 1982)
Nine participating laboratories — five laboratories from producersof kits and foijr frpm screening laboratories for the screening ofthyrotropin — measufed the concentrations -of thyrotropin in twosets of samples (A «= 13 mU/1; B = 31 mU/1) by means of eight-fold determinations. Each eight-fold determination was cafriedout with the following samples: two samples of 3 mm, one sampleof 4.25 mm» one of 6 mm and, äs fär'as technically possible, onesample with a disc diameter of 8 mm. From the values of eacheight-fold determination the precision in the series was calculatedäs a coefficient of Variation.
Special survey "Hidden dose-response curve" (May 1982)
In accordance with the model of quality control surveys developedby Marschner et a). (4), the same laboratories that had participat-ed in the quality control survey "diameter of paper discs" alsomeasured in duplicate the concentrations of thyrotropin in eightdifferent blood samples dried on fi 1ter paper. Six of the samples —all of them were unknown to the participants (i(hidden Stand-
ards"; samples 1—6) — contained the following concentrations ofthyrotropin by addition of the reference preparation MRC 68/38:l mU/1, l mU/K 13 mU/I, 25 mU/1, 31 mU/1, and 43 mUA Twosamples were prepared from the blood of patients (samples 7 and8). The participants of the quality control survey returned the fol-lowing data for the evaluation:
1. The given concentrations of thyrotropin and the counts perminute of the working Standards of the tests.
2. The counts per mifiute for the unknown samples ("hiddenStandards11 and samples from the patients) and the correspondingconcentrations of thyrotropin read from the dose-responsc curveof the test. From the returned counts per minute, a dose-responsecurve on the basis of the working Standards and a "hidden"1 dose-response curve on the basis of the samples l —6 were calculatedfor each participant using a standardized procedure. From thecounts per minute for samples 7 and 8 and the individual hiddendose-response curve, the resulting concentrations of thyrotropinwere computed and set against the results achieved by the partici-pants.
Results and Discussion
96 laboratories from 12 European countries partici-pated in the 7 quality control surveys. Most of themused commercial test combinations for the determi-nations of thyrotropin, but the proportion of labora-tories that used their own methods was — at 25% -relatively large (5).
J. Clin. Chem. Clin. Biochem. / Vol. 21, 1983 / No. 12
816 Röhle, Voigt, Kruse and Torresani: Quality control of determinations of thyrotropin in newborns
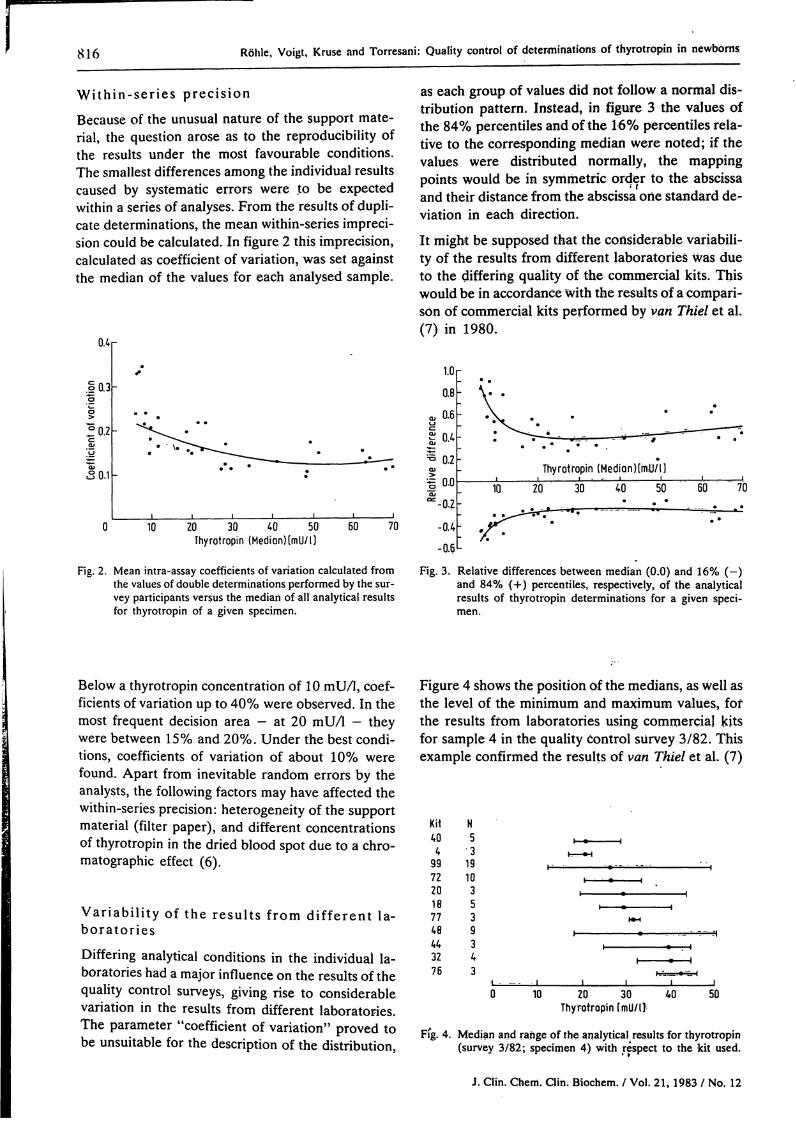
W i t h i n - s e r i e s precis ionBecause of the unusual nature of the support mate-rial, the question arose äs to the reproducibility ofthe results under the most favourable conditions.The smallest differences among the individual resultscaused by systematic errors were to be expectedvvithin a series of analyses. From the results of dupli-cate determinations, the mean within-series impreci-sion could be calculated. In figure 2 this imprecision,calculated äs coefficient of Variation, was set againstthe median of the values for each analysed sample.
0.4
o 0.3
°0.2c
«S 0.1
• \.
10 20 30 40 50Thyrotropin ( M e d i o n ) [ m U / l )
60 70
Fig. 2. Mean intra-assay coefficients of Variation calculated fromthe values of double determinations performed by the sur-vey participants versus the median of all analytical resultsfor thyrotropin of a given specimen.
as each group of values did not follow a normal dis-tribution pattern. Instead, in figure 3 the values ofthe 84% percentiles and of the 16% percentiles rela-tive to the corresponding median were noted; if thevalues were distributed normally, the mappingpoints would be in Symmetrie order to the abscissaand their distance from the abscissa one Standard de-viation in each direction.
It might be supposed that the coüsiderable variabili-ty of the results from different laboratories was düeto the differing quality of the commercial kits. Thiswould be in accordance with the results of a comparl·son of commercial kits performed by van Thiel et al.(7) in 1980.
1.0
0.8
0.6
0.4
Thyrotropin (Median)[nUJ/l]
10 20 30 40 50 60 70
-0.4
-0.6
Fig. 3. Relative differences between median (0.0) and 16% (-)and 84% (+) percentiles, respectively, of the analyticalresults of thyrotropin determinations for a given speci-
Below a thyrotropin concentration of 10 mU/1, coef-ficients of Variation up to 40% were observed. In themost frequent decision area — at 20 mU/1 - theywere between 15% and 20%. Under the best condi-tions, coefficients of Variation of about 10% werefound. Apart from inevitable random errors by theanalysts, the following factors may have affected thewithin-series precision: heterogeneity of the supportmaterial (filter paper), and different concentrationsof thyrotropin in the dried blood spot due to a Chro-matographie effect (6).
Var iab i l i ty of the resul ts f rom d i f f e ren t la-bora tor ies
Differing analytical conditions in the individual la-boratories had a major influence on the results of thequality control surveys, giving rise to considerableVariation in the results from different laboratories.The parameter "coefficient of Variation" proved tobe unsuitable for the description of the distribution,
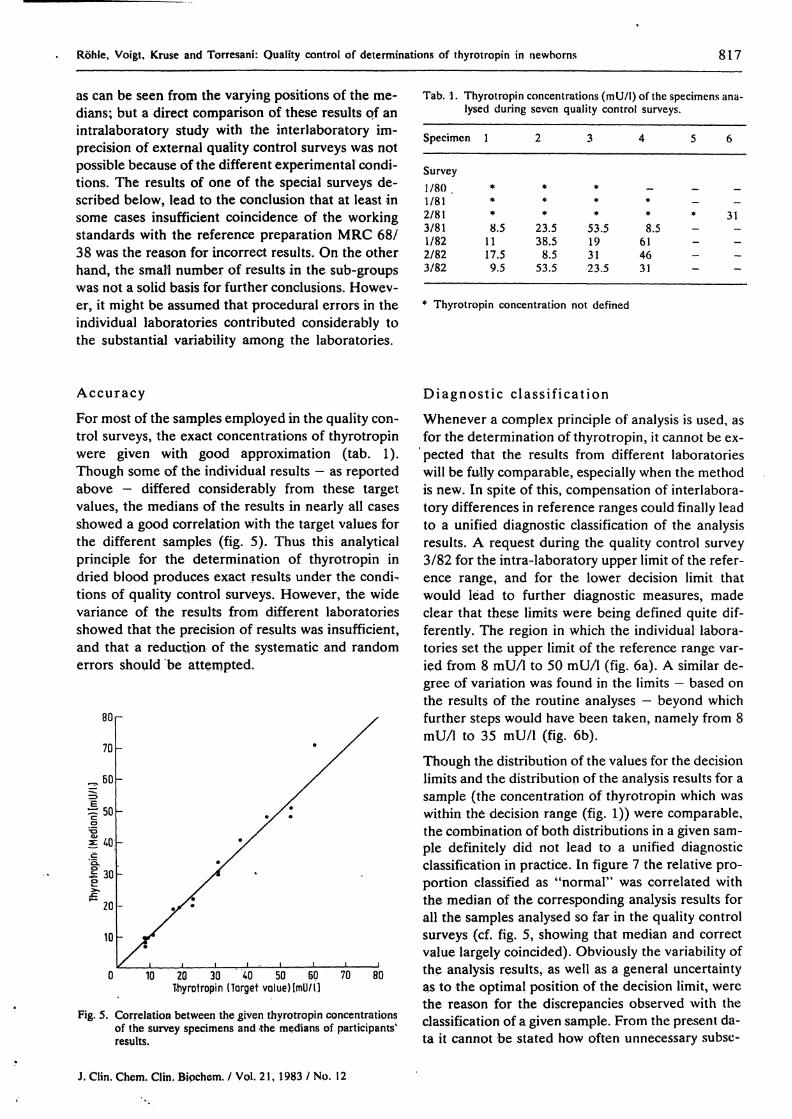
Figure 4 shows the position Of the medians, as well asthe level of the minimum and maximum values, fofthe results ffom laboratories using commerciaj kitsfor sample 4 in the quality control sürvey 3/82. Thisexample confirmed the results of van Thiel et al, (7)
Kit404
99722017748443276
N5
•319103539343
0 10 20 30 40 50Thyrotropin (mü/ll·
Fig. 4. Median and ränge of the analytical results for thyrotropin(sürvey 3/82; specimen 4) with respect to the kit used.
J. Clin. Chem. Clin. Biochem. / Vol. 21, 1983 / No. 12
Röhle, Voigt, Kruse and Torresani: Quality control of determinations of thyrotropin in newborns 817
äs can be seen from the varying positions of the me-dians; but a direct comparison of these results pf anintralaboratory study with the interlaboratory im-precision of external quality control surveys was notpossible because of the different experimental condi-tions. The results of one of the special surveys de-scribed below, lead to the conclusion that at least insome cases insufficient coincidence of the workingStandards with the reference preparation MRC 68/38 was the reason for incorrect results. On the otherhand, the small number of results in the sub-groupswas not a solid basis for further conclusions. Howev-er, it might be assumed that procedural errors in theindividual laboratories contributed considerably tothe substantial variability among the laboratories.
Tab. l. Thyrotropin concentrations (mU/l) of the specimens ana-lysed during sevcn quality control surveys.
Specimen l 2 3 4 5 6
Survey1/801/812/813/811/822/823/82
**
*
8.51117.59.5
***
23.538.58.5
53.5
***
53.5193123.5
—**8.5
614631
_ __— __* 31_ _— _
— —— —
Thyrotropin concentration not defined
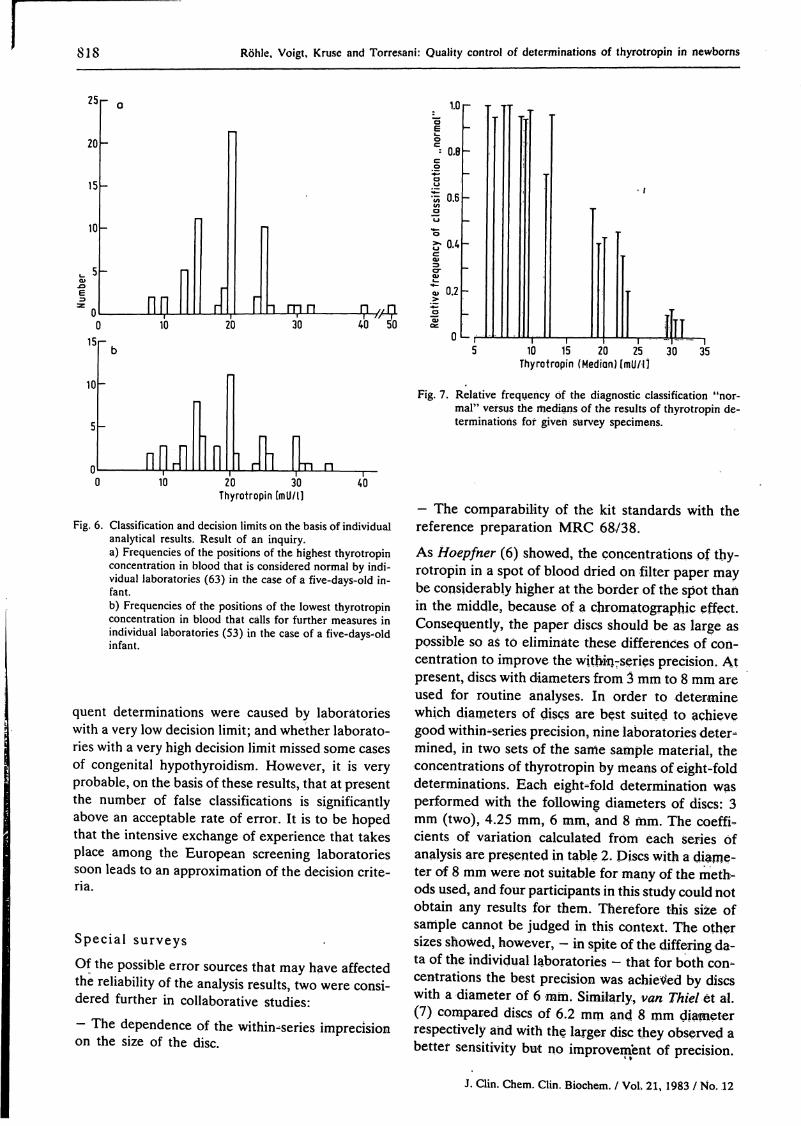
AccuracyFor most of the samples employed in the quality con-trol surveys, the exact concentrations of thyrotropinwere given with good approximation (tab. 1).Though some of the individual results — äs reportedabove - differed considerably from these targetvalues, the medians of the results in nearly all casesshowed a good correlation with the target values forthe diffefent samples (fig. 5). Thus this analyticalprinciple for the determination of thyrotropin indried blood produces exact results under the condi^tions of quality control surveys. However, the widevariance of the results from different laboratoriesshowed that the precision of results was insufficient,and that a reduction of the systematic and randomerrors should be attempted.
80
70
»30
^ 20
10
0 10 20 30 40 50 60 70 80Thyrotropin (Target volueMmU/l]
Fig. 5. Correlation between the given thyrotropin concentrationsof the survey specimens and -the medians of participants'results.
Diagnost ic c l a s s i f i c a t i onWhenever a complex principle of analysis is used, äsfor the determination of thyrotropin, it cannot be ex-pected that the results from different laboratorieswill be fully comparable, especially when the methodis new. In spite of this, compensation of interlabora-tory differences in reference ranges could finally leadto a unified diagnostic classification of the analysisresults. A request during the quality control survey3/82 for the intra-laboratory upper limit of the refer-ence ränge, and for the lower decision limit thatwould lead to further diagnostic measures, madeclear that these limits were being defined quite dif-ferently. The region in which the individual labora-tories set the upper limit of the reference ränge var-ied from 8 mU/l to 50 mU/l (fig. 6a). A similar de-gree of Variation was found in the limits — based onthe results of the routine analyses — beyond whichfurther Steps would have been taken, namely from 8mU/l to 35 mU/l (fig. 6b).Though the distribution of the values for the decisionlimits and the distribution of the analysis results for asample (the concentration of thyrotropin which waswithin the decision ränge (fig. 1)) were comparable,the combination of both distributions in a given sam-ple definitely did not lead to a unified diagnosticclassification in practice. In figure 7 the relative pro-portion classified äs "normal" was correlated withthe median of the corresponding analysis results forall the samples analysed so far in the quality controlsurveys (cf. fig. 5, showing that median and correctvalue largely coincided). Obviously the variability ofthe analysis results, äs well äs a general uncertaintyäs to the optimal position of the decision limit, werethe reason for the discrepancies observed with theclassification of a given sample. Frorn the present da-ta it cannot be stated how often unnecessary subse-
J. Clin. Chem. Clin. Biochem. / Vol. 21, 1983 / No. 12
818 R hle, Voigt, Kruse and Torresani: Quality control of determinations of thyrotropin in newborns
25
20
15
10
,_ 50>.0
z oC
15
10
5
n
" o 1.0C5
""
Π
π π I I Γ
r)
oC= Ο.Θc
8^ °·6αuπ °co>tul—« 0.2
Γ ι m π π /, n "1) 10 20 30 40 " 50 £
0
r- j
—
-
-
•
J
1'
AI1 i i l |- - ib 5 10 15 20 25 30 35
Thyrotropin (Medi n) (mU/l l_
-
nilr i l I nFig. 7. Relative frequency f the diagnostic classification "nor-
mal" versus the medians of the results of thyrotropin de-terminations fof given survey specimens.
1 rill L n0 10 20 30 40
Thyrotropin [mU/l l
Fig. 6. Classification and decision limits on the basis of individualanalytical results. Result of an inquiry.a) Frequencies of the positions of the highest thyrotropinconcentration in blood that is considered normal by indi-vidual laboratories (63) in the case of a five-days-old in-fant.b) Frequencies of the positions of the lowest thyrotropinconcentration in blood that c lls for further measures inindividual laboratories (53) in the case of a five-days-oldinfant.
quent determinations were caused by laboratorieswith a very low decision limit; and whether laborato-ries with a very high decision limit missed some casesof congenital hypothyroidism. However, it is veryprobable, on the basis of these results, that at presentthe number of false classifications is significantlyabove an acceptable rate of error. It is to be hopedthat the intensive exchange of experience that takesplace among the European screening laboratoriessoon leads to an approximation of the decision crite-ria.
Special surveys
Of the possible error sources that may have affectedthe reliability of the analysis results, two were consi-dered further in collaborative studies:
- The dependence of the within-series imprecisionon the size of the disc.
- The comparability of the kit Standards with thereference preparation MRC 68/38.
As Hoepfner (6) showed, the concentrations of thy-rotropin in a spot of blood dried on filter paper maybe considerably higher at the border of the spot thanin the middle, because of a Chromatographie effect.Consequently, the paper discs should be s large spossible so s to elimin te these differences of con-centration to improve the within-series precision. Atpresent, discs with diarneters from 3 mm to 8 mm areused for routine art lyses. In order to deteri inewhich diameters of discs are best suited to achievegood within-series precision, nine laboratories deter-^mined, in two sets of the sarrie sample matefial, theconcentrations of thyrotropin by means of eight-folddeterminations. Each eight-fold determination wasperformed with the following diameters of discs: 3mm (two), 4.25 mm, 6 mm, and 8 mm. The coeffi-cients of Variation calculated frorri each series ofanalysis are presented in table 2. Discs with a diame-ter of 8 mm were not suitable for many of the meth-ods used, and four participants in this st dy could notobtain any results for them. Therefore this size ofsample cannot be judged in this context. The othersizes showed, however, - in spite of the differing da-ta of the individual laboratories - that for both con-centrations the best precision was achieXted by discswith a diameter of 6 mm. Similarly, van Thiel et al.(7) compared discs of 6.2 mm and 8 mm diapteterrespectively and with the larger disc they observed abetter sensitivity but no improvement of precision.
J. Clin. Chem. Clin. Biochem. / Vol. 21, 1983 / No. 12

Röhle, Voigt, Kruse and Torresani: Quality control of determinations of thyrotropin in newborns 819
Tab. 2. Coefficients of Variation of the intra-assay precision ofeight-fold thyrotropin determinations achieved by ninelaboratories u sin g varying sizes of discs.
Specimen A( 13 mU/I thyrotropin)
Dia- 3 4.25 6 8meter (two)(mm)of discs
Laboratory1 0.28 -23456789
Me-diän
0.080.220.150.500.440.320.170.15
0.22
0.390.120.080.340.260.440.24—
0.26
0.0.0.0.0.0.0.0.0.
181212072611393913
0.13
0.200.0.—--—0.
0726
27*0.48
0.26
Specimen B(31 mU/1 thyrotropin)
3 4.25 6 8(two)
0.170.060.170.070.280.140.290.160.29
0.17
0.360.150.110.040.150.220.620.13
—
0.15
0.040.110.150.060.150.150.280.070.06
0.11
0.0.0.----
101013
0.32**0.06
0.10
* seven-fold determination** four-fold determination
In another survey, the trial design of which was per-formed in accordance with the „Münchner Modell"(4, 8), nine laboratories received eight different sam-ples each with a concentration of thyrotropin thatwas unknown to the participants.
The comparison of the dose-response curves of theworking Standards arid the "hidden Standards" re-sulted partly in very different combinations (fig.8a—c). In three laboratories the coincidence of bothcurves was very good, äs shown in figure 8a. In fourlaboratories a more or less distinct parallel displace-rhent was obserVed, äs seen in the example in figure8b. Pössibly these displacements are rnainly causedby errprs in the calibration of the wprking Standards.Additional dfawbacks of the method and probablyhandlmg mistäkes, however, must be supposed forthe case presented in figure 8c. Here the curves crossand diverge to an increasiiig extent in ari importantpart of the ränge of measurement. A similar patternof the curves was observed by another participatinglaboratofy,-although with opposite and smaller dis-crepancies.
Using the counts per minute for sarnples 7 and 8(samples from patients)/the concentrations of thyro-tropin (that should have resulted on the basis of thehidden dose-response curve from the individual la-boratories) were calculated. In figures 9a~d they arecompared with the analysis results that eight of thenine participating laboratories had returned (the re-sults from laboratory 7 were unsuitable for the corn-
7000r
6000
5000-
4000
3000
4000
.| 3500
- 3000
2500
2000Q
3000
2500
2000
1500
10 20 30 50
10 20 30 40 50
10 20 30Thyrotropin imU/ l ]
40 50
Fig. 8. Dose-response curves for thyrotropin calculated from thecounts measured by three individual laboratories
for the working Standards of the kit used— -<·'·— for the hidden Standards among the survey speci-
mens.
parison). The expected optimization of precisionthroughout the laboratories for the values computedon the basis of the hidden dose-response curve wasonly partially attained. With sample 7 (fig. 9a and b)the ränge of distribution was äs wide, but differentlypositioned. This Situation was also confirmed by theStandard deviations, which were 4.5 mU/1 in bothcases. At least for the sample 8 (fig. 9d), the ränge of
J> Clin. Chem. Clin. Bipchem. / Vol. 21, 1983 / No. 12

820 Röhle, Voigt, Kruse and Torresani: Quality control of dcterminations of thyrotropin in newborns
fcO
10
10
mm JTL15 20 25 30
15 20 25 30
g6
10 155 l ,
zo 25„ m// -| --
35
15 20Thyrotropin [mU/ l ]
25 30
Fig. 9. Distributions of the analytical results for thyrotropin in two different specimens (a, b and c, d respectively) from hypothyreoticpatients established by eight laboratories. The numbers within the squares symbolize the individual laboratories.a) and c) analytical values calculated by the participants themselves.b) and d) analytical values calculated from the hidden dose-response curves.
distribution of the values on the basis of the hiddendose-response curves was considerably smalier thanfor the values from the laboratories. The value fromlaboratory 8, which can be called an outlayer, camecloser to the average of the other values after therecalculation, and the Standard deviations decreasedfrom 7.3 mU/l to 3.8 mU/l.
Conclusion
The determination of thyrotropin in blood dried onfilter paper has proved to be a very helpful methodfor the early diagnosis of congenital hypothyroidism.1t is possible t o determine the correct concenträtionsof thyrotropin by this method. This is evident fromthe satisfactory accuracy of the medians of the re-sults in quality control surveys, äs well äs in the con-siderable reliability of the analysis values of some in-dividual laboratories.
By use of a semiquantitative analytical method theinsufficient precision of the results from different la-boratories can only be improved to a certain degree.
The investigations öf Höpfner (6) indicated, howev-er, some initial Steps for a possible optimization, es-pecially with respect to the kind of filter paper usedand the size of the samples. The results cönfirmedthat samples of the lärgest possible size may improvethe reliability of the results. Furthermore, it could beshown that often errors in calibration were probäblybehind incorfect results.
For the important diagnostic classification of theanalysis results, the quality control sufveys revealedgreat differences in the location of the decision lim-its, taking into consideration the correct concentra-tions of thyrotropin äs well äs the intralaboratoryanalysis results. These uiicertainties in the diagnosticclassification may result partly because in somecountries the screening of hypothyroidism by thyro-tropin assay has been in use for only few years, sothat experience is still limited. Büt a slight improve-ment in the reliability of analytic procedures - onethat could be gained by taking the measures dis-cussed above - would represent considerable pro-gress toward exact diagnosis.
J. Clin. Chem. Clin. Biochem. / Vol. 21, 1983 / No. 12

Röhle, Voigl, Kruse and Torresani: Quality control of determinations of thyrotropin in newborns 821
References1. Delange, F., Illig, R.f Rochiccioli, P. & Brock-Jacobsen, B. 6. Höpfner, B. (1982) J. Clin. Chem. Clin. Biochem. 20, 915-
(1981) Acta Paediatr. Scand. 70, 1-2. . 920.2. Illig, R. & Rodriguez de Vera Roda, C. (1976) Schweiz. Med. 7. van Thiel, Dagmar, Marschner, L, Wood, W. G., Habermann,
Wochenschr. 106, 1676-1681. J. & Scriba, P. C. (1980) J. Clin. Chem. Clin. Biochem. 7£,3. Illig, R., Torresani, T. & Sobradillo, B. (1977) Helv. Paediat. 807-816.
Acta 32, 289-297. 8. Marschner, L, Wood, W. G., van Thiel, Dagmar, Habermann,4. Marschner, 1., Erhardt, E. W. & Scriba, P. C. (1976) J. Clin. J.,'König, A. & Scriba, P. C. (1983) J. Clin. Chem. Clin. Bio-
Chem. Clin. Biochem. 14, 345-351. ehem. 27, 301-311.5. Voigt, U., Röhle. G., Kruse, R. & Breuer, H. (1982) In: Ra-
dioimmunoassay and Related Procedures in Mediane, IAEA- Qr Q j^5njeProceedings, Vienna 1982, p. 607-614. Institut für Klinische Biochemie
Sigmund-Freund-Straße 25D-5300 Bonn l
J. Clin. Chem. Clin. Biochem. / Vol, 21, 1983 / No. 12