Results of Growout Production Trials of Growout Production Trials Leslie Sturmer, Shirley Baker,...
34
Results of Growout Production Trials Leslie Sturmer, Shirley Baker, Eric Cassiano University of Florida, Institute of Food & Agricultural Sciences John Scarpa, Harbor Branch Oceanographic Institute at FAU Presented at Improving Shellfish Aquaculture Production Session Aquaculture 2010
Transcript of Results of Growout Production Trials of Growout Production Trials Leslie Sturmer, Shirley Baker,...

Results of Growout Production Trials
Leslie Sturmer, Shirley Baker, Eric Cassiano University of Florida, Institute of Food & Agricultural Sciences
John Scarpa, Harbor Branch Oceanographic Institute at FAU Presented at
Improving Shellfish Aquaculture Production Session Aquaculture 2010

• Clams grow fast – 12-18 month growout
from seed (12 mm SL) to littleneck size ( 25 mm SW) clam
– One half to third of crop times of other states
• Year-round growing conditions
• Subtropical water temperatures
• High natural produc-tivity levels
• Clams are available year round – Plant and harvest
continuously
Florida Clam Culture

2.4 5.9 8.8
38.143
99
134 142 134
92
184
0
25
50
75
100
125
150
175
200
Num
ber o
f Cla
ms
(mill
ions
)
1987 1989 1991 1993 1995 1997 1999 2001 2003 2005 2007
1987-2005 Compiled from Florida Agricultural Statistics Service’s survey of aquaculturists 2007 Compiled from University of Florida survey of shellfish wholesalers
Florida Clam Culture Industry, 1987-2007
0.4 1 1.23.6
5.4
12.7
15.9 15
13
9.8
19
0
5
10
15
20V
alue
of C
lam
s ($
mill
ions
)
1987 1989 1991 1993 1995 1997 1999 2001 2003 2005 2007
Production
Sales Value

Why improve upon a good thing?
• Increasing unreliable production • Increasing summer crop mortalities (>50%)
– High water temperatures and other environmental stressors during prolonged summer months
Photo Courtesy: Carlton Ward, Jr., LINC Foundation

• Hybridization is a common breeding technique – Used in commercial agriculture and finfish aquaculture
• Hybrids have superior traits to either parent species – For example, improved growth or environmental resistance
• The use of clam hybridization for “mariculture” potential was examined by Winston Menzel at Florida State University in the 1960-70s – Showed hybrids had improved growth, shelf life – Little data reported on merit of hybrids for improved survival
• This project allows for a rigorous examination of clam hybridization – To improve production – To assure product quality
Improvement of Cultured Clam Stocks through Hybridization

Clam Species • The northern hard clam supports
fisheries and aquaculture industries along Atlantic coast from MA to FL
• The southern quahog found from NC to Caribbean, recreationally fished in FL – May have production traits for resisting
environmental stressors – Not cultured because of their tendency
to gape in refrigerated storage • Mercenaria species are normally
separated by environmental tolerances, but readily hybridize where they do co-occur or under hatchery conditions
Northern hard clam Mercenaria mercenaria
notata
Southern quahog Mercenaria campechiensis

Hatchery Production • Northern hard clams obtained
from a Florida hatchery • Southern quahogs obtained
from the wild (Sarasota), where highly pure populations are known to exist
• Single parent crosses utilized • Multiple spawns accomplished
with different sets of parents, October-December, 2007
• Stock verification by allozyme method – Arnold and Geiger, FWC FWRI

Nursing Hybrid Seed
• Standard hard clam protocols used
• Land-based nursing – Downwellers – March-June 2008 – Cedar Key, FL
• Field nursing – Bottom bags, 4 mm – June–September 2008 – Cedar Key, FL

Nursing Hybrid Seed • Growth differences
negligible
• Survival rates not statistical different
• About 600,000 seed from three families nursed for growout evaluation
Stock Survival (%) Average + SD
M x M 72.9 + 11.5
M x C 82.4 + 16.9
C x M 79.5 + 4.6
C x C 86.1 + 4.9

C x C C x M
M x C M x M (♀ x ♂)

Growout Trials Stock Comparison
• Replicated plants - Parental stocks and reciprocal crosses from 3 families – 146K seed – Cedar Key, FL – Sept 2008-Sept 2009
• Standard planting procedures – Bottom bags, 9 mm – Net coated and
covered with wire – Stocked at 1150/bag
(72/ft2)

Growout Trials • Stocking Density
Comparison – Parental stocks and reciprocal
crosses from 1 family • 88K seed • Cedar Key, FL • Sept 2008-Sept 2009
– Bottom bags stocked • 960/bag (60/ft2) • 1150/bag (72/ft2) • 1360/bag (85/ft2)
• Site Comparison – 190K distributed to 8
growers in 3 counties • Cedar Key, FL • SW Florida • FL Panhandle
• Gear Comparison – Bottom bag – Bottom plant

Comparison of Production Characteristics
• Sampling every 4 months and at harvest (12 months)
• Growth – SL, SW, total and dry meat weight
• Survival
• Condition index – measure of degree of fattening or nutritive status
• Histology – determine gonadal stage and reproductive potential

Commercial Market Sizes
Common Name
Shell Width/ Hinge Size
(inches)
Number per Pound
Littleneck 1” 10-13 7/8 inch 7/8” 14-18 Pasta 3/4” 18-25

Water Temperature (oF) Dog Island Lease Area, Cedar Key September 2008- September 2009
Water temperature measured every 30 minutes with YSI 6600 data sonde
30
40
50
60
70
80
90
100
9/7
9/1
10/
10/
10/
11/
11/
12/
12/
12/
1/1
1/2
2/4
2/1
3/1
3/1
3/2
4/7
4/2
5/2
5/1
5/2
6/9
6/2
7/4
7/1
7/2
8/1
8/2
9/4
2008-9
Tem
pera
ture
(oF)
19 days > 90oF (32oC)

Harvest Results (12 months)–All Families Average + Standard Deviation
Note: ANOVA were performed using the PROC GLM procedure of SAS. Treatment means were considered significantly different when p< 0.05. Tukey’s test groupings are displayed
Stock Shell Width (mm)
Total Weight
(g)
Dry Meat Wt.
(g)
Survival (%)
Production (lbs/bag)
M x M 23.1 + 1.2 b
26.8 + 3.7 a
0.59 + 0.09 bc
93.3 + 15.4 a
62.8 + 9.6 a
M x C 24.3 + 0.8 a
30.2 + 2.7 a
0.73 + 0.08 a
99.5 + 8.3 a
76.1 + 8.2 a
C x M 23.3 + 3.1 ab
27.5 + 9.1 a
0.68 + 0.20 ab
90.9 + 23.5 ab
67.2 + 33.0 a
C x C 20.4 + 1.3 c
17.3 + 3.0 b
0.52 + 0.10 c
72.3 + 25.3 b
32.5 + 13.9 b

Harvest Results (12 months) – All Families
0
20
40
60
80
100C
omm
erci
al G
rade
(%)
Pasta 7/8" 1"
1" 18 30 32 37/8" 42 41 27 16Pasta 40 29 41 81
M x M M x C C x M C x Ca
a
b
a
a
b
a
b
b
b
b
a

Harvest Results (12 months) – Family A Average + Standard Deviation
Note: ANOVA were performed using the PROC GLM procedure of SAS. Treatment means were considered significantly different when p< 0.05. Tukey’s test groupings are displayed.
Stock Shell Width (mm)
Total Weight
(g)
Dry Meat Wt.
(g)
Survival (%)
Production (lbs/bag)
M x M 22.6 + 1.2 b
25.8 + 3.6 b
0.58 + 0.08 b
81.8 + 11.3 ab
53.0 + 6.6 b
M x C 24.5 + 0.7 a
31.0 + 2.2 a
0.76 + 0.05 a
96.8 + 9.9 a
75.8 + 5.4 a
C x M 20.7 + 2.2 bc
19.4 + 5.6 c
0.56 + 0.13 ab
68.4 + 7.6 b
34.4 + 13.0 c
C x C 20.1 + 1.5 c
16.5 + 3.2 c
0.50 + 0.10 b
72.5 + 26.7 ab
32.1 + 16.3 c

Harvest Results (12 months) – Family A
0
20
40
60
80
100C
omm
erci
al G
rade
(%)
Pasta 7/8" 1"
1" 11 33 6 37/8" 40 38 21 14Pasta 49 29 73 83
M x M M x C C x M C x Cb
a
b
a
a
b
bc
b
a
c
b
a
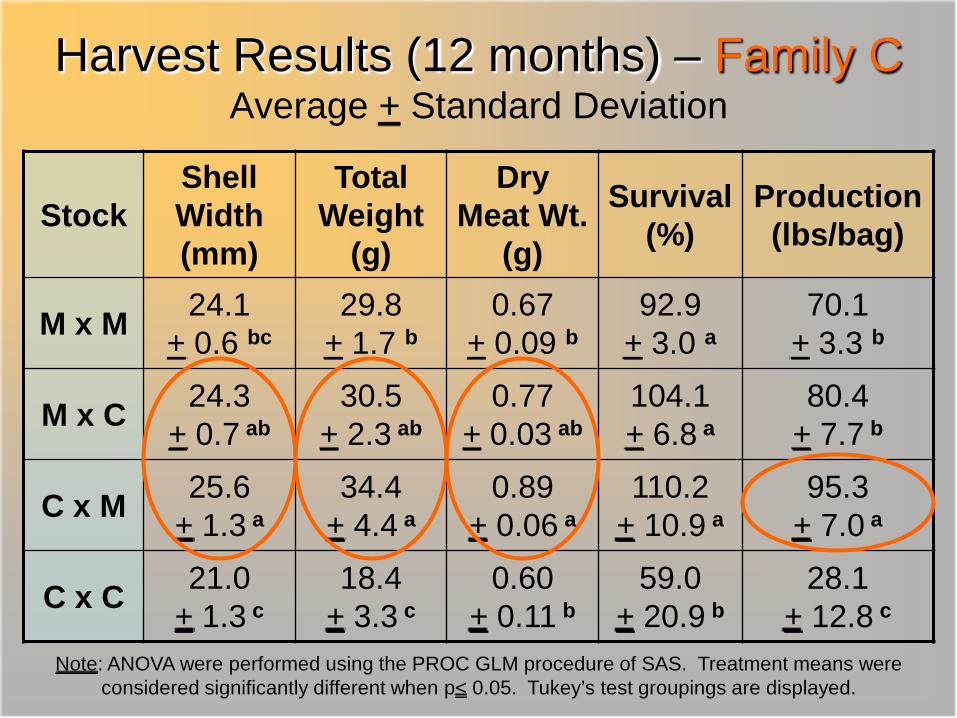
Harvest Results (12 months) – Family C Average + Standard Deviation
Note: ANOVA were performed using the PROC GLM procedure of SAS. Treatment means were considered significantly different when p< 0.05. Tukey’s test groupings are displayed.
Stock Shell Width (mm)
Total Weight
(g)
Dry Meat Wt.
(g)
Survival (%)
Production (lbs/bag)
M x M 24.1 + 0.6 bc
29.8 + 1.7 b
0.67 + 0.09 b
92.9 + 3.0 a
70.1 + 3.3 b
M x C 24.3 + 0.7 ab
30.5 + 2.3 ab
0.77 + 0.03 ab
104.1 + 6.8 a
80.4 + 7.7 b
C x M 25.6 + 1.3 a
34.4 + 4.4 a
0.89 + 0.06 a
110.2 + 10.9 a
95.3 + 7.0 a
C x C 21.0 + 1.3 c
18.4 + 3.3 c
0.60 + 0.11 b
59.0 + 20.9 b
28.1 + 12.8 c

Harvest Results (12 months) – Family C
0
20
40
60
80
100Co
mm
erci
al G
rade
(%)
Pasta 7/8" 1"
1" 31 30 54 57/8" 47 45 33 19Pasta 22 25 13 76
M x M M x C C x M C x Cb
a
b
b
a
b
a
ab
b
c
b
a

Growers Site Comparisons Cedar Key, Florida
High-density Lease Areas
2009
Temp oF (+ SD)
Salinity ppt (+ SD)
June 85.3 (2.6) 19.5 (5.7) July 86.2 (2.1) 18.8 (4.5)
August 86.8 (2.6) 26.3 (1.9)
2009
Temp oF (+ SD)
Salinity ppt (+ SD)
June 85.8 (2.5) 21.2 (3.1) July 86.3 (2.1) 21.8 (2.8)
August 86.6 (2.5) 25.4 (1.6)
Pelican Reef Lease Area
Dog Island Lease Area

Harvest Results(12 months) – Grower A Average + Standard Deviation
Note: T tests were performed using the PROC TTEST procedure of SAS. Treatment means were considered significantly different when p< 0.05.
Stock Shell Width (mm)
Shell Length (mm)
Total Weight
(g)
Survival (%)
Production (lbs/bag)
M x M (Family A)
21.9 + 0.2 b
41.9 + 0.5 b
22.7 + 0.7 b
52.2 + 8.5 b
31.3 + 5.0 b
M x C (Family A)
25.7 + 0.9 a
46.9 + 1.7 a
34.5 + 3.4 a
90.2 + 6.6 a
82.0 + 5.0 a
M x M (Family C)
23.3 + 0.4 b
42.1 + 1.0 b
25.0 + 1.6 b
49.9 + 7.3 b
33.2 + 6.8 b
C x M (Family C)
24.6 + 0.2 a
43.5 + 0.6 a
28.8 + 0.4 a
86.2 + 20.8 a
65.1 + 15.0 a

Grade (12 months) – Grower A
0
20
40
60
80
100Co
mm
erci
al G
rade
(%)
Pasta 7/8" 1"
Family A A C C1" 5 43 14 387/8" 46 40 50 48Pasta 49 17 36 14
M x M M x C M x M C x M
a
a
b a
a
b
b
a
a
a
a
b

• Document shelf life – Survival in refrigerated
storage (45oF)
Product Quality
• Consumer acceptance • Sensory evaluation
and profiling

Shelf Life: Survival in 45oF Storage Average of Families A,B,C – Harvested at 84.6oF
0
10
20
30
40
50
60
70
80
90
100
Surv
ival (
%)
0 2 4 6 8 10Days
M x M M x C C x M C x C
Note: A repeated measures analysis (PROC GLIMMIX) was performed (p<0.0001).
a a a
b
a
ab
b
c
99%
88%
70%
16%
39%
0
10
20
30
40
50
60
70
80
90
100
Gap
ping
(%)
0 2 4 6 8 10Days
M x M M x C C x M C x C
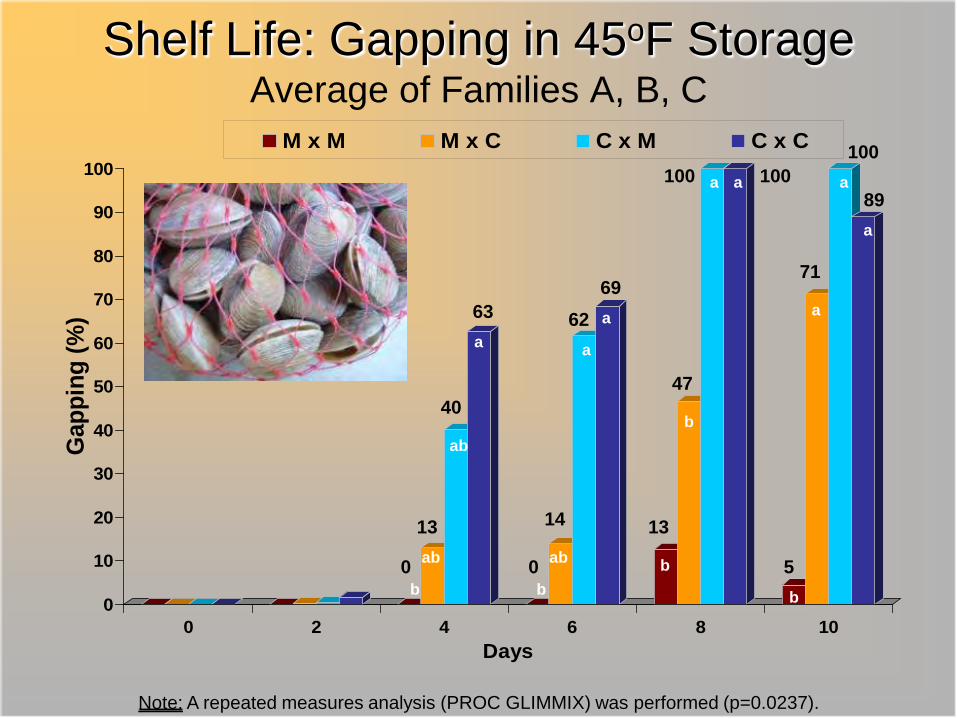
Shelf Life: Gapping in 45oF Storage Average of Families A, B, C
Note: A repeated measures analysis (PROC GLIMMIX) was performed (p=0.0237).
b
ab
ab
a
b
ab
a
a
b
b
a a
b
a
a
a
0
13
40
63
0
14
62 69
13
47
100 100
5
71
100
89
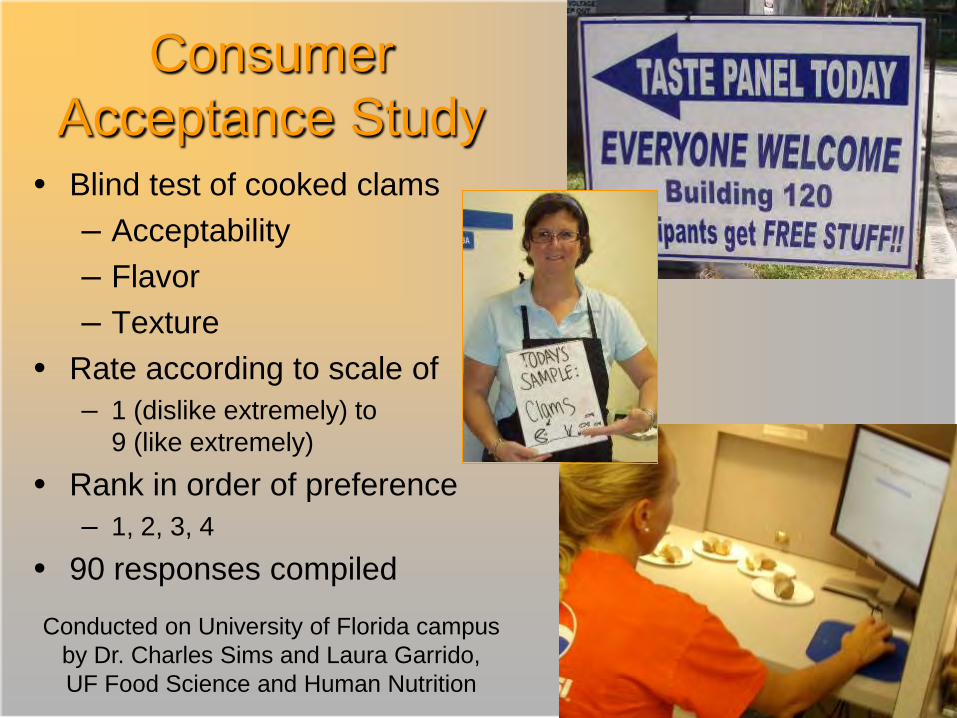
Consumer Acceptance Study
• Blind test of cooked clams – Acceptability – Flavor – Texture
• Rate according to scale of – 1 (dislike extremely) to
9 (like extremely) • Rank in order of preference
– 1, 2, 3, 4 • 90 responses compiled
Conducted on University of Florida campus by Dr. Charles Sims and Laura Garrido, UF Food Science and Human Nutrition

Consumer Acceptance Results
* No significant differences among clam stocks
Stock Acceptability* Flavor* Taste*
M x M 5.8 5.6 5.4
M x C 6.0 5.8 5.7
C x M 5.6 5.6 5.4
C x C 5.8 5.6 5.4
Stock M x C** C x C M x M C x M** Ranking 195 222 239 244
Analysis b ab ab a ** Friedman Analysis of Rank and Tukey’s HSD at 5% significance level

Sensory Evaluation and Profile • Blind tasting by UF
trained panel using standards
• Characterization of raw clams – Appearance – Aroma – Basic Tastes – Flavor – Aftertaste – Texture, Meat – Mouth feel
• Scale of 1-10
Conducted by Dr. Steve Otwell and Laura Garrido, UF Aquatic Food Products Lab

Results: Sensory Profile of Raw Clams
Ratings Scale M x M M x C C x M C x C Appearance 1-10 Volume of Flesh Not covered-Full 5.50 6.58 7.25 7.5 Plumpness Flaccid-Plump 6 6.25 6.83 6.83 Aroma 1-10 Briny Not-Extremely 4.25 3.25 3.42 7.50 Metallic Not-Extremely 3.25 1.5 1.50 6.83 Basic Tastes 1-10 Salty Not-Ext. (>10) 10.08 10.25 10.58 10.50 Umami Not-Extremely 3.75 4 3.08 4.17 Flavor 1-10 Seaweed Not-Extremely 2.33 2.92 3 3.5 Chicken-Liver-Like Not-Extremely 2.75 2.67 2.58 2.42 Earthy Not-Extremely 1.83 1.83 2 2 Aftertaste 1-10 Metallic Not-Extremely 3.5 3 2.83 2.17 Astringent Not-Extremely 2.08 1 1.75 2.08 Texture, Meat 1-10 Firmness Mushy-Ext.Firm 6.08 5.58 6.50 7 Chewiness Not-Extremely 4.92 5.42 5.83 6.60 Mouthfeel 1-10 Detect Grit Not-Extremely 2.42 1.33 2.00 0.90

Sunshine Clam (M X C) TropiClam (C X M)
Summary • Hybridization may offer improved
clam production performance – MxC ↑ SW and DryMtWt
• Genetic background played a significant role in responses – Family A, MxC ↑ SW,TW, DMtWt, Prod – Family C, CxM ↑ SW,TW, DMtWt, Prod
• Environmental conditions at growing sites also played a role in responses – Grower A, Hybrids > MxM
• Shelf life acceptable – 10 days for MxC, 8 days for CxM
• Gapping in refrigerated storage problematic – By day 8 for MxC, day 4 for CxM

Acknowledgements • University of Florida
– Dr. Steve Otwell, Laura Garrido, Dr. Charles Sims, Reggie Markham, Barry Clayton, Russ Colson, Charles Mulligan
• Harbor Branch Oceanographic Institute at FAU – Dr. Susan Laramore, Fredrico Prahl
• Industry partners – Steve Hostetter, Barry Hurt, Chad O’Steen, Johnny
Sheridan, Doug Telgin, Chris Taiani, Rick Viele – Cedar Key Aquaculture Farms, Dog Island Blues Clam Co.
• Cedar Key Aquaculture Association • Supported by USDA CSREES Special Research
Grants Program

• Initial report on backcrossing F1 hybrids with hard clams, 2009-10
– Spawning – Land-based nursing – Field nursing
See you next year!