
Results of an AI 09 Simulation Validation and Handling ...
29
NASA Technical Memorandum 101 062 USAAVSCOMTechnical Report 88-A-002 I - Results of an AI 09 Simulation Validation and Handling Qualities Study Michelle M. Eshow, Aeroflightdynarnics Directorate, U.S. Army Aviation Research and Technology Activity, Ames Research Center, Moffett Field, California Diego Orlandi Giovanni Bonaita, Costruzioni Aeronautiche G. Agusta, Cascina Costa (VA), Italy Sergio Barbieri, Italian Air Force/D.A.S.R.S.-R.S.V., Pratica di Mare (ROMA), Italy May 1989 NationalAeronautics and Space Administration US ARM AVIAT10 SYSTEMS COMMAND Ames Research Center Moffett Field, California 94035 AVIATION RESEARCH AND TECHNOLOGY ACTIVITY MOFFETT FIELD. CA 94305-1099
Transcript of Results of an AI 09 Simulation Validation and Handling ...

NASA Technical Memorandum 101 062 USAAVSCOM Technical Report 88-A-002
I -
Results of an A I 09 Simulation Validation and Handling Qualities Study Michelle M. Eshow, Aeroflightdynarnics Directorate, U.S. Army Aviation Research and Technology Activity, Ames Research Center, Moffett Field, California
Diego Orlandi Giovanni Bonaita, Costruzioni Aeronautiche G. Agusta, Cascina Costa (VA), Italy Sergio Barbieri, Italian Air Force/D.A.S.R.S.-R.S.V., Pratica di Mare (ROMA), Italy
May 1989
National Aeronautics and Space Administration
US ARM AVI AT10 SYSTEMS COMMAND
Ames Research Center Moffett Field, California 94035
AVIATION RESEARCH AND TECHNOLOGY ACTIVITY MOFFETT FIELD. CA 94305-1099

Abstraet The results of a research program conducted to validate a mathematical model of the Agusta A109 he-
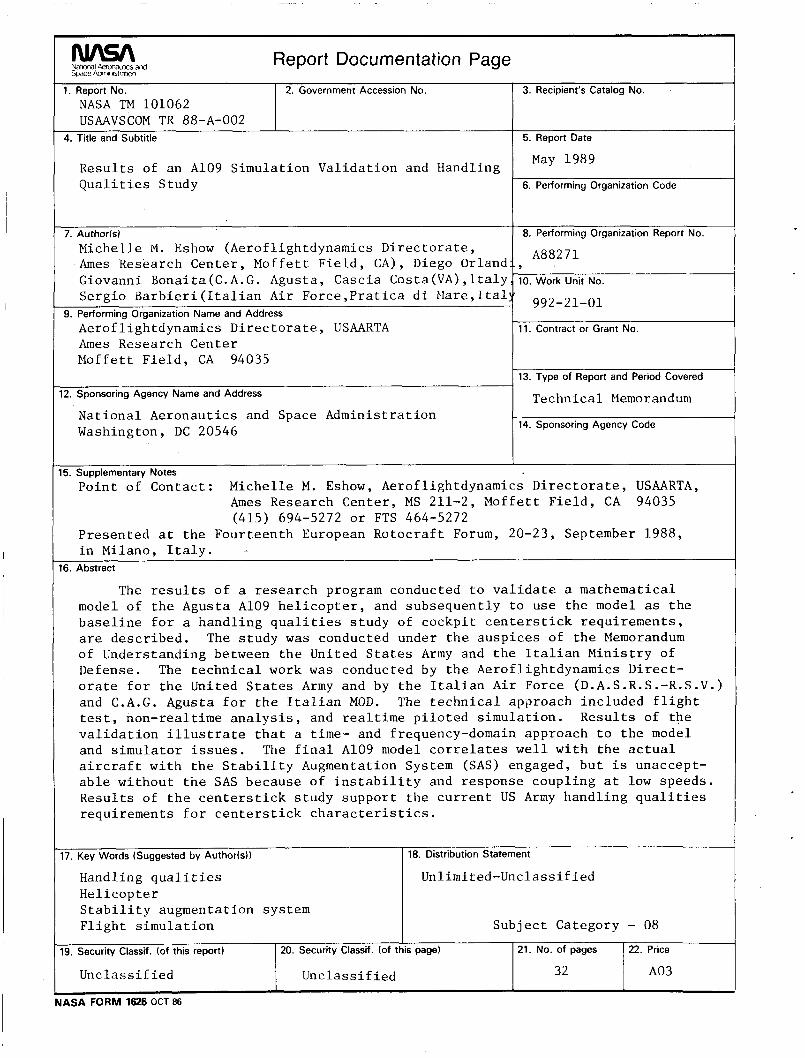
licopter, and subsequently to use the model as the baseline for a handling qualities study of cockpit centerstick requirements, are described. The study was conducted under the auspices of the Memorandum of Understanding between the United States Army and the Italian Ministry of Defense. The technical work was conducted by the Aemflightdynamics Directorate for the United States Army and by the Italian Air Force (D.A.S.R.S.-R.S.V.) and C.A.G. Agusta for the Italian MOD. The technical approach included flight test, non-realtime analysis, and realtime piloted simulation. Results of the validation illustrate that a time and frequency-domain approach to the model development and correlation, followed by a systematic piloted evaluation, can provide valuable insight into model and simulator issues. The final A109 model correlates well with the actual aircraft with the Stability Augmen- tation System (SAS) engaged, but is unacceptable without the SAS because of instability and response coupling at low speeds. Results of the centerstick study support the current US Army handling qualities requirements for centerstick characteristics.
1. Introduch 'on Realtime piloted simulation is becoming of ever-increasing importance both in the industry and in gov-
ernment research environments because of its inherent cost effectiveness, flexibility, and safety. Rotorcraft man- ufacturers have begun to use simulation extensively in the development of new or modified aircraft, especially in the areas of control system design and handling qualities prediction. Government research has long included sim- ulation to investigate new control design methodologies, new mission requirements, and in particular, to develop the specifications for handling qualities which new aircraft must meet.
A major ingredient of piloted simulation is the mathematical model of the aircraft contained in the com- puter. Whether the model represents an existing helicopter, a generic one, or a new concept, it must be accurate for the simulation results to be exrrapolated reliably to the actual flight environment. The quantification of the re- quired accuracy, model complexity, and the degree to which other simulation components, for example the visual and motion systems, may reduce the model's significance, are important questions that motivated this research.
Mathematical model validation has been performed extensively for a variety of helicopters and model representations. Approaches usually include timedomain comparison with flight data, and frequency-domain comparison when possible. One example is the UH-60 GENHEL model, which has been very extensively validated (ref. 1). The validation is occasionally extended to piloted simulation in order to compare pilot behavior and perceptions in the two environments. This was done quite successfully for the VSRA Harrier research aircraft (ref. 2), but in many other cases has proved to be difficult to do systematically.
The first objective of this study, therefore, was to develop and validate, using both analysis and piloted simulation, a realtime model of the Agusta A109 helicopter, shown in figure 1. The model was based on a generic realtime helicopter model developed by the US Army, and the validation made extensive use of A109 flight-test data. It was expected that the experience gained from this validation could be applied to other rotorcraft model developments to reduce the effort required, and that guidance could be given as to which areas of development are most fruitful.
The second objective of the study was to use the validated A109 model as the baseline for a handling qualities simulation investigation of the requirements for centerstick force characteristics for nap-of-the-Earth (NOE) tasks. The goal of this experiment was to provide further validation of the force requirements contained in the new US Army Helicopter Handling Qualities Specification (ref. 3).
The paper is organized as follows: first, the model development and response validation are summarized and the final correlation between the model and the actual aircraft is presented. The piloted validation flight tests and simulation are then described, followed by a summary of the centerstick study. Finally, some conclusions and model development guidelines are discussed.
4 2 A
The Agusta A109 is comprised of a family of multipurpose helicopters ranging from the executive MKII Widebody to the military "K" version. The A109 has a four-bladed, articulated main-rotor system and is powered by two Allison or Turbomeca turbine engines. The maximum gross weight is about 6OOO lbs, and the maximum cruise speed is about 150 knots.
1

The A109 mathematical model was based on a generic, single-main-rotor helicopter model developed by the US Army and the National Aeronautics and Space Administration (NASA) and known as ARMCOP (ref. 4). The ARMCOP model is a nonlinear, force-and-moment representation with modules of equations for each aircraft component, for example the main rotor, tail rotor and empennage, fuselage, engine, and control system. The model has 10 degrees of freedom: 6 for the rigid body. 3 for the main rotor tip-path plane orientation and coning, and 1 for the rotor speed variation from the engine (not used in this study). The main rotor is modeled analytically including flapping dynamics and with the choice of uniform or first-harmonic inflow. The rotor flapping and force and moment equations contain explicit design parameters such as hinge offset, pitch-flap coupling angle, and blade Lock number.
The ARMCOP model has been applied to various aircraft (ref. 5 ) and used extensively in piloted simulation by NASA and the US Army (refs. 6 and 7). Each application requires the specification of about 90 physical, dynamic, and aerodynamic parameters. However, because of the many simplifications and approximations used in the model, the correct specification of the parameters for a particular helicopter does not guarantee that the resultant model response will be correct. The object of the model validation effort was to determine the parameter adjustments and model enhancements necessary to match the model and aircraft responses. An approach was taken in which the adjustments and enhancements were made using a physical understanding of the primary effects of each variation, and the resulting responses were examined graphically.
Extensive flight tests were performed on an instrumented A109K at Agusta to gather a base of flight-test data for comparison with the model. Trim, single-axis step, impulse, and frequency sweep data were collected at hover and at 40 and 80 knots, with and without the Stability Augmentation System (SAS) engaged, and at three longitudinal center-of-gravity (cg) locations. The parameters which were recorded included cockpit control and swashplate positions, attitudes and angular rates, linear veIocities and accelerations, main-rotor flapping and lag- ging, main- and tail-rotor mast torques, and angles of attack and sideslip. Feeding all the four actual control-input time histories for corresponding test conditions into the A109 ARMCOP model, the model and flight responses could be compared directly.
In general, the approach entailed an iterative examination of the trim and step-response correlations result- ing from successive parameter adjustments and model improvements. The model enhancements became necessary when no value of a parameter would yield acceptable correlation. For example, one of the largest enhancement efforts was to replace the simple fuselage aerodynamic equations with wind tunnel data tables of fuselage forces and moments as a function of angle of attack and sideslip. This enhancement required wind tunnel tests at Agusta with a concentration on high angles such as the fuselage experiences in hover, when it is under the downwash of the main rotor. Inclusion of the tables markedly improved the trim attitude correlation.
A summary of the principal parameters and model enhancements which were used in the correlation, and their trim and dynamic effects, is presented in table 1. It should be noted that some of the parameten requiring adjustment are quite well known for the A1 09. Thus. the change was not a question of finding the correct physical magnitude of the parameter, but of finding an appropriate value that worked well in the face of other simplifications in the model. For example, the flapping hinge offset for the A109 is 2.74, but for the model was reduced to 2.0% in order to match the short-term pitch and roll-response time Constants, given that the rotor model does not include the lead-lag or any structural dynamics.
An important element of the model development was the inclusion of the A 109 SAS in the control system representation. (The helicopter is usually flown with the SAS on.) A digital model of the SAS was developed based on @roprietary) engineering block diagrams provided by the avionics contractor for the A109. The SAS provides rate and attitude damping with optional attitude hold in pitch and roll, and rate damping plus turn coordination in yaw through limited-authority series actuators. Integration of the SAS into ARMCOP allowed comparison of model and flight behavior in the SAS-on configuration.
Finally, to add more realism to the model, a ground- effects representation was developed based on the methods in reference 8. and integrated into the A109 ARMCOP. The groundeffects model replicates the cush- ioning effect of the ground plane by predicting the reduction in shaft power required and the increase in thrust produced at low altitudes and speeds.
3. Correlation Results Examples of the final quantitative correlation between the ARMCOP A109 model and the flight tests are
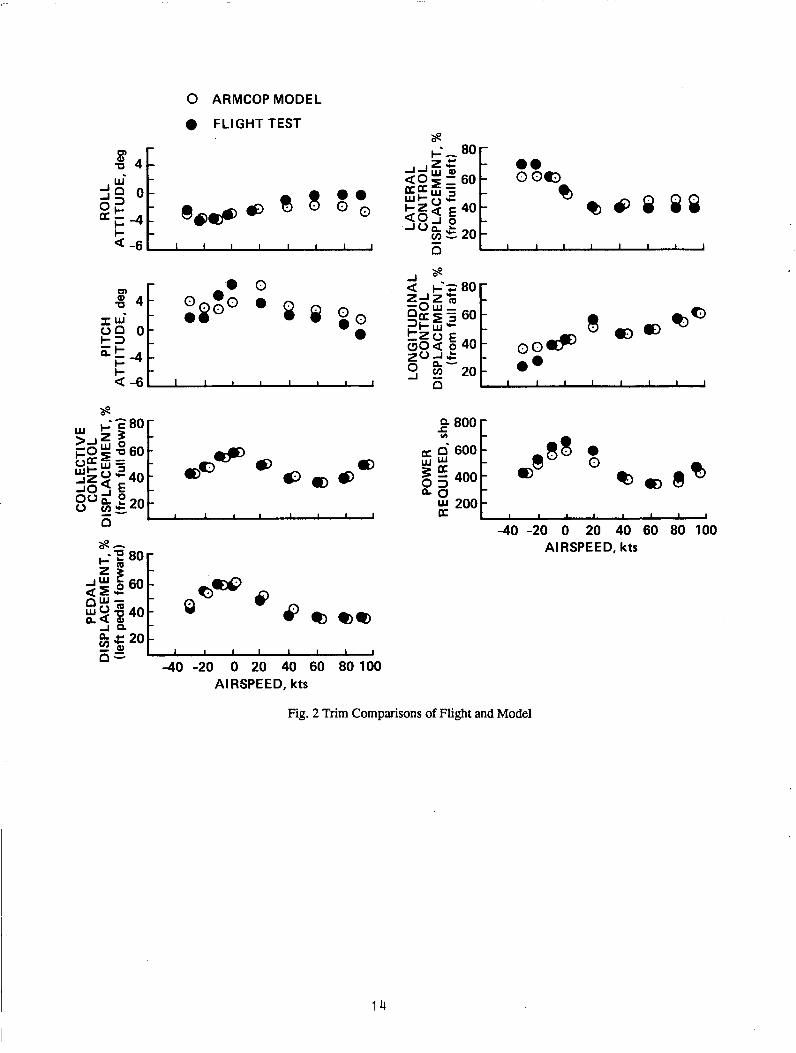
presented in figures 2 through 11. First, the trim correlation is presented for both rear and forward flight (fig. 2).

It can be seen that the trim match is in general excellent. However, while the quality of the trim match provided confidence in the kinematic and aerodynamic modeling, it was not found to be a strong predictor of good dynamic response correlation. That is, the fuselage and surface aerodynamics, which strongly affect the trim, were found to be a second-order dynamic effect when compared with the main-rotor and control system modeling.
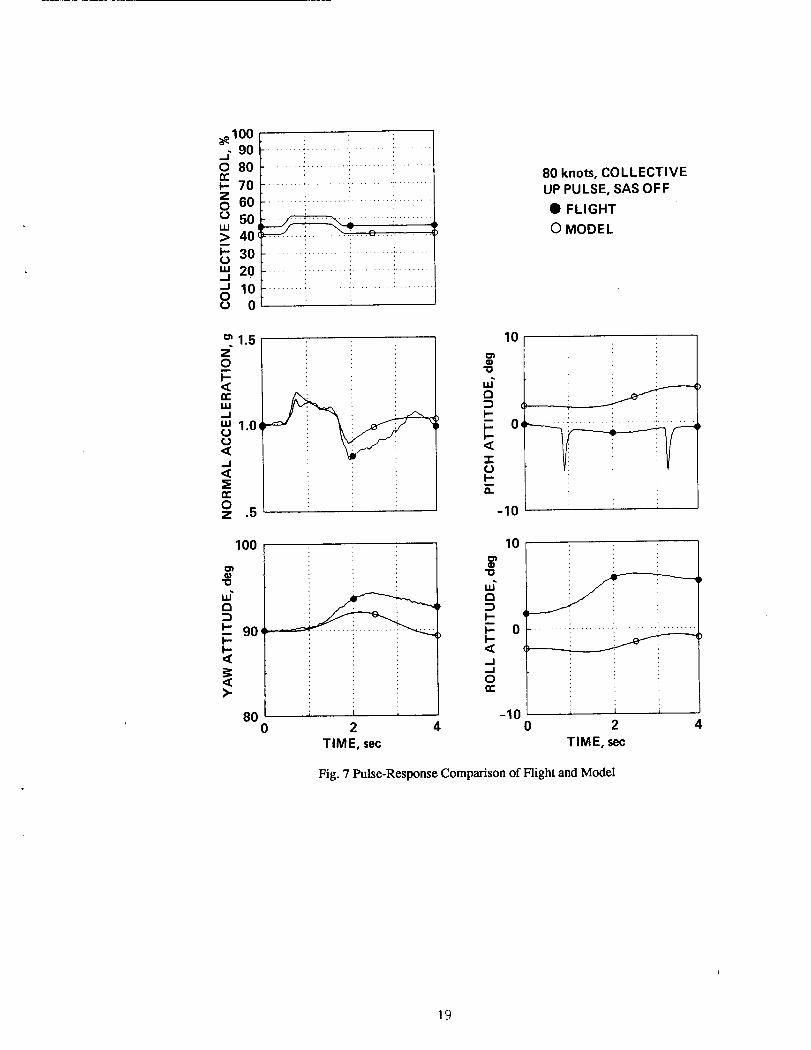
Figures 3 through 7 provide examples of the time-domain correlation at hover and at 80 knots, with the SAS off. All four of the pilot-control time histories were fed into the model for a direct comparison. Although the objective was to make an input into only one axis, circumstances sometimes forced pilot stabilization in the other axes. (It should also be noted that, because of a lately discovered flight data conversion error, the time histories of the flight roll attitude include a bias of positive 2.5 degrees, which accounts for much of the steady offset in roll between the model and flight data.) For these SAS-off cases it is seen that, in general, the responses for the axis in which the primary input was made (the on-axis) are in quite close agreement. The coupled responses in the other axes, however, exhibit discrepancies of varying magnitude. In particular, the hover SAS-off case indicates a higher degree of response coupling and instability in the model than in the aircraft. This flight condition is the one in which the main rotor has the highest influence. The correlation was found be highly sensitive to the rotor inflow modeling; the first-harmonic inflow, which takes into account the longitudinal inflow variation over the rotor disk, provided the best overall match. As presented in figures 5 through 7, the agreement generally improves with increasing airspeed, in which both the model and aircraft become more stable. The off-axes matches are assumed not as critical when the magnitudes of both the model and aircraft responses are small compared with the on-axis.
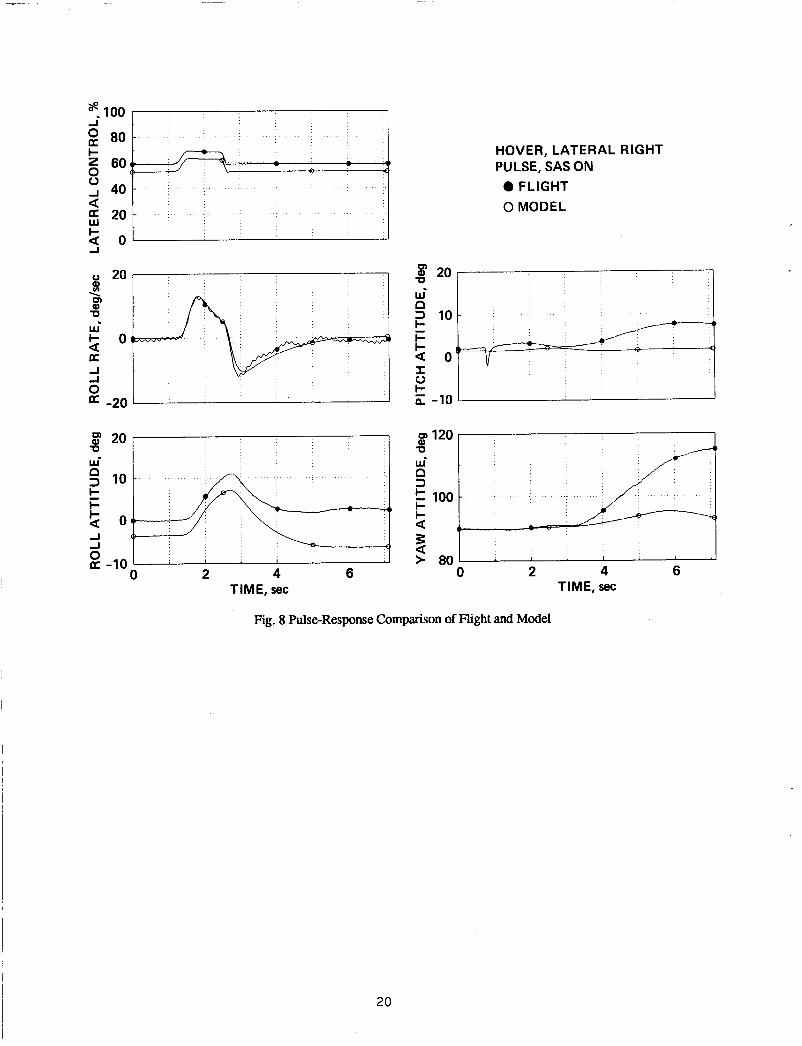
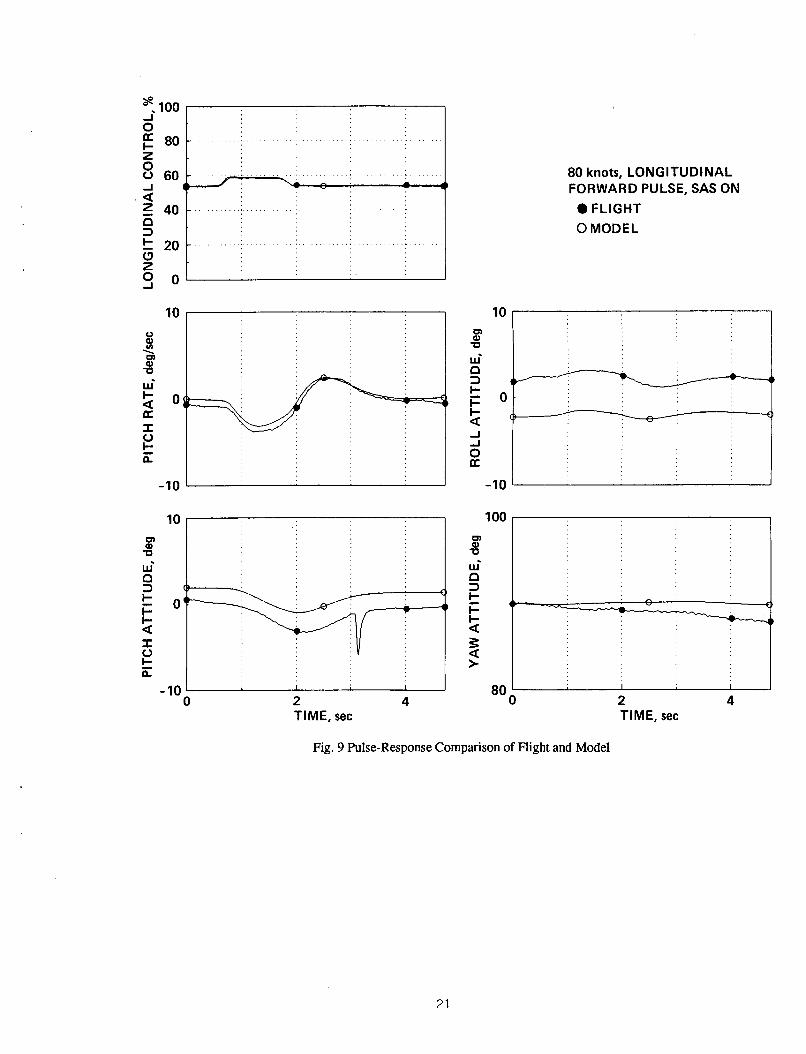
Next, figures 8 and 9 provide similar correlation examples, with the SAS on and Attitude Hold on. The responses are now much better damped, of course, and the flighvmodel correlation is improved. No changes in the SAS parameters from the actual flight system were necessary to achieve these results.
To provide further quantitative correlation, frequency-domain analysis was conducted on the aircraft and model responses using Fast-Fourier Transform (FIT) and transfer function modeling techniques developed by the US Army (ref. 9). Pilot-generated frequency sweeps were conducted on the aircraft, and the FRESPID program was used to determine the frequency response of the on-axis angular rate to the control input. For the model, both computer-generated frequency sweeps and white noise were used as inputs, and the on-axis attitude frequency response was determined, again using FRESPID. Both SAS-on and SAS-off conditions were analysed. Since the model tended to diverge under long inputs with the SAS off, all runs were conducted with it on. The SAS-off characteristics were obtained by simply using the swashplate rather than the stick as the input in the FRESPID analysis. The swashplate position was then scaled to refer it to equivalent percent of pilot input.
All of the model analysis was conducted with 50 msec of pure time delay between the swashplate or control input and the vehicle response. This was done to match the time-domain correlation of the model and flight responses and is representative of unmodeled actuator and filter dynamics. The model had a 50 msec frame time for the frequency-domain analysis.
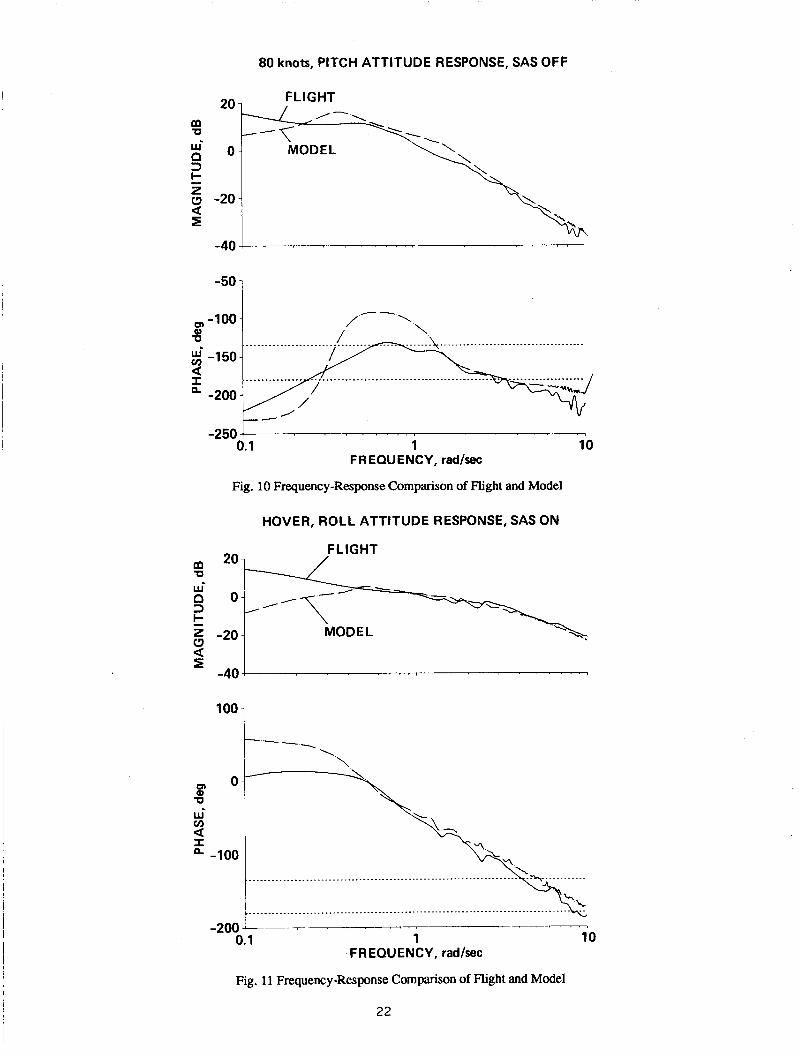
Figure 10 presents sample results for the 80 knots, SAS-off. pitch-attitude response correlation. The model and flight magnitude responses match adequately above 0.5 rad/sec, and below that the quality of the model identi- fication is not good. The magnitude slopes are essentially parallel beyond 2 rad/sec, indicating correct attenuation of the input at these frequencies. The approximately 2 dB offset between the curves at high frequency indicates about a 20% discrepancy in the pitch control sensitivity at this airspeed.
The model and aircraft phase curves show a rise in phase in the low- and mid-frequency regions, indicating that the dominant attitude response at these frequencies is unstable for both. The steeper rise of the model's phase indicates that it is more unstable than the aircraft. The high-frequency phase correlation is adequate but indicates a slightly higher time delay for the aircraft than the model, in spite of the 50 msec of pure delay which had been introduced in the model.
The hover, SAS-on, roll attitude response correlation is presented in figure 11. Excellent matching of the magnitude and phase curves is evident beyond 0.5 rad/sec, and the quality of the identifications are good throughout the frequency range shown. The magnitude curves are superimposed in the high frequencies, indicating correct control sensitivity. Using the handling qualities definition of bandwidth as the point where the phase reaches -135 deg (ref. 3). the attitude response bandwidth of the model is about 5 rad/sec, while that of the aircraft is about 4 rad/sec. Again, the time delay of the model appears to be less than the aircraft, though the difference is not as pronounced as for the SAS-off case.

These hover SAS-on responses were analysed using the NAVFIT program (ref. 9), which fits lower-order equivalent transfer functions to frequency response curves. Over the frequency range of 0.8 to 10 rad/sec, the model’s roll angle response to lateral cyclic stick was found to be:
10.27 e-.075s -- - 47lIGTiCl
So (s+ 1.34)(s+ 5.67)
where the exponent .075 indicates the approximate pure time delay of 75 msec between the control input and model response. This was a fixed parameter in the identification. arrived at from the combination of the 50 msec of inten- tional pure control delay programmed into the model and an additional 25 msec representing half of the computer frame time of 50 msec. Fixing of the time delay parameter was necesary to avoid identifying unrealistically low
For the aircraft, with all parameters left free in the identification, the describing transfer function between
9.9 1 e- 082
I values for it, given that there are four parameters being used to identify one degree of freedom.
0.8 and 10 rad/sec was: -- 4 o / c - 6, (s+ 1.36)(s+ 5.13)
Thus, the aircraft time delay was determined during the fit to be 82 msec. These transfer functions quantify the excellent on-axis correlation between the model and aircraft in the SAS-on, Attitude Hold-on condition in the mid- and high-frequency range. In the low-frequency region, the match was relatively poor but was assumed to be not as important for pilot-in-the-loop NOE handling qualities evaluations.
I The results of the response correlations are summarized as follows:
1. The short-term, or high-frequency, on-axis response of the model was quite good.
2. The long-term on-axis response, especially in pitch and roll, exhibited errors of varying magnitude, al- though the trim comparisons were very good.
3. The off-axis correlation was not adequate and was difficult to improve.
4. The correlation improved with increasing airspeed.
5. The SAS markedly improved the correlation for both the on- and off-axes, especially at hover.
4. Piloted Validation
The objective of the piloted model validation was to compare pilot perceptions and acceptance of the model with the aircraft. In this way, insight could be gained regarding those aspects of the model response that are most important to the pilots, and the effects of other simulator components, such as the visual and motion cues.
The validation was comprised of a combination of flight test and realtime simulation. Test pilots flew a well-defined set of NOE tasks, first in an A109 at Agusta, and then in a simulator at NASA Ames Research Center, all in a period of 7 weeks. The same test pilots and task definitions were used both in flight and simulation to provide a common basis for the subjective comparison between the aircraft and the model.
The following subsections describe the flight tests, simulation facility and procedures, and validation re- sults.
4.1 Validation Flight Tests The validation flight tests were conducted in Italy 2 weeks before the beginning of the piloted simulation.
Three test pilots participated. Pilot A was an Agusta test pilot who flies the A109 daily. Pilot B was an Italian Air Force officer and test pilot with considerable flight time on Agusta helicopters. Pilot C was a NASA engineering test pilot with no previous A109 flight time but with extensive experience in the Ames simulation facilities.
The major objectives of the flight tests were to define, perform, and collect data for a series of NOE maneuvers which would reveal the handling qualities of the A109 and which could be replicated in the simulator in terms of the task geometry as well as the aggressiveness and performance levels. The simulator considerations were important because the lack of field-of-view and detailed cues available from the simulator’s computer-generated imagery can limit the aggressiveness and precision of nearearth maneuvers. The types of limitations, for example the maximum pitch-up angle in a quickstop, are different from those arising from safety-of-flight issues.
I
I 4

The tasks identified and performed were: precision hover, hover turn, longitudinal dash/quickstop, lateral sidestep, bob-up/bob-down, and a slalom course. Illustrations and performance standards for the maneuvers are presented in figure 12. The tasks were defined, measured, and marked on a field adjacent to the Agusta plant. The measurements were recorded for later duplication on the ground-based simulator. The task performance parameters were then defined based on preliminary flights and consideration of simulator capabilities. Especially important were those affecting aggressiveness, such as the total time required for each maneuver.
All of the tasks except for the slalom, plus a dolphin maneuver, were also performed with the same ge- ometry on the Agusta NOE course, a tree-lined golf course near the plant. The NOE golf course provided the opportunity to perform the tasks continuously in a stressful environment with obstacles, and so was valuable in revealing more realistic aircraft handling qualities associated with NOE flight.
The three pilots performed all of the tasks several times, both with the SAS off and with the SAS on but the Attitude Hold (ATTH) off (normal for maneuvering flight in the A109). The control force gradients were disengaged at all times using the magnetic brake switch, so that only friction and damping were present in the centerstick and pedals. Disengaging the forces also changed the dynamic paths in the SAS, providing a higher degree of rate stabilization than with the forces on. This proved to be an important detail during the simulation.
Each pilot provided comments and a Cooper-Harper Handling Qualities Rating (HQR) (ref. 10) for each task and each SAS configuration. Flight data were also collected for most of the flights. The recorded parame- ters included control positions, attitudes, angular rates, linear accelerations, torque, and airspeed. The total time required to perform each maneuver was also noted.
4.2 Piloted Validation Simulation
Facility. The piloted simulation was conducted in a five-week period in the fixed-base simulator cockpit shown in figure 13. This facility is part of the Ames Vertical Motion Simulator (VMS); however, the motion system was under modification during this period and so was not available. All of the other VMS components were employed. These included a four-window computer-generated image (CGI) with both an NOE area and a runway scene, programmable hydraulic control loaders for a conventional centerstick, pedals, and collective, and a sound generator to simulate generic rotor noise in the cab.
Elements of the CGI’s NOE scene were used to define each of the tasks that had been done in the A109 flight tests. For example, a canyon with a slight left turn was used for the dash/quickstop, and a gridded area with trees 100 ft apart was used for the sidestep. As much visual content in terms of grids or coarse texture was included as the CGI system was capable of, to maximize position and altitude cueing. The runway scene was used to replicate the slalom. Eighty-foot-high pylons were placed just as the small markers had been in flight, and were divided into 10-ft colored sections to provide altitude cues. Also important to note is that a delay compensation algorithm was used which removes much of the intrinsic 100 msec of time delay between the model and CGI responses (ref. 11). Because of other simulator delays such as those associated with digitaVanalog conversions, the 50 msec of pure time delay which had been used for the model correlation was removed for the piloted simulation. Because of computer and realtime considerations, the frame time was increased to 68 msec.
An important contributor to pilot acceptance of a simulation is the match of the controller force-feel char- acteristics. Based on detailed data provided by Agusta, all of the cockpit controls were set as close as possible to the A109 values. This included the gradient, breakout (preload), friction and damping with the forces engaged and the friction and damping with the forces disengaged. The simulator control characteristics are presented in table 2. The control loaders were carefully calibrated and were rebalanced several times each day. For consistency with the maneuvering flight tests, which were conducted with the control forces disengaged, the simulation tasks were performed with the noted friction and damping present in the centerstick, but with no gradient or breakout.
Simulation Conduct.The simulation began with pilot familiarization with the A109 model and with the simulator. Considerable time was spent in informal examination of the aircraft responses for the various SAS modes and at all airspeeds, followed by familiarization with the tasks. During this process, several model de- ficiencies were noted by all of the pilots. First, attitude retrimming in the SAS-on mode seemed impossible, especially at high airspeeds. This was determined to be due to the SAS model, which did not include the trim actuators that in effect increase the SAS authority by recentering its actuators as the trim conditions change. To account for this, the SAS authority was increased by a factor of four, from about 10% to about 40%, which is equivalent to assuming instantaneous trim actuator response. The SAS behavior was then judged correct by the pilots.
The pilots also remarked that the roll and collective sensitivities seemed too high compared with the real A109. Although these sensitivities appeared correct from the off-line correlation, it is common in the limited-cue environment of a simulator for adjustments to be necessary. The roll sensitivity was reduced by one-quarter and the collective by one-third, in accordance with pilot comments.
As mentioned previously, the SAS response depends both on whether or not Attitude Hold is selected, as well as on whether or not the cockpit control forces are engaged through the magnetic brake switch. The off-line correlation had been done for the case of ATTH-on and forces engaged both in the model and in the flight data, however, the maneuvering flight tests were all done with ATTH-off and forces disengaged, which provides a more maneuverable, less stabilized response. As an illustration, figure 14 shows a sample model step response for the three SAS-on cases of: ATTH-on, ATTH-off with forces disengaged, and ATTH-off with forces engaged. The third case will become important in the discussion of the centerstick study. Based on preliminary pilot comments indicating a preference for the AlTH-on case in the simulator, it was decided to perform all of the tasks in three configurations: 1) SAS-off; 2) SAS-on, A'ITH-off, and forces disengaged through the magnetic brake switch, which was the flight test SAS configuration; and 3) SAS-on, ATTH-on.
The pilots flew each of these three configurations for each task. Many repetitions were made to minimize mining effects. Time history and on-line statistical data were collected. The statistics were used to confirm that the tasks were being performed with the same level of aggressiveness as they had been in flight, and, if possible, to adjust the aggressiveness as necessary.
Pilots provided one rating for each configuration and task combination. They also provided comments regarding the vehicle characteristics and task performance compared with flight, their perceptions of the simulator environment, and the realism of various phenomena such as ground effects and tail rotor wake interference.
5. Piloted Validation Results
The results of the piloted validation are now discussed starting with each of the three SAS configurations. Pilot comments are summarized and general performance comparisons between flight and simulation are made. Simulator effects are then discussed with dependence on task noted, followed by a summary of pilot comments regarding phenomena modeling and a summary of the results.
5.1 SAS-Off Confieuration
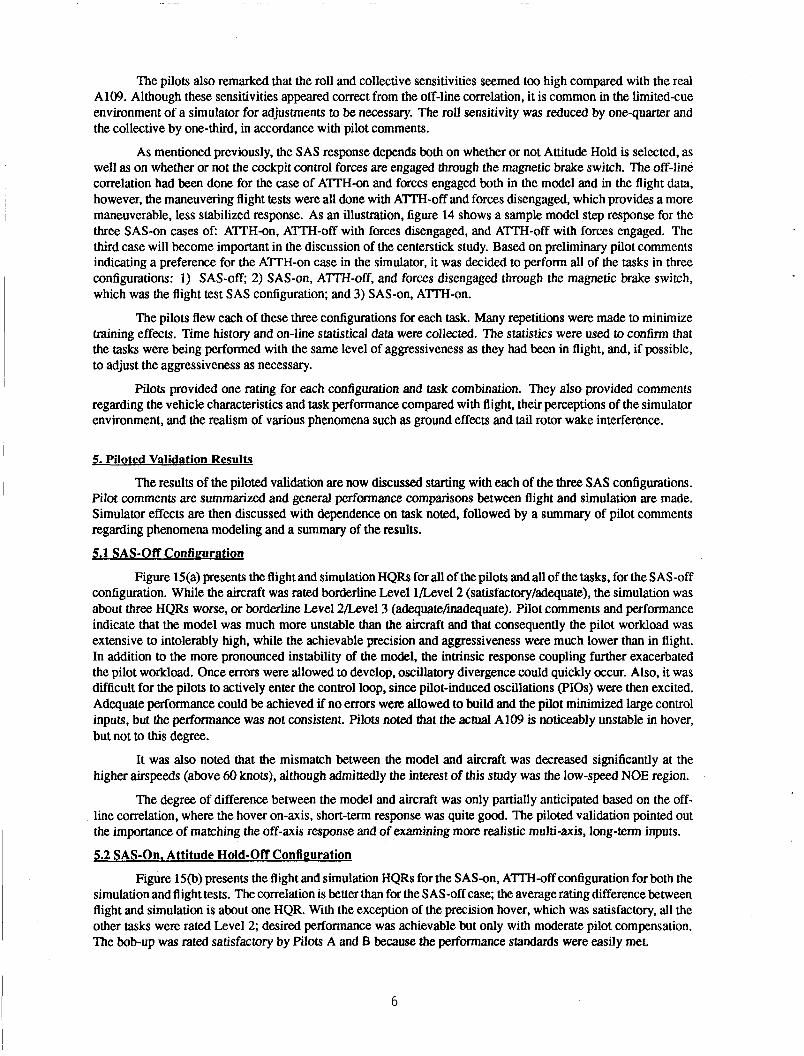
Figure 15(a) presents the flight and simulation HQRs for all of the pilots and all of the tasks, for the SAS-off configuration. While the aircraft was rated borderline Level 1Level2 (satisfactory/adequate), the simulation was about three HQRs worse, or borderline Level 2/Level3 (adequatefinadequate). Pilot comments and performance indicate that the model was much more unstable than the aircraft and that consequently the pilot workload was extensive to intolerably high, while the achievable precision and aggressiveness were much lower than in flight. In addition to the more pronounced instability of the model, the intrinsic response coupling further exacerbated the pilot workload. Once errors were allowed to develop, oscillatory divergence could quickly occur. Also, it was difficult for the pilots to actively enter the control loop, since pilot-induced oscillations (PIOs) were then excited. Adequate performance could be achieved if no errors were allowed to build and the pilot minimized large control inputs, but the performance was not consistent. Pilots noted that the actual A109 is noticeably unstable in hover, but not to this degree.
It was also noted that the mismatch between the model and aircraft was decreased significantly at the higher airspeeds (above 60 knots), although admittedly the interest of this study was the low-speed NOE region.
The degree of difference between the model and aircraft was only partially anticipated based on the off- line correlation, where the hover on-axis, short-term response was quite good. The piloted validation pointed out the importance of matching the off-axis response and of examining more realistic multi-axis, long-term inputs.
5.2 SAS-On. Attitude Hold-Off Configuration
Figure 150) presents the flight and simulation HQRs for the SAS-on, A?TN-off configuration for both the simulation and flight tests. The correlation is better than for the SAS-off case; the average rating difference between flight and simulation is about one HQR. With the exception of the precision hover, which was satisfactory, all the other tasks were rated Level 2; desired performance was achievable but only with moderate pilot compensation. The bob-up was rated satisfactory by Pilots A and B because the performance srandards were easily met.
6
A more thoughtful examination of the model response was possible with this configuration since the work- load was more reasonable. Pilots found the control sensitivity quite similar to the A109. The model seemed again more divergent than the aircraft, especially in roll, but easily controllable nevertheless. The cross coupling from collective to yaw felt quite representative of the A 109, while the pitch-roll coupling was of similar character but of higher magnitude than the aircraft. The higher coupling was especially noticeable in the slalom, which is a four- axis control task. Pilots A and B, with considerable A109 experience, commented that this configuration appeared similar to the A109 with the SAS off. In fact, the SAS-off flight ratings from figure 15(a) agree favorably with the simulation ratings of figure 15(b).
5.3 SAS-On. Attitude Hold-On Configuration
Figure 15(c) presents the simulation HQR's for the SAS-on, A'ITH-on configuration versus the flight ratings for the SAS-on, ATl2-I-off configuration which were presented in figure 15(b). It is seen that the increased stability of the A'ITH feature in the simulation improves the pilot ratings to the point where flight and simulation correlate very well; in fact in some cases the simulator tasks were rated easier than the flight ones.
The pilots found the model response stable, predictable, and well-damped, and the response coupling minimal. Again, the sensitivity was perceived close to the A109. The achievable aggressiveness and precision were close to what was accomplished in flight. Pilots A and B felt that this configuration was similar but slightly more stabilized than the A109 with ATIM off. As stated previously, the ATIM-on model agreed very well with flight in the time- and frequency-domain correlation. Thus, knowing that the A"H-off case represents a less- stabilized response, it is reasonable to assume that the simulation ATTH-on case was more highly stabilized than the flight ATTH-off case, and that the similarity in pilot ratings for these dissimilar configurations must be due in part to increased workload in the simulator which was induced by factors other than the model itself.
5.4 Simulator and Task Effects
According to pilot comments, all of the pilot ratings were strongly affected by the simulator environment, that is, the visual cues available, the field-of-view, the lack of motion cues, and perceived transport delays between control input and visual scene response. Moreover, the pilot sensitivity to the cues became higher as the vehicle augmentation increased, because as the aircraft became easier to fly, the task performance became limited by the visual cues rather than by the vehicle characteristics. The shortcomings of the cue environment were always judged a contributor to the increased pilot compensation over what was encountered in flight.
The simulator effects were also a function of the task, for example, in the precision hover task, which was performed over an area with 10-ft grids and surrounding trees, the position cues were judged not fine enough. In the hover turn, the position cues changed with heading and were not sufficient at some headings. This task was easier to the right than the left because of the lower right chin window, which aided stabilization at the terminal heading. For the SAS-on, ATTH-on case discussed above, Pilot C commented that the visual cue deficiencies made the pilot compensation moderate rather than minimal, forcing his HQR to a 4.
The dash/quickstop was in general performed with less aggressiveness and precision than in flight due in part to the lack of height and velocity cues and position cues on final hover. Pilots had to refer to the instruments for velocity and altitude information. Longitudinal motion cues were felt to be an important missing element for this task.
For the sidestep, the right-chin window again made the task easier to the right. The other position cue comments were the same as for the hover and hover turn tasks, since they were performed in the same area.
The bob-up was performed over a hover pad and the height was referenced to a group of trees. The height cues were judged generally sufficient, but the horizontal position was difficult to perceive, especially at the highest point. This was also true in the real aircraft, however. Pilot C also noted some time delay in the vertical and yaw axes during the initial collective input, which is somewhat open-loop. This degraded his SAS-on, A'ITH-off rating. In general, time delay was not a perceived problem for the other tasks.
The slalom was generally rated the most difficult of all of the tasks because of requirements for precision and high control activity in all axes. All of the pilots noted that motion would be very helpful for vertical and sideslip cueing. Constant airspeed was difficult to maintain during turns, probably caused by a combination of cues and the model's characteristic anomalies in sideslipped conditions. The altitude and position cues available from the marked pylons were judged effective but unrealistic. Pilot C noted that too much attention to the pylons was required to attain desired performance, which degraded his SAS-on, ATTH-on rating. Finally, the high roll rates necessary for the closely spaced pylons sometimes caused disconcerting ratcheting in the visual response.
7
5.5 Phenomena Modeling
The pilots were also asked to comment on the quality of phenomena such as ground effects, and the importance of the lack of complete modeling of vertical fin and tail rotor interference and disturbances caused by the main rotor downwash. Comments about the ground effects model indicated that it was realistic and helpful in controlling altitude, especially in the hover, hover turn, and sidestep tasks. The loss and regaining of ground effect was obvious in the bob-up and added to its realism.
The lack of sophisticated modeling of the tail rotor aerodynamics meant that the sidestep task felt es- sentially symmetric right and left. However, in the A109 steps to the right are noticeably easier than to the left because when translating to the left the tail rotor is traveling through its own wake, causing disturbances which make velocity and heading control difficult.
In general, the lack of detailed downwash modeling in the dynamic sense removed the requirement for the pilot to stabilize against the constant disturbances seen in real flight near the ground, especially in sidestep tasks. However, this was certainly more than offset by the increased workload from the cue environment just discussed.
5.6 Summarv of Validation
The piloted validation provided a complete subjective evaluation of the A109 model which could be com- pared with what had been predicted based on the model and aircraft correlation. In general, the pilots judged the model to require a higher level of pilot workload than the aircraft in the same configuration, even though the SAS-on, A'ITH-on model was found to be close to the aircraft based on the previous analysis. Part of the increased workload must be attributed to the lack of cues in the simulator, in particular the fine visual texture necessary for precision in low-speed tasks. Another source of the discrepancy, based on pilot comments, is the off-axis response and response coupling errors in the model. This was especially true for the SAS-off case, where the correctness of the short-term on-axis response was masked by the high degree of model instability and response coupling.
The NOE tasks chosen were effective in revealing the vehicle and model characteristics and were easily duplicated from flight into the simulator. Combined with the consistency of pilot participation in the flight tests and simulation, this provided a rational basis of comparison of the flight and simulation pilot ratings.
6. Centerstick Studv
As discussed in the introduction, the second objective of the research effort was to use the validated A109 model to study the effects of centerstick force characteristics on NOE maneuvering. This subject is of interest to the US Army in its specification development and to Agusta and the Italian MOD in their development of a military version of the A109, the A109K. The civil A109, which is certified for single-pilot Instrument Flight Rules (Ell) operation, has control forces which are too great for the maneuvering required in NOE flight (table 2).
Centerstick requirements have not been addressed extensively for rotorcraft in NOE tasks. Most handling qualities experiments chose one appropriate set of characteristics while varying other parameters of interest. Since the optimum choice of a centerstick configuration is highly dependent on the vehicle characteristics, in particular the response type, little general guidance about centerstick requirements can be gained from these studies. In fact, the current specification is based largely on operational experience rather than on systematic experiments. Thus, it was expected that the data generated from this study would provide further justification for the requirements.
This experiment was conducted during the 5-week fixed-base simulation period. One NASA and one Army test pilot, Pilots D and E, participated for 2 weeks prior to the piloted validation. Thus, the model was not completely validated as representative of an A109 at that time, however, this was not judged crucial for the experiment. Following the validation, pilots A, B, and C also participated, but with the updated model. The following subsections will describe the test matrix, conduct, tasks and results of the centerstick study.
6.1 Exoeriment Matrix
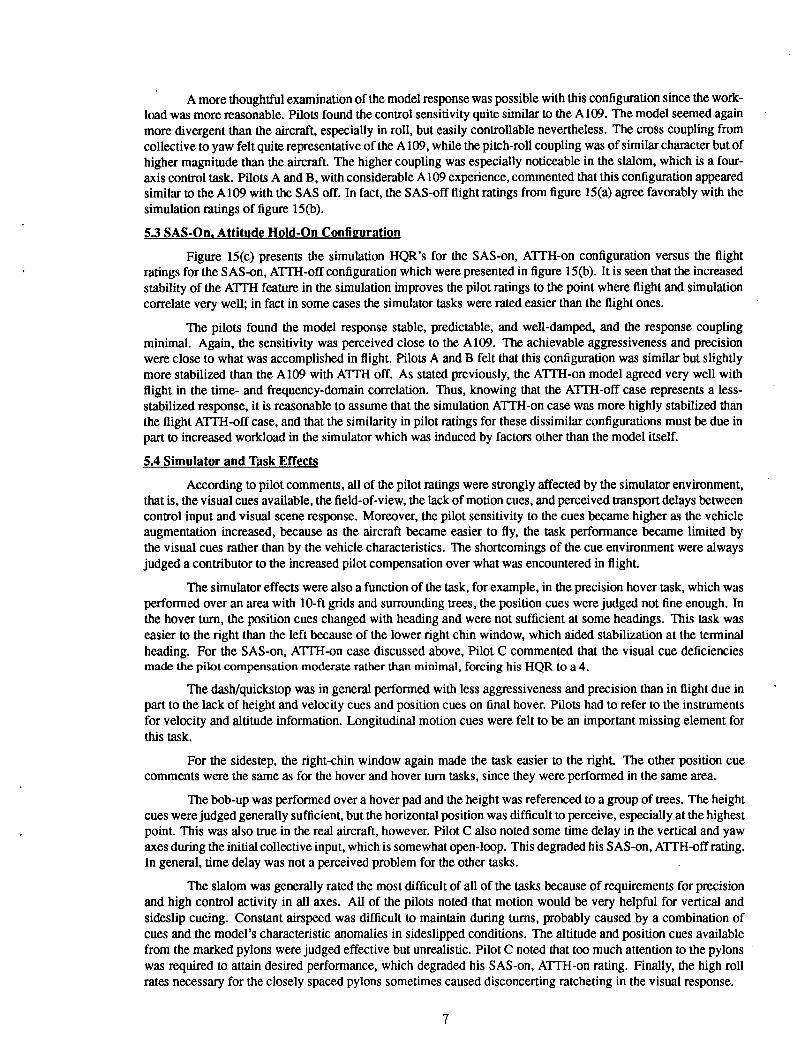
The variables for the study were the lateral and longitudinal breakouts and force gradients; the friction and damping of the centerstick did not vary. m e pedal and collective Characteristics were those of the A109 (table 2). Figure 16 shows an example of the effects of each of these parameters on the force versus displacement characteristics. The damping governs the speed of return and overshoot of the stick following release. It was set such that one small overshoot was visible as the stick returned to center. An exact damping ratio was not measured, but was estimated to be 0.5 both in pitch and in roll.
8
The experiment matrix of breakouts and gradients is presented in table 3. The configurations were chosen, based on preliminary piloted evaluations, to result in handling qualities ranging from Level 1 to 3. The current handling qualities specification predictions for hover and low speed are also included (ref. 3, also known as Aero- nautical Design Standard ADS-33). The actual A109 forces are shown for comparison.
The A109 model was used with the SAS on, AlTH off, and forces engaged, which represents a minimum amount of rate stabilization (see fig. 14). Pilots D and E, who flew prior to the piloted validation, flew with the higher roll and collective sensitivities and lower SAS authority. The latter issue was important because the pitch SAS authority was often reached during the quickstop maneuver, thus degrading the vehicle response. However, this was consistent for both pilots. Pilots A, B, and C flew the same SAS configuration but with the updated sensitivities and SAS authority resulting from the piloted validation. A secondary objective was to examine the dependence of the ratings on these model changes.
6.2 ExDeriment Conduct and Tasks
Pilots D and E performed the dash/quickstop, sidestep, and slalom tasks as previously described, while pilots A, B, and C performed only the dash/quickstop, because of time constraints. It was quickly seen that pilot perceptions of a particular configuration were greatly influenced by the previous one flown. In order to minimize this effect, many repetitions were done for each taskkonfiguration pair; 10 or 15 repetitions of the task before assigning a pilot rating were not unusual.
The configurations were presented such that there was a significant change from one to the next, and each session started with a mid-range configuration for refamiliarization. The same task was flown as the centerstick characteristics varied for each session.
6.3 Pilot Rating Results
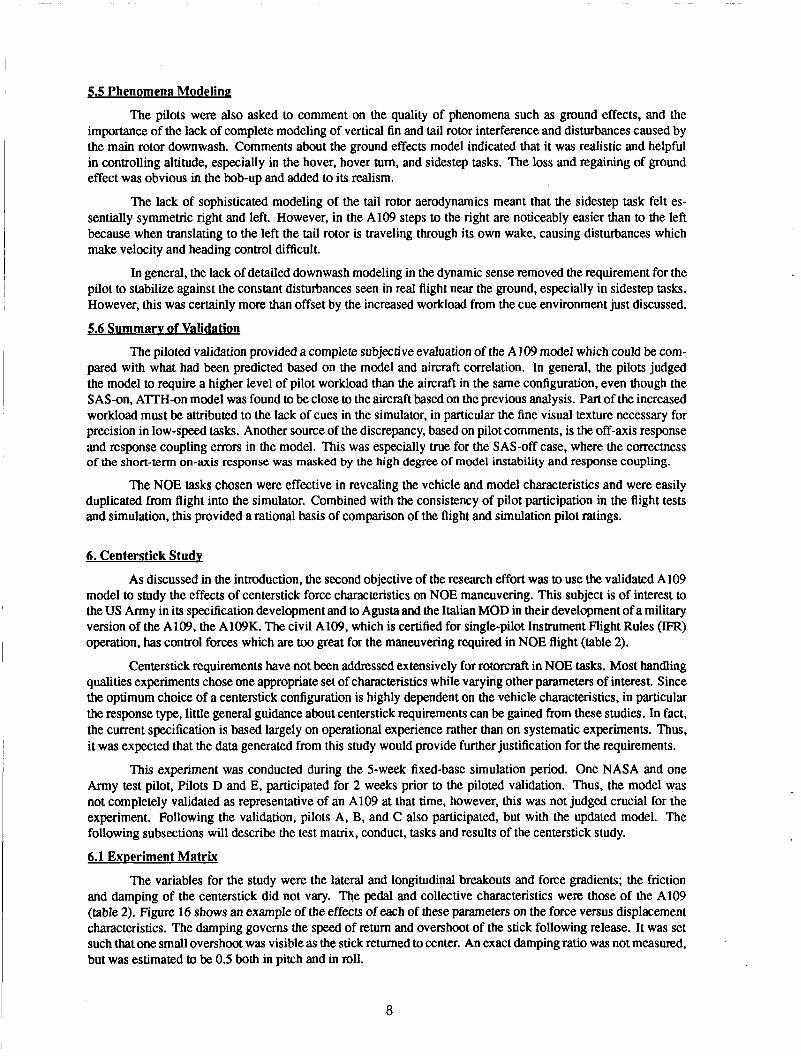
The HQRs for pilots D and E are presented in figures 17(a), @), and (c) for the three tasks. The strong dependence of the rating on the centerstick configuration is immediately apparent and quite substantial. For the low-force cases, the ratings were degraded because the lack of forces and centering led to overcontrolling in pitch and roll. Pilots noted a lack of precision and predictability, reduced achievable aggressiveness, and only adequate performance. Pilot D experienced pilot-induced oscillations (PIOs), and both pilots rated the workload as excessive. As the forces increased to configuration 3, the performance and ratings improved, though the pilots felt that the forces were still lower than optimum. At about configuration 8, the ratings again started to degrade. Pilot comments indicate that for the high force cases they were fighting the forces, and both under- and overcontrolling due to a lack of position feedback. They had to lead the inputs and reduce the aggressiveness. Task performance again degraded to adequate, and workload was rated very high.
The preferred configuration of pilots D and E in terms of subjective comments was number 6, in which the magnitude of the gradient is equal to that of the breakout for each axis. Pilots described this configuration as relaxed, smooth, continuous through the center trim point, and amenable to high aggressiveness with low workload.
As in the case of the piloted validation, the slalom task was considered quite difficult, and the sensitivity of the ratings to the stick configuration was higher.
Harmony between pitch and roll was not in general an issue, though the pilots commented that the roll forces were too high compared with pitch for configuration 4, and that the pedal forces were too light compared with the centerstick for configuration 10.
Next, the HQRs versus the centerstick configuration for pilots A, B, and C are presented in figure 17(d), for the dash/quickstop task. Even with the final validated version of the model, the rating trends and comments are similar to those for pilots D and E, indicating that the results are not dependent on the model details. However, there is more scatter in the ratings; in particular, pilot C’s ratings are better than those of pilots A and B. Comments indicate that this is because he found a way to perform the quicktop portion of the task with very little movement of the centerstick, which made his ratings less sensitive to the configuration. While pilots D and E preferred configuration 6, pilots A and B rated it as Level 2. Pilot A found the forces for this configuration objectionably asymmetric left versus right, which was afterward attributed to a misbalance of the force-feel system. Pilot B experienced PIOs with it, perhaps because it was presented immediately after configuration 10 and without enough task repetitions to remove the dependence on the order of the configurations.
It should be noted that the centerstick configuration that had been used in the piloted model validation, namely 1 lb of friction plus damping but no gradient or breakout in pitch and roll, should have resulted in Level 3
9

handling qualities according to the specification. However. the combination of training, the higher augmentation- configuration of the SAS during the piloted validation, the higher SAS authority, and the similarity with the forces- off vehicle controls makes a direct comparison between the centerstick and validation results difficult.
6.4 Correlation with Current Reauirements
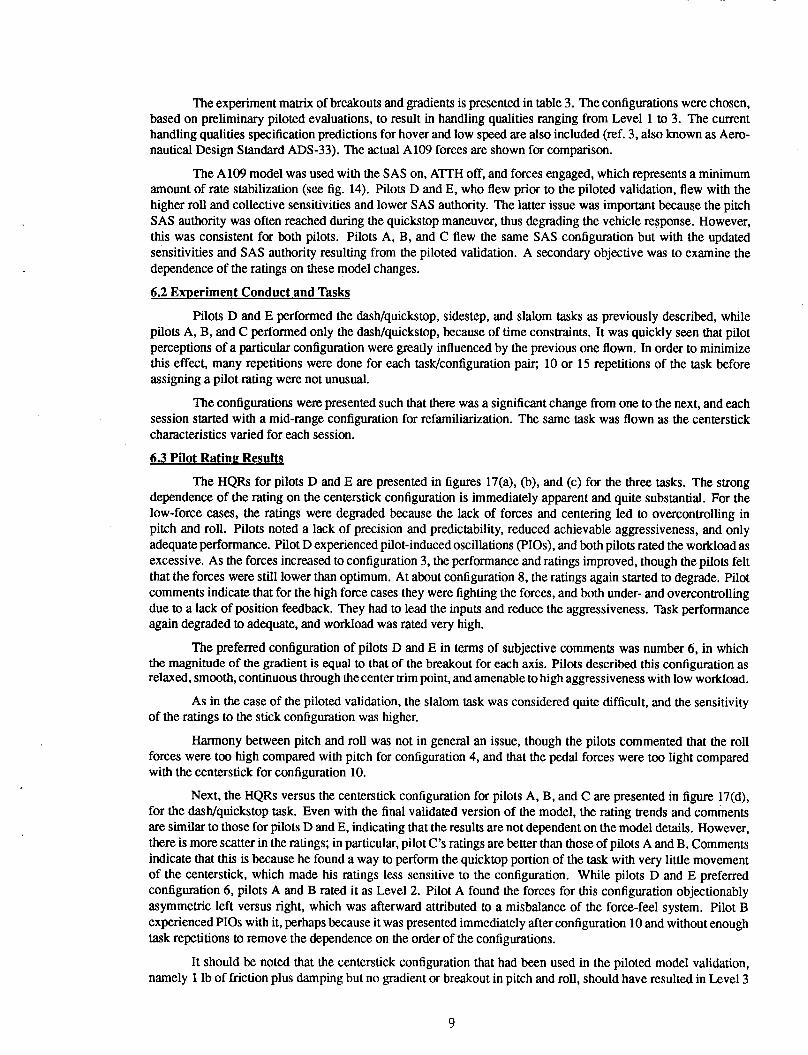
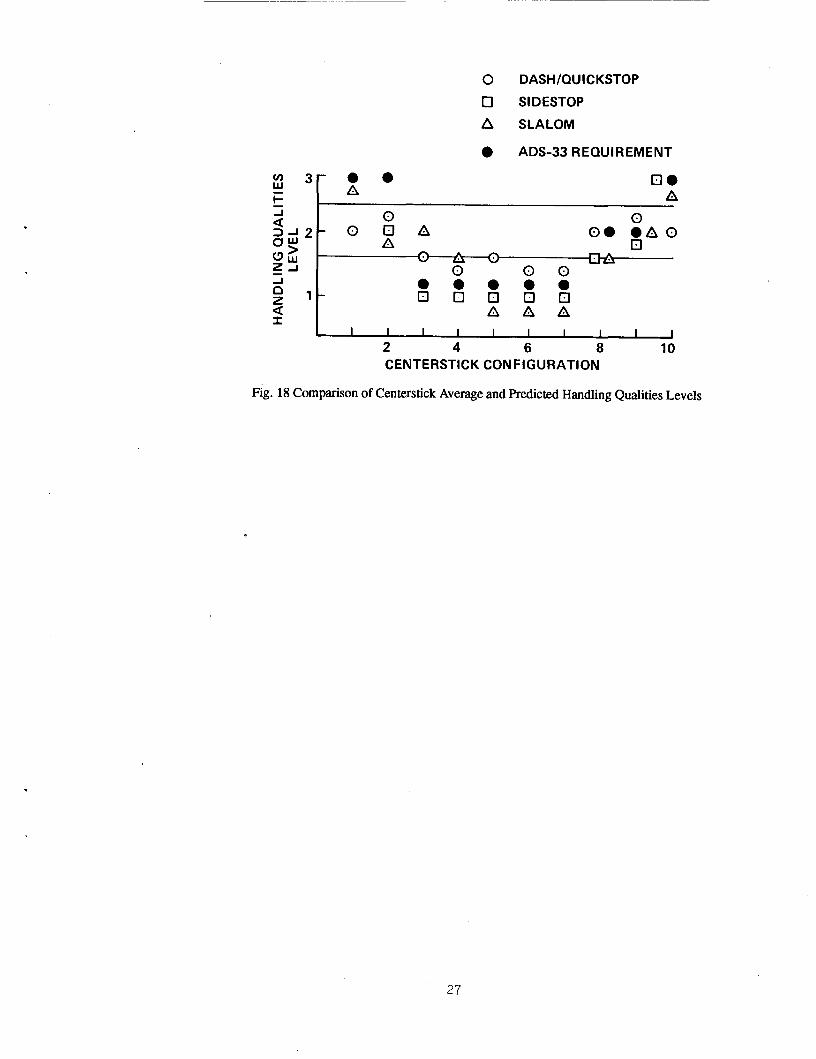
Figure 18 compares the average handling qualities levels resulting from each configuration with those predicted by the requirements in the specification. The predictions are based on the worst level resulting from all of the pitch and roll gradient and breakouts for each configuration, as shown in table 3. Values of the characteristics which are not allowed by the specification, such as zero breakouts and gradients, were assumed to be predictive of Level 3 handling qualities. It is seen that the experimental results agree favorably with the requirements for all of the configurations except for 2 and 8. For these, the specification is slightly conservative, but this is justified as they were subjectively disliked by the pilots even if the performance was too good to warrant downgrading the level.
7. Conclusions and Recommendations
The methodology and results of a research program to develop, validate and use a realtime mathematical model of the A109 helicopter have been presented. Based on this study, several conclusions and recommendations can be stated:
1. The A109 version of the generic ARMCOP mathematical model exhibited low-speed dynamic response which was considerably more unstable than the real helicopter and resulted in poor pilot acceptance of the model with the SAS off. Data collection and examination of long-term response correlation, on the order of 15 sec, would have been helpful in predicting this.
2. The validity of the model response improved both subjectively and quantitatively with the SAS engaged. Because the basic model had the correct on-axis short-term response, no changes to the A109 SAS model were required to obtain excellent correlation for the Al'TH-on case.
3. The approach to the model validation was successful in maximizing the model correlation, although the graphical examination of the results of each model variation was time consuming. An automated technique for optimizing the correlation would be helpful in this regard and is under development by Agusta.
4. It is considered that more sophisticated main rotor aerodynamic modeling would improve the model cor- relation, and that the frequency domain provides the best insight into the sensitivity of the response to this modeling. Barring model improvements, it is recommended that the model is most appropriate for use in conjuntion with stability augmentation, or in other than hovering conditions.
5. Some model adjustments, namely reduction of the roll and collective control sensitivities, were necessary to improve pilot acceptance of the model, even if the time- and frequency-domain correlation supported the higher values. This illustrates the strong influence of the simulator environment on pilot perception of model fidelity.
6. The lack of motion and fine visual cues increased the difficulty of the simulator tasks and was assumed partly responsible for the difference in pilot ratings between flight and simulation.
7. The systematic approach to the piloted validation, using the same pilots and tasks in flight and in simula- tion, yielded easily comparable data and credible results.
8. The handling qualities of NOE tasks were found to be sensitive to the centerstick force characteristics in a manner well-predicted by the current US military handling qualities specification for helicopters.
8. Acknowledgments
The authors wish to express their appreciation and gratitude to the test pilots who participated in this endeavor, namely: T.Col. Mario Ottone of the Italian Air Force (F'ratica di Mare), Cmdte. Bruno Bellucci of C.A.G. Agusta, William Hindson and Michael Stortz of NASA Ames Research Center, and Maj. Rick Simmons of the US Army Aeroflightdynamics Directorate.
10

The authors also acknowledge the invaluable support of the Project Officers of the US/Italy Memorandum of Understanding, namely: T.Col. Francesco Falcucci and Col. Fulvio Gagliardi of the Italian Air Force, David L. Key of the US Army Aeroflightdynamics Directorate, and the Agusta MOU representative, Ing. Giuliano Monti.
9. References
1.
2.
3.
4.
5.
6.
7.
8.
9 .
10.
11.
Mark Ballin: “Validation of a Real-Time Engineering Simulation of the UHdOA Helicopter ” NASA TM 88360, February 1987.
J.A. Schroeder, E. Moralez, and V.K. Merrick: “Simulation Evaluation of the Control System Command Monitoring Concept for the NASA V/STOL Research Aircraft (VSRA)” AIAA Paper No. 87-2255, pre- sented at the AIAA Guidance, Navigation, and Control conference, Monterey, California, August, 1987.
R.H. Hoh, D.G. Mitchell, B.L. Aponso, D.L. Key, C.L. Blanken: “Proposed Specification for Handling Qualities of Military Rotorcraft Volume I - Requirements” USAAVSCOM TR 87-A-4 and ADS-33, May 1988.
P.D. Talbot, B.E. Tinling, W.A. Decker, and R.T.N. Chen: “A Mathematical Model of a Single Main Rotor Helicopter for Piloted Simulation” NASA TM 84281, September 1982.
Kathryn B. Hilbert: “A Mathematical Model of the UH-60 Helicopter” NASA TM 85890, April 1984.
R.K. Heffley, S.M. Bourne, H.C. Curtiss, W.S. Hindson, and R.A. Hess: “Study of Helicopter Roll Control Effectiveness Criteria” NASA CR 177404, April 1986.
M.S. Lewis, and E.W. Aiken: “Piloted Simulation of One-on-One Helicopter Air Combat at NOE Flight Levels” NASA TM 86686, April 1985.
M.B. Tischler, R.F. Ringland, H.R. Jex, and I.L. Ashkenas: “Flight Dynamics Analysis and Simulation of Heavy Lift Airships, Vol 11: Technical Manual” STI TR-1151-2-II, Systems Technology, Inc., Hawthorne, California, December 1982.
Mark B. Tischler: “Frequency Response Identification of XV- 15 Tilt-Rotor Aircraft Dynamics” NASA TM 89428, May 1987.
G.E. Cooper and R.P. Harper: “The Use of Pilot Rating in the Evaluation of Aircraft Handling Qualities”
R.E. McFarland: “CGI Delay Compensation” NASA TM 84281, January 1986.
NASA TN D-5153, April 1969.
11
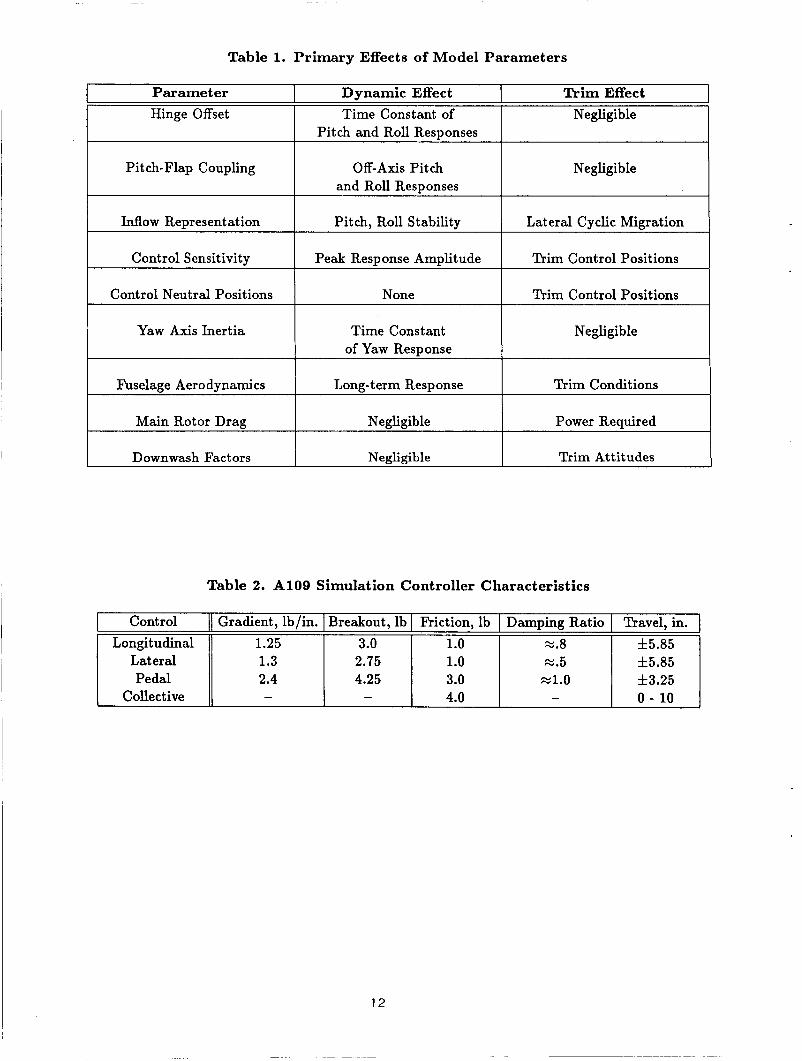
Table 1. Primary Effects of Model Parameters
Parameter Hinge Offset
Pitch-Flap Coupling
Inflow Representation
Control Sensitivity
Dynamic Effect Time Constant of
Pitch and Roll Responses
Off-Axis Pitch and Roll Responses
Pitch, Roll Stability
Peak Response Amplitude
1 Control Neutral Positions 1
Fuselage Aerodynamics
Main Rotor Drag
Downwash Factors
None
Long-term Response
Negligible
Negligible
Yaw Axis Inertia
Control Longitudinal
Lateral Pedal
Collective
Time Constant of Yaw ResDonse
Gradient, lb/in. Breakout, lb Friction, lb Damping Ratio Travel, in. 1.25 3.0 1.0 z . 8 f5 .85 1.3 2.75 1.0 E.5 f5 .85 2.4 4.25 3.0 x1.0 f3 .25
0 - 10 - - 4.0 -
Trim Effect Negligible
Negligible
Lateral Cyclic Migration
Trim Control Positions
Trim Control Positions
Negligible
Trim Conditions
Power Required
Table 2. A109 Simulation Controller Characteristics
12

FRICTION: .25 LB(1-lo), 1.0 LB(A109)
6
Fig. 1 Agusta A109 Helicopter
13
0 ARMCOP MODEL
FLIGHTTEST
$ 41:
8 8 8 - n I 1 I I I I 1 1 1
-40 -20 0 20 40 60 80 100 Y
8o c
-40 -20 0 20 40 60 80 100 u -
AIRSPEED, kts
AIRSPEED, kts
Fig. 2 Trim Comparisons of Flight and Model
1 4

ae 100 Ai 0 e 80 z
6 0 -
- 40 n < 3
u z 2 0 -
0
W'
100 HOVER, LONGITUDINAL ap
- AFT PULSE, SAS OFF 4. 80 - 0
5 60'
- h 4 40 -
0 FLIGHT LT
8 4' a n
2 2 0 -
7 A .
0 MODEL " -
.8-
A " . - .,
0
I-
K -10 a I 0 c
-30
100 I 1
I 10 en 0 U W' n
F -10
a
B
3 I-
I-
4 -I
-py-.- . . . . . .. . . . . .. . . . . .. . . . . . . . . . . . . . . . . . . .
-20 ' I I P -30 0 2 4 6 0 2 4 6
TIME, sec TIME, sec
Fig. 3 Pulse-Response Comparison of Flight and Model
15

HOVER, LATERAL RIGHT PULSE, SAS OFF 0 FLIGHT
4 0 MODEL
40 I 1
er, al '0
30 I 1
-30 I I I
0 2 4 TIME, sec
100
ae 80 4-
I- 60 z 0
40
2
.J a s 20 p.
0
, , . . . . , . . . . . . . . . . . .
150 I I
e r , t 130 u' n 3 110
30
U " d 10
5 3
I- !I
-10 u t k a
-30 0 2 4
TIME, sec
Fig. 4 Pulse-Response Comparison of Flight and Model
16

0 Q
P) al U
l-
K I 0
c
u' a
P) Q '0
w' n k 3
I- s 4
0
P) al '0
u' n 3 I- I- - s I 0 k n
10 I
1 -\
tI+
-10 I I I
0 2 4 TIME, sec
80 knots, LONGITUDINAL AFT PULSE, SAS OFF 0 FLIGHT 0 MODEL
-20 ' 100 I
n k
3 a
3
I- s t
80 0 2 4
TIME, sec
Fig. 5 Pulse-Response Comparison of Flight and Model
17

100 I I
w-
a k
8 m
0 ' I
I
80 knots, PEDAL RIGHT PULSE, SAS OFF
0 FLIGHT oMODEL
10 I I
- I- I- a
100 I I
80 0 2 4
10 m al 0
I- - c o
-10 ' I I 0 2 4
TIME, sec TIME, sec
Fig. 6 Pulse-Response Comparison of Flight and Model
18
80 knots, COLLECTIVE UP PULSE, SAS OFF 0 FLIGHT 0 MODEL
TIME, sec
C I
-10
10
I J 4
-10 ' 0 2
TIME, sec
Fig. 7 Pulse-Response Comparison of Flight and Model
p 20 \ m 0) '0
LLJ- I - 0 4 a
0 a -20
A -I
TIME, sec
HOVER, LATERAL RIGHT PULSE, SAS ON 0 FLIGHT 0 MODEL
B 20
u' n 3 10 k t-
I 0 I-
U
5 0
C -10
TIME, sec
Fig. 8 Pulse-Response Comparison of Flight and Model
20
2
8 60
4
3
W' c
I I
I I -10 I
-10 ' I 1
0 2 4 TIME, sec
10 I
I I
80 knots, LONGITUDINAL FORWARD PULSE, SAS ON 0 FLIGHT 0 MODEL
10 1 1
-10 ' 1
100 I
4 2 4 TIME, sec
*O 0
Fig. 9 Pulse-Response Comparison of Flight and Model
21
80 knots, PITCH ATTITUDE RESPONSE, SAS OFF
FLIGHT 20 1 , m D
0, -100
a
Q) '0
v) w' -150
-200 f
........................................... .\ ......................................
.................................................................................... * / 1 /
- -4 -250
0.1 1 10 FREQUENCY, rad/sec
Fig. 10 Frequency-Response Comparison of Flight and Model
HOVER, ROLL ATTITUDE RESPONSE, SAS ON
201 FLIGHT /
L r \ MODEL -1
-40 I]----
\ look-- \ \
Q) '23
W'
I -100-
. - . . . . . . 1 10
-200 L-- 0.1
Fig. 11 Frequency-Response Comparison of Flight and Model
FREQUENCY, rad/sec
22

PRECISION HOVER
Desired Performance for one minute hover: Altitude 10 ft ? 3 ft Position within 5 ft circle, SAS off
3 ft circle, SAS on Heading f 5 deg, SAS off
f 2 deg, SAS on
HOVER
HOVER
H
1000 f t
DASH/QU ICKSTOP
Desired Performance: Achieve stable hover within 25 seconds Altitude f 10 f t Heading ?r 10 deg Achieve 40 kts f 5 kts during Dash
1
BOB-UP/BOB-DOWN
Desired Performance: No overtorque or overshoot in altitude Heading f 5 deg Position within 10 f t circle
HOVER TURN
Desired Performance in 360 deg turn: Stabilize within 18 seconds Terminal heading f 5 degs Altitude f 3 ft Position within 5 ft circle
0 1ooft 1ooft 0
LATERAL SIDESTEP
Desired Performance: Stabilize within 9 seconds for 100 ft translation
13 seconds for 200 f t translation Final position within 'h fuselage width Heading f 5 deg Altitude f 10 f t
620 620 310 720 ft 720
SLALOM
Desired Performance: 40 kts.f 10 kts 40 ft altitude f 10 f t Minimize error from path connecting pylons
Fig. 12 A109 Flight and Simulation Evaluation Task Definitions
23

Fig. 13 A109 Simulator Cockpit
4 4
80 -
60 - I 40 -
20 -
0 ' " " " ' " "
FORCES ENGAGED FORCES DISENGAGED
201' " " " " " ' ' . ' " ' 1
4 0 . . U w- 30-
10- 5 2 0 -
I- I- a O -
. ' ' ' '
-I 1
a TIME, sec 0 0 1 2 3 4 5 4 -101. " " " ' " ' " " " " "
Fig. 14 Illustration of A109 SAS Modes at Hover
24 ORIG!NAL PAGE
BLACK AND WHITE PWT'Cl(JRAW

10-
a w u 8 -
a + f j - 2 z $ 2
. -. 1 I I 1 1 I
c LEVEL 3 A PILOTC
INADEQUATE - mmh 0
A 0A LEVEL 2 -
0 FLtGHT TEST, SAS ON, ATTH OFF
l o r o SIMULATION, SAS ON, ATTH OFF
10
a 8 - 2 p 2 ; s - 5 2 $ + 4 - L O O=! O L 2 0
LEVEL 3
$2 LEVEL 2
[ INADEQUATE
- 0 SIMULATION, SAS ON, ATTH ON -
LEVEL 3 - INADEQUATE
LEVEL 2 ADEQUATE
LEVEL 1 SATISFACTORY
- h A . . .
. . dp ppbec& w - - - (4
I I I I I
ADEQUATE
LEVEL 1 SATISFACTORY
HOVER QUICK BOB SLALOM STOP UP
HOVER SIDE TURN STEP
Fig. 15 Comparison of Flight and Simulation Pilot Rating Results
25

w 0 E 0 LL
- .. 0.
- 0 - 0.
WITH FRICTION
NO FRICTION
D I SP L AC EM E NT 0
- - 0 - LEVEL 2 . ADEQUATE
lo - FDASH/QUICKSTOP 6 8 L
z F 2 2
Fig. 16 Effects of Controller Characteristics
- 9m0 '" LEVEL1
SATISFACTORY 0 . 'k
0 PILOT D
H PILOT E
LEVEL 3 INADE~UATE
- - (d)
I l l 1 1 1 1 1
a Y lo [r SIDESTEP LEVEL 3
- INADEQUATE - U LEVEL 2
LEVEL 1 SATISFACTORY
2 4 6 8 1 0 - INCREASING FORCES
o m . o o o a o
0 PILOTA DASH/QU ICKSTOP 0 PILOTB
A PILOTC Q
CENTERSTICK CONTROLLER CONFIGURATION
Fig. 17 Pilot Rating Results for Centerstick Study
26
0 DASH /QU I CKSTOP
0 SIDESTOP
A SLALOM
W - t A h -
I I I I I I 1 I I I I 2 4 6 8 10 CENTERSTICK CONFIGURATION
Fig. 18 Comparison of Centerstick Average and F’redicted Handling Qualities Levels
27
Report Documentation Page 1. Report No. NASA TM 101062 USAAVSCOM TR 88-A-002
2. Government Accession No.
~
4. Title and Subtitle
17. Key Words (Suggested by Author(s))
Results of an A109 Simulation Validation and Handling Qualities Study
18. Distribution Statement
7. Authods) Michelle M. Eshow (Aeroflightdynamics Directorate, Ames Research Center, Moffett Field, C A ) , Diego Orland Giovanni Bonaita(C.A.G. Agusta, Cascia Costa(VA),Italy Sergio Barbieri (Italian Air Force,Pratica di ILlare,Ital
Aeroflightdynamics Directorate, USAARTA Ames Research Center Moffett Field, CA 94035
9. Performing Organization Name and Address
19. Security Classif. (of this report) 20. Security Classif. (of this page)
Unclassified Unclassified
12. Sponsoring Agency Name and Address
National Aeronautics and Space Administration Washington, DC 20546
21. No. of pages 22. Price
32 A03
3. Recipient's Catalog No.
5. Report Date
May 1989
6. Performing Organization Code
8. Performing Organization Report No.
A88271 9
10. Work Unit No.
992-21-01
11. Contract or Grant No.
13. Type of Report and Period Covered
Te c hn ica 1 Plemor and urn
14. Sponsoring Agency Code
~
5. Supplementary Notes Point of Contact: Michelle M. Eshow, Aeroflightdynamics Directorate, USAARTA,
Ames Research Center, MS 211-2, Moffett Field, CA 94035 (415) 694-5272 or FTS 464-5272
Presented at the Fourteenth European Rotocraft Forum, 20-23, September 1988, in Milano, Italy.
6. Abstract
The results of a research program conducted to validate a mathematical model of the Agusta A109 helicopter, and subsequently to use the model as the baseline for a handling qualities study of cockpit centerstick requirements, are described. The study was conducted under the auspices of the Memorandum of Understanding between the United States Army and the Italian Ministry of Defense. The technical work was conducted by the Aeroflightdynamics Direct- orate for the United States Army and by the Italian Air Force (D.A.S.R.S.-R.S.V.) and C.A.G. Agusta for the Italian MOD. test, non-realtime analysis, and realtime piloted simulation. Results of the validation illustrate that a time- and frequency-domain approach to the model and simulator issues. The final A109 model correlates well with the actual aircraft with the Stability Augmentation System (SAS) engaged, but is unaccept- able without the SAS because of instability and response coupling at low speeds. Results of the centerstick study support the current US Army handling qualities requirements for centerstick characteristics.
The technical approach included flight
Handling qualities Helicopter Stability augmentation system Flight simulation
Unlimited-Unclassified
Subject Category - 08