RESULTS OF A NATIONAL SURVEY - jwebireland.com quality of life of people with disabilities in...
31
THE QUALITY OF LIFE OF PEOPLE WITH DISABILITIES IN IRELAND IN 2007 RESULTS OF A NATIONAL SURVEY OUTCOMES NETWORK OF IRELAND & DELIVERING OUTCOMES TO PEOPLE PROJECT 2007 ©
Transcript of RESULTS OF A NATIONAL SURVEY - jwebireland.com quality of life of people with disabilities in...

THE QUALITY OF LIFE
OF PEOPLE WITH DISABILITIES
IN IRELAND IN 2007
RESULTS OF A NATIONAL SURVEY
OUTCOMES NETWORK OF IRELAND & DELIVERING OUTCOMES TO PEOPLE PROJECT 2007©

THE DELIVERING OUTCOMES TOPEOPLE PROJECT
The Delivering Outcomes to People Project is funded by the Dept. of Justice, Equality and Law
Reform, under Enhancing Disability Services (EDS) and is managed by Pobal. The Project came
about as a result of a proposal for EDS funding by the Outcomes Network of Ireland, a network of
service providers in Ireland using Personal Outcome Measures.
The targets of the Project are to:
• Support clusters of smaller agencies in the disability sector in training their
staff in Personal Outcomes measuring.
• Develop a national baseline of data from agencies using personal outcomes.
• Support & disseminate good practice in outcomes delivery through website,
seminars, national conference & good practice guide.
• Support implementation of Basic Assurances in all network members.
The Project funds a Project Manager and Project Administrator and runs from April 2006 – March
2008.
THE COUNCIL ON QUALITY &LEADERSHIP
The Council on Quality & Leadership (CQL) are a Maryland U.S.-based organisation engaged in
research, training, consultancy and accreditation of service providers across the English-speaking
world. CQL have more that 35 years experience of assessing and accrediting services They first
published their personal outcomes measures in 1993, issuing a 2nd edition in 1997, and a 3rd
edition in 2005. The Council have been working in Ireland since 1998, supporting the Outcomes
Network in Ireland in a series of conferences and seminars, as well as training certified POMs
trainers, accrediting services and certifying Basic Assurances. The Council see themselves as
partnering interested service providers in improving the quality of the services they provide
through responsiveness to individual needs and priorities. (See ‘References & Resources’ for
their publications and websites)

THE QUALITY OF LIFE
OF PEOPLE WITH DISABILITIES
IN IRELAND IN 2007
RESULTS OF A NATIONAL SURVEY
BOB MCCORMACK AND MARGARET FARRELL
OUTCOMES NETWORK OF IRELAND & DELIVERING OUTCOMES TO PEOPLE PROJECT

ACKNOWLEDGEMENTS
THIS NATIONAL STUDY WAS ONLY POSSIBLE WITH THE ASSISTANCE OF MANY PEOPLE, AND MOST
ESPECIALLY THE FOLLOWING:
• The Survey Advisory Group – Suzanne Bennett, Maura O'Loughlin, Tom Hughes, Brigid Butler, Fiona Coffey and Ann Neenan
who advised on all aspects of the study;
• Suzanne Bennett and Maura O'Loughlin who delivered the Training Seminar for Study Coordinators of the participating
Agencies on information gathering and scoring;
• The Survey Coordinators in each of the participating service providers – Lynn Howard, Sarah Phelan, Gerry Keane, Liz
O’Neill, Jenny Cullen, Ann Neenan, Suzanne Bennett, Teresa Ryan, John Farrelly, Geraldyn Jackman, Siobhan Buckley, Janice
Hyde, Joe Murphy, Marian Murphy, Claire O’Dwyer, Eoin Mooney, Sharon Kelly, Margaret Glacken, Mary Rowan, Majella
Hayes, Emmett Stones, Anthony Kiernan, Paul Henry, Vivienne Jeffers, Finola Loughney, Lynn McDermott, Michael Tiernan
and Angela Carr.
• The supervising POMs trainers who reviewed the data with the interviewers before forwarding to the Project Office – the
study coordinators already mentioned, Fiona Coffey, Maura O'Loughlin, Eilin de Paor, Karen Harrold, Joanne Kelleher,
Cabrini de Barra and Tom Hughes.
• The Data Collectors in each of the participating service providers.
• The people who agreed to be interviewed and to share their current experiences with us, allowing us to present a national
picture of their quality of life, the supports they receive and their priorities for change.
• The people who allowed us include their photograph in this report.
• Oonagh Hayes, the Project Adminstrator, who collated, inputted and cleaned the data for analysis, and Siobhan Buckley
who assisted with the layout of the report.
• Tom Hughes, Suzanne Bennett and Maura O'Loughlin who offered helpful comments on the draft report.
• And not least, the Dept of Justice Equality & Law Reform and Pobal who provided and administered respectively the
Delivering Outcomes to People project funding which made this study possible.

CONTENTS
ACKNOWLEDGEMENTS
THE SURVEY
PURPOSE OF THE SURVEY PAGE 1
THE SURVEY INSTRUMENT PAGE 1RELIABILITY OF THE DATA PAGE 2ANALYSING THE DATA PAGE 2DESCRIPTION OF THE SAMPLE PAGE 2SCORING EACH PERSONAL OUTCOME PAGE 3AGENCY SUPPORT FOR PERSONAL OUTCOMES PAGE 3PRIORITY OUTCOMES PAGE 3
THE FINDINGS OF THE SURVEY PAGE 4
1. PEOPLE’S OVERALL QUALITY OF LIFE PAGE 42. ASPECTS OF QUALITY OF LIFE PAGE 43. EFFECTIVE SUPPORT PAGE 54. IDENTIFYING PEOPLE’S PRIORITIES PAGE 7
REFLECTIONS ON THE SURVEY PAGE 8
ACHIEVING PERSONAL OUTCOMES FOR PEOPLE PAGE 8WHO IS RESPONSIBLE FOR ACHIEVING OUTCOMES? PAGE 9PROVIDING EFFECTIVE SUPPORTS PAGE 9ACCREDITATION OF SERVICE PROVIDERS PAGE 10DOES AGENCY SIZE MATTER? PAGE 10THE VALUE OF MEASURING OUTCOMES & SUPPORTS PAGE 10CONCLUDING COMMENTS PAGE 11
REFERENCES AND RESOURCES PAGE 12
APPENDICES PAGE 131. PARTICIPATING SERVICE PROVIDERS PAGE 142. DRAWING THE SAMPLE & DATA COLLECTION PAGE 153. SUMMARY TABLE OF RESULTS & BAR CHARTS PAGE 16

THE QUALITY OF LIFE OFPEOPLE WITHDISABILITIES IN IRELANDIN 2007
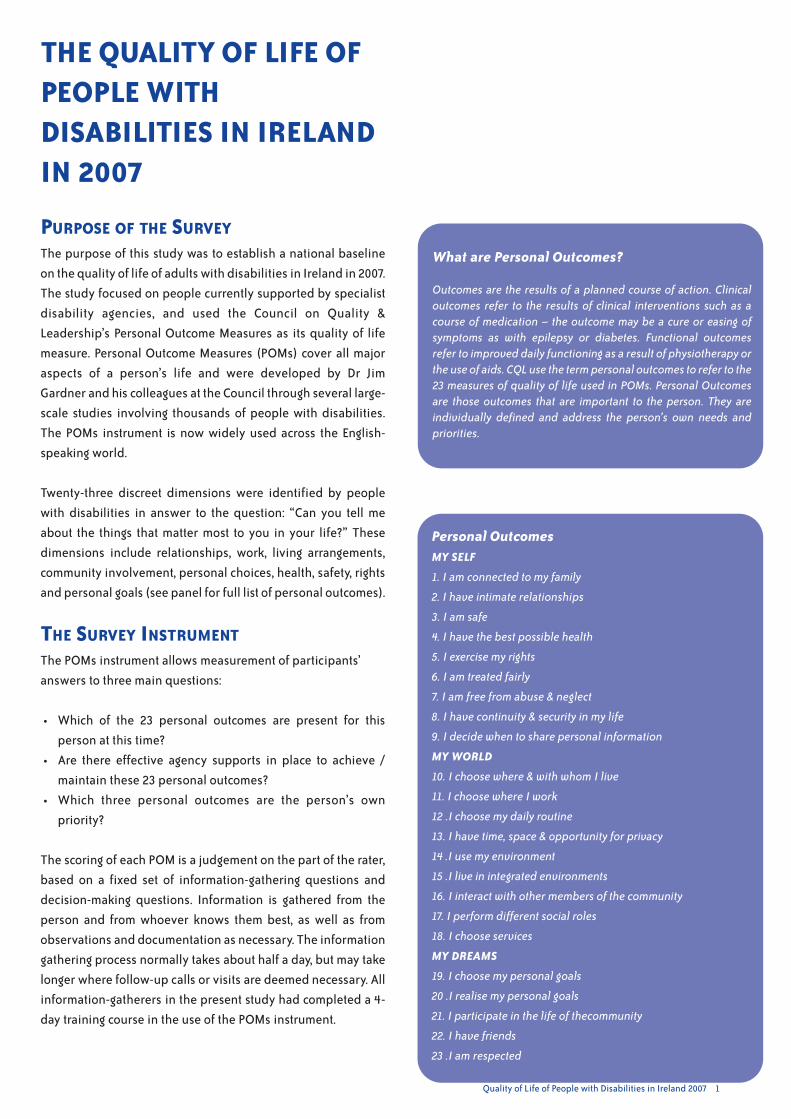
PURPOSE OF THE SURVEY
The purpose of this study was to establish a national baseline
on the quality of life of adults with disabilities in Ireland in 2007.
The study focused on people currently supported by specialist
disability agencies, and used the Council on Quality &
Leadership’s Personal Outcome Measures as its quality of life
measure. Personal Outcome Measures (POMs) cover all major
aspects of a person’s life and were developed by Dr Jim
Gardner and his colleagues at the Council through several large-
scale studies involving thousands of people with disabilities.
The POMs instrument is now widely used across the English-
speaking world.
Twenty-three discreet dimensions were identified by people
with disabilities in answer to the question: “Can you tell me
about the things that matter most to you in your life?” These
dimensions include relationships, work, living arrangements,
community involvement, personal choices, health, safety, rights
and personal goals (see panel for full list of personal outcomes).
THE SURVEY INSTRUMENT
The POMs instrument allows measurement of participants’
answers to three main questions:
• Which of the 23 personal outcomes are present for this
person at this time?
• Are there effective agency supports in place to achieve /
maintain these 23 personal outcomes?
• Which three personal outcomes are the person’s own
priority?
The scoring of each POM is a judgement on the part of the rater,
based on a fixed set of information-gathering questions and
decision-making questions. Information is gathered from the
person and from whoever knows them best, as well as from
observations and documentation as necessary. The information
gathering process normally takes about half a day, but may take
longer where follow-up calls or visits are deemed necessary. All
information-gatherers in the present study had completed a 4-
day training course in the use of the POMs instrument.
What are Personal Outcomes?
Outcomes are the results of a planned course of action. Clinicaloutcomes refer to the results of clinical interventions such as acourse of medication – the outcome may be a cure or easing ofsymptoms as with epilepsy or diabetes. Functional outcomesrefer to improved daily functioning as a result of physiotherapy orthe use of aids. CQL use the termpersonal outcomes to refer to the23 measures of quality of life used in POMs. Personal Outcomesare those outcomes that are important to the person. They areindividually defined and address the person’s own needs andpriorities.
Personal OutcomesMY SELF
1. I am connected to my family
2. I have intimate relationships
3. I am safe
4. I have the best possible health
5. I exercise my rights
6. I am treated fairly
7. I am free from abuse & neglect
8. I have continuity & security in my life
9. I decide when to share personal information
MY WORLD
10. I choose where & with whom I live
11. I choose where I work
12 .I choose my daily routine
13. I have time, space & opportunity for privacy
14 .I use my environment
15 .I live in integrated environments
16. I interact with other members of the community
17. I perform different social roles
18. I choose services
MY DREAMS
19. I choose my personal goals
20 .I realise my personal goals
21. I participate in the life of thecommunity
22. I have friends
23 .I am respected
Quality of Life of People with Disabilities in Ireland 2007 1
RELIABILITY OF THE DATA
For the purposes of the present study, additional steps were
put in place to ensure the reliability of the data collected.
These included:
• Having a named Study Coordinator in each agency who
undertook to oversee the random selection of
participants, the allocation of trained interviewers, the
availability of a certified POMs trainer, and liaison with
the Project staff. (A briefing day was held for Study
Coordinators at the beginning of the year)
• Interviews were undertaken by a team of two trained
interviewers working together, from information-
gathering through to scoring of Outcomes.
• In each agency, a certified POMs trainer reviewed the
information gathered and the scoring by the teams of
interviewers working in that agency. Where necessary
the evidence for particular scores were reviewed and re-
scored if appropriate.
ANALYSIS OF THE DATA
Following completion of the data collection process, the
anonymised scoring sheets were forwarded by the local Study
Coordinator to the Project office for data inputting, checking,
cleaning, and analysis. Analysis was undertaking by the Project
team using the statistical software programme SPSS v.14.
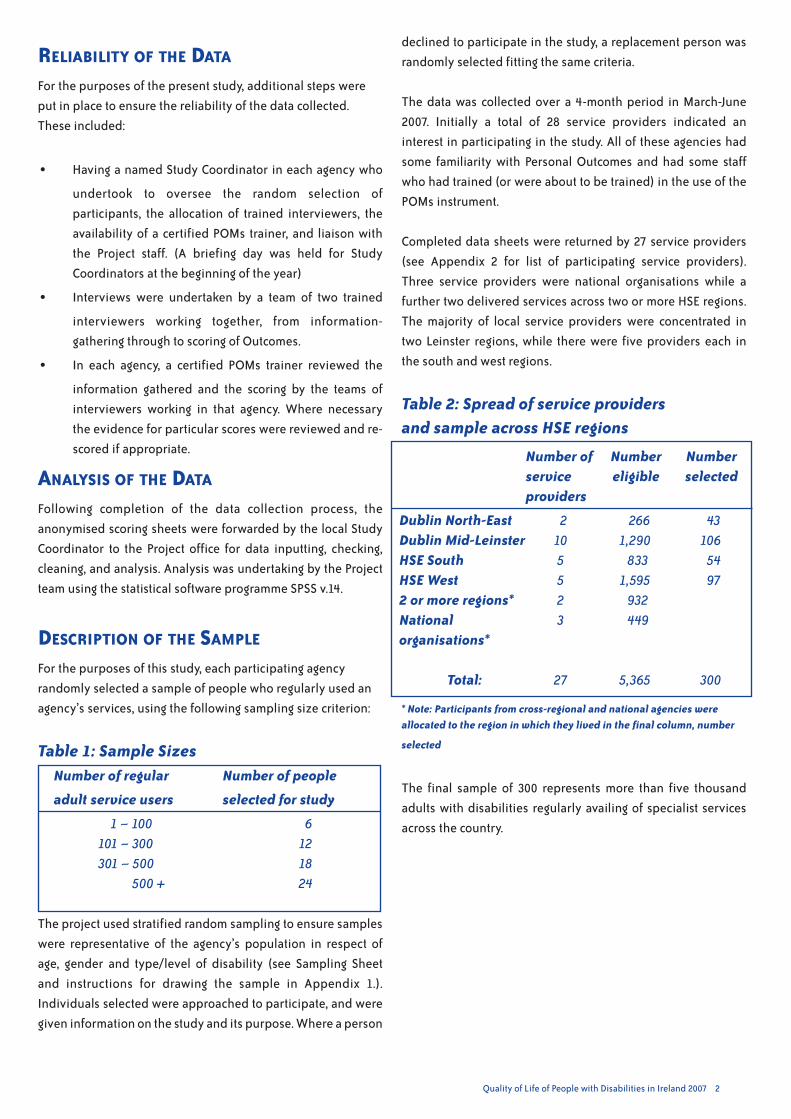
DESCRIPTION OF THE SAMPLE
For the purposes of this study, each participating agency
randomly selected a sample of people who regularly used an
agency’s services, using the following sampling size criterion:
Table 1: Sample SizesNumber of regular Number of people
adult service users selected for study
1 – 100 6101 – 300 12301 – 500 18
500 + 24
The project used stratified random sampling to ensure samples
were representative of the agency’s population in respect of
age, gender and type/level of disability (see Sampling Sheet
and instructions for drawing the sample in Appendix 1.).
Individuals selected were approached to participate, and were
given information on the study and its purpose. Where a person
declined to participate in the study, a replacement person was
randomly selected fitting the same criteria.
The data was collected over a 4-month period in March-June
2007. Initially a total of 28 service providers indicated an
interest in participating in the study. All of these agencies had
some familiarity with Personal Outcomes and had some staff
who had trained (or were about to be trained) in the use of the
POMs instrument.
Completed data sheets were returned by 27 service providers
(see Appendix 2 for list of participating service providers).
Three service providers were national organisations while a
further two delivered services across two or more HSE regions.
The majority of local service providers were concentrated in
two Leinster regions, while there were five providers each in
the south and west regions.
Table 2: Spread of service providersand sample across HSE regions
* Note: Participants from cross-regional and national agencies were
allocated to the region in which they lived in the final column, number
selected
The final sample of 300 represents more than five thousand
adults with disabilities regularly availing of specialist services
across the country.
Quality of Life of People with Disabilities in Ireland 2007 2
2 266 4310 1,290 1065 833 545 1,595 972 9323 449
27 5,365 300
Dublin North-EastDublin Mid-LeinsterHSE SouthHSE West2 or more regions*Nationalorganisations*
Total:
Number of Number Numberservice eligible selectedproviders

Quality of Life of People with Disabilities in Ireland 2007 3
Table 3: The disability focus of participatingservice providers (N=27)
The number of regular service users in the participating
agencies ranged from 6 to 879 with an average of about 200
regular service users.
Sample sizes in the participating agencies ranged from 5 to 24,
with a mean of 12. More men than women participated in the
study (58% male), and a majority were 35 years of age or older
(58%). The most common primary disability was intellectual
disability (85% of participants), more than three-quarters of
whom had a mild or moderate intellectual disability. Only I-in-
10 participants had a physical disability, and 1-in-25 were on
the autistic spectrum.
Nearly half of the participants lived at home while more than 1-
in-4 lived in a community house. Only 1-in-8 lived in a larger
campus setting.
The majority of those living at home were under-35, while older
adults were more likely to live in community houses or live
independently.
SCORING EACH PERSONAL OUTCOME
The POMs instrument requires stringent scoring. If any aspect of
a personal outcome is absent, the outcome is scored as not
present. For example, the personal outcome “People are free
from abuse and neglect” will not be scored present if the person
is still bothered about abuse, neglect, or exploitation that
happened in the past.
Equally the personal outcome “People are safe” will not be
scored present if the person does not feel safe – if they worry
about a risk which staff do not consider substantial. For
example, if the person is worried about getting out in the event
of a fire, then they do not consider themselves safe, even
though there may be fire procedures in place. The person's own
concerns must also be addressed. In other words, these
personal outcomes must be considered to be present both by
the person in question as well as by an objective observer; they
are assessed both subjectively and objectively.
AGENCY SUPPORT FOR PERSONAL OUTCOMES
As well as determining whether each of the 23 personal
outcomes are present to the person’s satisfaction, information-
gatherers must also decide if there is effective agency support
for each of these outcomes.
Agency support generally means staff time and other agency
resources. To be scored present, there must be effective support
in place for this particular individual. An effective support
means one that will achieve the desired outcome within a
reasonable period – usually within the next six months (a major
personal outcomes such as a new place to live, may take up to
12 months and still be considered effective support). Scoring a
support as present means that the rater is confident that this
personal outcome will be achieved with the supports that are
currently available to this person.
PRIORITY OUTCOMES
Almost everyone with a disability has a less than perfect quality
of life. In terms of improving a person’s quality of life, the
starting point is the person’s own priorities. The person’s
priorities will generally emerge clearly from the discussion
about their current quality of life. What aspects of their life does
the person want addressed without delay? What are their
priorities? Knowing the person’s priorities creates an excellent
starting point for person-centred planning.
Information-gatherers were asked to elicit each person’s top
three priorities for the purpose of this study.
Number of Primary Number of Numberservice disability of eligible for studyproviders participants participants
2 asd 100 133 physical 424 3122 I.D 4,640 256
Total 27 5,164 300
Example of an effective support: ‘I have friends’Agencies cannot manufacture friends for people, but should supportopportunities where friendships may develop – with co-workers,neighbours, peers. Support may also involve training, or arrangingtransport, or helping with writing cards, texting and phone calls.People with communication problemsmay need particular supports.But first, the agency needs to understand what the person wants inthe line of friendships, and what obstacles they face, before workingout with the person what support they need.
Example of a Personal Outcome: ‘I have friends’Friendship is a two-way voluntary relationship; hence paid staffcannot be counted as friends. In gathering information regardingthis outcome, the key questions are:• Does the person have any friends?• Do they have enough friends?• Do they have enough contact with their friends?• Are the number of friends and the amount of contact
satisfactory to the person?
Only if the answer to these questions is Yes, is the outcomeconsidered fully present.

Quality of Life of People with Disabilities in Ireland 2007

Quality of Life of People with Disabilities in Ireland 2007 4
THE FINDINGS OF THESURVEY1. PEOPLE’S OVERALL QUALITY OF LIFE
The participants in the survey reported an average of 10 out of
23 personal outcomes fully present at the time of the study.
While the average was 10 outcomes, individual scores varied
greatly, Two participants had no personal outcome fully present,
while one person had all 23 outcomes present.
There was no significant difference in scores between men and
women, or between younger and older participants. But there
was a notable difference based on where participants lived.
Those living independently scored highest (average15
outcomes) while those in campus settings scored lowest
(average 7 outcomes). Participants who lived at home had, on
average, 10 personal outcomes fully present.
Generally the number of personal outcomes present varied with
the type and severity of the disability. Participants with physical
disabilities averaged higher (13 outcomes) than those on the
autistic spectrum (11) or with a mild/moderate (10) or
severe/profound (7) intellectual disability.
Where people lived was also associated with the number of
personal outcomes present. Twice as many participants who
lived on a campus achieved less than 10 outcomes, as
participants living in community housing.
Level of disability and living arrangements mutually interact.
Participants with a mild or moderate learning disability were
twice as likely to live at home as participants with a severe or
profound intellectual disability, who in turn were eight times
more likely to live in campus accommodation.
2. ASPECTS OF QUALITY OF LIFE
The POMs instrument assesses 23 different dimensions of the
person’s quality of life. The survey found considerable variation
across these various dimensions or “personal outcomes”. The
outcomes most often present are set out in Figure 3 below.
You would expect that most participants would report that they
were free from abuse, neglect and exploitation, and that they
would have adequate privacy. Also that they would have enough
involvement with their families, would be and feel safe, and
would enjoy the best possible health. A majority of participants
also reported that they achieved at least one important personal
goal in the past year.
On the other hand, only one-participant-in-six had a choice
about where and with whom they lived. Less than one-in-five
had all their rights respected. Less than one-in-four had any
0 2 4 6 8 10 12 14 16
total survey
other
campus
community house
living independently
family home
Figure 1: Average personal outcomes in different living arrangements
0 2 4 6 8 10 12 14
total survey
sever/profound ID
mild/moderate ID
autistic spectrum
physical
Figure 2: Average personal outcomes for different types/levels of disability

Quality of Life of People with Disabilities in Ireland 2007 5
choices about where they worked. Only one-in-four chose
personal services such as hairdresser, dentist or doctor. And
only a quarter experienced life in ordinary settings – living in
ordinary housing, working in ordinary work-places and being in
ordinary leisure places.
While no-one’s quality of life is perfect or fully to their
satisfaction, these results suggests there is a lot of room for
improvement in the lives of people with disabilities in Ireland.
A quarter of the participants had five or less of the 23 personal
outcomes fully present.
3. EFFECTIVE SUPPORT TO ACHIEVE
PERSONAL OUTCOMES
People with disabilities require flexible and responsive support
in order to improve their quality for life. Indeed this is the very
reason specialist agencies exist.
The survey assessed the effectiveness of agency support to
each participant. Information was gathered in relation to
effective supports for each of the 23 personal outcomes, and in
the light of this information, assessors had to decide if effective
support was in place for this person to fully achieve this
outcome. Effective support means supports that the assessor
was confident would result in the outcome being achieved in
the next 6 to 12 months, depending on the particular outcome in
question. (Finding a job or a new home might take much longer
than joining a club or arranging a health check-up.)
The participants in the survey had effective agency supports in
place for 10 of the 23 personal outcomes, on average.
0 10 20 30 40 50 60 70 80
I choose my routines
I have the best health
I am safe
I realise my goals
I am connected to family
I have privacy
I am free from abuse
Figure 3: Personal outcomes most often present (%)
Quality of Life or Service Standards?Quality of life is a universal concept that has been applied towhole populations, and to diverse groups such as immigrants,suburban dwellers, patients recovering from surgery, and peoplerecovering from mental illness. It is accepted that quality of lifevaries for individuals based on their personal circumstances,recent life events, personal wealth, social capital and otherfactors, and is not a constant. Relatively few people achieve a“perfect” quality of life, but everyone aspired to a very goodquality of life. Recent scholarship suggests that quality of life isboth personally defined and is influenced by group orcommunity expectations or 'norms'.
'Standards' usually refer to basic requirements set by aregulatory body which must be met by a service provider. Somestandards may incorporate legislative requirements, or widelyaccepted “good practice”. In general standards are highlyprescriptive, and there are sanctions when the set standards arenot met.
Standards tend to focus on the service provider, while quality oflife focuses on the individual supported by the service.
Both standards and quality of life measures have value indisability services, the former to ensure basic requirements aremet, the latter to promote flexibility, responsiveness and thepursuit of excellence in service provision.
0 10 20 30 40 50 60 70 80
I live in integrated settings
I choose services
I choose where I work
I choose with whom I live
I exercise my rights
Figure 4: Personal outcomes least often present (%)

Quality of Life of People with Disabilities in Ireland 2007 6
Some personal outcomes were more likely to be supported
than others. Personal privacy, links to families, and achieving
personal goals were effectively supported for two-thirds of the
participants. Agencies also effectively supported best possible
health, personal safety, and protection from abuse, neglect and
exploitation for a majority of participants.
The personal outcomes that received least support were
support in exercising rights, in choosing where and with whom
to live, being in ordinary places, choosing personal services and
controlling personal information.
4. THE LINK BETWEEN OUTCOMES AND
SUPPORTS
Are personal outcomes linked to effective supports? Effective
support for any outcome should lead to that outcome being
achieved in time – or being maintained when the outcome is
already in place to the person's satisfaction.
Our survey found that overall there was a strong association
(or correlation) between the achievement of personal
outcomes, and effective supports from the service provider. In
other words, where outcomes were high, supports were also
high.
5. THE IMPACT OF ACCREDITATION
At the time of the survey, six service providers were accredited
by the Council on Quality & Leadership (CQL). These accredited
services, not surprisingly, scored higher on average on outcomes
and supports, as Table 3 shows. These services had undertaken
sustained work over two or more years supporting people's
personal outcomes, and so you would expect to find more
effective supports and more personal outcomes achieved, on
average, than the other services.
Average supports and outcomes were higher on all 23 supports
and on 22 of the 23 personal outcomes – only on "I realise my
personal goals" were accredited organisations marginally
behind.
Table 4: Comparison of personal outcomes andeffective supports in accredited and non-accredited service providers (N=27)
Average Averagetotal totaloutcomes supports
Accredited (N=6) 12.2 14.7Non-accredited (N=21) 6.6 7.9
0 10 20 30 40 50 60 70 80
I have continuity/security
I choose my routines
I am respected
I am free from abuse
I am safe
I have the best health
I realise my goals
I have privacy
I am linked to my family
Figure 5: Effective supports most commonly in place (%)
0
0 10 20 30 40 50 60 70 80
I am treated fairly
I have intimacy
I have friends
I decide on personal info
I choose services
I live in integrated settings
I choose with whom I live
I exercise my rights
Figure 6: Effective supports least often present (%)

Quality of Life of People with Disabilities in Ireland 2007 7
6. SIZE OF AGENCY
Service providers were broken down into three groups
according to the number of people they supported on a regular
basis: 1-100; 101-300; 301+ people supported.
Our analysis found that the size of the agency was not
associated with a significant difference in average outcomes or
supports achieved.
7. IDENTIFYING PEOPLE’S PRIORITIES
For each survey participant, their three top priorities were
identified. The most common priorities were: people wanted to
choose their personal goals to work on; people wanted to
choose where they worked; people wanted to choose where
and with whom they lived; and people wanted to take an active
part in their local community.
While the graph below shows the most common priorities,
every personal outcome was a priority for someone in our
survey.
0 5 10 15 20 25 30 35
I have best possible health
I take part in community
I choose with whom I live
I choose where I work
I choose my own goals
Figure 7: Participants' most common priorities (%)

Quality of Life of People with Disabilities in Ireland 2007 8
REFLECTIONS ON THESURVEYACHIEVING PERSONAL OUTCOMES FOR PEOPLE
On average, participants had less than half their personal
outcomes fully present at the time of the survey. Only 30% of the
participants had more than half present. This certainly leaves
room from improvement.
The threshold for accreditation by the Council on Quality and
Leadership (CQL) is, on average, more than half the outcomes
fully present, as well as meeting all ten Basic Assurances fully,
and other requirements. A concerted effort by service providers
will see this average rise steadily as proven by the six accredited
agencies.
Participants who lived in campus settings and had a severe or
profound intellectual disability generally achieved fewer
personal outcomes. In other words, people with more severe
disabilities living in larger congregate settings are likely to have
a poorer quality of life. This is hardly surprising. They will
require more individual support than others to achieve their
personal outcomes. While we cannot change their disability,
changing the setting would offer more opportunities for
community integration, participation and interaction.
In this report we have focused on average or ‘mean’ scores. This
masks the variation in scoring even within sub-groups. For
example, participants with a severe or profound intellectual
disability scored lowest on average. But the number of
outcomes present ranged from zero outcomes fully present, to
17 outcomes fully present. And there was an even wider
variation in supports present.
No personal outcome was fully present for everyone, not even ‘I
am free from abuse and neglect’, or ‘I have time, space and
opportunity for privacy’. There are a number of reasons for this:
• the outcomes are strictly assessed and any doubt regarding
the outcomes will result in it being considered not fully
present (the ‘if in doubt, no’ rule);
• secondly, the outcome may be present when the person is in
the service setting, but not present at home or when they are
independently in the community;
• thirdly, in the case of abuse or neglect, past events which
have not been fully resolved may result in the person
considering the outcome not present.
However, the most common reason a personal outcome is not
fully present is that the service provider has not really
addressed it to the person’s satisfaction.
Addressing some outcomes will require significant resources.
For example, choosing where and with whom you live, is an
outcome service providers struggle with. Usually it is the
professional staff who make these decisions based on their
judgment of how people will get on, staffing levels,
qualifications of staff, convenience to day services and bus
routes. Yet living day in, day out in close proximity with
someone you don’t get on with, can be a living hell for some
people. So it is not surprising that ‘I choose where and with
whom I live’ is a priority for almost one-in-four of the survey
participants. Service providers and families may need to be
creative, offering more flexible arrangements - renting, moving
between houses, building an annex to the family home - while
listening to the person.
Working with people with communicationdifficultiesIt is most important tomeet with the person directly. If a support staffis present, questions are still directed to the person. It is important tofind out how the person communicates - verbally, with LAMH signs orhis own gestures, Picture Board, Talking Mat, PECS, individual’s ownsounds or body movements, or a combination of these or othermeans. Also find out from those who know the person best whathelps or hinders the person’s communication For example, what arehis favourite topics of conversation, having his photo album open,having minimal noise or other distractions, not just before dinnertime or during 'Coronation Street', having his Communication Boardin front of him, using signs as you ask him a question.
Talk to other people who are close to the person, to validate whatyou think you’re hearing. Also be aware of the effects of medication,poor hearing, or feeling unwell on the person’s communication.
If someone else is speaking on behalf of the person, in his presence,ask ‘What does Simon tell you he likes to do… during the day?’ and‘Howdo you knowhe likes that?’ 'Howdo you knowwhen the persondoesn’t want to talk about something or wants to stop?'
Always look to the person for ideas and directions – don’ t forget tostop talking, wait, observe the person and listen towhat they’re tryingto tell you or draw your attention to. Sometimes, we are trying so hardto elicit information from people that we miss what they’re trying totell us, even if it is that they’re bored and want their tea! Silence isokay – it gives the person time to respond or begin a new topic.
It may be helpful to use a tool like the Personal Outcomes SymbolPack to elicit information. These symbols may also help the personover time to know what you mean when you ask about health orbeing safe or having relationships. Some services use the symbolsaround the buildings to highlight the different areas covered byPOMs.
Judging whether an Outcome is present or not, can sometimes bedifficult for the more abstract outcomes such as social roles andrights. You may have to make a judgement based on what youobserve happening and hear from others who are close to theperson, as well as what the person is ‘saying’. You can usually make areasonable judgement of this and of the person’s priorities bykeeping an open mind, listening and observing and not making anyassumptions

Quality of Life of People with Disabilities in Ireland 2007 9
Supported Decision-MakingWhere a person with intellectual disability wishes to enter a contract(for example, to rent accommodation) or to agree to medicaltreatment, they must have the capacity to consent. This means theymust understand, in general terms, the decision and its consequencesand, free from undue influence, communicate their decision - givetheir consent. Supported decision-making is where the person isassisted by 2 or 3 others whom they trust – family members and otherswhom they know well, who will understand and communicate theirwishes. Supported decision-making has legal status in BritishColumbia and is being considered in other jurisdictions. In legalterms, it falls between full decision-making capacity, and Ward ofCourt or Public Guardianship.
Outside of the strict legal context, supported decision-making can be atool to allow people with severe intellectual disability orcommunication difficulties, to have their voices heard and theirchoices respected.
Other personal outcomes, such as ‘I choose my daily routine’ requirechanges in staff practices and greater flexibility in the organising of acommunity house. Sometimes agency policies, insurance clauses andstaff assumptions disempower people in their efforts to exercise somecontrol over their own lives. The personal outcomes frequently usethe phrase ‘I choose..’ and these outcomes require that the personhas some options regarding where they work, where they shop orwhat they want to achieve. (Saying you like something doesn’t meanyou wouldn't prefer something else if there was a choice!)
Some outcomes, such as ‘I exercise my rights’, are a major challenge tothe way we treat people with disabilities and the assumptions wemake regarding our decision-making role in their lives. Such outcomesrequire a cultural change at all levels of service organisations, a shiftfrom our traditional benign charity ethos where professionals knowbest, to an empowering rights-based approach where the person isreally listened to and respected.
WHO IS RESPONSIBLE FOR ACHIEVING
OUTCOMES?
The responsibility for ensuring personal outcomes are achieved
does not fall solely to frontline staff.
• Outcomes that require re-allocation of significant resources
(e.g. choices in where and with whom people live; the move
from sheltered employment to supported employment; the
development of policies relating to expression of sexuality)
will involve the Board and senior management of an agency.
• Outcomes that require organisational initiatives (e.g.
promoting staff retention; policies and practice on access to
personal information; choosing personal services) will
require the active support of managers.
• Outcomes that require changes in daily practices (e.g.
choosing your daily routine) may well fall within the control
of frontline staff. The survey found that almost half of the
participants did not achieve this outcome.
The survey found that only a quarter of people with disabilities
supported by specialist agencies spend their whole day in
ordinary settings - or make an informed choice to spend part of
their day in a segregated setting. In other words, specialist
agencies tend to only support people in segregated settings,
even though nearly half of this sample lived at home.
This finding highlights the need to develop more integrated
services, to maintain people in their local communities rather
than remove them into special settings. The newer models of
service such as individualised service design, supported
employment and supported living, offer this potential.
PROVIDING EFFECTIVE SUPPORTS
If personal outcomes are a measure of quality of life, then
effective supports are a measure of quality of service.
Service providers exist to support people to have a better
quality of life. While people’s quality of life is not solely down to
the service provider – families and individuals themselves may
independently achieve some personal outcomes – the survey
found a strong association between the presence of outcomes
and the presence of supports. Increasing effective supports
should naturally result in more outcomes being fully present.
In other words, where the number of supports present is higher
than the number of outcomes present, more outcomes will
Figure 8: Levels of Change
Frontline Staff
M anagem ent
Agency
Outcome
I choose my daily routine
I have continuity & security
I choose where & withwhom I live
FRONTLINE STAFF
MANAGEMENT
AGENCY
UN Declaration on the Rights of the Person with aDisabilityOn 30th March 2007, Ireland signed the United Nations Conventionon the Rights of Persons with Disabilities. When ratified, theConvention will be binding on Ireland under international law. Noneof the rights set out in this Convention are new. People withdisabilities have exactly the same rights as everybody else. What theDeclaration did is set out the obligation on ratifying states to providethe necessary supports to enable people with disabilities exercisetheir rights, both civil / political rights and social / economic rights.
An example of a social /economic right is found in Article 19 of thenew Convention: ‘States Parties to this Convention recognise theequal right of all persons with disabilities to live in the communitywith choices equal to others … (a) Persons with disabilities have theopportunity to choose their place of residence and where and withwhom they live on a equal basis with others, and are not obliged tolive in a particular living arrangement.’

Quality of Life of People with Disabilities in Ireland 2007 10
follow. Our survey found only a marginal difference (an average
of 9.8 personal outcomes, and 9.9 supports), so there is a need
to increase the supports if we are to see a substantial
improvement in the number of personal outcomes present.
Because personal outcomes are individually defined, blanket
supports will not necessarily work. The support service can only
identify the right supports after the person has articulated the
outcome they are looking for. This is obvious in relation to work,
for example. It’s not a question of finding any job; it’s a question
of finding the type of job the person wants.
This is where the POMs dovetail with person-centred planning.
Achieving personal outcomes demands a person-centred
approach. By identifying the person’s priorities, the task of
developing an individual plan becomes much easier, as Figure
9 below shows.
ACCREDITATION OF SERVICE PROVIDERS
At the time of the survey, six service providers were fully
accredited with CQL – Sunbeam House Services, Western Care
Association, Step Enterprises, St Michael’s House, Breanann
Services and Carmona Services – and the survey showed these
service providers achieving considerably higher average
outcomes and supports than the non-accredited services. While
it should be noted that none of these accredited services
included large institutions, it is likely that the decision to seek
accreditation gave a focus to their efforts that motivated
management and staff, and involved widespread staff training
and improved individual planning.
The CQL accreditation process is expensive especially for small
agencies, as it involves a team of CQL staff spending up to a
week in an agency, interviewing people supported and their
staff, assessing organisational assurances, values,
responsiveness and interaction with the local community.
However there is no requirement that an agency using personal
outcomes must be accredited, and the Delivering Outcomes to
People project has, with the support of CQL, begun working
with a large number of smaller agencies, training their staff and
management in the implementation of personal outcomes.
At the end of the day, it is far more important that we work to
improve people’s quality of life, than that agencies get the
kudos of accreditation. But it is clear that seeking accreditation
focuses and motivates agencies to support people achieve
more personal outcomes.
DOES AGENCY SIZE MATTER?When it comes to delivering personal outcomes, the size of the
agency does not matter. Smaller services were as effective as
larger services in this survey in achieving outcomes and in
providing effective supports for people. There is probably a
trade-off here between the better-resourced larger agencies
and the more flexible local service.
CQL’s research on a large sample of 3,630 people from 552
organisations in the United States found that people supported
by small-to-medium-sized organisations (26-200 people) had
more personal outcomes present. In analysing the findings for
people with severe and profound intellectual disability,
organisations serving 26 – 100 individuals did best while
organisations serving more than 500 people did least well.
(Given the smaller size of these sub-categories in the present
sample, we could not reliably replicate this analysis.)
The regionalising of some of the larger agencies is attempting to
bring services closer to the people served, thus becoming more
responsive to people's needs.
THE VALUE OF MEASURING OUTCOMES AND
SUPPORTS
By creating valid and reliable data, the POMs instrument allows
agencies to measure progress in a number of ways:
• Mapping individual change: As POMs data is collected each
year, it is easy to plot a person’s outcomes and supports, and
see what additional outcomes are now in place, and what
supports are in place, and which are still missing.
• Monitoring organisational progress over time: by repeating
the data collection each year, an agency can map its progress
over time. There should be a steadily increasing number of
outcomes achieved, and more importantly, an increase in
effective orgnaisational supports. Equally progress in
achieving particular outcomes such as rights or privacy can
be easily mapped also to assess progress.
• Comparisons with national and international data: A service
provider can compare their results with the national picture
and with international studies, identifying relative strengths
and challenges.
Figure 9: Implementing Personal Outcomes through Person-Centred Planning
PP OOMMss
PP OOMMss
1. INFORMATION GATHERING
2. IDENTIFY PRIORITIES
3. AGREE PLAN
4. IMPLEMENT
5. SIX-MONTH REVIEW
The 5-StepApproach

Quality of Life of People with Disabilities in Ireland 2007 11
• As a check on internal systems: The My Self section of the
POMs instrument (Outcomes 1 – 9) provides an effective
check on the operation of the Basic Assurances – safety,
abuse, rights & complaints, health, security, family
involvement. If these outcomes are falling short, then the
organisational systems are not working properly.
• Checking the effectiveness of Person-Centred Planning: If
the individual plans are intended to achieve particular
outcomes (i.e. the person’s priorities), then the following
year’s POMs data should verify that those plans have been
successful. If this hasn't happened, supports may need to be
more closely tailored to what the individual is looking for. As
the person becomes more aware of an issue, and their
expectations rise, delivering outcomes can become more
demanding – eg. rights – thought they had them, then
learned more about their rights and found they weren't
present.
In this way POMs data can fulfill a range of mapping, monitoring
and verifying functions within the agency, giving senior
management continuous data to evaluate organisational
systems and agency effectiveness.
CONCLUDING COMMENTS
The successful completion of this national survey required a
high level of cooperation and support among a large number of
service providers. It shows a commitment on the part of these
organisations to deliver more effective services. The snapshot it
provides of the quality of the lives of people with disabilities,
presents a challenge of considerable proportions: that is, to
systematically and continually enhance people’s lives through
providing effective supports to them, to achieve the outcomes
they desire.
We are only at the beginning of this road – and further analysis
of this data will yield further learning.
The tools are now there to gather reliable data, to ascertain
people’s priorities, and to develop and implement individual
plans to address these priorities. There will never be enough
resources, enough manpower, enough community support and
opportunity. Those are the excuses. The challenge is to work
more effectively with the resources and opportunities we have,
to work closely with families and with local communities to
create opportunities for a life worth living for the people we
support.

Quality of Life of People with Disabilities in Ireland 2007 12
REFERENCES & RESOURCESBOOKS & ARTICLES
Gardner, J.F., Carran, D.T. & Nudler, S. (2001) Measuring quality of life and quality of services through personal outcome
measures: Implications for public policy. International Review of Research in Mental Retardation, 24, 75-100.
Gardner, J.F. & Nudler, S. (eds.) (2001) Quality Performance in Human Services: Leadership, Values and Vision. Baltimore:
Brookes.
Gardner, J.F., Nudler, S. & Chapman, M. (1997) Personal outcome measures of quality. Mental Retardation, 35, 295-305.
Gardner, J.F. & Carran, D.T. (2005) Attainment of personal outcomes by people with developmental disabilities. Mental
Retardation, 43, 157-174.
These Council Publications and others are available from their website: www.the council.org
• Overview of Quality Measures 2005
• Shared Values
• Basic Assurances
• Personal Outcome Measures 2005 Edition
• Responsive Services
• Community Life
• All about Rights: A Guide to Supporting the Rights of People with Intellectual Disabilities
• A Quality Measures 2005 Complete Set of 6 Manuals
• A Proactive Guide to Incident Management
• Assessment Workbook for use with Personal Outcome Measures 2000 Edition.
WEBSITES
Delivering Outcomes to People: www.outcomestopeople.ie
The Council for Quality and Leadership (CQL): www.thecouncil.org
CQL Canada: www.accreditationontario.com
Health Information and Quality Authority: www.hiqa.ie
National Disability Authority: www.nda.ie
Inclusion Ireland: www.inclusionireland.ie
People with Disabilities in Ireland: www.pwdi.ie
National federation of Voluntary Bodies: www.fed-vol.com
Disability Federation of Ireland: www.disability-federation.ie
Not for profit Business Association email: [email protected]
Quality of Life of People with Disabilities in Ireland 2007 13
APPENDICES
1. SERVICE PROVIDERS WHO PARTICIPATED IN THE SURVEY
2. INSTRUCTIONS FOR DRAWING THE SAMPLE & DATA COLLECTION SHEET
3. SUMMARY TABLE AND BAR CHARTS OF RESULTS

Quality of Life of People with Disabilities in Ireland 2007 14
APPENDIX 1
THE SERVICE PROVIDERS WHO PARTICIPATED IN THE SURVEY
SUNBEAM HOUSE SERVICES
CHEEVERSTOWN HOUSE
CHESHIRE IRELAND
ST MICHAEL’S HOUSE
GHEEL AUTISM SERVICES
IRISH WHEELCHAIR ASSOCIATION
WESTERN CARE ASSOCIATION
MALTA SERVICES
PEACEHAVEN TRUST
IRISH SOCIETY FOR AUTISM
PROSPER FINGAL
ST PATRICK’S KILKENNY
ANNE SULLIVAN CENTRE
DARA RESIDENTIAL
WALKINSTOWN ASSOCIATION
LORREQUER HOUSE
BROTHERS OF CHARITY SERVICES AT:GALWAY
ROSCOMMON
CLARE
LIMERICK
SOUTH
WATERFORD
HOSPITALLER ORDER OF ST JOHN OF GOD SERVICES AT:MENNI
STEP ENTERPRISES
CARMONA
BREANNAN

Quality of Life of People with Disabilities in Ireland 2007 15
APPENDIX 2
INSTRUCTIONS FOR DRAWING THE SAMPLE FORM A:
NATIONAL BASELINE STUDY
Name of Agency/Organisation (e.g. Sunbeam House Services Ltd):
___________________________________________________
1. Define what Geographic Area is being Sampled for this National Baseline:
(e.g. County Wicklow, excluding west Wicklow)
____________________________________________________
Note: If the service being sampling is not defined by a fixed geographic area, please explain how the group
being sampled is defined:
(e.g. St Patrick's, Kilkenny - all adult residents)
_______________________________________________________
2. Total number of adults the service provides services to in this area: ______
3. Number of Eligible Adults (i.e. receive regular weekly service): ______
4. Breakdown of Eligible Adults:
Men: ____ Women: ____ Aged 18-34: ____ Aged 35+ ____
Primary Disability: ASD: _____ Physical/Sensory: ____
Intellectual Disability: ____ *Mild/Moderate: ____
Severe/Profound: ____
5. Name of Baseline Study Coordinator: ________________________
6. Data Sheets sent to Outcomes Project Office on: ___ / ___ / '07
* Note: Any adult assessed as "borderline" should be included in the mild / moderate category. Any adult who has not been formally
assessed, should be allocated to either the mild/moderate or the severe/profound groups based on the opinion of staff who know
them well.

Quality of Life of People with Disabilities in Ireland 2007 16
Category Male Female 18-34 35+ Total
Physical/Sensory
ASD
ID - M/M
ID – S/P
Total
Please indicate the total number in each cell, and the number selected for the Sample.
FORM B:BREAKDOWN OF TOTAL ELIGIBLE SAMPLE BY AGE, GENDER, DISABILITY / LEVEL OF ABILITY

Quality of Life of People with Disabilities in Ireland 2007 17
Date: __ / __ / '07
OUTCOMES OutcomePresent
IndividualSupport Present
3 Top Priorities
MY SELF
1. People are connected to their natural support Networks
2. People have Intimate Relationships
3. People are Safe
4. People have best possible Health
5. People exercise Rights
6. People are treated Fairly
7. People are free from Abuse / Neglect
8. People have Continuity & Security
9. People decide when to share personal Information
MY WORLD
10. People choose where /& with whom they Live
11. People choose where they Work
12. People choose their Daily Routine
13. People have time, space, & opportunity for Privacy
14. People use their Environments
15. People live in integrated Environments
16. People Interact with other members of community
17. People perform di!erent Social Roles
18. People choose Services
MY DREAMS
19. People choose personal Goals
20. People realise personal Goals
21. People participate in the life of the Community
22. People have Friends
23. People are Respected
TOTALS
Interview No: _____ Two trained interviewers Reviewed by CertiÞed Trainer
Male Female 18-34 3 5+ Primary Dis : ASD Phy/Sen ID M/M S/P
At least weekly service? Yes No
Living arrangement: with family living independently in community house (less than 10 residents)
building/campus with 10 or more residents some other arrangement
Comment
FORM C:
POMS RESULTS SHEET

Quality of Life of People with Disabilities in Ireland 2007 18
emoctuOSEMOCTUOPresent
Individual SupportPresent
3 Top Priorities
MY SELF % % %1. People are connected to their natural support
Networks 66.3 67.0 16
2. People have Intimate Relationships 47.0 33.3 7
3. People are Safe 57.3 58.0 9
4. People have best possible Health 57.0 62.3 21
5. People exercise Rights 17.7 21.0 13
6. People are treated Fairly 35.7 33.7 4
7. People are free from Abuse / Neglect 70.1* 57.6* 4
8. People have Continuity & Security 43.7 52.7 10
9. People decide when to share personal Information 27.0 31.0 4
MY WORLD
10. People choose where & with whom they Live 17.0 21.3 24
11. People choose where they Work 21.7 31.7 31
12. People choose their Daily Routine 51.3 54.0 15
13. People have time, space & opportunity for Privacy 66.7 67.0 5
14. People use their Environments 42.3 44.3 15
15. People live in integrated Environments 25.0 23.3 3
16. People Interact with other members of community 43.7 39.3 10
17. People perform di!erent Social Roles 31.3 26.7 11
18. People choose Services 22.0 23.7 8
MY DREAMS
19. People choose personal Goals 45.3 53.3 33
20. People realise personal Goals 66.0 66.0 3
21. People participate in the life of the Community 40.3 35.3 24
22. People have Friends 35.0 33.7 20
23. People are Respected 49.3 54.7 6
TOTALS 42.5 43.0
* One agency did not submit information on this outcome
APPENDIX 3:SUMMARY TABLES AND CHARTS OF RESULTS.MEAN SCORES ON OUTCOMES, SUPPORTS & PRIORITIES (N=300)

0 10 20 30 40 50 60 70 80 90 100
23 Respected
22 Friends
21 Participate
20 Realise goals
19 Choose goals
18 Choose services
17 Social roles
16 Interact
15 Integrated env
14 Use environ
13 Privacy
12 Daily routines
11 Work
10 Live
9 Personal info
8 Continuity
7 Abuse & neglect
6 Treated fairly
5 Rights
4 Health
3 Safe
2 Relationships
1 Support network
Supports Outcomes
Quality of Life of People with Disabilities in Ireland 2007 19
APPENDIX 3 CONTD:PERSONAL OUTCOMES & INDIVIDUAL SUPPORTS MEAN SCORES (N=300) (%)

Quality of Life of People with Disabilities in Ireland 2007 20
0 5 10 15 20 25 30 35
23 Respected
21 Participate
19 Choose goals
17 Social roles
15 Integrated env
13 Privacy
11 Work
9 Personal info
7 Abuse & neglect
5 Rights
3 Safe
1 Support network
Priorities
22 Friends
20 Realise goals
18 Choose services
16 Interact
14 Use environ
12 Daily routines
10 Live
8 Continuity
6 Treated fairly
4 Health
2 Relationships
APPENDIX 3 CONTD:
INDIVIDUAL PRIORITIES (N=300) (%)

Quality of Life of People with Disabilities in Ireland 2007

Quality of Life of People with Disabilities in Ireland 2007

Quality of Life of People with Disabilities in Ireland 2007 21
THE OUTCOMES NETWORK OF IRELAND
THE BRIEF OF THE OUTCOMES NETWORK OF IRELAND IS:
1. To provide a forum for discussion, sharing information and mutual learning among organisations promoting Personal
Outcomes in Ireland
2. To act as a point of contact on national issues between The Council (CQL) and the agencies in the network
3. To provide ongoing support to accredited trainers
4. To disseminate information about Personal Outcome Measures in Ireland
5. To promote the development of Personal Outcomes for individuals with disabilities in Ireland
6. To support ongoing research on Personal Outcome Measures in an Irish context
7. To provide leadership at a national level on quality enhancement issues arising from Personal Outcome Measures
THE AGENCIES IN THE NETWORK INCLUDE:
* Agency awarded CQL’s Basic Assurances Certification.
** Agency awarded CQL’s Accreditation on 2000 Measures.
*** Agency awarded CQL’s Accreditation on 2005 Measures.
The Chairperson of the Outcomes Network of Ireland is Fiona Coffey, Brothers of Charity Galway.
(Contact details: [email protected])
Sunbeam House Services***
Cheeverstown House
Cheshire Ireland
St Michael’s House**
Gheel Autism Services
Irish Wheelchair Association
Irish Society for Autism
Malta Services
Cregg House
Western Care Association**
St Patrick’s Kilkenny
Dara Residential
Walkinstown Association*
Brothers of Charity Services at:
Galway, Roscommon*, Clare, Limerick,
South, Waterford.
Cloonamahon, HSE/NW
Peamount Hospital
Prosper Fingal
St John of God Hospitaller Services at:
Menni
STEP**
Carmona**
St. Raphaels
Breannan**
Holy Angels Service Beaufort

Delivering Outcomes to People Project,
C/o St. Michael’s House,
Ballymun Road,
Dublin 9.
(01) 8086411 & (01) 8086402
www.outcomestopeople.ie