Results for the year ended 31 ... - foundry-planet.com · Headline Earnings(2) (£m) 87.7 75.0...
31
(1) Underlying basis is at constant currency and excludes separately reported items and the impact of acquisitions and disposals (2) For definitions of non-GAAP measures, refer to note 18 of the financial statements (3) Headline results refer to continuing operations and exclude separately reported items (4) 2012 results have been restated as a result of IAS 19 (Revised) Employee Benefits. Refer to note 1.7 of the financial statements 1 4 March 2014 Results for the year ended 31 December 2013 Strong profitability improvements in first year following demerger. Significant portfolio realignment. Vesuvius plc, a global leader in molten metal flow engineering, announces its preliminary audited results for the year ended 31 December 2013, its first full year of independence following the demerger of Cookson Group plc in December 2012. Highlights • Revenue of £1,511m, down 2.4%; down 0.8% on an underlying basis (1) (2012: £1,548m) • Trading profit (2) of £140.0m, up 6.6% on a reported basis, 10.9% on an underlying basis (1) (2012: £131.3m (4) ) • Return on sales (2) improved by 80 basis points to 9.3%; a 100 basis point improvement on an underlying basis (1) • Significant realignment of portfolio including disposal of Precious Metals Processing division and exit from non- core low-margin businesses • Share repurchase programme of £30m completed in September 2013 • Year-end net debt (2) reduced to £256m: positive operating cashflow (2) of £150m, cash conversion rate of 107% • Headline (3) earnings per share of 31.9 pence; up 18.1% (2012: 27.0 pence (4) ) • Final dividend of 10.25 pence per share recommended François Wanecq, Chief Executive of Vesuvius, commented: “In our first complete year as an independent company, we have successfully initiated the recovery of margins across the Group despite an unfavourable economic environment. Market conditions remained challenging in 2013, continuing from the reduced levels of activity seen in the second half of 2012, and Sterling strengthened substantially in the second half of 2013, impacting our reported growth numbers. “Against this backdrop we have taken a disciplined approach to implementing our stated strategy. We streamlined our business portfolio and activities, exiting non-core low-margin businesses, further improved the quality of our products and services, and implemented self-help measures to increase the productivity of our own businesses. “The result is improved profitability, strong cash flow, and a more focused Group. This gives us a strong platform from which to pursue our growth strategy.” Full Year Results : 2013 2012 (4) Year-on-year change Underlying change (1) Revenue (£m) 1,511 1,548 -2.4% -0.8% Trading Profit (2) (£m) 140.0 131.3 +6.6% +10.9% Headline Earnings (2) (£m) 87.7 75.0 +16.9% +22.2% Headline EPS (2) (pence) 31.9 27.0 +18.1% +23.4% Outlook We expect the underlying trading environment during 2014 to be broadly similar to that experienced in 2013. We are progressing with our plan to improve operational efficiency across the Group. These actions should continue to drive improvement in our trading margins and working capital performance in 2014. If the recent strength of Sterling continues it will have a negative impact on our reported growth in 2014. Our primary objectives for the medium-term are to: • improve margins further; • increase investment in research and development; • sustain our global leadership in our core businesses; • grow further our presence in China; • retain a strong balance sheet in order to give us financial flexibility; and • progress our overall strategy of providing superior technical products and services for the steel and foundry industries.
Transcript of Results for the year ended 31 ... - foundry-planet.com · Headline Earnings(2) (£m) 87.7 75.0...
(1) Underlying basis is at constant currency and excludes separately reported items and the impact of acquisitions and disposals
(2) For definitions of non-GAAP measures, refer to note 18 of the financial statements
(3)
Headline results refer to continuing operations and exclude separately reported items (4)
2012 results have been restated as a result of IAS 19 (Revised) Employee Benefits. Refer to note 1.7 of the financial statements
1
4 March 2014
Results for the year ended 31 December 2013
Strong profitability improvements in first year following demerger. Significant portfolio realignment.
Vesuvius plc, a global leader in molten metal flow engineering, announces its preliminary audited results for the year
ended 31 December 2013, its first full year of independence following the demerger of Cookson Group plc in
December 2012.
Highlights
• Revenue of £1,511m, down 2.4%; down 0.8% on an underlying basis(1)
(2012: £1,548m)
• Trading profit(2)
of £140.0m, up 6.6% on a reported basis, 10.9% on an underlying basis(1)
(2012: £131.3m(4)
)
• Return on sales(2)
improved by 80 basis points to 9.3%; a 100 basis point improvement on an underlying basis(1)
• Significant realignment of portfolio including disposal of Precious Metals Processing division and exit from non-
core low-margin businesses
• Share repurchase programme of £30m completed in September 2013
• Year-end net debt(2)
reduced to £256m: positive operating cashflow(2)
of £150m, cash conversion rate of 107%
• Headline(3)
earnings per share of 31.9 pence; up 18.1% (2012: 27.0 pence(4)
)
• Final dividend of 10.25 pence per share recommended
François Wanecq, Chief Executive of Vesuvius, commented:
“In our first complete year as an independent company, we have successfully initiated the recovery of margins across
the Group despite an unfavourable economic environment. Market conditions remained challenging in 2013,
continuing from the reduced levels of activity seen in the second half of 2012, and Sterling strengthened substantially
in the second half of 2013, impacting our reported growth numbers.
“Against this backdrop we have taken a disciplined approach to implementing our stated strategy. We streamlined our
business portfolio and activities, exiting non-core low-margin businesses, further improved the quality of our products
and services, and implemented self-help measures to increase the productivity of our own businesses.
“The result is improved profitability, strong cash flow, and a more focused Group. This gives us a strong platform from
which to pursue our growth strategy.”
Full Year Results :
2013 2012(4)
Year-on-year
change
Underlying
change(1)
Revenue (£m) 1,511 1,548 -2.4% -0.8%
Trading Profit(2)
(£m) 140.0 131.3 +6.6% +10.9%
Headline Earnings(2)
(£m) 87.7 75.0 +16.9% +22.2%
Headline EPS(2)
(pence) 31.9 27.0 +18.1% +23.4%
Outlook
We expect the underlying trading environment during 2014 to be broadly similar to that experienced in 2013. We are
progressing with our plan to improve operational efficiency across the Group. These actions should continue to drive
improvement in our trading margins and working capital performance in 2014. If the recent strength of Sterling
continues it will have a negative impact on our reported growth in 2014.
Our primary objectives for the medium-term are to:
• improve margins further;
• increase investment in research and development;
• sustain our global leadership in our core businesses;
• grow further our presence in China;
• retain a strong balance sheet in order to give us financial flexibility; and
• progress our overall strategy of providing superior technical products and services for the steel and foundry
industries.
2
FOR FURTHER INFORMATION PLEASE CONTACT:
Shareholder/analyst enquiries:
Vesuvius plc François Wanecq, Chief Executive +44 (0) 207 822 0000
Chris O’Shea, Chief Financial Officer +44 (0) 207 822 0000
Tony Harrison, Group Head of Corporate Finance +44 (0) 207 822 0000
Maddy Cox-Smith, Investor Relations Manager +44 (0) 207 822 0016
Media enquiries:
MHP Communications John Olsen/Vicky Watkins +44 (0) 203 128 8100
Copies of Vesuvius’ 2013 Annual Report are due to be posted to shareholders of the Company who have elected to
receive a hard copy on 07 April 2014 and are also expected to be available on the Company's website and at the
Registered Office of the Company on or before this date.
Vesuvius management will make a presentation to analysts and investors on 04 March 2014 at 10.00am (UK time).
This will be broadcast live on Vesuvius’ website, http://investors.vesuvius.com/investor-relations and an archive
version of the presentation will be available on the website later that day.
About Vesuvius plc
Vesuvius operates in the steel and foundry casting industries, with market and technology leadership across a range of
mission critical products and services supplied to these sectors, including flow control solutions, advanced refractories
and other consumable products.
We have a worldwide presence in both Steel and Foundry. We serve our customers through a low-cost network of
manufacturing plants located close to their own facilities, and by embedding our industry experts within their
operations, all supported by our global technology centres.
Vesuvius’ core competitive strengths are our leading technology and innovation, strong customer relationships, well
established presence in developing markets, low-cost manufacturing base, and our global reach, all of which enable us
to expand our addressable markets.
Forward looking statements
This announcement contains certain forward looking statements which may include reference to one or more of the following: the
Group’s financial condition, results of operations, cash flows, dividends, financing plans, business strategies, operating efficiencies
or synergies, budgets, capital and other expenditures, competitive positions, growth opportunities for existing products, plans and
objectives of management and other matters.
Statements in this announcement that are not historical facts are hereby identified as "forward looking statements". Such forward
looking statements, including, without limitation, those relating to the future business prospects, revenue, working capital,
liquidity, capital needs, interest costs and income, in each case relating to Vesuvius, wherever they occur in this announcement, are
necessarily based on assumptions reflecting the views of Vesuvius and involve a number of known and unknown risks, uncertainties
and other factors that could cause actual results, performance or achievements to differ materially from those expressed or implied
by the forward looking statements. Such forward looking statements should, therefore, be considered in light of various important
factors that could cause actual results to differ materially from estimates or projections contained in the forward looking
statements. These include without limitation: economic and business cycles; the terms and conditions of Vesuvius’ financing
arrangements; foreign currency rate fluctuations; competition in Vesuvius’ principal markets; acquisitions or disposals of businesses
or assets; and trends in Vesuvius’ principal industries.
The foregoing list of important factors is not exhaustive. When considering forward looking statements, careful consideration
should be given to the foregoing factors and other uncertainties and events, as well as factors described in documents the
Company files with the UK regulator from time to time including its annual reports and accounts.
You should not place undue reliance on such forward looking statements which speak only as of the date on which they are made.
Except as required by the Rules of the UK Listing Authority and the London Stock Exchange and applicable law, Vesuvius undertakes
no obligation to update publicly or revise any forward looking statements, whether as a result of new information, future events or
otherwise. In light of these risks, uncertainties and assumptions, the forward looking events discussed in this announcement might
not occur.
Vesuvius plc, 165 Fleet Street, London EC4A 2AE
Registered in England and Wales No. 8217766
www.vesuvius.com
3
Vesuvius plc
Results for the year ended 31 December 2013
Group Trading Performance
Group revenue from our continuing operations was £1,511m, a reduction of 2.4% compared to 2012. Underlying
revenue, excluding impact of exchange rate movements, acquisitions and disposals, declined by 0.8%. Trading profit
for the year was £140.0m, up 6.6% from £131.3m in 2012, 10.9% on an underlying basis, reflecting the success of
management’s focus on self-help initiatives in light of continuing weak market conditions.
Market Trends and Business Performance
Our business comprises two divisions, Steel and Foundry, with the Steel division operated as two principal product
lines, Steel Flow Control and Advanced Refractories.
Steel Division
After steep downturns in the steel industry in mid-2012, activity stabilised at those lower levels through the second
half of 2013. Whilst world steel production grew by 4.8%, driven primarily by growth in China, volumes outside China
were flat, with year-on-year production reductions of 2.3% and 1.9% in the EU and the USA, respectively. To date, the
Chinese steel market has been predominantly focused on ‘long’ products for use in infrastructure and construction,
the production of which requires fewer Vesuvius products. In the coming years, with the evolution towards a more
consumer-driven economy, a significant restructuring of the Chinese steel industry is anticipated, leading to a greater
focus on quality and performance rather than volume. This will require more ‘flat’ steel production and, with our
advanced process-enhancing solutions, Vesuvius is in a good position to participate in this development.
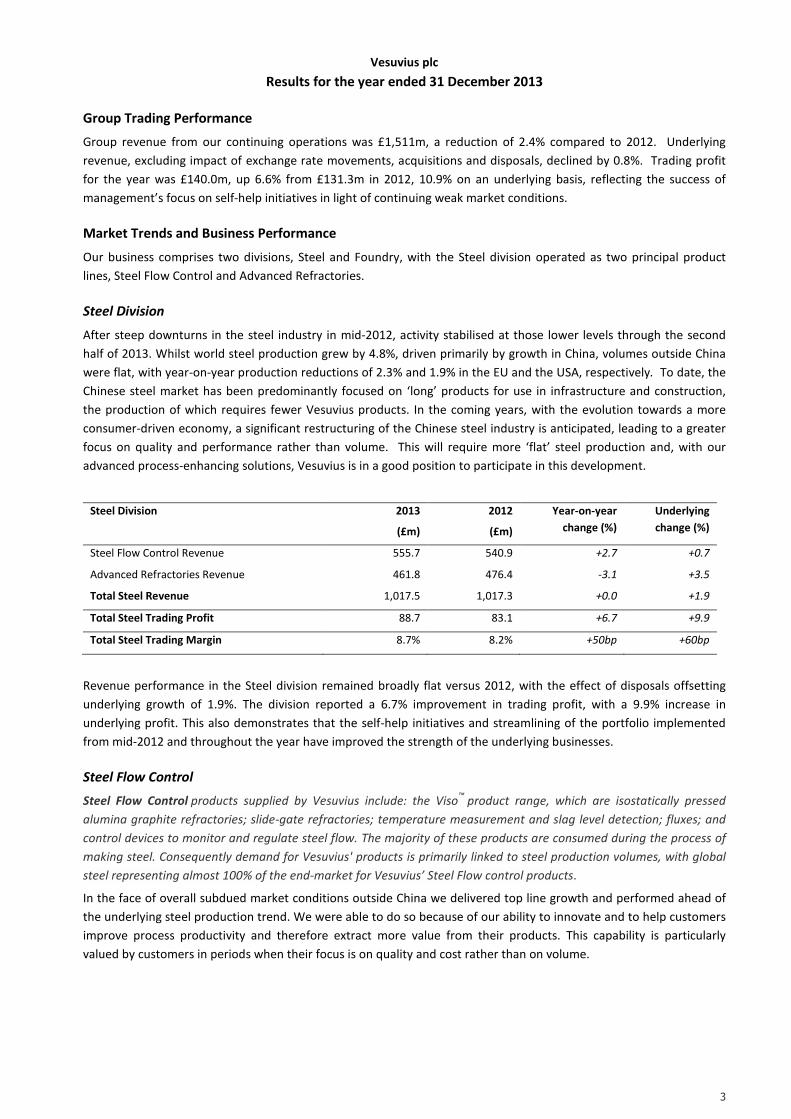
Steel Division 2013
(£m)
2012
(£m)
Year-on-year
change (%)
Underlying
change (%)
Steel Flow Control Revenue 555.7 540.9 +2.7 +0.7
Advanced Refractories Revenue 461.8 476.4 -3.1 +3.5
Total Steel Revenue 1,017.5 1,017.3 +0.0 +1.9
Total Steel Trading Profit 88.7 83.1 +6.7 +9.9
Total Steel Trading Margin 8.7% 8.2% +50bp +60bp
Revenue performance in the Steel division remained broadly flat versus 2012, with the effect of disposals offsetting
underlying growth of 1.9%. The division reported a 6.7% improvement in trading profit, with a 9.9% increase in
underlying profit. This also demonstrates that the self-help initiatives and streamlining of the portfolio implemented
from mid-2012 and throughout the year have improved the strength of the underlying businesses.
Steel Flow Control
Steel Flow Control products supplied by Vesuvius include: the Viso™
product range, which are isostatically pressed
alumina graphite refractories; slide-gate refractories; temperature measurement and slag level detection; fluxes; and
control devices to monitor and regulate steel flow. The majority of these products are consumed during the process of
making steel. Consequently demand for Vesuvius' products is primarily linked to steel production volumes, with global
steel representing almost 100% of the end-market for Vesuvius’ Steel Flow control products.
In the face of overall subdued market conditions outside China we delivered top line growth and performed ahead of
the underlying steel production trend. We were able to do so because of our ability to innovate and to help customers
improve process productivity and therefore extract more value from their products. This capability is particularly
valued by customers in periods when their focus is on quality and cost rather than on volume.
4
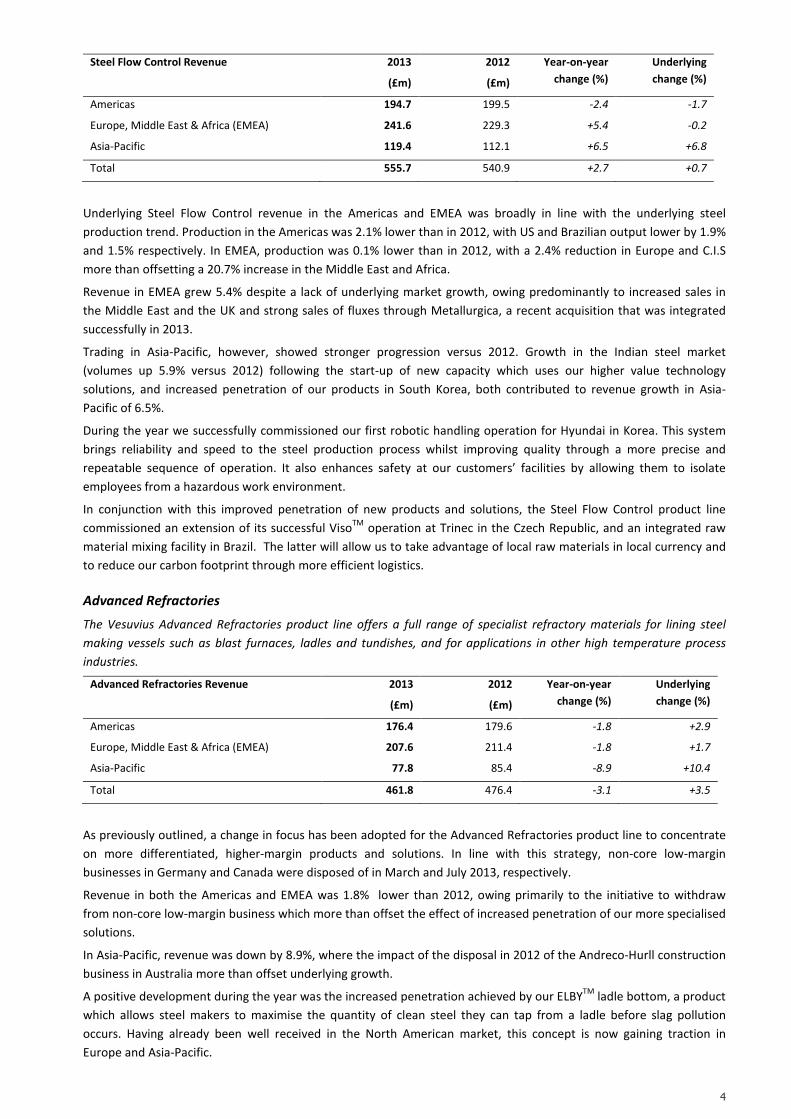
Steel Flow Control Revenue 2013
(£m)
2012
(£m)
Year-on-year
change (%)
Underlying
change (%)
Americas 194.7 199.5 -2.4 -1.7
Europe, Middle East & Africa (EMEA) 241.6 229.3 +5.4 -0.2
Asia-Pacific 119.4 112.1 +6.5 +6.8
Total 555.7 540.9 +2.7 +0.7
Underlying Steel Flow Control revenue in the Americas and EMEA was broadly in line with the underlying steel
production trend. Production in the Americas was 2.1% lower than in 2012, with US and Brazilian output lower by 1.9%
and 1.5% respectively. In EMEA, production was 0.1% lower than in 2012, with a 2.4% reduction in Europe and C.I.S
more than offsetting a 20.7% increase in the Middle East and Africa.
Revenue in EMEA grew 5.4% despite a lack of underlying market growth, owing predominantly to increased sales in
the Middle East and the UK and strong sales of fluxes through Metallurgica, a recent acquisition that was integrated
successfully in 2013.
Trading in Asia-Pacific, however, showed stronger progression versus 2012. Growth in the Indian steel market
(volumes up 5.9% versus 2012) following the start-up of new capacity which uses our higher value technology
solutions, and increased penetration of our products in South Korea, both contributed to revenue growth in Asia-
Pacific of 6.5%.
During the year we successfully commissioned our first robotic handling operation for Hyundai in Korea. This system
brings reliability and speed to the steel production process whilst improving quality through a more precise and
repeatable sequence of operation. It also enhances safety at our customers’ facilities by allowing them to isolate
employees from a hazardous work environment.
In conjunction with this improved penetration of new products and solutions, the Steel Flow Control product line
commissioned an extension of its successful VisoTM
operation at Trinec in the Czech Republic, and an integrated raw
material mixing facility in Brazil. The latter will allow us to take advantage of local raw materials in local currency and
to reduce our carbon footprint through more efficient logistics.
Advanced Refractories
The Vesuvius Advanced Refractories product line offers a full range of specialist refractory materials for lining steel
making vessels such as blast furnaces, ladles and tundishes, and for applications in other high temperature process
industries.
Advanced Refractories Revenue 2013
(£m)
2012
(£m)
Year-on-year
change (%)
Underlying
change (%)
Americas 176.4 179.6 -1.8 +2.9
Europe, Middle East & Africa (EMEA) 207.6 211.4 -1.8 +1.7
Asia-Pacific 77.8 85.4 -8.9 +10.4
Total 461.8 476.4 -3.1 +3.5
As previously outlined, a change in focus has been adopted for the Advanced Refractories product line to concentrate
on more differentiated, higher-margin products and solutions. In line with this strategy, non-core low-margin
businesses in Germany and Canada were disposed of in March and July 2013, respectively.
Revenue in both the Americas and EMEA was 1.8% lower than 2012, owing primarily to the initiative to withdraw
from non-core low-margin business which more than offset the effect of increased penetration of our more specialised
solutions.
In Asia-Pacific, revenue was down by 8.9%, where the impact of the disposal in 2012 of the Andreco-Hurll construction
business in Australia more than offset underlying growth.
A positive development during the year was the increased penetration achieved by our ELBYTM
ladle bottom, a product
which allows steel makers to maximise the quantity of clean steel they can tap from a ladle before slag pollution
occurs. Having already been well received in the North American market, this concept is now gaining traction in
Europe and Asia-Pacific.
5
In addition, two new plants were commissioned in Port Kembla (Australia) and in Ras al Khaima (United Arab
Emirates). These are now ramping up production and sales in line with expectations.
Combined, these developments clearly demonstrate our innovative approach, our focused investment and our ability
to deliver more engineering services to our customers in addition to the sale of our technologically advanced
consumables.
Foundry Division
Vesuvius, trading under the Foseco brand, is a world leader in the supply of consumable products and services to the
global foundry industry which produces castings used in a wide variety of engineered components. Some 40% of
castings are produced for the vehicle sector, comprising approximately 25% for cars and light trucks (“light vehicle”)
and 15% for heavy trucks. Other end-markets include machinery for the construction, agriculture and mining industries,
power generation equipment, railroad and general engineering.
The foundry market was significantly impacted in 2013 by the difficulties in the mining industry and, in particular, the
reduction of investment spending in the extraction of hard rock metallic ores. This impacted sales in the USA, Brazil
and Australia in particular. Furthermore, the truck and railroad markets remained stagnant, and the overall market in
India and ASEAN was disappointing. However, Vesuvius’ Foundry division made good progress in China where our
solutions started to gain wider adoption.
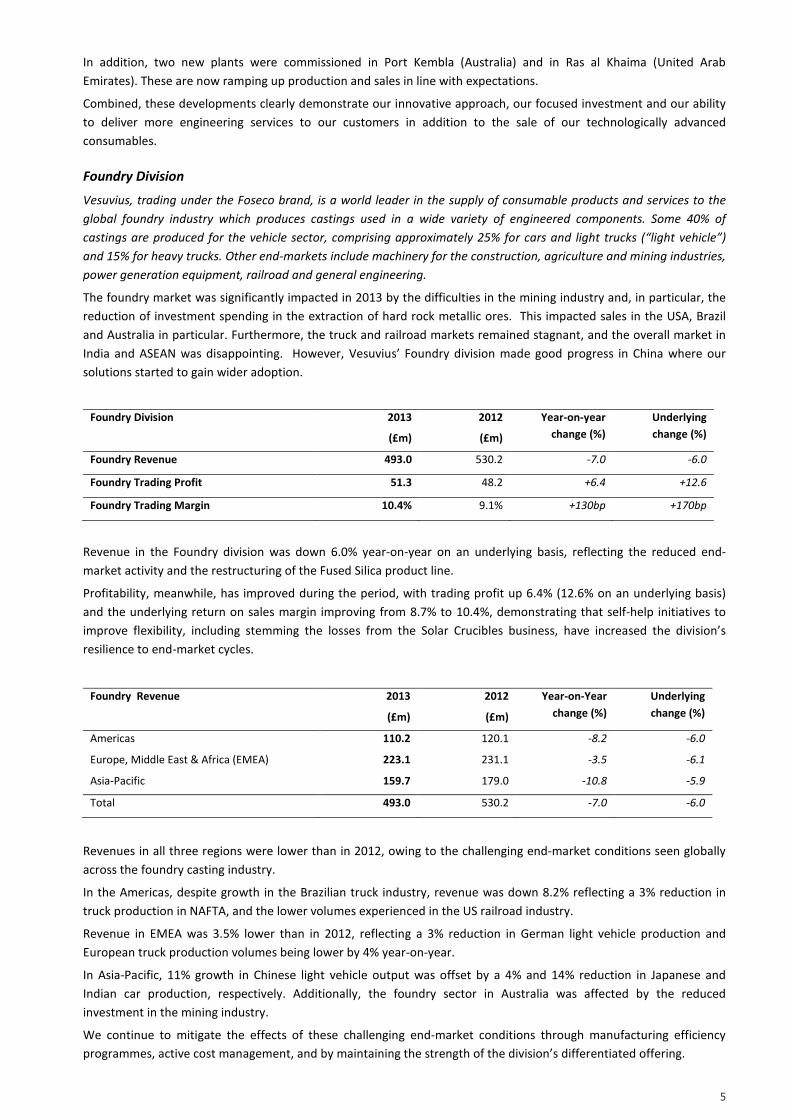
Foundry Division 2013
(£m)
2012
(£m)
Year-on-year
change (%)
Underlying
change (%)
Foundry Revenue 493.0 530.2 -7.0 -6.0
Foundry Trading Profit 51.3 48.2 +6.4 +12.6
Foundry Trading Margin 10.4% 9.1% +130bp +170bp
Revenue in the Foundry division was down 6.0% year-on-year on an underlying basis, reflecting the reduced end-
market activity and the restructuring of the Fused Silica product line.
Profitability, meanwhile, has improved during the period, with trading profit up 6.4% (12.6% on an underlying basis)
and the underlying return on sales margin improving from 8.7% to 10.4%, demonstrating that self-help initiatives to
improve flexibility, including stemming the losses from the Solar Crucibles business, have increased the division’s
resilience to end-market cycles.
Foundry Revenue 2013
(£m)
2012
(£m)
Year-on-Year
change (%)
Underlying
change (%)
Americas 110.2 120.1 -8.2 -6.0
Europe, Middle East & Africa (EMEA) 223.1 231.1 -3.5 -6.1
Asia-Pacific 159.7 179.0 -10.8 -5.9
Total 493.0 530.2 -7.0 -6.0
Revenues in all three regions were lower than in 2012, owing to the challenging end-market conditions seen globally
across the foundry casting industry.
In the Americas, despite growth in the Brazilian truck industry, revenue was down 8.2% reflecting a 3% reduction in
truck production in NAFTA, and the lower volumes experienced in the US railroad industry.
Revenue in EMEA was 3.5% lower than in 2012, reflecting a 3% reduction in German light vehicle production and
European truck production volumes being lower by 4% year-on-year.
In Asia-Pacific, 11% growth in Chinese light vehicle output was offset by a 4% and 14% reduction in Japanese and
Indian car production, respectively. Additionally, the foundry sector in Australia was affected by the reduced
investment in the mining industry.
We continue to mitigate the effects of these challenging end-market conditions through manufacturing efficiency
programmes, active cost management, and by maintaining the strength of the division’s differentiated offering.
6
Construction of a new manufacturing plant for foundry products in Changshu, China commenced during the year, with
completion of Phase One expected in mid-2014. In the Fused Silica product line, our glass roller business made good
progress, benefitting from investments related to vehicle manufacturing in China and the USA.
Self-Help Initiatives
Within this uncertain environment, our focus has remained on self-help steps to improve our performance. We have
initiated a focus on quality in all business segments across the Group. Significant improvement was recorded in our
Chinese steel operations and new business was successfully initiated in Korea.
As a result of our significant restructuring work, the Fused Silica product line recovered from the substantial challenges
experienced in 2012 in the Solar Crucibles product line.
Across the Group, specific effort was also dedicated to inventory reduction. Significant improvements were
experienced across all the businesses, most notably in Foundry. We look forward to continuing this progress in 2014.
Together, these actions generate savings in the cost of handling, warehousing and rejects, and improve our overall
productivity.
This emphasis on self-help has been rewarded by productivity gains in both divisions, with margins progressing
markedly despite the weak market conditions and significant headwinds from foreign exchange rate fluctuations
towards the end of the year. Overall margins progressed from 8.5% in 2012 to 9.3%; underlying margins increased by 1
percentage point (underlying 2012 margin: 8.3%).
Our successful efforts in inventory reduction together with good control of receivables allowed us to generate a
substantial level of cash flow, with a cash conversion rate of 107%.
Portfolio Management and Capital Allocation
Our strategy, and the focus of our management teams, is to grow those activities where we can develop and exploit
synergies from existing technological and market expertise. We are also committed to maintaining a robust balance
sheet, and to delivering long-term dividend growth for our shareholders.
Following the demerger, we resolved to refocus Vesuvius on the businesses where we can offer a unique value
proposition and differentiation from the competition. In May 2013 we completed the sale of the Precious Metals
Processing division which had no fit with our core business of molten metal flow engineering, and which carried
significant metal financing requirements. The majority of the proceeds of the transaction were returned to
shareholders through a £30m share buy-back as a sign of our commitment to delivering attractive returns to our
shareholders.
We sold our German brick production business in March 2013, and our Canadian construction business in July 2013,
thereby increasing the focus of our Advanced Refractories product line on higher margin segments.
Capital expenditure of £48m represented 3.2% of revenue, with the focus being on expanding our capacity in emerging
economies and extending our research centres.
Health and Safety
The Board places great emphasis on the importance of health and safety in the workplace and in the communities in
which we operate. We measure lost time incidents as a fundamental indicator of our operational performance. Safety
is of paramount importance, as our employees often operate in harsh environments. Whilst we are constantly
evolving and improving our safety programmes, we did not achieve our targets in the reduction of accidents in 2013.
Very regrettably, one of our colleagues lost his life in April 2013, in a work-related incident at our Chicago Heights
facility in the US. It is important that, at the most senior level, we formally acknowledge this, and reaffirm our
objective of zero accidents in the workplace.
Board of Directors
A substantially new Board of Directors was appointed in late 2012 as a result of the demerger and strengthened
further on 1 March 2013 through the appointment of Nelda Connors as a Non-executive Director.
Having served nine years as Non-executive Directors for Cookson Group plc prior to the demerger, both John Sussens
and Jan Oosterveld retired from the Board, as planned, at the close of the Annual General Meeting on 4 June 2013.
John Sussens was succeeded as Senior Independent Director by Jeff Hewitt, and as Chair of the Remuneration
Committee by Jane Hinkley.
7
In September 2013, Henry Knowles was appointed as Company Secretary and General Counsel, succeeding Richard
Malthouse who retires in March 2014 after 21 years of valued service.
A Renewed Senior Management Team
The overall progress made in our first year owes much to the good understanding that has been developed between
our new, focused Board of Directors and our widely renewed management team. Of the ten-strong Group Executive
Committee, three are in their first year of tenure and three others have served less than three years in their present
roles.
This executive team is engaged in re-examining all our past practices and in ensuring quality, consistency and
technology are embedded at the heart of everything we do. This will be central to our success in reinforcing and
growing our share of our targeted market segments. In June 2013, we launched our Group-wide plan to deliver a step
change in our Quality performance. Significant progress has already been made, most notably in our Advanced
Refractories product line, and within our operations in China.
The Group’s overall strategy, reconfirmed by the Board in June, places particular emphasis on technology. A new
worldwide research centre for Foundry is being established in Enschede, in the Netherlands, to be commissioned in
mid-2014 and, in October, George Coulston (PhD, MBA) joined the Group as Chief Technology Officer to drive forward
this increased focus on technology development.
Dividend
The Board has recommended a final dividend of 10.25 pence per share for 2013. This would result in a total dividend
for the year of 15.00 pence per share, an increase on Vesuvius’ share of the full year Cookson Group dividend for 2012
of 5.3%. The final dividend, if approved at the Annual General Meeting, will be paid on 23 May 2014 to shareholders
on the register at 25 April 2014.
Vesuvius is a cash generative and well invested business. Our dividend policy aims to deliver long-term dividend
growth, provided that this is supported by underlying earnings, cash flows, capital expenditure requirements and the
prevailing market outlook.
8
FINANCIAL REVIEW
During 2013 we have been busy on a number of fronts: streamlining and focusing the asset portfolio; improving
operating margins; increasing cash flow; and strengthening the balance sheet. We have made significant progress in
each of these key areas during the year, all of which underpin our ability to provide superior returns to our
shareholders.
In line with our strategy of focusing the portfolio, in 2013 we completed the disposal of the Precious Metals Processing
division and other lower margin businesses.
In 2013 we improved our performance with underlying operating margins improving by 1 percentage point from 8.3%
in 2012 to 9.3% despite the reduced activity levels experienced in the second half of 2012 continuing throughout 2013.
We remain confident in our ability to deliver further margin improvement in the coming years by continuing to focus
on improving our financial and operational flexibility. As indicated in the principal risks section in this announcement,
we consider end-market cyclicality to be a significant concern. This financial and operational flexibility ensures that we
are able to react appropriately, and quickly, to changes in end-market conditions.
As set out in the KPIs in this announcement, we consider cash flow as a primary measure of success. Our continued
efforts to focus the business in this area are bearing fruit, with a cash conversion ratio of 107% in 2013, meaning that
for each £100 of trading profit, we generated operational cash flow after capital expenditure of £107. This contributed
to a 13% reduction in our net debt to £256 million.
This reduction in net debt, together with a further improvement in the funding position of our defined benefit pension
plans, has contributed to a strengthening of our balance sheet. This enabled us to raise new long-term debt on
attractive terms in the second half of the year, increasing the maturity profile of our debt and thus, in line with
mitigations noted in our principal risks section, reducing refinancing risks in future years.
During the year we returned £70 million to shareholders through dividends and a share repurchase programme,
thereby returning the majority of the net sales proceeds of the disposal of the Precious Metals Processing division to
shareholders.
With net debt of £256 million and committed debt facilities of £637 million with maturities out to 2028, we have a
strong balance sheet. At the end of the year net debt represented 1.4 times 2013 EBITDA, well within our debt
covenants. Our business is strongly cash generative with relatively low capital intensity. In short, we are well
positioned to invest in organic projects, fund attractive acquisition opportunities as they arise, and provide superior
returns to shareholders.
The following review considers our financial KPIs, our financial risks, and sets out other relevant financial
information
Basis of Preparation
We have adopted a columnar presentation format for our accounts to identify separately headline performance
results, as we considered that this gives a better view of the underlying results of the ongoing business.
Prior Year Comparison
The 2012 comparative figures have been restated to reflect the implementation of a new pensions accounting
standard (IAS19 (Revised) Employee Benefits). This has had the effect of reducing the 2012 comparative trading profit
by £1.7 million, reducing the net finance charge by £0.5 million, thus giving rise to a net reduction in pre-tax profit of
£1.2 million, and a reduction in headline earnings per share from continuing operations of 0.5 pence.
Dividend
In line with our dividend policy, the Board has recommended a final dividend of 10.25 pence per share. Together with
the interim dividend paid during 2013, this will bring the full year dividend to 15 pence, an increase of 5.3% on
Vesuvius’ share of the 2012 Cookson Group dividend.
9
Financial KPIs
Underlying Revenue growth
We look at underlying (or organic) movements in our results to establish meaningful period-on-period comparisons.
Underlying movements are calculated by:
• restating the previous period’s results at the same foreign exchange rates as used in the current period;
• removing the results of disposed businesses in both the current and prior year;
• removing the results of businesses acquired in the current year; and
• assuming acquisitions made in the prior year were made on the first day of that period.
Group revenue of £1,511 million was 2.4% lower than 2012 (£1,548 million); underlying revenues fell by 0.8%
reflecting the fact that the strong market conditions experienced in the first half of 2012 were not repeated in 2013,
with reductions in the Foundry division more than offsetting underlying growth in the Steel division.
Trading Profit and Return on Sales
The underlying trading profit of the Group is measured by both the trading profit in absolute terms, and as a
percentage of sales (return on sales). Trading profit of £140 million was 6.6% ahead of 2012 (£131 million); on an
underlying basis, trading profit increased by 10.9%.
In the Steel division, trading profit increased from £83 million in 2012 to £89 million in 2013; on an underlying basis,
trading profit increased by 9.9% with return on sales increasing from 8.1% to 8.7%. These results reflect a substantial
improvement in underlying profits in the Advanced Refractories product line and the impact of a lower bad debt
charge.
In the Foundry division, trading profit increased from £48 million in 2012 to £51 million in 2013; on an underlying
basis, trading profit increased by 12.6% with return on sales increasing from 8.7% to 10.4%. These results reflect the
elimination of the losses in the Solar Crucibles product line, which was partially offset by an underlying reduction in
other foundry activity which fed through into profitability.
Headline PBT and EPS
Headline profit before tax (PBT) and earnings per share (EPS) are used to assess the underlying financial performance
and earnings capacity of the Group. The principal difference between trading profit and PBT is net finance costs.
Net finance costs of £17 million comprised £16 million of net interest payable on borrowings (2012: £22 million), £2
million on retirement benefit plans (2012: nil), and £1 million relating to the unwinding of discounts on provisions
(2012: £2 million); this was partially offset by £2 million (2012: £2 million) of finance income which principally
comprised interest income.
The net interest payable on borrowings in 2012 includes substantially all interest costs relating to the former Cookson
Group plc as all such costs were incurred by companies which remained with Vesuvius following the demerger. We
estimate that net interest payable on borrowings in 2012 would have been £16 million had Vesuvius been a stand-
alone entity throughout 2012.
Headline PBT, including our share of the profits from joint ventures of £2.5 million (2012: £0.1 million) has increased
by 14% to £125 million (2012: £110 million).
Headline EPS has grown from 27.0 pence per share to 31.9 pence per share, reflecting the increased profitability of the
Group, the lower effective tax rate (26.5%; 2012: 27.0%), and the impact of the share repurchase programme which
reduced the number of shares in issue.
Free Cash Flow and Working Capital
Free cash flow is used to assess the underlying cash generation of the Group, which is impacted by the level of working
capital employed in the business. In order to drive sustained performance in working capital management we measure
performance on a 12 month moving average basis at constant exchange rates. On this basis, trade working capital as a
percentage of sales was 24.7% in 2013, a reduction of 1.9 percentage points on 2012 (26.6%). Inventory days reduced
from 85 days of cost of sales at the end of 2012 to 77 days at the end of 2013, with debtor days reducing from 74 days
of sales at the end of 2012 to 73 days at the end of 2013.
Operating cash flow was £150 million in 2013 (2012: £133 million), which represents a cash conversion rate of 107%
(2012: 101%) in relation to trading profit from continuing operations. Our focus on working capital has led to a net
10
cash inflow from trade and other working capital of £16 million in the year relating to continuing operations,
continuing the strong performance in 2012, where the net inflow was £13 million. Free cash flow from continuing
operations, before restructuring and demerger costs, of £108 million was generated in the year (2012: £78 million).
Return on Net Assets
Return on net assets (RONA) is used to assess the underlying financial performance of the Group. RONA is affected
both by the assets employed by the business, and the returns earned by the business. In 2013, a combination of the
reduction in working capital and the improvement in profitability led to an increase in Group pre-tax RONA to 24.4% in
2013. (2012: 19.5%).
Net Debt and Interest Cover
The Group’s debt facilities have financial covenants with specific limits on the ratios of Net Debt to EBITDA (maximum
3 times limit) and EBITDA to Interest (minimum 4 times limit). These ratios are monitored regularly to ensure the
Group has sufficient financing available to run the business and fund future growth. At the end of 2013, the Net Debt
to EBITDA ratio was 1.4, with EBITDA covering net interest paid 13.0 times; accordingly, the Group was well within its
covenants.
At the end of the year we had £637 million of gross committed debt facilities (2012: £579 million), of which £329
million was unutilised (£2012: £158 million). Our net debt stood at £256 million at the end of 2013, a reduction of £39
million in the year. As part of a process to increase the efficiency of the utilisation of our facilities, we have reduced
the cash and short-term deposits held to £68 million at the end of 2013. (2012: £130 million)
We keep our capital structure under regular review, and we took advantage of favourable market conditions and
strong demand for our credit to raise new long-term fixed rate debt on the US Private Placement market on attractive
terms as follows:
• €15 million at 3.46% maturing in December 2021;
• US$30 million at 4.61% maturing in December 2023;
• €15 million at 3.93% maturing in December 2025; and
• US$30 million at 4.96% maturing in December 2028.
As a result, at the end of 2013 one-third of our committed debt facilities comprised long-term fixed rate facilities, with
the remainder being the £425 million multi-currency revolving credit facility which runs until April 2016.
Gross borrowings at the end of 2013 amounted to £327 million. Of this, approximately two-thirds is long-term fixed
rate debt, with the remainder floating rate. The currency split of the borrowings is approximately one-third in each of
Euros, US Dollars, and Sterling.
Financial Risk Factors
There are two main financial risk factors: End-market cyclicality is discussed in the principal risks section of this
announcement. In addition, the Group faces risks relating to foreign exchange, capital market, interest rate and
inflation uncertainties. Despite the mitigations described in this announcement, we operate in many countries, and as
such, our reported results vary with foreign exchange rates. When Sterling strengthens against a currency, our
revenues and profits as reported in Sterling are reduced; however, the underlying revenue and profits in the local
currency are unaffected.
The second half of 2013 saw a strengthening of Sterling against a number of our important trading currencies, most
notably the Indian Rupee and the Brazilian Real. This, coupled with the weakness experienced throughout the year in
the Japanese Yen and the South African Rand more than offset the effects of a stronger US Dollar, Euro, and Renminbi.
The combined effects of these foreign exchange movements served to constrain our growth in reported profits. We
continue to monitor this closely, and where possible seek to balance our cost and revenue base in similar currencies to
minimise exposure. As with all international companies, and particularly ones like ours focused on growth in emerging
markets, this continues to be an area for attention.
11
Other relevant financial information
Trading Results – Discontinued Operations
The results of the Precious Metals Processing division up to the date of disposal (31 May 2013) are reported as
discontinued operations in 2013. In 2012 the consolidated results of the Alent plc group of businesses up to 18
December 2012, plus the results of the Precious Metals Processing division were reported as discontinued operations.
Revenue of the Precious Metals Processing division for 2013 was £65 million, down from £190 million in 2012,
reflecting the disposals of the European businesses on 31 May 2013 and the US business on 1 May 2012. Trading profit
for the year of £14 million (2012: £17 million) reflected weaker end-market conditions in 2013 together with the effect
of the business disposals. Included within trading profit is £10 million relating to the release of a provision following
the successful conclusion of a UK VAT case.
Total revenue of Alent plc for the period up to 18 December 2012 was £698 million, with trading profit of £100 million.
Restructuring
The restructuring charge in 2013 of £4 million principally comprises costs relating to the relocation of a Steel division
production facility in Australia, the closure and relocation costs relating to two Foundry production sites in China, and
some trailing costs relating to prior restructuring programmes. Around one-third of this charge is non-cash.
The restructuring charge in 2012 of £57 million principally related to the restructuring of the Solar Crucibles business,
with around 80% representing non-cash asset write-offs.
Taxation
The headline effective income tax rate for the year reduced to 26.5% (2012:27.0%). The income tax credit on
separately reported items principally consists of non-cash deferred tax movements relating to the amortisation of a
deferred liability arising from the acquisition of Foseco plc in 2008 (£7 million; 2012: £7 million), and the recognition
of a deferred tax asset due to the forecast utilisation of US tax losses incurred in prior years (£29 million). Due to the
uncertain nature of future profitability, we have recognised an asset equivalent to the estimated profitability in the
coming three years.
During the year the major part of a dispute with the UK tax authorities over VAT on metal purchases relating to the
Precious Metals Processing division was resolved in our favour, resulting in the release of a provision of £10 million
held in relation to this matter. This has been included in the results from discontinued operations. Further details are
set out in Note 17 to the Accounts.
Pensions
The net pension deficit in our post-retirement employee benefits plans reduced during the year from £69 million to
£48 million, with the reduction coming primarily from employer contributions (£15 million) and gains on plan assets
(£9 million), partially offset by service charges, administration costs and finance costs.
The triennial valuation of the UK plan as at 31 December 2012 was agreed during 2013. This showed the plan had a
funding surplus of £11 million. As a result of this valuation, we ceased obligatory contributions to the plan in July 2013
and agreed with the Trustee, on a non-binding basis, to make payments of £2 million per annum from 1 January 2014
to build further the strength of the plan.
Our activities to reduce Vesuvius’ exposure to defined benefit pension risks continue and in early 2014 we are
transferring the liabilities for members who had retired since July 2012 to Pension Insurance Corporation (PIC), under
the terms of an extension to the original buy-in agreement signed with PIC in 2012. This extension provides that UK
plan members who retire up to the end of 2015 will have their pensions insured on agreed terms. This agreement
covers up to £30 million of liabilities, with the future premium payments to be met from the existing assets of the UK
plan. As a result, we expect around 65% of the total UK plan liabilities will be covered by these agreements with PIC.
Corporate Activity
On 31 May 2013 we completed the disposal of the Precious Metals Processing division for a cash consideration of
EUR56.8 million. The results of this business prior to disposal have been reported as discontinued operations.
Our non-core German brick manufacturing business, VGT-Dyko, was disposed in February 2013. In August 2013 we
announced the disposal of our construction and installation business in Canada which follows the disposal of a similar
business in Australia in 2012.
12
During 2013, no businesses were acquired as we focussed on putting in motion the actions required to improve the
profitability of the base business. Metallurgica, was acquired in 2012 for £28 million. It is one of the world’s leading
suppliers of fluxes - a range of powders used together with refractory products in the enclosed continuous casting
process. Profit margins in Metallurgica improved in 2013 following the integration of the business into Vesuvius. With
improvements in margins also achieved in 2012, this highlights the synergies achievable from acquiring such
complementary businesses.
Capital Expenditure
Capital expenditure in 2013 of £48 million (2012: £57 million) comprised £29 million (2012: £38 million) in the Steel
division and £19 million (2012: £19 million) in the Foundry division. This represented 3.2% of revenue (2012: 3.7%).
Share Buy-back
During the year we committed to returning the majority of the net disposal proceeds of the Precious Metals
Processing division to shareholders by way of an on-market repurchase of shares. The net proceeds from the disposal
amounted to £37 million, comprising the cash-free debt-free gross proceeds of £47 million less the cash consumed by
the business operations in the period prior to disposal, which amounted to £10 million. Of this, £30 million was used to
repurchase 7,271,174 shares currently held in treasury at an average price, including transaction costs, of 412.59
pence per share between 5 June 2013 and 17 September 2013.
Additionally, during the year the Employee share ownership Trust (ESOT) purchased 851,736 shares at an average
price, including transaction costs, of 479.77 pence per share. These shares were purchased by the ESOT partially to
cover the anticipated vesting of current share-based incentive awards. Subsequent to the year end, the EBT purchased
a further 82,152 shares at an average price, including transaction costs, of 503.52 pence per share.
13
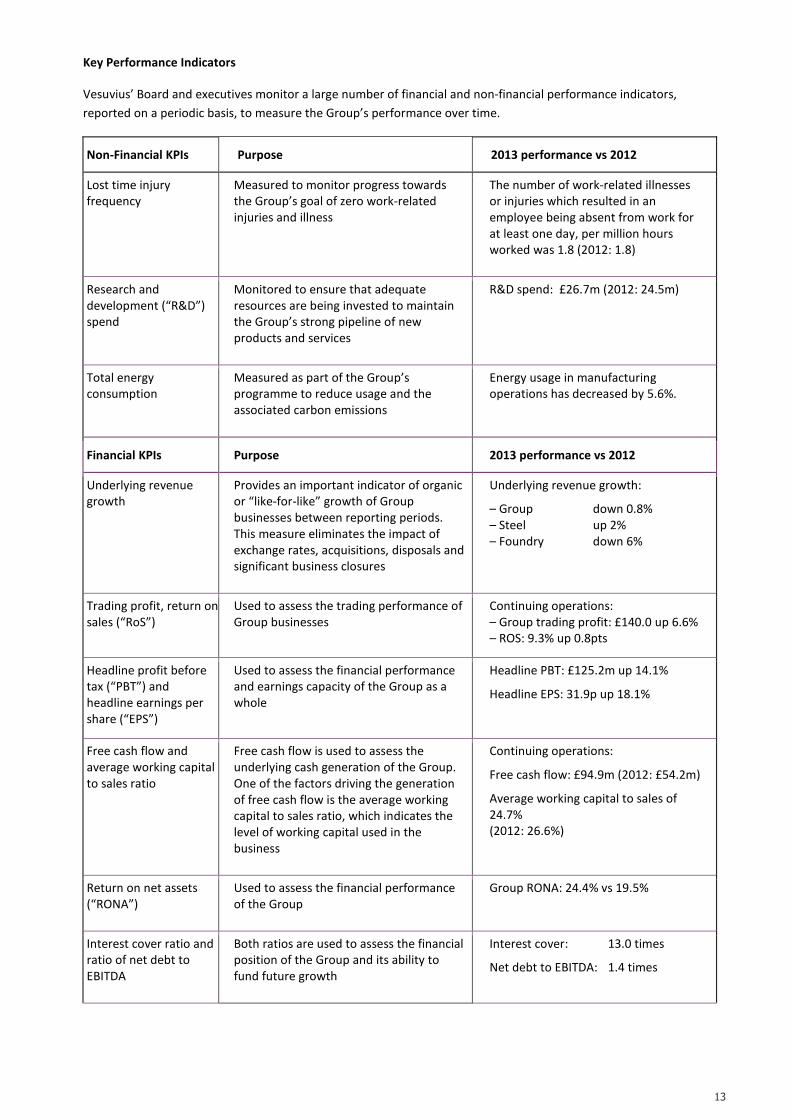
Key Performance Indicators
Vesuvius’ Board and executives monitor a large number of financial and non-financial performance indicators,
reported on a periodic basis, to measure the Group’s performance over time.
Non-Financial KPIs Purpose 2013 performance vs 2012
Lost time injury
frequency
Measured to monitor progress towards
the Group’s goal of zero work-related
injuries and illness
The number of work-related illnesses
or injuries which resulted in an
employee being absent from work for
at least one day, per million hours
worked was 1.8 (2012: 1.8)
Research and
development (“R&D”)
spend
Monitored to ensure that adequate
resources are being invested to maintain
the Group’s strong pipeline of new
products and services
R&D spend: £26.7m (2012: 24.5m)
Total energy
consumption
Measured as part of the Group’s
programme to reduce usage and the
associated carbon emissions
Energy usage in manufacturing
operations has decreased by 5.6%.
Financial KPIs Purpose 2013 performance vs 2012
Underlying revenue
growth
Provides an important indicator of organic
or “like-for-like” growth of Group
businesses between reporting periods.
This measure eliminates the impact of
exchange rates, acquisitions, disposals and
significant business closures
Underlying revenue growth:
– Group down 0.8%
– Steel up 2%
– Foundry down 6%
Trading profit, return on
sales (“RoS”)
Used to assess the trading performance of
Group businesses
Continuing operations:
– Group trading profit: £140.0 up 6.6%
– ROS: 9.3% up 0.8pts
Headline profit before
tax (“PBT”) and
headline earnings per
share (“EPS”)
Used to assess the financial performance
and earnings capacity of the Group as a
whole
Headline PBT: £125.2m up 14.1%
Headline EPS: 31.9p up 18.1%
Free cash flow and
average working capital
to sales ratio
Free cash flow is used to assess the
underlying cash generation of the Group.
One of the factors driving the generation
of free cash flow is the average working
capital to sales ratio, which indicates the
level of working capital used in the
business
Continuing operations:
Free cash flow: £94.9m (2012: £54.2m)
Average working capital to sales of
24.7%
(2012: 26.6%)
Return on net assets
(“RONA”)
Used to assess the financial performance
of the Group
Group RONA: 24.4% vs 19.5%
Interest cover ratio and
ratio of net debt to
EBITDA
Both ratios are used to assess the financial
position of the Group and its ability to
fund future growth
Interest cover: 13.0 times
Net debt to EBITDA: 1.4 times
14
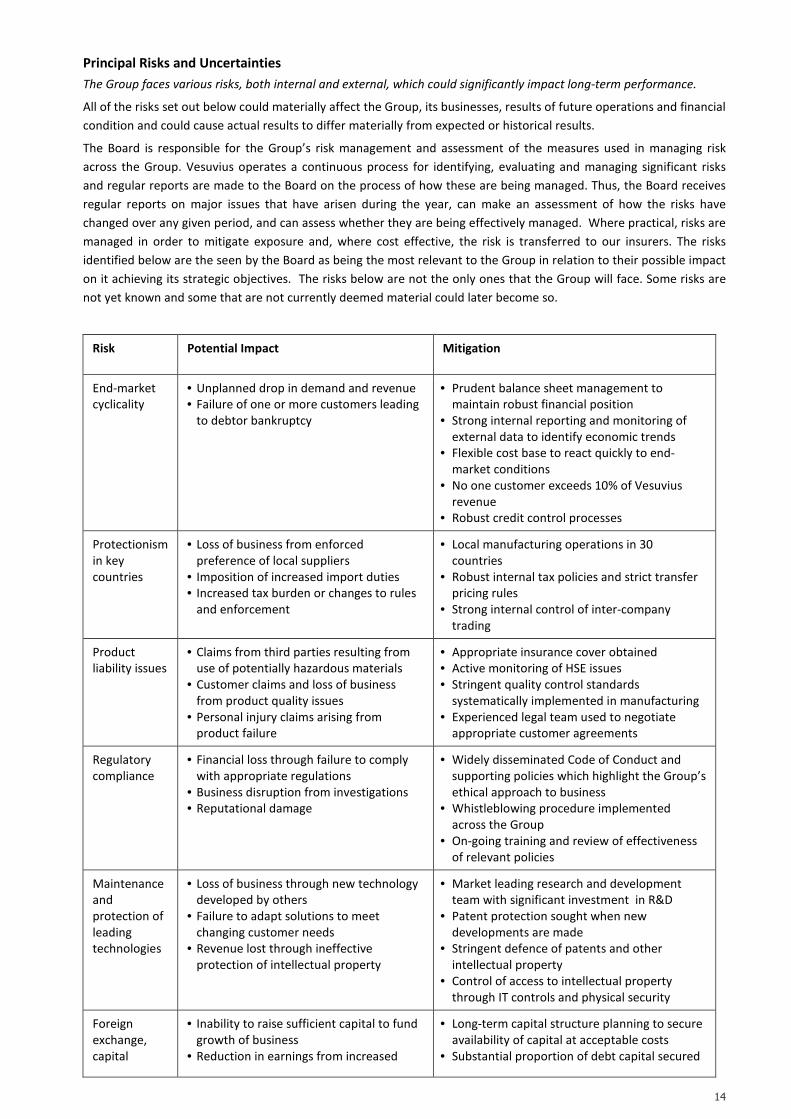
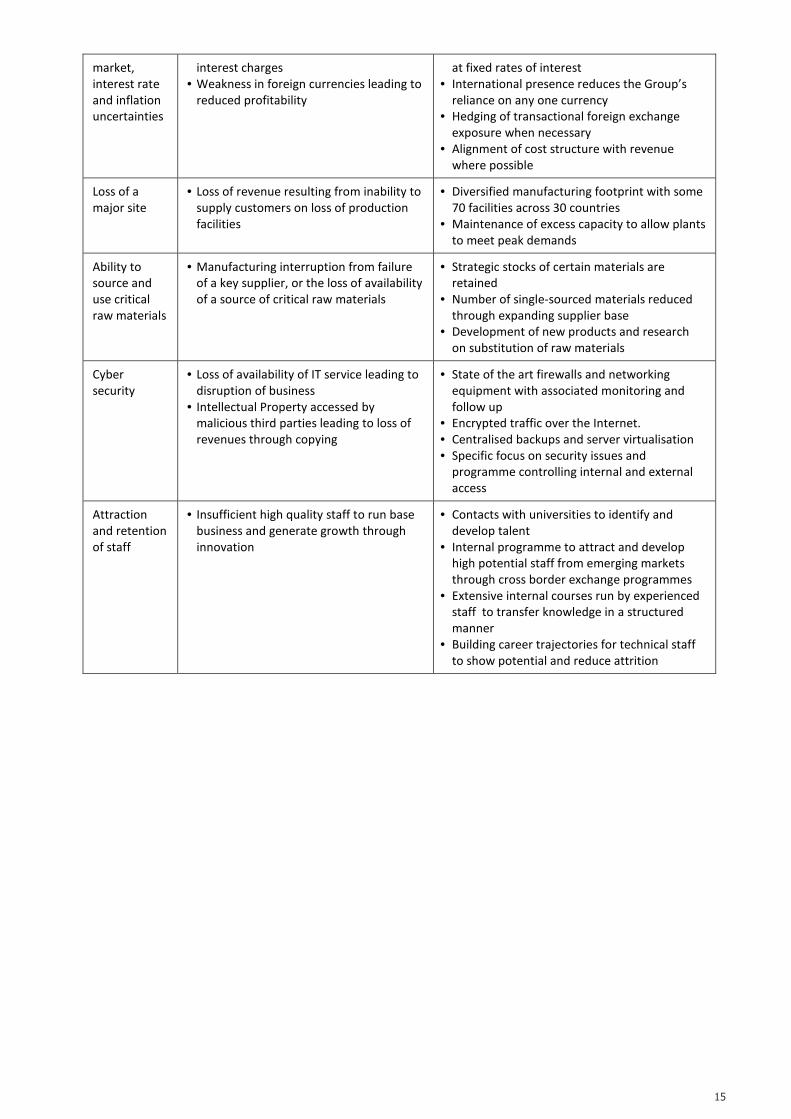
Principal Risks and Uncertainties
The Group faces various risks, both internal and external, which could significantly impact long-term performance.
All of the risks set out below could materially affect the Group, its businesses, results of future operations and financial
condition and could cause actual results to differ materially from expected or historical results.
The Board is responsible for the Group’s risk management and assessment of the measures used in managing risk
across the Group. Vesuvius operates a continuous process for identifying, evaluating and managing significant risks
and regular reports are made to the Board on the process of how these are being managed. Thus, the Board receives
regular reports on major issues that have arisen during the year, can make an assessment of how the risks have
changed over any given period, and can assess whether they are being effectively managed. Where practical, risks are
managed in order to mitigate exposure and, where cost effective, the risk is transferred to our insurers. The risks
identified below are the seen by the Board as being the most relevant to the Group in relation to their possible impact
on it achieving its strategic objectives. The risks below are not the only ones that the Group will face. Some risks are
not yet known and some that are not currently deemed material could later become so.
Risk Potential Impact Mitigation
End-market
cyclicality
• Unplanned drop in demand and revenue
• Failure of one or more customers leading
to debtor bankruptcy
• Prudent balance sheet management to
maintain robust financial position
• Strong internal reporting and monitoring of
external data to identify economic trends
• Flexible cost base to react quickly to end-
market conditions
• No one customer exceeds 10% of Vesuvius
revenue
• Robust credit control processes
Protectionism
in key
countries
• Loss of business from enforced
preference of local suppliers
• Imposition of increased import duties
• Increased tax burden or changes to rules
and enforcement
• Local manufacturing operations in 30
countries
• Robust internal tax policies and strict transfer
pricing rules
• Strong internal control of inter-company
trading
Product
liability issues
• Claims from third parties resulting from
use of potentially hazardous materials
• Customer claims and loss of business
from product quality issues
• Personal injury claims arising from
product failure
• Appropriate insurance cover obtained
• Active monitoring of HSE issues
• Stringent quality control standards
systematically implemented in manufacturing
• Experienced legal team used to negotiate
appropriate customer agreements
Regulatory
compliance
• Financial loss through failure to comply
with appropriate regulations
• Business disruption from investigations
• Reputational damage
• Widely disseminated Code of Conduct and
supporting policies which highlight the Group’s
ethical approach to business
• Whistleblowing procedure implemented
across the Group
• On-going training and review of effectiveness
of relevant policies
Maintenance
and
protection of
leading
technologies
• Loss of business through new technology
developed by others
• Failure to adapt solutions to meet
changing customer needs
• Revenue lost through ineffective
protection of intellectual property
• Market leading research and development
team with significant investment in R&D
• Patent protection sought when new
developments are made
• Stringent defence of patents and other
intellectual property
• Control of access to intellectual property
through IT controls and physical security
Foreign
exchange,
capital
• Inability to raise sufficient capital to fund
growth of business
• Reduction in earnings from increased
• Long-term capital structure planning to secure
availability of capital at acceptable costs
• Substantial proportion of debt capital secured
15
market,
interest rate
and inflation
uncertainties
interest charges
• Weakness in foreign currencies leading to
reduced profitability
at fixed rates of interest
• International presence reduces the Group’s
reliance on any one currency
• Hedging of transactional foreign exchange
exposure when necessary
• Alignment of cost structure with revenue
where possible
Loss of a
major site
• Loss of revenue resulting from inability to
supply customers on loss of production
facilities
• Diversified manufacturing footprint with some
70 facilities across 30 countries
• Maintenance of excess capacity to allow plants
to meet peak demands
Ability to
source and
use critical
raw materials
• Manufacturing interruption from failure
of a key supplier, or the loss of availability
of a source of critical raw materials
• Strategic stocks of certain materials are
retained
• Number of single-sourced materials reduced
through expanding supplier base
• Development of new products and research
on substitution of raw materials
Cyber
security
• Loss of availability of IT service leading to
disruption of business
• Intellectual Property accessed by
malicious third parties leading to loss of
revenues through copying
• State of the art firewalls and networking
equipment with associated monitoring and
follow up
• Encrypted traffic over the Internet.
• Centralised backups and server virtualisation
• Specific focus on security issues and
programme controlling internal and external
access
Attraction
and retention
of staff
• Insufficient high quality staff to run base
business and generate growth through
innovation
• Contacts with universities to identify and
develop talent
• Internal programme to attract and develop
high potential staff from emerging markets
through cross border exchange programmes
• Extensive internal courses run by experienced
staff to transfer knowledge in a structured
manner
• Building career trajectories for technical staff
to show potential and reduce attrition
16
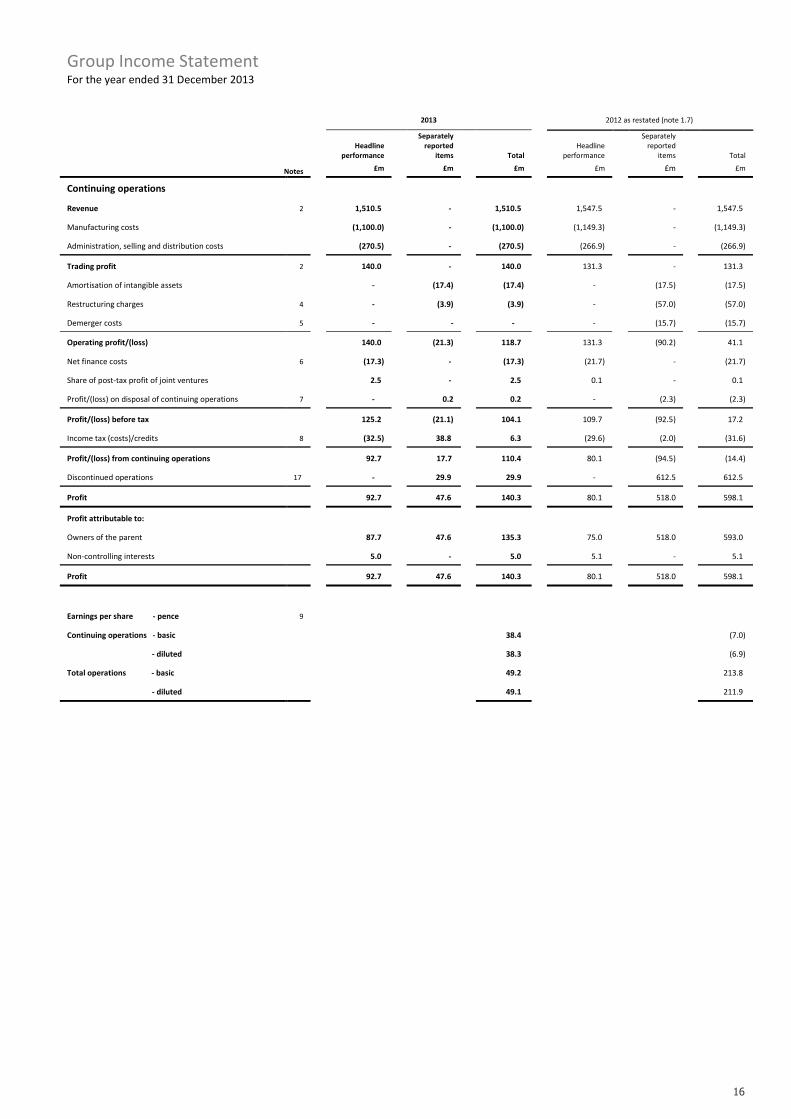
Group Income Statement For the year ended 31 December 2013
2013
2012 as restated (note 1.7)
Headline
performance
Separately
reported
items Total
Headline
performance
Separately
reported
items
Total
Notes
£m £m £m £m £m
£m
Continuing operations
Revenue 2
1,510.5
-
1,510.5
1,547.5 -
1,547.5
Manufacturing costs
(1,100.0)
-
(1,100.0)
(1,149.3) -
(1,149.3)
Administration, selling and distribution costs
(270.5)
-
(270.5)
(266.9) -
(266.9)
Trading profit 2
140.0
-
140.0
131.3 -
131.3
Amortisation of intangible assets
-
(17.4)
(17.4)
- (17.5)
(17.5)
Restructuring charges 4
-
(3.9)
(3.9)
- (57.0)
(57.0)
Demerger costs 5
-
-
-
- (15.7)
(15.7)
Operating profit/(loss)
140.0 (21.3) 118.7
131.3 (90.2)
41.1
Net finance costs 6
(17.3)
-
(17.3)
(21.7) -
(21.7)
Share of post-tax profit of joint ventures
2.5
-
2.5
0.1 -
0.1
Profit/(loss) on disposal of continuing operations 7
-
0.2
0.2
- (2.3)
(2.3)
Profit/(loss) before tax
125.2 (21.1) 104.1
109.7 (92.5)
17.2
Income tax (costs)/credits 8
(32.5) 38.8 6.3
(29.6) (2.0) (31.6)
Profit/(loss) from continuing operations 92.7 17.7 110.4 80.1 (94.5) (14.4)
Discontinued operations 17
- 29.9 29.9
- 612.5
612.5
Profit
92.7 47.6 140.3
80.1 518.0
598.1
Profit attributable to:
Owners of the parent
87.7 47.6 135.3
75.0 518.0
593.0
Non-controlling interests
5.0
-
5.0
5.1 -
5.1
Profit
92.7 47.6 140.3
80.1 518.0
598.1
Earnings per share - pence 9
Continuing operations - basic 38.4 (7.0)
- diluted 38.3 (6.9)
Total operations - basic 49.2 213.8
- diluted 49.1 211.9
17
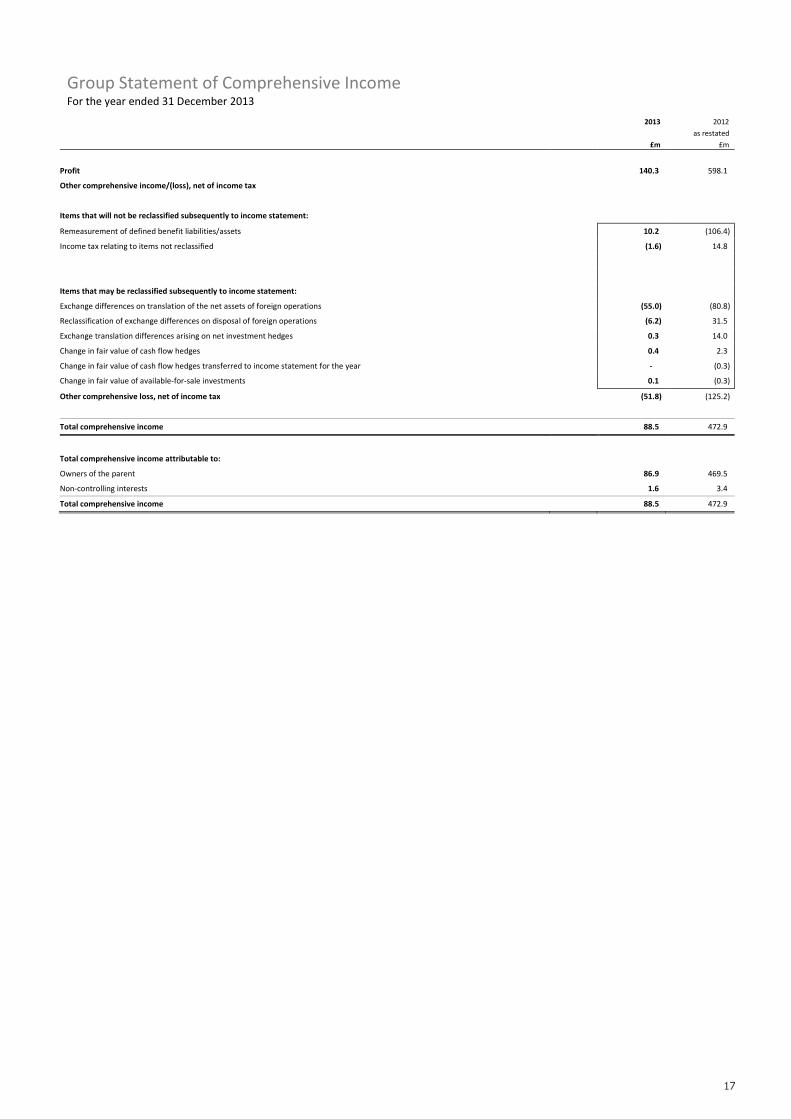
Group Statement of Comprehensive Income For the year ended 31 December 2013
2013 2012
as restated
£m £m
Profit 140.3 598.1
Other comprehensive income/(loss), net of income tax
Items that will not be reclassified subsequently to income statement:
Remeasurement of defined benefit liabilities/assets 10.2 (106.4)
Income tax relating to items not reclassified (1.6) 14.8
Items that may be reclassified subsequently to income statement:
Exchange differences on translation of the net assets of foreign operations (55.0) (80.8)
Reclassification of exchange differences on disposal of foreign operations (6.2) 31.5
Exchange translation differences arising on net investment hedges 0.3 14.0
Change in fair value of cash flow hedges 0.4 2.3
Change in fair value of cash flow hedges transferred to income statement for the year - (0.3)
Change in fair value of available-for-sale investments 0.1 (0.3)
Other comprehensive loss, net of income tax (51.8) (125.2)
Total comprehensive income 88.5 472.9
Total comprehensive income attributable to:
Owners of the parent 86.9 469.5
Non-controlling interests 1.6 3.4
Total comprehensive income 88.5 472.9
18
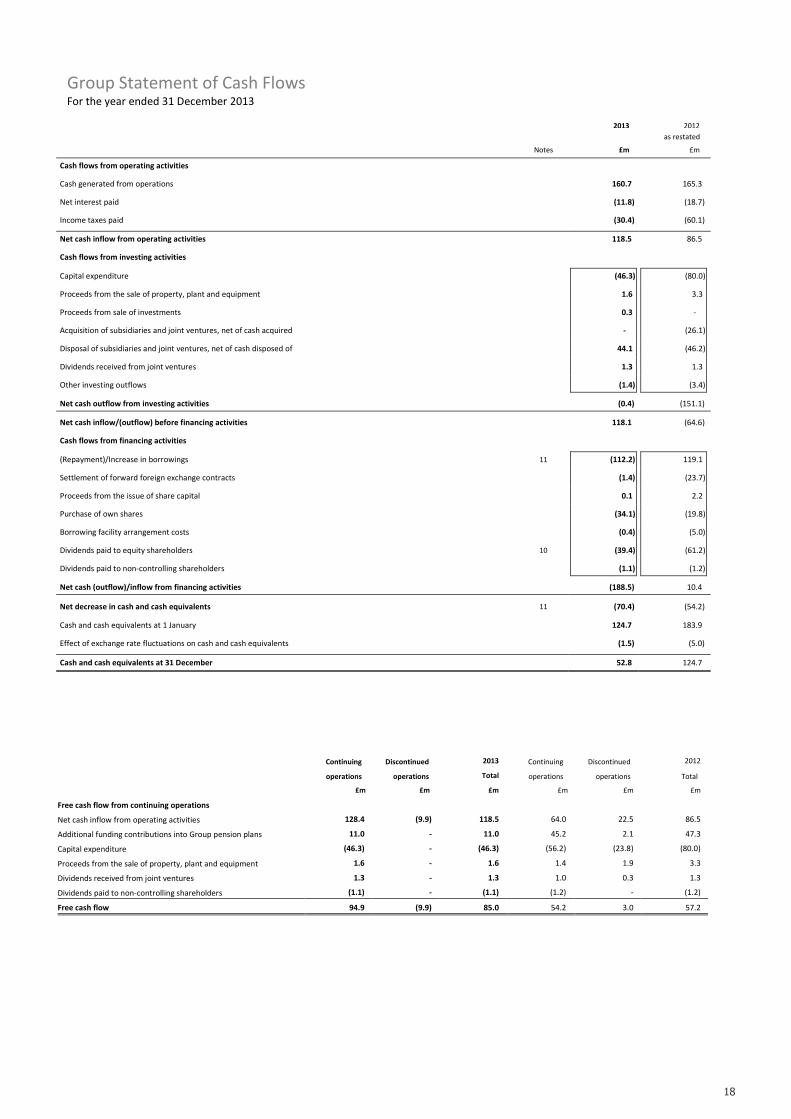
Group Statement of Cash Flows For the year ended 31 December 2013
Continuing Discontinued 2013 Continuing Discontinued 2012
operations operations Total operations operations Total
£m £m £m £m £m £m
Free cash flow from continuing operations
Net cash inflow from operating activities 128.4 (9.9) 118.5 64.0 22.5 86.5
Additional funding contributions into Group pension plans 11.0 - 11.0 45.2 2.1 47.3
Capital expenditure (46.3) - (46.3) (56.2) (23.8) (80.0)
Proceeds from the sale of property, plant and equipment 1.6 - 1.6 1.4 1.9 3.3
Dividends received from joint ventures 1.3 - 1.3 1.0 0.3 1.3
Dividends paid to non-controlling shareholders (1.1) - (1.1) (1.2) - (1.2)
Free cash flow 94.9 (9.9) 85.0 54.2 3.0 57.2
2013 2012
as restated
Notes £m £m
Cash flows from operating activities
Cash generated from operations 160.7 165.3
Net interest paid (11.8) (18.7)
Income taxes paid (30.4) (60.1)
Net cash inflow from operating activities 118.5 86.5
Cash flows from investing activities
Capital expenditure (46.3) (80.0)
Proceeds from the sale of property, plant and equipment 1.6 3.3
Proceeds from sale of investments 0.3 -
Acquisition of subsidiaries and joint ventures, net of cash acquired - (26.1)
Disposal of subsidiaries and joint ventures, net of cash disposed of 44.1 (46.2)
Dividends received from joint ventures 1.3 1.3
Other investing outflows (1.4) (3.4)
Net cash outflow from investing activities (0.4) (151.1)
Net cash inflow/(outflow) before financing activities 118.1 (64.6)
Cash flows from financing activities
(Repayment)/Increase in borrowings 11 (112.2) 119.1
Settlement of forward foreign exchange contracts (1.4) (23.7)
Proceeds from the issue of share capital 0.1 2.2
Purchase of own shares (34.1) (19.8)
Borrowing facility arrangement costs (0.4) (5.0)
Dividends paid to equity shareholders 10 (39.4) (61.2)
Dividends paid to non-controlling shareholders (1.1) (1.2)
Net cash (outflow)/inflow from financing activities (188.5) 10.4
Net decrease in cash and cash equivalents 11 (70.4) (54.2)
Cash and cash equivalents at 1 January 124.7 183.9
Effect of exchange rate fluctuations on cash and cash equivalents (1.5) (5.0)
Cash and cash equivalents at 31 December 52.8 124.7
19
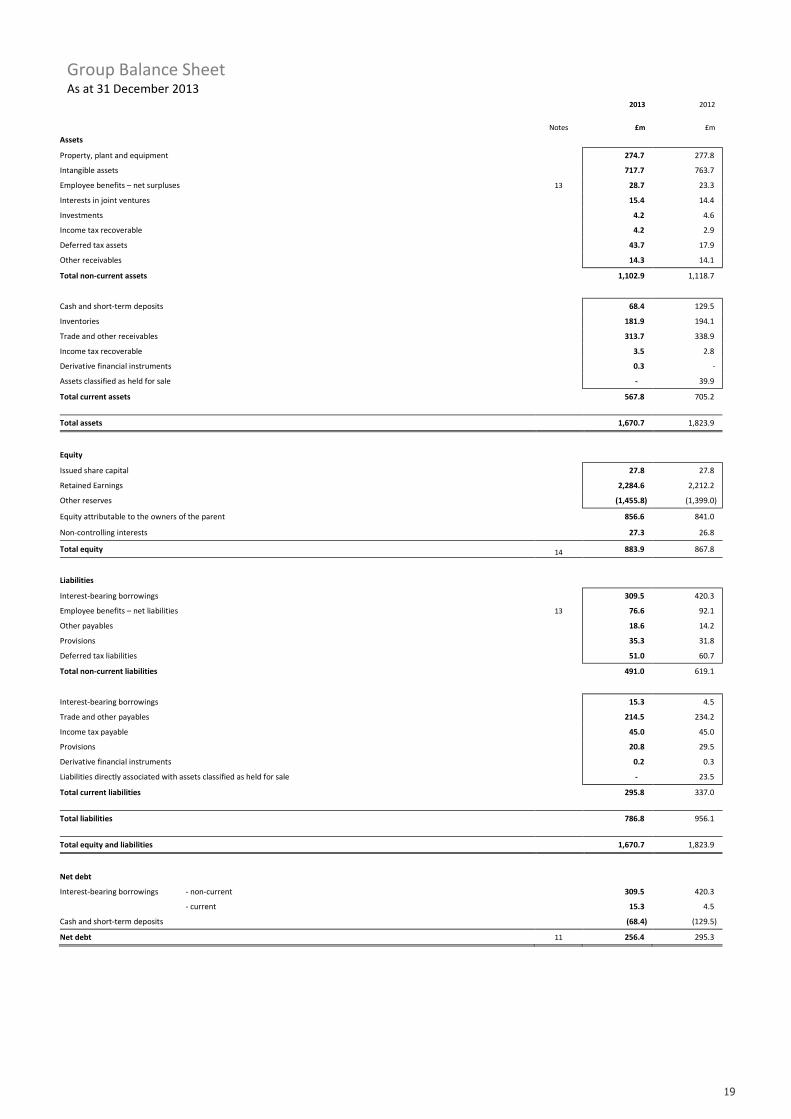
Group Balance Sheet As at 31 December 2013
2013 2012
Notes £m £m
Assets
Property, plant and equipment 274.7 277.8
Intangible assets 717.7 763.7
Employee benefits – net surpluses 13 28.7 23.3
Interests in joint ventures 15.4 14.4
Investments 4.2 4.6
Income tax recoverable 4.2 2.9
Deferred tax assets 43.7 17.9
Other receivables 14.3 14.1
Total non-current assets 1,102.9 1,118.7
Cash and short-term deposits 68.4 129.5
Inventories 181.9 194.1
Trade and other receivables 313.7 338.9
Income tax recoverable 3.5 2.8
Derivative financial instruments 0.3 -
Assets classified as held for sale - 39.9
Total current assets 567.8 705.2
Total assets 1,670.7 1,823.9
Equity
Issued share capital 27.8 27.8
Retained Earnings 2,284.6 2,212.2
Other reserves (1,455.8) (1,399.0)
Equity attributable to the owners of the parent 856.6 841.0
Non-controlling interests 27.3 26.8
Total equity 14 883.9 867.8
Liabilities
Interest-bearing borrowings 309.5 420.3
Employee benefits – net liabilities 13 76.6 92.1
Other payables 18.6 14.2
Provisions 35.3 31.8
Deferred tax liabilities 51.0 60.7
Total non-current liabilities 491.0 619.1
Interest-bearing borrowings 15.3 4.5
Trade and other payables 214.5 234.2
Income tax payable 45.0 45.0
Provisions 20.8 29.5
Derivative financial instruments 0.2 0.3
Liabilities directly associated with assets classified as held for sale - 23.5
Total current liabilities 295.8 337.0
Total liabilities 786.8 956.1
Total equity and liabilities 1,670.7 1,823.9
Net debt
Interest-bearing borrowings - non-current 309.5 420.3
- current 15.3 4.5
Cash and short-term deposits (68.4) (129.5)
Net debt 11 256.4 295.3
20
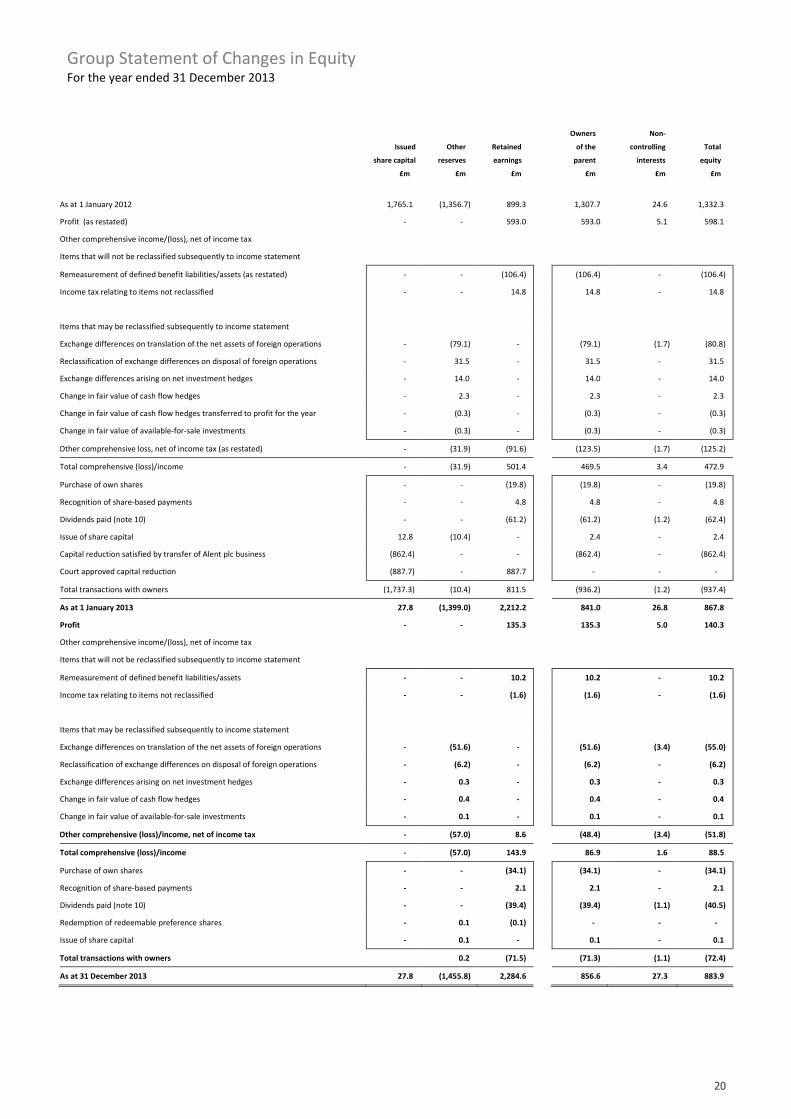
Group Statement of Changes in Equity For the year ended 31 December 2013
Owners Non-
Issued Other Retained of the controlling Total
share capital reserves earnings parent interests equity
£m £m £m £m £m £m
As at 1 January 2012 1,765.1 (1,356.7) 899.3 1,307.7 24.6 1,332.3
Profit (as restated) - - 593.0 593.0 5.1 598.1
Other comprehensive income/(loss), net of income tax
Items that will not be reclassified subsequently to income statement
Remeasurement of defined benefit liabilities/assets (as restated) - - (106.4) (106.4) - (106.4)
Income tax relating to items not reclassified - - 14.8 14.8 - 14.8
Items that may be reclassified subsequently to income statement
Exchange differences on translation of the net assets of foreign operations - (79.1) - (79.1) (1.7) (80.8)
Reclassification of exchange differences on disposal of foreign operations - 31.5 - 31.5 - 31.5
Exchange differences arising on net investment hedges - 14.0 - 14.0 - 14.0
Change in fair value of cash flow hedges - 2.3 - 2.3 - 2.3
Change in fair value of cash flow hedges transferred to profit for the year - (0.3) - (0.3) - (0.3)
Change in fair value of available-for-sale investments - (0.3) - (0.3) - (0.3)
Other comprehensive loss, net of income tax (as restated) - (31.9) (91.6) (123.5) (1.7) (125.2)
Total comprehensive (loss)/income - (31.9) 501.4 469.5 3.4 472.9
Purchase of own shares - - (19.8) (19.8) - (19.8)
Recognition of share-based payments - - 4.8 4.8 - 4.8
Dividends paid (note 10) - - (61.2) (61.2) (1.2) (62.4)
Issue of share capital 12.8 (10.4) - 2.4 - 2.4
Capital reduction satisfied by transfer of Alent plc business (862.4) - - (862.4) - (862.4)
Court approved capital reduction (887.7) - 887.7 - - -
Total transactions with owners (1,737.3) (10.4) 811.5 (936.2) (1.2) (937.4)
As at 1 January 2013 27.8 (1,399.0) 2,212.2 841.0 26.8 867.8
Profit - - 135.3 135.3 5.0 140.3
Other comprehensive income/(loss), net of income tax
Items that will not be reclassified subsequently to income statement
Remeasurement of defined benefit liabilities/assets - - 10.2 10.2 - 10.2
Income tax relating to items not reclassified - - (1.6) (1.6) - (1.6)
Items that may be reclassified subsequently to income statement
Exchange differences on translation of the net assets of foreign operations - (51.6) - (51.6) (3.4) (55.0)
Reclassification of exchange differences on disposal of foreign operations - (6.2) - (6.2) - (6.2)
Exchange differences arising on net investment hedges - 0.3 - 0.3 - 0.3
Change in fair value of cash flow hedges - 0.4 - 0.4 - 0.4
Change in fair value of available-for-sale investments - 0.1 - 0.1 - 0.1
Other comprehensive (loss)/income, net of income tax - (57.0) 8.6 (48.4) (3.4) (51.8)
Total comprehensive (loss)/income - (57.0) 143.9 86.9 1.6 88.5
Purchase of own shares - - (34.1) (34.1) - (34.1)
Recognition of share-based payments - - 2.1 2.1 - 2.1
Dividends paid (note 10) - - (39.4) (39.4) (1.1) (40.5)
Redemption of redeemable preference shares - 0.1 (0.1) - - -
Issue of share capital - 0.1 - 0.1 - 0.1
Total transactions with owners 0.2 (71.5) (71.3) (1.1) (72.4)
As at 31 December 2013 27.8 (1,455.8) 2,284.6 856.6 27.3 883.9
21
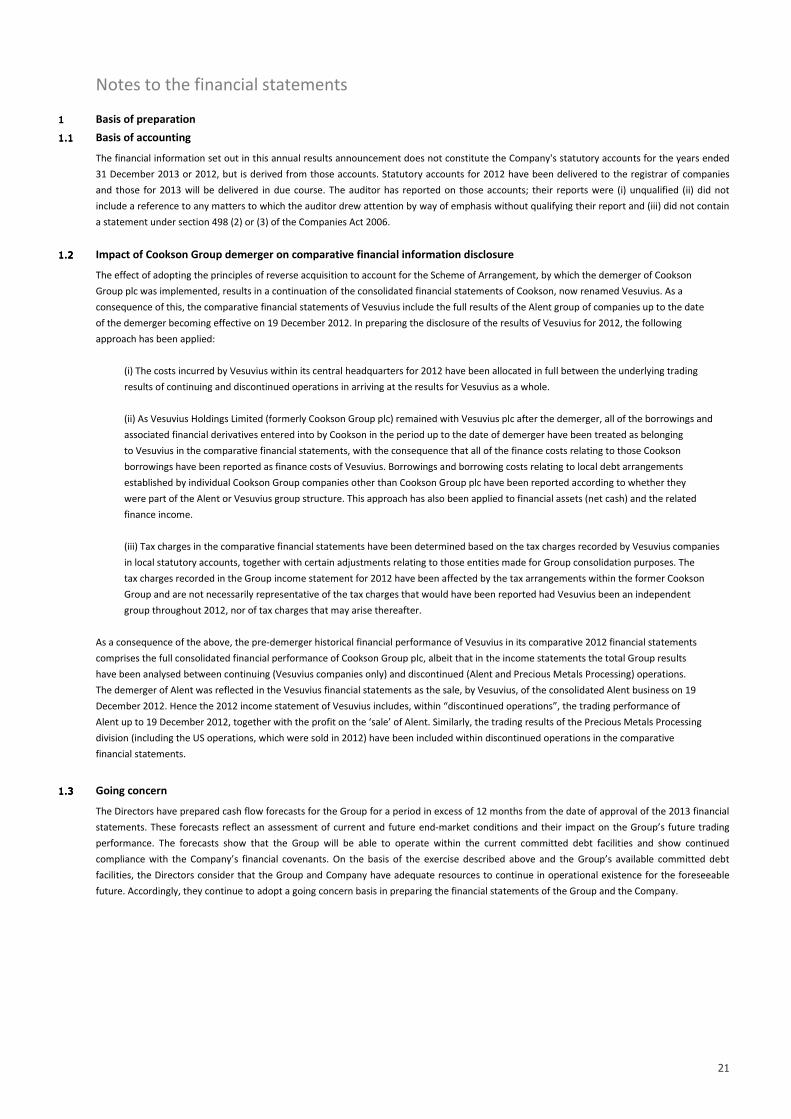
Notes to the financial statements
1111 Basis of preparation
1.11.11.11.1 Basis of accounting
The financial information set out in this annual results announcement does not constitute the Company's statutory accounts for the years ended
31 December 2013 or 2012, but is derived from those accounts. Statutory accounts for 2012 have been delivered to the registrar of companies
and those for 2013 will be delivered in due course. The auditor has reported on those accounts; their reports were (i) unqualified (ii) did not
include a reference to any matters to which the auditor drew attention by way of emphasis without qualifying their report and (iii) did not contain
a statement under section 498 (2) or (3) of the Companies Act 2006.
1.21.21.21.2 Impact of Cookson Group demerger on comparative financial information disclosure
The effect of adopting the principles of reverse acquisition to account for the Scheme of Arrangement, by which the demerger of Cookson
Group plc was implemented, results in a continuation of the consolidated financial statements of Cookson, now renamed Vesuvius. As a
consequence of this, the comparative financial statements of Vesuvius include the full results of the Alent group of companies up to the date
of the demerger becoming effective on 19 December 2012. In preparing the disclosure of the results of Vesuvius for 2012, the following
approach has been applied:
(i) The costs incurred by Vesuvius within its central headquarters for 2012 have been allocated in full between the underlying trading
results of continuing and discontinued operations in arriving at the results for Vesuvius as a whole.
(ii) As Vesuvius Holdings Limited (formerly Cookson Group plc) remained with Vesuvius plc after the demerger, all of the borrowings and
associated financial derivatives entered into by Cookson in the period up to the date of demerger have been treated as belonging
to Vesuvius in the comparative financial statements, with the consequence that all of the finance costs relating to those Cookson
borrowings have been reported as finance costs of Vesuvius. Borrowings and borrowing costs relating to local debt arrangements
established by individual Cookson Group companies other than Cookson Group plc have been reported according to whether they
were part of the Alent or Vesuvius group structure. This approach has also been applied to financial assets (net cash) and the related
finance income.
(iii) Tax charges in the comparative financial statements have been determined based on the tax charges recorded by Vesuvius companies
in local statutory accounts, together with certain adjustments relating to those entities made for Group consolidation purposes. The
tax charges recorded in the Group income statement for 2012 have been affected by the tax arrangements within the former Cookson
Group and are not necessarily representative of the tax charges that would have been reported had Vesuvius been an independent
group throughout 2012, nor of tax charges that may arise thereafter.
As a consequence of the above, the pre-demerger historical financial performance of Vesuvius in its comparative 2012 financial statements
comprises the full consolidated financial performance of Cookson Group plc, albeit that in the income statements the total Group results
have been analysed between continuing (Vesuvius companies only) and discontinued (Alent and Precious Metals Processing) operations.
The demerger of Alent was reflected in the Vesuvius financial statements as the sale, by Vesuvius, of the consolidated Alent business on 19
December 2012. Hence the 2012 income statement of Vesuvius includes, within “discontinued operations”, the trading performance of
Alent up to 19 December 2012, together with the profit on the ‘sale’ of Alent. Similarly, the trading results of the Precious Metals Processing
division (including the US operations, which were sold in 2012) have been included within discontinued operations in the comparative
financial statements.
1.31.31.31.3 Going concern
The Directors have prepared cash flow forecasts for the Group for a period in excess of 12 months from the date of approval of the 2013 financial
statements. These forecasts reflect an assessment of current and future end-market conditions and their impact on the Group’s future trading
performance. The forecasts show that the Group will be able to operate within the current committed debt facilities and show continued
compliance with the Company’s financial covenants. On the basis of the exercise described above and the Group’s available committed debt
facilities, the Directors consider that the Group and Company have adequate resources to continue in operational existence for the foreseeable
future. Accordingly, they continue to adopt a going concern basis in preparing the financial statements of the Group and the Company.
22
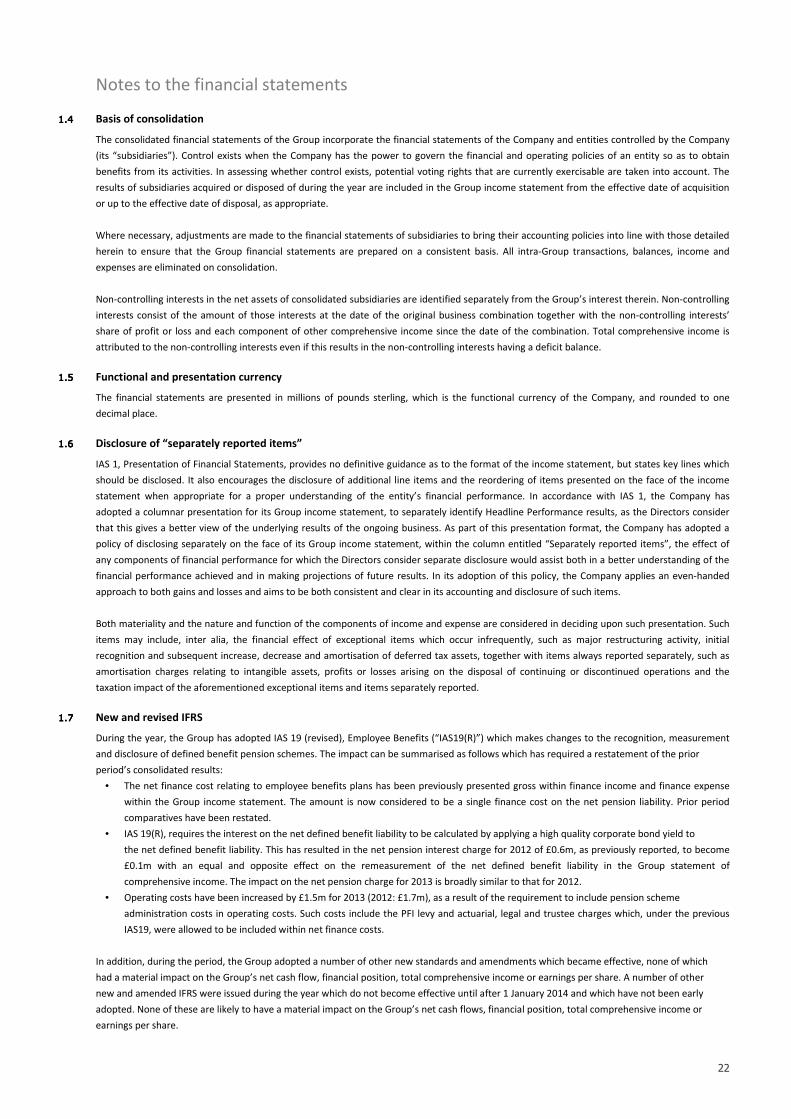
Notes to the financial statements
1.41.41.41.4 Basis of consolidation
The consolidated financial statements of the Group incorporate the financial statements of the Company and entities controlled by the Company
(its “subsidiaries”). Control exists when the Company has the power to govern the financial and operating policies of an entity so as to obtain
benefits from its activities. In assessing whether control exists, potential voting rights that are currently exercisable are taken into account. The
results of subsidiaries acquired or disposed of during the year are included in the Group income statement from the effective date of acquisition
or up to the effective date of disposal, as appropriate.
Where necessary, adjustments are made to the financial statements of subsidiaries to bring their accounting policies into line with those detailed
herein to ensure that the Group financial statements are prepared on a consistent basis. All intra-Group transactions, balances, income and
expenses are eliminated on consolidation.
Non-controlling interests in the net assets of consolidated subsidiaries are identified separately from the Group’s interest therein. Non-controlling
interests consist of the amount of those interests at the date of the original business combination together with the non-controlling interests’
share of profit or loss and each component of other comprehensive income since the date of the combination. Total comprehensive income is
attributed to the non-controlling interests even if this results in the non-controlling interests having a deficit balance.
1.51.51.51.5 Functional and presentation currency
The financial statements are presented in millions of pounds sterling, which is the functional currency of the Company, and rounded to one
decimal place.
1.61.61.61.6 Disclosure of “separately reported items”
IAS 1, Presentation of Financial Statements, provides no definitive guidance as to the format of the income statement, but states key lines which
should be disclosed. It also encourages the disclosure of additional line items and the reordering of items presented on the face of the income
statement when appropriate for a proper understanding of the entity’s financial performance. In accordance with IAS 1, the Company has
adopted a columnar presentation for its Group income statement, to separately identify Headline Performance results, as the Directors consider
that this gives a better view of the underlying results of the ongoing business. As part of this presentation format, the Company has adopted a
policy of disclosing separately on the face of its Group income statement, within the column entitled “Separately reported items”, the effect of
any components of financial performance for which the Directors consider separate disclosure would assist both in a better understanding of the
financial performance achieved and in making projections of future results. In its adoption of this policy, the Company applies an even-handed
approach to both gains and losses and aims to be both consistent and clear in its accounting and disclosure of such items.
Both materiality and the nature and function of the components of income and expense are considered in deciding upon such presentation. Such
items may include, inter alia, the financial effect of exceptional items which occur infrequently, such as major restructuring activity, initial
recognition and subsequent increase, decrease and amortisation of deferred tax assets, together with items always reported separately, such as
amortisation charges relating to intangible assets, profits or losses arising on the disposal of continuing or discontinued operations and the
taxation impact of the aforementioned exceptional items and items separately reported.
1.71.71.71.7 New and revised IFRS
During the year, the Group has adopted IAS 19 (revised), Employee Benefits (“IAS19(R)”) which makes changes to the recognition, measurement
and disclosure of defined benefit pension schemes. The impact can be summarised as follows which has required a restatement of the prior
period’s consolidated results:
• The net finance cost relating to employee benefits plans has been previously presented gross within finance income and finance expense
within the Group income statement. The amount is now considered to be a single finance cost on the net pension liability. Prior period
comparatives have been restated.
• IAS 19(R), requires the interest on the net defined benefit liability to be calculated by applying a high quality corporate bond yield to
the net defined benefit liability. This has resulted in the net pension interest charge for 2012 of £0.6m, as previously reported, to become
£0.1m with an equal and opposite effect on the remeasurement of the net defined benefit liability in the Group statement of
comprehensive income. The impact on the net pension charge for 2013 is broadly similar to that for 2012.
• Operating costs have been increased by £1.5m for 2013 (2012: £1.7m), as a result of the requirement to include pension scheme
administration costs in operating costs. Such costs include the PFI levy and actuarial, legal and trustee charges which, under the previous
IAS19, were allowed to be included within net finance costs.
In addition, during the period, the Group adopted a number of other new standards and amendments which became effective, none of which
had a material impact on the Group’s net cash flow, financial position, total comprehensive income or earnings per share. A number of other
new and amended IFRS were issued during the year which do not become effective until after 1 January 2014 and which have not been early
adopted. None of these are likely to have a material impact on the Group’s net cash flows, financial position, total comprehensive income or
earnings per share.
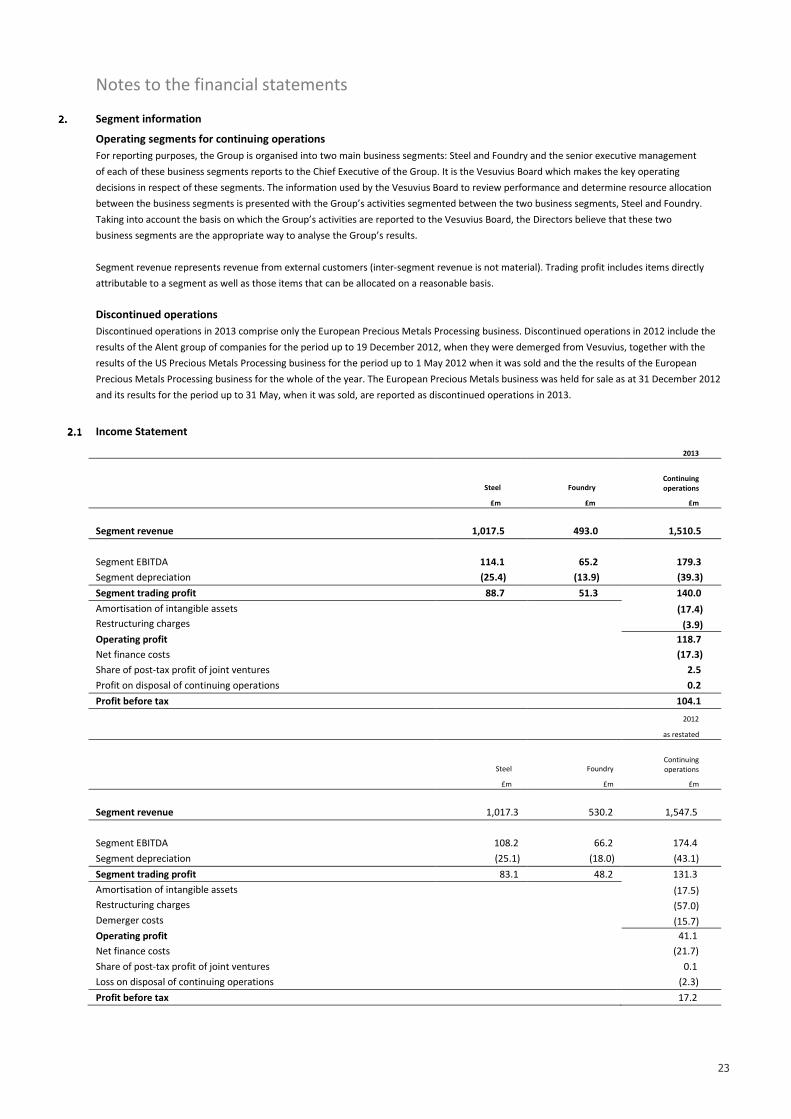
23
Notes to the financial statements
2.2.2.2. Segment information
Operating segments for continuing operations
For reporting purposes, the Group is organised into two main business segments: Steel and Foundry and the senior executive management
of each of these business segments reports to the Chief Executive of the Group. It is the Vesuvius Board which makes the key operating
decisions in respect of these segments. The information used by the Vesuvius Board to review performance and determine resource allocation
between the business segments is presented with the Group’s activities segmented between the two business segments, Steel and Foundry.
Taking into account the basis on which the Group’s activities are reported to the Vesuvius Board, the Directors believe that these two
business segments are the appropriate way to analyse the Group’s results.
Segment revenue represents revenue from external customers (inter-segment revenue is not material). Trading profit includes items directly
attributable to a segment as well as those items that can be allocated on a reasonable basis.
Discontinued operations
Discontinued operations in 2013 comprise only the European Precious Metals Processing business. Discontinued operations in 2012 include the
results of the Alent group of companies for the period up to 19 December 2012, when they were demerged from Vesuvius, together with the
results of the US Precious Metals Processing business for the period up to 1 May 2012 when it was sold and the the results of the European
Precious Metals Processing business for the whole of the year. The European Precious Metals business was held for sale as at 31 December 2012
and its results for the period up to 31 May, when it was sold, are reported as discontinued operations in 2013.
2.12.12.12.1 Income Statement
2013
Steel Foundry
Continuing
operations
£m £m £m
Segment revenue 1,017.5 493.0 1,510.5
Segment EBITDA 114.1 65.2 179.3
Segment depreciation (25.4) (13.9) (39.3)
Segment trading profit 88.7 51.3 140.0
Amortisation of intangible assets (17.4)
Restructuring charges (3.9)
Operating profit 118.7
Net finance costs (17.3)
Share of post-tax profit of joint ventures 2.5
Profit on disposal of continuing operations 0.2
Profit before tax 104.1
2012
as restated
Steel Foundry Continuing
operations
£m £m £m
Segment revenue 1,017.3 530.2 1,547.5
Segment EBITDA 108.2 66.2 174.4
Segment depreciation (25.1) (18.0) (43.1)
Segment trading profit 83.1 48.2 131.3
Amortisation of intangible assets (17.5)
Restructuring charges (57.0)
Demerger costs (15.7)
Operating profit 41.1
Net finance costs (21.7)
Share of post-tax profit of joint ventures 0.1
Loss on disposal of continuing operations (2.3)
Profit before tax 17.2
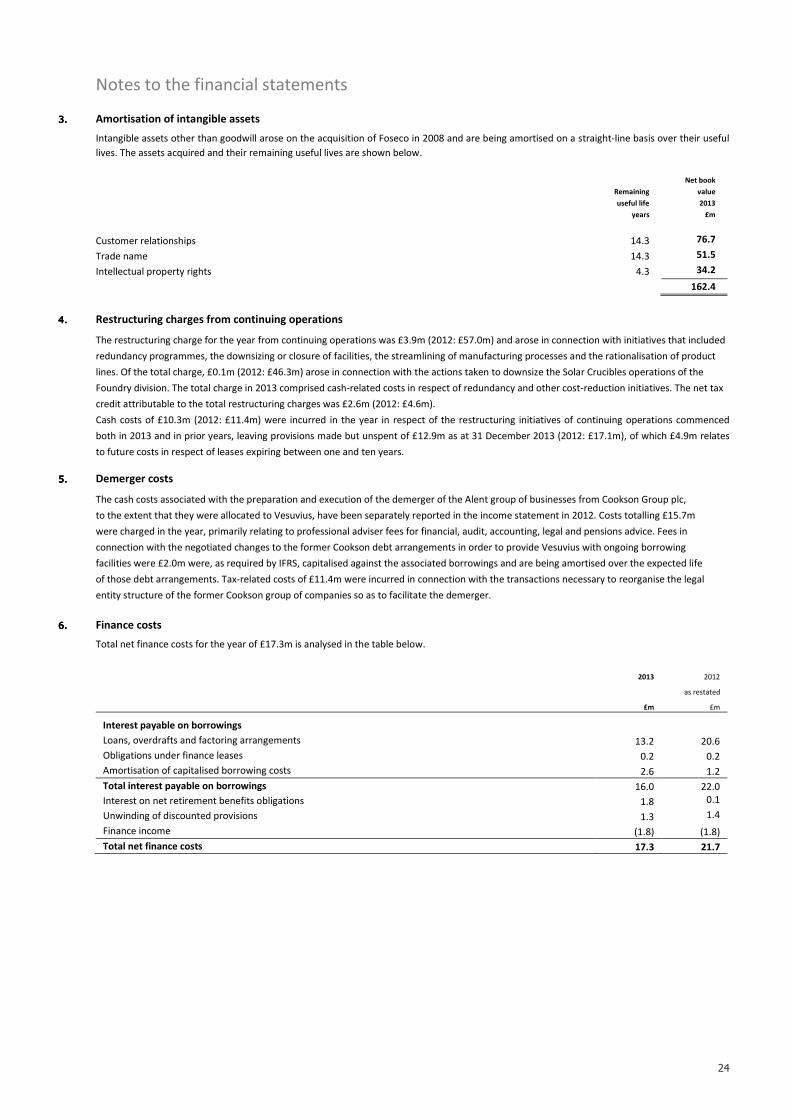
24
Notes to the financial statements
3.3.3.3. Amortisation of intangible assets
Intangible assets other than goodwill arose on the acquisition of Foseco in 2008 and are being amortised on a straight-line basis over their useful
lives. The assets acquired and their remaining useful lives are shown below.
Net book
Remaining value
useful life 2013
years £m
Customer relationships 14.3 76.7
Trade name 14.3 51.5
Intellectual property rights 4.3 34.2
162.4
4.4.4.4. Restructuring charges from continuing operations
The restructuring charge for the year from continuing operations was £3.9m (2012: £57.0m) and arose in connection with initiatives that included
redundancy programmes, the downsizing or closure of facilities, the streamlining of manufacturing processes and the rationalisation of product
lines. Of the total charge, £0.1m (2012: £46.3m) arose in connection with the actions taken to downsize the Solar Crucibles operations of the
Foundry division. The total charge in 2013 comprised cash-related costs in respect of redundancy and other cost-reduction initiatives. The net tax
credit attributable to the total restructuring charges was £2.6m (2012: £4.6m).
Cash costs of £10.3m (2012: £11.4m) were incurred in the year in respect of the restructuring initiatives of continuing operations commenced
both in 2013 and in prior years, leaving provisions made but unspent of £12.9m as at 31 December 2013 (2012: £17.1m), of which £4.9m relates
to future costs in respect of leases expiring between one and ten years.
5.5.5.5. Demerger costs
The cash costs associated with the preparation and execution of the demerger of the Alent group of businesses from Cookson Group plc,
to the extent that they were allocated to Vesuvius, have been separately reported in the income statement in 2012. Costs totalling £15.7m
were charged in the year, primarily relating to professional adviser fees for financial, audit, accounting, legal and pensions advice. Fees in
connection with the negotiated changes to the former Cookson debt arrangements in order to provide Vesuvius with ongoing borrowing
facilities were £2.0m were, as required by IFRS, capitalised against the associated borrowings and are being amortised over the expected life
of those debt arrangements. Tax-related costs of £11.4m were incurred in connection with the transactions necessary to reorganise the legal
entity structure of the former Cookson group of companies so as to facilitate the demerger.
6.6.6.6. Finance costs
Total net finance costs for the year of £17.3m is analysed in the table below.
2013 2012
as restated
£m £m
Interest payable on borrowings Loans, overdrafts and factoring arrangements 13.2 20.6
Obligations under finance leases 0.2 0.2
Amortisation of capitalised borrowing costs 2.6 1.2
Total interest payable on borrowings 16.0 22.0
Interest on net retirement benefits obligations 1.8 0.1
Unwinding of discounted provisions 1.3 1.4
Finance income (1.8) (1.8)
Total net finance costs 17.3 21.7
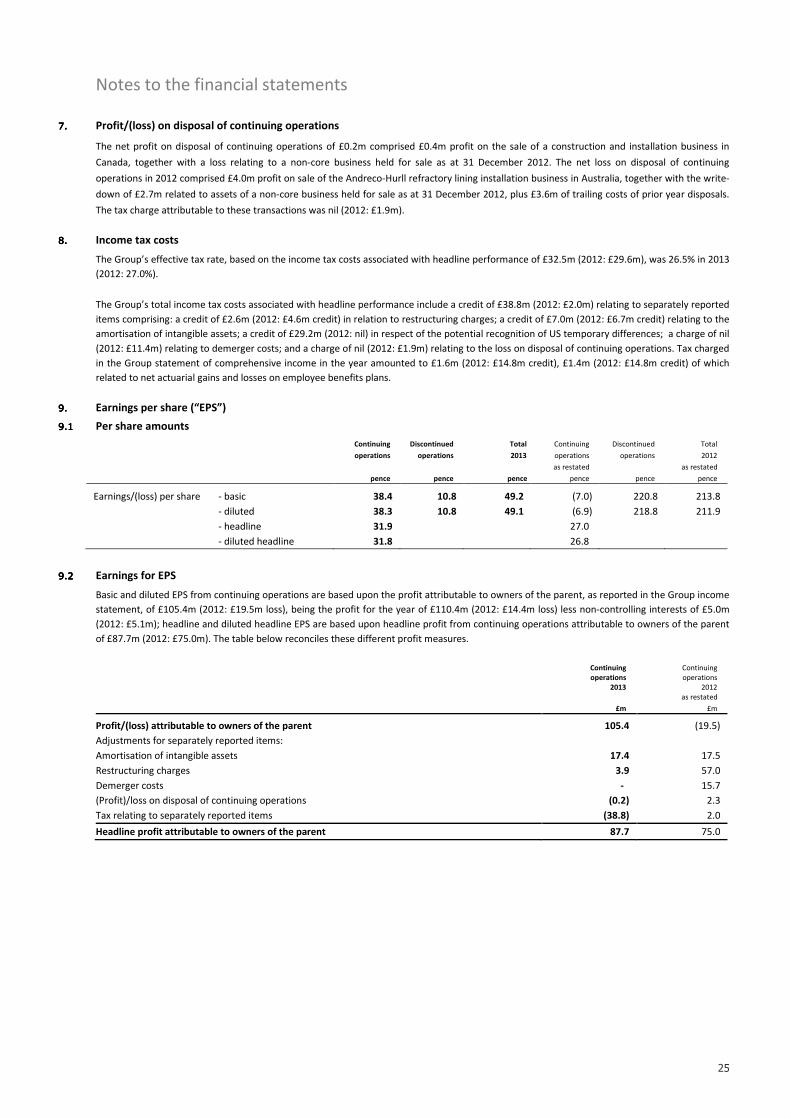
25
Notes to the financial statements
7.7.7.7. Profit/(loss) on disposal of continuing operations
The net profit on disposal of continuing operations of £0.2m comprised £0.4m profit on the sale of a construction and installation business in
Canada, together with a loss relating to a non-core business held for sale as at 31 December 2012. The net loss on disposal of continuing
operations in 2012 comprised £4.0m profit on sale of the Andreco-Hurll refractory lining installation business in Australia, together with the write-
down of £2.7m related to assets of a non-core business held for sale as at 31 December 2012, plus £3.6m of trailing costs of prior year disposals.
The tax charge attributable to these transactions was nil (2012: £1.9m).
8.8.8.8. Income tax costs
The Group’s effective tax rate, based on the income tax costs associated with headline performance of £32.5m (2012: £29.6m), was 26.5% in 2013
(2012: 27.0%).
The Group’s total income tax costs associated with headline performance include a credit of £38.8m (2012: £2.0m) relating to separately reported
items comprising: a credit of £2.6m (2012: £4.6m credit) in relation to restructuring charges; a credit of £7.0m (2012: £6.7m credit) relating to the
amortisation of intangible assets; a credit of £29.2m (2012: nil) in respect of the potential recognition of US temporary differences; a charge of nil
(2012: £11.4m) relating to demerger costs; and a charge of nil (2012: £1.9m) relating to the loss on disposal of continuing operations. Tax charged
in the Group statement of comprehensive income in the year amounted to £1.6m (2012: £14.8m credit), £1.4m (2012: £14.8m credit) of which
related to net actuarial gains and losses on employee benefits plans.
9.9.9.9. Earnings per share (“EPS”)
9.19.19.19.1 Per share amounts
Continuing Discontinued Total Continuing Discontinued Total
operations operations 2013 operations operations 2012
as restated as restated
pence pence pence pence pence pence
Earnings/(loss) per share - basic 38.4 10.8 49.2 (7.0) 220.8 213.8
- diluted 38.3 10.8 49.1 (6.9) 218.8 211.9
- headline 31.9 27.0
- diluted headline 31.8 26.8
9.29.29.29.2 Earnings for EPS
Basic and diluted EPS from continuing operations are based upon the profit attributable to owners of the parent, as reported in the Group income
statement, of £105.4m (2012: £19.5m loss), being the profit for the year of £110.4m (2012: £14.4m loss) less non-controlling interests of £5.0m
(2012: £5.1m); headline and diluted headline EPS are based upon headline profit from continuing operations attributable to owners of the parent
of £87.7m (2012: £75.0m). The table below reconciles these different profit measures.
Continuing Continuing
operations
2013
operations
2012
as restated
£m £m
Profit/(loss) attributable to owners of the parent 105.4 (19.5)
Adjustments for separately reported items:
Amortisation of intangible assets 17.4 17.5
Restructuring charges 3.9 57.0
Demerger costs - 15.7
(Profit)/loss on disposal of continuing operations (0.2) 2.3
Tax relating to separately reported items (38.8) 2.0
Headline profit attributable to owners of the parent 87.7 75.0
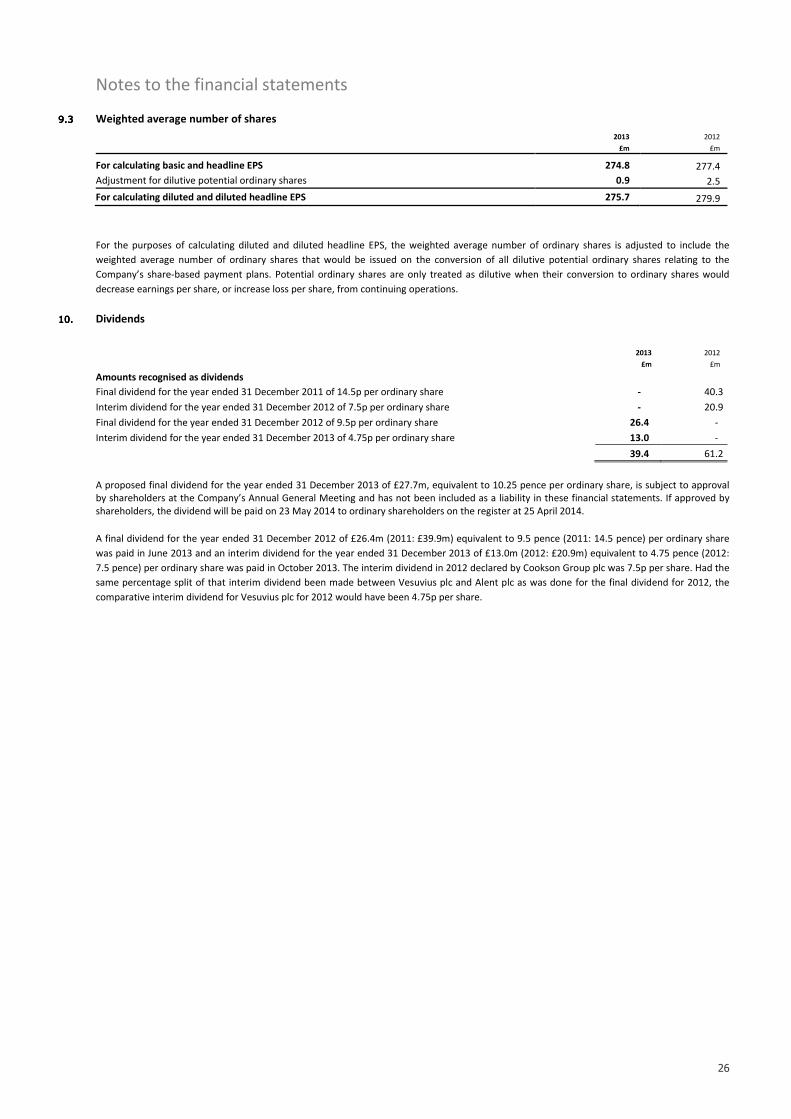
26
Notes to the financial statements
9.39.39.39.3 Weighted average number of shares
2013 2012
£m £m
For calculating basic and headline EPS 274.8 277.4
Adjustment for dilutive potential ordinary shares 0.9 2.5
For calculating diluted and diluted headline EPS 275.7 279.9
For the purposes of calculating diluted and diluted headline EPS, the weighted average number of ordinary shares is adjusted to include the
weighted average number of ordinary shares that would be issued on the conversion of all dilutive potential ordinary shares relating to the
Company’s share-based payment plans. Potential ordinary shares are only treated as dilutive when their conversion to ordinary shares would
decrease earnings per share, or increase loss per share, from continuing operations.
10.10.10.10. Dividends
2013 2012
£m £m
Amounts recognised as dividends
Final dividend for the year ended 31 December 2011 of 14.5p per ordinary share - 40.3
Interim dividend for the year ended 31 December 2012 of 7.5p per ordinary share - 20.9
Final dividend for the year ended 31 December 2012 of 9.5p per ordinary share 26.4 -
Interim dividend for the year ended 31 December 2013 of 4.75p per ordinary share 13.0 -
39.4 61.2
A proposed final dividend for the year ended 31 December 2013 of £27.7m, equivalent to 10.25 pence per ordinary share, is subject to approval
by shareholders at the Company’s Annual General Meeting and has not been included as a liability in these financial statements. If approved by
shareholders, the dividend will be paid on 23 May 2014 to ordinary shareholders on the register at 25 April 2014.
A final dividend for the year ended 31 December 2012 of £26.4m (2011: £39.9m) equivalent to 9.5 pence (2011: 14.5 pence) per ordinary share
was paid in June 2013 and an interim dividend for the year ended 31 December 2013 of £13.0m (2012: £20.9m) equivalent to 4.75 pence (2012:
7.5 pence) per ordinary share was paid in October 2013. The interim dividend in 2012 declared by Cookson Group plc was 7.5p per share. Had the
same percentage split of that interim dividend been made between Vesuvius plc and Alent plc as was done for the final dividend for 2012, the
comparative interim dividend for Vesuvius plc for 2012 would have been 4.75p per share.
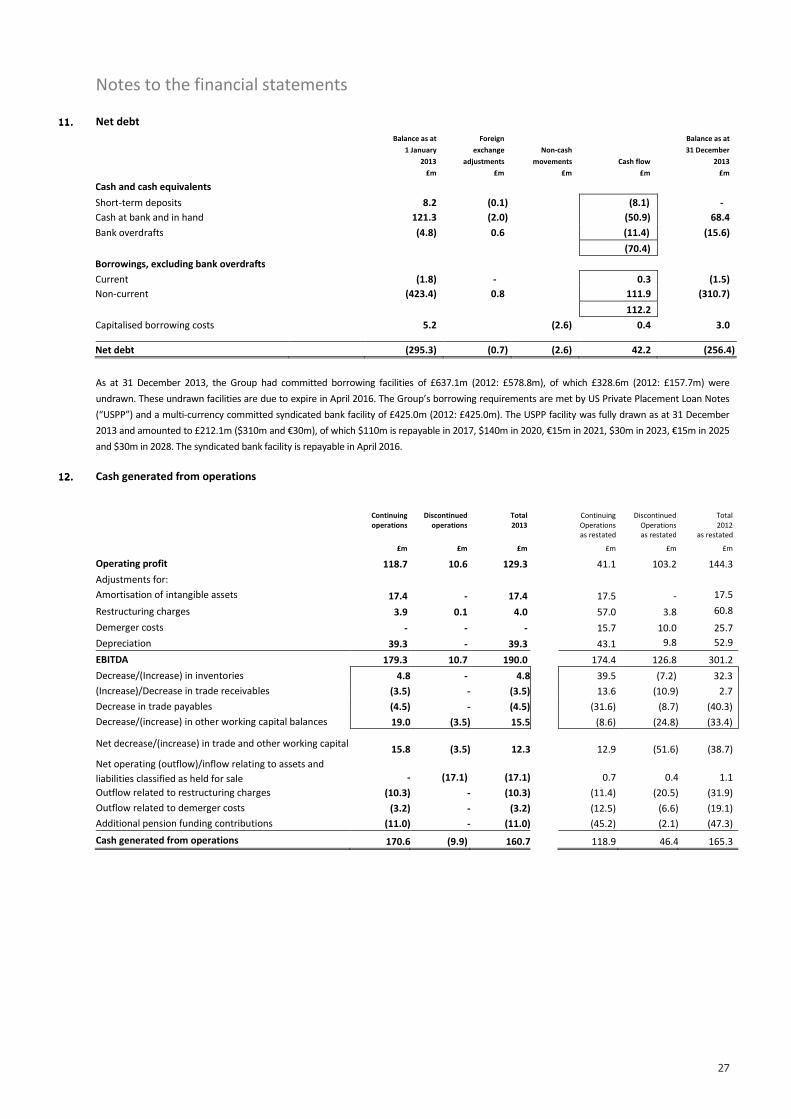
27
Notes to the financial statements
11.11.11.11. Net debt
Balance as at Foreign Balance as at
1 January exchange Non-cash 31 December
2013 adjustments movements Cash flow 2013
£m £m £m £m £m
Cash and cash equivalents
Short-term deposits 8.2 (0.1) (8.1) -
Cash at bank and in hand 121.3 (2.0) (50.9) 68.4
Bank overdrafts (4.8) 0.6 (11.4) (15.6)
(70.4)
Borrowings, excluding bank overdrafts
Current (1.8) - 0.3 (1.5)
Non-current (423.4) 0.8 111.9 (310.7)
112.2
Capitalised borrowing costs 5.2 (2.6) 0.4 3.0
Net debt (295.3) (0.7) (2.6) 42.2 (256.4)
As at 31 December 2013, the Group had committed borrowing facilities of £637.1m (2012: £578.8m), of which £328.6m (2012: £157.7m) were
undrawn. These undrawn facilities are due to expire in April 2016. The Group’s borrowing requirements are met by US Private Placement Loan Notes
(“USPP”) and a multi-currency committed syndicated bank facility of £425.0m (2012: £425.0m). The USPP facility was fully drawn as at 31 December
2013 and amounted to £212.1m ($310m and €30m), of which $110m is repayable in 2017, $140m in 2020, €15m in 2021, $30m in 2023, €15m in 2025
and $30m in 2028. The syndicated bank facility is repayable in April 2016.
12.12.12.12. Cash generated from operations
Continuing Discontinued Total Continuing Discontinued Total
operations operations 2013 Operations Operations 2012
as restated as restated as restated
£m £m £m £m £m £m
Operating profit 118.7 10.6 129.3 41.1 103.2 144.3
Adjustments for:
Amortisation of intangible assets 17.4 - 17.4 17.5 - 17.5
Restructuring charges 3.9 0.1 4.0 57.0 3.8 60.8
Demerger costs - - - 15.7 10.0 25.7
Depreciation 39.3 - 39.3 43.1 9.8 52.9
EBITDA 179.3 10.7 190.0 174.4 126.8 301.2
Decrease/(Increase) in inventories 4.8 - 4.8 39.5 (7.2) 32.3
(Increase)/Decrease in trade receivables (3.5) - (3.5) 13.6 (10.9) 2.7
Decrease in trade payables (4.5) - (4.5) (31.6) (8.7) (40.3)
Decrease/(increase) in other working capital balances 19.0 (3.5) 15.5 (8.6) (24.8) (33.4)
Net decrease/(increase) in trade and other working capital 15.8 (3.5) 12.3 12.9 (51.6) (38.7)
Net operating (outflow)/inflow relating to assets and
liabilities classified as held for sale - (17.1) (17.1) 0.7 0.4 1.1
Outflow related to restructuring charges (10.3) - (10.3) (11.4) (20.5) (31.9)
Outflow related to demerger costs (3.2) - (3.2) (12.5) (6.6) (19.1)
Additional pension funding contributions (11.0) - (11.0) (45.2) (2.1) (47.3)
Cash generated from operations 170.6 (9.9) 160.7 118.9 46.4 165.3
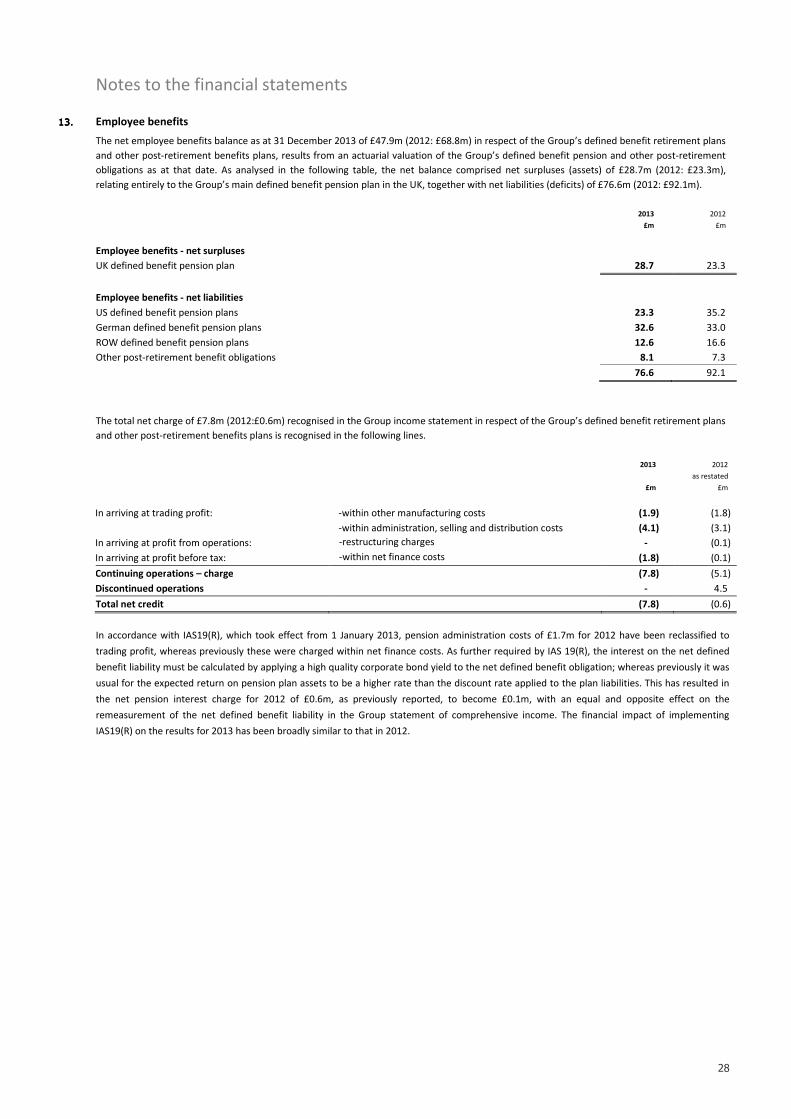
28
Notes to the financial statements
13.13.13.13. Employee benefits
The net employee benefits balance as at 31 December 2013 of £47.9m (2012: £68.8m) in respect of the Group’s defined benefit retirement plans
and other post-retirement benefits plans, results from an actuarial valuation of the Group’s defined benefit pension and other post-retirement
obligations as at that date. As analysed in the following table, the net balance comprised net surpluses (assets) of £28.7m (2012: £23.3m),
relating entirely to the Group’s main defined benefit pension plan in the UK, together with net liabilities (deficits) of £76.6m (2012: £92.1m).
2013 2012
£m £m
Employee benefits - net surpluses
UK defined benefit pension plan 28.7 23.3
Employee benefits - net liabilities
US defined benefit pension plans 23.3 35.2
German defined benefit pension plans 32.6 33.0
ROW defined benefit pension plans 12.6 16.6
Other post-retirement benefit obligations 8.1 7.3
76.6 92.1
The total net charge of £7.8m (2012:£0.6m) recognised in the Group income statement in respect of the Group’s defined benefit retirement plans
and other post-retirement benefits plans is recognised in the following lines.
2013 2012
as restated
£m £m
In arriving at trading profit: -within other manufacturing costs (1.9) (1.8)
-within administration, selling and distribution costs (4.1) (3.1)
In arriving at profit from operations: -restructuring charges - (0.1)
In arriving at profit before tax: -within net finance costs (1.8) (0.1)
Continuing operations – charge (7.8) (5.1)
Discontinued operations - 4.5
Total net credit (7.8) (0.6)
In accordance with IAS19(R), which took effect from 1 January 2013, pension administration costs of £1.7m for 2012 have been reclassified to
trading profit, whereas previously these were charged within net finance costs. As further required by IAS 19(R), the interest on the net defined
benefit liability must be calculated by applying a high quality corporate bond yield to the net defined benefit obligation; whereas previously it was
usual for the expected return on pension plan assets to be a higher rate than the discount rate applied to the plan liabilities. This has resulted in
the net pension interest charge for 2012 of £0.6m, as previously reported, to become £0.1m, with an equal and opposite effect on the
remeasurement of the net defined benefit liability in the Group statement of comprehensive income. The financial impact of implementing
IAS19(R) on the results for 2013 has been broadly similar to that in 2012.
29
Notes to the financial statements
14.14.14.14. Shareholders’ equity
Following the completion of the sale of the European Precious Metals division on 31 May 2013, the Group commenced an on-market share
repurchase programme to return cash to shareholders. During the period from 4 June 2013 to 31 December 2013, the Group had repurchased
7,271,174 of its own ordinary shares for £30.0m.
15.15.15.15. Related parties
All transactions with related parties are conducted on an arm’s length basis and in accordance with normal business terms. Transactions between
related parties that are Group subsidiaries are eliminated on consolidation.
16.16.16.16. Contingent liabilities
Guarantees given by the Group under property leases of operations disposed of amounted to £2.7m (2012: £3.4m).
Vesuvius has extensive international operations and is subject to various legal and regulatory regimes, including those covering taxation and
environmental matters. Several of Vesuvius’ subsidiaries are parties to legal proceedings, certain of which are insured claims arising in the
ordinary course of the operations of the company involved, and the Directors are aware of a number of issues which are, or may be, the subject of
dispute with tax authorities. Reserves are made for the expected amounts payable in respect of known or probable costs resulting both from legal
or other regulatory requirements, or from third-party claims. As the settlement of many of the obligations for which reserve is made is subject to
legal or other regulatory process, the timing and amount of the associated outflows is subject to some uncertainty.
Certain of Vesuvius’ subsidiaries are subject to lawsuits, predominantly in the US, relating to a small number of products containing asbestos
manufactured prior to the acquisition of those subsidiaries by Vesuvius. These suits usually also name many other product manufacturers. To
date, Vesuvius is not aware of there being any liability verdicts against any of these subsidiaries. A number of lawsuits have been withdrawn,
dismissed or settled and the amount paid, including costs, in relation to this litigation has not had a material adverse effect on Vesuvius’ financial
position or results of operations.
Cookson Precious Metals Ltd, a subsidiary of Vesuvius, was engaged in transactions involving the purchase of scrap platinum between August
2007 and October 2009. Vesuvius has been informed by HMRC that, in HMRC’s view, certain external third parties within the supply chain for
those transactions deliberately failed to account to HMRC for VAT. Such fraud is commonly known as Missing Trader Intra-Community Fraud.
HMRC have undertaken and investigation to assess whether, as a consequence of any fraudulent actions of those third parties, they could argue
that the ability of Vesuvius to retain VAT recovered on the relevant transactions should be limited. HMRC’s investigation has been concluded in
respect of most of the VAT loss under investigation, with no associated liability for VAT or interest or penalties arising.
Certain subsidiary companies of Vesuvius plc and Alent plc are defendants in two actions, brought by MacDermid (incorporated in the United
States), which are pending in the Connecticut Superior Court and arising out of corporate activity involving the parties in the autumn of 2006. The
first action was commenced in 2009 and the second action was commenced in August 2012. MacDermid claims damages of approximately $62m,
plus punitive or exemplary damages, costs and interest which are currently unquantifiable. Both Vesuvius and Alent believe these claims have no
merit and are vigorously defending these actions. Each of Vesuvius and Alent anticipate filing motions for summary judgement in both cases by
mid-2014 and, if any claims remain pending decisions on those motions, a trial in the first action is anticipated in the first half of 2015. Any liability
relating to the MacDermid claim arising following the demerger of Cookson Group will be split equally between Alent plc and Vesuvius plc.
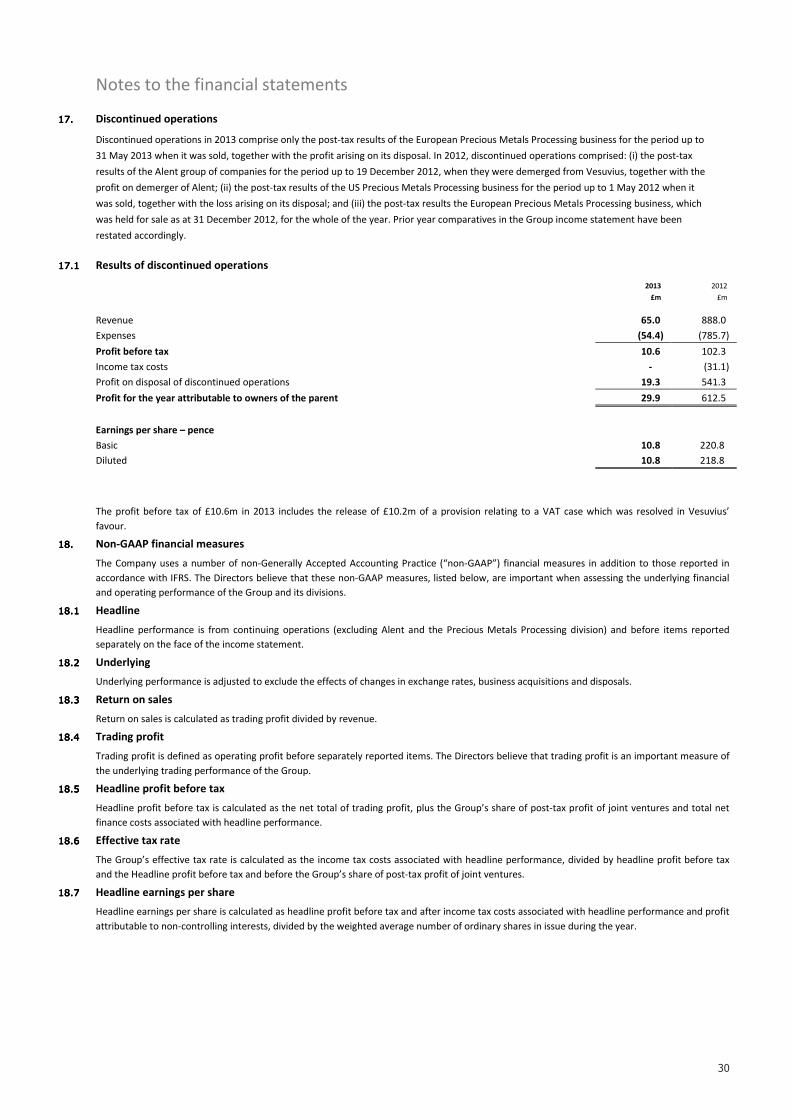
30
Notes to the financial statements
17.17.17.17. Discontinued operations
Discontinued operations in 2013 comprise only the post-tax results of the European Precious Metals Processing business for the period up to
31 May 2013 when it was sold, together with the profit arising on its disposal. In 2012, discontinued operations comprised: (i) the post-tax
results of the Alent group of companies for the period up to 19 December 2012, when they were demerged from Vesuvius, together with the
profit on demerger of Alent; (ii) the post-tax results of the US Precious Metals Processing business for the period up to 1 May 2012 when it
was sold, together with the loss arising on its disposal; and (iii) the post-tax results the European Precious Metals Processing business, which
was held for sale as at 31 December 2012, for the whole of the year. Prior year comparatives in the Group income statement have been
restated accordingly.
17.117.117.117.1 Results of discontinued operations
2013 2012
£m £m
Revenue 65.0 888.0
Expenses (54.4) (785.7)
Profit before tax 10.6 102.3
Income tax costs - (31.1)
Profit on disposal of discontinued operations 19.3 541.3
Profit for the year attributable to owners of the parent 29.9 612.5
Earnings per share – pence
Basic 10.8 220.8
Diluted 10.8 218.8
The profit before tax of £10.6m in 2013 includes the release of £10.2m of a provision relating to a VAT case which was resolved in Vesuvius’
favour.
18.18.18.18. Non-GAAP financial measures
The Company uses a number of non-Generally Accepted Accounting Practice (“non-GAAP”) financial measures in addition to those reported in
accordance with IFRS. The Directors believe that these non-GAAP measures, listed below, are important when assessing the underlying financial
and operating performance of the Group and its divisions.
18.118.118.118.1 Headline
Headline performance is from continuing operations (excluding Alent and the Precious Metals Processing division) and before items reported
separately on the face of the income statement.
18.218.218.218.2 Underlying
Underlying performance is adjusted to exclude the effects of changes in exchange rates, business acquisitions and disposals.
18.318.318.318.3 Return on sales
Return on sales is calculated as trading profit divided by revenue.
18.418.418.418.4 Trading profit
Trading profit is defined as operating profit before separately reported items. The Directors believe that trading profit is an important measure of
the underlying trading performance of the Group.
18.518.518.518.5 Headline profit before tax
Headline profit before tax is calculated as the net total of trading profit, plus the Group’s share of post-tax profit of joint ventures and total net
finance costs associated with headline performance.
18.618.618.618.6 Effective tax rate
The Group’s effective tax rate is calculated as the income tax costs associated with headline performance, divided by headline profit before tax
and the Headline profit before tax and before the Group’s share of post-tax profit of joint ventures.
18.718.718.718.7 Headline earnings per share
Headline earnings per share is calculated as headline profit before tax and after income tax costs associated with headline performance and profit
attributable to non-controlling interests, divided by the weighted average number of ordinary shares in issue during the year.
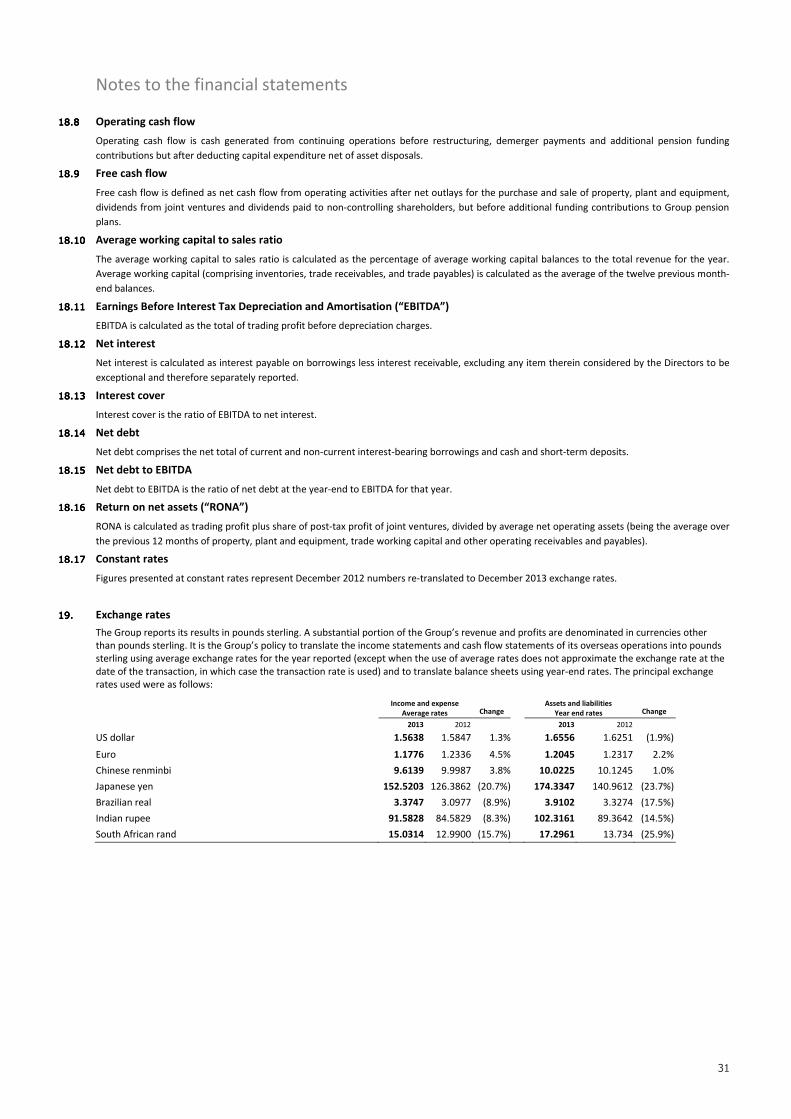
31
Notes to the financial statements
18.818.818.818.8 Operating cash flow
Operating cash flow is cash generated from continuing operations before restructuring, demerger payments and additional pension funding
contributions but after deducting capital expenditure net of asset disposals.
18.918.918.918.9 Free cash flow
Free cash flow is defined as net cash flow from operating activities after net outlays for the purchase and sale of property, plant and equipment,
dividends from joint ventures and dividends paid to non-controlling shareholders, but before additional funding contributions to Group pension
plans.
18.1018.1018.1018.10 Average working capital to sales ratio
The average working capital to sales ratio is calculated as the percentage of average working capital balances to the total revenue for the year.
Average working capital (comprising inventories, trade receivables, and trade payables) is calculated as the average of the twelve previous month-
end balances. 18.1118.1118.1118.11 Earnings Before Interest Tax Depreciation and Amortisation (“EBITDA”)
EBITDA is calculated as the total of trading profit before depreciation charges.
18.1218.1218.1218.12 Net interest
Net interest is calculated as interest payable on borrowings less interest receivable, excluding any item therein considered by the Directors to be
exceptional and therefore separately reported.
18.1318.1318.1318.13 Interest cover
Interest cover is the ratio of EBITDA to net interest.
18.1418.1418.1418.14 Net debt
Net debt comprises the net total of current and non-current interest-bearing borrowings and cash and short-term deposits.
18.1518.1518.1518.15 Net debt to EBITDA
Net debt to EBITDA is the ratio of net debt at the year-end to EBITDA for that year.
18.1618.1618.1618.16 Return on net assets (“RONA”)
RONA is calculated as trading profit plus share of post-tax profit of joint ventures, divided by average net operating assets (being the average over
the previous 12 months of property, plant and equipment, trade working capital and other operating receivables and payables).
18.1718.1718.1718.17 Constant rates
Figures presented at constant rates represent December 2012 numbers re-translated to December 2013 exchange rates.
19.19.19.19. Exchange rates
The Group reports its results in pounds sterling. A substantial portion of the Group’s revenue and profits are denominated in currencies other
than pounds sterling. It is the Group’s policy to translate the income statements and cash flow statements of its overseas operations into pounds
sterling using average exchange rates for the year reported (except when the use of average rates does not approximate the exchange rate at the
date of the transaction, in which case the transaction rate is used) and to translate balance sheets using year-end rates. The principal exchange
rates used were as follows:
Income and expense
Average rates
Assets and liabilities
Year end rates
Change Change
2013 2012 2013 2012
US dollar 1.5638 1.5847 1.3% 1.6556 1.6251 (1.9%)
Euro 1.1776 1.2336 4.5% 1.2045 1.2317 2.2%
Chinese renminbi 9.6139 9.9987 3.8% 10.0225 10.1245 1.0%
Japanese yen 152.5203 126.3862 (20.7%) 174.3347 140.9612 (23.7%)
Brazilian real 3.3747 3.0977 (8.9%) 3.9102 3.3274 (17.5%)
Indian rupee 91.5828 84.5829 (8.3%) 102.3161 89.3642 (14.5%)
South African rand 15.0314 12.9900 (15.7%) 17.2961 13.734 (25.9%)