Results for the Fiscal Year Ended March 2017¼ˆmanagement accounting basis, figures are rounded to...
55
Results for the Fiscal Year Ended March 2017 May 18, 2017
Transcript of Results for the Fiscal Year Ended March 2017¼ˆmanagement accounting basis, figures are rounded to...

Results for the Fiscal Year Ended March 2017
May 18, 2017
Copyright © 2017 JAPAN POST BANK CO., LTD. All Rights Reserved. 1

Copyright © 2017 JAPAN POST BANK CO., LTD. All Rights Reserved.
Table of Contents
2
1. Overview of FY2017/3 Results・ Overview of Business Results・ Development of BP and SP
2. FY2018/3 Earnings Forecast・ Changes in Net Ordinary Income (from FY2016/3 to FY2017/3)・ FY2018/3 Earnings Forecast / Dividend Policy
Appendix
Note: All figures regarding the business performance of JAPAN POST BANK Co., Ltd. (the “Bank”) are rounded down, unless otherwise noted.Accordingly, the total of each account may not be equal to the combined total of individual items.
3. Business Development for Future Growth・ Business Development・ Diversification and Sophistication of Investment Strategy・ Settlement Transaction Business
< Definition of terms>Base Portfolio (BP) : Portfolio aimed at ensuring stable income by investing mostly in Japanese government bonds while
managing interest rate and liquidity risks.
Satellite Portfolio (SP) : Portfolio aimed at accumulating profit, including capital gains from sales of bonds and other assets, primarily by taking credit and market risks through diversified investment in foreign and other assets.
Transfer Price (TP) : Transfer pricing was established for internal transactions using internal rates based on market interest rates.
Limited Partner (LP) : Fund investor leaving fund management to the GP.Japan Post Bank accumulates a wide range of expertise, through participation in fund investmentcommittees as an observer, as a step leading to investment in the GP.
General Partner (GP) : The principal fund manager responsible for selecting investments, making investment decisions and so on.Unlimited liability is assumed towards creditors, including the sum invested.

Copyright © 2017 JAPAN POST BANK CO., LTD. All Rights Reserved. 3
1.Overview of FY2017/3 Results
• Net income down 3.9% YoY, but 104.0% achievement rate to full-year forecast
• Endeavoured to diversify and sophisticate investment strategy, optimize certain unrealized gains (unrealized gains up ¥211.7bn YoY) and streamline expenses

Copyright © 2017 JAPAN POST BANK CO., LTD. All Rights Reserved.
Net unrealized gains (losses) on available-for-sale securities adjusted by gains (losses) on hedge transactions
¥4,398.1bn [ YoY +¥211.7bn ]
Capital adequacy ratio 22.22% [ YoY (4.16%pt) ]
Leverage ratio (pro forma basis) 4.11% [ YoY +0.00%pt ]
Overview of Business Results
4
Annual DPS ¥50 【Payout ratio 60%】☛ p 9
Net income ¥312.2bn※ [ YoY (3.9%) ]
Net ordinary income ¥442.0bn※ [ YoY (8.2%) ]
※Achievement rate to forecast 104.0%
※Achievement rate to forecast 105.2%
☛ p 15
☛ p 36
☛ p 17
Net interest income ¥1,223.5bn [ YoY (¥137.5bn) ]
Net fees and commissions ¥86.6bn [ YoY (¥4.5bn) ]
Net other operating income (loss) ¥100.0bn [ YoY +¥100.2bn ]
General and administrative expenses1 ¥1,056.1bn [ YoY (¥10.0bn) ]
Exchange and settlement transactions, ATM related commissions
¥66.4bn [ YoY (¥0.4bn) ]
Sales of asset management products, etc.1
¥20.1bn [ YoY (¥4.1bn) ]
Annual sales amount ¥544.3bn [ YoY + ¥117.3bn ]
Outstanding AUM ¥1,310.1bn [ YoY + ¥174.6bn ]
Number of accounts 749thou [ YoY + 53thou ]
1 Exclude non-recurring items
☛ p 31, 32
Investment trust sales-related results;☛ p 24
1 JGBs related commissions, investment trust related commissions,new businesses related commissions, other.
☛ p 30
Total Portfolio (BP + SP) (A) ¥197.5tn ¥433.0bn
Base Portfolio (BP)1 ¥131.5tn (¥243.3bn)
BP (Customer-based Funding, sales)
- (¥399.6bn)
BPInvestment Side, etc.
- ¥156.3bn
Satellite Portfolio (SP)1 ¥66.0tn ¥676.4bn
Net other ordinary income 2 (B) - ¥9.0bn
Total (A + B) - ¥442.0bn
☛ p 281 Includes net fees and commissions [BP:¥86.7bn, SP:(¥0.1bn)],
general and administrative expenses [BP:(¥1,048.0bn), SP:(¥5.9bn)].2 Recoveries of written-off loans, rent for land, buildings and others, etc. which are
unrecognized under management accounting basis .
<Average balance><Net gains (losses)>
(Domestic standards)

Copyright © 2017 JAPAN POST BANK CO., LTD. All Rights Reserved.
Portfolio Management Policy
Base Portfolio ¥129tn [ YoY (¥7tn) ](Liability-driven portfolio) (JGB balance decreased, reflecting
prolonged historically low interest rateenvironment)
Purpose: The foundation of our ALM
Funding: Stable liabilities (over 90% are retail, small-sized deposits)
Strategy: Manage interest rate/liquidity risk, secure fundamentalreturn mainly from JGBsMain source of profits – spread between long and short-term interest rates; aim for carry profitsProvide internal funding to the Satellite Portfolio
Development of BP and SP (1)(management accounting basis, figures are rounded to the nearest trillion)
Mar 31, 2017 Difference Mar 31, 2016
Short-term assets1 55 7 48
Bonds held to maturity-JGBs, Government
guaranteed bonds 38 (13) 52
Available for sale securities-JGBs, Government
guaranteed bonds 35 (1) 36
Loans 1 (0) 1
1. Short-term assets include cash and due from banks, call loans, receivables under securities borrowing transactions (excl. those in trust), T-bills, short-term corporate bonds, loans to thegovernment (special accounts), etc.
(¥tn)
Satellite Portfolio ¥70tn [ YoY +¥9tn ](Excess-return portfolio) (Further expansion of SP with focus on
foreign securities and new entry intoalternative areas)
Purpose: Pursue excess return
Funding: Mainly funding from the Base Portfolio(Transfer price based on market interest rates)
Strategy: Promote global asset allocation while assessing market and economic conditionsAim to achieve excess return including capital gainsCreate a “hedge position” by adding assets with negativecorrelation against domestic bonds
Mar 31, 2017 Difference Mar 31, 2016
Available-for-sale securities-Japanese local government
bonds-Corporate bonds, etc.1-Foreign securities1,3
[Investment trusts]
68
52[32]
117
[7]
67
45[26]
Bonds held to maturity-Japanese local government
bonds, etc.0 (0) 0
Money held in trust (Stocks), etc.2,3 3 0 2
Loans 1 (0) 1
Alternative assets 1 1 -
(¥tn)
1. Corporate bonds, etc., foreign securities include monetary claims bought.2. JGBs contained in money held in trust are included in the Base Portfolio.3. Assets related to alternative investment are included in “alternative assets”.
5

Copyright © 2017 JAPAN POST BANK CO., LTD. All Rights Reserved.
Development of BP and SP (2)
(Chart 3) SP Balance (Chart 4) US Credit Spread (Chart 5) Currency Hedging Cost(¥tn)
0.4%0.8%1.2%1.6%2.0%2.4%2.8%3.2%3.6%4.0%4.4%
13/3 13/9 14/3 14/9 15/3 15/9 16/3 16/9 17/3
5-year UST
BB rating
(Yr/Mth)
A rating
BBB rating
020406080
100120140160180200
13/3 13/9 14/3 14/9 15/3 15/9 16/3 16/9 17/3
(bp)
(Yr/Mth)
Basis(USD/JPY 3 Months)
Interest spread(3 Months
LIBOR)
Currency hedging cost(USD/JPY 3 Months)
01020304050607080
07 08/3 09/3 10/3 11/312/3 13/3 14/315/3 16/3 17/3(As of Oct 1) (Yr/Mth end)
¥4tn
¥48tn
¥62tn¥70tn
(Chart 1) Shares of BP and SP to Total Portfolio (Chart 2) Domestic Implied Forward Rates (December 31, 2014 vs December 31, 2016)
(Yr/Mth)
91 86 85 84 81 76 69 65
9 14 15 16 19 24 31 35
0%10%20%30%40%50%60%70%80%90%
100%
10/3末11/3末12/3末13/3末14/3末15/3末16/3末17/3末
SP
BP
Note: Percentages are rounded.
10/3 11/3 12/3 13/3 14/3 15/3 16/3 17/3 (0.4%)(0.3%)(0.2%)(0.1%)
0.0%0.1%0.2%0.3%0.4%0.5%0.6%0.7%0.8%
14/12 15/3 15/6 15/9 15/12 16/3 16/6 16/9 16/12 17/3 17/6 17/9 17/12 18/3
10-year IFR (Dec 31, 2014)
2-year rate (actual)
10-year rate (actual)
10-year IFR (Dec 31, 2016)2-year IFR (Dec 31, 2014)
2-year IFR (Dec 31, 2016)
(Yr/Mth end)
6
Note: Balance are rounded.

Copyright © 2017 JAPAN POST BANK CO., LTD. All Rights Reserved. 7
2. FY2018/3 Earnings Forecast
Assumptions for earnings forecastAssumptions of domestic and foreign market interest rates
are based on the implied forward rates as of December 31, 2016
Assumption of foreign exchange rate is approximately $1=¥114 for USD/JPY
• We forecast FY2018/3 net income up 12.0% YoY

Copyright © 2017 JAPAN POST BANK CO., LTD. All Rights Reserved. 8
Changes in Net Ordinary Income (from FY2016/3 to FY2017/3)
BP revenues declined considerably under the prolonged severe business environment and fees and commissions dropped mainly due to the cashback campaign of investment trust salesBut promoted further diversification and sophistication of investment strategy and enhanced cost-efficiencyAchieved a certain level of profit as initially forecasted with these initiatives and realization of some appraisal gains
:Positive factor
:Negative factor :Positive factor
:Negative factor
¥207.3bn
FY2016/3Net ordinary
income (result)¥481.9bn
Decrease in BP
revenues, etc.
Decrease in net fees &
commissions
¥4.5bn
Increase in SPrevenues
¥161.1bn
FY2017/3Net ordinary
income (result)¥442.0bn
¥10.8bn
Cost reduction
FY2018/3 Net ordinary
income (forecast)¥490.0bn
< FY2016/3→ FY2017/3>< FY2015/3→ FY2016/3>
FY2015/3 Net ordinary income (result)
¥569.4bn
¥193.3bn
Decrease in BP
revenues, etc.
Increase in net fees &
commissions
¥1.8bn
Increase in SP
revenues
¥51.6bn
Cost reduction¥52.2bn
FY2016/3 Net ordinary income (result)
¥481.9bn
Due to decrease in deposit insurance
premium rate¥48.3bn
Note: The above figures, showing the change in our net ordinary income have been broken down based on our management accounting process but are different from the results calculated from “Net Gains and Losses by Portfolio” on P28 due to the followings:1) Personnel expenses, non-personnel expenses, and taxes in “Net Gains and Losses by Portfolio” are allocated to BP and SP gains/losses, respectively, while personnel expenses and taxes in the above figures are fully factored into
“Decrease in BP revenues, etc.” and non-personnel expenses into “Cost reduction.”2) Fees and commissions in “Net Gains and Losses by Portfolio” are allocated to BP and SP gains/losses, respectively, while those in the above figures are factored into “Increase in net fees and commissions.”3) Increase/decrease in net other ordinary income, which are unrecognized under management accounting basis, are factored into “Decrease in BP revenues, etc.” in the above figures.
Copyright © 2017 JAPAN POST BANK CO., LTD. All Rights Reserved.
FY2018/3 Earnings Forecast / Dividend Policy
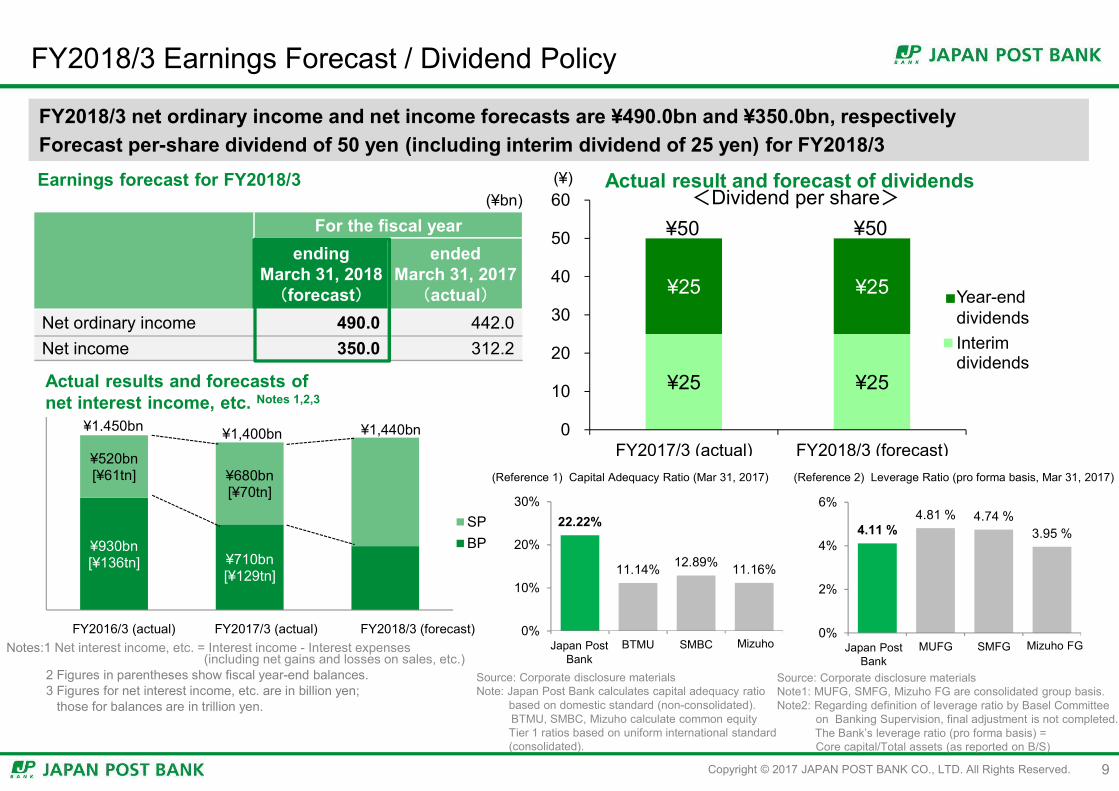
FY2018/3 net ordinary income and net income forecasts are ¥490.0bn and ¥350.0bn, respectivelyForecast per-share dividend of 50 yen (including interim dividend of 25 yen) for FY2018/3
For the fiscal yearending
March 31, 2018(forecast)
ended March 31, 2017(actual)
Net ordinary income 490.0 442.0Net income 350.0 312.2
Earnings forecast for FY2018/3(¥bn)
¥930bn[¥136tn] ¥710bn
[¥129tn]
¥520bn[¥61tn] ¥680bn
[¥70tn]
2016.3期(実績) 2017.3期(実績) 2018.3期(計画)
SPBP
¥1,450bn ¥1,400bn ¥1,440bn
Actual results and forecasts of net interest income, etc. Notes 1,2,3
Notes:1 Net interest income, etc. = Interest income - Interest expenses (including net gains and losses on sales, etc.)
2 Figures in parentheses show fiscal year-end balances. 3 Figures for net interest income, etc. are in billion yen;
those for balances are in trillion yen.
FY2016/3 (actual) FY2017/3 (actual) FY2018/3 (forecast)
(Reference 1) Capital Adequacy Ratio (Mar 31, 2017) (Reference 2) Leverage Ratio (pro forma basis, Mar 31, 2017)
Source: Corporate disclosure materials Note1: MUFG, SMFG, Mizuho FG are consolidated group basis.Note2: Regarding definition of leverage ratio by Basel Committee
on Banking Supervision, final adjustment is not completed.The Bank’s leverage ratio (pro forma basis) = Core capital/Total assets (as reported on B/S)
Source: Corporate disclosure materialsNote: Japan Post Bank calculates capital adequacy ratio
based on domestic standard (non-consolidated).BTMU, SMBC, Mizuho calculate common equity Tier 1 ratios based on uniform international standard(consolidated).
Actual result and forecast of dividends(¥)
¥25 ¥25
¥25 ¥25
0
10
20
30
40
50
60
FY2017/3 (actual) FY2018/3 (forecast)
AnnualdividendsInterimdividends
<Dividend per share>¥50 ¥50
■Year-end
22.22%
11.14% 12.89% 11.16%
0%
10%
20%
30%
ゆうちょ BTMU SMBC みずほ
4.11 %4.81 % 4.74 %
3.95 %
0%
2%
4%
6%
ゆうちょ MUFG SMFG みずほFGJapan Post Bank
Mizuho Mizuho FGJapan Post Bank
9
Copyright © 2017 JAPAN POST BANK CO., LTD. All Rights Reserved. 10
3. Business Development for Future GrowthKey initiatives for FY2018/3
Customer-oriented financial services・ Expanding sales of investment trust products・ Offering further settlement options, etc.・ Attracting customers with wider range of products and services
Funds flow to regional communities・ Expanding the cooperation with regional financial institutions through participations in regional
revitalization funds, etc.
Sophistication of investment management・ Promoting diversification focusing on foreign assets along with appropriate risk management ・ Upgrading operational framework for investments in new asset classes

Copyright © 2017 JAPAN POST BANK CO., LTD. All Rights Reserved.
Business Development
11
Customer-oriented financial services
“From savings to asset building”
Funds flow to regional
communities
Sophistication of investment
management
Traditional savings and asset building services (savings, variable annuities policies sales, mortgage loans (as intermediary), etc.)
Credit cards
Prepaid cards
overdraft services linked to ordinary deposit accounts*
Debit cards
+ +
Traditional asset management
Derivative trading(adjustment of interest, foreign
exchange and equity risk)+ CDS transactions*
Investment in alternative assets
Regional revitalization funds
Further enhancement of
corporate value
Promote use of investment trust accounts +
accumulation type investment trust accounts andaccumulation NISA accounts
* Waiting for regulatory approval (as of May 18, 2017)

Copyright © 2017 JAPAN POST BANK CO., LTD. All Rights Reserved.
16/9末 16/12末 17/3末
ヘッジファンド
不動産ファンド
プライベート・エクイティ
(地域活性化ファンドを含む)
Diversification and Sophistication of Investment Strategy
Start investing in alternative assets (private equity, real estate funds and hedge funds)
Contribute to revitalization of domestic regional economies by new investment methods (LP investments in funds, etc.) Promote human resource development focused on making GP investment contributions in the long term
12
<Alternative investment>
Foreign bondsListed stocks
Corporate bonds, etc.
Derivatives(Diversification and adjustment of risk)
Alternative assets
Regional revitalization funds
Sophistication and Diversification of investment strategy
(global asset allocation & diversification of risk profile )
Japanese government bonds, etc.
¥58.9bn ¥80.6bn ¥124.4bn
¥14.6bn
¥468.2bn
¥136.3bn
¥1.8bn
Total ¥607.3bn
16/9 16/12 17/3
Hedge funds
Real estate funds
Private equity(includes regional revitalization funds)
(Yr/Mth end)
Copyright © 2017 JAPAN POST BANK CO., LTD. All Rights Reserved.Copyright © 2017 JAPAN POST BANK CO., LTD. All Rights Reserved.
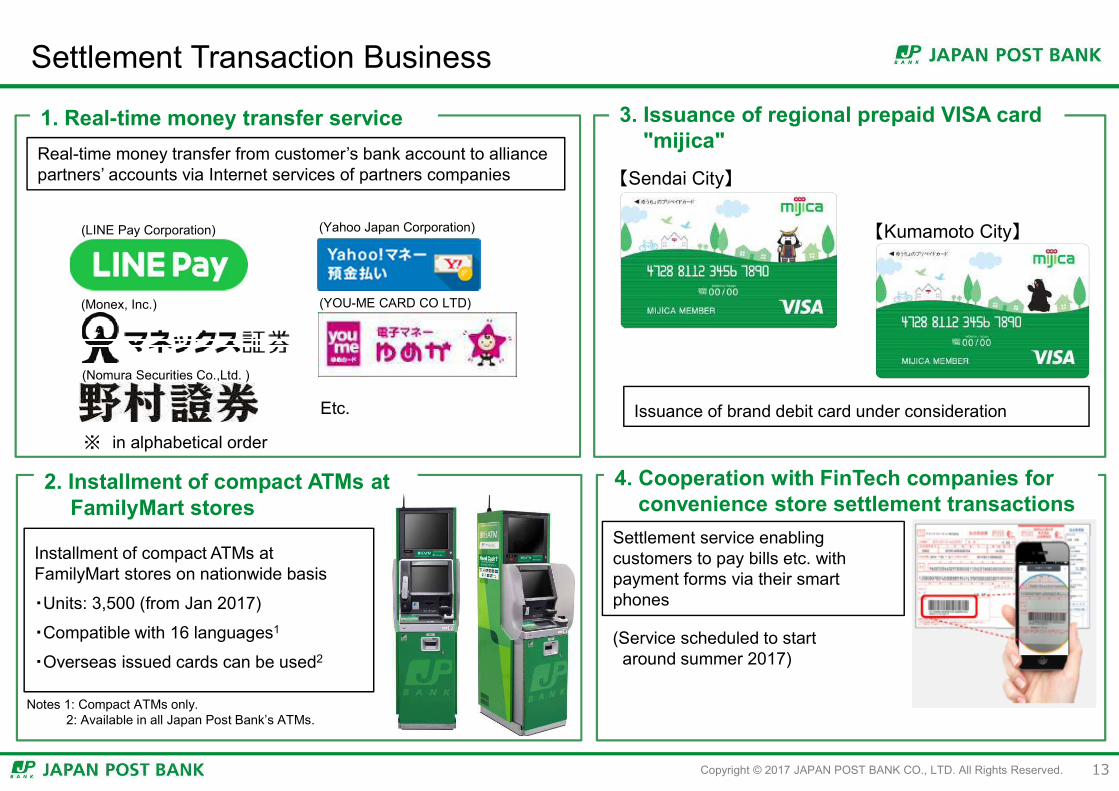
Settlement Transaction Business
Installment of compact ATMs at FamilyMart stores on nationwide basis
・Units: 3,500 (from Jan 2017)
・Compatible with 16 languages1
・Overseas issued cards can be used2
Real-time money transfer from customer’s bank account to alliance partners’ accounts via Internet services of partners companies 【Sendai City】
【Kumamoto City】
Issuance of brand debit card under considerationEtc.
1. Real-time money transfer service
4. Cooperation with FinTech companies forconvenience store settlement transactions
2. Installment of compact ATMs at FamilyMart stores
3. Issuance of regional prepaid VISA card"mijica"
Settlement service enabling customers to pay bills etc. with payment forms via their smart phones
※ in alphabetical order
(Service scheduled to start around summer 2017)
(Nomura Securities Co.,Ltd. )
(Monex, Inc.)
(LINE Pay Corporation) (Yahoo Japan Corporation)
(YOU-ME CARD CO LTD)
Notes 1: Compact ATMs only.2: Available in all Japan Post Bank’s ATMs.
13

Copyright © 2017 JAPAN POST BANK CO., LTD. All Rights Reserved.
Appendix
14
・ Overview of FY2017/3 Results・ Changes in Net Ordinary Income (from FY2015/3 to FY2018/3)・ Management Indicators ・ Summarized Balance Sheets・ Income Analysis・ Net Interest Income and Interest Rate Spread・ Average Balance, Interest, and Earnings Yield of
Interest-Earning Assets and Interest-Bearing Liabilities・ Asset Management Status・ Unrealized Gains (Losses) on Financial Assets・ Exposure Profile of Investment Assets・ Net Gains and Losses by Portfolio
・ Deposit Balance・ Fees and Commissions・ Overview of Asset Management Product Sales・ Selected Business Results ・ General and Administrative Expenses ・ Capital Adequacy Ratio・ Detailed Information on Capital Adequacy・ Progress under Medium-Term Business Plan・ Framework for Corporate Governance・ 7-year Review

Copyright © 2017 JAPAN POST BANK CO., LTD. All Rights Reserved. 15
Overview of FY2017/3 Results
Financial ConditionResults of Operations
For the fiscal year ended Increase(Decrease)
(A) – (B)March 31, 2017 (A)
March 31, 2016 (B)
Gross operating profit 1,410.2 1,452.0 (41.8)
Net interest income 1,223.5 1,361.0 (137.5)Net fees and commissions 86.6 91.1 (4.5)
Net other operating income (loss) 100.0 (0.1) 100.2
Gains (losses) on foreign exchanges 99.3 (1.4) 100.8 Gains (losses) on bonds (2.4) 1.8 (4.3)
General and administrative expenses (*) 1,056.1 1,066.1 (10.0)Provision for general reserve for possible loan losses (0.0) - (0.0)
Net operating profit 354.0 385.8 (31.7)Non-recurring gains (losses) 87.9 96.1 (8.1)
Gains (losses) on money held in trust 82.9 93.8 (10.9)
Net ordinary income 442.0 481.9 (39.9)
Net income 312.2 325.0 (12.8)
(¥bn)As of
March 31, 2017 (A)
As of March 31, 2016 (B)
Increase(Decrease)
(A) – (B)
Assets 209,568.8 207,056.0 2,512.7
Cash and due from banks 51,281.9 45,895.0 5,386.8
Call loans 470.0 978.8 (508.8)Receivables under securities borrowing transactions
8,718.9 7,923.2 795.6
Money held in trust 3,817.9 3,561.1 256.7
Securities 138,792.4 144,076.8 (5,284.3)
Loans 4,064.1 2,542.0 1,522.0
Liabilities 197,788.7 195,547.8 2,240.8
Deposits 179,434.6 177,871.9 1,562.6 Payables under securities lending transactions 13,694.2 13,123.5 570.7
Net assets 11,780.0 11,508.1 271.8
Total shareholders’ equity 8,729.6 8,605.2 124.3 Total valuation and translation adjustments 3,050.4 2,902.8 147.5
(¥bn)
* General and administrative expenses exclude non-recurring losses.

Copyright © 2017 JAPAN POST BANK CO., LTD. All Rights Reserved.
Changes in Net Ordinary Income (from FY2015/3 to FY2018/3)Amid a deeper-than-expected decline in BP revenues due to prolonged historically low interest rate environment, have expanded SP ahead of the medium-term plan by accelerating global asset allocation and investment sophisticationAnd continue to make company-wide efforts in boosting fee revenues and pursuing further cost reduction, in addition to the realization of FX gains on redemption of foreign bonds, seeking to meet medium-term targets
:Positive factor
:Negative factor
FY2015/3Net Ordinary
Income (result)¥569.4bn
Decrease inBP revenues,
etc.
Approx.¥578.0bn
Increase innet fees &
commissions Approx.¥7.0bn
FY2018/3Net Ordinary
Income (forecast)¥490.0bn
Increase inSP
revenuesApprox.¥64.0bn
Costreduction
Approx.¥436.0bn
< FY2015/3→ FY2018/3>
* As of the time our medium-term management plan was contemplated.
Decrease inBP revenues,
etc.
Around ¥400.0bn
Increase innet fees &
commissionsApprox.¥10.0bn
FY2018/3Net Ordinary
Income (planned)Approx.¥480.0bnIncrease in
SPrevenues
Approx.¥50.0bn
Costreduction
Around¥300.0bn
:Positive factor
:Negative factor
FY2015/3Net Ordinary
Income (estimate)*¥540.0bn
< Medium-term Management Plan>
16
Copyright © 2017 JAPAN POST BANK CO., LTD. All Rights Reserved. 17
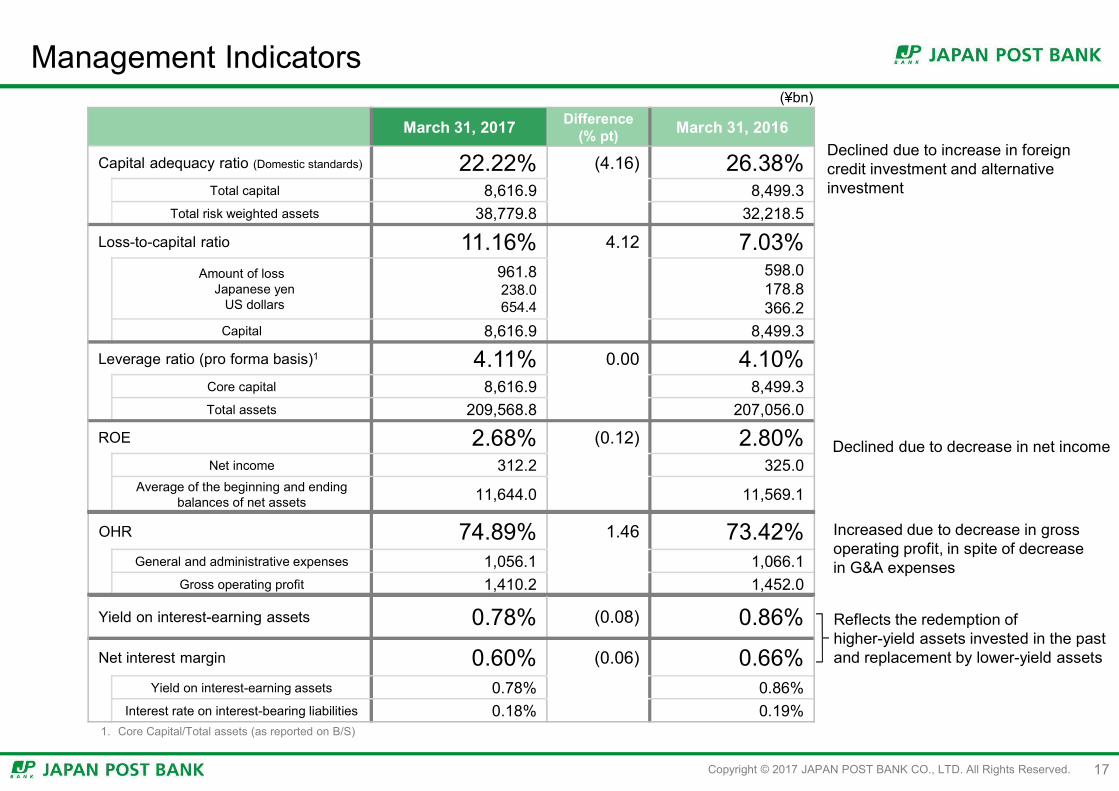
Management Indicators
March 31, 2017 Difference (% pt) March 31, 2016
Capital adequacy ratio (Domestic standards) 22.22% (4.16) 26.38%Total capital 8,616.9 8,499.3
Total risk weighted assets 38,779.8 32,218.5
Loss-to-capital ratio 11.16% 4.12 7.03%Amount of loss
Japanese yenUS dollars
961.8238.0654.4
598.0178.8366.2
Capital 8,616.9 8,499.3
Leverage ratio (pro forma basis)1 4.11% 0.00 4.10%Core capital 8,616.9 8,499.3Total assets 209,568.8 207,056.0
ROE 2.68% (0.12) 2.80%Net income 312.2 325.0
Average of the beginning and ending balances of net assets 11,644.0 11,569.1
OHR 74.89% 1.46 73.42%General and administrative expenses 1,056.1 1,066.1
Gross operating profit 1,410.2 1,452.0
Yield on interest-earning assets 0.78% (0.08) 0.86%Net interest margin 0.60% (0.06) 0.66%
Yield on interest-earning assets 0.78% 0.86%Interest rate on interest-bearing liabilities 0.18% 0.19%
(¥bn)
1. Core Capital/Total assets (as reported on B/S)
Declined due to increase in foreigncredit investment and alternativeinvestment
Declined due to decrease in net income
Increased due to decrease in gross operating profit, in spite of decrease in G&A expenses
Reflects the redemption ofhigher-yield assets invested in the past and replacement by lower-yield assets

Copyright © 2017 JAPAN POST BANK CO., LTD. All Rights Reserved. 18
Summarized Balance Sheets
As of March 31, 2017 (A)
As of March 31, 2016 (B)
Increase(Decrease)
(A) – (B)Total assets 209,568,820 207,056,039 2,512,781
Cash and due from banks 51,281,921 45,895,068 5,386,853
Call loans 470,000 978,837 (508,837)Receivables under securities borrowing transactions 8,718,905 7,923,229 795,676
Monetary claims bought 252,214 178,509 73,705
Trading account securities 9 187 (178)
Money held in trust 3,817,908 3,561,110 256,797
Securities 138,792,448 144,076,834 (5,284,385)
Loans 4,064,120 2,542,049 1,522,070
Foreign exchanges 78,646 25,328 53,318
Other assets 1,871,733 1,573,316 298,416
Tangible fixed assets 175,825 182,733 (6,907)
Intangible fixed assets 46,183 44,865 1,318 Customers’ liabilities for acceptances and guarantees - 75,000 (75,000)Reserve for possible loan losses (1,096) (1,030) (65)
(Millions of yen)As of March 31,
2017 (A)As of March 31,
2016 (B)Increase
(Decrease)(A) – (B)
Total liabilities and net assets 209,568,820 207,056,039 2,512,781
Total liabilities 197,788,782 195,547,888 2,240,893
Deposits 179,434,686 177,871,986 1,562,699
Call money 45,436 22,536 22,900 Payables under repurchase agreements 960,937 554,522 406,415 Payables under securities lending transactions 13,694,294 13,123,558 570,736
Commercial paper 40,324 - 40,324
Foreign exchanges 407 338 68
Other liabilities 2,185,197 2,532,920 (347,723)
Reserve for bonuses 6,007 6,020 (12)Reserve for employees’ retirement benefits 148,800 149,720 (919)Reserve for managementboard benefit trust 43 - 43 Reserve for reimbursement of deposits 2,096 - 2,096
Deferred tax liabilities 1,270,550 1,211,286 59,264 Acceptances and guarantees - 75,000 (75,000)
Total net assets 11,780,037 11,508,150 271,887
Capital stock 3,500,000 3,500,000 -
Capital surplus 4,296,285 4,296,285 -
Retained earnings 2,233,759 2,108,969 124,790
Treasury stock (1,300,411) (1,299,999) (411)
Total shareholders’ equity 8,729,634 8,605,256 124,378 Net unrealized gains (losses) on available-for-sale securities 3,166,980 3,322,827 (155,846)Net deferred gains (losses) on hedges (116,577) (419,932) 303,355 Total valuation and translation adjustments 3,050,403 2,902,894 147,508

Copyright © 2017 JAPAN POST BANK CO., LTD. All Rights Reserved. 19
Income Analysis
For the fiscal year ended(A) – (B)March 31,
2017 (A)March 31, 2016 (B)
Gross operating profit 1,410,256 1,452,082 (41,825)
Net interest income 1,223,546 1,361,065 (137,519)
Net fees and commissions 86,619 91,139 (4,520)Net other operating income (loss) 100,091 (122) 100,213
Gains (losses) on foreign exchanges 99,395 (1,471) 100,867
Gains (losses) on bonds (2,454) 1,846 (4,300)General and administrative expenses (1,056,168) (1,066,184) 10,015
Personnel expenses (125,328) (125,423) 95
Non-personnel expenses (854,369) (865,169) 10,800
Taxes and dues (76,470) (75,591) (879)
Operating profit (before provision for general reserve for possible loan losses)
354,087 385,897 (31,810)
Provision for general reserve for possible loan losses 10 - 10
Net operating profit 354,098 385,897 (31,799)
Non-recurring gains (losses) 87,987 96,100 (8,112)Gains (losses) related to stocks 88 3,232 (3,143)Gains (losses) on money held in trust 82,930 93,867 (10,937)
Net ordinary income 442,085 481,998 (39,912)
For the fiscal year ended(A) – (B)March 31,
2017 (A)March 31, 2016 (B)
Extraordinary income (loss) (1,488) (1,109) (379)Gains (losses) on sales and disposals of fixed assets (529) (1,103) 573 Losses on impairment of fixed assets (958) (5) (953)
Income before income taxes 440,596 480,888 (40,292)
Income taxes – current (133,287) (152,528) 19,241
Income taxes – deferred 4,954 (3,291) 8,245
Total income taxes (128,332) (155,819) 27,486
Net income 312,264 325,069 (12,805)
Gains (losses) on money held in trust 82,930 93,867 (10,937)
Dividends and interest income 51,556 54,137 (2,581)Gains (losses) on sales of stocks 41,608 47,700 (6,091)
Impairment losses (3,734) (1,588) (2,146)
Withholding income tax, etc. (6,499) (6,382) (117)
Credit-related expenses 0 18 (18)
Provision for general reserve for possible loan losses 0 18 (18)
Write-off of loans - - -
Provision for specific reserve for possible loan losses - - -
Recoveries of written-off loans - - -
(Millions of yen)
Notes: 1. General and administrative expenses exclude non-recurring losses related to retirement benefit costs (¥2,115 million and ¥2,179 million recorded as profits forthe fiscal years ended March 31, 2017 and 2016, respectively).
2. Credit-related expenses are those expenses related to problem assets disclosed under the Financial Reconstruction Act.3. Numbers in parenthesis indicate the amount of loss, expense or decrease.

Copyright © 2017 JAPAN POST BANK CO., LTD. All Rights Reserved. 20
Net Interest Income and Interest Rate Spread
Net interest income was ¥1,223.5bn and interest rate spread was 0.60% for the fiscal year ended March 31,2017
Source: JGB interest rate information (as of the fiscal year-ends) – Ministry of Finance Japan
For the fiscal year ended Increase(Decrease)
(A) – (B)March 31, 2017 (A)
March 31, 2016 (B)
Net interest income 804.0 970.5 (166.5)
Interest income 1,046.5 1,248.6 (202.0)Interest income on Japanese government bonds 793.3 966.6 (173.3)
Interest expenses 242.5 278.0 (35.5)
For the fiscal year ended Increase(Decrease)
(A) – (B)March 31, 2017 (A)
March 31, 2016 (B)
Net interest income 419.5 390.4 29.0
Interest income 596.6 545.9 50.6 Interest income on foreign securities 595.3 541.0 54.3
Interest expenses 177.1 155.5 21.6
For the fiscal year ended Increase(Decrease)
(A) – (B)March 31, 2017 (A)
March 31, 2016 (B)
Net interest income 1,223.5 1,361.0 (137.5)
Interest income 1,567.5 1,731.2 (163.7)
Interest expenses 343.9 370.1 (26.1)
Domestic
Overseas
Total
(¥bn)
(¥bn)
(¥bn)
Notes: 1. “Domestic” represents yen-denominated transactions while “overseas” represents foreign currency-denominated transactions (except that yen-denominated transactions with non-residents of Japan are included in “overseas”).
2. For a part of interest income and expenses, transactions between “domestic” and “overseas” are offset to calculate totals. As a result, the total of each account may not be equal to the combined total of “domestic” and “overseas” of each item.
1,532.11,470.2
1,540.7
1,361.0
1,223.5
0.82%0.73% 0.76%
0.66%0.60%
0.07%
△ 200
0
200
400
600
800
1,000
1,200
1,400
1,600
1,800
(0.2)%
0.0%
0.2%
0.4%
0.6%
0.8%
1.0%
1.2%
1.4%
1.6%
1.8%
FY2013/3 FY2014/3 FY2015/3 FY2016/3 FY2017/3
Interest rate spread
Domestic
Overseas
(Fiscal year)
(¥bn)
10-year JGB yield
Net interest income(right-hand scale)
(0.2%)

Copyright © 2017 JAPAN POST BANK CO., LTD. All Rights Reserved. 21
For the fiscal year ended Increase(Decrease)
(A) – (B)March 31, 2017 (A) March 31, 2016 (B)Average balance Interest Earnings yield Average
balance Interest Earnings yield Earnings yield
Interest-earning assets 193,991,919 1,046,541 0.53% 192,120,047 1,248,620 0.64% (0.11)%
Loans 3,081,133 17,741 0.57 2,681,909 25,091 0.93 (0.35)
Securities 92,901,349 926,690 0.99 109,010,368 1,116,543 1.02 (0.02)Receivables under securities borrowing transactions 8,318,619 1,471 0.01 8,586,952 7,958 0.09 (0.07)
Due from banks, etc. 47,723,014 24,916 0.05 39,310,383 35,624 0.09 (0.03)
Interest-bearing liabilities 184,991,156 242,503 0.13 184,078,165 278,032 0.15 (0.01)
Deposits 179,251,855 200,373 0.11 177,868,069 232,795 0.13 (0.01)Payables under securities lending transactions 8,385,284 844 0.01 8,650,599 7,337 0.08 (0.07)
For the fiscal year ended Increase(Decrease)
(A) – (B)March 31, 2017 (A) March 31, 2016 (B)Average balance Interest Earnings yield Average
balance Interest Earnings yield Earnings yield
Interest-earning assets 48,252,687 596,691 1.23% 40,910,445 545,998 1.33% (0.09)%
Loans 2,151 7 0.35 2,614 11 0.43 (0.08)
Securities 48,099,311 595,384 1.23 40,072,765 541,079 1.35 (0.11)Receivables under securities borrowing transactions - - - - - - -
Due from banks, etc. 81,553 968 1.18 777,583 4,704 0.60 0.58
Interest-bearing liabilities 47,375,519 177,183 0.37 38,370,177 155,520 0.40 (0.03)
Deposits - - - - - - -
Payables under securities lending transactions 4,674,255 40,697 0.87 5,500,853 25,895 0.47 0.39
(1) Domestic
(2) Overseas
(Millions of yen, %)
(Millions of yen, %)
Average Balance, Interest, and Earnings Yield of Interest-Earning Assets and Interest-Bearing Liabilities (1)

Copyright © 2017 JAPAN POST BANK CO., LTD. All Rights Reserved. 22
Notes: 1. “Domestic” represents yen-denominated transactions while “overseas” represents foreign currency-denominated transactions (except that yen-denominated transactions with non-residents of Japan are included in “overseas”).
2. Income and expenses for money held in trust are included in “other ordinary income” and “other ordinary expenses,” respectively. Accordingly, the average balance of money held in trust (fiscal year ended March 31, 2017, ¥2,646,250 million; fiscal year ended March 31, 2016, ¥2,450,837 million) is excluded from interest-earning assets, and the average balance corresponding to money held in trust (fiscal year ended March 31, 2017, ¥2,646,250 million; fiscal year ended March 31, 2016, ¥2,450,837 million) and the corresponding interest (fiscal year ended March 31, 2017, ¥4,779 million; fiscal year ended March 31, 2016, ¥4,776 million) are excluded from interest-bearing liabilities.
3. For investment trusts, the distribution of profits, which was deducted from the book value as the repayment of principal, was ¥900 million for the fiscal year ended March 31, 2017 (¥61,984 million for the fiscal year ended March 31, 2016).
4. Average balance and interest on transactions between “domestic” and “overseas” are offset to calculate totals.5. “Due from banks, etc.” consists of negotiable certificates of deposit, Bank of Japan deposits, call loans and monetary claims bought.
For the fiscal year ended Increase(Decrease)
(A) – (B)March 31, 2017 (A) March 31, 2016 (B)Average balance Interest Earnings yield Average
balance Interest Earnings yield Earnings yield
Interest-earning assets 200,321,045 1,567,512 0.78% 200,500,267 1,731,217 0.86% (0.08)%Loans 3,083,285 17,748 0.57 2,684,524 25,103 0.93 (0.35)Securities 141,000,661 1,522,075 1.07 149,083,133 1,657,623 1.11 (0.03)Receivables under securities borrowing transactions 8,318,619 1,471 0.01 8,586,952 7,958 0.09 (0.07)
Due from banks, etc. 47,804,568 25,885 0.05 40,087,966 40,329 0.10 (0.04)Interest-bearing liabilities 190,443,114 343,966 0.18 189,918,117 370,151 0.19 (0.01)
Deposits 179,251,855 200,373 0.11 177,868,069 232,795 0.13 (0.01)Payables under securities lending transactions 13,059,539 41,542 0.31 14,151,453 33,233 0.23 0.08
(3) Total (Millions of yen, %)
Average Balance, Interest, and Earnings Yield of Interest-Earning Assets and Interest-Bearing Liabilities (2)
Interest Rate SpreadFor the fiscal year ended Increase
(Decrease)(A) – (B)March 31, 2017 (A) March 31, 2016 (B)
Yield on interest-earning assets (a) 0.78% 0.86% (0.08)%Total cost of funding (including general and administrative expenses) (b) 0.73 0.75 (0.02)
Interest rate on interest-bearing liabilities (c) 0.18 0.19 (0.01)
Overall interest rate spread (a) - (b) 0.04 0.10 (0.05)Interest rate spread (a) - (c) 0.60 0.66 (0.06)
(%)

Copyright © 2017 JAPAN POST BANK CO., LTD. All Rights Reserved. 23
Asset Management Status (1)
(¥bn)
Included in investment assets as of March 31, 2017, JGBs were ¥68.8tn and foreign securities, etc. were ¥52.9tn
CategoriesAs of
March 31, 2017 (A)
%As of
March 31, 2016 (B)
%Increase
(Decrease)(A) – (B)
Securities 138,792.4 66.9 144,076.8 70.3 (5,284.3)Japanese government bonds 68,804.9 33.2 82,255.6 40.1 (13,450.6)Japanese local government bonds, corporate bonds, etc. (*)
17,070.4 8.2 16,425.6 8.0 644.8
Foreign securities, etc. 52,917.0 25.5 45,395.5 22.1 7,521.4
Foreign bonds 20,143.4 9.7 19,829.5 9.6 313.9
Investment trusts 32,726.7 15.7 25,520.9 12.4 7,205.7 Money held in trust(stocks, JGBs, etc.) 3,817.9 1.8 3,561.1 1.7 256.7
Domestic stocks 2,079.2 1.0 1,878.6 0.9 200.6
Loans 4,064.1 1.9 2,542.0 1.2 1,522.0
Due from banks, etc. (**) 51,213.3 24.7 45,769.1 22.3 5,444.2 Short-term investments and others (***) 9,305.6 4.4 8,927.5 4.3 378.0
Total 207,193.4 100.0 204,876.6 100.0 2,316.8
* “Japanese local government bonds, corporate bonds, etc.” consists of Japanese local government bonds, commercial paper, Japanese corporate bonds and Japanese stocks.
** “Due from banks, etc.” consists of negotiable certificates of deposit, Bank of Japan deposits and monetary claims bought.
*** “Short-term investments and others” consists of call loans and receivables under securities borrowing transactions, etc.
JGBs¥68.8 tn33.2%
Japanese local government bonds, corporate bonds, etc.¥17.0 tn8.2%
Foreign securities, etc.¥52.9 tn25.5%
Money held in trust(stocks, JGBs, etc.)¥3.8 tn1.8%
Loans¥4.0 tn1.9%
Due from banks, etc.¥51.2 tn24.7% Total
¥207.1 tn
Short-term investments and others¥9.3 tn4.4%

Copyright © 2017 JAPAN POST BANK CO., LTD. All Rights Reserved. 24
Asset Management Status (2)
As of March 31, 2017 As of March 31, 2016Amount on thebalance sheet
Net unrealizedgains (losses)
Amount on thebalance sheet
Net unrealizedgains (losses)
Held-to-maturity securities 38,316.9 1,456.5 52,052.5 2,208.3
As of March 31, 2017 As of March 31, 2016Amount on thebalance sheet /
Notional amount
Net unrealizedgains (losses) /
Net deferred gains (losses)
Amount on thebalance sheet /
Notional amount
Net unrealizedgains (losses) /
Net deferred gains (losses)Available-for-sale 104,470.1 4,566.1 95,847.5 4,791.7
Securities (*)(A) 100,666.9 3,282.1 92,286.3 3,872.4Japanese government bonds 33,487.5 1,320.7 34,358.2 1,744.7
Foreign bonds 20,078.5 1,335.1 19,732.7 1,967.8Investment trusts 32,604.2 435.0 25,520.9 (128.0)Others 14,496.5 191.1 12,674.4 287.9
Effect of fair value hedge accounting (B) 185.3 35.3
Money held in trust (*)(C) 3,803.2 1,098.6 3,561.1 883.8Domestic stocks 2,079.2 1,058.6 1,878.6 829.8Others 1,723.9 40.0 1,682.4 54.0
Derivatives for which deferredhedge accounting is applied (D) 7,553.3 (168.0) 7,719.8 (605.3)
Total (A) + (B) + (C) + (D) 4,398.1 4,186.4
(¥bn)
Net unrealized gains on available-for-sale securities adjusted by gains (losses) on hedge transactions were ¥4,398.1bn as of March 31, 2017 (before application of tax effect accounting)
(¥bn)
* Excluding available-for-sale securities that are deemed to be extremely difficult to determine a fair value.

Copyright © 2017 JAPAN POST BANK CO., LTD. All Rights Reserved. 25
Unrealized Gains (Losses) on Financial Assets (1)
As of March 31, 2017 (A) As of March 31, 2016 (B) Increase (Decrease) (A) – (B)Amount on thebalance sheet
Net unrealized gains (losses)
Amount on thebalance sheet
Net unrealized gains (losses)
Amount on thebalance sheet
Net unrealized gains (losses)
Japanese government bonds 35,317,430 1,373,826 47,897,398 2,063,032 (12,579,968) (689,205)
Japanese local government bonds 44,618 115 341,147 3,954 (296,528) (3,839)
Japanese corporate bonds 2,889,963 70,626 3,717,263 110,702 (827,299) (40,076)
Others 64,911 11,981 96,744 30,670 (31,833) (18,688)
Foreign bonds 64,911 11,981 96,744 30,670 (31,833) (18,688)
Total 38,316,923 1,456,549 52,052,553 2,208,359 (13,735,630) (751,810)
(1) Held-to-maturity Securities
Note: Net unrealized gains (losses) shown above are calculated by deducting the amount on the balance sheet from the fair value.
(Millions of yen)
(2) Available-for-sale Securities (Excluding Available-for-sale Securities that are Deemed to be Extremely Difficult to Determine a Fair Value)
As of March 31, 2017 (A) As of March 31, 2016 (B) Increase (Decrease) (A) – (B)Amount on thebalance sheet
Net unrealized gains (losses)
Amount on thebalance sheet
Net unrealized gains (losses)
Amount on thebalance sheet
Net unrealized gains (losses)
Bonds 47,622,031 1,518,522 46,724,064 2,037,834 897,966 (519,312)
Japanese government bonds 33,487,558 1,320,778 34,358,255 1,744,753 (870,697) (423,974)
Japanese local government bonds 6,037,606 90,906 5,515,361 125,743 522,245 (34,837)
Commercial paper 233,998 - 204,995 - 29,002 -
Japanese corporate bonds 7,862,867 106,837 6,645,451 167,337 1,217,416 (60,500)
Others 53,044,897 1,763,647 45,562,334 1,834,648 7,482,562 (71,001)
Foreign bonds 20,078,556 1,335,157 19,732,759 1,967,868 345,797 (632,710)
Investment trusts 32,604,245 435,050 25,520,966 (128,070) 7,083,278 563,120
Total 100,666,928 3,282,169 92,286,398 3,872,483 8,380,529 (590,313)
(Millions of yen)
Notes: 1. Securities shown above include “securities,” negotiable certificates of deposit, which is recorded under “cash and due from banks,” and “monetary claims bought.” 2. Net unrealized gains (losses) shown above are calculated by deducting the acquisition cost from the amount on the balance sheet (fair value).3. Of net unrealized gains (losses) shown above, ¥185,342 million and ¥35,341 million losses were included in the statements of income for the fiscal years ended March 31, 2017
and 2016, respectively, because of the application of fair value hedge accounting.4. Investment trusts are mainly invested in foreign bonds.5. No impairment losses were recognized on available-for-sale securities for the fiscal years ended March 31, 2017 and 2016.

Copyright © 2017 JAPAN POST BANK CO., LTD. All Rights Reserved. 26
Unrealized Gains (Losses) on Financial Assets (2)(3) Money Held in Trust Classified as Available-for-sale (Excluding Money Held in Trust Classified as Available-for-sale that is Deemed to be Extremely Difficult to
Determine a Fair Value)As of March 31, 2017 (A) As of March 31, 2016 (B) Increase (Decrease) (A) – (B)
Amount on thebalance sheet
Net unrealized gains (losses)
Amount on thebalance sheet
Net unrealized gains (losses)
Amount on thebalance sheet
Net unrealized gains (losses)
Money held in trust classified as available-for-sale 3,803,267 1,098,661 3,561,110 883,889 242,156 214,772
Domestic stocks 2,079,290 1,058,661 1,878,626 829,857 200,664 228,804
Foreign stocks 0 (0) 0 (0) (0) (0)
Domestic bonds 1,274,178 40,000 1,293,411 54,032 (19,232) (14,031)
Notes: 1. The amount on the balance sheet shown above is stated at the average market price of the final month for the fiscal year for equity securities and at the market price at the balance sheet date for other securities.
2. Net unrealized gains (losses) shown above are calculated by deducting the acquisition cost from the amount on the balance sheet (fair value).3. Impairment losses on money held in trust which is classified as available-for-sale for the fiscal years ended March 31, 2017 and 2016 amounted to ¥3,734 million and ¥1,588
million, respectively.
(Millions of yen)
Notes: 1. Net deferred gains (losses) are those before application of tax effect accounting.2. Hedged instruments are available-for-sale securities.
As of March 31, 2017 (A) As of March 31, 2016 (B) Increase (Decrease) (A) – (B)
Notional amount Net deferred gains (losses) Notional amount Net deferred
gains (losses) Notional amount Net deferred gains (losses)
Interest rate swaps 4,498,510 (195,410) 3,987,422 (409,837) 511,088 214,427
Currency swaps 2,971,988 37,723 3,651,466 (182,201) (679,478) 219,924
Foreign exchange forward contracts 82,803 (10,351) 80,937 (13,267) 1,866 2,915
Total 7,553,302 (168,039) 7,719,826 (605,306) (166,523) 437,267
(4) Derivatives under Hedge Accounting (Deferred Hedge Accounting)
As of March 31, 2017 (A) As of March 31, 2016 (B) Increase (Decrease) (A) – (B)
Total net unrealized gains (losses) 4,398,134 4,186,407 211,727
Total (2) + (3) + (4)
Note: Total net unrealized gains (losses) exclude gains (losses) which are included in the statements of income because of the application of fair value hedge accounting.
(Millions of yen)
(Millions of yen)

Copyright © 2017 JAPAN POST BANK CO., LTD. All Rights Reserved.
Exposure Profile of Investment Assets
Breakdown of the Bank’s investment assets, By credit rating: 90% are rated A or above, and over 95% are rated IG (BBB or above)By sector: around 72% are Sovereign, and around 12% are Financials By region: around 75% are Japan, and around 12% are North America
<Exposures Classified by Ratings>BBB
6.02% BB, B and below3.57%
Financials rated “BBB”1.25%
Natural Resources and Energy rated “BBB”
0.45% Financials rated “BB, B and below” 0.13%Natural Resources
and Energy rated “BB, B and below”
0.17%
Financials rated “A and above” 11.25%
Natural Resources and Energy rated “A and above”
0.76%
<Exposures Classified by Sector>
<Exposures Classified by Region>
Notes: 1. The range of assets covered in this page includes bonds and/or loans to sovereign entities, financial institutions and industrial corporations, and stocks, etc.
2. Exposures are calculated on the management accounting and book value basis.3. Rating categories are based on the Bank’s internal ratings.
Mar 31, 2017¥194tn 1
A and above90.39%
Note: “Sovereign” includes exposures to national and/or local governments and central banks, etc.
Sovereign72.47%
Financials12.65%
Natural Resources and Energy
1.39%Others13.47%
Japan75.36%
North America12.10%
Europe8.37%
Asia1.39%
Oceania1.38%
Latin-America0.66%
Middle-Eastern0.57%
Africa0.04%
International Organization
0.09%
27
Copyright © 2017 JAPAN POST BANK CO., LTD. All Rights Reserved.
Net Gains and Losses by Portfolio
28
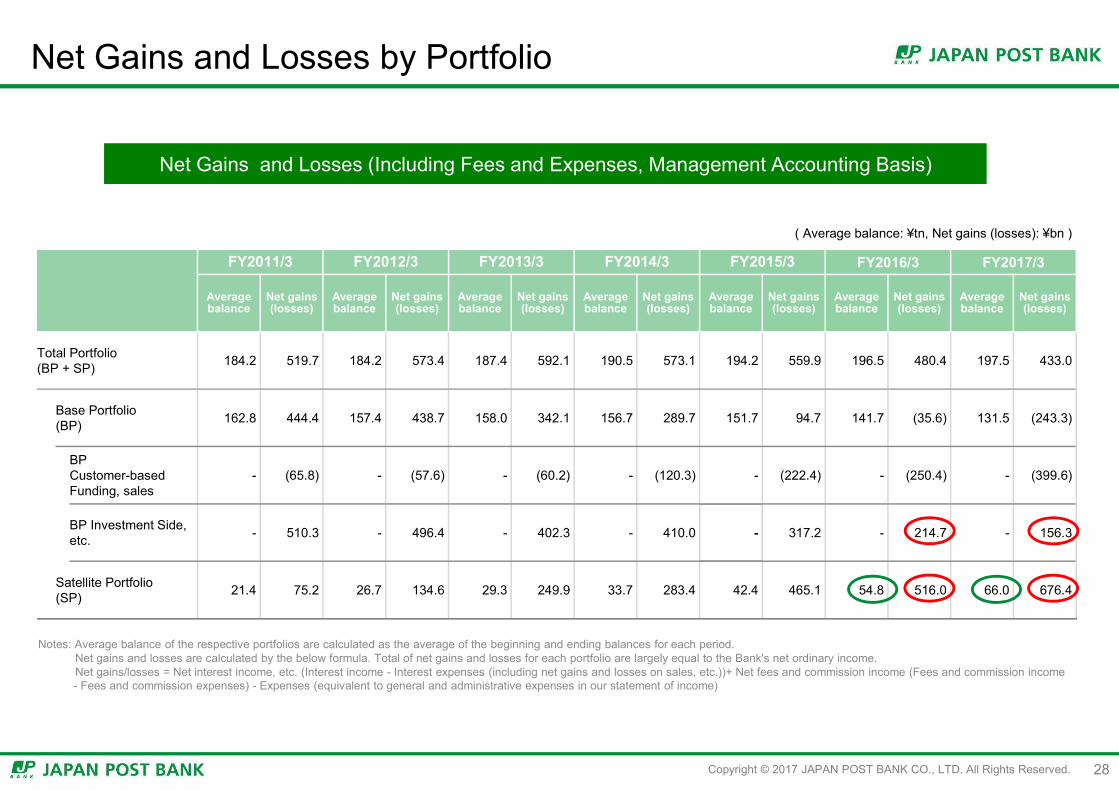
Net Gains and Losses (Including Fees and Expenses, Management Accounting Basis)
( Average balance: ¥tn, Net gains (losses): ¥bn )
Notes: Average balance of the respective portfolios are calculated as the average of the beginning and ending balances for each period.Net gains and losses are calculated by the below formula. Total of net gains and losses for each portfolio are largely equal to the Bank's net ordinary income.Net gains/losses = Net interest income, etc. (Interest income - Interest expenses (including net gains and losses on sales, etc.))+ Net fees and commission income (Fees and commission income- Fees and commission expenses) - Expenses (equivalent to general and administrative expenses in our statement of income)
FY2011/3 FY2012/3 FY2013/3 FY2014/3 FY2015/3 FY2016/3 FY2017/3
Average balance
Net gains (losses)
Average balance
Net gains (losses)
Average balance
Net gains (losses)
Average balance
Net gains (losses)
Average balance
Net gains (losses)
Average balance
Net gains (losses)
Average balance
Net gains (losses)
Total Portfolio(BP + SP) 184.2 5,197 184.2 5,734 187.4 5,921 190.5 5,731 194.2 5,599 196.5 4,804
Base Portfolio(BP) 162.8 4,444 157.4 4,387 158.0 3,421 156.7 2,897 151.7 947 141.7 △356
BP Customer-based Funding, sales
- △658 - △576 - △602 - △1,203 - △2,224 - △2,504 -
BP Investment Side, etc. - 5,103 - 4,964 - 4,023 - 4,100 - 3,172 - 2,147 -
Satellite Portfolio(SP) 21.4 752 26.7 1,346 29.3 2,499 33.7 2,834 42.4 4,651 54.8 5,160
FY2011/3 FY2012/3 FY2013/3 FY2014/3 FY2015/3 FY2016/3 FY2017/3
Average balance
Net gains (losses)
Average balance
Net gains (losses)
Average balance
Net gains (losses)
Average balance
Net gains (losses)
Average balance
Net gains (losses)
Average balance
Net gains (losses)
Average balance
Net gains (losses)
Total Portfolio(BP + SP) 184.2 519.7 184.2 573.4 187.4 592.1 190.5 573.1 194.2 559.9 196.5 480.4 197.5 433.0
Base Portfolio(BP) 162.8 444.4 157.4 438.7 158.0 342.1 156.7 289.7 151.7 94.7 141.7 (35.6) 131.5 (243.3)
BP Customer-based Funding, sales
- (65.8) - (57.6) - (60.2) - (120.3) - (222.4) - (250.4) - (399.6)
BP Investment Side, etc. - 510.3 - 496.4 - 402.3 - 410.0 - 317.2 - 214.7 - 156.3
Satellite Portfolio(SP) 21.4 75.2 26.7 134.6 29.3 249.9 33.7 283.4 42.4 465.1 54.8 516.0 66.0 676.4
Copyright © 2017 JAPAN POST BANK CO., LTD. All Rights Reserved. 29
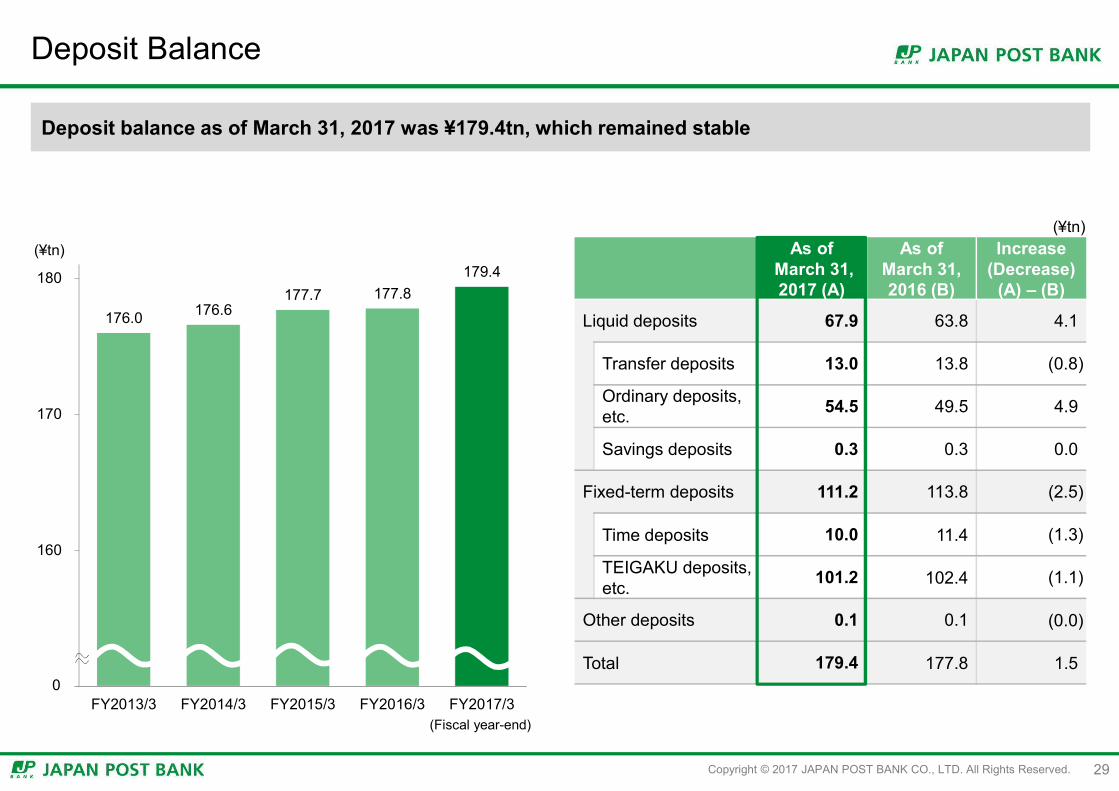
Deposit Balance
As ofMarch 31, 2017 (A)
As of March 31, 2016 (B)
Increase(Decrease)
(A) – (B)
Liquid deposits 67.9 63.8 4.1
Transfer deposits 13.0 13.8 (0.8)
Ordinary deposits, etc. 54.5 49.5 4.9
Savings deposits 0.3 0.3 0.0
Fixed-term deposits 111.2 113.8 (2.5)
Time deposits 10.0 11.4 (1.3)
TEIGAKU deposits, etc. 101.2 102.4 (1.1)
Other deposits 0.1 0.1 (0.0)
Total 179.4 177.8 1.5
(¥tn)
176.0 176.6 177.7 177.8
179.4
150
160
170
180
FY2013/3 FY2014/3 FY2015/3 FY2016/3 FY2017/30
(Fiscal year-end)
(¥tn)
Deposit balance as of March 31, 2017 was ¥179.4tn, which remained stable

Copyright © 2017 JAPAN POST BANK CO., LTD. All Rights Reserved. 30
Fees and Commissions
FY2017/3 FY2016/3 Difference
Net fees and commissions 86.6 91.1 (4.5)Exchange and settlementTransactions 59.1 59.2 (0.1)
Zengin net fee 9.3 8.4 0.9ATM related commissions 7.2 7.5 (0.2)
JGBs related commissions 1.8 2.5 (0.7)Investment trust relatedcommissions 10.5 13.0 (2.5)New businesses related commissions 6.9 7.2 (0.3)
Credit cards 4.2 3.9 0.2
Variable Annuities 1.5 2.2 (0.7)Consumer loans 1.1 1.0 0.0
Other 0.8 1.3 (0.4)
Results for Net Fees and Commissions
To promote better relationships with customers based on household accounts, and seek to create more opportunities in fee business fields, specifically in settlement services, ATM business and asset management product sales, by taking advantage of our broad network
(¥bn)
Install our compact ATMs at FamilyMart stores across the country (as a first step, project 3,500 units from Jan 2017)
(ATM business)
To expand our customer base, run a campaign targeting new customers(Apr 2017 - Mar 2018)
(Sales promotion of investment trust products)
(Introduction of new settlement services)
Started issuance of regional version of VISA prepaid card "mijica" (Jan 2017)
Copyright © 2017 JAPAN POST BANK CO., LTD. All Rights Reserved.
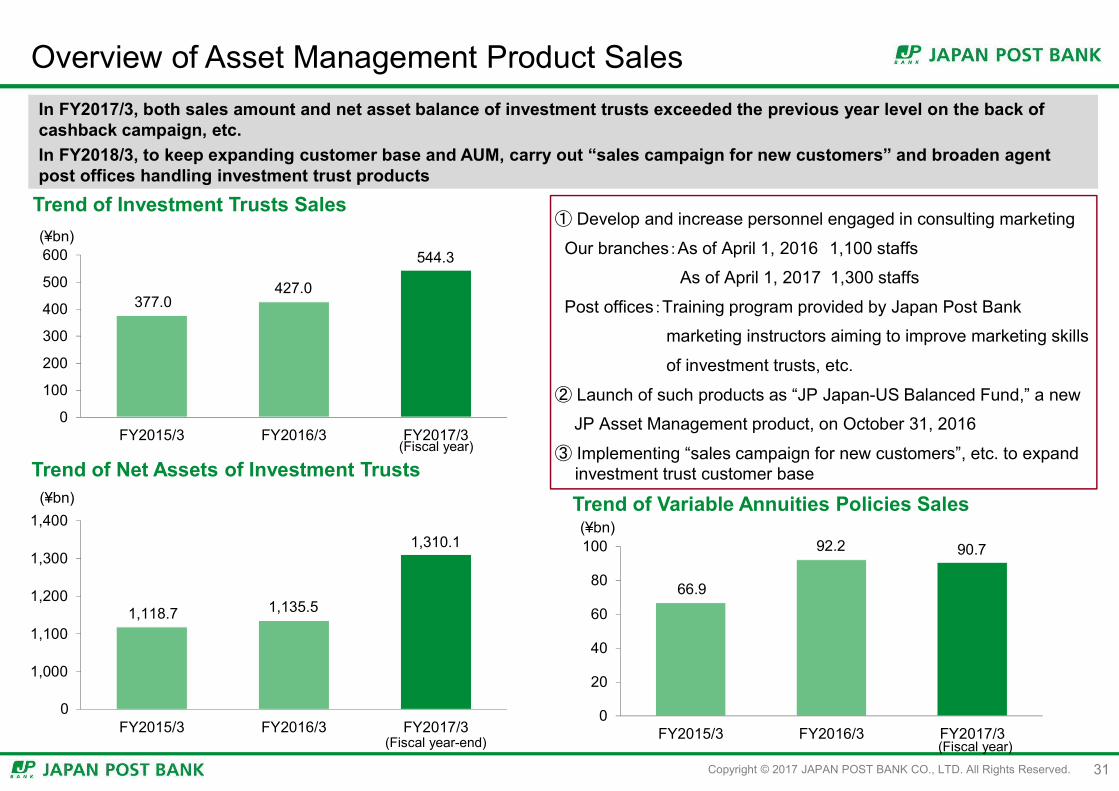
1,118.7 1,135.5
1,310.1
900
1,000
1,100
1,200
1,300
1,400
FY2015/3 FY2016/3 FY2017/30
(Fiscal year-end)
(¥bn)
66.9
92.2 90.7
0
20
40
60
80
100
FY2015/3 FY2016/3 FY2017/3(Fiscal year)
(¥bn)
Overview of Asset Management Product Sales
① Develop and increase personnel engaged in consulting marketing
Our branches:As of April 1, 2016 1,100 staffs
As of April 1, 2017 1,300 staffs
Post offices:Training program provided by Japan Post Bank
marketing instructors aiming to improve marketing skills
of investment trusts, etc.
② Launch of such products as “JP Japan-US Balanced Fund,” a new
JP Asset Management product, on October 31, 2016
③ Implementing “sales campaign for new customers”, etc. to expand investment trust customer base
31
In FY2017/3, both sales amount and net asset balance of investment trusts exceeded the previous year level on the back of cashback campaign, etc.In FY2018/3, to keep expanding customer base and AUM, carry out “sales campaign for new customers” and broaden agent post offices handling investment trust products
Trend of Net Assets of Investment Trusts
Trend of Investment Trusts Sales
Trend of Variable Annuities Policies Sales
377.0 427.0
544.3
0
100
200
300
400
500
600
FY2015/3 FY2016/3 FY2017/3(Fiscal year)
(¥bn)

Copyright © 2017 JAPAN POST BANK CO., LTD. All Rights Reserved. 32
Selected Business Results (1)
For the fiscal year ended Increase(Decrease)
(A) – (B)March 31, 2017 (A) March 31, 2016 (B)
Number of contracts (thousands) 1,251 1,164 86
Sales amount (millions of yen) 544,399 427,085 117,313
As of March 31, 2017 (A) As of March 31, 2016 (B)Increase
(Decrease)(A) – (B)
Number of investment trust accounts (thousands) 749 696 53
Net assets (millions of yen) 1,310,151 1,135,550 174,601
For the fiscal year ended Increase(Decrease)
(A) – (B)March 31, 2017 (A) March 31, 2016 (B)
Number of policies 17,731 17,220 511
Sales amount (millions of yen) 90,712 92,270 (1,558)
As of March 31, 2017 (A) As of March 31, 2016 (B)Increase
(Decrease)(A) – (B)
Number of policies (cumulative) 100,507 82,776 17,731
Sales amount (cumulative) (millions of yen) 528,434 437,722 90,712
(1) Investment Trusts Sales (Contract Basis)
(2) Variable Annuities Policies
Copyright © 2017 JAPAN POST BANK CO., LTD. All Rights Reserved. 33
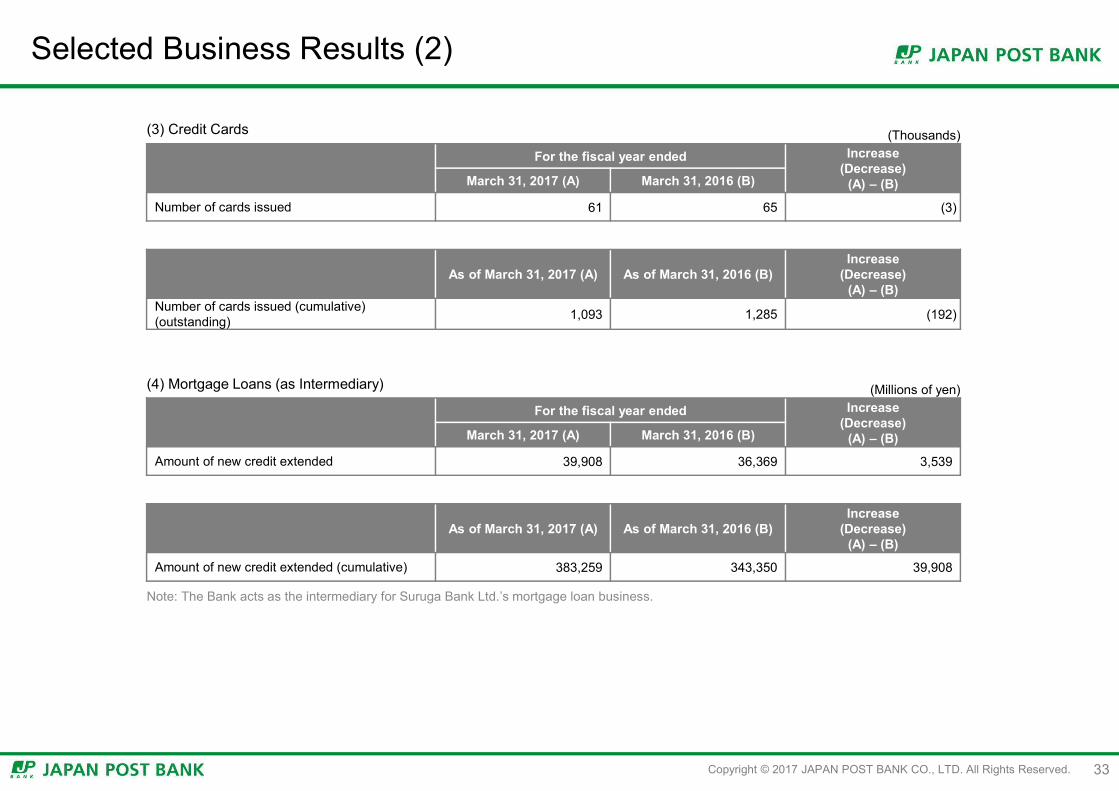
Selected Business Results (2)
For the fiscal year ended Increase(Decrease)
(A) – (B)March 31, 2017 (A) March 31, 2016 (B)
Amount of new credit extended 39,908 36,369 3,539
As of March 31, 2017 (A) As of March 31, 2016 (B)Increase
(Decrease)(A) – (B)
Amount of new credit extended (cumulative) 383,259 343,350 39,908
For the fiscal year ended Increase(Decrease)
(A) – (B)March 31, 2017 (A) March 31, 2016 (B)
Number of cards issued 61 65 (3)
As of March 31, 2017 (A) As of March 31, 2016 (B)Increase
(Decrease)(A) – (B)
Number of cards issued (cumulative) (outstanding) 1,093 1,285 (192)
(4) Mortgage Loans (as Intermediary)
(3) Credit Cards
Note: The Bank acts as the intermediary for Suruga Bank Ltd.’s mortgage loan business.
(Millions of yen)
(Thousands)

Copyright © 2017 JAPAN POST BANK CO., LTD. All Rights Reserved. 34
General and Administrative Expenses (1)
General and administrative expenses for the fiscal year ended March 31, 2017 decreased by ¥9.9bn year-on-year to ¥1,054.0bn
For the fiscal year ended Increase(Decrease)
(A) – (B)March 31, 2017 (A)
March 31, 2016 (B)
Personnel expenses (*) 123.2 123.2 (0.0)
Salaries and allowances 101.1 101.4 (0.3)
Non-personnel expenses 854.3 865.1 (10.8)
Commissions on bank agency services, etc. paid to JAPAN POST Co., Ltd.
612.4 609.4 3.0
Deposit insurance premiums paid to JAPAN POST HOLDINGS Co., Ltd.
8.3 9.8 (1.4)
Deposit insurance expenses paid to Deposit Insurance Corporation of Japan
66.1 64.4 1.7
Taxes and dues 76.4 75.5 0.8
Total 1,054.0 1,064.0 (9.9)
(¥bn)
* Personnel expenses include non-recurring losses.
1,110.7 1,095.0
1,113.6
1,064.0 1,054.0
800
900
1,000
1,100
1,200
FY2013/3 FY2014/3 FY2015/3 FY2016/3 FY2017/30
(Fiscal year)
(¥bn)
Copyright © 2017 JAPAN POST BANK CO., LTD. All Rights Reserved. 35
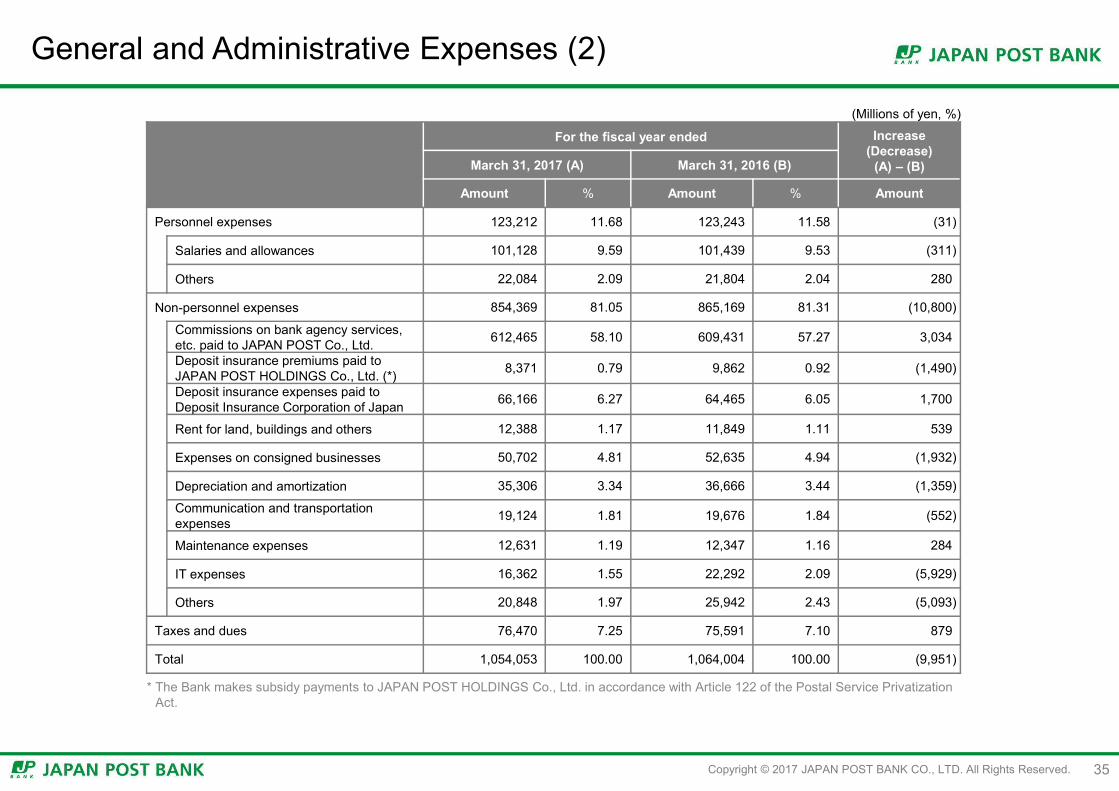
General and Administrative Expenses (2)
For the fiscal year ended Increase(Decrease)
(A) – (B)March 31, 2017 (A) March 31, 2016 (B)
Amount % Amount % Amount
Personnel expenses 123,212 11.68 123,243 11.58 (31)
Salaries and allowances 101,128 9.59 101,439 9.53 (311)
Others 22,084 2.09 21,804 2.04 280
Non-personnel expenses 854,369 81.05 865,169 81.31 (10,800)
Commissions on bank agency services, etc. paid to JAPAN POST Co., Ltd. 612,465 58.10 609,431 57.27 3,034
Deposit insurance premiums paid toJAPAN POST HOLDINGS Co., Ltd. (*) 8,371 0.79 9,862 0.92 (1,490)
Deposit insurance expenses paid to Deposit Insurance Corporation of Japan 66,166 6.27 64,465 6.05 1,700
Rent for land, buildings and others 12,388 1.17 11,849 1.11 539
Expenses on consigned businesses 50,702 4.81 52,635 4.94 (1,932)
Depreciation and amortization 35,306 3.34 36,666 3.44 (1,359)
Communication and transportation expenses 19,124 1.81 19,676 1.84 (552)
Maintenance expenses 12,631 1.19 12,347 1.16 284
IT expenses 16,362 1.55 22,292 2.09 (5,929)
Others 20,848 1.97 25,942 2.43 (5,093)
Taxes and dues 76,470 7.25 75,591 7.10 879
Total 1,054,053 100.00 1,064,004 100.00 (9,951)
(Millions of yen, %)
* The Bank makes subsidy payments to JAPAN POST HOLDINGS Co., Ltd. in accordance with Article 122 of the Postal Service PrivatizationAct.
Copyright © 2017 JAPAN POST BANK CO., LTD. All Rights Reserved. 36
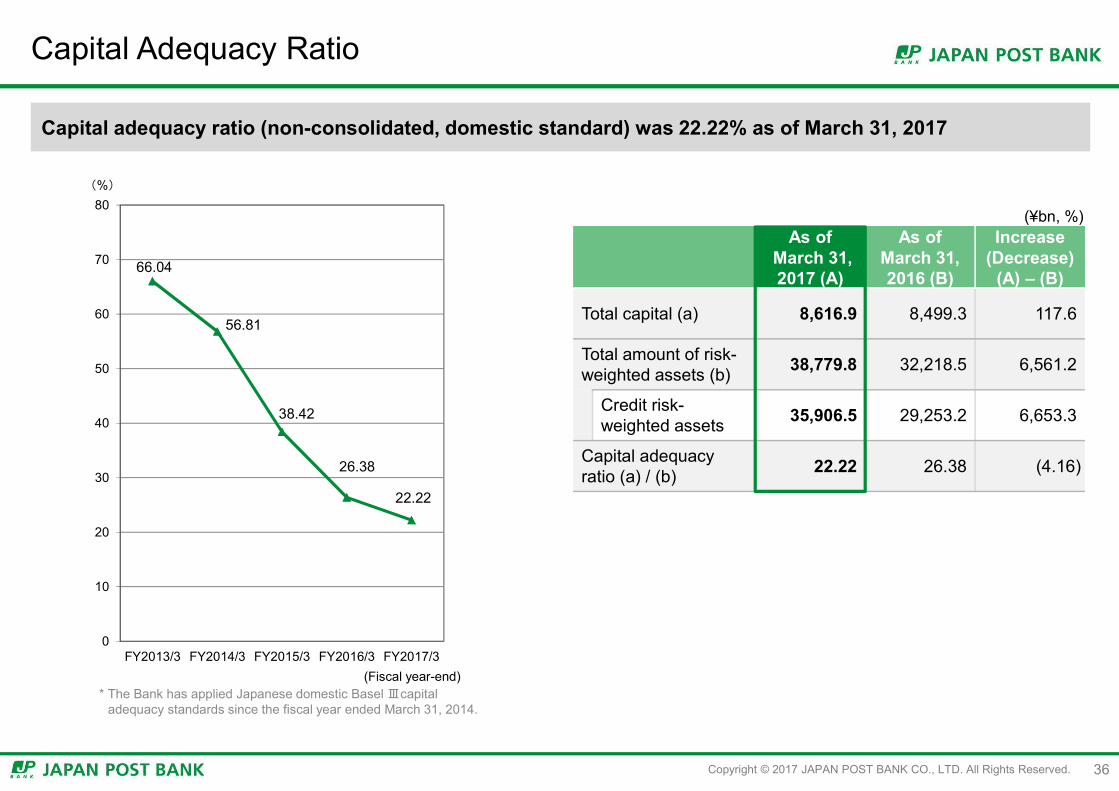
Capital Adequacy Ratio
As ofMarch 31, 2017 (A)
As of March 31, 2016 (B)
Increase(Decrease)
(A) – (B)
Total capital (a) 8,616.9 8,499.3 117.6
Total amount of risk-weighted assets (b) 38,779.8 32,218.5 6,561.2
Credit risk-weighted assets 35,906.5 29,253.2 6,653.3
Capital adequacy ratio (a) / (b) 22.22 26.38 (4.16)
(¥bn, %)
Capital adequacy ratio (non-consolidated, domestic standard) was 22.22% as of March 31, 2017
* The Bank has applied Japanese domestic Basel Ⅲcapitaladequacy standards since the fiscal year ended March 31, 2014.
66.04
56.81
38.42
26.38
22.22
0
10
20
30
40
50
60
70
80
FY2013/3 FY2014/3 FY2015/3 FY2016/3 FY2017/3
(%)
(Fiscal year-end)
Copyright © 2017 JAPAN POST BANK CO., LTD. All Rights Reserved. 37
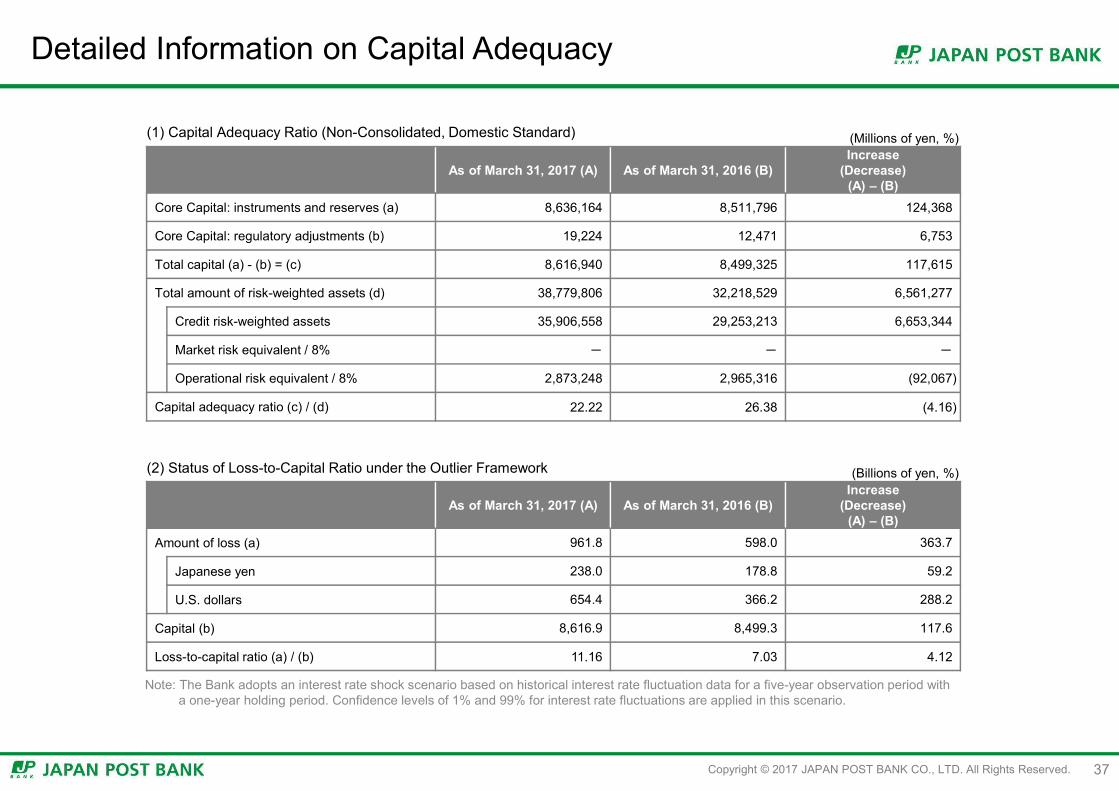
Detailed Information on Capital Adequacy
As of March 31, 2017 (A) As of March 31, 2016 (B)Increase
(Decrease)(A) – (B)
Core Capital: instruments and reserves (a) 8,636,164 8,511,796 124,368
Core Capital: regulatory adjustments (b) 19,224 12,471 6,753
Total capital (a) - (b) = (c) 8,616,940 8,499,325 117,615
Total amount of risk-weighted assets (d) 38,779,806 32,218,529 6,561,277
Credit risk-weighted assets 35,906,558 29,253,213 6,653,344
Market risk equivalent / 8% - - -
Operational risk equivalent / 8% 2,873,248 2,965,316 (92,067)
Capital adequacy ratio (c) / (d) 22.22 26.38 (4.16)
As of March 31, 2017 (A) As of March 31, 2016 (B)Increase
(Decrease)(A) – (B)
Amount of loss (a) 961.8 598.0 363.7
Japanese yen 238.0 178.8 59.2
U.S. dollars 654.4 366.2 288.2
Capital (b) 8,616.9 8,499.3 117.6
Loss-to-capital ratio (a) / (b) 11.16 7.03 4.12
(1) Capital Adequacy Ratio (Non-Consolidated, Domestic Standard)
(2) Status of Loss-to-Capital Ratio under the Outlier Framework
Note: The Bank adopts an interest rate shock scenario based on historical interest rate fluctuation data for a five-year observation period with a one-year holding period. Confidence levels of 1% and 99% for interest rate fluctuations are applied in this scenario.
(Millions of yen, %)
(Billions of yen, %)

Copyright © 2017 JAPAN POST BANK CO., LTD. All Rights Reserved. 38
Progress under Medium-Term Business Plan
FY2015/3 FY2016/3 FY2017/3 FY2018/3Medium-term targets
Assets under management
Deposits1 ¥178.4tn1 ¥179.3tn¥180.7tn【+¥2.3tn】
+¥3tn(FY2016/3-2018/3)
Asset management
products2¥1.66tn ¥1.96tn
¥2.39tn【+¥0.73tn】
+¥1tn(FY2016/3-2018/3)
Net ordinary income ¥569.4bn ¥481.9bn ¥442.0bn Approx. ¥480.0bn
Net income ¥369.4bn ¥325.0bn ¥312.2bn Approx. ¥330.0bn
Non-personnel expenses ¥917.4bn ¥865.1bn¥854.3bn【(¥63.0bn)】
Decrease of ¥50.0bn or more(vs. FY2015/3)
※1 Includes accrued interests. Excludes our group companies’ deposits increased at the time of the share buyback (FY2015/3: Approx. ¥0.6tn).Deposit balances excluding accrued interests are as follows; FY2015/3:¥177.1tn, FY2016/3:¥177.8tn, FY2017/3:¥179.4tn
2 Asset management products: Investment trust products + Variable annuities policies Figures shown in the table above are calculated with all NAVs fixed as the level of FY2015/3-end, in order to eliminate the effects of value fluctuation.Figures including the effects of value fluctuation are as follows; FY2016/3:¥1.79tn, FY2017/3:¥2.10tn In both cases above, figures include quick estimation.
<Medium-term targets (FY2018/3)>Figures in 【 】 show comparison vs. FY2015/3
FY2018/3Earningsforecast
¥490.0bn
¥350.0bn

Copyright © 2017 JAPAN POST BANK CO., LTD. All Rights Reserved. 39
Framework for Corporate Governance
39
Independent Auditor
General Meetings of Shareholders
Appointment and dismissal
Election anddismissal
President andRepresentative
Executive Officer
(Audit Committee Office)
Audit Committee5 Directors (5 Outside Directors)
Election and dismissal
Nomination Committee4 Directors (3 Outside Directors)
Election and dismissalBoard of Directors
12 Directors (8 Outside Directors)
Compensation Committee4 Directors (3 Outside Directors)
Committee Chairperson Committee members
Nomination Committee
Masatsugu Nagato
Yoshizumi NezuTomoyoshi AritaTsuyoshi Okamoto
Audit Committee
Tomoyoshi Arita
Sawako NoharaTetsu MachidaToshihiro TsuboiKatsuaki Ikeda
Compensation Committee
Tsuyoshi Okamoto
Masatsugu NagatoYoshizumi NezuKatsuaki Ikeda
Reporting
① Ensure management transparency with the adoption of a committees based system② Effective supervision by Outside Directors (8 out of 12 Directors are Outside Directors)

Copyright © 2017 JAPAN POST BANK CO., LTD. All Rights Reserved.
7-year Review
1. Net interest income is calculated by deducting interest expenses (excluding the expenses related to money held in trust) from interest income.2. General and administrative expenses exclude non-recurring losses.3. New domestic standards (Basel III) have been applied from FY2014/3.
FY2011/3 FY2012/3 FY2013/3 FY2014/3 FY2015/3 FY2016/3 FY2017/3
Gross operating profit 1,718.9 1,670.0 1,624.3 1,568.7 1,634.7 1,452.0 1,410.2
Net interest income1 1,686.4 1,677.3 1,532.1 1,470.2 1,540.7 1,361.0 1,223.5
Net fees and commissions 87.9 88.4 88.1 92.6 89.2 91.1 86.6
General and administrative expenses2 (1,210.1) (1,174.5) (1,111.5) (1,096.0) (1,114.7) (1,066.1) (1,056.1)
Provision for general reserve for possible loan losses (0.3) - - - - - 0.0
Net operating profit 508.3 495.4 512.8 472.6 519.9 385.8 354.0
Non-recurring gains (losses) 18.1 80.7 80.7 92.4 49.4 96.1 87.9
Net ordinary income 526.5 576.2 593.5 565.0 569.4 481.9 442.0
Extraordinary income (losses) (1.3) (2.4) (1.9) (0.6) 1.5 (1.1) (1.4)
Net income 316.3 334.8 373.9 354.6 369.4 325.0 312.2
Total net assets 9,093.6 9,818.1 10,997.5 11,464.5 11,630.2 11,508.1 11,780.0
Total assets 193,443.3 195,819.8 199,840.6 202,512.8 208,179.3 207,056.0 209,568.8
Capital adequacy ratio3
(domestic standard) 74.82% 68.39% 66.04% 56.81% 38.42% 26.38% 22.22%
Number of employees 12,351 12,796 12,922 12,963 12,889 12,905 12,965
Average number of temporary employees 6,173 6,006 5,818 5,699 5,523 5,223 4,902
(¥bn)
40

Copyright © 2017 JAPAN POST BANK CO., LTD. All Rights Reserved. 41
Appendix2
Copyright © 2017 JAPAN POST BANK CO., LTD. All Rights Reserved.
Privatization and Listing Scheme of Japan Post Group
42
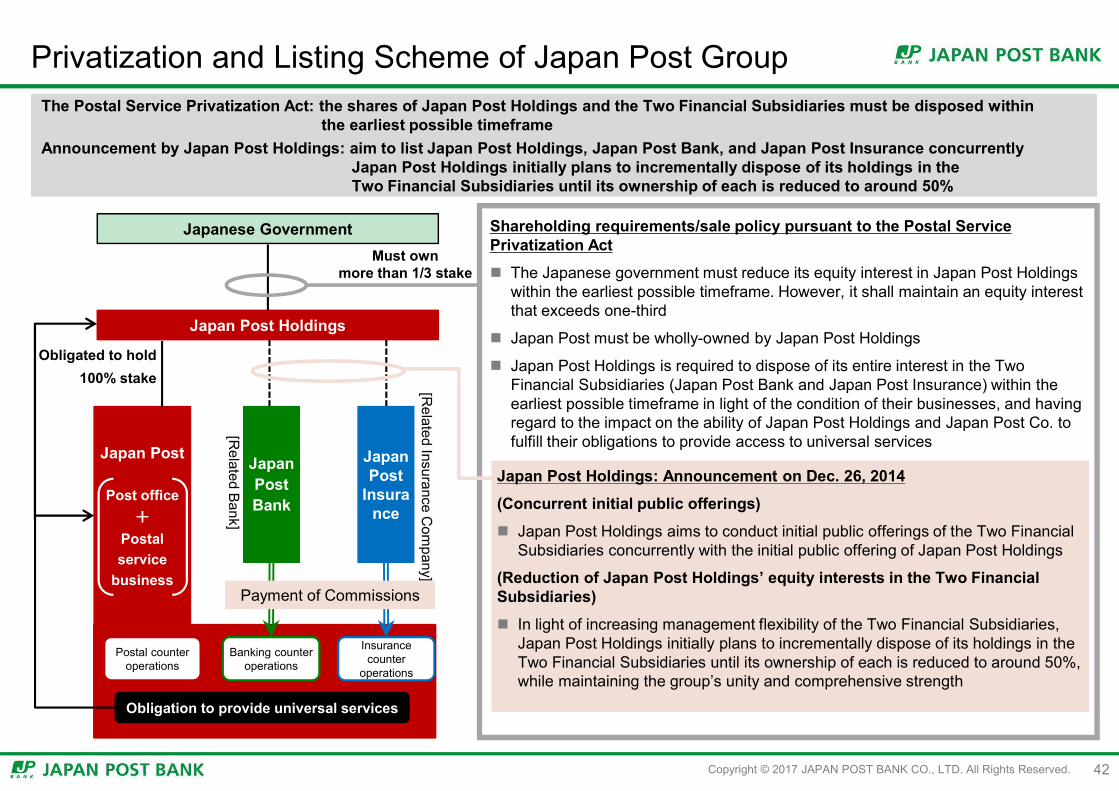
The Postal Service Privatization Act: the shares of Japan Post Holdings and the Two Financial Subsidiaries must be disposed withinthe earliest possible timeframe
Announcement by Japan Post Holdings: aim to list Japan Post Holdings, Japan Post Bank, and Japan Post Insurance concurrentlyJapan Post Holdings initially plans to incrementally dispose of its holdings in the Two Financial Subsidiaries until its ownership of each is reduced to around 50%
Shareholding requirements/sale policy pursuant to the Postal Service Privatization Act
The Japanese government must reduce its equity interest in Japan Post Holdings within the earliest possible timeframe. However, it shall maintain an equity interest that exceeds one-third
Japan Post must be wholly-owned by Japan Post Holdings
Japan Post Holdings is required to dispose of its entire interest in the Two Financial Subsidiaries (Japan Post Bank and Japan Post Insurance) within the earliest possible timeframe in light of the condition of their businesses, and having regard to the impact on the ability of Japan Post Holdings and Japan Post Co. to fulfill their obligations to provide access to universal services
Japan Post Holdings: Announcement on Dec. 26, 2014
(Concurrent initial public offerings)
Japan Post Holdings aims to conduct initial public offerings of the Two Financial Subsidiaries concurrently with the initial public offering of Japan Post Holdings
(Reduction of Japan Post Holdings’ equity interests in the Two Financial Subsidiaries)
In light of increasing management flexibility of the Two Financial Subsidiaries, Japan Post Holdings initially plans to incrementally dispose of its holdings in the Two Financial Subsidiaries until its ownership of each is reduced to around 50%, while maintaining the group’s unity and comprehensive strength
[Related Insurance C
ompany]
Obligation to provide universal services
Japanese Government
Japan Post Holdings
Japan Post
Post office+
Postal service
business
Japan Post Bank
Japan Post
Insurance
Must ownmore than 1/3 stake
Obligated to hold100% stake
Postal counter operations
Banking counter operations
Insurance counter
operations
[Related Bank]
Payment of Commissions

Copyright © 2017 JAPAN POST BANK CO., LTD. All Rights Reserved.
“Retail Financial Institution that Caters to All Segments of Society” and “One of the Largest Institutional Investors in Japan”
“One of the largest retail financial institutions in Japan” providing essential financial services mainly through the post office network“One of the largest institutional investors in Japan” with its securities-centered portfolio aiming to diversify through global asset allocation
Deposit Ranking of Japanese Banks
43
Note: Ordinary deposit customers are as of March 2017.
(As of March 2015)
Source: Company disclosures, subsidiary bank non-consolidated basisNote: Excluding negotiable certificate of deposits.1. Aggregate deposit balance of Resona Bank, Saitama Resona Bank and Kinki Osaka Bank.
1
One of the largest retail customer bases in Japan with “accessible and trusted brand” Approx. 120mn ordinary deposit customers Deposit balance ¥179.4tn (as of March 2017)
Customer Base
Retail financial institution w
ith customers from
all segm
ents of society
Significant network channels covering a broad range of customers Nationwide network of post offices as the main channel Largest number of ATMs nationwide, internet banking
Channels
Essential financial services for individual customers Focus on basic financial services essential to individual
customers such as savings, remittances, investment trusts, loans and other services
Productsand
Services
Diversification of investment portfolio while maintaining securities-centered portfolio Planning to diversify revenue source by expanding credit
exposure and increasing global asset allocation
Asset Manage-
ment
One of the largest
institutional investors in Japan
179
139
107 105
40 29
Japan PostBank
BTMU Mizuho SMBC Resona¹ SMTB0
50
100
150
200
(¥ tn) (As of March 2017)

Copyright © 2017 JAPAN POST BANK CO., LTD. All Rights Reserved.
Strategic & Financial Highlights
4. Investment Strategyhaving Secured Stable Profits 2. Retail Marketing Capability through the
Largest Network among Japanese Banks
3. Solid Capital Base
5. Growth Strategy and Compelling/Stable Shareholder Return
1. Maintained Stable Profitunder Economic Volatility
Condensed Balance Sheet (As of March 2017)
Total Assets ¥209.5tn
Cash and due from banks, call loans, and receivables under
securities borrowing transactions¥60.4tn
JGBs¥68.8tn
Transfer deposits¥13.0tn
Net assets ¥11.7tn
Other liabilities¥18.3tn
Foreign securities¥52.9tn
Japanese local government bonds ¥6.0tn
Corporate bonds ¥10.9tn
Ordinary deposits, etc.
¥54.5tn
Time deposits¥10.0tn
TEIGAKU deposits, etc.
¥101.2tn
Deposits ¥179.4tn
Other assets ¥2.4tn
Loans ¥4.0tnMoney held in trust ¥3.8tn
44

Copyright © 2017 JAPAN POST BANK CO., LTD. All Rights Reserved.
(800)
(600)
(400)
(200)
0
200
400
600
800
08/3 09/3 10/3 11/3 12/3 13/3 14/3 15/3 16/3 17/3
(¥ bn)
(FY)
Japan Post Bank BTMUSMBC MizuhoMajor Regional Banks
Stable Profits through Retail Funding and Market Investment
45
Maintained stable profits up to FY2017/3 with its funding structure and investment portfolio resilient to economic fluctuationOur differentiated business model (retail funding/market investment) supported by ALM strategy and cost control is key to stable profits
Record of Net Income(Comparison with megabanks and major regional banks since corporatization of Japan Post Bank)
(¥ bn)JapanPost
Bank1BTMU SMBC Mizuho2
Major Regional Banks3
10-year average 321.7 451.0 427.8 294.4 163.6
Source: Company disclosures Note: Subsidiary bank data are on a non-consolidated basis (excl. Fukuoka FG)1. Net income of Japan Post Bank for FY2008/3 is shown as double the net income from Oct. 1, 2007 to Mar. 31, 2008.2. FY2014/3 for Mizuho is calculated by simply adding 1Q net income of “former” Mizuho Bank to the full year net income of “new” Mizuho Bank
(ex. Mizuho Corporate Bank).3. Major Regional Banks include The Bank of Yokohama, Shizuoka Bank, Chiba Bank, Joyo Bank (non-consolidated basis, a subsidiary of
Mebuki FG) and Fukuoka FG (consolidated). Figures shown are the aggregate net income of these banks.

Copyright © 2017 JAPAN POST BANK CO., LTD. All Rights Reserved.
Post Offices23,865
24,145
13,589
752 975 513
8,010
Japan PostBank
NationwideBank Total²
BTMU SMBC Mizuho (Reference)JA³
91%
36% 30% 28%
0%
20%
40%
60%
80%
100%
JapanPostBank
BTMU SMBC Mizuho
Stable/Low-cost Funding through Significant Network and Customer Base
Over 90% of our funding is retail deposits – relatively stable and low-cost funding structure compared to market-based fundingPost offices, Japan’s largest physical network that covers every municipality in Japan, are our main channel. We hold a retail deposit market share of approx. 20%
Breakdown of Funding Sources Domestic Branch Network
46
Japan Post Bank
Branches234
Estimated Share of Japan Post BankJapanese Household Deposits
Deposits at other banks
Japan Post Bank
approx. 20%4
(As of December 2016)
Source: Company disclosuresNote: Subsidiary bank non-consolidated basis.1. Funding from financial markets includes negotiable certificates of deposit, call money,
payables under repurchase agreements, payables under securities lending transactions, commercial paper, borrowings, bonds, etc.
Source: Company disclosures, Japanese Bankers Association, JA Bank website2. Nationwide bank total: domestic head office/branches and sub branches of 116 banks
(excluding Japan Post Bank). Independent ATMs located outside of branches are not included in sub-branches, as of September 2016.
3. Total of Japan Agricultural Cooperative and the Prefectural Credit Federations of Agricultural Cooperatives locations with exchange operations, as of March 2016.
4. Retail deposits of Japan Post Bank as of December 2016 / household deposits (from “Flow of Funds Accounts” released by Bank of Japan) as of December 2016.
(Branches/Offices, as of September 2016)
Domestic Retail
Deposits
Deposits other than domestic retail
Funding from financial markets1Limited reliance on funding from financial markets
(As of March 2017)
24,099
Copyright © 2017 JAPAN POST BANK CO., LTD. All Rights Reserved.
JGBs, etc.188.0%
Japanese local government bonds
3.6%
ForeignSecurities
0.1%
Loans1.8%
Due frombanks, etc.2
2.9%Money heldin trust, etc.3
0.2%
Corporatebonds3.1%
JGBs33.2%
Japanese local government
bonds 2.9%
Loans1.9%
ForeignSecurities
25.5%
Due frombanks, etc.2
29.1%
Money heldin trust, etc.3
1.9%Corporatebonds5.3%
1.19%1.14%
1.09% 1.11% 1.10%1.02%
0.93% 0.95%0.86%
0.78%
0.37%0.33%
0.24%0.20% 0.19% 0.19% 0.19% 0.18% 0.19% 0.18%
0.82% 0.80%0.84%
0.91% 0.91%0.82%
0.73% 0.76%0.66%
0.60%
0.07%
0
200
400
600
800
1,000
1,200
1,400
1,600
1,800
(0.2%)
0.0%
0.2%
0.4%
0.6%
0.8%
1.0%
1.2%
1.4%
1.6%
08/3 09/3 10/3 11/3 12/3 13/3 14/3 15/3 16/3 17/3(FY)
Net Interest Margin①-②
② Interest rate on interest-bearing liabilities
10 year JGByield
① Yield on Interest-earning assets
(net interest income, ¥ bn)
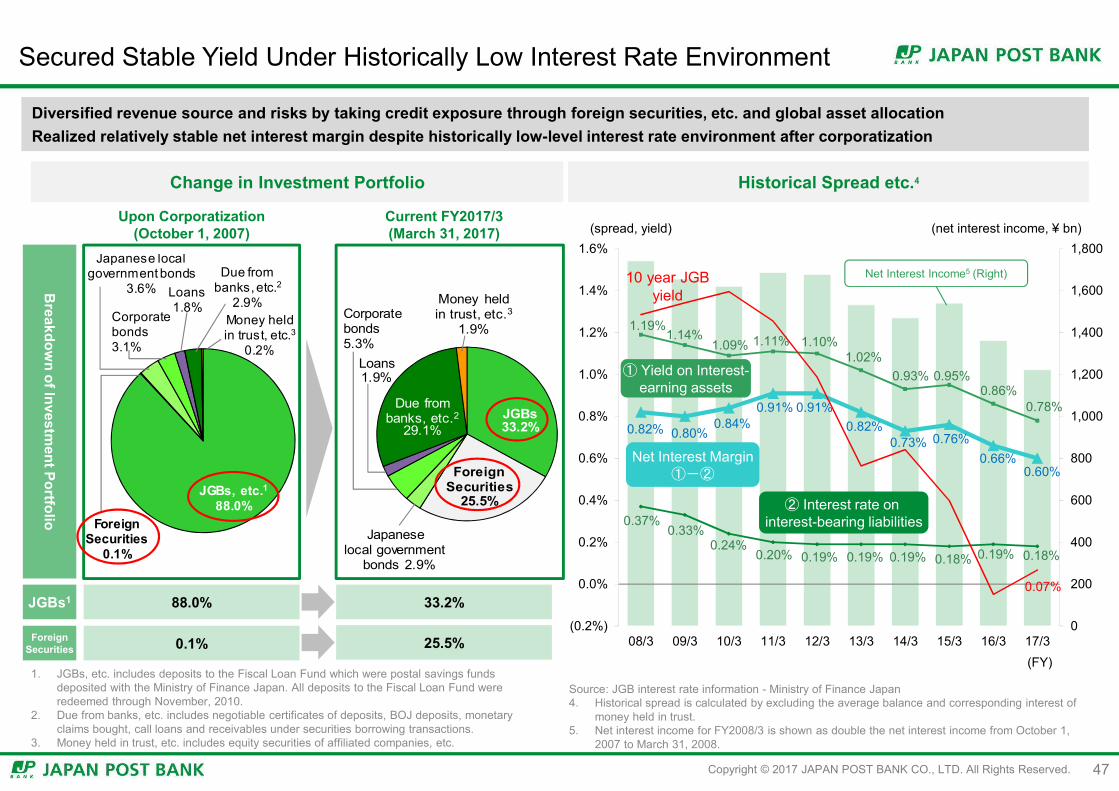
Secured Stable Yield Under Historically Low Interest Rate Environment
Diversified revenue source and risks by taking credit exposure through foreign securities, etc. and global asset allocationRealized relatively stable net interest margin despite historically low-level interest rate environment after corporatization
Change in Investment Portfolio Historical Spread etc.4
Upon Corporatization(October 1, 2007)
Breakdow
n of Investment Portfolio
Current FY2017/3(March 31, 2017)
88.0%
0.1%ForeignSecurities
JGBs1 33.2%
25.5%
1. JGBs, etc. includes deposits to the Fiscal Loan Fund which were postal savings funds deposited with the Ministry of Finance Japan. All deposits to the Fiscal Loan Fund were redeemed through November, 2010.
2. Due from banks, etc. includes negotiable certificates of deposits, BOJ deposits, monetary claims bought, call loans and receivables under securities borrowing transactions.
3. Money held in trust, etc. includes equity securities of affiliated companies, etc.
Source: JGB interest rate information - Ministry of Finance Japan4. Historical spread is calculated by excluding the average balance and corresponding interest of
money held in trust.5. Net interest income for FY2008/3 is shown as double the net interest income from October 1,
2007 to March 31, 2008.
Net Interest Income5 (Right)
(spread, yield)
47

Copyright © 2017 JAPAN POST BANK CO., LTD. All Rights Reserved.
Portfolio Management Policy Summary of Assets Summary of Funding
Base Portfolio (BP): ¥129tn(Liability-driven portfolio)
Purpose: The foundation of our ALM
Funding: Stable liabilities (over 90% are retail, small-sizeddeposits)
Strategy: Main source of profits – spread between long and short-term interest rates; aim for carry profitsProvide internal funding to the Satellite Portfolio
Satellite Portfolio (SP): ¥70tn(Excess-return portfolio)
Purpose: Pursue excess return
Funding: Mainly funding from the Base Portfolio(Transfer price based on market interest rates)
Strategy: Promote global asset allocation while assessing marketand economic conditionsAim to achieve excess return including capital gainsCreate a “hedge position” by adding assets with negativecorrelation against domestic bonds
ALM/Investment Strategy to Generate Stable Income and Excess Return
BP: manage interest rate/liquidity risk, secure fundamental return mainly from JGBs. Stable funding enables held-to-maturity investmentSP: seek excess return by taking credit/market risk in the global market. Solid capital allows over-the-market-cycle investment
48
1. Short-term assets include cash and due from banks, call loans, receivables under securities borrowing transactions (excl. those in trust), T-bills, short-term corporate bonds, loans to the government (special accounts), etc. 2. Corporate bonds, etc., foreign securities include monetary claims bought. 3. JGBs contained in money held in trust are included in the Base Portfolio.
4. Assets related to alternative investment are included in “alternative assets”.5. Market-based funding includes call money, payables under repurchase agreements, payables under securities lending transactions.
(As of March 2017, illustrative breakdown based on management accounting, figures are rounded to the trillion)
Market-based funding5
¥15tn
Net assets¥12tn
Base Portfolio
(Investment)
Internal Funding toSatellite Portfolio
InternalFunding
TP
Satellite Portfolio(Investm
ent)
* TEIGAKU Deposits: 10-year-maturity time deposits with option to withdraw after 6 months; semi-annual compound interest
Short-term assets1
Bonds held to maturity- JGBs, Government
guaranteed bonds
Loans
Available for sale securities- JGBs, Government
guaranteed bonds
Available-for-sale securities- Japanese local
government bonds- Corporate bonds, etc.2- Foreign securities2,4
(Investment trusts ¥32tn)
Money held in trust (Stocks), etc.3,4
Loans
Base Portfolio
Bonds held to maturity- Japanese local
government bonds, etc.
Custom
er-based Funding
*
¥55tn
¥38tn
¥35tn
¥1tn
¥6tn
¥8tn¥52tn
¥0tn
¥3tn
¥1tn
Liquid Deposits, etc.
¥68tn
Fixed-term Deposits
TEIGAKUDeposits
¥111tn(¥101tn)
Alternative assets ¥1tn
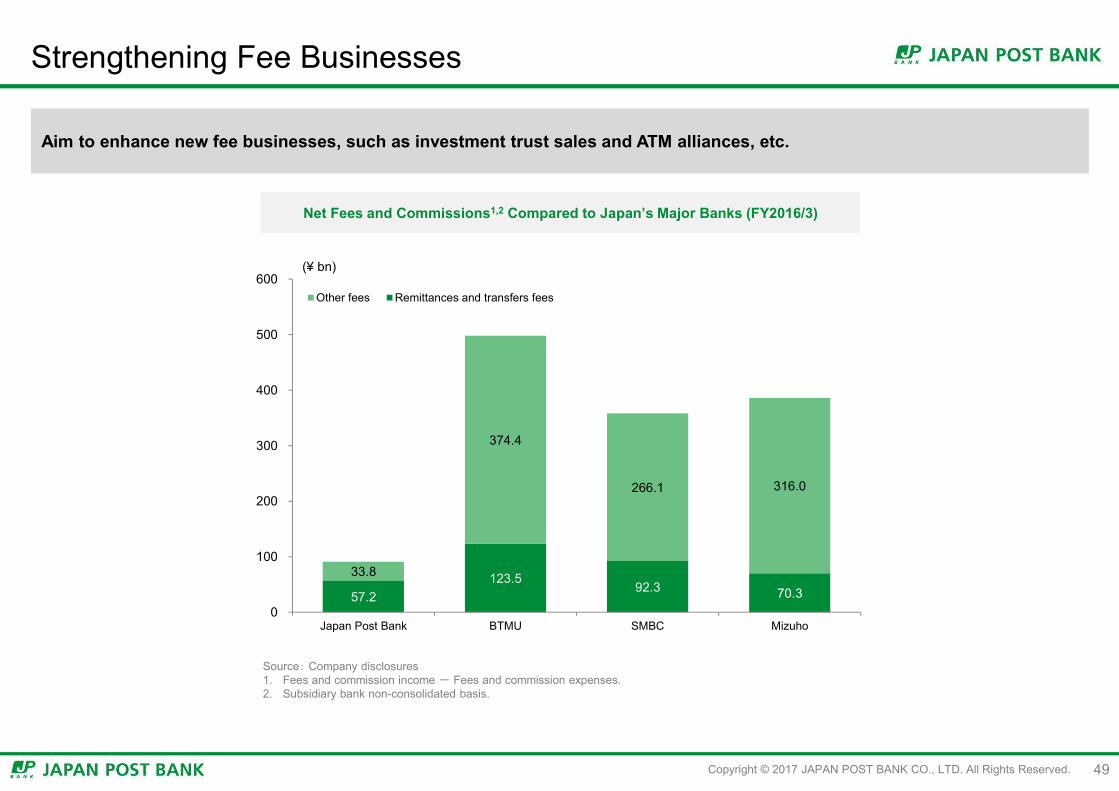
Copyright © 2017 JAPAN POST BANK CO., LTD. All Rights Reserved.
Strengthening Fee Businesses
Aim to enhance new fee businesses, such as investment trust sales and ATM alliances, etc.
Net Fees and Commissions1,2 Compared to Japan’s Major Banks (FY2016/3)
49
57.2123.5
92.3 70.3
33.8
374.4
266.1 316.0
0
100
200
300
400
500
600
Japan Post Bank BTMU SMBC Mizuho
Other fees Remittances and transfers fees
Source: Company disclosures1. Fees and commission income - Fees and commission expenses.2. Subsidiary bank non-consolidated basis.
(¥ bn)

Copyright © 2017 JAPAN POST BANK CO., LTD. All Rights Reserved.
1,266.2 1,221.0 1,209.9 1,173.9
1,110.7 1,095.0 1,113.6 1,064.0 1,054.0
0
200
400
600
800
1,000
1,200
1,400
09/3 10/3 11/3 12/3 13/3 14/3 15/3 16/3 17/3
137.5
121.7
102.8 94.3 96.8
83.1
0
20
40
60
80
100
120
140
160
11/3 12/3 13/3 14/3 15/3 16/3
Expense Control through IT Expense Reduction
While maintaining the nationwide network of 24,000 post offices as our main channel, seek to manage expenses by reducing costs through such initiatives as business process re-engineeringHave significantly reduced its IT costs through integration, restructuring, and internalizing of system development and operations
Trend of G&A Expense Trend of IT Expense1
50
1. Management accounting basis.
(FY)
(¥ bn)
Personnelexpense
Non-personnel expense, etc.
(¥212.2bn)(2009/3-2017/3)
(¥54.3bn)(2011/3-2016/3)
(FY)
(¥ bn)

Copyright © 2017 JAPAN POST BANK CO., LTD. All Rights Reserved.
Commissions are based on operating cost of Japan Post Bank branches and operational volume, etc. of post offices to arrive at an amount reflecting the cost of agency services.
Banking Counter Component1
Deposit Component
Remittance Component
Financial Product Sales Component
Commissions to Japan Post Co., Ltd.
Commissions we pay to Japan Post are in compliance with arm's length rules(Based on the operating cost of our branches and operational volume, etc. of post offices + incentive component)Fee structure incentivizes both Japan Post Bank and Japan Post to increase efficiency
Commission StructureCommissions Paid to Japan Post
51
1. Cost to maintain post offices (allocated to Japan Post Bank based on management accounting of Japan Post) within “cost of agency services” as mentioned in the left column of the table.
Payable based on marketing targets and service quality Incentive component
The breakdown of commissions for FY2017/3 (¥612.4bn):banking counter services component of ¥262.0bn, deposit componentof ¥202.7bn, remittance component of ¥98.2bn, financial product salescomponent of ¥4.1bn and incentive component of ¥45.1bn
632.5 631.9 619.0 609.5 607.2 602.4 609.4 612.4
0
200
400
600
800
10/3 11/3 12/3 13/3 14/3 15/3 16/3 17/3
(¥ bn)
(FY)
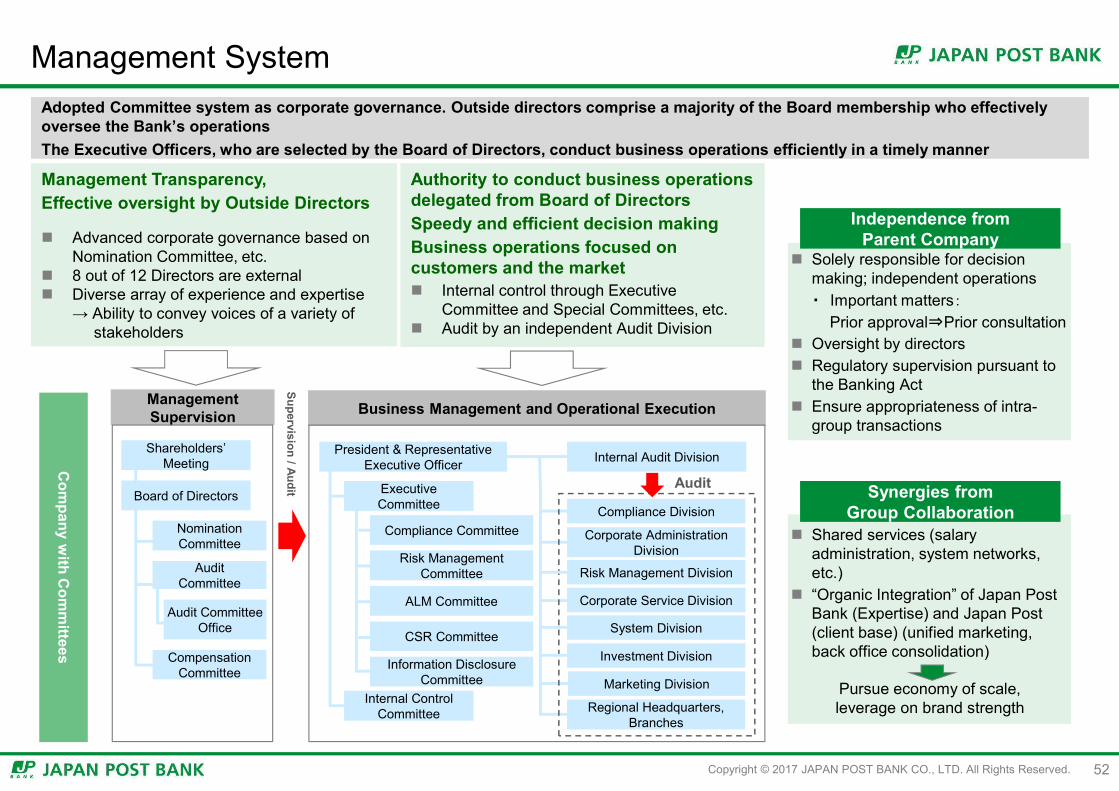
Copyright © 2017 JAPAN POST BANK CO., LTD. All Rights Reserved.
Management SystemAdopted Committee system as corporate governance. Outside directors comprise a majority of the Board membership who effectively oversee the Bank’s operationsThe Executive Officers, who are selected by the Board of Directors, conduct business operations efficiently in a timely manner
52
Management Transparency,Effective oversight by Outside Directors
Advanced corporate governance based on Nomination Committee, etc.
8 out of 12 Directors are external Diverse array of experience and expertise
→ Ability to convey voices of a variety ofstakeholders
Management Supervision Business Management and Operational Execution
Com
pany with C
omm
ittees
Audit
Authority to conduct business operations delegated from Board of DirectorsSpeedy and efficient decision makingBusiness operations focused on customers and the market Internal control through Executive
Committee and Special Committees, etc. Audit by an independent Audit Division
Solely responsible for decision making; independent operations・ Important matters:
Prior approval⇒Prior consultation Oversight by directors Regulatory supervision pursuant to
the Banking Act Ensure appropriateness of intra-
group transactions
Independence fromParent Company
Shared services (salary administration, system networks, etc.)
“Organic Integration” of Japan Post Bank (Expertise) and Japan Post (client base) (unified marketing, back office consolidation)
Synergies fromGroup Collaboration
Pursue economy of scale, leverage on brand strength
Shareholders’ Meeting
Audit Committee
Board of Directors
Nomination Committee
Compensation Committee
Audit Committee Office
President & RepresentativeExecutive Officer Internal Audit Division
Executive Committee
Internal Control Committee
Compliance Division
Corporate Administration Division
Corporate Service Division
Investment Division
Marketing Division
Regional Headquarters, Branches
Compliance Committee
Risk Management Committee
ALM Committee
CSR Committee
Information Disclosure Committee
Supervision / Audit
Risk Management Division
System Division

Copyright © 2017 JAPAN POST BANK CO., LTD. All Rights Reserved.
Overview of Regulations Surrounding Japan Post Bank
53
In addition to banking regulations, we are subject to additional regulations pursuant to the Postal Service Privatization Act
Summary of Regulations
Universal Service Obligation(Imposed on Japan Post
Holdings and Japan Post)
Obligation to provide basic banking services (acceptances and withdrawals of ordinary, TEIGAKU and time deposits, and remittance, etc.) through the post office network
Japan Post Co. has Bank Counter Services Agreement, etc. with Japan Post Bank, etc.
Share-holding
Japan Post Holdings ⇒Japan Post Bank
Japan Post Holdings must aim to dispose all of their shares within the earliest possible timeframe while considering the management situation of both financial services companies, and the impact on the fulfillment of obligations to provide universal services
Regulations on
Japan Post Bank
Regulations under the Banking Act Same regulation is imposed as a “Bank” under the Banking Act
【Additional Regulations】Restrictions on Scope of Business
Current Approval from the Ministers in charge (consultation with the Postal Privatization Committee)
No additional regulations imposed1 after “Specified
Date”2
After Japan Post Holdings disposes of 50% or more
Notification to the Ministers in charge(Obligation to care for fair competition + notice to Postal Privatization Committee + Supervision)
【Additional】Restrictions on theMaximum Amount of Deposit
Maximum amount of deposits (¥13mn) are stipulated by the enforcement order of the Privatization Act
New Business requiring approvals
(Example)
Bi-lateral loans to corporations Loans to individuals
Establishment/acquisition of subsidiaries with certain businesses
Merger, transfer of business, etc.
1. Our banking license is subject to the following conditions: (1) obtain approval from the Prime Minister in order to conduct new types of businesses, (2) continue outsourcing our business operations to an authorized banking agent, in order to maintain a sound, appropriate and stable foundation of our business. (Condition (2) is effective until the Specified Date)
2. “Specified Date” means the earlier of the following:(1) The date when Japan Post Holdings disposes of all its interest in Japan Post Bank(2) The date when Japan Post Holdings disposes of 50% or more of its interest in Japan Post Bank and both the Prime Minister and the Minister of Internal
Affairs and Communications decide to acknowledge lifting of additional regulations will not negatively affect fair competition with other financial institutions, etc. nor provision of appropriate services to customers

Copyright © 2017 JAPAN POST BANK CO., LTD. All Rights Reserved. 54
<Disclaimer>
This document is written solely for the purpose of disclosing relevant information regarding JAPAN POST BANK Co., Ltd.(“Japan Post Bank”). This document does not constitute an offer to sell or the solicitation of an offer to buy any securities in United States, Japan or any other jurisdiction.This presentation contains forward-looking statements including forecasts, targets and plans. These statements are based on estimates at the time in light of the information currently available to Japan Post Bank. The statements and assumptions may prove to be incorrect and may not be realized in the future.Any uncertainties, risks and other factors that may cause such a situation to arise include, but are not limited to, risks related to the effectiveness of risk management policies and procedures; risks related to business strategy and management planning such as market risk, market liquidity risk, credit risk and operational risk; risks related to the expansion of the scope of operations; risks related to the business environment; and other various risks. Please also see the Securities Report and the latest quarterly financial report for material facts that Japan Post Bank recognizes as potentially affecting its actual results, performance or financial position. Japan Post Bank’s actual results, performance or financial position may be materially different from those expressed or implied by such forward-looking statements.The statements in this document are current as of the date of the document or the date otherwise specified, and Japan Post Bank has no obligation or intent to keep this information up to date. The information concerning companies or parties other than Japan Post Bank and the Japan Post Group is based on publicly available and other information as cited, and Japan Post Bank has neither independently verified the accuracy and appropriateness of, nor makes any warranties with respect to, such information. The information of the document may be revised without prior notice.