Results for the 6 months to 30 June 2021
45
Results for the 6 months to 30 June 2021
Transcript of Results for the 6 months to 30 June 2021

Results for the 6 months to 30 June 2021

2
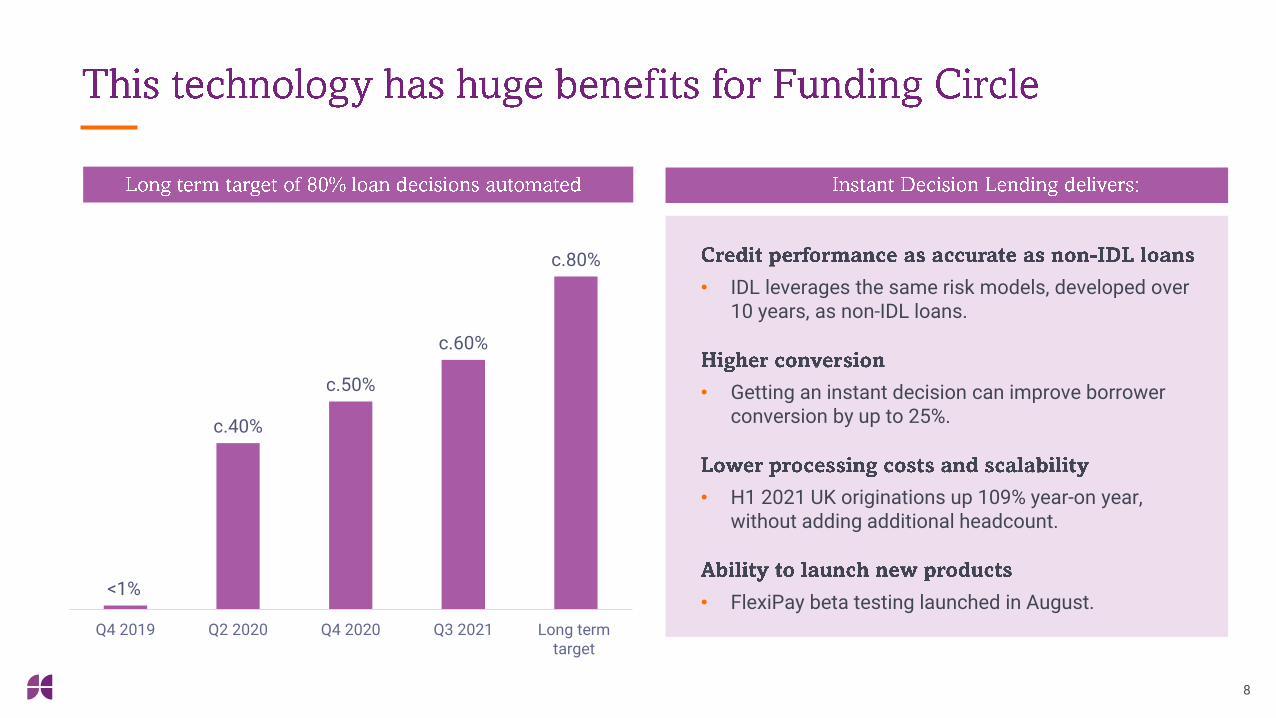
• Our technology platform is transforming the SME borrowing experience with instant decisions for 60% of applications.
• Leveraging our technology to launch new solutions to help SMEs: • Embedded finance • FlexiPay• Business Charge Card
• Improving loan performance demonstrates quality and resilience of portfolio.
• High levels of demand from institution investors to fund loans.
• Strong financial performance: • Total income: £120.6m (H1 2020: £101.2m) up 19%
year-on-year.• Profit: £53.3m AEBITDA (H1 2020 -£84.1m) and
£35.5m operating profit (H1 2020: -£113.5m). • Strong growth in net assets to £254.1m (Dec-20:
£217.6m)
• Record Loans under Management of c.£5bn and originations of £1.6bn, helping thousands of businesses - UK originations up 109% year-on-year.
• Acceleration in adoption of online small business lending, will benefit Funding Circle going forward.
• Attractive financial profile: powered by UK, we expect to be AEBITDA profitable on an ongoing basis and will invest in additional growth opportunities.
• Continue to scale Instant Decision Lending with long term target of 80% of loan decisions automated.
• Operating our core loan product alongside government guarantee programmes in the UK and US.


4
•
•
•
•
0
500
1000
1500
2000
2500
3000
3500
4000
4500
2012 2013 2014 2015 2016 2017 2018 2019 2020 Jun-21
£m
UK LuM

5
<2%
50-70%
SME loans as a % of banks' balancesheets
SMEs as a % of GDP and employment
1. OECD SME and Entrepreneurship Outlook 20192. OC&C analysis: Target addressable market in UK and US. Excludes commercial mortgages, loans / debt products <5k and >500k in local currency and loans with APR >25%. In US, higher minimum threshold of $25k
£305bn
Total Addressable Market 2
1
1
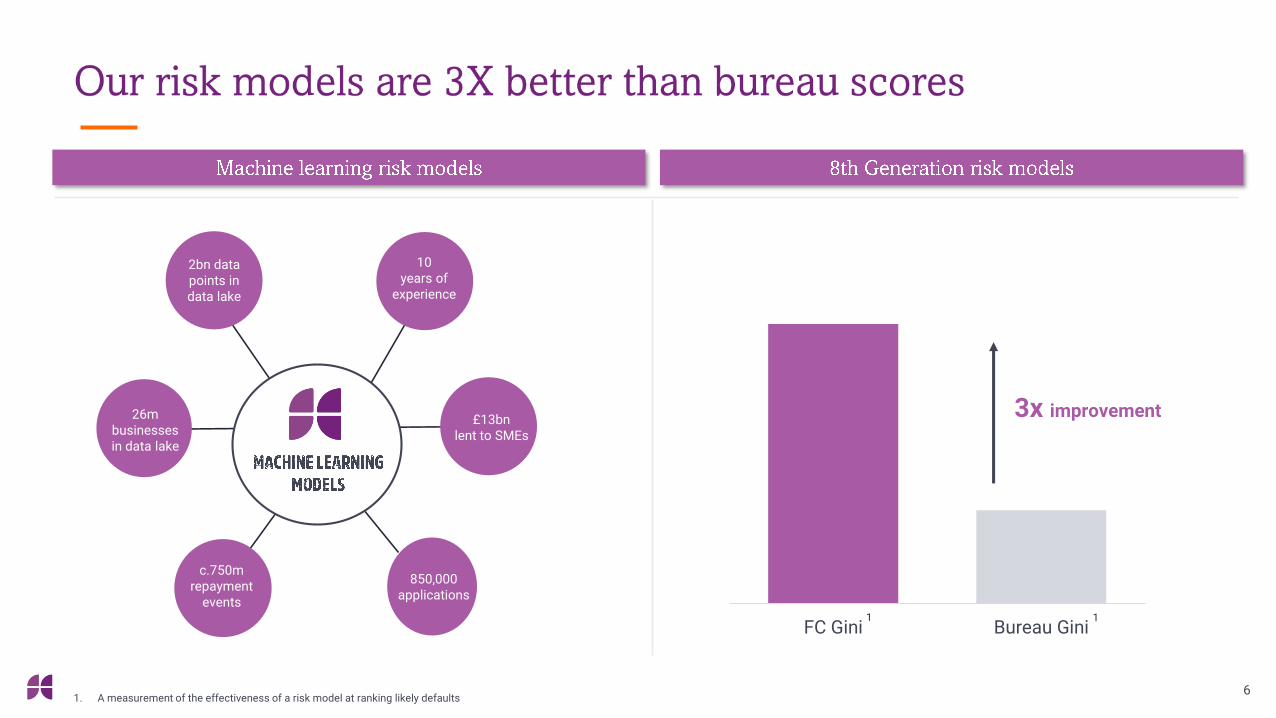
6
FC Gini Bureau Gini
3x improvement
1. A measurement of the effectiveness of a risk model at ranking likely defaults
1 1
Consumer bureau
10 years of
experience
£13bn lent to SMEs
850,000 applications
c.750m repayment
events
26m businesses in data lake
2bn data points in data lake

7
c.6 minutes 9 seconds 24 hours
Get started
Answer a few questions to check if you’re eligible in seconds.
This check does not affect your credit score
£ £100,000
You can borrow from £5,000 to £500,000
Good news – you have been approved for your loan!
1. Average interest rate for Core loans for A+ borrowers
8
<1%
c.40%
c.50%
c.60%
c.80%
Q4 2019 Q2 2020 Q4 2020 Q3 2021 Long termtarget
• IDL leverages the same risk models, developed over 10 years, as non-IDL loans.
• Getting an instant decision can improve borrower conversion by up to 25%.
• H1 2021 UK originations up 109% year-on year, without adding additional headcount.
• FlexiPay beta testing launched in August.
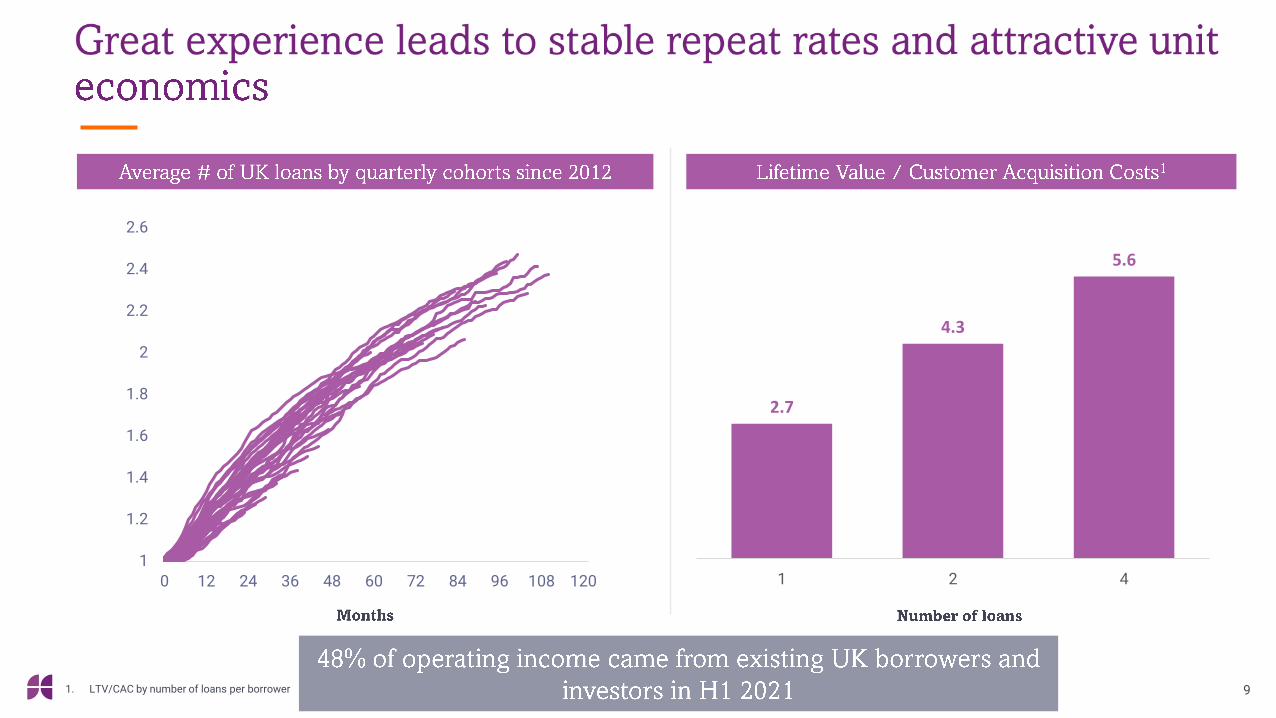
91. LTV/CAC by number of loans per borrower
1
1.2
1.4
1.6
1.8
2
2.2
2.4
2.6
0 12 24 36 48 60 72 84 96 108 120
2.7
4.3
5.6
1 2 4

101. Target addressable market in UK based on OC&C analysis. Excludes commercial mortgages, loans / debt products <5k and >500k in local currency and loans with APR >25%2. Hall & Partners brand awareness research for Funding Circle – October 20203. Net Promoter Score (“NPS”) scores from Funding Circle NPS survey 2021. and average NPS of UK main banks via Customer Guru: https://customer.guru/
UK LuM
83
17
Funding CircleUK borrower
NPS
Average UKBanks NPS
87%
49%
13%
Top 4 banks Funding Circle FinTechs
c.4%1
market share
£4.1bn

11
• 12 years trading history
• 8 employees
• £1m revenue
• £80k loan size
• 50 months average term
Source: Funding Circle data and from the Oxford Economics and Funding Circle 2020 Economic Impact Report
Mike Turner co-founder and MDof Bird and Blend
• 12 years trading history
• 8 employees
• £1m revenue
• £80k loan size
• 50 months average term

12
98%
2%
Group LuM excluding FC equity invested (£4.8bn)
FC equity invested (£105m)*
46%
32%
7%
6%
7%2%
Asset Managers BanksRetail Bond programmeNational entities Funds
* Absolute equity invested at Jun-21 within year-end 2020 guardrails (Jun-21: £105m, Dec-20: £118m)

-1%
0%
1%
2%
3%
4%
5%
6%
7%
2015 2016 2017 2018 2019 2020 2021H1
-1%
0%
1%
2%
3%
4%
5%
6%
7%
2015 2016 2017 2018 2019 2020 2021H1
13
H2 2019 forecast H1 2020 forecast H2 2020 forecast H1 2021 forecastUK and US annualised returns by cohort show mid-point estimates. H1 2020 forecast as at 30 June 2020; H2 2020 forecast as at 31 December 2020; H1 2021 forecast as at 30 June 2021. The US cohort for H1 2021 has a relatively low projected annualised return as these are PPP loans

14
¹
1. Typical Yield may vary depending on government schemes and marketplace mix.2. Go-forward yield will depend on the nature of where Funding Circle's equity is invested e.g. investments such as ABS typically yield higher returns but with higher volatility. Co-investments in loans, will typically earn lower returns
but with lower volatility.


£mH1 2020 H2 2020 H1 2021
Loans Under Management (LuM) 3,722 4,214 4,933Originations 1,112 1,630 1,635
Operating income 64.8 90.9 94.5
Investment income 36.4 29.9 26.1
Total income¹ 101.2 120.8 120.6
Fair value (losses)/gains² (96.1) (22.2) 8.1
Net income 5.1 98.6 128.7
Expenses above AEBITDA (89.2) (78.3) (75.4)
AEBITDA² (84.1) 20.3 53.3
Operating AEBITDA (24.4) 12.6 19.1
Investment AEBITDA (59.7) 7.7 34.2
Expenses below AEBITDA (12.5) (11.3) (13.9)
Exceptionals (16.9) (1.8) (3.9)
Operating profit (loss) (113.5) 7.2 35.5
Profit (Loss) before taxation (115.1) 7.0 35.4
Cash³ 131.2 103.3 168.1Net Assets 216.9 217.6 254.1
16
1. Total income is defined as fee income and investment income less investment expense and before non-cash fair value gains/losses2. Adjusted EBITDA represents EBITDA (Earnings before Interest, Tax, Depreciation and Amortisation) excluding share-based payments, exceptional items and foreign exchange gains or losses. Investment AEBITDA represents
investment income, investment expense and fair value adjustments and operating AEBITDA represents AEBITDA excluding investment AEBITDA3. £38m of cash in H1 2021 crystallized from US warehouse sale
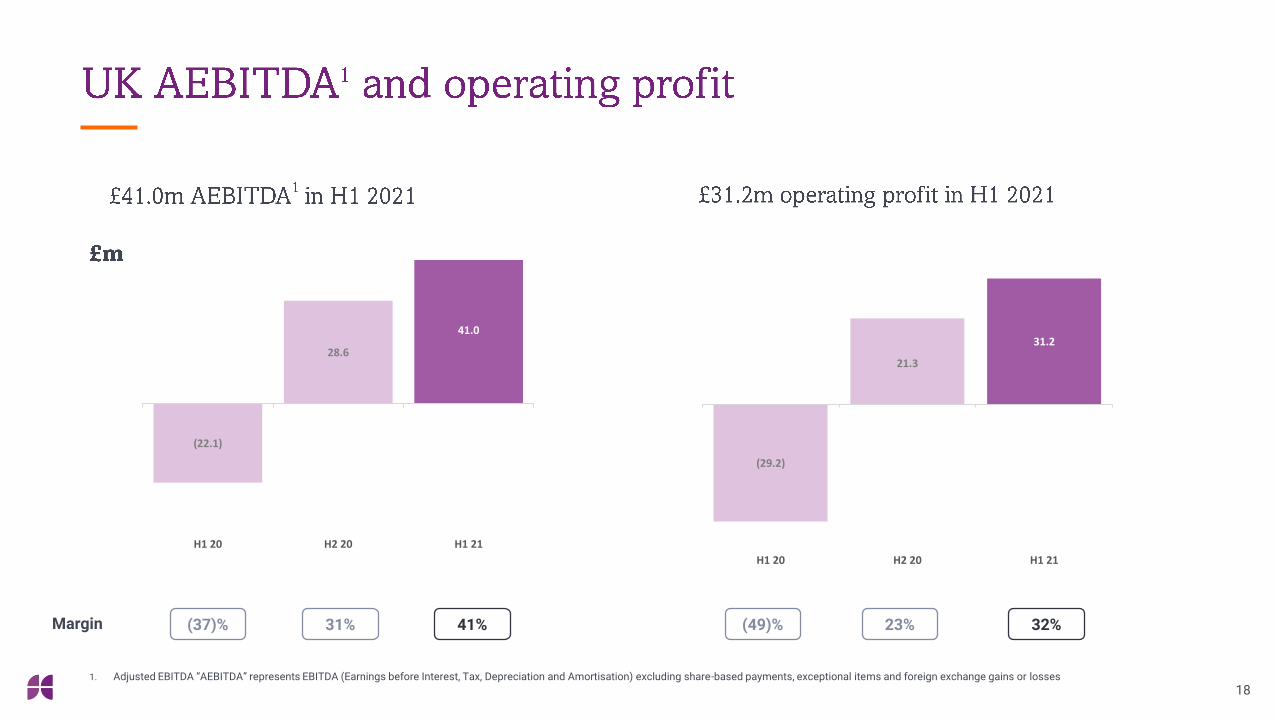
• Total income: £120.6m up 19% year-on-year
• Profit: £53.3m AEBITDA and £35.5m operating profit
• Net assets: strong growth in net assets to £254.1m

2,566
3,271
4,072
H1 20 H2 20 H1 21
171. Total income is defined as fee income and investment income less investment expense and before non-cash fair value gains/losses
YoYgrowth
59%27% 109%91% 67%60%5% (17)% 12%
662
1,449 1,381
H1 20 H2 20 H1 21
59.3
93.6 98.8
H1 20 H2 20 H1 21
(29.2)
21.3
31.2
H1 20 H2 20 H1 21
(22.1)
28.6
41.0
H1 20 H2 20 H1 21
181. Adjusted EBITDA “AEBITDA” represents EBITDA (Earnings before Interest, Tax, Depreciation and Amortisation) excluding share-based payments, exceptional items and foreign exchange gains or losses
Margin (37)% 31% 41% (49)% 23% 32%

19
1. Total income is defined as fee income and investment income less investment expense and before non-cash fair value gains/losses. PPP deferred revenues of £16 million being spread over the future expected term of the PPP loans on balance sheet.
2. H1 21 LuM includes £333m PPP loans3. Geographic segment growth stated in local currency to eliminate FX variations
YoYgrowth³
(34)%(43)% (42)%(15)%(9)%(11)%3% 28% 67%
410
171
247
H1 20 H2 20 H1 21
38.0
25.0 20.2
H1 20 H2 20 H1 21
904
759 733
H1 20 H2 20 H1 21

201. Adjusted EBITDA “AEBITDA” represents EBITDA (Earnings before Interest, Tax, Depreciation and Amortisation) excluding share-based payments, exceptional items and foreign exchange gains or losses
Margin 58%(142)% (33)% (186)% (52)% 19%
(54.1)
(8.3)
11.8
H1 20 H2 20 H1 21
(70.7)
(12.9)
3.8
H1 20 H2 20 H1 21

3,722 4,214
4,933
H1 20 H2 20 H1 21
211. Total income is defined as fee income and investment income less investment expense and before non-cash fair value gains/losses
33%13% 47%41% 26% 19%YoY
growth5% (7)% 24%
1,112
1,630 1,635
H1 20 H2 20 H1 21
36.4 29.9 26.1
64.8 90.9 94.5
101.2
120.8 120.6
H1 20 H2 20 H1 21
Investment Income Operating Income

22
1. Adjusted EBITDA represents EBITDA (Earnings before Interest, Tax, Depreciation and Amortisation) excluding share-based payments, exceptional items and foreign exchange gains or losses. Investment AEBITDA represents investment income, investment expense and fair value adjustments and operating AEBITDA represents AEBITDA excluding investment AEBITDA
Margin 44%(83)% 17% (112)% 6% 29%
(113.5)
7.2
35.5
H1 20 H2 20 H1 21
(24.4)
12.6 19.1
(59.7)
7.7
34.2
(84.1)
20.3
53.3
H1 20 H2 20 H1 21
Operating Investment
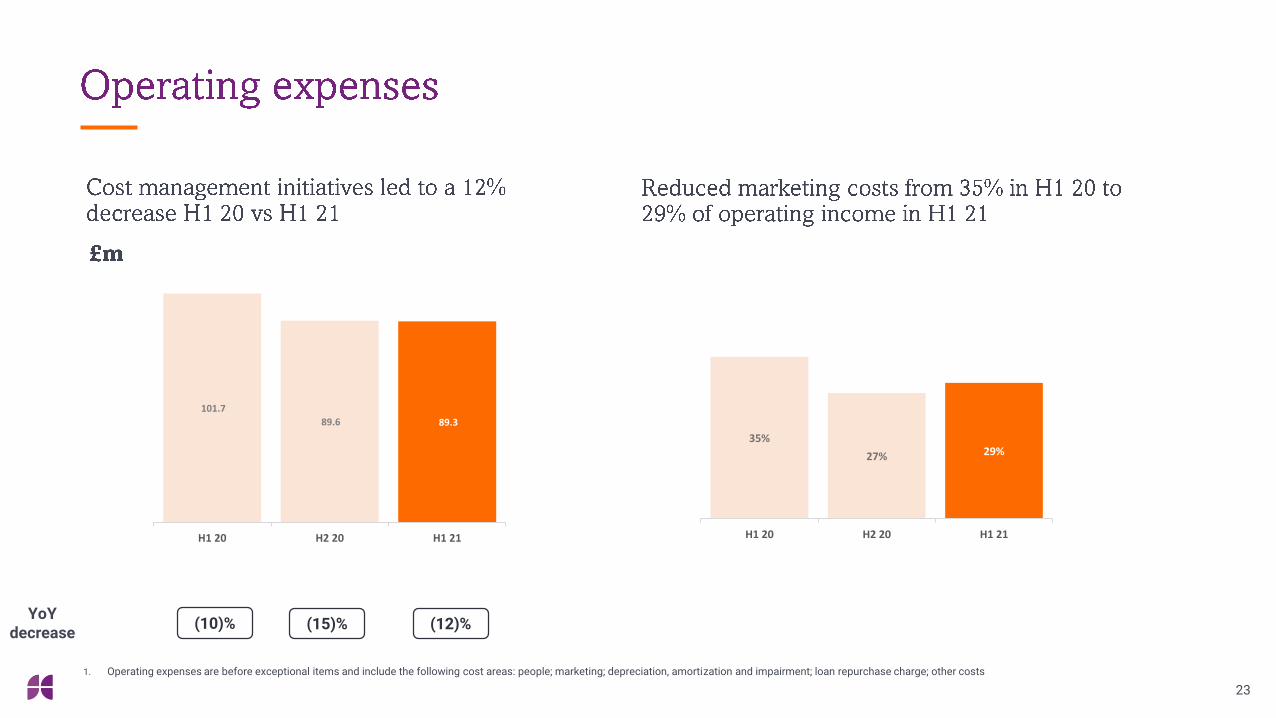
35%
27% 29%
0%
10%
20%
30%
40%
50%
60%
70%
H1 20 H2 20 H1 21
101.7
89.6 89.3
-
20.0
40.0
60.0
80.0
100.0
120.0
140.0
H1 20 H2 20 H1 21
23
(15)% (12)%
1. Operating expenses are before exceptional items and include the following cost areas: people; marketing; depreciation, amortization and impairment; loan repurchase charge; other costs
YoYdecrease
(10)%

216.9 217.6
254.1
0.0
50.0
100.0
150.0
200.0
250.0
300.0
350.0
400.0
H1 20 H2 20 H1 21
24
+£37m¹
• Funding Circle deploys its equity where it makes the
platform stronger. This may include limited co-investment
and investment in new products.
• We see the ability to do this as a source of competitive
advantage. We don't deploy capital with the sole purpose of
deepening profit through investment returns.
• Absolute equity invested at Jun-21 of £105m is in-line with
the guardrail we communicated at the FY results of being
within the Dec-20 absolute level of £118m.
• We intend to re-cycle the investments over time as
opportunity for realisations allow and we will continue to
leverage some of our co-investments where appropriate.
This is demonstrated by the sale of the US warehouses in
Jun-21. 1. £37m equates to £33.4m profit for H1 2021, plus share awards of £3.5m, minus FX of £0.4m

26
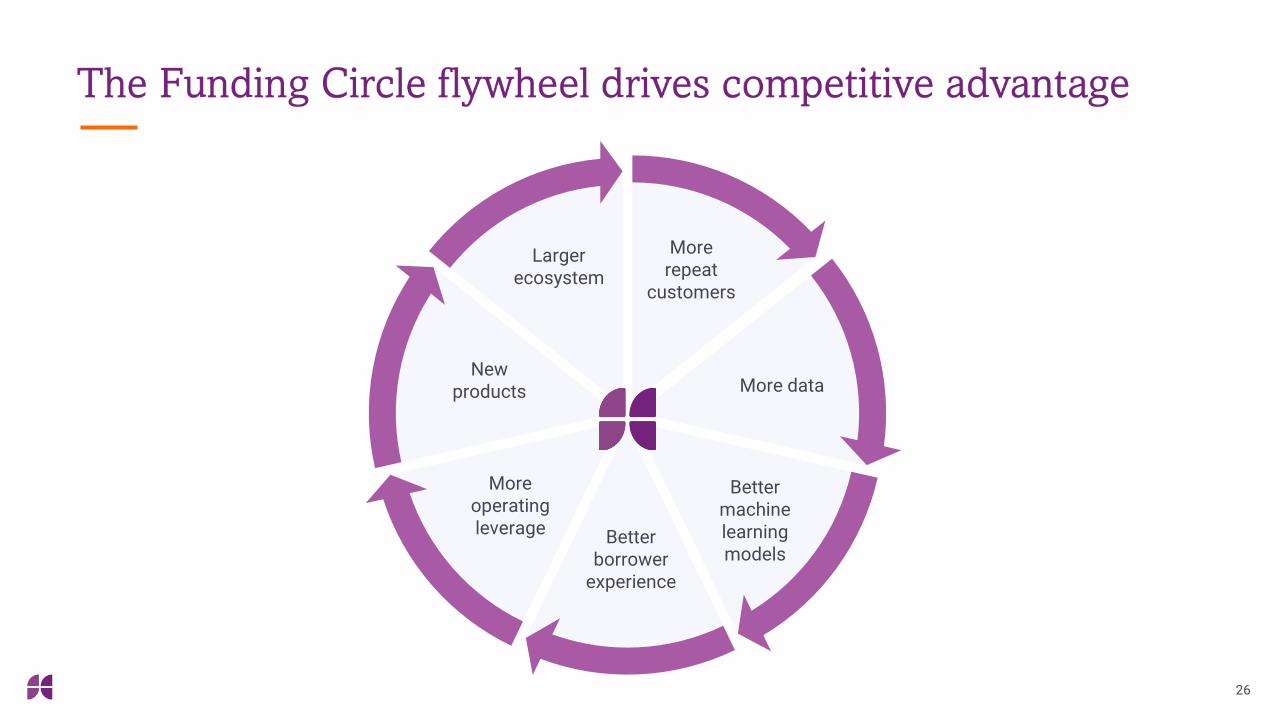
More data
More repeat
customers
Better machine learning models
More operating leverage Better
borrower experience
New products
Larger ecosystem

27
• Core loans for borrowers that do not require a guarantee.
• Operate Recovery Loan Scheme for other borrowers.
• Launch new products using technology platform.
• Core loans for borrowers that do not require a guarantee.
• Originate permanent government guarantee loans on behalf of banks.
• Continue to operate our referral model for other borrower needs.
28
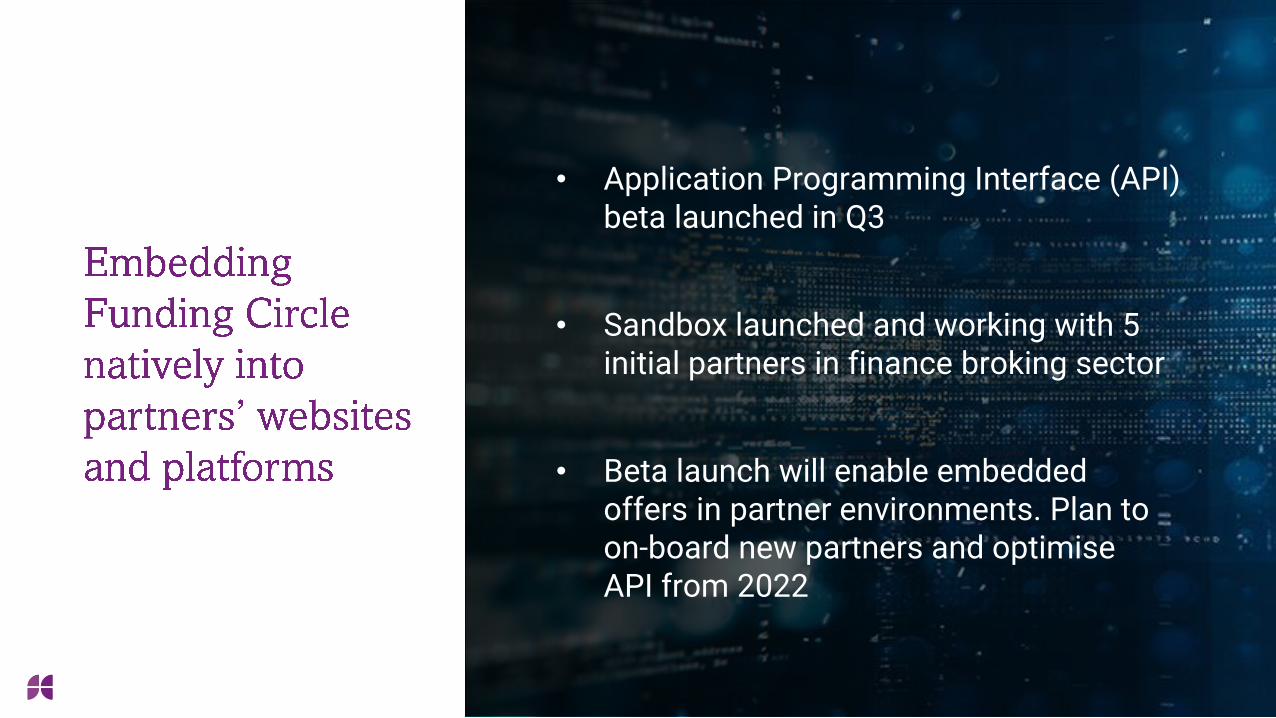
• Beta launch will enable embedded offers in partner environments. Plan to on-board new partners and optimise API from 2022
• Application Programming Interface (API) beta launched in Q3
• Sandbox launched and working with 5 initial partners in finance broking sector
29
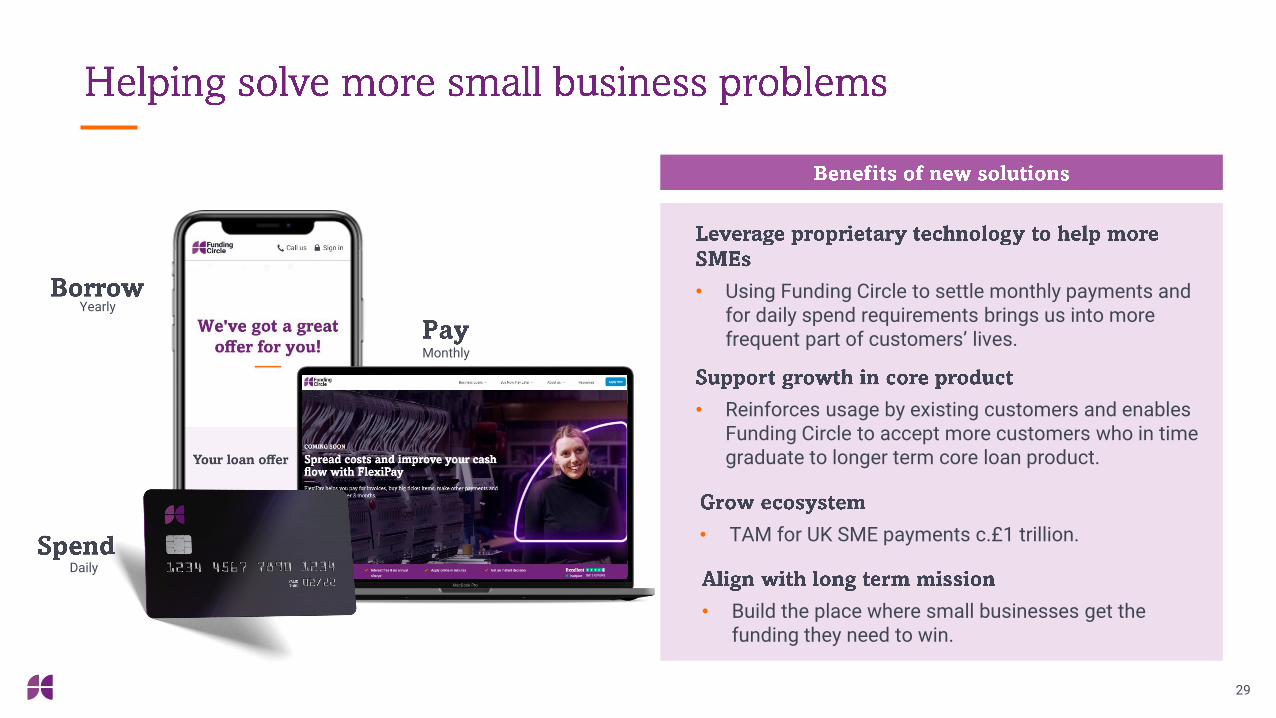
• Using Funding Circle to settle monthly payments and for daily spend requirements brings us into more frequent part of customers’ lives.
• Reinforces usage by existing customers and enables Funding Circle to accept more customers who in time graduate to longer term core loan product.
• TAM for UK SME payments c.£1 trillion.
• Build the place where small businesses get the funding they need to win.
Yearly
Monthly
Daily

NEW
30
• Unique BNPL1 product for spreading the cost of paying invoices
• Instant ability to settle invoices, one-off 3% fee and then spread the repayment over 3 months interest free
• Running in beta phase for existing borrowers
1. Buy Now Pay Later

31

NEW
32
• 1% cashback and nothing to pay for one month
• Opportunity to settle the balance in full at the end of the month or spread the repayment FlexiPay
• Wait list now open, roll out in 2022

33
Full year outlook:
• The business performed strongly in H1 2021 and the financial performance was above expectations.
• We remain mindful of the uncertain economic environment. In line with our expectations, there has been
an initial reduction in lending as we have transitioned to operating our core loan product alongside
government guarantee programmes in the UK and the US.
• As the economic environment becomes clearer we anticipate an acceleration in lending and are well
placed to capture this going forward.
• We continue to expect AEBITDA will be skewed towards H1 with an expectation of H2 AEBITDA profit in
the low single digit millions.

34
• Group: powered by UK, we expect to be AEBITDA profitable on an ongoing basis and will invest in additional growth opportunities.
• UK: represented c.80% of Group total income in H1 2021. The business continues to offer operational leverage, is AEBITDA and Operating Profit profitable (and has been AEBITDA profitable since 2018), and cash generative.
• Strong growth opportunities in core market over the medium term.
• US: The US is 5x the size of the UK market, but at an earlier stage of development. PPP provided a boost to volumes and revenues in H1 2021. Post PPP as we invest to grow market share, the US will likely be AEBITDA loss making for the next few years. We will carefully manage the level of investment.
• New products: there is a big but early stage opportunity to support more customers by leveraging our technology platform. We announced the beta launch of FlexiPay. These new products will generate a small income contribution initially; stepping up in the future following successful roll out.


*maturity of 2 years if loan issued prior to June 5 2020 37
• CBILS started in March 2020. Loans available up to £5 million, available on repayment terms of up to six years. No personal guarantees for facilities under £250,000.
• The scheme provides the lender with an 80% government-backed guarantee against the outstanding balance of the finance. The borrower remains 100% liable for the debt.
• The Government pays the first year’s interest and fees to the borrower, known as a Business Interruption Payment (BIP).
• Lenders pay a guarantee fee to participate on the scheme.
• CBILS applications ended on 31 March 2021, with ongoing fulfilment in Q2.
• RLS launched in April 2021 with loans available up to £10 million on repayment terms of up to six years. No personal guarantees for facilities under £250,000.
• The scheme provides the lender with an 80% government-backed guarantee against the outstanding balance of the finance.
• Businesses are required to meet the costs of interest payments and any fees associated with the facility.
• Borrowers can have existing CBILS/BBLS facilities.
• Lenders pay a guarantee fee to participate on the scheme.
• The scheme is initially set to run until 31 December 2021, subject to review.
• PPP originally ran April-August 2020 and then restarted in January 2021.
• Loans are designed to help businesses keep their workforce employed during Covid.
• These loans have an interest rate of 1% and maturity of 5 years*.
• PPP loans are 100% forgivable if all employee retention criteria are met and the funds are used for eligible purposes.
• SBA pays the lender an origination fee that is a % of the loan amount accessed.
• PPP ended in May 2021.

38
1. Exceptional items related to US lease exit £3.9m
H1 2020 H2 2020 H1 2021
Total TotalBefore
exceptional items Exceptional items Total
£m £m £m £m £m
Transaction fees 47.8 74.7 70.5 70.5
Servicing fees 13.8 16.4 21.9 21.9
Other fees 3.2 (0.2) 2.1 2.1
Operating income 64.8 90.9 94.5 - 94.5
Investment income 49.8 39.2 33.5 33.5
Investment expense (13.4) (9.3) (7.4) (7.4)
Total income 101.2 120.8 120.6 - 120.6
Fair value (losses)/gains (96.1) (22.2) 8.1 8.1
Net income 5.1 98.6 128.7 - 128.7
People costs (48.3) (37.0) (39.4) (39.4)
Marketing costs (22.4) (24.4) (27.4) (27.4)
Depreciation, amortisation and impairment (20.6) (10.3) (8.3) (3.9) (12.2)
Loan repurchase charge (5.5) (0.7) (0.1) (0.1)
Other costs (21.8) (19.0) (14.1) (14.1)
Operating expenses (118.6) (91.4) (89.3) (3.9) (93.2)
Operating profit (loss) (113.5) 7.2 39.4 (3.9) 35.5
Finance income 0.3 0.1 0.1 0.1
Finance costs (0.8) (0.6) (0.6) (0.6)
Share of net loss of associates (1.1) 0.3 0.4 0.4
Profit (Loss) before taxation (115.1) 7.0 39.3 (3.9) 35.4

39
1. Total income is defined as fee income and investment income less investment expense and before non-cash fair value gains/losses2. Adjusted EBITDA represents EBITDA (Earnings before Interest, Tax, Depreciation and Amortisation) excluding share-based payments, exceptional items and foreign exchange gains or losses. Investment AEBITDA represents
investment income, investment expense and fair value adjustments and operating AEBITDA represents AEBITDA excluding investment AEBITDA
H1 2020 H2 2020 H1 2021
Operating Investment Total Operating Investment Total Operating Investment Total
GroupIncome 64.8 36.4 101.2 90.9 29.9 120.8 94.5 26.1 120.6
AEBITDA (24.4) (59.7) (84.1) 12.6 7.7 20.3 19.1 34.2 53.3
UKIncome 43.3 16.0 59.3 80.6 13.0 93.5 85.8 13.0 98.8
AEBITDA (3.3) (18.8) (22.1) 24.8 3.9 28.6 27.7 13.3 41.0
USIncome 17.6 20.4 38.0 8.1 16.9 25.0 7.1 13.1 20.2
AEBITDA (13.2) (40.9) (54.1) (12.1) 3.9 (8.2) (9.1) 20.9 11.8
DMIncome 3.9 - 3.9 2.2 - 2.2 1.6 - 1.6
AEBITDA (7.9) - (7.9) - - - 0.5 - 0.5
Segment profit H1 2020 H2 2020 H1 2021
United Kingdom
United States
Developing Markets
TotalUnited
KingdomUnited States
Developing Markets
TotalUnited
KingdomUnited States
Developing Markets
Total
Adjusted EBITDA (22.1) (54.1) (7.9) (84.1) 28.6 (8.3) - 20.3 41.0 11.8 0.5 53.3
Depreciation and amortisation (4.1) (3.4) (0.7) (8.2) (5.3) (3.1) (0.6) (9.0) (5.6) (2.7) - (8.3)
Share-based payments and social security costs (3.0) (1.2) (0.1) (4.3) (2.0) 0.0 (0.3) (2.3) (4.2) (0.6) - (4.8)
Foreign exchange losses (0.8) - (0.8)
Exceptional items - (12.0) (4.9) (16.9) - (1.5) (0.3) (1.8) - (3.9) - (3.9)
Operating profit / (loss) (29.2) (70.7) (13.6) (113.5) 21.3 (12.9) (1.2) 7.2 31.2 3.8 0.5 35.5

40Source: Funding Circle. Annualised lifetime returns ranges are show as net returns, which is calculated as gross yield minus servicing fee and bad debt (actual and forecast)
Cohort 2015 2016 2017 2018 2019 2020 2021
UK 6.6% - 6.7% 4.7% - 5.1% 3.3% - 3.8% 2.0% - 3.0% 2.1% - 3.1% 4.5% - 5.5% 5.1% - 6.1%
US 2.6% - 2.8% 4.0% - 4.2% 4.1% - 4.6% 1.7% - 2.7% 1.6% - 2.7% 2.5% - 3.1% 2.3% - 2.5%

41
Investment AEBITDA impact: (£52)m
Investment AEBITDA impact: £34m
1. Downside and upside scenarios reflect scenarios for planning purposes and are based on higher/lower default stress assumptions which decrease/increase future projected cash flows. Only default assumptions are stressed and other variables such as discount rate remain static. No change for downside / upside valuation for Co-investments and Other investments, and PPP, as these investments have lower volatility.
£m
Investment as shown on Balance Sheet (“Committed Capital”) Downside / upside on valuation1
Dec-19Additional
investment / withdrawals
Investment income
Fair value adjustment
Dec-20Additional
investment / withdrawals
Investment income
Fair value adjustment
Jun-21Estimated
future cash flowsDownside Upside 1 Upside 2
Vertical securitisation retention
13 (1) - - 12 (4). - - 8 8 8 8 9
Co-investments-
21- -
21 13. 3. - 37 37 37 37 51
Other investments and PPP
13 (2) - - 11 (1). - - 10 10 10 10 11
Warehouses 94 (10) 28 (42). 70 (48). 10. 5. 37 31 39 41 42
Horizontal securitisation retention
25 17 38 (76). 4 (6). 13. 3. 13 7 16 20 18
Invested 145 25 66 (118). 118 (46). 26. 8. 105 92 110 116 130

As at 30June 2021
As at 31 December
2020
As at 30 June2020
Trading business
Investments in PPP
Warehouses Securitisations
1
Investments in trusts and co-investments
Other² Total Total Total
£m £m £m £m £m £m £m £m £m
Investment in SME loans 0.7 226.5 108.8 207.1 37.0 9.7 589.8 558.8 758.6
Cash & cash equivalents 134.2 0.8 9.5 15.7 7.9 168.1 103.3 131.2
Other assets - 1.0 - 2.7 (7.9) - (4.2) 11.1 13.3
Borrowings/bonds - (228.3) (81.3) (204.1) - - (513.7) (489.8) (717.4)
CASH & INVESTMENTS 134.9 - 37.0 21.4 37.0 9.7 240.0 183.4 185.7
Other assets 95.3 - - - - - 95.3 109.0 102.0
Other liabilities (81.2) - - - - - (81.2) (74.8) (70.8)
NET ASSETS 149.0 - 37.0 21.4 37.0 9.7 254.1 217.6 216.9
Investments of £105mOur intention remains to sell elements of the warehouses and securitisations investments when appropriate
42* All investments in warehouses and securitisations are bankruptcy remote from the core business1. Securitisations include vertical tranche of £8m and horizontal tranche of £13m2. Other includes £9.7m investment in Private Funds

43
£m H1 20 H2 20 H1 21
Net Assets b/f 319.0 216.9 217.6
Profit/(Loss) for year (115.2) 6.9 33.4
FX 8.7 (7.0) (0.4)
Issue of share capital 0.3 - 0.3 Employee share schemes 4.1 0.8 3.2 Net Assets c/f 216.9 217.6 254.1

44
H2 2020 H1 2021
Operating Investment Operating Investment
AEBITDA 12.6 7.7 19.1 34.2
Payment of lease liabilities (4.3) - (3.8) -
Purchase of tangible/intangible assets (4.4) - (4.6) -
Fair value adjustments - 22.2 - (8.1)
Working capital/other (8.8) - 29.0 -
Free cash flow (FCF) (4.9) 29.9 39.7 26.1
1. Adjusted EBITDA “AEBITDA” represents EBITDA (Earnings before Interest, Tax, Depreciation and Amortisation) excluding share-based payments, exceptional items and foreign exchange gains or losses2. Free Cash Flow represents net cash flows from operating and investment activities, including the payment of lease liabilities, but excludes net investment in new products and is stated before financing activities3. Other and FX is £(2.6)m in H2 2020 and £nil in H1 2021
Positive operating FCF in H2 2020 once CBILS payment
received from UK government (paid quarterly in arrears).
1
1

45
Information regarding forward-looking statements
This Presentation includes forward-looking statements. These forward-looking statements involve known and unknown risks and uncertainties, many of which are beyond the Group’s control and all of which are based on the Group’s current beliefs and expectations about future events.
Forward-looking statements are sometimes identified by the use of forward-looking terminology such as “believe”, “expects”, “may”, “will”, “could”, “should”, “shall”, “risk”, “intends”, “estimates”, “aims”, “plans”, “predicts”, “continues”, “assumes”, “positioned”, “anticipates” or “targets” or the negative thereof, other variations thereon or comparable terminology. These forward-looking statements include all matters that are not historical facts. They appear in a number of places throughout this Presentation and include statements regarding the intentions, beliefs or current expectations of the Group concerning, among other things, the future results of operations, financial condition, prospects, growth, strategies, and dividend policy of the Group and the industry in which it operates.
These forward-looking statements and other statements contained in this Presentation regarding matters that are not historical facts involve predictions. No assurance can be given that such future results will be achieved; actual events or results may differ materially as a result of risks and uncertainties facing the Group. Such risks and uncertainties could cause actual results to vary materially from the future results indicated, expressed, or implied in such forward-looking statements.
Such forward-looking statements contained in this Presentation speak only as of its date. The Group expressly disclaims any obligation or undertaking to update these forward-looking statements contained in the document to reflect any change in its expectations or any change in events, conditions, or circumstances on which such statements are based unless required to do so by applicable law, the Listing Rules, the Disclosure Guidance and Transparency Rules of the FCA or the Market Abuse Regulation.