Results for S A N S 2 0 0 8 Calendar Year 2008 · 15 GIAC certifications among the top 15 very...
20
Results for Calendar Year 2008 SANS 2008
Transcript of Results for S A N S 2 0 0 8 Calendar Year 2008 · 15 GIAC certifications among the top 15 very...

Results
for
Calendar
Year
2008
S A N S 2 0 0 8
Executive Summary
SANS 2008 Salary and Certification Survey
The SANS 2008 Salary and Certification Survey was conducted by Rob Kolstad of Delos Enterprises on behalf of the SANS Institute to examine salaries, the importance of certifications, and education trends among information security profession-als as well as to present an outlook for 2009. The survey was conducted online in November, 2008 with a total of 2,120 respondents from a variety of industries.
New additions to the SANS Salary Survey include a detailed analysis of the most important certifications in the information security industry as well as a comprehensive examination of both formal and informal training.
This year’s survey is divided into five sections: Demographics, Salary, Certifications, Continuing Education and a Twelve-month Outlook. Essential findings from the survey:
Salaries for information security professionals are high. Only 1.65% of respondents earn less than US $40,000 per year and over 38% earn US $100,000 or more per year.
81% of respondents with hiring responsibilities consider certification a factor in their hiring decisions.
41% of the respondents said their organizations use certifications as a factor when determining salary increases.
In an overall certification assessment, 11 GIAC certifications were ranked in the top 15 very important certifications in the industry.
The most experienced security professionals (those with 20+ years in the industry) ranked 15 GIAC certifications among the top 15 very important certifications.
The overall mean funding for training was US $2,854 per year with a median of US $2,000 per year.
Digital forensics, intrusion detection, and penetration testing are the technical topics respondents are most interested in learning in 2009.
As of late November 2008, just over 79% of respondents forecast no information security personnel reductions in the next 12 months.
Over 25% of respondents plan to deploy the following technologies in 2009:• Configuration Management• SIEM (Security Information and Event
Management)• Storage Security• Wireless Security Solutions
The top five reasons security professionals stay with their current employer:• Benefits (66%)• Flexible hours (51%)• Salary/compensation (50%)• Job security (49%)• Challenge (43%)
The top five reasons security professionals would consider changing jobs:• Salary/compensation (78%)• Challenge (55%)• Benefits (53%)• Bonuses (52%)• Job security (52%)
The best places to find an information security position are in the metro areas of Las Vegas, Nevada; Dallas, Texas; and Washington, DC.

I. Demographics
1 SANS 2008 Salary and Certification Survey 1
The demographics section examines respon-dents’ gender, industry, title, metro area, educa-tion, employer’s annual revenue, number of employees, years of experience, and years with current employer.
We began by asking the gender of those who participated in the survey. It came as no surprise to learn that information security remains a male-dominated industry. Only 1/6 of the respondents were female.
45 industries were represented in this survey, but the majority of respondents came from the categories of Finance, Education, Government, Healthcare, and Manufacturing.
The information technology field has a multitude of job titles, however this survey concentrated on the 54 (general) titles. The most popular were Security Engineer/Architect (12%) followed by Information Security Analyst (12%), IT Director (9%), Systems Administrator (7%), Information Security Officer, Security Director (6%), and Network Administrator (6%).
Annual Revenue
Both small and large companies were repre-sented in the survey, with the largest number of respondents categorizing their company as earning $1- $4 billion in annual revenue:
GenderGender # Resp % Resp
Men 1752 82.6%Women 368 17.4%
IndustryTitle % Resp
Banking • Finance • Insurance 14.4%Education 12.5%Government (Non-Military) 7.8%Government - Contracting 7.0%Healthcare • Medicine 6.7%Government (Military) 4.6%Manufacturing 4.2%
Job TitlesTitle % Resp
Security Engineering • Architect 12.2%Information Security Analyst • Specialist 11.6%IT Director • Manager 8.6%Systems Administrator 7.2%Information Security Officer 5.6%Network Administrator 5.5%Systems Engineer 4.4%Analyst 4.1%Security Administrator 3.4%Auditor 2.8%Chief Information Security Officer 2.2%Security Auditor 2.1%Director of Security 1.7%Network Manager 1.7%Project Leader 1.7%Applications Programmer 1.4%Engineer 1.2%Forensic • Pen Test • Intrusion Detection Analyst 1.2%Network Architect 1.1%

I. Demographics (Continued)
2 SANS 2008 Salary and Certification Survey 2
Number of Employees
The number of employees at respondents’ organizations also ranged from small to large, with the highest concentration having 10,000-40,000 total employees:
College education is the rule of the day for this survey’s respondents. Over three-quarters have at least a Bachelor’s Degree; over a quarter have a Master’s Degree or Ph.D.
85% of the people who participated in this survey reside in one of 20 metropolitan areas; the highest concentration of respondents was 10% from the Washington, DC metro area.
Metropolitan AreasMetro Area % Resp
Washington, DC 10.0%San Francisco • San Jose • Silicon Valley, CA 4.1%Chicago, IL 3.8%Denver, CO 3.7%New York, NY 3.6%Boston, MA 3.5%Dallas, TX 3.3%Philadelphia, PA 3.0%Atlanta, GA 2.9%Los Angeles • Orange County, CA 2.5%Seattle • Redmond, WA 2.1%Research Triangle, NC 2.0%Phoenix, AZ 1.9%San Diego, CA 1.5%Austin, TX 1.4%Houston, TX 1.4%Minneapolis, MN 1.0%San Antonio, TX 0.9%Portland, OR 0.8%Las Vegas, NV 0.7%
Respondent’s Level of EducationEducation Level % Resp
High School Diploma 2.5%Associate’s Degree 6.6%Some College • Technical School 15.8%Bachelor’s Degree 33.4%Some Post Bachelors Studies 14.2%Master’s Degree 25.8%Ph.D. 1.7%

II. Salaries
3 SANS 2008 Salary and Certification Survey 3
The statistics include only salaries in the range of US$10,000-$250,000 per year since including salaries above $250,000 in the calcula-tions creates results that do not represent the majority of respondents.
This year’s survey reveals that information security professionals earn well over the national average salary of $37,440 for US workers. Only 1.65% of respondents earn less than US$40,000 annually while over 38% earn US$100,000 or more per year. The chart on the right shows the distribution of salaries, which includes those at the entry-level to those with 20 years or more of experience.
Experience is a key factor in determining salaries. The chart below breaks down overall salary by experience.
Salary vs. Years of ExperienceYears’ Exp # Resp % Resp
0 – 2.99 71,902 8.1%3 – 4.99 77,558 10.5%5 – 6.99 87,505 15.5%7 – 8.99 94,413 15.0%9 – 10.99 96,291 18.0%11 – 15.99 104,136 18.6%16 – 19.99 108,877 4.0%20+ 107,725 10.2%
Which information security titles earn the highest salaries? The chart below breaks down salaries by title and years of experience. Ranking is based on an experience weighted estimated salary for five years of experience. An intriguing observation is of the 23 titles identified, 10 earn a six-figure salary.
Salary vs. Title Salary by Years’ Experience
Title 0 – 4 5 – 9 10+ 5-Yr Avg
Senior Security Executive — — 160,600 138,534Chief Information Officer — 136,857 141,750 129,080VP (any division) 116,500 122,500# 143,418 124,146Sales • Account Manager 65,000 95,000# 154,838 119,739Director of Security — 112,909 125,165 109,567Chief Information Security Officer 87,750 109,376 126,296 108,427Security Director • Manager 98,566 106,928 117,202 105,063Engineer 100,000 108,333 116,968 104,486Audit Director — 98,500 117,701 100,979Security Engineer • Architect 84,600 96,521 113,843 97,534Systems Engineer 87,588 97,098 106,075 94,729Network Architect 74,142 108,166 108,538 93,187Penetration Tester — 101,000 101,483 92,924IT Director • Manager 75,758 95,061 102,071 90,437Information Security Officer 76,841 90,881 98,661 87,937Forensic • Pen Test • Intrusion Detection Analyst 56,166 77,033 111,166 87,330Security Auditor 72,489 91,858 95,987 86,796Information Security Analyst • Admin • Specialist 71,627 87,427 94,339 84,184Auditor 73,588 81,676 85,829 81,134Analyst 69,279 79,288 83,724 77,750Systems Administrator 60,939 73,664 87,886 74,129Security Administrator 61,643 75,253 82,787 73,235Network Administrator 60,648 70,486 72,276 67,372
II. Salaries (Continued)
4 SANS 2008 Salary and Certification Survey 4
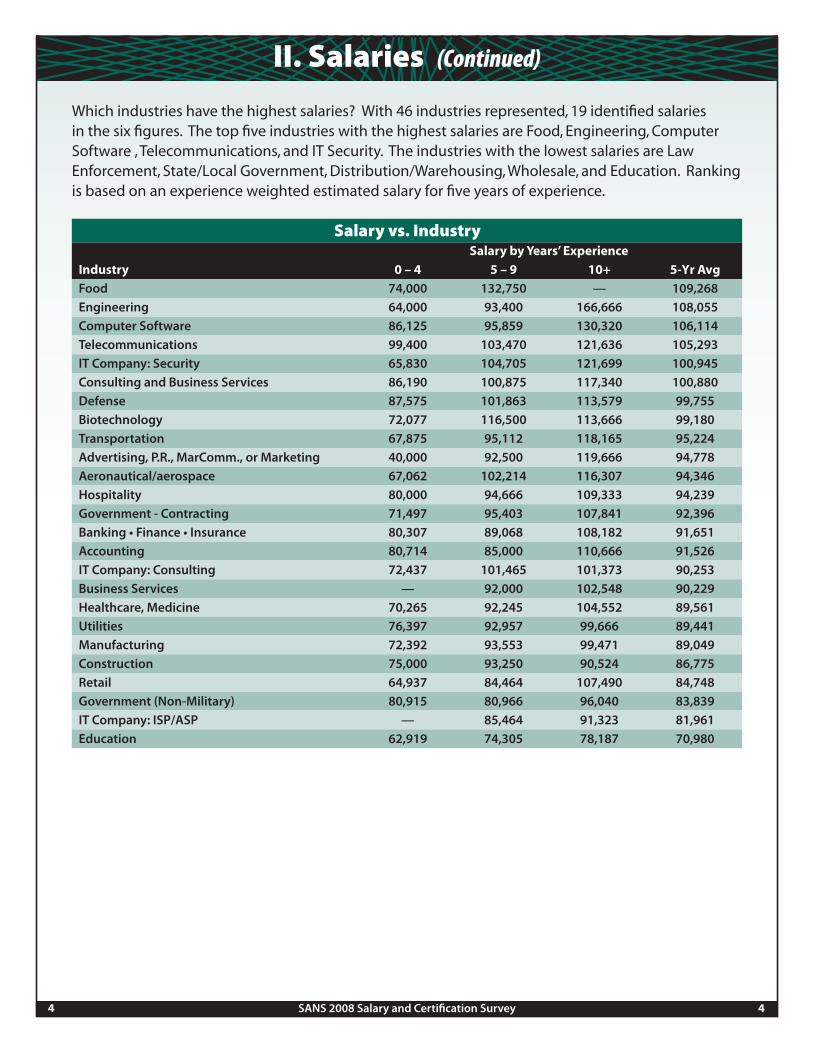
Which industries have the highest salaries? With 46 industries represented, 19 identified salaries in the six figures. The top five industries with the highest salaries are Food, Engineering, Computer Software , Telecommunications, and IT Security. The industries with the lowest salaries are Law Enforcement, State/Local Government, Distribution/Warehousing, Wholesale, and Education. Ranking is based on an experience weighted estimated salary for five years of experience.
Salary vs. Industry Salary by Years’ Experience
Industry 0 – 4 5 – 9 10+ 5-Yr Avg
Food 74,000 132,750 — 109,268Engineering 64,000 93,400 166,666 108,055Computer Software 86,125 95,859 130,320 106,114Telecommunications 99,400 103,470 121,636 105,293IT Company: Security 65,830 104,705 121,699 100,945Consulting and Business Services 86,190 100,875 117,340 100,880Defense 87,575 101,863 113,579 99,755Biotechnology 72,077 116,500 113,666 99,180Transportation 67,875 95,112 118,165 95,224Advertising, P.R., MarComm., or Marketing 40,000 92,500 119,666 94,778Aeronautical/aerospace 67,062 102,214 116,307 94,346Hospitality 80,000 94,666 109,333 94,239Government - Contracting 71,497 95,403 107,841 92,396Banking • Finance • Insurance 80,307 89,068 108,182 91,651Accounting 80,714 85,000 110,666 91,526IT Company: Consulting 72,437 101,465 101,373 90,253Business Services — 92,000 102,548 90,229Healthcare, Medicine 70,265 92,245 104,552 89,561Utilities 76,397 92,957 99,666 89,441Manufacturing 72,392 93,553 99,471 89,049Construction 75,000 93,250 90,524 86,775Retail 64,937 84,464 107,490 84,748Government (Non-Military) 80,915 80,966 96,040 83,839IT Company: ISP/ASP — 85,464 91,323 81,961Education 62,919 74,305 78,187 70,980

II. Salaries (Continued)
5 SANS 2008 Salary and Certification Survey 5
Formal education is also a key factor in IT security salaries. 75% of respondents hold a Bachelor’s Degree or higher and those with 0 - 4 years of experience earn an average salary of $74,807.
Salary vs. Education Salary by Years’ Experience
Title 0 – 4 5 – 9 10+
High School Diploma 64,850 85,577 88,721Associates Degree 59,503 83,158 90,389Some College/Technical School 68,529 87,616 94,240Bachelors Degree 74,807 91,541 100,865Some Post Bachelor Studies 75,741 91,100 107,346Masters Degree 83,075 96,531 113,199Ph.D. 124,800 82,127 94,290
In this survey, 20 metro areas were identified and ranked by salary and years of experience. The chart below shows the top 15 areas based on an experience weighted estimated salary for five years of experience.
Salary vs. Metro Area Salary by Years’ Experience
Metro Area 0 – 4 5 – 9 10+ 5-Yr Avg
San Francisco • San Jose • Silicon Valley, CA 88,592 112,730 124,876 108,308Washington, DC 81,505 105,664 118,982 102,553New York 72,890 111,194 120,582 102,286Houston, TX 97,000 104,566 104,833 100,478Chicago, IL 87,629 98,310 116,857 99,996Dallas, TX 86,481 93,318 104,140 93,310Research Triangle, NC 77,937 88,703 112,547 93,237Philadelphia, PA 78,006 93,316 107,766 92,427Las Vegas, NV 74,500 89,100 111,000 90,609Phoenix, AZ 85,333 85,148 104,814 89,979Denver, CO 85,600 92,787 99,490 89,899Atlanta, GA 74,535 88,108 102,839 87,968Toronto, ON 80,002 80,783 103,063 86,338San Antonio, TX 60,530 75,200 122,285 86,191Austin, TX 72,000 83,363 90,156 80,284

III. Certifications
6 SANS 2008 Salary and Certification Survey 6
Certifications do have value for IT security pro-fessionals. Whether you are demonstrating mas-tery of a specific skill or a broad understanding of the field, the benefits of holding certifications are both professional and personal. When asked if their organization uses certifications as a factor when determining salary increases, 41% of the respondents answered yes.
Do certifications help you get a job? This chart shows that 81% of respondents with hiring responsibilities do consider certifications a factor in their hiring decisions.
Very Important
ImportantSomewhat Important
Neither Important nor Unimportant
Not Important
Respondents were asked to rank 63 industry certifications by importance. The chart below shows the top 25 certifications sorted by the “Very Important” column. Four certification bodies hold the top 15 certifications: GIAC (GCIH, GCIA, GCFA, GISP, GSEC, GCFW, GPEN, GCWN, GSE), Cisco (CCNA, CCNP, CCIE), (ISC)2 (CISSP, SSCP), and ISACA (CISA).
Overall Certification Assessments Not A Bit Somewhat Very Certification Important Important Important Important Important
GCIH - GIAC Certified Incident Handler 16.4 25.6 14.4 11.0 32.6Cisco CCNA 11.3 31.9 16.8 8.5 31.5Cisco CCNP 15.8 30.1 15.6 7.9 30.5GCIA - GIAC Certified Intrusion Analyst 16.3 26.4 15.4 11.3 30.5(ISC)2 CISSP 8.6 15.8 8.2 37.6 29.8GCFA - GIAC Certified Forensics Analyst 19.0 26.9 15.7 8.7 29.7CISA (ISACA) 18.8 24.2 14.6 12.9 29.5GPEN - Certified Penetration Tester 19.4 24.9 17.4 9.2 29.1GISP - GIAC Security Professional Certification 15.4 30.4 16.3 8.9 29.0(ISC)2 SSCP 19.3 25.3 15.2 11.8 28.4Cisco CCIE 15.4 24.1 13.5 18.8 28.3GCFW - GIAC Certified Firewall Analyst 17.5 29.0 16.8 8.6 28.1GCWN - GIAC Certified Windows Security Admin 17.9 30.3 17.4 6.5 27.9GSEC - GIAC Security Essentials Certification 14.7 30.0 16.6 10.7 27.9Any GIAC Security Expert 16.8 27.8 16.2 11.9 27.3GSNA - GIAC Systems/Network Auditor Certification 18.7 29.5 18.3 6.8 26.8GISF - GIAC Security Fundamentals Certification 17.0 30.1 19.5 7.3 26.2Any GIAC Software Security 20.0 30.4 19.9 6.2 23.5Cisco CCDP 23.3 28.8 20.2 4.4 23.2GREM - GIAC Reverse-Engineering Certification 26.3 25.0 20.5 6.2 22.0G7799 - GIAC Certified ISO-17799 Specialist 24.4 30.3 17.7 5.9 21.7Other GIAC Audit Certification 24.2 29.1 20.9 4.1 21.7GCPM - GIAC Certified Project Manager 24.1 28.4 21.2 4.8 21.5GSLC - GIAC Security Leadership Certification 21.8 29.9 20.3 6.5 21.5Cisco CCDA 23.7 28.9 22.2 3.9 21.3

III. Certifications (Continued)
7 SANS 2008 Salary and Certification Survey 7
The next two charts reveal the importance of certifications by years of experience. The separations are 1-20 years of experience and 21+ years of experience.
Security professionals with 1 - 20 years of experience rate GIAC’s GCIH number one. 10 other GIAC certifications ranked in the top 15. ISACA’s CISA was ranked number two followed by (ISC)2’s SSCP at number three and CISSP at number 8.
Security Professionals with 1-20 Years of Experience Not A Bit Somewhat Very Certification Important Important Important Important Important
GCIH - GIAC Certified Incident Handler 9.2 24.7 13.0 14.5 38.6CISA (ISACA) 10.4 27.7 12.6 14.0 35.4(ISC)2 SSCP 10.2 25.8 15.1 14.0 35.0GPEN - Certified Penetration Tester 12.0 26.5 16.2 11.5 33.8GCIA - GIAC Certified Intrusion Analyst 9.4 27.4 14.4 15.0 33.7GCFA - GIAC Certified Forensics Analyst 10.6 29.3 15.0 11.5 33.6Any GIAC Security Expert Certification 9.2 27.3 15.7 14.3 33.5(ISC)2 CISSP 2.4 13.7 6.2 45.4 32.2GISP - GIAC Security Professional Certification 8.0 32.9 16.4 11.1 31.5GCFW - GIAC Certified Firewall Analyst 10.8 30.1 16.3 11.7 31.1GSNA - GIAC Systems/Network Auditor Certification 11.2 31.5 18.5 8.4 30.3GSEC - GIAC Security Essentials Certification 7.9 31.0 16.4 14.8 29.9GCWN - GIAC Certified Windows Security Admin 12.3 32.1 18.2 7.8 29.6Cisco CCNP 13.4 33.6 15.4 8.1 29.4Any GIAC Software Security Certification 13.5 31.2 19.0 7.4 29.0Cisco CCNA 10.1 35.4 17.7 8.1 28.8GISF - GIAC Security Fundamentals Certification 10.4 31.1 20.5 9.5 28.5Cisco CCIE 14.7 24.6 12.3 21.1 27.4GREM - GIAC Reverse-Engineering Certification 17.9 27.3 20.7 7.1 27.1Other GIAC Audit Certification 16.8 32.0 20.1 5.5 25.6G7799 - GIAC Certified ISO-17799 Specialist 16.9 32.5 17.6 7.6 25.4GSLC - GIAC Security Leadership Certification 12.5 31.0 22.6 8.8 25.0(ISC)2 Other 17.8 25.7 18.4 13.2 24.9Other GIAC Security Administration Certification 14.1 33.3 23.0 5.6 24.0GCPM - GIAC Certified Project Manager 17.3 29.3 23.3 6.7 23.3
III. Certifications (Continued)
8 SANS 2008 Salary and Certification Survey 8
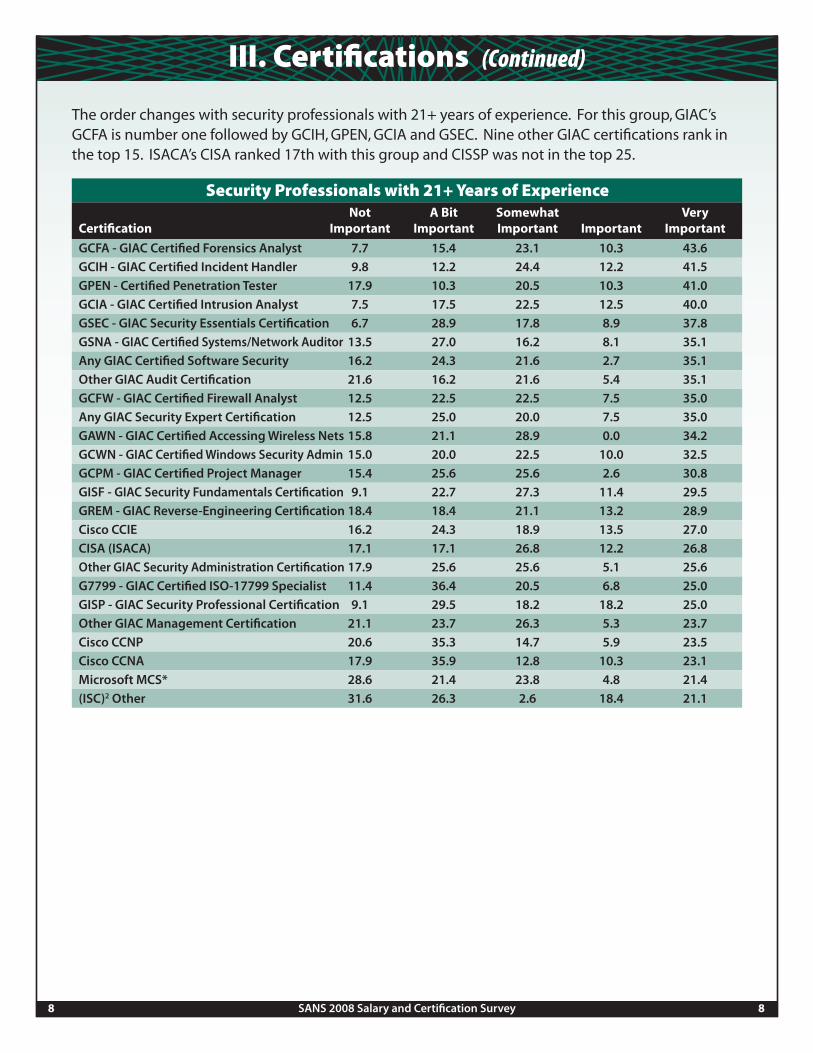
The order changes with security professionals with 21+ years of experience. For this group, GIAC’s GCFA is number one followed by GCIH, GPEN, GCIA and GSEC. Nine other GIAC certifications rank in the top 15. ISACA’s CISA ranked 17th with this group and CISSP was not in the top 25.
Security Professionals with 21+ Years of Experience Not A Bit Somewhat Very Certification Important Important Important Important Important
GCFA - GIAC Certified Forensics Analyst 7.7 15.4 23.1 10.3 43.6GCIH - GIAC Certified Incident Handler 9.8 12.2 24.4 12.2 41.5GPEN - Certified Penetration Tester 17.9 10.3 20.5 10.3 41.0GCIA - GIAC Certified Intrusion Analyst 7.5 17.5 22.5 12.5 40.0GSEC - GIAC Security Essentials Certification 6.7 28.9 17.8 8.9 37.8GSNA - GIAC Certified Systems/Network Auditor 13.5 27.0 16.2 8.1 35.1Any GIAC Certified Software Security 16.2 24.3 21.6 2.7 35.1Other GIAC Audit Certification 21.6 16.2 21.6 5.4 35.1GCFW - GIAC Certified Firewall Analyst 12.5 22.5 22.5 7.5 35.0Any GIAC Security Expert Certification 12.5 25.0 20.0 7.5 35.0GAWN - GIAC Certified Accessing Wireless Nets 15.8 21.1 28.9 0.0 34.2GCWN - GIAC Certified Windows Security Admin 15.0 20.0 22.5 10.0 32.5GCPM - GIAC Certified Project Manager 15.4 25.6 25.6 2.6 30.8GISF - GIAC Security Fundamentals Certification 9.1 22.7 27.3 11.4 29.5GREM - GIAC Reverse-Engineering Certification 18.4 18.4 21.1 13.2 28.9Cisco CCIE 16.2 24.3 18.9 13.5 27.0CISA (ISACA) 17.1 17.1 26.8 12.2 26.8Other GIAC Security Administration Certification 17.9 25.6 25.6 5.1 25.6G7799 - GIAC Certified ISO-17799 Specialist 11.4 36.4 20.5 6.8 25.0GISP - GIAC Security Professional Certification 9.1 29.5 18.2 18.2 25.0Other GIAC Management Certification 21.1 23.7 26.3 5.3 23.7Cisco CCNP 20.6 35.3 14.7 5.9 23.5Cisco CCNA 17.9 35.9 12.8 10.3 23.1Microsoft MCS* 28.6 21.4 23.8 4.8 21.4(ISC)2 Other 31.6 26.3 2.6 18.4 21.1
IV. Continuing Education
9 SANS 2008 Salary and Certification Survey 9
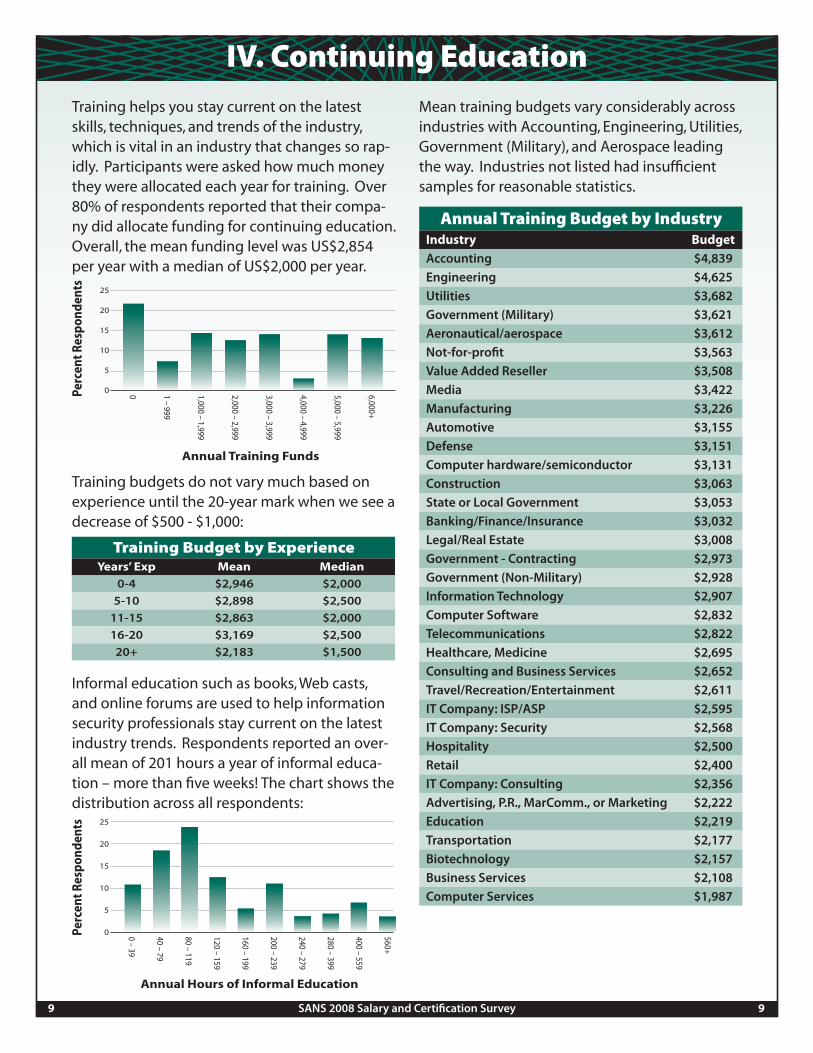
Training helps you stay current on the latest skills, techniques, and trends of the industry, which is vital in an industry that changes so rap-idly. Participants were asked how much money they were allocated each year for training. Over 80% of respondents reported that their compa-ny did allocate funding for continuing education. Overall, the mean funding level was US$2,854 per year with a median of US$2,000 per year.
Training budgets do not vary much based on experience until the 20-year mark when we see a decrease of $500 - $1,000:
Informal education such as books, Web casts, and online forums are used to help information security professionals stay current on the latest industry trends. Respondents reported an over-all mean of 201 hours a year of informal educa-tion – more than five weeks! The chart shows the distribution across all respondents:
Mean training budgets vary considerably across industries with Accounting, Engineering, Utilities, Government (Military), and Aerospace leading the way. Industries not listed had insufficient samples for reasonable statistics.
Training Budget by Experience Years’ Exp Mean Median
0-4 $2,946 $2,000 5-10 $2,898 $2,500 11-15 $2,863 $2,000 16-20 $3,169 $2,500 20+ $2,183 $1,500
Annual Training Budget by IndustryIndustry Budget
Accounting $4,839Engineering $4,625Utilities $3,682Government (Military) $3,621Aeronautical/aerospace $3,612Not-for-profit $3,563Value Added Reseller $3,508Media $3,422Manufacturing $3,226Automotive $3,155Defense $3,151Computer hardware/semiconductor $3,131Construction $3,063State or Local Government $3,053Banking/Finance/Insurance $3,032Legal/Real Estate $3,008Government - Contracting $2,973Government (Non-Military) $2,928Information Technology $2,907Computer Software $2,832Telecommunications $2,822Healthcare, Medicine $2,695Consulting and Business Services $2,652Travel/Recreation/Entertainment $2,611IT Company: ISP/ASP $2,595IT Company: Security $2,568Hospitality $2,500Retail $2,400IT Company: Consulting $2,356Advertising, P.R., MarComm., or Marketing $2,222Education $2,219Transportation $2,177Biotechnology $2,157Business Services $2,108Computer Services $1,987

IV. Continuing Education (Continued)
10 SANS 2008 Salary and Certification Survey 10
Formal training, such as taking courses online or in a classroom, averages 64 hours per year (median=40) over all participants.
There is little variation in the number of formal training hours by years of experience. Security professionals with 0 – 4 , 15 – 19, and 20+ years of experience invest the most time in formal training while those with 10 – 14 years invest the least.
Industries with the highest number of formal training hours are Value-Added Resellers, the Military, and Law Enforcement. These industries receive three times the annual formal training hours as the lowest reported industries:
Annual Formal Training Hours by IndustryIndustry Hours/Year
Value-Added Reseller 97Government (Military) 96Law Enforcement 92Defense 88Aeronautical/aerospace 80Biotechnology 74Accounting 68Not-for-profit 68IT Company: Security 66Government (Non-Military) 65Computer hardware/semiconductor 64Construction 64Telecommunications 63Government - Contracting 62IT Company: Consulting 61Automotive 60Healthcare, Medicine 59Utilities 59Banking/Finance/Insurance 58Business Services 58Engineering 58Food 58Education 57Information Technology 57Manufacturing 56Consulting and Business Services 54Retail 54Other 51Travel/Recreation/Entertainment 51State or Local Government 50Hospitality 49IT Company: ISP/ASP 48Legal/Real Estate 48Computer Services 47Media 47Computer Software 44Transportation 44Advertising, P.R., MarComm., or Marketing 32IT Company: Other 32
IV. Continuing Education (Continued)
11 SANS 2008 Salary and Certification Survey 11
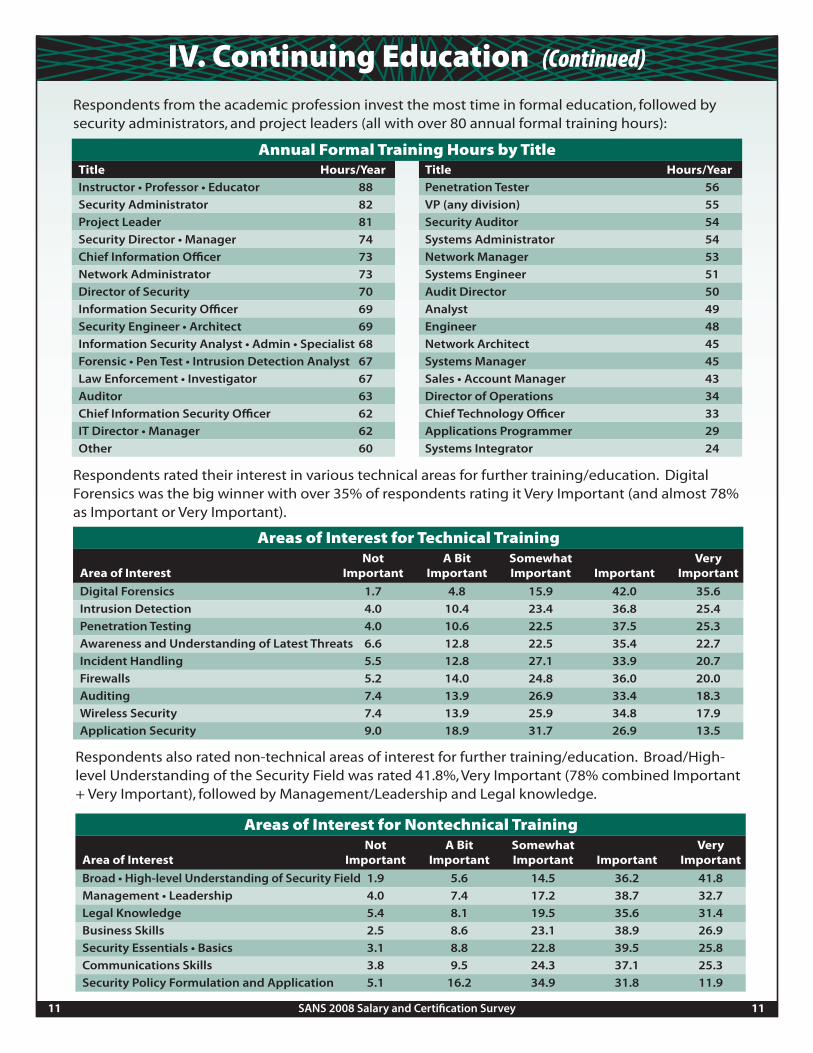
Respondents from the academic profession invest the most time in formal education, followed by security administrators, and project leaders (all with over 80 annual formal training hours):
Respondents rated their interest in various technical areas for further training/education. Digital Forensics was the big winner with over 35% of respondents rating it Very Important (and almost 78% as Important or Very Important).
Areas of Interest for Technical Training Not A Bit Somewhat Very Area of Interest Important Important Important Important Important
Digital Forensics 1.7 4.8 15.9 42.0 35.6Intrusion Detection 4.0 10.4 23.4 36.8 25.4Penetration Testing 4.0 10.6 22.5 37.5 25.3Awareness and Understanding of Latest Threats 6.6 12.8 22.5 35.4 22.7Incident Handling 5.5 12.8 27.1 33.9 20.7Firewalls 5.2 14.0 24.8 36.0 20.0Auditing 7.4 13.9 26.9 33.4 18.3Wireless Security 7.4 13.9 25.9 34.8 17.9Application Security 9.0 18.9 31.7 26.9 13.5
Annual Formal Training Hours by TitleTitle Hours/Year
Instructor • Professor • Educator 88Security Administrator 82Project Leader 81Security Director • Manager 74Chief Information Officer 73Network Administrator 73Director of Security 70Information Security Officer 69Security Engineer • Architect 69Information Security Analyst • Admin • Specialist 68Forensic • Pen Test • Intrusion Detection Analyst 67Law Enforcement • Investigator 67Auditor 63Chief Information Security Officer 62IT Director • Manager 62Other 60
Title Hours/Year
Penetration Tester 56VP (any division) 55Security Auditor 54Systems Administrator 54Network Manager 53Systems Engineer 51Audit Director 50Analyst 49Engineer 48Network Architect 45Systems Manager 45Sales • Account Manager 43Director of Operations 34Chief Technology Officer 33Applications Programmer 29Systems Integrator 24
Respondents also rated non-technical areas of interest for further training/education. Broad/High-level Understanding of the Security Field was rated 41.8%, Very Important (78% combined Important + Very Important), followed by Management/Leadership and Legal knowledge.
Areas of Interest for Nontechnical Training Not A Bit Somewhat Very Area of Interest Important Important Important Important Important
Broad • High-level Understanding of Security Field 1.9 5.6 14.5 36.2 41.8Management • Leadership 4.0 7.4 17.2 38.7 32.7Legal Knowledge 5.4 8.1 19.5 35.6 31.4Business Skills 2.5 8.6 23.1 38.9 26.9Security Essentials • Basics 3.1 8.8 22.8 39.5 25.8Communications Skills 3.8 9.5 24.3 37.1 25.3Security Policy Formulation and Application 5.1 16.2 34.9 31.8 11.9
V. Twelve-month Outlook
12 SANS 2008 Salary and Certification Survey 12
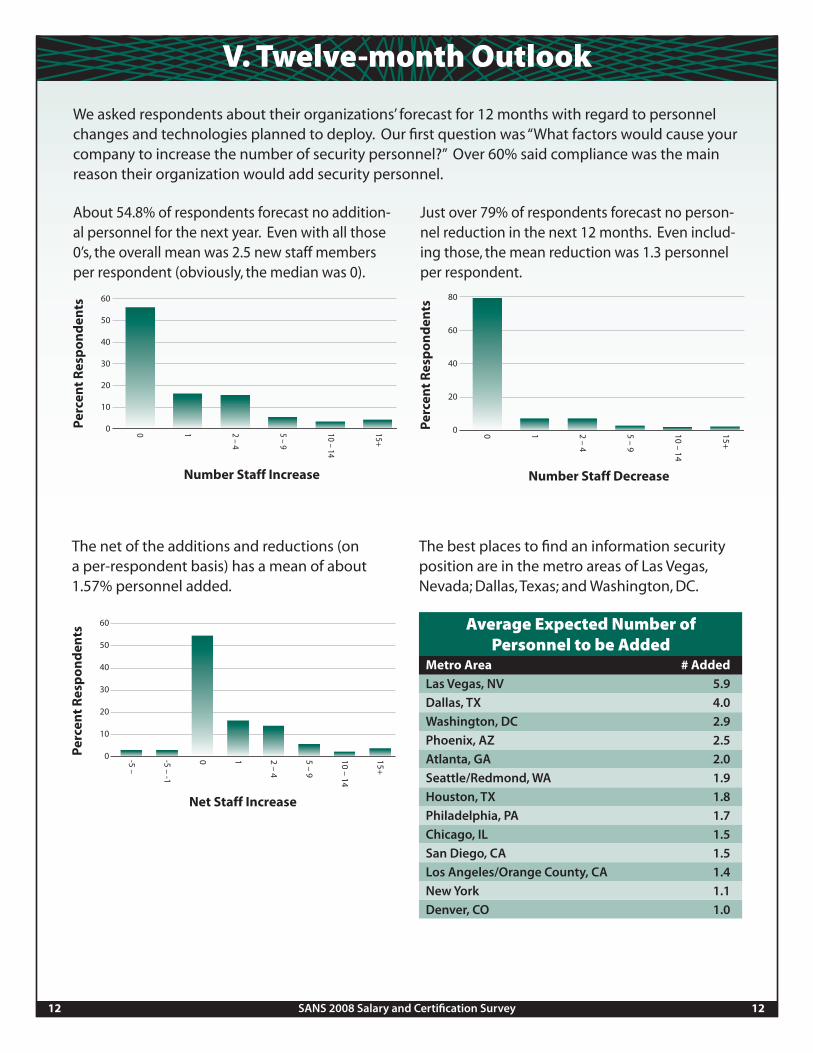
We asked respondents about their organizations’ forecast for 12 months with regard to personnel changes and technologies planned to deploy. Our first question was “What factors would cause your company to increase the number of security personnel?” Over 60% said compliance was the main reason their organization would add security personnel.
About 54.8% of respondents forecast no addition-al personnel for the next year. Even with all those 0’s, the overall mean was 2.5 new staff members per respondent (obviously, the median was 0).
Just over 79% of respondents forecast no person-nel reduction in the next 12 months. Even includ-ing those, the mean reduction was 1.3 personnel per respondent.
The net of the additions and reductions (on a per-respondent basis) has a mean of about 1.57% personnel added.
The best places to find an information security position are in the metro areas of Las Vegas, Nevada; Dallas, Texas; and Washington, DC.
Average Expected Number of Personnel to be Added
Metro Area # Added
Las Vegas, NV 5.9Dallas, TX 4.0Washington, DC 2.9Phoenix, AZ 2.5Atlanta, GA 2.0Seattle/Redmond, WA 1.9Houston, TX 1.8Philadelphia, PA 1.7Chicago, IL 1.5San Diego, CA 1.5Los Angeles/Orange County, CA 1.4New York 1.1Denver, CO 1.0

V. Twelve-month Outlook (Continued)
13 SANS 2008 Salary and Certification Survey 13
Net Personnel Change by IndustryIndustry Net Change
Defense 12.6IT Company: Security 8.4Computer Hardware • Semiconductor 5.9Government (Military) 5.1Aeronautical • Aerospace 4.7Government - Contracting 4.5Hospitality 4.1Information Technology 4.0Accounting 3.0Engineering 2.9Computer Software 2.7Human Resources • Human Capital • Recruiter 2.5IT Company: Consulting 1.7IT Company: Web Development • Webmaster 1.7Value Added Reseller 1.7Government (Non-Military) 1.2Healthcare • Medicine 0.9IT Company: ISP • ASP 0.8Law Enforcement 0.8Retail 0.7Travel • Recreation • Entertainment 0.7Education 0.6Utilities 0.6
Industry Net Change
Automotive 0.5Banking • Finance • Insurance 0.5Construction 0.5Consulting and Business Services 0.5IT Company: Other 0.5Advertising • P.R. • MarComm. • Marketing 0.4Chemical 0.4Manufacturing 0.4Legal/Real Estate 0.3State or Local Government 0.3Broadcasting • Cable • Video 0.2Distribution • Warehousing 0.2Not-for-profit 0.2Environmental Services 0.0Other 0.0Wholesale 0.0Biotechnology -0.4Food -0.4Telecommunications -0.4Media -0.7Transportation -1.5Computer Services -2.2Business Services -3.8
The net staff change varies widely across industries with Defense and IT security the big winners and Computer Services and Business Services the big losers.
V. Twelve-month Outlook (Continued)
14 SANS 2008 Salary and Certification Survey 14
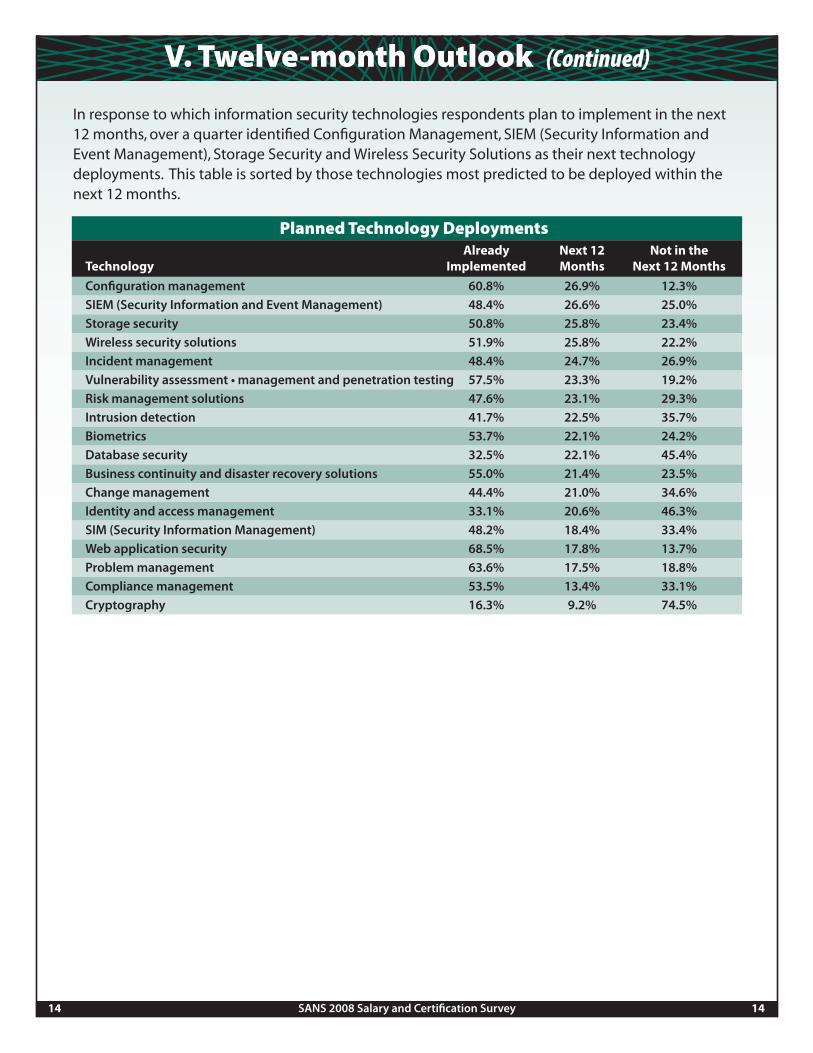
In response to which information security technologies respondents plan to implement in the next 12 months, over a quarter identified Configuration Management, SIEM (Security Information and Event Management), Storage Security and Wireless Security Solutions as their next technology deployments. This table is sorted by those technologies most predicted to be deployed within the next 12 months.
Planned Technology Deployments Already Next 12 Not in the Technology Implemented Months Next 12 Months
Configuration management 60.8% 26.9% 12.3%SIEM (Security Information and Event Management) 48.4% 26.6% 25.0%Storage security 50.8% 25.8% 23.4%Wireless security solutions 51.9% 25.8% 22.2%Incident management 48.4% 24.7% 26.9%Vulnerability assessment • management and penetration testing 57.5% 23.3% 19.2%Risk management solutions 47.6% 23.1% 29.3%Intrusion detection 41.7% 22.5% 35.7%Biometrics 53.7% 22.1% 24.2%Database security 32.5% 22.1% 45.4%Business continuity and disaster recovery solutions 55.0% 21.4% 23.5%Change management 44.4% 21.0% 34.6%Identity and access management 33.1% 20.6% 46.3%SIM (Security Information Management) 48.2% 18.4% 33.4%Web application security 68.5% 17.8% 13.7%Problem management 63.6% 17.5% 18.8%Compliance management 53.5% 13.4% 33.1%Cryptography 16.3% 9.2% 74.5%

V. Twelve-month Outlook (Continued)
15 SANS 2008 Salary and Certification Survey 15
IncentivesWhat incentives do security professionals find valuable? Benefits took the lead with 66%, flexible hours 51%, salary 50%, and stability with 49%. Here’s the complete list of incentives that encourage employees to stay with their current employer:
V. Twelve-month Outlook (Continued)
16 SANS 2008 Salary and Certification Survey 16
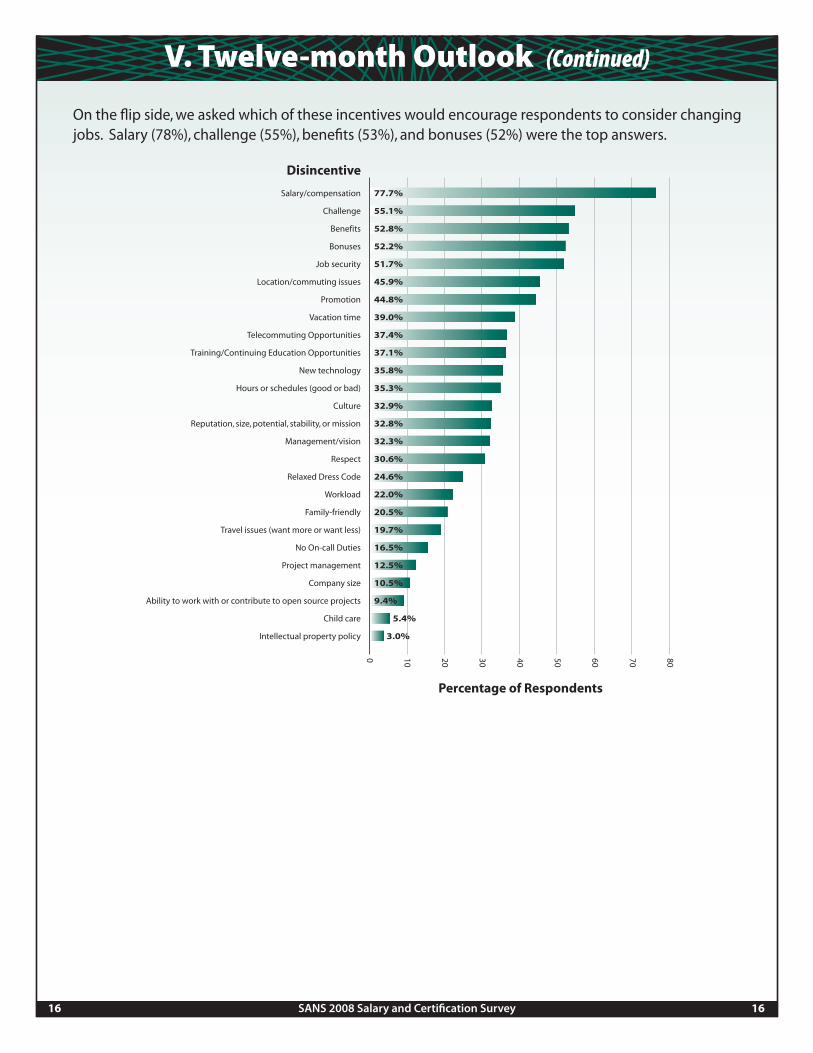
On the flip side, we asked which of these incentives would encourage respondents to consider changing jobs. Salary (78%), challenge (55%), benefits (53%), and bonuses (52%) were the top answers.

V. Twelve-month Outlook (Continued)
17 SANS 2008 Salary and Certification Survey 17
ConclusionDespite the current economy, the demand for qualified information security professionals is predicted to increase through 2016, according to the Bureau of Labor Statistics. Those with formal education and professional certifications have the best opportunities to advance their careers as well as their salaries.
Security threats reached their highest levels in 2008 and are predicted to increase in 2009. With external as well as internal threats, commercial organizations, financial institutions, state and local governments and the military will continue to require qualified information security professionals to protect their systems and data. With an average entry-level (0 - 2 years of experience) salary of $70,807, security professionals are expected to hold a certain level of education, certifications, and experience as well as pursue a variety of informal and formal continuing education efforts to stay current in the industry.
The results of the SANS 2008 Salary and Certification Survey provided the following conclusions:
81% of respondents with hiring responsibilities consider certification a factor in their hiring decisions.
41% of the respondents said their organizations use certifications as a factor when determining salary increases.
In an overall certification assessment, 11 GIAC certifications were ranked in the top 15 very important certifications in the industry.
The most experienced security professionals (those with 20+ years in the industry) ranked 15 GIAC certifications among the top 15 very important certifications.
As of late November 2008, just over 79% of respondents forecast no personnel reductions in the next 12 months.
Formal training, such as taking courses online or in a classroom, averages 64 hours per year (median=40) over all participants.
Formal education is also a key factor in IT security salaries. 75% of respondents hold a Bachelor’s Degree or higher and earn an average entry-level salary of $70,807.00.
SANS is the most trusted & by far the largest source for information security training, certi� cation & research in the world.
SANS 2009Orlando, FL • March 2 - 9, 2009
SANS Phoenix 2009Phoenix, AZ • March 23 - 30, 2009
SANS Calgary 2009Calgary, AB • April 14 - 19, 2009
SANS Tysons Corner 2009Tysons Corner, VA • April 14 - 22, 2009
SANS Security East 2009New Orleans, LA • May 4 - 10, 2009
SANS Toronto 2009Toronto, ON • May 5 - 13, 2009
SANS San Diego 2009San Diego, CA • May 8 - 16, 2009
SANSFIRE 2009Baltimore, MD • June 13 - 22, 2009
SANS Rocky Mountain 2009Denver, CO • July 7 - 15, 2009
SANS Network Security 2009San Diego, CA • September 14 - 22, 2009
SANS Cyber Defense Initiative 2009
Washington DC • December 11 - 18, 2009
For a full list of training events, please visit www.sans.org Dates and locations are subject to change.
SANS OnSite YOUR LOCATION - YOUR SCHEDULE!
With SANS OnSite program you can bring a unique combination of high-quality and world-recognized instructors to train your professionals at your loca-tion and realize signifi cant savings. For organizations that need to train a large number of people, the SANS OnSite program is simply hard to beat!
Six reasons to consider SANS OnSite:1. Enjoy the same great certi� ed SANS instructors and
unparalleled courseware2. Flexible scheduling – conduct the training when it is
convenient for you3. Focus on internal security issues during class and � nd solutions4. Keep sta� close to home5. Realize signi� cant savings on travel expenses6. Enable dispersed workforce to interact with one another in one place
DoD or DoD Contractor working to meet the stringent requirements of DoD-Directive 8570? SANS OnSite is the best way to help you achieve your training and certifi cation objectives. Contact us today for more information at [email protected] or 678-714-5712.
Consider these Training Without Travel alternatives.
SANS OnDemand ONLINE SECURITY TRAINING & ASSESSMENTS
When you want access to SANS’ high-quality training ‘anytime, anywhere’, choose our advanced online delivery method! OnDemand is designed to provide a very convenient, comprehensive, and highly eff ective means for information security professionals to receive the same intensive, immersion training that SANS is famous for. Students will receive:
• Four months access to online training• Integrated lectures by SANS top-rated instructors• Assessments to reinforce your knowledge throughout the course• Hard copy of course books• Access to our SANS Virtual Mentor• Labs & hands-on exercises• Progress Reports
SANS @Home PERSONAL SANS INSTRUCTION AT HOME
SANS @Home delivers live instruction via the Web using various Internet-based technologies. Streaming audio, instant messaging, online forums, and e-mail are all leveraged to make the student’s online learning experience as fun and engaging as possible.
No Travel Budget? Nothing beats the experience of attending a live SANS training event with incomparable instructors
and guest speakers, vendor solutions expos, and myriad networking opportunities. Sometimes, though, travel costs and a week away from the offi ce are just not feasible. When limited time and/or budget keeps you or your co-workers grounded, you can still get great SANS training close to home.
Visit our Web site for more ways to Train Without Travel – www.sans.org/training/without_travel