RESULTS AND FINDINGS - 名古屋大学 · 2016-03-21 · RESULTS AND FINDINGS. Presented by: Glo...
28
Determinants of Farmers’ Demand for Rice crop Insurance in the Ilocos Region RESULTS AND FINDINGS Presented by: Glo Ann N. Balcita Seminar on Economic Development Policy and Management 2 Prof. Shinkai Naoko 1
Transcript of RESULTS AND FINDINGS - 名古屋大学 · 2016-03-21 · RESULTS AND FINDINGS. Presented by: Glo...

Determinants of Farmers’ Demand for Rice crop Insurancein the Ilocos Region
RESULTS AND FINDINGSPresented by: Glo Ann N. Balcita
Seminar on Economic Development Policy and Management 2Prof. Shinkai Naoko
1

Outline of Presentation 2
1. Research Objectives2. Research Questions3. Hypotheses of the Study4. Conceptual Framework5. Logistic Regression Model6. Results and Findings
• Descriptive Statistics• Logistic Regression Analysis
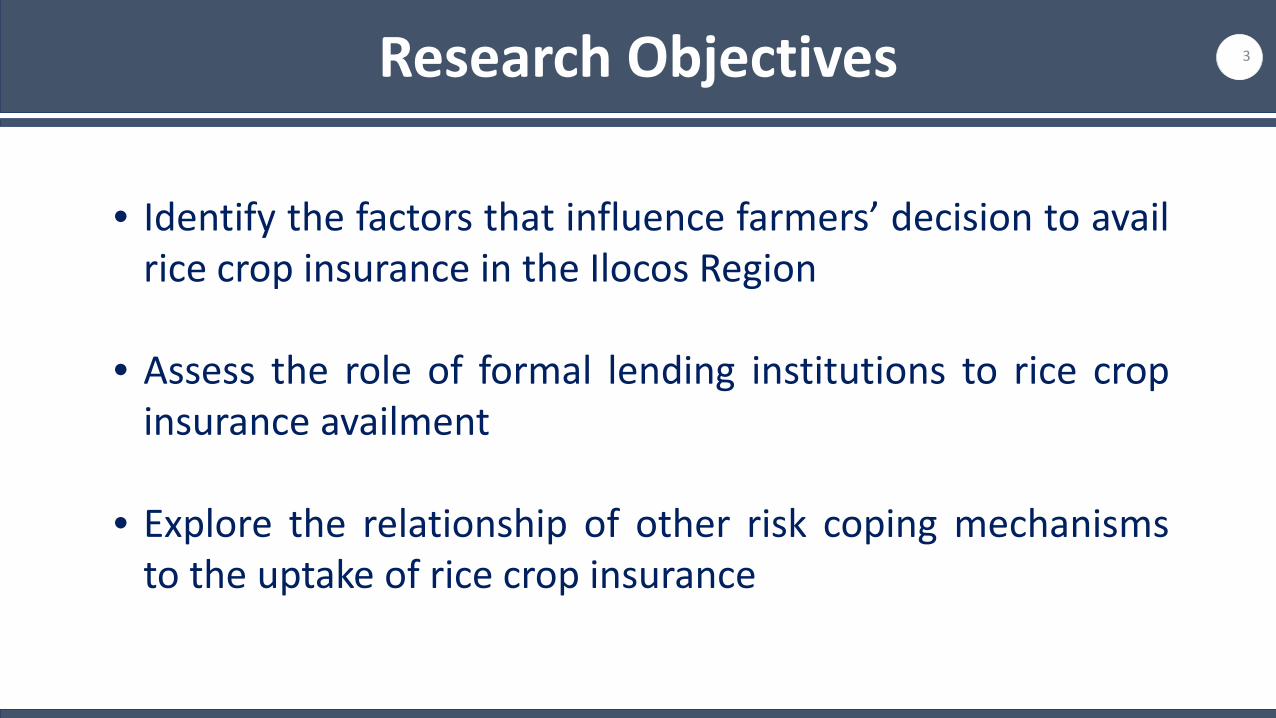
Research Objectives 3
• Identify the factors that influence farmers’ decision to availrice crop insurance in the Ilocos Region
• Assess the role of formal lending institutions to rice cropinsurance availment
• Explore the relationship of other risk coping mechanismsto the uptake of rice crop insurance

Research Questions 4
• What are the determinants of farmers’ demand for rice crop insurance inthe Ilocos Region?
• What are the most important factors that affect farmers’ decision to avail ricecrop insurance?
• How does farmers’ loan availment from formal lending institutionsinfluence their demand for rice crop insurance?
• How does other risk coping mechanisms affect the decision of farmers toavail rice crop insurance?

Hypotheses of the Study 5
• Higher educational attainment, positive perception of the insurer, higher premiumsubsidy, higher yield forecast, perceived yield risk, and probability of receiving aclaim payment, and higher loan uptake from formal lending institutions (insuranceas a prior loan condition) increases the probability that farmers will avail rice cropinsurance.
• Older farmers with longer farming experience, larger farm size, and have higher on-farm and non-farm income are more reluctant to avail rice crop insurance.
• Farmers who are engaged in other forms of risk coping mechanisms such as cropdiversification, livestock and poultry farming (for commercial purposes), andmembership to Irrigators Association are less likely to purchase rice crop insurance.
プレゼンター
プレゼンテーションのノート
Based on the result of previous studies

Demand for Rice
Crop Insurance
TASTES AND PREFERENCES
AgeEducationExperienceFarm Size
Land OwnershipReputation of the Insurer
INCOMEOn-farm Income
Non-Farm Income
FARMER’S EXPECTATIONYield Forecast
Perceived Yield Risk Probability of Receiving a
Claim Payment
PREMIUM PRICEPremium Subsidy
COMPLEMENTARY GOOD
Loan requirement
AVAILABILITY OF SUBSTITUTES
Crop DiversificationLivestock and Poultry
FarmingIrrigation
Conceptual Framework
Adopted from the Study of Tsikirayi, C. M. R., Makoni, E., & Matiza, J. (2013). Analysis of the Uptake of Agricultural Insurance Services by the AgriculturalSector in Zimbabwe. Journal of International
Business and Cultural Studies, Vol. 7, 1-14.
6

Logistic Regression Model
Independent Variables:
X1 = AgeX2 = EducationX3 = Farming ExperienceX4 = Land TenureX5 = Farm SizeX6 = Reputation of the InsurerX7 = On-Farm IncomeX8 = Non-Farm IncomeX9 = Premium SubsidyX10 = Yield ForecastX11 = Perceived Yield RiskX12 = Probability of Receiving a ClaimX13 = Lender RequirementX14 = Membership to Irrigators AssociationX15 = Crop DiversificationX16 = Livestock Farming
Where:
Pi = The probability of choice of farmer i to avail rice crop
insurance
Dependent Variable:
1 = Avail Rice Crop Insurance0 = Not Avail Rice Crop Insurance
α0 = Intercept
ui = Error term
Zi = Ln [Pi/(1-Pi)] = α0 + α2X2 + α3X3 + α4X4 + ……… + α16X16 + ui
7

Logistic Regression Model 8
Factors Definition
Tastes and Preferences
Age Number of years
Education Categorical Variable: 1 if elementary; 2 if secondary, 3 tertiary, 4 if vocational
Farming Experience Number of years
Land Tenure Categorical Variable: 1 if owner; 2 if tenant; and 3 if both
Farm Size in hectares
Reputation of the Insurer 1 if the farmer have positive perception of the insurer; 0 if otherwise
Income
On-Farm Income Amount of on-farm income (Average monthly income)
Non-Farm Income Amount of non-farm income (Average monthly income)
Complementary Good
Lender Requirement 1 if insurance availment is a prior loan condition of formal lending institutions; 0 if otherwise

Logistic Regression Model 9
Factors Definition
Price of Insurance
Subsidized premium 1 if subsidy is high; 0 if subsidy is low
Farmer’s Expectations
Perceived Yield 1 if a farmer’s yield forecast is high; 0 if low
Perceived Yield Risk 1 if a farmer’s perceived yield risk is high; 0 if low
Probability of Receiving a Claim 1 if a farmer expects to receive a claim payment; 0 if otherwise
Availability of Substitutes
Membership to Irrigators Association 1 if the farmer is a member of irrigators association; 0 if otherwise
Crop Diversification 1 if the farmer plants more than 1 crop; 0 if otherwise
Livestock and Poultry Farming 1 if the farmer raise livestock and poultry for commercial purposes; 0 if otherwise
プレゼンター
プレゼンテーションのノート
Livestock and poultry farming as an alternative source of income.

RESULTS AND FINDINGSDescriptive Statistics
10

Rice Crop Insurance Availment 11
Sample: 70 Rice Farmers
A. With Rice Crop Insurance - 30, 42.86%1. With farmer’s share insurance - 18, 60.00%2. With fully subsidized insurance - 16, 53.33%3. With both (1) and (2) - 4, 13.33%
B. Without Rice Crop Insurance - 40, 57.14%
-------1. Member of IA - 29, 41.42%2. Member of MFI - 18, 27.14%
プレゼンター
プレゼンテーションのノート
Findings: Looking at this pie chart of rice crop insurance availment in my research site, it can be observed that 1. Farmers who availed rice crop insurance are members either MFIs or IA, or it could be both. 2. Farmers who availed regular rice crop insurance are those farmers who are members of TSPI, while those… 3. Farmers who availed fully-subsidized insurance are those farmers who are member of irrigators assoc. 4. What we can observe here is that insurance is a requirement for a loan application membershipinsuranceloan availment
Socio-Economic Characteristics of Respondents
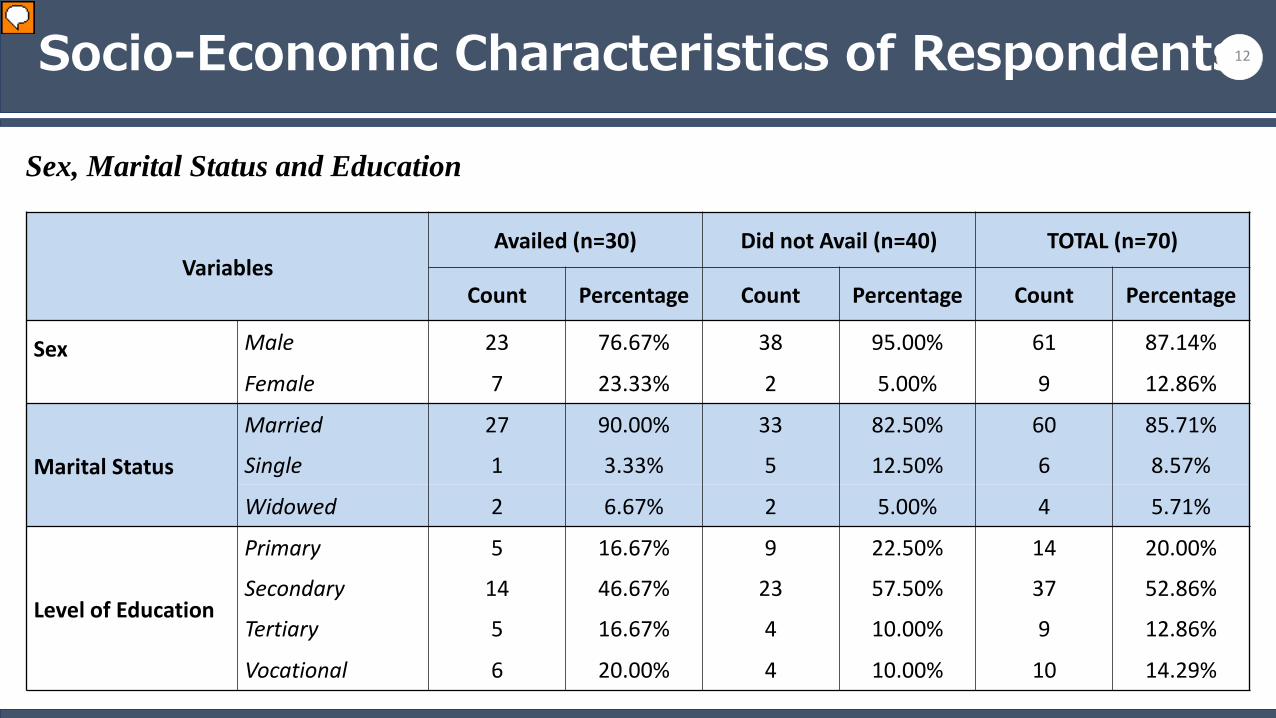
Sex, Marital Status and Education
12
VariablesAvailed (n=30) Did not Avail (n=40) TOTAL (n=70)
Count Percentage Count Percentage Count Percentage
Sex Male 23 76.67% 38 95.00% 61 87.14%
Female 7 23.33% 2 5.00% 9 12.86%
Marital Status
Married 27 90.00% 33 82.50% 60 85.71%
Single 1 3.33% 5 12.50% 6 8.57%
Widowed 2 6.67% 2 5.00% 4 5.71%
Level of Education
Primary 5 16.67% 9 22.50% 14 20.00%
Secondary 14 46.67% 23 57.50% 37 52.86%
Tertiary 5 16.67% 4 10.00% 9 12.86%
Vocational 6 20.00% 4 10.00% 10 14.29%
プレゼンター
プレゼンテーションのノート
Majority of the farmers who availed and did not avail rice crop insurance are married men and their highest level of educational attainment is secondary.

Socio-Economic Characteristics of Respondents
Primary and Secondary Occupation
13
VariablesAvailed (n=30) Did not Avail (n=40) TOTAL (n=70)
Count Percentage Count Percentage Count Percentage
Primary Occupation
Farming 30 100.00% 38 95.00% 68 97.14%
Agricultural Trader 0 0.00% 1 2.50% 1 1.43%
Private 0 0.00% 1 2.50% 1 1.43%
Secondary Occupation
Barangay Official 2 6.67% 0 0.00% 2 2.86%
Market Vendor 1 3.33% 0 0.00% 1 1.43%
Electrician 0 0.00% 1 2.50% 1 1.43%
Driver 0 0.00% 1 2.50% 1 1.43%
Farming 0 0.00% 2 5.00% 2 2.86%
Store Owner 0 0.00% 1 2.50% 1 1.43%
プレゼンター
プレゼンテーションのノート
- Farming is the primary occupation of almost all the respondents (both farmers who availed and did not avail insurance) – with 97.14% percentage share - Secondary occupation of those who availed rice crop insurance are non-farm related jobs, same with those who did not avail insurance (although there are 2 farmers whose secondary occupation is farming)

Socio-Economic Characteristics of Respondents
Age, Household Size and Farming Experience
14
Variables Availed Did not Avail TOTAL
Age Average 46.23 47.18 46.77Min. 30 24 24Max. 69 80 80Std. Dev. 11.46
Household Size Average 4.30 4.83 4.60Min. 3 2 2Max. 7 10 10Std. Dev. 1.55
Farming Experience Average 22.67 23.95 23.4Min. 6 4 4Max. 52 60 60Std. Dev. 11.21
プレゼンター
プレゼンテーションのノート
- No variation/difference bet. Age, hh size and farming experience of those who avail and did not avail insurance. The average age of those availed insurance is 46.23 yrs old. which is very close to the average age of those who did not avail insurance (47.18yrs old) Approximately, the average household size of the respondents ranges from 4 members (those who availed) to 5 members (those who did not) The average farming experience of those who avail and did not avail insurance is more than 2 decades.

Socio-Economic Characteristics of Respondents
Average Monthly Income – On Farm and Non Farm (in Pesos)
15
Variables Availed Did not Avail TOTALOn-Farm Average 6,133.33 5,656.25 5,860.72
Min. 2,000.00 1,750.00 1,750.00Max. 12,500.00 16,500.00 19,000.00Std. Dev. 3,841.75
A. Main Crop Average 6,958.33 6,550.00 6,725.00 Min. 2,000.00 2,000.00 2,000.00 Max. 15,000.00 23,000.00 23,000.00
B. Second Crop Average 5,308.33 4,762.50 4,996.43 Min. 2,000.00 1,500.00 1,500.00 Max. 10,000.00 10,000.00 15,000.00
Non-Farm Average 2,725.00 8,875.00 5,800.00 Min. 2,200.00 1,000.00 1,000.00 Max. 3,500.00 18,000.00 18,000.00 Std. Dev. 6,694.99
Note:P1 = $0.0224$1 = P44.57
プレゼンター
プレゼンテーションのノート
Average on-farm (both main crop and second crop) and off-farm income of all the respondents are relative low (lower than the average monthly per capita income which is around P7,000.00 or $157.00 Most likely, their income is not sufficient to support their farming expenses.

Agricultural Characteristics 16
VariablesAvailed (n=30) Did not Avail (n=40) TOTAL (n=70)
Count Percentage Count Percentage Count Percentage
Land Tenure Owner 4 13.33% 3 7.50% 7 10.00%
Tenant 20 66.67% 29 72.50% 49 70.00%
Both 6 20.00% 8 20.00% 14 20.00%
Crops Cultivated Rice 30 100.00% 40 100.00% 70 100.00%
Corn 16 53.33% 16 40.00% 32 45.71%
Vegetables 1 3.33% 2 5.00% 3 4.29%
Livestock and Poultry Subsistence 8 32.00% 15 42.86% 23 38.33%
Commercial 17 68.00% 20 57.14% 37 61.67%
プレゼンター
プレゼンテーションのノート
Majority of the respondents are tenants. This shows that majority of the respondents tend to have higher farming expenses (they need to pay for rent also) Aside from rice, most the respondents also plant corn (45.71%) while some also plant vegetables (4.29%) which means almost half of the respondents are engage in crop diversification Majority of the them are engage in livestock and poultry farming. More than half of the total respondents are engage in livestock and poultry for commercial purposes

Agricultural Characteristics 17
Variables Availed Did not Avail TOTAL
Farm Size Average 2.28 1.85 2.04
(in Hectares) Min. 0.80 0.50 0.50
Max. 8.00 11.00 11.00
Std. Dev. 1.18
Insured Farm Size Average 1.26
(in Hectares) Min. 0.80
Max. 3.00
Std. Dev. 0.60
プレゼンター
プレゼンテーションのノート
Those who availed insurance have larger farms (with an ave. of 2.28 ha.) than those who did not avail insurance (with an ave. of 1.85 ha. – lower than the total average farm size The ave. insured farm size is 1.26 hectares, relatively lower than the ave. farm size for both farmers who availed and did not avail insurance)

Type of Farmer and Borrowing 18
VariablesAvailed (n=30) Did not Avail (n=40) TOTAL (n=70)
Count Percentage Count Percentage Count Percentage
Type of Farmer Self-financed 12 30.00% 12 17.14%
Financed by Landowner 4 33.33%
On-Farm Income 6 50.00%
Remittance 2 16.67%
Borrowing 30 100.00% 28 70.00% 58 82.86%
Type of Borrowing Individual 0 0.00% 28 70.00% 28 40.00%
Group 30 100.00% 0 0.00% 30 42.86%
プレゼンター
プレゼンテーションのノート
All insured farmers are borrowing farmers. Majority of the farmers who did not avail insurance are also borrowing farmers (mostly are tenant farmers) while only a few self-financed farmers (these are those farmers whose income are relatively higher than the average per capita income) By type of borrowing, we can observed all farmers who availed insurance are engage in group lending while those farmers who did not avail insurance are engage in individual loans
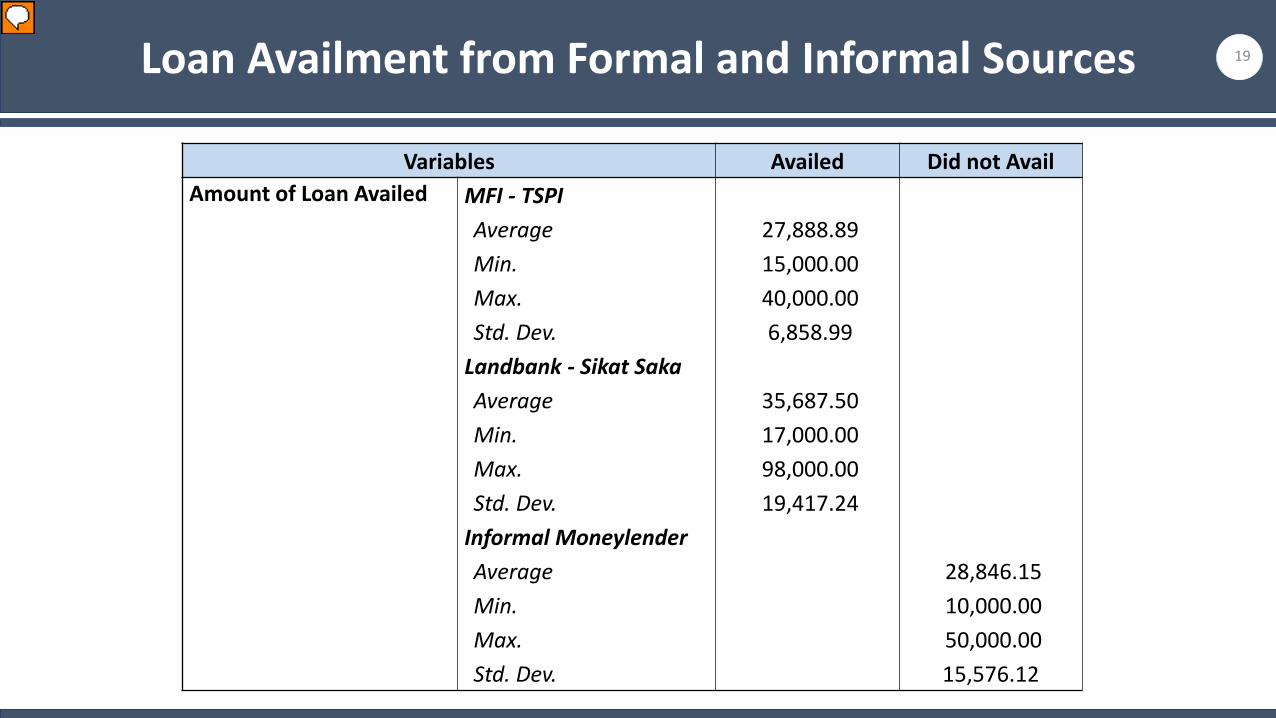
Loan Availment from Formal and Informal Sources 19
Variables Availed Did not AvailAmount of Loan Availed MFI - TSPI
Average 27,888.89 Min. 15,000.00 Max. 40,000.00 Std. Dev. 6,858.99
Landbank - Sikat SakaAverage 35,687.50 Min. 17,000.00 Max. 98,000.00 Std. Dev. 19,417.24
Informal MoneylenderAverage 28,846.15 Min. 10,000.00 Max. 50,000.00 Std. Dev. 15,576.12
プレゼンター
プレゼンテーションのノート
In relation to the previous slide, it can observed that all borrowing farmers who availed insurance obtained their loans from formal lending institutions while those borrowing farmers who did not avail insurance obtained their loans from informal moneylenders. The ave. loan amount for those farmers who obtain their loan from formal sources is relatively higher than those farmers who borrowed from informal moneylenders. This depicts that borrowing from formal lending institutions is a better financing option (same with loan interest – 3% vis-à-vis-5% per month) than borrowing from informal ones.

RESULTS AND FINDINGSLogistic Regression Analysis
20
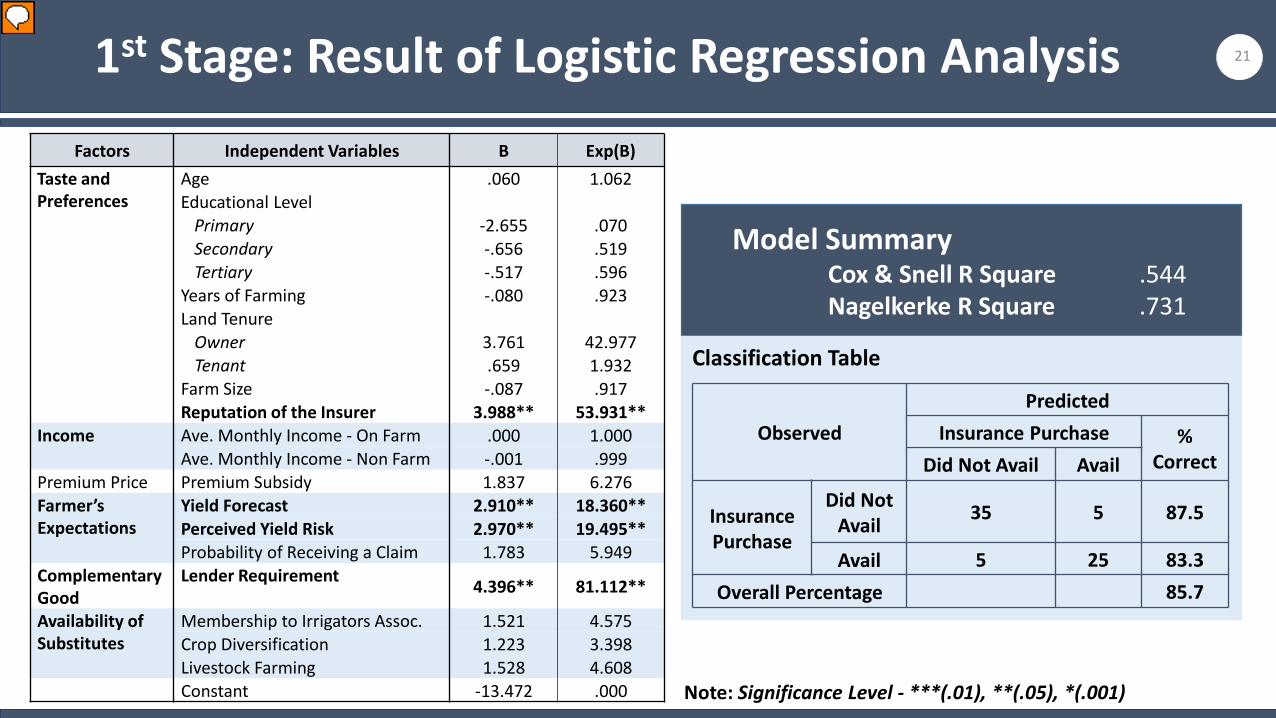
Model SummaryCox & Snell R Square .544Nagelkerke R Square .731
ObservedPredicted
Insurance Purchase % CorrectDid Not Avail Avail
Insurance Purchase
Did Not Avail 35 5 87.5
Avail 5 25 83.3Overall Percentage 85.7
Factors Independent Variables B Exp(B)Taste and Preferences
Age .060 1.062Educational Level
Primary -2.655 .070Secondary -.656 .519Tertiary -.517 .596
Years of Farming -.080 .923Land Tenure
Owner 3.761 42.977Tenant .659 1.932
Farm Size -.087 .917Reputation of the Insurer 3.988** 53.931**
Income Ave. Monthly Income - On Farm .000 1.000Ave. Monthly Income - Non Farm -.001 .999
Premium Price Premium Subsidy 1.837 6.276Farmer’s Expectations
Yield Forecast 2.910** 18.360**Perceived Yield Risk 2.970** 19.495**Probability of Receiving a Claim 1.783 5.949
Complementary Good
Lender Requirement 4.396** 81.112**
Availability of Substitutes
Membership to Irrigators Assoc. 1.521 4.575Crop Diversification 1.223 3.398Livestock Farming 1.528 4.608Constant -13.472 .000 Note: Significance Level - ***(.01), **(.05), *(.001)
211st Stage: Result of Logistic Regression Analysis
Classification Table
プレゼンター
プレゼンテーションのノート
- The result of the logistic regression analysis revealed that reputation of the insurer, yield forecast, perceived yield risk and lender requirement have positive statistical relation with rice crop insurance availment, all at 95% significance level - This means that farmers who perceive that the insurer has good reputation (for instance, based on the interaction that they had) are more likely to avail insurance by 53.93 times that those who have negative perception of the insurer. - Farmers who have high yield forecast and perceived yield risk have higher probability to purchase insurance by 18.36 times and 19.50 times, respectively. - Farmers who obtain loan from formal lending institutions (who basically require insurance purchase before loan availment) have higher chance to uptake insurance by 81.11 times than those farmers who obtain loan from informal moneylenders (who does not require them to avail insurance) - All other factors were found to have no statistical effect on rice crop insurance purchase. Model summary: Cox & Snell R Square tries to imitate Multiple R Squared Based on Likelihood. .544 indicates that 54.4% of the variation in the dependent variable was explained by the logistic model. Nagelkerke’s R Square is considered as a more reliable measure of the relationship (most reported R Square estimate for logistic regression) Here, .731 indicates that 73.1% of the variation in the dependent variable were explained by predictors in the model. Rather than using goodness-of-fit, we often want to look at the proportion of cases we have managed to classify correctly in our model. As shown in the classification table, 83.3% were correctly classified by the avail group while 87.5% were correctly classified for the Did not avail proup. Overall, 85.7% were correctly classified/predicted in this model.
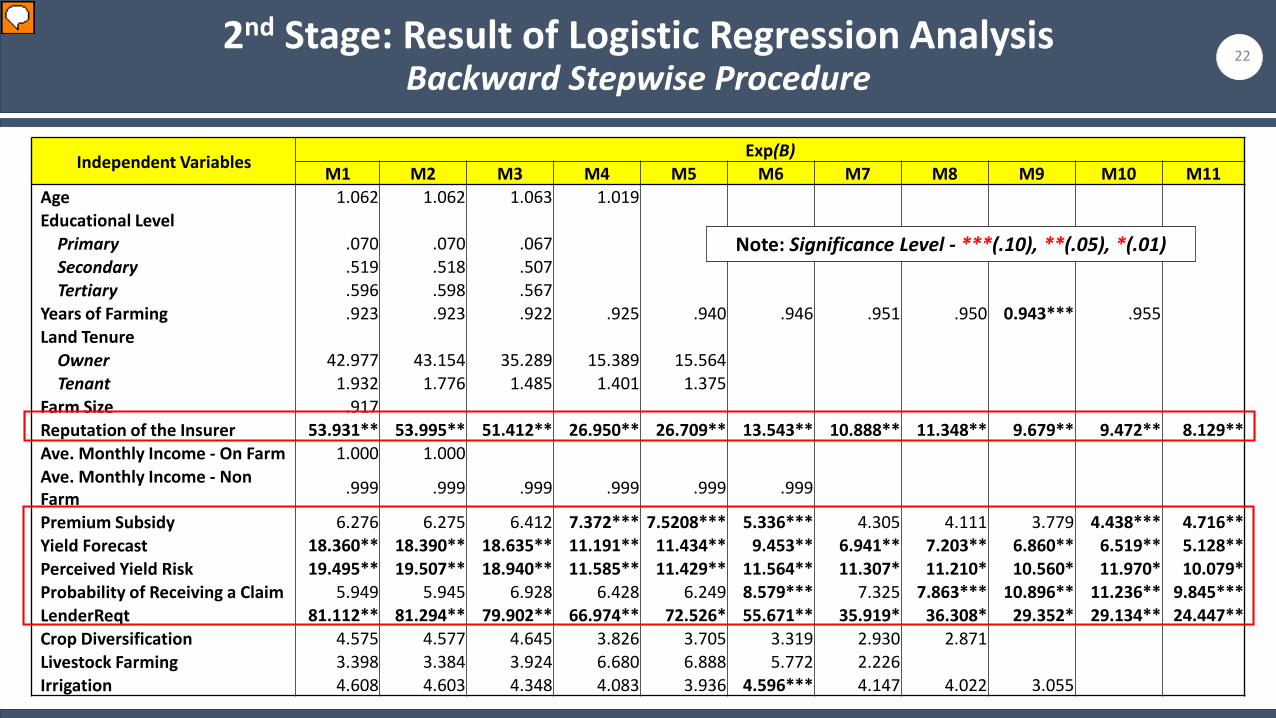
2nd Stage: Result of Logistic Regression Analysis Backward Stepwise Procedure
22
Independent Variables Exp(B)M1 M2 M3 M4 M5 M6 M7 M8 M9 M10 M11
Age 1.062 1.062 1.063 1.019Educational Level
Primary .070 .070 .067Secondary .519 .518 .507Tertiary .596 .598 .567
Years of Farming .923 .923 .922 .925 .940 .946 .951 .950 0.943*** .955Land Tenure
Owner 42.977 43.154 35.289 15.389 15.564Tenant 1.932 1.776 1.485 1.401 1.375
Farm Size .917Reputation of the Insurer 53.931** 53.995** 51.412** 26.950** 26.709** 13.543** 10.888** 11.348** 9.679** 9.472** 8.129**Ave. Monthly Income - On Farm 1.000 1.000Ave. Monthly Income - Non Farm .999 .999 .999 .999 .999 .999
Premium Subsidy 6.276 6.275 6.412 7.372*** 7.5208*** 5.336*** 4.305 4.111 3.779 4.438*** 4.716**Yield Forecast 18.360** 18.390** 18.635** 11.191** 11.434** 9.453** 6.941** 7.203** 6.860** 6.519** 5.128**Perceived Yield Risk 19.495** 19.507** 18.940** 11.585** 11.429** 11.564** 11.307* 11.210* 10.560* 11.970* 10.079*Probability of Receiving a Claim 5.949 5.945 6.928 6.428 6.249 8.579*** 7.325 7.863*** 10.896** 11.236** 9.845***LenderReqt 81.112** 81.294** 79.902** 66.974** 72.526* 55.671** 35.919* 36.308* 29.352* 29.134** 24.447**Crop Diversification 4.575 4.577 4.645 3.826 3.705 3.319 2.930 2.871Livestock Farming 3.398 3.384 3.924 6.680 6.888 5.772 2.226Irrigation 4.608 4.603 4.348 4.083 3.936 4.596*** 4.147 4.022 3.055
Note: Significance Level - ***(.10), **(.05), *(.01)
プレゼンター
プレゼンテーションのノート
Summary Table of Logistic Regression Analysis - Backward Stepwise Procedure This procedure was done for two pursoses: (1) determinination of the most significant variables that affect the decision of farmers to avail or not avail rice crop insurance; and (2) come up with the best fit model for this study. In this study, backward stepwise procedure refers to the removal testing of variables based on the probability of the wald statistic (IBM, 2013). This means that the elimination of variables in each model is based on the significance of each explanatory variable in the equation. As we can observe from the result of this proedure, 11 models were generated. Among the variables, reputation of the insurer, premium subsidy, yield forecast, perceived yield risk, probability of receiving a claim and lender requirement seems to be the most sig. variables that affect farmers’ decision to avail rice crop insurance

Model Selection: Result of Likelihood Ratio Test
Model Comparison -2 Log likelihood No. of IVs DF Chi Square P Value
1 40.580 17
2 2 vis-a-1 40.580 16 1 - 1.000
3 3 vis-a-2 40.611 15 1 0.031 0.860
4 4 vis-a-3 42.713 14 1 2.102 0.156
5 5 vis-a-4 42.770 13 1 0.057 0.811
6 6 vis-a-5 44.926 12 1 2.156 0.142
7 7 vis-a-6 45.941 11 1 1.015 0.314
8 8 vis-a-7 46.175 10 1 0.234 0.629
9 9 vis-a-8 47.727 9 1 1.552 0.213
10 10 vis-a-9 49.701 8 1 1.974 0.160
11 11 vis-a-10 52.063 7 1 2.362 0.124
23
Summary 1
プレゼンター
プレゼンテーションのノート
Interpretation: If the P value is not statistically significant then the model will lesser variables is better For us to know which among these models is best fit model… Likelihood Ratio Test: Comparing Logistic Regression Models Comparing the base model (with a set of predictors) to an alternate/simpler model (with fewer predictors) The difference between the 2 models "-2 log likelihood" is an approximation of the chi-square statistic with a df given the extra parameters in the full model This test is an analog of the F Test for comparing complete and reduced models - If the p value is statistically significant then the more complex model (with more variables) shows an extremely strong evidence of a better fit model Source: Agresti, et al. (2009). Statistical Methods for Social Sciences. 4th Edition

Model Comparison -2 Log likelihood No. of IVs DF Chi Square P Value
1 11 vis-a-1 40.580 16 10 11.483 0.32112 11 vis-a-2 40.580 15 9 11.483 0.24723 11 vis-a-3 40.611 14 8 11.452 0.17744 11 vis-a-4 42.713 13 7 9.350 0.22855 11 vis-a-5 42.770 12 6 9.293 0.15786 11 vis-a-6 44.926 11 5 7.137 0.21067 11 vis-a-7 45.941 10 4 6.122 0.19028 11 vis-a-8 46.175 9 3 5.888 0.11729 11 vis-a-9 47.727 8 2 4.336 0.1140
10 11 vis-a-10 49.701 7 1 2.362 0.124311 52.063 6
24Model Selection: Result of Likelihood Ratio Test
Summary 2
プレゼンター
プレゼンテーションのノート
Compare selected model with all other models Interpretation: If the P value is not statistically significant then the model will lesser variables is a better model (Model 11 as best fit model)

Model SummaryCox & Snell R Square .463Nagelkerke R Square .622
ObservedPredicted
Insurance Purchase % CorrectDid Not Avail Avail
Insurance Purchase
Did Not Avail 33 7 82.5
Avail 7 23 76.7Overall Percentage 80.0
Independent Variables B Exp (B)
Premium Price
Premium Subsidy 1.551 4.716**
Farmer’s Expectations
Yield Forecast 1.635 5.128**
Perceived Yield Risk 2.310 10.079*
Probability of Receiving a Claim
2.287 9.845***
Tastes and Preferences
Reputation of the Insurer 2.095 8.129**
Complementary Good
Lender Requirement 3.197 24.447**
Constant -8.397 .000Note: Significance Level - ***(.10), **(.05), *(.01)
25Final Model – Most Significant Factors

Equation of the Final Logistic Regression Model
Zi = Ln [Pi/(1-Pi)] = α0 + α2X2 + α3X3 + α4X4 + ……… + α16X16 + ui
26
Zi = Ln [Pi/(1-Pi)] = -8.397 + 2.095X1+ 1.635X2 + 2.310X3 + 2.287X4 + 1.551X5 + 3.197X6
Independent Variables:
X1 = Reputation of the Insurer X2 = Yield ForecastX3 = Perceived Yield RiskX4 = Probability of Receiving a X5 = Premium SubsidyX6 = Lender Requirement
Where:
Zi = Reaction IndexPi = The probability of choice of
farmer i to avail rice crop insurance
Dependent Variable:
1 = Avail Rice Crop Insurance0 = Not Avail Rice Crop Insurance

27TimetableMonth Mon Tue Wed Thu Fri Sat Sun
May
18 19 20 21Pres. of Results and
Findings
22 23 24
25 26 27 28 29 30 31
June
1 2 3 4 5 6 7
8Submit 1st
draft to Shinkai Sensei and Peddie Sensei (for
English Check)
9Plagiarism Check (1)
and English Check
10 11 12 13 14
15 16 17 18 17 20 21
22Final Plagiarism
Check (2)
23 24 25 26 27 28
29 30
July1
Submit Thesis
2 3
DL: Thesis Submission
Revision of thesis (based on the result of Plagiarism Check and English Check)
Thesis Writing (Results and Findings, Conclusion and Recommendation, Literature Review)
Thesis Writing (Introduction, Country Profile, Abstract, Appendix)
Thesis Writing (Methodology, Results and Findings) Thesis Writing (Results and Findings)
Revision of thesis (based on Shinkai Sensei’s comments and Peddie Sensei’s English Check)
Final Revision of thesis (based on the result of Plagiarism Check)
Final Revision of thesis
DL: Submission of Master’s Thesis Evaluation Form

28