Results and Discussion - Kinam Park
62
3. RESULTS AND DISCUSSION 35 3 Results and Discussion 3.1 Solubility and miscibility The solubility of different PLGA polymers in some solvents frequently used for the preparation of in situ forming implants was proved (Table 3.1). After 48 hours agitation, RG 752 and R 202H showed to be soluble in all the solvents tested, exhibiting a single clear phase while the other three polymers (RG 502H, RG 503H and RG 504) swelled after being shaken with benzyl alcohol. RG 503H and RG 504 also swelled with benzyl benzoate. Additionally RG 503H was not soluble in PEG 400 and RG 504 not soluble in ethyl acetate. Partial miscibility was found for RG 504 in 2-pyrrolidone (Table 3.2). The polymer selected for the next studies was RG 752. Table 3.1 Solvents used for in situ implants formation. Data obtained from http://chemdat.merck.de/mda/int_en/catalog/ Melting Boiling Solubility Density Point Point water 20°C N-methyl-2-pyrrolidone -24.0°C 202.0°C 1000 g/l 1.03 g/cm 3 2 -pyrrolidone 24.0 - 26.0°C 245.0°C 1000 g/l 1.11 g/cm 3 Polyethylene glycol 400 4.0 - 8.0°C >250 °C 1000 g/l 1.13 g/cm 3 Ethyl acetate -83.0°C 77.0 °C 85.3 g/l 0.90 g/cm 3 Benzyl alcohol -15.3°C 205.0 °C 40.0 g/l 1.05 g/cm 3 Benzyl benzoate 21.0°C 324.0°C insoluble 1.12 g/cm 3 Triacetin -78.0°C 258.0°C 64.0 g/l 1.16 g/cm 3 Dimethyl sulfoxide 18.4°C 189.0°C 1000 g/l 1.10 g/cm 3 Solvent
Transcript of Results and Discussion - Kinam Park

3. RESULTS AND DISCUSSION
35
3 Results and Discussion
3.1 Solubility and miscibility
The solubility of different PLGA polymers in some solvents frequently used for
the preparation of in situ forming implants was proved (Table 3.1). After 48
hours agitation, RG 752 and R 202H showed to be soluble in all the solvents
tested, exhibiting a single clear phase while the other three polymers (RG 502H,
RG 503H and RG 504) swelled after being shaken with benzyl alcohol. RG
503H and RG 504 also swelled with benzyl benzoate. Additionally RG 503H
was not soluble in PEG 400 and RG 504 not soluble in ethyl acetate. Partial
miscibility was found for RG 504 in 2-pyrrolidone (Table 3.2). The polymer
selected for the next studies was RG 752.
Table 3.1 Solvents used for in situ implants formation.
Data obtained from http://chemdat.merck.de/mda/int_en/catalog/
Melting Boiling Solubility DensityPoint Point water 20°C
N-methyl-2-pyrrolidone -24.0°C 202.0°C 1000 g/l 1.03 g/cm3
2 -pyrrolidone 24.0 - 26.0°C 245.0°C 1000 g/l 1.11 g/cm3
Polyethylene glycol 400 4.0 - 8.0°C >250 °C 1000 g/l 1.13 g/cm3
Ethyl acetate -83.0°C 77.0 °C 85.3 g/l 0.90 g/cm3
Benzyl alcohol -15.3°C 205.0 °C 40.0 g/l 1.05 g/cm3
Benzyl benzoate 21.0°C 324.0°C insoluble 1.12 g/cm3
Triacetin -78.0°C 258.0°C 64.0 g/l 1.16 g/cm3
Dimethyl sulfoxide 18.4°C 189.0°C 1000 g/l 1.10 g/cm3
Solvent
kpark
Typewritten Text
kpark
Typewritten Text
http://www.diss.fu-berlin.de/diss/servlets/MCRFileNodeServlet/FUDISS_derivate_000000002179/3_results.pdf?hosts=

3. RESULTS AND DISCUSSION
36
Table 3.2 Solubility of different PLGA polymers in different solvents.
For the preparation of O/W-ISM systems, the suitable solvent had to be
immiscible with water and able to dissolve the polymer, as it was the case of
benzyl benzoate or other low water soluble solvents like benzyl alcohol and
triacetin (Table 3.1 and 3.2). O/O-ISM systems required an organic solvent
immiscible with the oil but able to dissolve the polymer. Some commonly used
oils for parenteral products are listed in table 3.3. Peanut oil and sesame oil are
slightly miscible or immiscible with the three solvents tested. Since corn oil and
miglyol were miscible with NMP, sesame oil and peanut oil were selected for
the study. Additionally sesame oil was reported as being more stable, knowing
the possible oxidative changes of fixed oils, due to the presence of unsaturated
fatty acids [102].
RG 752 RG 502H RG 503H RG 504 R 202H
+ soluble+/- partially soluble- insolubleSw swelling
Sw +
Triacetin + + + + +
Benzyl benzoate + + Sw
- +
Benzyl alcohol + Sw Sw Sw +
Ethyl acetate + + +
+ +
Polyethylene glycol 400 + + - + +
N-methyl-2-pyrrolidone + + +
SolventPolymer
2-pyrrolidone + + + +/- +

3. RESULTS AND DISCUSSION
37
Table 3.3 Properties of commonly used oils in parenteral products.
Data from reference [103]
Table 3.4 Solvent/oil miscibility for O/O-ISM systems.
+++ miscible, one phase that stay after rotation of the vial++ partial miscible, one phase that forms lamps after rotation of the vial+ slightly miscible -two phases, one bigger than the other
- inmiscible - two phases of equal height
N-methyl-2-pyrrolidone 2-pyrrolidoneOilSolvent
+ -Polyethylene glycol 400
-Corn oil +++ - -
Peanut oil
-Miglyol +++ -Sesame oil + - -
Viscosity
C16 8.3% C20 2.4%Peanut oil 41 cP 0.910 - C18 3.1% C22 3.1%
0.915 g/ml C18:1 56.0% C24 1.1%C18:2 26.0%
0.940 - C6 0.5% C10 40.0%Miglyol 812 28 - 32 cP 0.960 g/ml C8 58.0% C12 1.0%
C14 1.4% C16:1 1.5%
Corn oil 39 cP 0.916- C16 10.2% C18 3.0%0.921 g/ml C18:1 49.6% C18:2 47.8%
C16 9.1% C18 4.3%Sesame oil 57 cP 0.916 - C18:1 45.4% C20 0.8%
0.920 g/ml C18:2 40.4%
C12 0.2% C16:1 0.4%C14 0.1% C18:1 28.9%
Soybean oil 50cP 0.930 g/ml C16 9.8% C18:2 50.7%C18 2.4% C18:3 6.5%C20 0.9% C24 1.1%
Oil Density Constitution

3. RESULTS AND DISCUSSION
38
3.2 Rate of dissolution
A rapid dissolution of PLGA in the biocompatible organic solvent during
reconstitution is essential for the potential use of solid PLGA for the formation of
in situ systems. The rate of dissolution of solids can be described by the Noyes-
Whitney equation:
dm/dt = kA(Cs-C),
Where:
m = mass of solute that passed into solution in time t,
dm/dt = mass of solute going in solution per unit time,
A = surface area of the undissolved solid in contact with the solvent,
Cs = concentration of solute required to saturate the solvent at the experimental
temperature,
C = solute concentration at time t and
k = dissolution rate constant, it has the dimensions of length-2 time-1 :
k = D/ Vh
Where:
D = diffusion coefficient of the solute in the dissolution medium (or solvent),
V = volume of the dissolution medium and
h = thickness of the boundary layer [104-106].
From the terms present in the previous equation is possible to deduce some of
the factors that could have influence on the dissolution rate of solids in liquids
and therefore in the dissolution rate of solid PLGA particles in organic solvents
(Table 3.5).

3. RESULTS AND DISCUSSION
39
Table 3.5 Factors affecting dissolution rate of solids in liquids.
Adapted from [105].
The rate of polymer dissolution thus depends on the surface area (particle size)
of the polymer. The particle size of PLGA (as received from the supplier) was >
500 µm, The particle size could be reduced by cryogenic milling to 50 µm. As
Noyes-Whitney Affected by Commentsequation terms
A, surface area of Size of solid particles Particle sizeundissolved solid
Dispersibility of powdered Wetting agentsolid in solvent
Porosity of solid particles Large enough pores
Cs, Solubility of solid Temperature exothermic - endothermicin solvent
Nature of solvent Solubility parameters, cosolvents, pH
Molecular structure of solute different polymers, drugs
Crystalline form of solid polymorphism
Presence of other compounds complex formation, solubilizing agents
C, concentration of solute in Solvent volume different concentrationssolution at time t
Any process that removes partition into oildissolved solute from the
solvent
k, dissolution rate constant Thickness of boundary layer mixing rate, shape and size of container, volume of solvent,
viscosity of solvent
Diffusion coefficient of solute viscosity solvent, particle size of in the solvent diffusing molecules
kpark
Highlight

3. RESULTS AND DISCUSSION
40
expected, the dissolution time (as represented by the number of mixing cycles)
decreased with decreasing particle size (increasing surface area) from 45
cycles for the size fraction larger 160 µm to 20 cycles for the 50 – 100 µm
fraction (Figure 3.1).
Figure 3.1 Effect of the particle size on the dissolution rate of 30% w/w R
202H in 2-pyrrolidone (0.5 cycles/s)
A key factor for the polymer dissolution process is the selection of the organic
solvent, which will affect the rate of dissolution primarily through the solubility of
0
10
20
30
40
50
60
50-100 100-160 160-500 >500Particle size, µm
N° C
ycle
s

3. RESULTS AND DISCUSSION
41
the polymer and the viscosity of the resulting polymer solution [107]. Since
PLGAs are water-insoluble, various organic biocompatible solvents, which have
been in used in parenteral formulations, were evaluated for their ability to
rapidly dissolve PLGA. The time required for complete dissolution of PLGA RG
752 powder (as received from the supplier) was in the following order: ethyl
acetate < NMP < benzyl alcohol < triacetin < benzyl benzoate < 2-pyrrolidone <
PEG 400 (Table 3.6).
Table 3.6 Dissolution time of PLGA RG752 in different solvents and their
corresponding solvent/ PLGA solution viscosities.
[a] From [108]
The rank order of the solvents was the same at all three concentrations tested
(10%, 25% and 40% w/v). The viscosity of the biocompatible solvent
(“dissolution medium”) increased significantly during the dissolution of the
polymer. The time for dissolution correlated with the viscosity of the pure
solvents/resulting polymer solutions and the solubility parameter of the solvent
(Table 3.6). Solvents with a lower viscosity, such as ethyl acetate, NMP or
benzyl alcohol dissolved the polymer in between 1 and 50 min at all polymer
concentrations tested, while the most viscous solvent PEG 400 required almost
HildebrandSolvent Solubility parameter,
10% 25% 40% 0% 10% 25% 40% MPa 1/2 [a]
Ethyl acetate 1.1 1.8 10.2 0.5 - - - 18.6
NMP 3.0 10.7 33.0 1.7 - 48.9 - 23.1
Benzyl alcohol 18.0 33.2 51.0 3.7 - 113.1 - 24.8
Triacetin - 84.4 - 17.0 - 761.9 - 23.7
Benzyl benzoate - 132.4 - 6.8 - 419.6 - -
2 -pyrrolidone - 178.5 - 12.2 - 292.8 - 30.1
PEG 400 1355.0 1860.0 * 90.0 - 1243.0 * - * not completely dissolved- not determined (viscosity) / not found (solubility parameters)
Dissolution time, min Viscosity, mPa sPolymer concentration Polymer concentration

3. RESULTS AND DISCUSSION
42
one day at a PLGA concentration of only 10% w/v. The dissolution time
increased with increasing polymer concentration because of an increased
solution viscosity.
The solvent quality for a solute is generally reflected by the solubility of the
solute in the solvent. However, the solubility of polymers is difficult to determine
experimentally because of their high solution viscosity. The solvent quality for
polymers has been reflected empirically by the solubility parameter [108, 109].
Shivley et. al determined the solubility parameter of PLGA as being 20.05
MPa1/2 and Lambert and Peck reported the best solubility of PLGA in solvents
with solubility parameters between 18.41–22.50 MPa1/2 [43, 45]. Ethyl acetate
(18.6 MPa1/2), NMP (23.1 MPa½), triacetin (23.7 MPa½) and benzyl alcohol (24.8
MPa1/2) had solubility parameters within or close to this range, thus resulting in
rapid dissolution times. In contrast, 2-pyrrolidone (30.1 MPa1/2) had a solubility
parameter outside this solubility parameter range and longer dissolution times
(Table 3.6). An ideal organic solvent for rapid dissolution of PLGA should thus have a
solubility parameter close to the one of the polymer and result in a low solution
viscosity. With regard to injectability, solvents resulting in a lower polymer
solution viscosity at the same polymer concentration are more desirable
because of an easier and less painful injection.
3.3 In situ forming implants (ISI)
Next, the dissolution time of PLGA was investigated within a possible
application device to be used with patients, a two syringe system with a
connector. PLGA was filled in one syringe and the solvent in the second
syringe. The two syringes were connected via a connector; the solvent was then
pushed in the polymer-containing syringe followed by pushing forward and
backward the plungers of the two syringes in order to dissolve the polymer
(Figure 3.2).

3. RESULTS AND DISCUSSION
43
Figure 3.2 Device for the preparation of in situ forming systems.
3.3.1 Factors affecting the dissolution rate
The rank order in dissolution time was the same as with the one obtained with
the shaker method (Table 3.6) except for 2-pyrrolidone, which dissolved the
polymer slightly faster than triacetin (Figure 3.3A). The dissolution times with
the two syringe system were much shorter (less than one minute) than the
dissolution times obtained with the shaker method, because the shear stress at
the PLGA particle/solvent interface was much higher with the syringe system
than within a shaken vial. The short reconstitution times of less than one minute
are in a time frame acceptable for the clinical end user, who prepares the
injectable in situ system.
3. RESULTS AND DISCUSSION
44
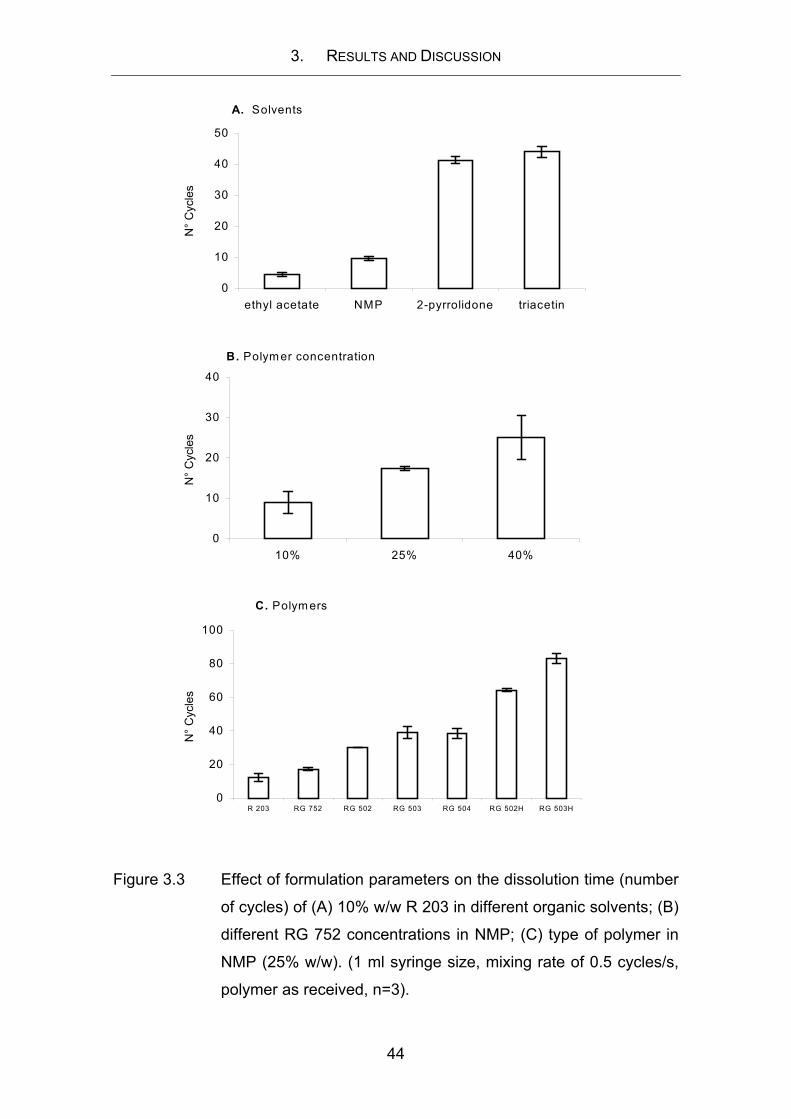
Figure 3.3 Effect of formulation parameters on the dissolution time (number
of cycles) of (A) 10% w/w R 203 in different organic solvents; (B)
different RG 752 concentrations in NMP; (C) type of polymer in
NMP (25% w/w). (1 ml syringe size, mixing rate of 0.5 cycles/s,
polymer as received, n=3).
B. Polym er concentration
0
10
20
30
40
10% 25% 40%
N° C
ycle
s
C. Polym ers
0
20
40
60
80
100
R 203 RG 752 RG 502 RG 503 RG 504 RG 502H RG 503H
N° C
ycle
s
A. Solvents
0
10
20
30
40
50
ethyl acetate NMP 2-pyrrolidone triacetin
N° C
ycle
s

3. RESULTS AND DISCUSSION
45
The drug release from in situ forming systems usually decreases with
increasing polymer solution concentration because of the formation of a denser
polymer matrix after precipitation of the polymer in situ in the body [40, 75]. The
required number of cycles to dissolve the polymer increased with increasing
polymer concentration. However, the dissolution process was still very rapid,
even a solution with a high polymer content of 40% formed after only approx. 20
cycles (40 sec) (Figure 3.3B).
The possible drug release time periods from in situ systems also depend on
polymer properties such as the molecular weight, lactide/glycolide ratio and end
group functionality of PLGAs, which control the degradation process of the
PLGAs. The dissolution time of various PLGA polymers in NMP increased with
increasing molecular weight because of an increased solution viscosity (RG
502H vs. RG 503H) (Figure 3.3C). The uncapped PLGAs (free carboxylic end
groups, marked H) RG 502H and 503H are more hydrophilic than the end-
capped PLGAs RG 502 and 503 and required more cycles to be dissolved.
Polymers with a lower glycolide content (RG 752 vs. RG 502) or pure D,L-
lactide (R 203) also resulted in faster dissolution times because of the less
hydrophilic character of the polymer and also due to the lower viscosity of their
polymeric solutions (Figure 3.4)
Figure 3.4 Viscosity of solutions prepared with different polymers at 20% w/w
in NMP.
36,7 44,863,5 69,6
111,7
198,6
739,4
0
100
200
300
400
500
600
700
800
900
1000
R 203 RG 752 RG 502 RG 502H RG 503H RG 503 RG 504
Visc
osity
, mPa
s

3. RESULTS AND DISCUSSION
46
The mixing rate (number of cycles per second) did not affect the required
number of cycles to dissolve the polymer (Figure 3.5A). This indicated a robust
reconstitution process independent of variable mixing speeds applied by the
end user. The dissolution time slightly increased with increasing syringe size at
the same polymer solution volume because of a less intensive mixing with the
larger syringes (Figure 3.5B).
Figure 3.5 Effect of (A) mixing rate (1ml syringe size) and (B) syringe size
(mixing rate of 0.5 cycles/s) on the dissolution time of RG 752 in
NMP (10% w/w, polymer as received, n=3).
B. Syringe size
0
5
10
15
20
1 ml 2 ml 5 ml
N°
Cyc
les
A. Mixing rate
0
5
10
15
20
0.25 c/s 0.5 c/s 1 c/s 2 c/s
N°
Cyc
les

3. RESULTS AND DISCUSSION
47
3.4 Freeze-drying
Powder filling of the PLGA particles into vial or syringes could be problematic
because of the small amount of PLGA (approx. 30-100 mg) required per dose
and because of the poor flow of small particles and static charge problems.
Liquid filling is an interesting alternative, which could result in a better dosing
accuracy and eliminate powder flow properties. For example, the polymer
particles could be filled as an aqueous suspensions followed by lyophilization.
Potential polymer degradation by hydrolysis (although the contact time with
water would be short) and sedimentation problems during filling have to be
addressed in this case. Alternatively, the polymer could be dissolved in an
organic solvent followed by filling of the polymer solution into a syringe (vial)
followed by lyophilization of the polymer solution, resulting in a highly porous
cake (sponge).
An additional advantage of the lyophilization process is the easy incorporation
of drugs into the in situ system. Drugs could be dissolved/dispersed in the
polymer solution prior to freeze-drying thus assuring a homogeneous
distribution of the drug within the reconstituted polymer solution and eliminating
the problems seen with filling of small amounts of drug.
3.4.1 Solvent selection
Solvents for freeze-drying had to be identified, which dissolve PLGA and which
can be frozen and be removed during the lyophilization process. The solvent
should therefore possess a melting point, which allows freezing in the
temperature range used in lyophilization (Tm > -70°C) and, ideally, a low
toxicity. From many solvents commonly used to lyophilize, 1,4-dioxane and
acetic acid fulfilled these criteria and were evaluated (Table 3.7).
Acetic acid and 1,4-dioxane are solvents for PLGA and can also be freeze-dried
because of a high enough melting point and vapor pressure to allow removal by
sublimation. Moreover, they belong to class 3 (acetic acid) and class 2 (1,4-
dioxane) in accordance with the International Conference on Harmonization
(ICH) guidelines. Class 3 solvents include no solvent known as a human health
hazard at levels normally accepted in pharmaceuticals and class 2 solvents

3. RESULTS AND DISCUSSION
48
should be limited. While class 1 solvents should not be employed in the
manufacture of drug substances, excipients and drug products because of their
unacceptable toxicity or their deleterious environmental effect [110].
Table 3.7 Solvents used for freeze- drying.
Melting point Boiling point Vapor pressure°C (a) °C (a) hPa (20°C) (b)
1-butanol -89,5 118.0 6,7 31,1,2-trichloroethene -86,4 86.9 77,0 21,4-dioxane 12,0 101.1 41,0 21-propanol -127,0 97.2 19,0 32-pyrrolidone 24,0 245,0 0,0 --2-butanol -114,0 99.5 16,5 32-methyl-1-propanol -108,0 108,0 10,6 32-propanol -89,5 82.4 43,0 33-methyl-1-butanol -117,0 130.5 3,1 3acetic acid 10,0 118,0 15,0 3acetone -95,4 56.5 233,0 2acetonitrile -45,7 81.6 97,0 2acetylene dichloride -95,0 60,0 475,0 2benzaldehyde -26,0 179,0 1,3 2butyl acetate -77,0 126,0 13,0 3chlorobenzene -45,0 132,0 12,0 2chloroform -63,0 61,0 213,0 2cumene -96,0 153,0 5,3 3cyclohexane 6,0 80.7 103,0 1dimethyl sulfoxide -18,5 189,0 0,6 3ethanol -114,5 78.5 59,0 3ethyl acetate -83,0 77,0 97,0 2ethyl ether -116,3 34.6 587,0 2ethyl formate -81,0 54,0 256,0 3Ethyl lactate -25,0 154,0 1,6 3formamide 2,0 210.5 0.08 2formic acid 8 decomp. 100.5 42,0 3heptane -90,6 98.4 48,0 3isobutyl acetate -99,0 118,0 17,0 3isopropyl acetate -73,0 89,0 61,0 3methyl acetate -98,0 56.9 217,0 3methylene chloride -95,0 39.7 475,0 3methylethyl ketone -86,0 79.6 105,0 3methylisobutyl ketone -84,0 116-118 20,2 3N-methyl-2-pyrrolidone -24,0 202,0 0,3 --pentane -129,7 36.1 573,0 3propyl acetate -95,0 101.6 33,0 3pyridine -42,0 115.3 20,0 2tert-butyl methyl ether -108,6 55.3 268,0 3tetrahydrofuran -108,5 66,0 173,0 3tetralin -36,0 207.2 0,4 2xylene >-34 137-140 10,0 2(a) Values from The Merck Index , 12th ed.; Budavari,S.,Ed,Merck: Whitehouse Station,NJ,1996 (b) Values from the web site: www.merck.de(c) Values from Department of Health and Human services. Food and Drug Administration. International Conference on Harmonization;Draft Guideline on Impurities: Residual Solvents. 1997.-- Not included on the list
Solvent Class (c)

3. RESULTS AND DISCUSSION
49
3.4.2 Process conditions
The freeze-drying process consists of three stages: prefreezing, primary drying
and secondary drying. During the freezing process the solution is transformed
into a solid, usually water and solutes crystallize or, if amorphous, transformed
to a rigid glass when the system is cooled below the glass transition
temperature (Tg) of the amorphous phase. In practice, ice does not form at the
thermodynamic or equilibrium freezing point, but normally nucleates and
crystallizes only after supercooling to about 10-15°C below the equilibrium
freezing point [79].
The freezing cycle of the lyophilization process was simulated by DSC, whereby
the freezing point of the solvent was observed upon cooling of the PLGA
solution. The freezing point of acetic acid decreased with increasing PLGA
solution concentration from –2 to –17°C due to a stronger binding of the solvent
and a higher solution viscosity retarding crystallization of the solvent (Figure
3.6A). The heat of fusion also decreased with increasing polymer content. The
freezing point depression also depends on the type of polymer (e.g.
lactide/glycolide ratio, capped vs. free carboxyl groups) and probably reflects
different solvent-polymer interactions (Figure 3.6B).
The samples were frozen at –70°C in a freezer, which is a temperature well
below the freezing point of the different formulations.
The freezing speed has influence in the structure of the final product, but this
parameter will be discussed in 3.6.1

3. RESULTS AND DISCUSSION
50
Figure 3.6 DSC thermograms of PLGA solutions: (A) RG 752 at different
polymer concentrations in acetic acid; (B) different types of PLGA
at 20% w/w in acetic acid.
A. ��������������������������������������������������������������������������������������������������������������������������������������������������������������������������������������������
��������������������
��������������������
������������������������������������������
����������������������������������������������������
���������������������������������
����������
���������������������������
����
����������������
������������������������������������������������������������������������������������������������������������������������������������������������������������������������������� �������������������������������������������������������������������������������������������������������������������������������������������������������������������������
����������������������������������������������
������������������������������������������������
�����������������
������������������������������
�����������������
��������������������������
��������������������
����������������
����������������������������������������������������������������������������������������������������������������������������������������������������������������������������������������������������������
-60 -50 -40 -30 -20 -10 0 10 20Temperature, °C
��������������������������������������30%�������������������
20%10%0%
B. ��������
������������
��������
������������������������������������������������������������������������������������������������
��������������
��������
��������������������������
��������������������������
������������������������������������������������������������
�������������������������������������������������������������
��������������������
�������������
������������
����������������
������������������������������������������
��������
��������
��������
��������
����������
������������
����������
������������
��������
��������������
��������
������������
����������
��������
��������
��������
��������
����������
������������
����������
��������
��������
������������
����������
������������
������������
������������
������������
��������������
������������
������������
����������
��������
�������� ��������������������������������������������������������������������������������������������������
������������������������������
������������������������������������������������
��������������������������������������������������������
��������������������
���������������
������
���������������
���������
������
��������������
�����������������������������������������������������������������������������������������������������������
��������
��������������
��������
������������
����������
������������
������������
����������
������������
����������
��������
��������
������������
����������
������������
������������
������������
������������
��������������
������������
������������
����������
������������
-60 -50 -40 -30 -20 -10 0 10 20Temperature, °C
�������������������RG 752RG 502HR 203�������������������RG 503HRG 502R 202H
RG 752in acetic acid Peak, °C ∆H, J/g
0% -2,00 178,1710% -5,00 135,1620% -12,50 127,1530% -17,00 102,58
Polymer 20%in acetic acid Peak, °C ∆H, J/g
RG 752 -12.5 127.15RG 502H -11.0 182.46
R 203 -6.5 162.51RG 503H -5.0 219.32RG 502 -0.5 188.98R 202H -0.5 124.45

3. RESULTS AND DISCUSSION
51
Figure 3.7 DSC thermogram of a solution of RG 503H and RG 502H with
10% lidocaine base in 1,4-dioxane (first run: 25°C to –70°C and
second run: –70°C to 85°C).
After prefreezing the product, the appropriate conditions of temperature and
pressure at which the solvent can be removed from the frozen product should
be established. A balance between the temperature that maintains the frozen
integrity of the product and the temperature that maximizes the vapor pressure
of the product is the key for an optimum drying. No phase diagrams pressure
vs. temperature were available, neither for acetic acid nor for 1,4-dioxane.
Temperature, °C
RG 503HRG 502H
-16 -60 -38 2 43 25 84
Tg' = -18°C
Tg' = -10°C

3. RESULTS AND DISCUSSION
52
Therefore, the temperature (-40°C) and pressure (0.040 mbar) selected for the
primary drying were as low as possible to ensure a process well below Tg’
(glass transition temperature in the frozen state) of the different formulations
and to allow a high sublimation rate (Figure 3.7). In the last stage of the
process, the secondary drying, the objective is to reduce the residual moisture
content to a level optimal for stability, which is usually less than 1%. Higher
vacuum and a temperature increase above 0°C but below Tg of the product
allow the desired water desorption. The conditions selected were 10°C and
0.040 mbar (Figure 3.8) [78, 79, 81].
Figure 3.8 DSC thermogram of a physical mixture of RG 503H and 10%
lidocaine base (first run: 25°C to –100°C, second run: 100°C to -
40°C and third run: -40°C to 85°C).
Temperature, °C25 58 91 52 -14 -17 16 49 82
Tg = 40°C

3. RESULTS AND DISCUSSION
53
3.4.3 Sponges dissolution rate
Porous, sponge-like matrices were obtained after lyophilization (Figure 3.9).
Figure 3.9 SEM picture of an R 202H sponge.
The PLGA sponges dissolved rapidly in different organic solvents and much
faster than the received polymer powder because of the high internal surface
area and rapid penetration of the solvent into the pores (the same number of
cycles was obtained for each case n=3) (Figure 3.10)

3. RESULTS AND DISCUSSION
54
Figure 3.10 Dissolution time of freeze-dried PLGA-sponge in comparison with
polymer (RG 752 as received from supplier) in different solvents
(25% w/w based on solvent) for in situ implants preparation
3.5 In situ forming microparticles (ISM)
In contrast to in situ implants, which form after injection of PLGA solutions, in
situ microparticles (ISM) are based on an emulsion of an internal drug-
containing PLGA solution and an external water- (O/W-ISM) or oil- (O/O-ISM)
phase [111, 112]. ISM-emulsion are generally prepared with the two syringe
system, whereby the polymer and external phase are kept in separate syringes
and are then mixed through the connector.
������������������������������������������������
����������������������������������������������������������������
������������������������������������������������
������������������������������
0
20
40
60
80
100
NMP PEG 400 Benzyl Benzoate Ethyl acetate
No C
ycle
s
polymer as received����
sponge

3. RESULTS AND DISCUSSION
55
3.5.1 ISM dissolution rate
With ISM, the reconstitution process thus has to result in the dissolution of the
polymer and the formation of the emulsion prior to injection. Surprisingly, both
the polymer dissolution and emulsion formation were possible in less than a
minute for both O/O- and O/W-ISM, even at a high polymer content of 30%
(Figure 3.11 and Table 3.8).
Figure 3.11 Dissolution time of freeze-dried PLGA-sponge in comparison with
polymer (RG 752 as received from supplier) in different solvents
(25% w/w based on solvent) for O/W-ISM (1 ml syringe size and
0.5 cycles/s).
��������������������������������������������������������������������������������
������������������������������������������������
��������������������������������������������������������������������������������
���������������������������������������������������0
20
40
60
80
100
Triacetin Benzyl Alcohol Benzylbenzoate
Ethyl acetate
No C
ycle
s
polymer as received����� sponge

3. RESULTS AND DISCUSSION
56
Table 3.8 Rate of dissolution of RG 503H sponges lyophilized with 40%
lidocaine base in O/O-ISM and O/W-ISM systems.
In general, the dissolution was faster with O/O- than with O/W-ISM systems,
probably because of the higher shear force exerted by the more viscous
external oil phase when compared to the less viscous external aqueous phase.
Only droplets and no solid polymer were visible on photographs of the
emulsions after 25 cycles (Figure 3.12).
Solvent Polymer O/O-ISM concentration (w/v) No. Cycles
2-Pyrrolidone 30% 100 DMSO 30% 15NMP 30% 15
O/W-ISMTriacetin 10% 30
Benzyl alcohol 20% 30 Ethyl acetate 30% 30

3. RESULTS AND DISCUSSION
57
A. O/O-system
B. O/W-system
Figure 3.12 Pictures of ISM-emulsions after 25 mixing cycles (0.5 cycles/s),
prepared with RG 752 10% w/w based on solvent: (A) O/O-system
with 2-pyrrolidone as solvent and (B) O/W-system with ethyl
acetate as solvent.

3. RESULTS AND DISCUSSION
58
The droplet size was bigger with the O/O-ISM, because of the higher polymer
solution viscosity in 2-pyrrolidone (O/O) than in ethyl acetate (O/W). The droplet
size decreased with the number of increasing mixing cycles (Figure 3.13). The
size of the droplets only slightly increased from 8.1 µm to 12.9 µm during a 2 h
storage at a 10% polymer concentration and from 10.2 µm to 12.6 µm for 25%
polymer concentration (Figure 3.14). The reconstituted emulsion, which would
normally be injected immediately after preparation, thus could be used within a
2 h time frame after preparation.
Figure 3.13 Effect of the number of mixing cycles on the droplet size of O/W-
and O/O-ISM systems at two different polymer concentrations
(w/w based on solvent) (polymer: PLGA RG 752, mixing rate:0.5
cycles/s).
���������������������������������������
������������������������������������������������������������
������������������������������������������������������������������������������������������������
������������������������������������������������������������������������������������������������
0
5
10
15
20
25
O/W, 10% O/W, 25% O/O, 10% O/O, 25%
drop
let s
ize,
µm
10 cycles25 cycles
���������� 50 cycles

3. RESULTS AND DISCUSSION
59
Figure 3.14 Stability of O/O-ISM prepared with RG 752 as received and NMP
as solvent at two different concentrations, 10% and 25% w/w
based on solvent (mixing rate:0.5 cycles/s).
3.5.2 Effect of the mixing method
Various possibilities exist to prepare the ISM-emulsions. Three different
methods were compared (see section 2.2.6). In method A, the polymer was
placed in one syringe and the organic solvent with the external phase (oil or
water) in the second syringe without mixing (two phases); both syringes were
then connected and the contents mixed to dissolve the polymer and form the
ISM-emulsion. In method B, an emulsion of the organic solvent with the external
phase was formed and was then pushed into the polymer-containing second
syringe followed by mixing. In method C, the polymer was dispersed in the oil or
0
2
4
6
8
10
12
14
16
10% 25%
drop
let s
ize,
µm
after mixing2 h after mixing

3. RESULTS AND DISCUSSION
60
water and then added to the solvent-containing second syringe followed by
mixing. Different ratios of solvent: water or oil (1:1, 1:2, 1:3 and 1:4) and
different polymer particle sizes were tested with method C. O/W-systems
dissolved fast, independent of the polymer particle size or the method used.
However, an increase in the amount of external water phase resulted in gel
formation during mixing due to polymer precipitation prior to emulsion formation
because of rapid diffusion of the organic solvent into in the external phase. The
dissolution time of PLGA in O/O-ISM systems decreased with the particle size
decrease and improved with method C, PLGA dispersion in the external oil
phase avoids agglomeration and allows a better dissolution when in contact
with the solvent. Nevertheless, increase in the phase ratio above 1:2 did not
improve the dissolution rate (Table 3.9).
Table 3.9 Dissolution time of RG 503H in ISM-systems prepared by different
mixing methods: O/W-systems, 20% w/v polymer in benzyl alcohol
and O/O-systems, 20% w/v polymer in DMSO.
Method A Method B1:1 1:1 1:1 1:2 1:3 1:4
O/W-ISMAs received 30 30 25 25 G 25 G 25G
< 160 µm 25 30 28 15 G 20 G 15Lyophilized 30 - - - - -O/O-ISM
As received * * * * * *< 160 µm 90 90 40 10 10 10< 50 µm 30 35 15 10 10 10
Lyophilized 15 - - - - -G- gel formed* polymer lump formed'- not determined
polymerMethod C
3. RESULTS AND DISCUSSION
61
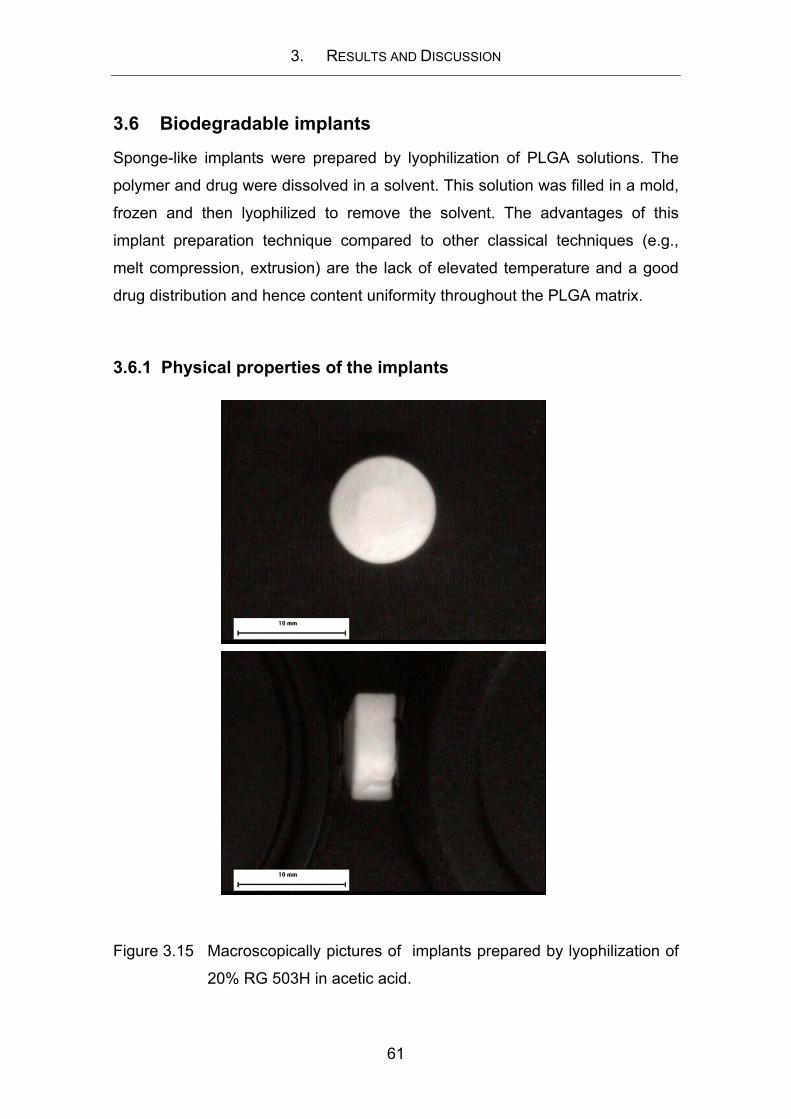
3.6 Biodegradable implants
Sponge-like implants were prepared by lyophilization of PLGA solutions. The
polymer and drug were dissolved in a solvent. This solution was filled in a mold,
frozen and then lyophilized to remove the solvent. The advantages of this
implant preparation technique compared to other classical techniques (e.g.,
melt compression, extrusion) are the lack of elevated temperature and a good
drug distribution and hence content uniformity throughout the PLGA matrix.
3.6.1 Physical properties of the implants
Figure 3.15 Macroscopically pictures of implants prepared by lyophilization of
20% RG 503H in acetic acid.

3. RESULTS AND DISCUSSION
62
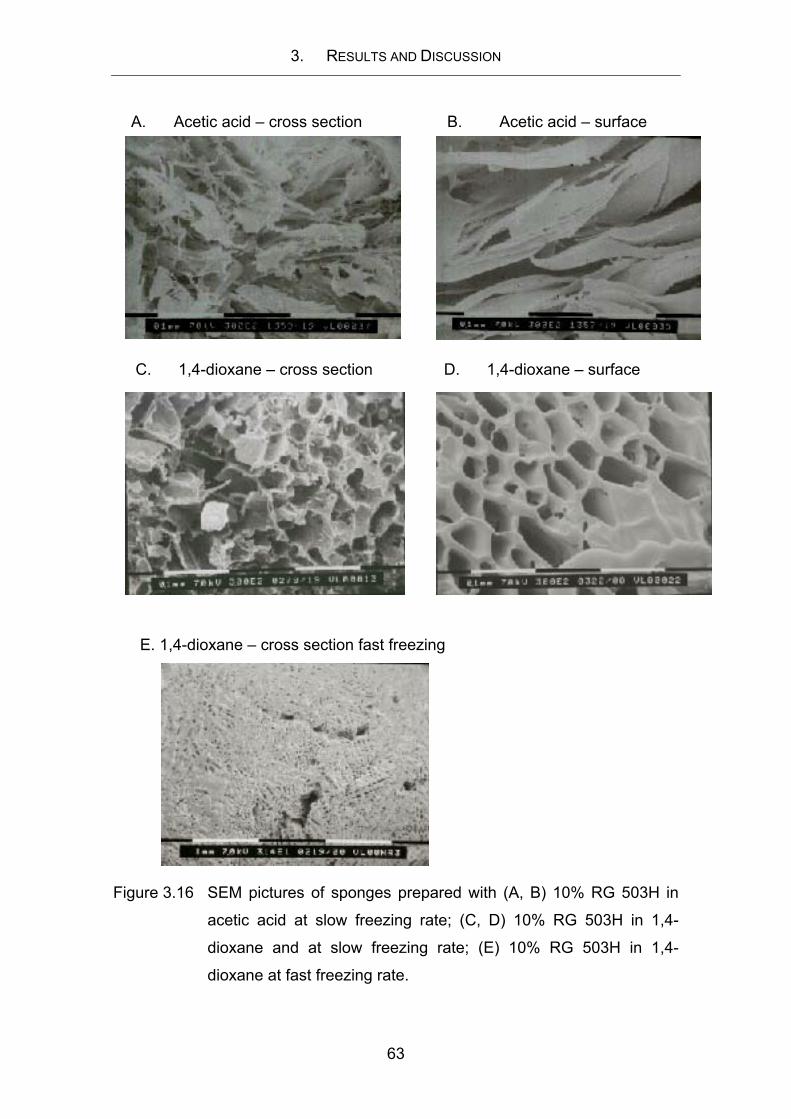
Morphology
Porous, sponge-like implants were obtained. 1,4-dioxane resulted in implants
with regular-shaped pores and a continuous PLGA network, while acetic acid
resulted in a more irregular structure, like leaflet or platelet structure. The pore
structure depends on the geometry of frozen solvent crystals before sublimation
and the polymer phase separation during the freezing process (Figure 3.16A-D)
[113]. Foda et. al founded that sheet-like structures are produced by partial
collapse of pores during freeze-drying, since unorganized ice crystal growth
may induce irregular sublimation with recrystallization of solvent vapor and
secondary sublimation in the same areas during the lyophilization process.
While a continuous open channel structure is obtained after a regular ice crystal
growth leading to a more regular sublimation between the surface and the
interior of the sponge without recrystallization [114, 115].
The freezing rate of the polymeric solutions strongly affected the morphology
and pore structure/size of lyophilized cakes. Implants prepared by a rapid
freezing of the PLGA solution have a visually denser structure with smaller
pores when compared to larger pores obtained with slower freezing rates
(Figure 3.16C and E). A higher degree of supercooling and a low temperature
induce a high nucleation rate and a low crystal growth rate, leading to the
formation of a large number of small crystals. On the other hand, a relatively low
degree of supercooling at a higher temperature, produce a small number of
large crystals, due to the low nucleation rate and the high crystal growth rate
[89, 115, 116].
3. RESULTS AND DISCUSSION
63
A. Acetic acid – cross section B. Acetic acid – surface
C. 1,4-dioxane – cross section D. 1,4-dioxane – surface
E. 1,4-dioxane – cross section fast freezing
Figure 3.16 SEM pictures of sponges prepared with (A, B) 10% RG 503H in
acetic acid at slow freezing rate; (C, D) 10% RG 503H in 1,4-
dioxane and at slow freezing rate; (E) 10% RG 503H in 1,4-
dioxane at fast freezing rate.

3. RESULTS AND DISCUSSION
64
As expected, at higher polymer concentrations more dense matrices were
obtained (Figure 3.17). The polymer type affected the matrix structure, since
more rigid structures with well interconnected pores were obtained at high
molecular weight polymers (Figure 3.18B, D and F) or pure D,L-lactide polymer,
as R 202H (Figure 3.18A). Low molecular weight polymers (RG 752 or RG
502H) presented superimposed porous layers (Figure 3.18C and E).
A. 5% B. 20%
C.
C. 30%
Figure 3.17 SEM pictures of sponges prepared with RG 503H in 1,4-dioxane
at different concentrations and slow freezing rate, (A) 5%, (B) 20%
and (C) 30%.

3. RESULTS AND DISCUSSION
65
A. R 202H B. R 203
C. RG 502H D. RG 503
E. RG 752 F. RG 755
Figure 3.18 PLGA sponges prepared with 10% drug loading (lidocaine base) in 10%
1,4-dioxane solutions of different polymers (A) R 202H, (B) R 203, (C)
RG 502H, (D) RG 503, (E) RG 752 and (F) RG 755.

3. RESULTS AND DISCUSSION
66
Glass transition temperature (Tg) and residual solvent
After freeze-drying, the glass transition temperature of the sponges decreased as a
consequence of the residual solvent, that act as a plasticizer for the polymer [117].
Sponges prepared with 1,4-dioxane presented less residual solvent but a more
significantly decline of Tg, suggesting a stronger plasticizer effect of 1,4-dioxane in
comparison with acetic acid that did not show a significantly decrease (Table 3.10).
Explained by the higher affinity of the polymer with 1,4-dioxane, a non-polar solvent
(37,2% polarity), compared with the higher polar acetic acid (73,4% polarity). The
freezing rate has no influence neither in the Tg nor in the residual solvent of the
sponges, while the presence of lidocaine base decreases the Tg values of the
sponges, as explained in 3.6.2 (Table 3.10).
Table 3.10 Glass transition temperature (Tg) and % of residual solvent of sponges
prepared with 30% of PLGA RG 503H in two different solvents and 10%
lidocaine base.
The Tg value for the different polymers tested decreased between 11°C to 17°C after
lyophilization in the presence of lidocaine base (Table 3.11), but without influence of
the type of polymer used. Sponges prepared from PLGAs with free carboxylic end
groups (H-grades) had a slight increase in the residual solvent content than sponges
prepared from the end-capped polymers. The solvents thus had a few more affinity
for the more hydrophilic H-grade polymers (Table 3.11)
Polymer Freezing rate Solvent Drug Tg, °C (a) Res. Solv., % (a)RG 503H slow acetic acid no drug 46.1(49.9) 1.4 (0.5)RG 503H slow acetic acid lidocaine base 38.5 2.5RG 503H slow 1,4-dioxane lidocaine base 29.3 1.6RG 503H slow 1,4-dioxane no drug 34.8 ---RG 502H slow acetic acid no drug 47.3 (46.7) 1.5 (0.6)RG 502H fast acetic acid no drug 48.5 1.4
(a) Value on parenthesis corresponds to the polymer as received. '--- not measured

3. RESULTS AND DISCUSSION
67
Table 3.11 Glass transition temperature (Tg) and % of residual solvent of sponges
prepared with 20% of different PLGA polymers in acetic acid and 10%
lidocaine base.
Figure 3.19 Glass transition temperature (Tg) of sponges prepared at different RG
503H concentrations in 1,4-dioxane without drug.
Polymer Freezing rate Tg °C (a) Residual solvent (a)R 202H slow 38.7 (50.7) 1.7%R 203 slow 35.5 (52.9) 1.0% (0.5%)
RG 502H slow 32.5 (46.7) 1.7% (0.6%)RG 503 slow 38.7 (50.2) 1.4% (0.4%)
RG 504H slow 38.8 (50.1) 1.9% (a) Value on parenthesis corresponds to the polymer as received.
���������������������������������
���������������������������������������������
����������
����������
������������������������������������������������������������������
�����������������������������������������������������������������������������������������������������
���������������������������������������������������������������������������
����������
����������
����������
�������������������������������������������������������������������������
����������
�������������������������������
-40 0 40 80 120Temperature,°C
10%�����������������������������
20% 30%
END
O
>

3. RESULTS AND DISCUSSION
68
Figure 3.20 Percentage of residual solvent in sponges prepared with RG 503H at
different concentrations in acetic acid and 10% lidocaine base.
The glass transition temperature, as well as the content of residual solvent were not
influenced by the polymer concentrations used (Figure 3.19 and 3.20)
�����������������������������������
��������������������������������������������������������������������������������������������������������
�������������������������������
������������������������������������������������������������������������
������������������������������������������������������������������������������������������
����������������������������������������������������������������������������������������
����������������������������������������������������������������������������������������������������������������������������������������������������������������������������������������������
97,0
97,5
98,0
98,5
99,0
99,5
100,0
100,5
0 2 4 6 8 10 12Time, min
Wei
ght l
oss,
%
10%������������������������������������
20%
30%

3. RESULTS AND DISCUSSION
69
Mechanical properties
According to the application intended for the polymeric implants, the mechanical
properties of the sponges must be sufficient so that it does not collapse during
manipulation, insertion or use. Since no specific use for the PLGA sponges is here
defined, the strength and % of recovery of the implants was assessed after variation
of some process and formulation parameters, in order to find the versatility of the
device.
A.
B.
Figure 3.21 (A) Compressive strength (Force) and (B) % of recovery of sponges
prepared with two different polymers at 10% and 30% concentration in
two different solvents.
���������������������������������������������������������������������������������������������������������������������������������������������������������������������������������������������������
���������������������������������������������������������������������������
��������������������������������������������������������������������������������
0
50
100
150
200
250
300
350
400
450
RG 503H 30% RG 503H 10% RG 755 10%
Forc
e, N
acetic acid���1,4-dioxane
������������������������������������������������������������������������������������������������������������������������������������������������������������������������������������
����������������������������������������������������������������������������������������������������������������
����������������������������������������������������������������������������������������������������������������
0
10
20
30
40
50
60
70
80
90
100
RG 503H 30% RG 503H 10% RG 755 10%
Rec
over
y, %
acetic acid������ 1,4-dioxane

3. RESULTS AND DISCUSSION
70
Implants prepared with 1,4-dioxane had a higher mechanical strength than implants
prepared with acetic acid. A non well defined and irregular structure will be less
resistant, as was the case of acetic acid sponges (Figure 3.21A) [118]. However the
differences in the percentage of recovery were not marked (Figure 3.21B).
A.
B.
Figure 3.22 (A) Compressive strength (Force) and (B) % of recovery of sponges
prepared with RG 502H 30% in acetic acid, at two different freezing
rates.
���������������������������������������������������������������������������������������������������������������������������������������������������������������������
����������������������������������������������������������������������������������������������������������������������������������������������������������������
������������������������������������������������������������������������������������������������������������������������������������������������
0
50
100
150
200
250
300
350
No drug 10% L. Base 10% L. HCl
Forc
e, N
fast freezing����
slow freezing
������������������������������������������������������������������������������������������������������������������������������������������������������������������������
������������������������������������������������������������������������������������������������������������������������������
������������������������������������������������������������������������������������������������������������������������������������������������������
0
10
20
30
40
50
60
70
80
90
100
No drug 10% L. Base 10% L. HCl
Rec
over
y, %
fast freezing������ slow freezing

3. RESULTS AND DISCUSSION
71
Surprisingly, no difference in the mechanical properties of sponges prepared by
different freezing rates was found (Figure 3.22). Since more porous sponges present
weaker mechanical strength, expected was a higher resistance in sponges freezed
slowly (Figure 3.16A and B) [119]. However, this suggests that the difference in the
freezing rate will alter the pore size but not the porosity.
A.
B.
Figure 3.23 Compressive strength (Force) for sponges prepared at (A) 10% of
different PLGA polymers in 1,4-dioxane and 10% lidocaine base and
(B) three different concentration of RG 503H in 1,4-dioxane.
0
20
40
60
80
100
120
140
160
R 203 RG 503 RG 504H RG 503H RG 755
Forc
e, N
0
100
200
300
400
500
10% 20% 30%
Forc
e, N

3. RESULTS AND DISCUSSION
72
The mechanical properties were influenced mainly by the type and concentration of
the polymer used (Figure 3.23 and 3.24). Pure D,L-lactide sponges (R203) were less
resistant than those prepared with the copolymers, this is in agreement with the
technical information that reports lower tensile strength for D,L-PLA (27.6-41.4 MPa)
in comparison with PLGA (41.4-55.2 MPa) [14]. Furthermore, the strength was
directly related to the polymer concentration, since denser matrices possess higher
resistance to compression (Figure 3.23 and 3.17).
No effect of the drug state or loading was observed (Figure 3.22 and 3.24).
Figure 3.24 Compressive strength (Force) for sponges prepared at 10% RG 503H
in 1,4-dioxane and different lidocaine base concentrations.
3.6.2 Drug distribution
The implants were prepared by freeze-drying of drug-containing PLGA solutions.
After freezing, the drug could be either within the polymer phase and or within the
frozen solvent phase. In the later case, the drug would then be present within the
pores. Drug present within the polymer matrix could be either dissolved or dispersed
(amorphous or crystalline) in the polymer. Lidocaine remains crystalline after freeze drying (Figure 3.25A), but sponges
prepared by freeze drying a drug-polymer solution in 1,4-dioxane presented no signs
of cristallinity (Figure 3.25B and 3.26). Films were clear in appearance, except for the
formulation with 40% lidocaine, which presented some drug crystals in the polymer
film (data not shown).
0
20
40
60
80
100
120
140
160
10% Base 25% Base 40% Base
Forc
e, N

3 RESULTS AND DISCUSSION
73
A.
B.
Figure 3.25 DSC thermograms of (A) lidocaine base as received and lyophilized (B)
polymer as received and correspondent sponges with and without 10%
lidocaine base.
���������������������������������������������������������
������������
�����������������������������������������������������������������������������������������������
������������������������������������������������������������������������������������
����������������
������������
������������
-40 -20 0 20 40 60 80 100Temperature °C
sponge without lidocainesponge with 10% lidocaine
�������������������������RG 752 as received
END
O
>
-40 -20 0 20 40 60 80 100 120Temperature °C
lidocaine as receivedfreeze-dried lidocaine
END
O >

3 RESULTS AND DISCUSSION
74
Figure 3.26 XRD of (A) freeze dried lidocaine base and (B) sponge with 10%
lidocaine base.
In the first run of DSC thermograms of physical mixtures of drug and polymer, two
peaks appeared, at 56°C (polymer Tg) and between 68-70°C (lidocaine base) or
between 79–80°C (lidocaine hydrochloride). The area under the melting peak of the
drug was directly proportional to the amount of drug present. In the second run no
0 5 10 15 20 25 30 35 40
2 theta, degrees
A.
0 5 10 15 20 25 30 35 40
2 theta, degrees
B.

3 RESULTS AND DISCUSSION
75
20 40 60 80 100Temperature, °C
40% lidocaine base
10% lidocaine base
END
O >
drug melting peak was observed, except for the sponges with 40% lidocaine base
(Figure 3.27).
A. First run
B. Second run
Figure 3.27 DSC thermograms of physical mixtures of sponges of RG 503H with
lidocaine base (A) first run (B) second run.
-40 -20 0 20 40 60 80 100Temperature °C
40% lidocaine base
10% lidocaine base
END
O
>

3 RESULTS AND DISCUSSION
76
The lowering and broadening of the melting point of the drug, as much as to make it
undetectable using DSC, as well as an amorphous state by XRD are signs of solid
solubility [120, 121]. The lidocaine / PLGA solubility is confirmed by comparison of
their solubility parameters. It was demonstrated that two compounds are likely to be
miscible when the difference between their solubility parameters is less than 7 MPa1/2
[18]. Lin and Nash reported three lidocaine base solubility parameter values obtained
by three different methods, 21.89 MPa1/2 (Fedor's group contribution method), 23.52
MPa1/2 (Hildebrand solubility parameter determined by the three solvent system) and
22.91 MPa1/2 (Hildebrand solubility parameter determined by the five solvent system)
[19]. Shivley et al. determined experimentally the solubility parameter value for
PLGA, to be 20.05 MPa1/2 [12]. Since the solubility parameter value for the lidocaine
is very close to that of PLGA, solubility of the drug in the polymer can be assumed.
The presence of drug affected the Tg of the polymer, it decreased from 49.9°C
(polymer as received) to 38.5°C for lidocaine-containing sponges (Table 3.9). This
suggested a plasticizing effect of the lidocaine. Chen et al. also reported a lidocaine
plasticizing effect on PLA-based microspheres [122]. The plasticizing effect was
observed also with the physical mixtures. After the second heating run, once polymer
and drug have been dissolved, the Tg of polymer decreased. The maximum solubility
of the lidocaine base within the polymer was found to be between 25% and 40%
loading, since recrystallization was found at 40% drug concentration but not at 25%
(Figure 3.28). In the case of lidocaine hydrochloride, sponges even at 40% drug
loading presented no recrystallization peak. DSC results of the drug as received
showed no recrystallization during the cooling and consequently no melting point
after reheating (Figure 3.29). This then presumes that the drug remains amorphous
or degrades after melting.

3 RESULTS AND DISCUSSION
77
Figure 3.28 DSC thermograms of sponges of sponges of 10% RG 503H in
1,4- dioxane with different lidocaine base concentrations.
Figure 3.29 DSC of lidocaine hydrochloride as received (25°C to 120°C, 120°C to –
40°C and –40°C to 140°C).
3.6.3 Drug release
The lidocaine release from films was compared from that of the sponges, being
slower for the sponges (Figure 3.30 and 3.31). Expected was the contrary since the
films were prepared with a polymer with a lower degradation rate, RG 752, and the
sponges are highly porous facilitating the lidocaine diffusion. But, due to the porosity,
the sponges floated and the drug was released only from the surface in contact with
the medium. No big differences were observed between different polymer
concentrations or drug loadings. In contrast, when the sponges were totally
immersed in the medium, the lidocaine was released faster (Figure 3.32).
Temperature, °C
END
O >
0 50 100 90 40 -10 -20 30 80 140
������������
����������
������������
������������
��������
�����������������������������������������������������������������������������������������������������������������������
��������������������
������������������������
-40 -20 0 20 40 60 80 100Temperature,°C
25% lidocaine�����������������10% lidocaine40% lidocaine
END
O>

3 RESULTS AND DISCUSSION
78
Figure 3.30 Lidocaine release from films prepared with 20% RG 752 in 1,4-dioxane
and different lidocaine loading.
Figure 3.31 Lidocaine release from floating sponges of RG 503H in 1,4-dioxane at
different concentrations and 10% lidocaine base.
0
20
40
60
80
100
120
0 5 10 15 20 25 30
Time, d
drug
rele
ased
, %10% lidocaine base18% lidocaine base25% lidocaine base
0
20
40
60
80
100
120
0 5 10 15 20 25Time, d
drug
rele
ased
, %
20% polymer concentration30% polymer concentration40% polymer concentration

3 RESULTS AND DISCUSSION
79
Figure 3.32 Release from non-floating sponges prepared with RG 503H in 1,4-
dioxane at different concentrations and 10% lidocaine base.
The faster initial release was due to the high water uptake during the first two days
(75%) in presence and absence of lidocaine base (Figure 3.33). However, a
continuous increase in the swelling of the sponges was visible during 28 days (Figure
3.34 and 3.35).
Figure 3.33 Water uptake of sponges (20% RG 503H in 1,4-dioxane and 10%
lidocaine base or no drug) immersed in PBS pH 7.4 during 28 days.
0
20
40
60
80
100
120
0 2 4 6 8 10 12 14 16Time, d
drug
rele
ased
, %
10%20%30%
0
25
50
75
100
0 5 10 15 20 25 30Time, d
Wat
er u
ptak
e, %
lidocaine sponges
drug-free sponges

3 RESULTS AND DISCUSSION
80
0 hours 72 hours
7 days 14 days
28 days
Figure 3.34 Frontal macroscopical pictures of sponges prepared with 20%
RG 503H in acetic acid, after different incubation times in PBS
pH 7.4.

3 RESULTS AND DISCUSSION
81
0 hours 72 hours
7 days 14 days
28 days
Figure 3.35 Side macroscopical pictures of sponges prepared with 20% RG 503H in
acetic acid, after different incubation times in PBS pH 7.4.

3 RESULTS AND DISCUSSION
82
Figure 3.36 Swelling behavior, (A, B, C) height, (D, E, F) diameter and (G, H, I)
weight change, of individual samples of sponges (9 mm diameter)
prepared with RG 503H at different concentrations in 1,4-dioxane.
The sponges increased in size in a ratio inversely proportional to the polymer
concentration, due to the porosity. More porous sponges, e.g. less polymer
concentration, absorb more buffer (Figure 3.36). However, in all cases, around the
seventh day, changes in size were visible. Since is this the start point of degradation,
as observed from the mass loss studies (Figure 3.37).
A. 20% Polymer + 10% lidocaine base
0
50
100
150
0 5 10 15 20Time, d
Hei
ght c
hang
e, %
B. 30% Polymer + 10% lidocaine base
0
50
100
150
0 5 10 15 20Time, d
Hei
ght c
hang
e, %
C. 30% Polymer without drug
0
50
100
150
0 5 10 15 20Time, d
Hei
ght c
hang
e, %
D. 20% Polymer + 10% lidocaine base
0
50
100
150
200
250
300
0 5 10 15 20Time, d
Dia
met
er c
hang
e, %
E. 30% Polymer + 10% lidocaine base
0
50
100
150
200
250
300
0 5 10 15 20Time, d
Dia
met
er c
hang
e, %
F. 30% Polymer without drug
0
50
100
150
200
250
300
0 5 10 15 20Time, d
Dia
met
er c
hang
e, %
G. 20% Polymer + 10% lidocaine base
0
1000
2000
3000
4000
5000
0 5 10 15 20Time, d
Wei
ght c
hang
e, %
H. 30% Polymer + 10% lidocaine base
0
1000
2000
3000
4000
5000
0 5 10 15 20Time, d
Wei
ght c
hang
e, %
I. 30% Polymer without drug
0
1000
2000
3000
4000
5000
0 5 10 15 20Time, d
Wei
ght c
hang
e, %

3 RESULTS AND DISCUSSION
83
Figure 3.37 Mass loss of sponges (20% RG 503H in 1,4-dioxane and 10% lidocaine
base or no drug) immersed in PBS pH 7.4 during 28 days.
The presence of drug is an important factor on the PLGA degradation rate. Drug-free
sponges increased in size less than lidocaine-containing sponges (Figure 3.36 C, F,
I), they also presented a slower mass loss in comparison with drug loaded sponges
(Figure 3.37). This could be attributed to the lower porosity of lidocaine-free sponges
(Figure 3.38) and to the polymer-drug interactions, since the basic lidocaine will
catalyzed the cleavage of the ester bonds more rapidly [122-124]. This basic
catalysis degradation was also confirmed with the DSC thermograms obtained for the
freeze-dried samples after swelling (Figure 3.39).
0
5
10
15
20
25
0 5 10 15 20 25 30Time, d
Mas
s lo
ss, %
lidocaine sponges
drug-free sponges

3 RESULTS AND DISCUSSION
84
A.
B.
Figure 3.38 SEM pictures of sponges prepared with RG 503H 20% in 1,4-dioxane
and (A) 10% lidocaine base and (B) no drug.

3 RESULTS AND DISCUSSION
85
Figure 3.39 DSC thermograms of sponges (20% RG 503H in 1,4-dioxane) as a
function of incubation time (A) drug-free sponges and (B) 10% lidocaine
base sponges.
0 20 40 60 80 100Temperature, °C
28 d
21 d
14 d
7 d
72 h
48 h
24 h
6 h
A
0 20 40 60 80 100Temperature, °C
28 d21 d14 d7 d72 h48 h24 h6 h
B

3 RESULTS AND DISCUSSION
86
Tg for both drug-free and lidocaine sponges, shift to lower temperatures after 7 days
of incubation, indicating a decrease in the molecular weight of the polymer backbone.
After 28 days only the drug-loaded samples presented a double Tg, corresponding to
crystallizable oligomers product of the polymer degradation (Figure 3.39). Similar
behavior for poly(D,L-lactide-co-glycolide) microspheres was reported [125]. The start
of degradation is evident after 7 days with the increase in porous size, that
continuous until 28 days (Figure 3.40).
The sponge’s size is a factor with big impact on the degradation rate. Small sponges
(6 mm diameter) start to decrease in size after 7 days and disintegrate within 20
days, while big sponges (9 mm diameter) continue growing even after 15 days
(Figure 3.41 and 3.42). The faster degradation of smaller devices could be related
with their larger surface area that controlled the water diffusion and thus hydrolysis
[126]. Since the sponges size increased quite a lot, a device to be implanted should
be necessarily smaller, to offer more comfort to the patient.
The release of lidocaine obtained during the first 24 hours (time frame for greater
drug release), from sponges prepared by varying some formulation parameters was
also compared. The polymeric implants prepared with acetic acid released faster the
drug than those prepared with 1,4-dioxane, as well lidocaine base was released
faster from sponges prepared with RG 502H, a lower molecular weight polymer
compared with RG 503H. Since the release was governed by the swelling behavior
and not by polymer degradation, the differences are a reflex of the porosity. The
release is faster for higher drug loadings (10% vs. 40%) and for the salt, due to the
higher solubility in the medium (Figure 3.43)

3 RESULTS AND DISCUSSION
87
0 hours 72 hours
7 days 21 days
28 days
Figure 3.40 SEM pictures of freeze-dried sponges prepared with 20% RG 503H in
1,4-dioxane, after different incubation times in PBS pH 7.4.

3 RESULTS AND DISCUSSION
88
Figure 3.41 Swelling behavior (height, diameter and weight change) of small
sponges (6 mm diameter) prepared with RG 503H at different
concentrations in 1,4-dioxane.
-100
-75
-50
-25
0
25
50
75
100
0 5 10 15 20 25 30Time, d
Hei
ght c
hang
e, %
20%30%40%
A
-100-75-50-25
0255075
100125150
0 5 10 15 20 25 30Time, d
Dia
met
er c
hang
e, %
20%30%40%
B
-200
-100
0
100
200
300
400
500
600
0 5 10 15 20 25 30Time, d
Wei
ght c
hang
e, %
20%30%40%
C

3 RESULTS AND DISCUSSION
89
Figure 3.42 Swelling behavior (height, diameter and weight change) of big sponges
(9 mm diameter) prepared with RG 503H at different concentrations in
1,4-dioxane.
0
25
50
75
100
125
150
0 5 10 15 20 25Time, d
Hei
ght c
hang
e, %
20%30%30% no drug
A
0
50
100
150
200
250
0 5 10 15 20 25Time, d
Dia
met
er c
hang
e, %
20%30%30% no drug
B
0
1000
2000
3000
4000
0 5 10 15 20 25Time, d
Wei
ght c
hang
e, %
20%30%30% no drug
C

3 RESULTS AND DISCUSSION
90
Figure 3.43 One day drug release from sponges prepared with (A) 20% RG 503H in
different solvents and 10% lidocaine base, (B) 30% of two different
polymers in acetic acid and 10% lidocaine base and (C) 30% RG 503 in
1,4-dioxane and different drug loadings and state (base and salt).
0
20
40
60
80
100
0,0 0,2 0,4 0,6 0,8 1,0Time, d
drug
rele
ased
, %
acetic acid
1,4-dioxane
A
0
20
40
60
80
100
0,0 0,2 0,4 0,6 0,8 1,0Time, d
drug
rele
ased
, %
10% L. hydrochloride40% L. base10% L. base
C
0
20
40
60
80
100
0,0 0,2 0,4 0,6 0,8 1,0Time, d
drug
rele
ased
, %
RG 502H
RG 503H
B

3 RESULTS AND DISCUSSION
91
3.6.4 Sponges curing
After freeze drying, the implants were temperature-cured in order to possible slow
down the release by closing of pores and to decrease the residual solvent (permitted
limits: acetic acid: 0.50% and 1,4-dioxane: 0.03%) [110]. The maximal secondary
drying temperature possible in the freeze-drier was 40°C, therefore for 50°C and
above a vacuum dryer was used. The residual solvent decreased and the Tg
increased with curing temperatures at or above 50°C, indicating a less plasticizing
effect because of the less amount of solvent present and leading to an increase in
the strength of the sponges (Table 3.12 and Figure 3.44).
Table 3.12 Glass transition temperature, residual solvent and mechanical
properties of sponges of 30% RG 503H in acetic acid and 10%
lidocaine base, cured at different temperatures.
Curing, °C Tg, °C Res. solvent, % F max., N Recovery, %22°C 38.5 2.46 312.28 72.6230°C 38.7 2.61 --- ---50°C 41.9 1.65 383.82 92.2965°C 41.6 1.10 --- ---70°C 41.8 0.90 --- ---
'--- not measured

3 RESULTS AND DISCUSSION
92
Figure 3.44 (A) DSC thermogram and (B) TGA of sponges of 30% RG 503H
in acetic acid and 10% lidocaine base, cured at different
temperatures.
-40 -20 0 20 40 60 80 100Temperature, °C
22°C
30°C
50°C
65°C
70°C
A
97,0
97,5
98,0
98,5
99,0
99,5
100,0
100,5
0 2 4 6 8 10 12Time, min
Wei
ght l
oss,
%
70°C
65°C
50°C
22°C
30°C
B

3 RESULTS AND DISCUSSION
93
A.
B.
Figure 3.45 SEM pictures of sponges prepared with 30% RG 502H in acetic
acid and 10% lidocaine base, before and after curing.
3 RESULTS AND DISCUSSION
94
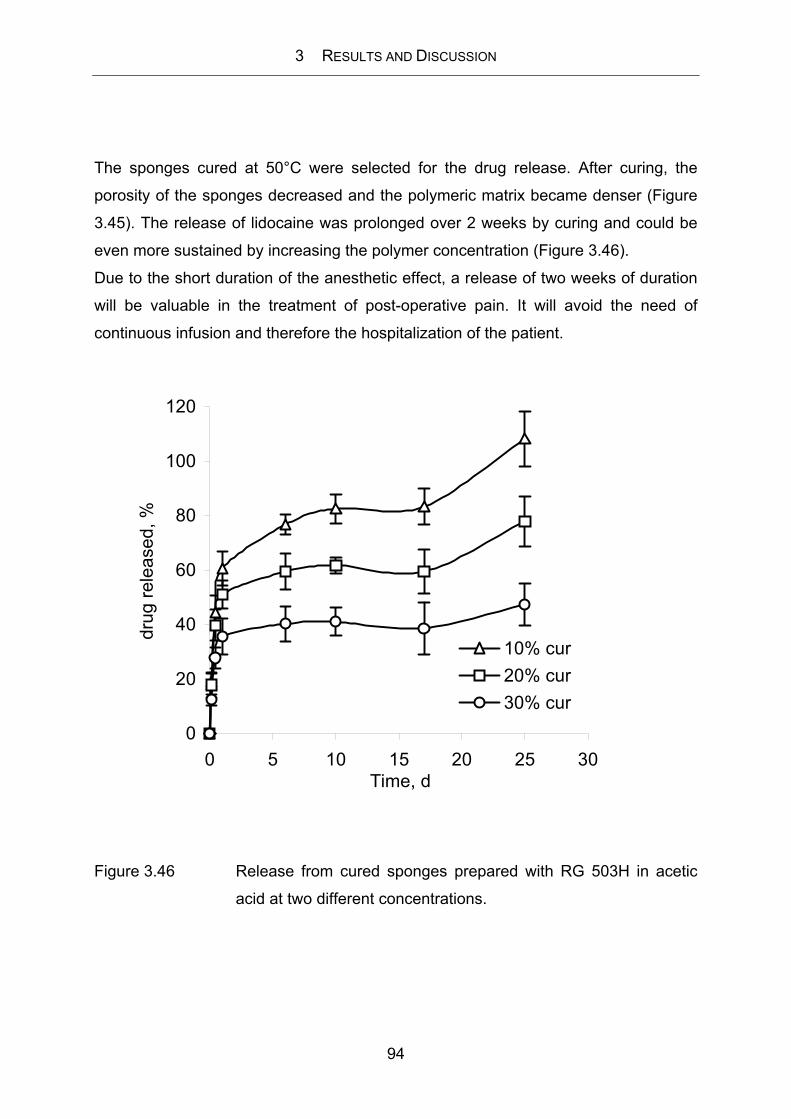
The sponges cured at 50°C were selected for the drug release. After curing, the
porosity of the sponges decreased and the polymeric matrix became denser (Figure
3.45). The release of lidocaine was prolonged over 2 weeks by curing and could be
even more sustained by increasing the polymer concentration (Figure 3.46).
Due to the short duration of the anesthetic effect, a release of two weeks of duration
will be valuable in the treatment of post-operative pain. It will avoid the need of
continuous infusion and therefore the hospitalization of the patient.
Figure 3.46 Release from cured sponges prepared with RG 503H in acetic
acid at two different concentrations.
0
20
40
60
80
100
120
0 5 10 15 20 25 30Time, d
drug
rele
ased
, %
10% cur20% cur30% cur

3 RESULTS AND DISCUSSION
95
3.6.5 Follow-up stability
One of the main stability issues with solid dispersions / solutions is the conversion of
the drug to the crystalline state after storage [127]. Samples stored at room
temperature during 2.5 years were studied by DSC to find out whether the lidocaine
was able to recrystallize. The results showed no melting peak, indicating that the
samples are physically stable under storage at ambient conditions. Also a shift of Tg
to lower temperatures, which could be a sign of polymer degradation, was not
observed (Figure 3.47).
Figure 3.47 DSC thermogram of sponges (10% RG 503H in 1,4-dioxane) after
storage at ambient conditions during 2.5 years.
�����������������������������������������������������������������������������������������������
����������
�������������������������������������������������������������
���������������������
����������
�����������������������������������������������������������������������������
����������������������������������������������������������������������
���������������������������������������������������������������������
����������������
������������������
����������������
����������
����������������������������������
����������
��������
����������������
����������������
������������������
����������������
10 20 30 40 50 60 70 80 90 100Temperature, °C
Lidocaine base
Sponge 25% L. base�����������������
Sponge 18% L. Base�����������������
Sponge 10% L. base
endo
>

3 RESULTS AND DISCUSSION
96
3.7 Conclusion
An improvement in the storage stability of in situ forming systems was achieved by
freeze drying the polymer, which in turn improve the dissolution rate. Moreover, since
the drug could be simultaneously freeze-dried with the polymer, a simplification of the
dosage form was possible without increasing the time needed to form a solution.
Furthermore, freeze-drying was an alternative method to prepare biodegradable
implants without the need of elevated temperatures and its versatility offers
possibilities to manufacture many different products according to the needs.