RESULT UPDATE JUST DIAL COMPANYNAME India Equity …
13
Edelweiss Research is also available on www.edelresearch.com, Bloomberg EDEL <GO>, Thomson First Call, Reuters and Factset. Edelweiss Securities Limited Just Dial’s (JD) revenue growth decelerated to 3.8% YoY (Q2FY20: 9.7% YoY) in Q3FY20 due to weak macro economy. Unearned revenue—lead revenue growth indicator—also fell 2.0% YoY as customers switched to monthly plans. However, the company rationalised costs, which led to 80bps QoQ jump in EBITDA margin. While muted business sentiments disproportionately impacted Q3FY20 revenue, we believe JD continues to be a valuable platform considering its ability to generate high number of leads. It also has INR15.3bn cash on books (41% of MCap) lending additional comfort. The stock has corrected 26% since our downgrade (Result Update Q1FY20 ) and we believe at 15.8x FY21E EPS, valuations are attractive. Hence, we upgrade to ‘BUY’ with revised TP of INR685 (earlier INR675) as we roll over to Q1FY22E. Weak economy dents business momentum JD’s unearned revenue declined 2.0% YoY (1.5% growth YoY in Q2FY20) as tepid business sentiment led to higher proportion of monthly customers. Growth in engagement matrices also decelerated with unique visitors growing at 17.0% YoY (22.8% in Q2FY20). While paid listings rose 10.2% YoY, realisation dipped 5.8% YoY. The company is currently focusing on increasing paid listings at the cost of realisation considering that with economic revival and consequent improvement in business confidence, it will be able to monetise them. High cash on books lends valuation comfort The company currently has INR15.3bn cash on books, which is 41% of its market capitalisation. It continues to generate strong FCF with minimal capex and high margin. Over TTM, while JD generated INR2.6bn EBITDA, its EV is INR21.9bn. Outlook and valuation: Attractive; upgrade to ‘BUY’ The stock has corrected 26% since our downgrade in Q1FY20. Although Q3FY20 numbers were weak, we had already factored in lower growth in our estimates and hence we do not see further downside to valuation. Considering the current reasonable valuations (15.8x FY21E EPS) and JD’s ability to improve margin albeit at low revenue growth, we upgrade our recommendation/rating to ‘BUY/SO’ from ‘HOLD/SP’ with revised TP of INR685. RESULT UPDATE JUST DIAL Numbers weak; valuations comforting COMPANYNAME EDELWEISS 4D RATINGS Absolute Rating BUY Rating Relative to Sector Outperformer Risk Rating Relative to Sector Medium Sector Relative to Market Overweight MARKET DATA (R: JUST.BO, B: JUST IN) CMP : INR 576 Target Price : INR 685 52-week range (INR) : 825 / 454 Share in issue (mn) : 64.9 M cap (INR bn/USD mn) : 37 / 545 Avg. Daily Vol.BSE/NSE(‘000) : 3,261.6 SHARE HOLDING PATTERN (%) Current Q2FY20 Q1FY20 Promoters * 33.0 33.0 33.8 MF's, FI's & BK’s 8.7 8.7 9.4 FII's 52.4 52.4 51.1 Others 6.0 6.0 5.7 * Promoters pledged shares (% of share in issue) : NIL PRICE PERFORMANCE (%) Stock Nifty EW Technology Index 1 month (7.9) 7.0 (1.0) 3 months (19.8) 7.9 (4.5) 12 months 12.6 12.4 6.1 Sandip Agarwal +91 22 6623 3474 [email protected] Pranav Kshatriya +91 22 4040 7495 [email protected] Nisha Jain +91 (22) 4063 7459 [email protected] India Equity Research| IT January 21, 2020 Financials (INR mn) Year to March Q3FY20 Q2FY20 Growth (%) Q3FY19 Growth (%) FY19 FY20E FY21E Revenue 2,354 2,426 (2.9) 2,268 3.8 8,915 9,535 10,247 EBITDA 671 673 (0.3) 552 21.5 2,289 2,633 2,835 Adjusted profit 620 769 (19.4) 573 8.2 2,068 2,547 2,387 Adj. dil. EPS (INR) 9.5 11.8 (19.4) 8.5 11.8 30.9 39.0 36.5 Diluted P/E (x) 18.6 14.8 15.8 EV/EBITDA (x) 11.0 8.7 7.6 EV/Revenues (x) 2.8 2.4 2.1
Transcript of RESULT UPDATE JUST DIAL COMPANYNAME India Equity …

Edelweiss Research is also available on www.edelresearch.com, Bloomberg EDEL <GO>, Thomson First Call, Reuters and Factset.
Edelweiss Securities Limited
Just Dial’s (JD) revenue growth decelerated to 3.8% YoY (Q2FY20: 9.7% YoY) in Q3FY20 due to weak macro economy. Unearned revenue—lead revenue growth indicator—also fell 2.0% YoY as customers switched to monthly plans. However, the company rationalised costs, which led to 80bps QoQ jump in EBITDA margin. While muted business sentiments disproportionately impacted Q3FY20 revenue, we believe JD continues to be a valuable platform considering its ability to generate high number of leads. It also has INR15.3bn cash on books (41% of MCap) lending additional comfort. The stock has corrected 26% since our downgrade (Result Update Q1FY20) and we believe at 15.8x FY21E EPS, valuations are attractive. Hence, we upgrade to ‘BUY’ with revised TP of INR685 (earlier INR675) as we roll over to Q1FY22E.
Weak economy dents business momentum
JD’s unearned revenue declined 2.0% YoY (1.5% growth YoY in Q2FY20) as tepid
business sentiment led to higher proportion of monthly customers. Growth in
engagement matrices also decelerated with unique visitors growing at 17.0% YoY
(22.8% in Q2FY20). While paid listings rose 10.2% YoY, realisation dipped 5.8% YoY. The
company is currently focusing on increasing paid listings at the cost of realisation
considering that with economic revival and consequent improvement in business
confidence, it will be able to monetise them.
High cash on books lends valuation comfort
The company currently has INR15.3bn cash on books, which is 41% of its market
capitalisation. It continues to generate strong FCF with minimal capex and high margin.
Over TTM, while JD generated INR2.6bn EBITDA, its EV is INR21.9bn.
Outlook and valuation: Attractive; upgrade to ‘BUY’
The stock has corrected 26% since our downgrade in Q1FY20. Although Q3FY20
numbers were weak, we had already factored in lower growth in our estimates and
hence we do not see further downside to valuation. Considering the current
reasonable valuations (15.8x FY21E EPS) and JD’s ability to improve margin albeit at
low revenue growth, we upgrade our recommendation/rating to ‘BUY/SO’ from
‘HOLD/SP’ with revised TP of INR685.
RESULT UPDATE
JUST DIAL Numbers weak; valuations comforting
COMPANYNAME
EDELWEISS 4D RATINGS
Absolute Rating BUY
Rating Relative to Sector Outperformer
Risk Rating Relative to Sector Medium
Sector Relative to Market Overweight
MARKET DATA (R: JUST.BO, B: JUST IN)
CMP : INR 576
Target Price : INR 685
52-week range (INR) : 825 / 454
Share in issue (mn) : 64.9
M cap (INR bn/USD mn) : 37 / 545
Avg. Daily Vol.BSE/NSE(‘000) : 3,261.6
SHARE HOLDING PATTERN (%)
Current Q2FY20 Q1FY20
Promoters *
33.0 33.0 33.8
MF's, FI's & BK’s 8.7 8.7 9.4
FII's 52.4 52.4 51.1
Others 6.0 6.0 5.7
* Promoters pledged shares (% of share in issue)
: NIL
PRICE PERFORMANCE (%)
Stock Nifty EW
Technology Index
1 month (7.9) 7.0 (1.0)
3 months (19.8) 7.9 (4.5)
12 months 12.6 12.4 6.1
Sandip Agarwal +91 22 6623 3474
Pranav Kshatriya +91 22 4040 7495
Nisha Jain +91 (22) 4063 7459
India Equity Research| IT
January 21, 2020
Financials (INR mn)
Year to March Q3FY20 Q2FY20 Growth (%) Q3FY19 Growth (%) FY19 FY20E FY21E
Revenue 2,354 2,426 (2.9) 2,268 3.8 8,915 9,535 10,247
EBITDA 671 673 (0.3) 552 21.5 2,289 2,633 2,835
Adjusted profit 620 769 (19.4) 573 8.2 2,068 2,547 2,387
Adj. dil. EPS (INR) 9.5 11.8 (19.4) 8.5 11.8 30.9 39.0 36.5
Diluted P/E (x) 18.6 14.8 15.8
EV/EBITDA (x) 11.0 8.7 7.6
EV/Revenues (x) 2.8 2.4 2.1

IT
2 Edelweiss Securities Limited
Table 1:Key operating metrics
Source: Company, Edelweiss research
Chart 1:Unearned revenue growth declined to 1.5% YoY
Source: Company, Edelweiss research
Chart 2: Contribution breakdown: Top 11 cities versus Tier II and Tier III cities
Source: Company, Edelweiss research
Q3FY18 Q4FY18 Q1FY19 Q2FY19 Q3FY19 Q4FY19 Q1FY20 Q2FY20 Q3FY20
Listings ('000) 20,700 21,800 22,700 23,800 24,800 25,700 26,500 27,600 28,600
QoQ growth(%) 4.5 5.3 4.1 4.8 4.2 3.6 3.1 4.2 3.6
YoY growth(%) 19.7 21.8 20.7 20.2 19.8 17.9 16.7 16.0 15.3
Campaigns ('000) 440.6 445.1 452.9 470.6 485.4 500.8 515.3 528.9 535.0
QoQ growth(%) 0.2 1.0 1.8 3.9 3.1 3.2 2.9 2.6 1.1
YoY growth(%) 3.7 2.2 3.9 7.0 10.2 12.5 13.8 12.4 10.2
Campaigns as % of listings 2.1 2.0 2.0 2.0 2.0 1.9 1.9 1.9 1.9
2.8 2.9 3.3
3.7 3.7 3.8 4.1 4.0 3.8 3.7
(5.0)
3.0
11.0
19.0
27.0
35.0
0.0
1.0
2.0
3.0
4.0
5.0
Q2
FY1
8
Q3
FY1
8
Q4
FY1
8
Q1
FY1
9
Q2
FY1
9
Q3
FY1
9
Q4
FY1
9
Q1
FY2
0
Q2
FY2
0
Q3
FY2
0
(%)
(IN
R b
n)
Unearned revenue Unearned revenue growth (YoY)
0.0
20.0
40.0
60.0
80.0
100.0
Traffic Revenue Campaigns
(Co
ntr
ibu
tio
n %
)
Top 11 Cities Tier II and III cities

Just Dial
3 Edelweiss Securities Limited
Chart 3: Traffic (unique visitors) Chart 4: Share of unique visitors (%)
Source: Company, Edelweiss research
Chart 5:App downloads
Source: Company, Edelweiss research
0.0
20.0
40.0
60.0
80.0
100.0
Q4F
Y18
Q1F
Y19
Q2F
Y19
Q3F
Y19
Q4F
Y19
Q1
FY20
Q2
FY20
Q3F
Y20
(%)
Mobile Desktop/PC Voice
19.8 20.8 21.9 22.8 23.7 24.5 25.4 26.1
0.0
15.0
30.0
45.0
60.0
75.0
0.0
6.0
12.0
18.0
24.0
30.0
Q4F
Y18
Q1F
Y19
Q2F
Y19
Q3F
Y19
Q4F
Y19
Q1
FY20
Q2
FY20
Q3
FY20
(%)
(mn
)
Total App downloads (LHS) YoY growth (RHS)
0
30
60
90
120
150
Q4F
Y18
Q1F
Y19
Q2F
Y19
Q3F
Y19
Q4F
Y19
Q1F
Y20
Q2F
Y20
Q3F
Y20
(mn
)
Mobile Desktop/PC Voice
IT
4 Edelweiss Securities Limited
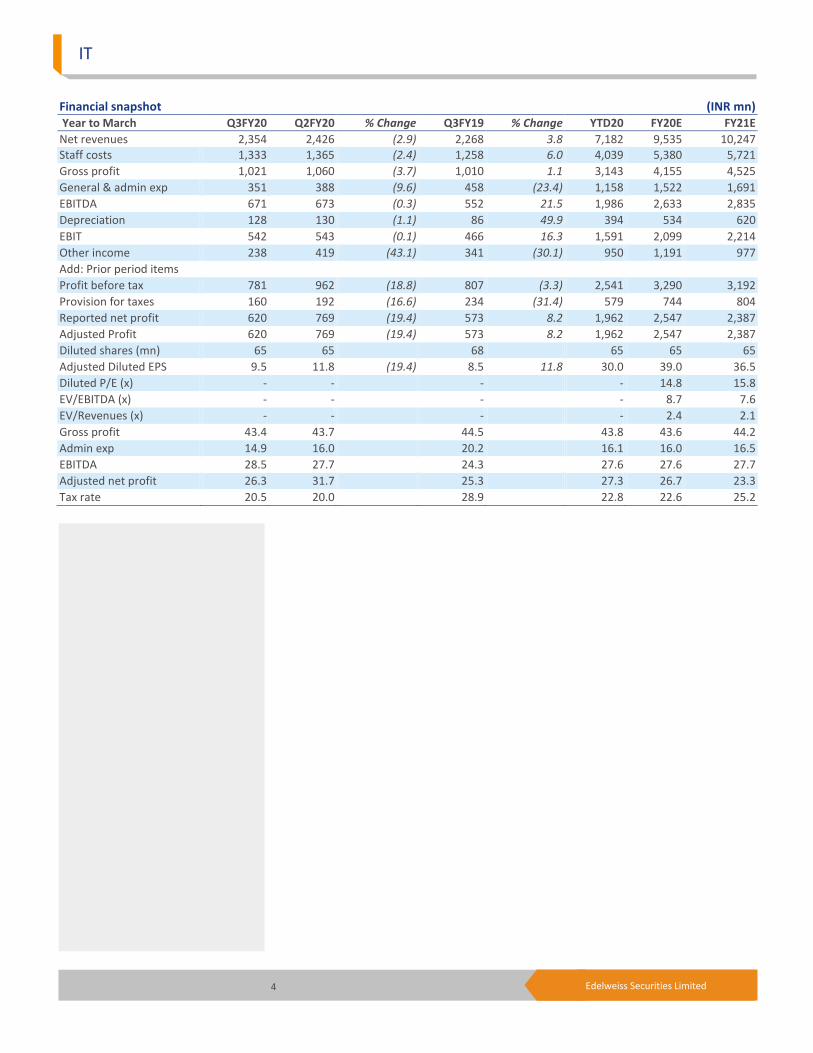
Financial snapshot (INR mn) Year to March Q3FY20 Q2FY20 % Change Q3FY19 % Change YTD20 FY20E FY21E
Net revenues 2,354 2,426 (2.9) 2,268 3.8 7,182 9,535 10,247 Staff costs 1,333 1,365 (2.4) 1,258 6.0 4,039 5,380 5,721
Gross profit 1,021 1,060 (3.7) 1,010 1.1 3,143 4,155 4,525
General & admin exp 351 388 (9.6) 458 (23.4) 1,158 1,522 1,691
EBITDA 671 673 (0.3) 552 21.5 1,986 2,633 2,835
Depreciation 128 130 (1.1) 86 49.9 394 534 620
EBIT 542 543 (0.1) 466 16.3 1,591 2,099 2,214
Other income 238 419 (43.1) 341 (30.1) 950 1,191 977
Add: Prior period items
Profit before tax 781 962 (18.8) 807 (3.3) 2,541 3,290 3,192
Provision for taxes 160 192 (16.6) 234 (31.4) 579 744 804
Reported net profit 620 769 (19.4) 573 8.2 1,962 2,547 2,387
Adjusted Profit 620 769 (19.4) 573 8.2 1,962 2,547 2,387
Diluted shares (mn) 65 65 68 65 65 65
Adjusted Diluted EPS 9.5 11.8 (19.4) 8.5 11.8 30.0 39.0 36.5
Diluted P/E (x) - - - - 14.8 15.8
EV/EBITDA (x) - - - - 8.7 7.6
EV/Revenues (x) - - - - 2.4 2.1
Gross profit 43.4 43.7 44.5 43.8 43.6 44.2
Admin exp 14.9 16.0 20.2 16.1 16.0 16.5
EBITDA 28.5 27.7 24.3 27.6 27.6 27.7
Adjusted net profit 26.3 31.7 25.3 27.3 26.7 23.3
Tax rate 20.5 20.0 28.9 22.8 22.6 25.2

Just Dial
5 Edelweiss Securities Limited
Company Description
JustDial is an classifieds search company. Incorporated as A&M Communications in 1993
and later renamed as JustDial (2006), it initially offered a fixed line voice-based service
dispensing information on whatever a user needed to locate. It provides local services for
India through multiple platforms such as internet, mobile internet, over the telephone
(voice) and text (SMS). Its internet and mobile internet services were launched in 2007. As
of Q2FY20, the company is running ~0.53mn campaigns for paid advertisers and has 27.6mn
listings. For TTM, the company reported revenue INR9.4bn. Investment Theme
Classified advertising has undergone a paradigm shift towards online from print media with
a large chunk of businesses shifting to the former. Moreover, the much anticipated jump in
internet usage over the next few years is bound to further fuel this segment, presenting a
humungous growth opportunity to relevant players. The competitive intensity has moved
from vertical services providers to horizontal services provider, opening up opportunities for
specialized players like Just Dial. However, given slowdown in the economy, specially
affecting the SMEs in Tier2, Tier 3 cities, we become cautious on the ongoing revenue
growth trajectory of the company.
Key Risks
• Slowdown in economy
• Increasing competition in internet space
• Success of transaction model can impact estimates
• Waning voice search growth
• Concentration in large cities
6 Edelweiss Securities Limited
IT
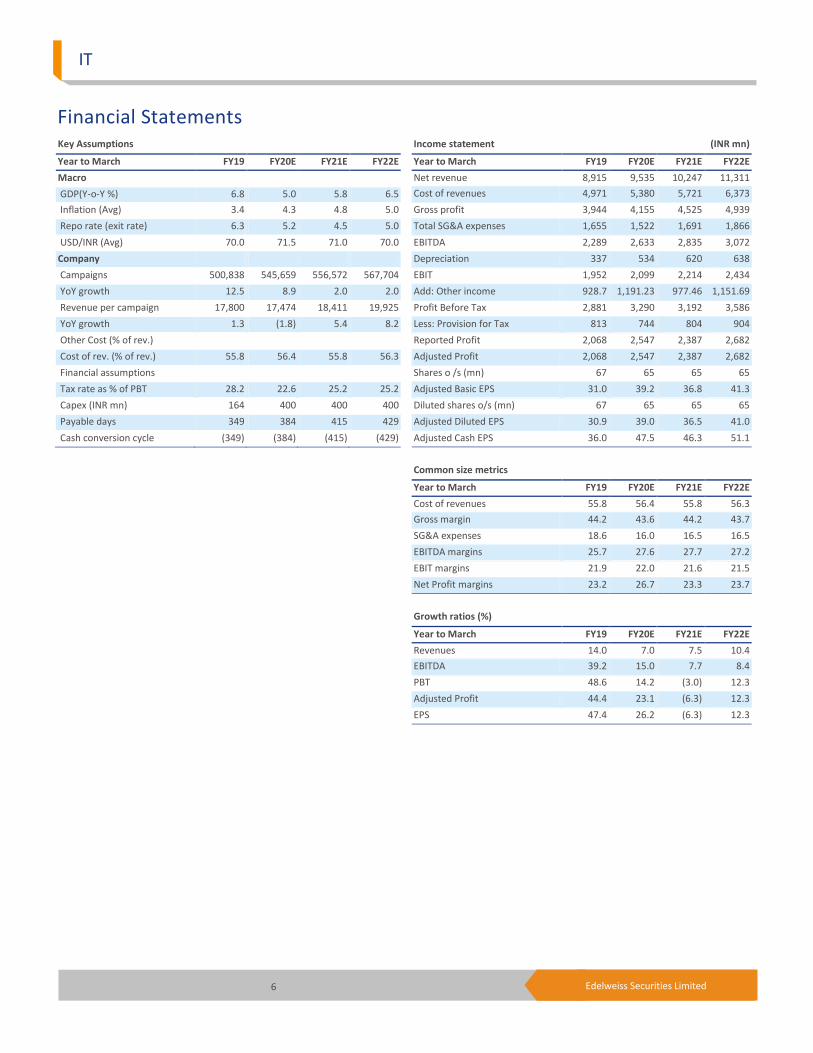
Financial Statements
Income statement (INR mn)
Year to March FY19 FY20E FY21E FY22E
Net revenue 8,915 9,535 10,247 11,311
Cost of revenues 4,971 5,380 5,721 6,373
Gross profit 3,944 4,155 4,525 4,939
Total SG&A expenses 1,655 1,522 1,691 1,866
EBITDA 2,289 2,633 2,835 3,072
Depreciation 337 534 620 638
EBIT 1,952 2,099 2,214 2,434
Add: Other income 928.7 1,191.23 977.46 1,151.69
Profit Before Tax 2,881 3,290 3,192 3,586
Less: Provision for Tax 813 744 804 904
Reported Profit 2,068 2,547 2,387 2,682
Adjusted Profit 2,068 2,547 2,387 2,682
Shares o /s (mn) 67 65 65 65
Adjusted Basic EPS 31.0 39.2 36.8 41.3
Diluted shares o/s (mn) 67 65 65 65
Adjusted Diluted EPS 30.9 39.0 36.5 41.0
Adjusted Cash EPS 36.0 47.5 46.3 51.1
Common size metrics
Year to March FY19 FY20E FY21E FY22E
Cost of revenues 55.8 56.4 55.8 56.3
Gross margin 44.2 43.6 44.2 43.7
SG&A expenses 18.6 16.0 16.5 16.5
EBITDA margins 25.7 27.6 27.7 27.2
EBIT margins 21.9 22.0 21.6 21.5
Net Profit margins 23.2 26.7 23.3 23.7
Growth ratios (%)
Year to March FY19 FY20E FY21E FY22E
Revenues 14.0 7.0 7.5 10.4
EBITDA 39.2 15.0 7.7 8.4
PBT 48.6 14.2 (3.0) 12.3
Adjusted Profit 44.4 23.1 (6.3) 12.3
EPS 47.4 26.2 (6.3) 12.3
Key Assumptions
Year to March FY19 FY20E FY21E FY22E
Macro
GDP(Y-o-Y %) 6.8 5.0 5.8 6.5
Inflation (Avg) 3.4 4.3 4.8 5.0
Repo rate (exit rate) 6.3 5.2 4.5 5.0
USD/INR (Avg) 70.0 71.5 71.0 70.0
Company
Campaigns 500,838 545,659 556,572 567,704
YoY growth 12.5 8.9 2.0 2.0
Revenue per campaign 17,800 17,474 18,411 19,925
YoY growth 1.3 (1.8) 5.4 8.2
Other Cost (% of rev.)
Cost of rev. (% of rev.) 55.8 56.4 55.8 56.3
Financial assumptions
Tax rate as % of PBT 28.2 22.6 25.2 25.2
Capex (INR mn) 164 400 400 400
Payable days 349 384 415 429
Cash conversion cycle (349) (384) (415) (429)

7 Edelweiss Securities Limited
Just Dial
Cash flow metrics
Year to March FY19 FY20E FY21E FY22E
Operating cash flow 2,762 2,591 2,842 3,107
Financing cash flow (2,166) (2,235) (2,095) (2,354)
Investing cash flow (766) 791 577 752
Net cash Flow (170) 1,148 1,325 1,505
Capex (164) (400) (400) (400)
Dividend paid - (2,235) (2,095) (2,354)
Profitability and efficiency ratios
Year to March FY19 FY20E FY21E FY22E
ROAE (%) 20.9 25.1 22.9 24.9
ROACE (%) 29.1 32.4 30.6 33.3
Payable Days 349 384 415 429
Cash Conversion Cycle (349) (384) (415) (429)
Current Ratio 2.7 2.5 2.4 2.3
Operating ratios
Year to March FY19 FY20E FY21E FY22E
Total Asset Turnover 0.9 0.9 1.0 1.0
Fixed Asset Turnover 6.5 8.0 10.1 14.3
Equity Turnover 0.9 0.9 1.0 1.1
Valuation parameters
Year to March FY19 FY20E FY21E FY22E
Adj. Diluted EPS (INR) 30.9 39.0 36.5 41.0
Y-o-Y growth (%) 47.4 26.2 (6.3) 12.3
Adjusted Cash EPS (INR) 36.0 47.5 46.3 51.1
Diluted P/E (x) 18.6 14.8 15.8 14.0
P/B (x) 3.8 3.6 3.5 3.4
EV / Sales (x) 2.8 2.4 2.1 1.8
EV / EBITDA (x) 11.0 8.7 7.6 6.6
Balance sheet (INR mn)
As on 31st March FY19 FY20E FY21E FY22E
Share capital 648 648 648 648
Reserves & Surplus 9,339 9,651 9,943 10,272
Shareholders' funds 9,986 10,298 10,591 10,919
Def. Tax Liability (net) 173 173 173 173
Sources of funds 10,159 10,471 10,764 11,092
Gross Block 3,402 3,802 4,202 4,602
Net Block 1,262 1,128 907 669
Total Fixed Assets 1,321 1,187 967 728
Cash and Equivalents 13,228 14,376 15,700 17,205
Other Current Assets 942 1,036 1,140 1,254
Current Assets (ex cash) 942 1,036 1,140 1,254
Trade payable 5,263 6,052 6,960 8,004
Other Current Liab 69 76 83 92
Total Current Liab 5,332 6,128 7,044 8,096
Net Curr Assets-ex cash (4,390) (5,092) (5,903) (6,842)
Uses of funds 10,159 10,471 10,764 11,092
BVPS (INR) 149.5 158.7 163.1 168.1
Free cash flow (INR mn)
Year to March FY19 FY20E FY21E FY22E
Reported Profit 2,068 2,547 2,387 2,682
Add: Depreciation 337 534 620 638
Others (209) (1,191) (977) (1,152)
Less: Changes in WC (567) (702) (812) (938)
Operating cash flow 2,762 2,591 2,842 3,107
Less: Capex 164 400 400 400
Free Cash Flow 2,599 2,191 2,442 2,707

8 Edelweiss Securities Limited
IT
Insider Trades
Reporting Data Acquired / Seller B/S Qty Traded
25 Mar 2019 Jaimin Shah Sell 15000.00
*in last one year
Bulk Deals Data Acquired / Seller B/S Qty Traded Price
03 Jul 2019 CROSSLAND TRADING CO SELL 13215 782.81
30 May 2019 EMERGING MARKETS SUDAN FREE EQUITY INDEX FUND BUY 355787 716.96
24 May 2019 GOLDMAN SACHS FUNDS - GOLDMAN SACHS EMERGING MARKETS CORE (R) EQUITY PORTFOLIO SELL 342238 694.32
04 Apr 2019 MORGAN STANLEY FRANCE SAS SELL 378115 579.55
18 Mar 2019 MORGAN STANLEY FRANCE SAS BUY 407312 639.34
*in last one year
Holding – Top10 Perc. Holding Perc. Holding
No Data Available
*in last one year
Additional Data
Directors Data B. Anand Chairman and Independent Non-Executive Director V.S.S. Mani Managing Director
Ramani Iyer Non-Independent, Non-Executive Director V. Krishnan Non-Independent, Executive Director
Pulak Prasad Non-Independent, Non-Executive Director Sanjay Bahadur Independent, Non-Executive Director
Malcolm Monteiro Independent, Non-Executive Director Anita Mani Non-Independent, Non-Executive Director
Auditors - S. R. Batliboi & Associates LLP
*as per last annual report

9 Edelweiss Securities Limited
Company Absolute
reco
Relative
reco
Relative
risk
Company Absolute
reco
Relative
reco
Relative
Risk
Cyient BUY SP H ECLERX SERVICES BUY SP M
HCL Technologies BUY SP H Hexaware Technologies HOLD SP M
IndiaMART BUY SO H Info Edge BUY SP M
Infosys BUY SO L Just Dial HOLD SP M
L&T Infotech Ltd BUY SO M L&T Technology Services Ltd BUY SO M
MINDTREE LTD BUY SO M Persistent Systems BUY SP L
Redington India Ltd BUY SO L Tata Consultancy Services HOLD SP L
Tech Mahindra BUY SP M Wipro HOLD SP L
RATING & INTERPRETATION
ABSOLUTE RATING
Ratings Expected absolute returns over 12 months
Buy More than 15%
Hold Between 15% and - 5%
Reduce Less than -5%
RELATIVE RETURNS RATING
Ratings Criteria
Sector Outperformer (SO) Stock return > 1.25 x Sector return
Sector Performer (SP) Stock return > 0.75 x Sector return
Stock return < 1.25 x Sector return
Sector Underperformer (SU) Stock return < 0.75 x Sector return
Sector return is market cap weighted average return for the coverage universe
within the sector
RELATIVE RISK RATING
Ratings Criteria
Low (L) Bottom 1/3rd percentile in the sector
Medium (M) Middle 1/3rd percentile in the sector
High (H) Top 1/3rd percentile in the sector
Risk ratings are based on Edelweiss risk model
SECTOR RATING
Ratings Criteria
Overweight (OW) Sector return > 1.25 x Nifty return
Equalweight (EW) Sector return > 0.75 x Nifty return
Sector return < 1.25 x Nifty return
Underweight (UW) Sector return < 0.75 x Nifty return

10 Edelweiss Securities Limited
IT
Edelweiss Securities Limited, Edelweiss House, off C.S.T. Road, Kalina, Mumbai – 400 098.
Board: (91-22) 4009 4400, Email: [email protected]
Aditya Narain
Head of Research
Coverage group(s) of stocks by primary analyst(s): IT
Cyient, ECLERX SERVICES, HCL Technologies, Hexaware Technologies, Infosys, Info Edge, IndiaMART, Just Dial, L&T Infotech Ltd, L&T Technology Services Ltd, MINDTREE LTD, Persistent Systems, Redington India Ltd, Tata Consultancy Services, Tech Mahindra, Wipro
Distribution of Ratings / Market Cap
Edelweiss Research Coverage Universe
Rating Distribution* 161 67 11 240 * 1stocks under review
Market Cap (INR) 156 62 11
Date Company Title Price (INR) Recos
Recent Research
17-Jan-20 Tata Consultancy
Services
Revenue deceleration overshadows margin performance; Result Update
2,219 Hold
17-Jan-20 L&T echnology Services
Light at the end of the tunnel; Result Update
1,643 Buy
17-Jan-20 HCL Technologies
IBM products chip in; Result Update
599 Buy
> 50bn Between 10bn and 50 bn < 10bn
Buy Hold Reduce Total
Rating Interpretation
Buy appreciate more than 15% over a 12-month period
Hold appreciate up to 15% over a 12-month period
Reduce depreciate more than 5% over a 12-month period
Rating Expected to
-
149
297
446
594
743
Jan
-14
Feb
-14
Mar
-14
Ap
r-1
4
May
-14
Jun
-14
Jul-
14
Au
g-1
4
Sep
-14
Oct
-14
No
v-1
4
De
c-1
4
(IN
R)
One year price chart
400
500
600
700
800
900
Jan
-19
Feb
-19
Mar
-19
Ap
r-1
9
May
-19
Jun
-19
Jul-
19
Au
g-1
9
Sep
-19
Oct
-19
No
v-1
9
De
c-1
9
Jan
-20
(IN
R)
Just Dial

11 Edelweiss Securities Limited
Just Dial
DISCLAIMER
Edelweiss Securities Limited (“ESL” or “Research Entity”) is regulated by the Securities and Exchange Board of India (“SEBI”) and is licensed to carry on the business of broking, depository services and related activities. The business of ESL and its Associates (list available on www.edelweissfin.com) are organized around five broad business groups – Credit including Housing and SME Finance, Commodities, Financial Markets, Asset Management and Life Insurance.
This Report has been prepared by Edelweiss Securities Limited in the capacity of a Research Analyst having SEBI Registration No.INH200000121 and distributed as per SEBI (Research Analysts) Regulations 2014. This report does not constitute an offer or solicitation for the purchase or sale of any financial instrument or as an official confirmation of any transaction. Securities as defined in clause (h) of section 2 of the Securities Contracts (Regulation) Act, 1956 includes Financial Instruments and Currency Derivatives. The information contained herein is from publicly available data or other sources believed to be reliable. This report is provided for assistance only and is not intended to be and must not alone be taken as the basis for an investment decision. The user assumes the entire risk of any use made of this information. Each recipient of this report should make such investigation as it deems necessary to arrive at an independent evaluation of an investment in Securities referred to in this document (including the merits and risks involved), and should consult his own advisors to determine the merits and risks of such investment. The investment discussed or views expressed may not be suitable for all investors.
This information is strictly confidential and is being furnished to you solely for your information. This information should not be reproduced or redistributed or passed on directly or indirectly in any form to any other person or published, copied, in whole or in part, for any purpose. This report is not directed or intended for distribution to, or use by, any person or entity who is a citizen or resident of or located in any locality, state, country or other jurisdiction, where such distribution, publication, availability or use would be contrary to law, regulation or which would subject ESL and associates / group companies to any registration or licensing requirements within such jurisdiction. The distribution of this report in certain jurisdictions may be restricted by law, and persons in whose possession this report comes, should observe, any such restrictions. The information given in this report is as of the date of this report and there can be no assurance that future results or events will be consistent with this information. This information is subject to change without any prior notice. ESL reserves the right to make modifications and alterations to this statement as may be required from time to time. ESL or any of its associates / group companies shall not be in any way responsible for any loss or damage that may arise to any person from any inadvertent error in the information contained in this report. ESL is committed to providing independent and transparent recommendation to its clients. Neither ESL nor any of its associates, group companies, directors, employees, agents or representatives shall be liable for any damages whether direct, indirect, special or consequential including loss of revenue or lost profits that may arise from or in connection with the use of the information. Our proprietary trading and investment businesses may make investment decisions that are inconsistent with the recommendations expressed herein. Past performance is not necessarily a guide to future performance .The disclosures of interest statements incorporated in this report are provided solely to enhance the transparency and should not be treated as endorsement of the views expressed in the report. The information provided in these reports remains, unless otherwise stated, the copyright of ESL. All layout, design, original artwork, concepts and other Intellectual Properties, remains the property and copyright of ESL and may not be used in any form or for any purpose whatsoever by any party without the express written permission of the copyright holders.
ESL shall not be liable for any delay or any other interruption which may occur in presenting the data due to any reason including network (Internet) reasons or snags in the system, break down of the system or any other equipment, server breakdown, maintenance shutdown, breakdown of communication services or inability of the ESL to present the data. In no event shall ESL be liable for any damages, including without limitation direct or indirect, special, incidental, or consequential damages, losses or expenses arising in connection with the data presented by the ESL through this report.
We offer our research services to clients as well as our prospects. Though this report is disseminated to all the customers simultaneously, not all customers may receive this report at the same time. We will not treat recipients as customers by virtue of their receiving this report.
ESL and its associates, officer, directors, and employees, research analyst (including relatives) worldwide may: (a) from time to time, have long or short positions in, and buy or sell the Securities, mentioned herein or (b) be engaged in any other transaction involving such Securities and earn brokerage or other compensation or act as a market maker in the financial instruments of the subject company/company(ies) discussed herein or act as advisor or lender/borrower to such company(ies) or have other potential/material conflict of interest with respect to any recommendation and related information and opinions at the time of publication of research report or at the time of public appearance. ESL may have proprietary long/short position in the above mentioned scrip(s) and therefore should be considered as interested. The views provided herein are general in nature and do not consider risk appetite or investment objective of any particular investor; readers are requested to take independent professional advice before investing. This should not be construed as invitation or solicitation to do business with ESL.

12 Edelweiss Securities Limited
IT
ESL or its associates may have received compensation from the subject company in the past 12 months. ESL or its associates may have managed or co-managed public offering of securities for the subject company in the past 12 months. ESL or its associates may have received compensation for investment banking or merchant banking or brokerage services from the subject company in the past 12 months. ESL or its associates may have received any compensation for products or services other than investment banking or merchant banking or brokerage services from the subject company in the past 12 months. ESL or its associates have not received any compensation or other benefits from the Subject Company or third party in connection with the research report. Research analyst or his/her relative or ESL’s associates may have financial interest in the subject company. ESL and/or its Group Companies, their Directors, affiliates and/or employees may have interests/ positions, financial or otherwise in the Securities/Currencies and other investment products mentioned in this report. ESL, its associates, research analyst and his/her relative may have other potential/material conflict of interest with respect to any recommendation and related information and opinions at the time of publication of research report or at the time of public appearance.
Participants in foreign exchange transactions may incur risks arising from several factors, including the following: ( i) exchange rates can be volatile and are subject to large fluctuations; ( ii) the value of currencies may be affected by numerous market factors, including world and national economic, political and regulatory events, events in equity and debt markets and changes in interest rates; and (iii) currencies may be subject to devaluation or government imposed exchange controls which could affect the value of the currency. Investors in securities such as ADRs and Currency Derivatives, whose values are affected by the currency of an underlying security, effectively assume currency risk.
Research analyst has served as an officer, director or employee of subject Company: No
ESL has financial interest in the subject companies: No
ESL’s Associates may have actual / beneficial ownership of 1% or more securities of the subject company at the end of the month immediately preceding the date of publication of research report.
Research analyst or his/her relative has actual/beneficial ownership of 1% or more securities of the subject company at the end of the month immediately preceding the date of publication of research report: No
ESL has actual/beneficial ownership of 1% or more securities of the subject company at the end of the month immediately preceding the date of publication of research report: No
Subject company may have been client during twelve months preceding the date of distribution of the research report.
There were no instances of non-compliance by ESL on any matter related to the capital markets, resulting in significant and material disciplinary action during the last three years except that ESL had submitted an offer of settlement with Securities and Exchange commission, USA (SEC) and the same has been accepted by SEC without admitting or denying the findings in relation to their charges of non registration as a broker dealer.
A graph of daily closing prices of the securities is also available at www.nseindia.com
Analyst Certification:
The analyst for this report certifies that all of the views expressed in this report accurately reflect his or her personal views about the subject company or companies and its or their securities, and no part of his or her compensation was, is or will be, directly or indirectly related to specific recommendations or views expressed in this report.
Additional Disclaimers
Disclaimer for U.S. Persons
This research report is a product of Edelweiss Securities Limited, which is the employer of the research analyst(s) who has prepared the research report. The research analyst(s) preparing the research report is/are resident outside the United States (U.S.) and are not associated persons of any U.S. regulated broker-dealer and therefore the analyst(s) is/are not subject to supervision by a U.S. broker-dealer, and is/are not required to satisfy the regulatory licensing requirements of FINRA or required to otherwise comply with U.S. rules or regulations regarding, among other things, communications with a subject company, public appearances and trading securities held by a research analyst account.
This report is intended for distribution by Edelweiss Securities Limited only to "Major Institutional Investors" as defined by Rule 15a-6(b)(4) of the U.S. Securities and Exchange Act, 1934 (the Exchange Act) and interpretations thereof by U.S. Securities and Exchange Commission (SEC) in reliance on Rule 15a 6(a)(2). If the recipient of this report is not a Major Institutional Investor as specified above, then it should not act upon this report and return the same to the sender. Further, this report may not be copied, duplicated and/or transmitted onward to any U.S. person, which is not the Major Institutional Investor.
13 Edelweiss Securities Limited
Just Dial
Access the entire repository of Edelweiss Research on www.edelresearch.com
In reliance on the exemption from registration provided by Rule 15a-6 of the Exchange Act and interpretations thereof by the SEC in order to conduct certain business with Major Institutional Investors, Edelweiss Securities Limited has entered into an agreement with a U.S. registered broker-dealer, Edelweiss Financial Services Inc. ("EFSI"). Transactions in securities discussed in this research report should be effected through Edelweiss Financial Services Inc. Disclaimer for U.K. Persons
The contents of this research report have not been approved by an authorised person within the meaning of the Financial Services and Markets Act 2000 ("FSMA"). In the United Kingdom, this research report is being distributed only to and is directed only at (a) persons who have professional experience in matters relating to investments falling within Article 19(5) of the FSMA (Financial Promotion) Order 2005 (the “Order”); (b) persons falling within Article 49(2)(a) to (d) of the Order (including high net worth companies and unincorporated associations); and (c) any other persons to whom it may otherwise lawfully be communicated (all such persons together being referred to as “relevant persons”). This research report must not be acted on or relied on by persons who are not relevant persons. Any investment or investment activity to which this research report relates is available only to relevant persons and will be engaged in only with relevant persons. Any person who is not a relevant person should not act or rely on this research report or any of its contents. This research report must not be distributed, published, reproduced or disclosed (in whole or in part) by recipients to any other person. Disclaimer for Canadian Persons
This research report is a product of Edelweiss Securities Limited ("ESL"), which is the employer of the research analysts who have prepared the research report. The research analysts preparing the research report are resident outside the Canada and are not associated persons of any Canadian registered adviser and/or dealer and, therefore, the analysts are not subject to supervision by a Canadian registered adviser and/or dealer, and are not required to satisfy the regulatory licensing requirements of the Ontario Securities Commission, other Canadian provincial securities regulators, the Investment Industry Regulatory Organization of Canada and are not required to otherwise comply with Canadian rules or regulations regarding, among other things, the research analysts' business or relationship with a subject company or trading of securities by a research analyst. This report is intended for distribution by ESL only to "Permitted Clients" (as defined in National Instrument 31-103 ("NI 31-103")) who are resident in the Province of Ontario, Canada (an "Ontario Permitted Client"). If the recipient of this report is not an Ontario Permitted Client, as specified above, then the recipient should not act upon this report and should return the report to the sender. Further, this report may not be copied, duplicated and/or transmitted onward to any Canadian person. ESL is relying on an exemption from the adviser and/or dealer registration requirements under NI 31-103 available to certain international advisers and/or dealers. Please be advised that (i) ESL is not registered in the Province of Ontario to trade in securities nor is it registered in the Province of Ontario to provide advice with respect to securities; (ii) ESL's head office or principal place of business is located in India; (iii) all or substantially all of ESL's assets may be situated outside of Canada; (iv) there may be difficulty enforcing legal rights against ESL because of the above; and (v) the name and address of the ESL's agent for service of process in the Province of Ontario is: Bamac Services Inc., 181 Bay Street, Suite 2100, Toronto, Ontario M5J 2T3 Canada. Disclaimer for Singapore Persons
In Singapore, this report is being distributed by Edelweiss Investment Advisors Private Limited ("EIAPL") (Co. Reg. No. 201016306H) which is a holder of a capital markets services license and an exempt financial adviser in Singapore and (ii) solely to persons who qualify as "institutional investors" or "accredited investors" as defined in section 4A(1) of the Securities and Futures Act, Chapter 289 of Singapore ("the SFA"). Pursuant to regulations 33, 34, 35 and 36 of the Financial Advisers Regulations ("FAR"), sections 25, 27 and 36 of the Financial Advisers Act, Chapter 110 of Singapore shall not apply to EIAPL when providing any financial advisory services to an accredited investor (as defined in regulation 36 of the FAR. Persons in Singapore should contact EIAPL in respect of any matter arising from, or in connection with this publication/communication. This report is not suitable for private investors.
Copyright 2009 Edelweiss Research (Edelweiss Securities Ltd). All rights reserved