Restraint and Seclusion User Guide
25
Annual Report on the Use of Physical Restraint and Seclusion in Connecticut School Year 2019-20
Transcript of Restraint and Seclusion User Guide

Annual Report on the
Use of Physical Restraint and Seclusion
in Connecticut
School Year 2019-20

Important Notes to the Reader
Actions Supporting the Reduction in the Use of Emergency Restraint and Seclusion in School Settings
The ongoing examination and analysis of the R/S data continues to inform guidance, technical assistance and
professional development associated with best practices to reduce the number of emergency situations which
occur and therefore reduce the need for the use of restraint and seclusion.
• The Guidelines to Identify and Educate Students with Emotional Disturbance promote the use of
positive behavior supports and prevention and intervention strategies within a tiered, scientific research-
based intervention framework (SRBI). These guidelines also address the appropriate implementation of
functional behavioral assessments (FBAs) and the development of behavior intervention plans (BIPs).
• Resources, technical assistance and professional development opportunities related to the regulations
around the use and reporting of restraint and seclusion in schools are available on the CSDE and State
Education Resource Center (SERC) websites.
• Recommended interventions impacting the reduction of restraint and seclusion also remain available to
schools and programs.
• The CSDE continues to engage with other state agencies through the Interagency Restraint and
Seclusion Prevention Partnership, which provides information and resources, and highlights best
practices to reduce restraint and seclusion through an annual conference and/or other targeted trainings.
• Updated guidance and forms reflecting the 2018 changes to laws governing the use of restraint and
seclusion in schools are available on the CSDE website. “Recommended Procedures and Practices to
Reduce the Use of Restraint and Seclusion in Schools” is also provided as a resource for districts and
programs. All guidance and professional development materials promote the use of trauma informed,
evidence-based practices in addressing students’ social, emotional and behavioral needs.
Changes to Incidents Reported as Restraints
Connecticut’s restraint and seclusion (R/S) data collection is unique in its transparency and detail; therefore,
comparison with other states is not recommended. Regardless of the duration, nature of the restraint or seclusion
and level of injury (if incurred), all incidents of restraint and seclusion are reported for students with disabilities
or those who have been referred for a special education eligibility determination. Collecting this incident level
data allows the Connecticut State Department of Education (CSDE) to obtain an accurate picture of the
incidence of R/S among Connecticut’s population of students with disabilities.
Effective July 1, 2018, Public Act (P.A.) 18-51 expanded the existing definition of restraint to include escorts
requiring carrying or forcibly moving a student from one location to another. This legislation altered the
reporting requirements for 2018-2019 making comparisons to prior years invalid. Therefore, 2018-19 data
represent a new baseline based on this new definition. Prior to July 1, 2018, if a student was escorted, forcibly
or otherwise, in response to an emergency situation, such an escort would not be reported as a restraint.
Additionally, if a student was escorted to seclusion in response to an emergency, the seclusion alone was
counted as a single event or incident since an escort was excluded from the definition of restraint. Generally,
prior to July 1, 2018, if a student was escorted in any manner (i.e. forcibly or simply guided) from point A to
point B, regardless of the amount of force required, this action was not reported as a restraint. The department

updated the data collection in 2019-20 to allow for a distinction between forcible escort restraints and other
emergency physical restraints.
Data Notes to Support Interpretation
When examining organization level data (Appendix A), consideration must be given to the fact that some local
education agencies (LEAs) operate in-district alternative programs and/or self-contained special education
programs. These programs are designed for students with significant special needs. Incidents of R/S occurring
in these settings are reported by the LEA.
Some LEAs may not have the capacity to address a student’s severe emotional/behavioral needs in district and
the student may be placed by the planning and placement team (PPT) in an approved private special education
program (APSEP) or regional educational service center (RESC) special education program. Incidents
occurring in these settings are reported directly by the APSEP or RESC and are included in the APSEP or
RESC incident count.
However, if a student is placed by the LEA in an out-of-state facility and is restrained or secluded, this R/S
incident is reported by the LEA and is included in the LEA’s incident count. Individual LEA policies,
procedures and practices may result in differences in in-district program availability, out-of-district placements,
and out-of-state placements and must be recognized when examining the organization level data.

Annual Report on the Use of Physical Restraint and Seclusion in Connecticut, 2019-20 Page 2
Background and Overview
Connecticut General Statutes (C.G.S.) Section 10-236b(k), as amended, requires the Connecticut
State Department of Education (CSDE) to produce an annual summary report to the Connecticut
General Assembly that includes data from each local or regional board of education and each
institution or facility operating under contract with a local or regional board of education which:
• identifies the frequency of use of physical restraint and seclusion (R/S); and
• specifies whether the use of such seclusion was in accordance with an individualized
education program (IEP) or whether the use of physical restraint or seclusion was a
response to an emergency.
While the original statute requires the specification as to whether the seclusion was in
accordance with the IEP or whether the use of physical restraint and seclusion was a response to
an emergency, as of July 1, 2018, P.A. 18-51 stipulates that seclusion is no longer permitted to
be used as a behavior intervention in the IEP. Therefore all reported incidents of restraint and
seclusion are in response to an emergency.
R/S incidents were reported for two types of students: students with an individualized education
program (IEP) and students for whom parental consent to evaluate for special education had been
obtained. General education students were not reported in these data, unless they were in the
evaluation process for special education services at the time of the restraint or seclusion.
Additionally, Section 10-236b(n) requires the CSDE to report on R/S incidents that result in
physical injury to the student.
Data regarding restraints and seclusions for 2019-20 were collected from:
• local education agencies (LEAs) who are responsible for special education including
local/regional school districts, Unified School District (USD) #2 and the Connecticut
Technical Education and Career System (CTECS) (170);
• endowed and incorporated academies (Academies) (3);
• public charter schools (22);
• regional educational service centers (RESCs) (6); and
• approved private special education programs (APSEPs) (93).
Table 1 below is provided to contextualize the results and discussion section of the report. Since
restraint and seclusion data are reported by the location of the occurrence, it is important to
consider both the proportion of students with disabilities attending various facility types as well
as the purpose of the facility. For example, many students are placed in APSEPs and RESC
special education programs when a planning and placement team (PPT) determines that due to
the nature and severity of the student’s needs, the IEP cannot be implemented within the LEA.
The results and discussion section focuses on state level data. Organization-level data for the
2019-20 school year are presented in Appendix A.

Annual Report on the Use of Physical Restraint and Seclusion in Connecticut, 2019-20 Page 3
Table 1
Number and Percent of All Students Statewide with IEPs by Facility Type (October 1, 2019)
Facility Type
Students
Number Percent
Academies 387 0.5%
APSEPs 2,975 3.5%
Charter Schools 1,129 1.3%
LEAs 77,965 92.4%
RESCs 1,939 2.3%
TOTAL 84,395 100.0%
Note: Students attending other non-public or out-of-state schools are included in the LEA count.
Definitions and Concepts
Major Categories of R/S1
1. Physical Restraint means any mechanical or personal restriction that immobilizes or reduces
the free movement of a child’s arms, legs or head.2
Restraint does not include:
• briefly holding a child in order to calm or comfort the child;
• actions involving the minimum contact necessary to safely escort a child from one
area to another;
• medication devices, including supports prescribed by a health care provider to
achieve proper body position or balance;
• helmets or other protective gear used to protect a child from injuries due to a fall; or
• helmets, mitts and similar devices used to prevent self-injury when the device is part
of a documented treatment plan or IEP and is the least restrictive means to prevent
self-injury.
2. Seclusion means the involuntary confinement of a person in a room, from which the student
is physically prevented from leaving. In a public school, seclusion does not mean any
confinement of a child where the child is physically able to leave the area of confinement.
Seclusion does not include:
• exclusionary time out; or
• in-school suspensions.
3. Forcible Escort (Restraint) means involuntary carrying or forcibly moving a person from
one location to another.2
1 Public Act 18-51 updated section 10-236b of the 2018 supplement and substituted a revised R/S definition of
physical restraints, effective July 1, 2018. 2 It is important to note that all restraints are reported regardless of duration.

Annual Report on the Use of Physical Restraint and Seclusion in Connecticut, 2019-20 Page 4
Subcategories of Injuries
1. Nonserious Injuries include red marks, bruises or scrapes requiring application of basic first
aid, for example a Band-Aid or ice pack.
2. Serious Injuries include any injury requiring medical attention beyond basic first aid.
Examples of such medical attention include emergency room visits, doctor visits, sutures,
diagnostic x-rays to determine fractures, placement in casts, etc.
Methodology
For the 2019-20 school year, the CSDE Performance Office collected and analyzed data at the
incident level for each student with an IEP or for whom parental consent to evaluate for special
education had been obtained. This incident-level collection allowed for a count of incidents, as
well as an unduplicated count of students with disabilities who were restrained and/or secluded.
Collecting incident level data is vital to obtaining an accurate picture of the incidence of R/S
among Connecticut’s population of students with disabilities.
Instances of R/S for 2019-20 school year were collected at the incident level from all institutions
and facilities (henceforth referred to as “Organizations”) that provide direct care, education or
supervision to students with disabilities. Organizations were asked to report incident level
information on all restraints and seclusions that occurred within their buildings and programs or
during transportation provided by their organization. Additionally, organizations were instructed
to include any restraints or seclusions of their students that occurred in out-of-state facilities,
nonpublic transition programs, and other nonpublic schools or during an extended day program
offered by their organization. LEAs did not report incidents of restraint and seclusion of their
students attending RESCs, charter schools, academies or APSEPs because each of these facilities
was responsible for separately reporting their R/S data.
The mechanism for collection in 2019-20 was the same as previous years. Data were collected
from all LEAs, RESCs, charter schools, academies, and APSEPs via an online application. This
application provided cross checks with other CSDE databases and included edit checks to ensure
data accuracy.
Data elements collected for each incident of restraint or seclusion included the student’s state
assigned student identifier (SASID), date of birth, date of incident, incident start and end times,
circumstance (imminent risk of injury to self, others, or self and others), special education status
(IEP or signed consent to evaluate), nature of incident (restraint, seclusion or forcible escort),
primary disability and, where applicable, injury type and details. It should be noted that incidents
of one minute or less in duration are reported as one minute and may reflect momentary
restraints only seconds in duration. Additionally, each time a new restraint or hold is initiated,
regardless of its duration, the restraint is reported as an individual incident. Therefore, a series of
brief holds and releases during a single event would be reported as multiple restraints.
The CSDE provided support to organizations through targeted technical assistance. Such
technical assistance included a help desk for all organizations, provision of additional supports to
all new reporting organizations and consultation with the Bureau of Special Education and

Annual Report on the Use of Physical Restraint and Seclusion in Connecticut, 2019-20 Page 5
Performance Office staff. The data collection system has also been enhanced with multiple edit
checks to ensure data integrity. Instances where data quality indicated concern were reviewed
with the organization contact. Additionally, all organizations were required to have a certified
administrator attest to the accuracy of their data through completion of an online certification
process. Each of these attestations regarding the accuracy of 2019-20 R/S data is on file with the
CSDE.
Results and Discussion
In total, 41,887 incidents of restraint and seclusion were reported to the CSDE in 2019-20. This
includes 19,255 emergency restraints, 14,163 emergency seclusions and 8,469 forcible escort
restraints.
A total of 3,481 students (unduplicated count) or 4.1 percent of all students with disabilities were
restrained and/or secluded.
The gender, grade, and race/ethnicity of students restrained and/or secluded in 2019-20 are
examined in Tables 2 and 3 and Figure 1 below. All tables in this section represent 2019-20 data
unless otherwise noted. Statewide counts and percentages for all students with IEPs are included
to allow for comparison. In accordance with the Family Educational Rights and Protection Act
(FERPA), some data have been suppressed to protect the identities of individual students.
Suppressed values are marked with an asterisk.
The gender of students restrained and/or secluded in 2019-20 differed significantly from the
gender of all students with IEPs (χ2 (1, N = 3,481) = 323.4, p < .0001). Effect size, a statistical
measure of practical significance, indicated a moderate association (=0.30) between gender and
being restrained and/or secluded. Further examination indicated that male students were
overrepresented in the population of students restrained and/or secluded while female students
were underrepresented.
Table 2
Gender of Students Restrained and/or Secluded (unduplicated count)
Students Restrained and/or
Secluded
All Students with IEPs
Gender Number Percent Number Percent
Female 671 19.3% 28,408 33.7%
Male 2,810 80.7% 55,987 66.3%
TOTAL 3,481 100.0% 84,395 100.0%
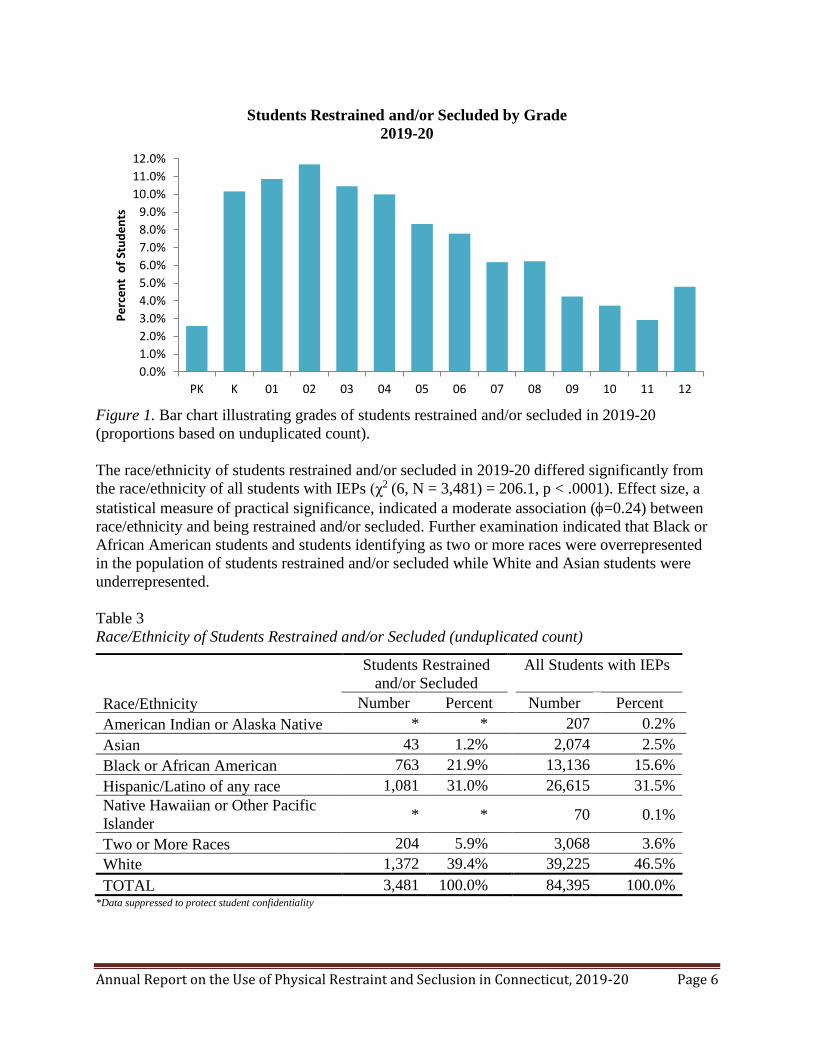
Figure 1, below, provides the proportion of students who were restrained and/or secluded by
grade.
Annual Report on the Use of Physical Restraint and Seclusion in Connecticut, 2019-20 Page 6
Figure 1. Bar chart illustrating grades of students restrained and/or secluded in 2019-20
(proportions based on unduplicated count).
The race/ethnicity of students restrained and/or secluded in 2019-20 differed significantly from
the race/ethnicity of all students with IEPs (χ2 (6, N = 3,481) = 206.1, p < .0001). Effect size, a
statistical measure of practical significance, indicated a moderate association (=0.24) between
race/ethnicity and being restrained and/or secluded. Further examination indicated that Black or
African American students and students identifying as two or more races were overrepresented
in the population of students restrained and/or secluded while White and Asian students were
underrepresented.
Table 3
Race/Ethnicity of Students Restrained and/or Secluded (unduplicated count)
Race/Ethnicity
Students Restrained
and/or Secluded
All Students with IEPs
Number Percent Number Percent
American Indian or Alaska Native * * 207 0.2%
Asian 43 1.2% 2,074 2.5%
Black or African American 763 21.9% 13,136 15.6%
Hispanic/Latino of any race 1,081 31.0% 26,615 31.5%
Native Hawaiian or Other Pacific
Islander * * 70 0.1%
Two or More Races 204 5.9% 3,068 3.6%
White 1,372 39.4% 39,225 46.5%
TOTAL 3,481 100.0% 84,395 100.0% *Data suppressed to protect student confidentiality
0.0%
1.0%
2.0%
3.0%
4.0%
5.0%
6.0%
7.0%
8.0%
9.0%
10.0%
11.0%
12.0%
PK K 01 02 03 04 05 06 07 08 09 10 11 12
Pe
rce
nt
of
Stu
de
nts
Students Restrained and/or Secluded by Grade
2019-20
Annual Report on the Use of Physical Restraint and Seclusion in Connecticut, 2019-20 Page 7
It is extremely important to note that use of the unduplicated student count for any type of
incidence rate calculation must be avoided. R/S incidents take place in response to an emergency
situation when students demonstrate significant self-injurious and/or aggressive behaviors. These
students often have multiple incidents and in many cases account for the majority of incidents
reported by an organization. If the total R/S incident and student count for this LEA were used to
calculate a rate, it would result in significant misrepresentation of the use of R/S by this
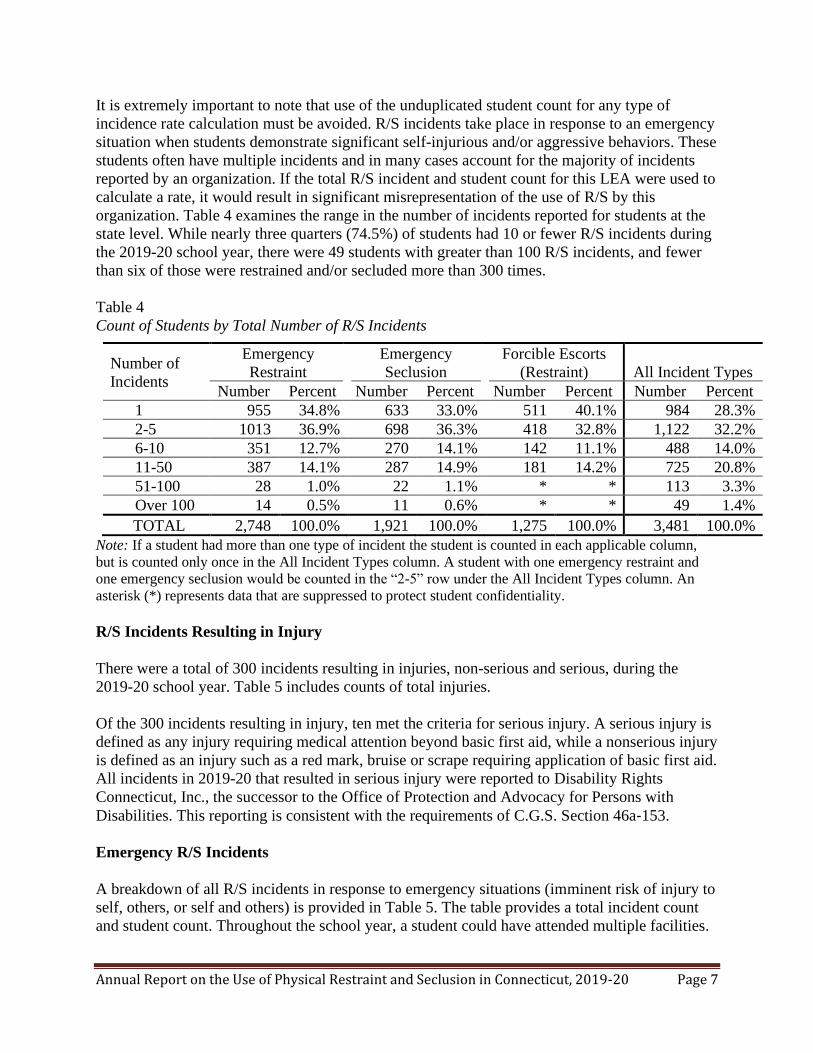
organization. Table 4 examines the range in the number of incidents reported for students at the
state level. While nearly three quarters (74.5%) of students had 10 or fewer R/S incidents during
the 2019-20 school year, there were 49 students with greater than 100 R/S incidents, and fewer
than six of those were restrained and/or secluded more than 300 times.
Table 4
Count of Students by Total Number of R/S Incidents
Number of
Incidents
Emergency
Restraint
Emergency
Seclusion
Forcible Escorts
(Restraint) All Incident Types
Number Percent Number Percent Number Percent Number Percent
1 955 34.8% 633 33.0% 511 40.1% 984 28.3%
2-5 1013 36.9% 698 36.3% 418 32.8% 1,122 32.2%
6-10 351 12.7% 270 14.1% 142 11.1% 488 14.0%
11-50 387 14.1% 287 14.9% 181 14.2% 725 20.8%
51-100 28 1.0% 22 1.1% * * 113 3.3%
Over 100 14 0.5% 11 0.6% * * 49 1.4%
TOTAL 2,748 100.0% 1,921 100.0% 1,275 100.0% 3,481 100.0%
Note: If a student had more than one type of incident the student is counted in each applicable column,
but is counted only once in the All Incident Types column. A student with one emergency restraint and
one emergency seclusion would be counted in the “2-5” row under the All Incident Types column. An
asterisk (*) represents data that are suppressed to protect student confidentiality.
R/S Incidents Resulting in Injury
There were a total of 300 incidents resulting in injuries, non-serious and serious, during the
2019-20 school year. Table 5 includes counts of total injuries.
Of the 300 incidents resulting in injury, ten met the criteria for serious injury. A serious injury is
defined as any injury requiring medical attention beyond basic first aid, while a nonserious injury
is defined as an injury such as a red mark, bruise or scrape requiring application of basic first aid.
All incidents in 2019-20 that resulted in serious injury were reported to Disability Rights
Connecticut, Inc., the successor to the Office of Protection and Advocacy for Persons with
Disabilities. This reporting is consistent with the requirements of C.G.S. Section 46a‐153.
Emergency R/S Incidents
A breakdown of all R/S incidents in response to emergency situations (imminent risk of injury to
self, others, or self and others) is provided in Table 5. The table provides a total incident count
and student count. Throughout the school year, a student could have attended multiple facilities.

Annual Report on the Use of Physical Restraint and Seclusion in Connecticut, 2019-20 Page 8
In these cases, the student will appear in the student count for each applicable facility type, but
only once in the statewide student count. Therefore, the statewide student count may be less than
the sum of the student counts for all facility types.
Table 5
All Emergency R/S Incidents by Facility Type
Emergency Restraints Emergency Seclusions Forcible Escorts
Facility
Type Incident
Count
Student
Count
Total
Injuries
Incident
Count
Student
Count
Total
Injuries
Incident
Count Student
Count Total
Injuries Academies * * 0 0 0 0 0 0 0 APSEPs 8,992 875 98 6,486 606 19 3923 439 * Charter Schs * * * 13 7 0 * * 0 LEAs 7,077 1,549 46 5,110 1,028 64 * 481 * RESCs 3,163 415 * 2,554 313 17 2,861 * 14
STATEWIDE 19,255 2,748 175 14,163 1,921 100 8,469 1,275 25
Note: If a student had an incident in more than one facility type, the student is only counted once in the
statewide student count. Therefore, the statewide student count may be less than the sum of the student
counts for all facility types. An asterisk (*) represents data that are suppressed to protect student
confidentiality.
Duration of R/S Incidents
The duration of R/S incidents was examined. Tables 6, 7 and 8 provide data on the duration of
emergency restraints, emergency seclusions and forcible escort restraints respectively.
Table 6 shows that the vast majority of emergency restraints (96.6%) lasted 20 minutes or less,
with well more than half (61.2%) lasting five minutes or less. Less than one quarter of one
percent (0.1%) of emergency restraints lasted over one hour.
Table 6
Duration of Emergency Restraints by Facility Type
Facility Type
0-2
Minutes
3-5
Minutes
6-20
Minutes
21-40
Minutes
41-60
Minutes
Over 60
Minutes
TOTAL
Emergency
Restraints
Academies 0 * 0 0 0 0 *
APSEPs 2,203 2,716 3,679 339 40 15 8,992
Charter Schools 13 * * * 0 0 *
LEAs 2,551 2,118 2,196 181 22 9 7,077
RESCs 1,145 1,030 * * 7 6 3,163
STATEWIDE N 5,912 5,867 6,818 559 69 30 19,255
% 30.7% 30.5% 35.4% 2.9% 0.4% 0.1% 100.0% *Data suppressed to protect student confidentiality

Annual Report on the Use of Physical Restraint and Seclusion in Connecticut, 2019-20 Page 9
Table 7 shows that over three quarters of emergency seclusions (86.2%) lasted 20 minutes or
less, with 43.2 percent lasting five minutes or less. Less than two percent (1.9%) of emergency
seclusions lasted over an hour.
Table 7
Duration of Emergency Seclusions by Facility Type
Facility Type
0-2
Minutes
3-5
Minutes
6-20
Minutes
21-40
Minutes
41-60
Minutes
Over 60
Minutes
TOTAL
Emergency
Seclusions
Academies 0 0 0 0 0 0 0
APSEPs 1,350 1,659 2,469 613 221 174 6,486
Charter Schools 0 * * * * * 13
LEAs 625 1,090 2,619 541 156 79 5,510
RESCs 780 * * * * * 2,554
STATEWIDE N 2,755 3,359 6,093 1,283 403 270 14,163
% 19.5% 23.7% 43.0% 9.1% 2.8% 1.9% 100.0% *Data suppressed to protect student confidentiality
Table 8 shows that nearly all emergency forcible escorts (99.7%) lasted 20 minutes or less, with
97.2 percent lasting five minutes or less.
Table 8
Duration of Emergency Forcible Escorts (Restraints) by Facility Type
Facility Type
0-2
Minutes
3-5
Minutes
6-20
Minutes
21-40
Minutes
41-60
Minutes
Over 60
Minutes
TOTAL
Emergency
Seclusions
Academies 0 0 0 0 0 0 0
APSEPs 3,618 240 62 * 0 * 3,923
Charter Schools * 0 0 0 0 0 *
LEAs * 188 65 * 0 * *
RESCs 2,636 127 88 7 * * 2,861
STATEWIDE N 7,677 555 215 15 * * 8,469
% 90.6% 6.6% 2.5% 0.1% 0.1% 0.1% 100.0% *Data suppressed to protect student confidentiality
Circumstances Necessitating the Use of R/S
The circumstances necessitating use of emergency R/S were investigated. Below, Figure 2
compares circumstances necessitating the use of emergency restraint, emergency seclusion and
forcible escort restraints. Slightly more forcible escort restraints occurred due to risk of injury to
self, than did other emergency events. When combined, 9.2 percent of emergency response
events occurred solely as a result of risk of injury to self and just over 40 percent (41.3%)
occurred solely as a result of risk of injury to others. Less than half of emergency responses
occurred as a result of risk of injury to self and others (49.5%).

Annual Report on the Use of Physical Restraint and Seclusion in Connecticut, 2019-20 Page 10
Figure 2. Pie charts comparing the circumstances necessitating the use of emergency restraint,
emergency seclusion and forcible escort restraints by risk type: risk of injury to self, others, or
self and others (2019-20 school year).
Primary Disability
Organizations were required to report a student’s primary disability at the time of each R/S
incident. The primary disabilities of autism, emotional disturbance, and other health impairment
(including attention deficit disorder/attention deficit hyperactivity disorder; ADD/ADHD)
accounted for over 80 percent of the incidents in each incident type. Figure 3 shows a breakdown
of incidents by primary disability. The primary disability category of other includes hearing
impairment, visual impairment, orthopedic impairment, deaf/blindness, multiple disabilities and
traumatic brain injury.
Figure 3. Pie charts comparing emergency restraint, emergency seclusion and forcible escort
restraints by Primary Disability (2019-20 school year).

Annual Report on the Use of Physical Restraint and Seclusion in Connecticut, 2019-20 Page 11
Actions Supporting the Reduction in the Use of Emergency Restraint and Seclusion in
School Settings
Public Act 18-51 expanded the existing definition of “restraint” to include escorts requiring
carrying or forcibly moving a student from one location to another. This legislation altered the
reporting requirements for 2018-2019 forward and made comparisons to prior years invalid. In
an effort to fully understand the impact of this legislation, the CSDE added a data field to the
restraint and seclusion 2019-2020 data collection to analyze the number of emergency restraints
that were categorized as an escort. This additional data analysis will be used to inform
supplementary supports and activities to reduce the need for the use of emergency restraint.
However, in the short term, the addition of this new field, along with premature in-person class
cancellations in March 2020 due to the COVID-19 pandemic make it problematic to compare
2019-20 data to those from prior years.
The CSDE continues to collaborate within and across agencies to examine and analyze R/S data
to inform guidance, technical assistance, and professional development activities in an effort to
support the reduction of emergency situations necessitating the use of emergency restraints and
seclusions in the school setting.
The CSDE will initiate a process to further examine incidents of restraint lasting 20 minutes or
more and seclusion reported as lasting 40 minutes or more, to ensure that incidents are reported
accurately and that when a restraint or seclusion extends beyond 15 minutes, the appropriate
oversight and documentation by an administrator (or designee) is maintained by the facility, in
the student file.
The CSDE will continue to support and assist Local Education Agencies and Parents/Guardians
with the provision of formal guidance and technical assistance. Guidance documents and
resources are available on the CSDE website and include: Recommended Procedures and
Practices to Reduce the Use of Restraint and Seclusion in Schools; The Guidelines to Identify
and Educate Students with Emotional Disturbance; Understanding the Laws and Regulations
Governing the Use of Restraint and Seclusion in Schools; and Guidance Related to Recent
Legislation Regarding Restraining and Seclusion in Schools to clarify important new definitions
and R/S requirements under PA 18-15, section 4, effective July 1, 2018. In addition to formal
guidance, the Bureau of Special Education, Due Process Unit responds to formal written
complaints related to restraint and seclusion with targeted feedback and technical assistance or
corrective actions as needed. The CSDE also continues to engage in the Federal School Climate
Transformation Grant (SCTG) as efforts continue to build capacity to develop, enhance, and
expand Connecticut’s Statewide Systems of Support to local educational agencies (LEAs) and
schools.
In a coordinated statewide effort, the CSDE participates in the Connecticut Interagency Restraint
and Seclusion Prevention Initiative. This partnership brings together state agencies and
community providers to support the vision, guiding principles, and overall goals of the initiative,
which is to prevent the use of restraint and seclusion in service environments across the life span.
The partnership has developed a needs assessment to inform future plans to provide prevention
activities, proactive strategies and meaningful tools to assist providers in avoiding the need to
use restraint and seclusion across settings and across agencies.

Annual Report on the Use of Physical Restraint and Seclusion in Connecticut, 2019-20 Page 12
The CSDE also collaborates with our Regional Educational Service Centers (RESCs) and the
State Educational Resource Center (SERC) to provide training and professional development
opportunities on an ongoing basis. The Pyramid Model, which supports Early Childhood
training, is a conceptual framework of evidence-based practices for promoting young children’s
healthy social and emotional development. Additional topics include the impact of trauma on
student learning, early intervention and alternative strategies to address challenging behaviors in
schools, creating appropriate behavior/social emotional goals and objectives within the IEP
process, and best practice strategies in designing and implementing functional behavior
assessments and behavior intervention plans.
Annual Report on the Use of Physical Restraint and Seclusion in Connecticut, 2019-20 Page 13
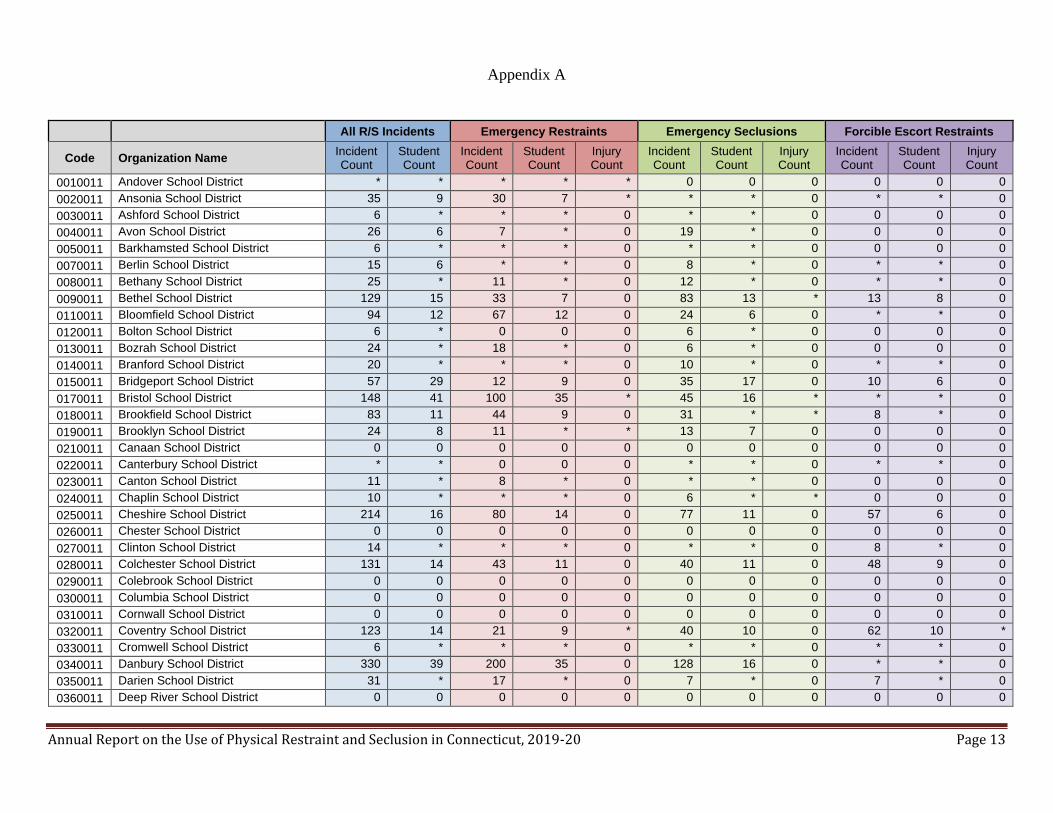
Appendix A
All R/S Incidents Emergency Restraints Emergency Seclusions Forcible Escort Restraints
Code Organization Name Incident Count
Student Count
Incident Count
Student Count
Injury Count
Incident Count
Student Count
Injury Count
Incident Count
Student Count
Injury Count
0010011 Andover School District * * * * * 0 0 0 0 0 0
0020011 Ansonia School District 35 9 30 7 * * * 0 * * 0
0030011 Ashford School District 6 * * * 0 * * 0 0 0 0
0040011 Avon School District 26 6 7 * 0 19 * 0 0 0 0
0050011 Barkhamsted School District 6 * * * 0 * * 0 0 0 0
0070011 Berlin School District 15 6 * * 0 8 * 0 * * 0
0080011 Bethany School District 25 * 11 * 0 12 * 0 * * 0
0090011 Bethel School District 129 15 33 7 0 83 13 * 13 8 0
0110011 Bloomfield School District 94 12 67 12 0 24 6 0 * * 0
0120011 Bolton School District 6 * 0 0 0 6 * 0 0 0 0
0130011 Bozrah School District 24 * 18 * 0 6 * 0 0 0 0
0140011 Branford School District 20 * * * 0 10 * 0 * * 0
0150011 Bridgeport School District 57 29 12 9 0 35 17 0 10 6 0
0170011 Bristol School District 148 41 100 35 * 45 16 * * * 0
0180011 Brookfield School District 83 11 44 9 0 31 * * 8 * 0
0190011 Brooklyn School District 24 8 11 * * 13 7 0 0 0 0
0210011 Canaan School District 0 0 0 0 0 0 0 0 0 0 0
0220011 Canterbury School District * * 0 0 0 * * 0 * * 0
0230011 Canton School District 11 * 8 * 0 * * 0 0 0 0
0240011 Chaplin School District 10 * * * 0 6 * * 0 0 0
0250011 Cheshire School District 214 16 80 14 0 77 11 0 57 6 0
0260011 Chester School District 0 0 0 0 0 0 0 0 0 0 0
0270011 Clinton School District 14 * * * 0 * * 0 8 * 0
0280011 Colchester School District 131 14 43 11 0 40 11 0 48 9 0
0290011 Colebrook School District 0 0 0 0 0 0 0 0 0 0 0
0300011 Columbia School District 0 0 0 0 0 0 0 0 0 0 0
0310011 Cornwall School District 0 0 0 0 0 0 0 0 0 0 0
0320011 Coventry School District 123 14 21 9 * 40 10 0 62 10 *
0330011 Cromwell School District 6 * * * 0 * * 0 * * 0
0340011 Danbury School District 330 39 200 35 0 128 16 0 * * 0
0350011 Darien School District 31 * 17 * 0 7 * 0 7 * 0
0360011 Deep River School District 0 0 0 0 0 0 0 0 0 0 0
Annual Report on the Use of Physical Restraint and Seclusion in Connecticut, 2019-20 Page 14
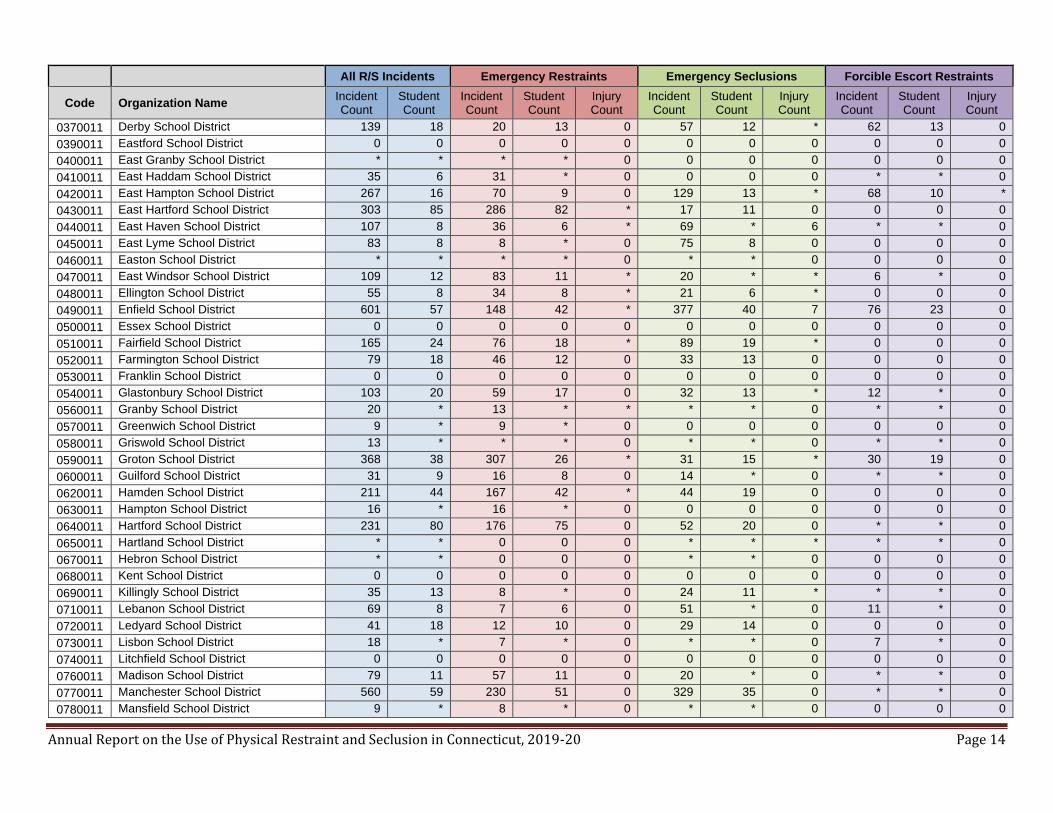
All R/S Incidents Emergency Restraints Emergency Seclusions Forcible Escort Restraints
Code Organization Name Incident Count
Student Count
Incident Count
Student Count
Injury Count
Incident Count
Student Count
Injury Count
Incident Count
Student Count
Injury Count
0370011 Derby School District 139 18 20 13 0 57 12 * 62 13 0
0390011 Eastford School District 0 0 0 0 0 0 0 0 0 0 0
0400011 East Granby School District * * * * 0 0 0 0 0 0 0
0410011 East Haddam School District 35 6 31 * 0 0 0 0 * * 0
0420011 East Hampton School District 267 16 70 9 0 129 13 * 68 10 *
0430011 East Hartford School District 303 85 286 82 * 17 11 0 0 0 0
0440011 East Haven School District 107 8 36 6 * 69 * 6 * * 0
0450011 East Lyme School District 83 8 8 * 0 75 8 0 0 0 0
0460011 Easton School District * * * * 0 * * 0 0 0 0
0470011 East Windsor School District 109 12 83 11 * 20 * * 6 * 0
0480011 Ellington School District 55 8 34 8 * 21 6 * 0 0 0
0490011 Enfield School District 601 57 148 42 * 377 40 7 76 23 0
0500011 Essex School District 0 0 0 0 0 0 0 0 0 0 0
0510011 Fairfield School District 165 24 76 18 * 89 19 * 0 0 0
0520011 Farmington School District 79 18 46 12 0 33 13 0 0 0 0
0530011 Franklin School District 0 0 0 0 0 0 0 0 0 0 0
0540011 Glastonbury School District 103 20 59 17 0 32 13 * 12 * 0
0560011 Granby School District 20 * 13 * * * * 0 * * 0
0570011 Greenwich School District 9 * 9 * 0 0 0 0 0 0 0
0580011 Griswold School District 13 * * * 0 * * 0 * * 0
0590011 Groton School District 368 38 307 26 * 31 15 * 30 19 0
0600011 Guilford School District 31 9 16 8 0 14 * 0 * * 0
0620011 Hamden School District 211 44 167 42 * 44 19 0 0 0 0
0630011 Hampton School District 16 * 16 * 0 0 0 0 0 0 0
0640011 Hartford School District 231 80 176 75 0 52 20 0 * * 0
0650011 Hartland School District * * 0 0 0 * * * * * 0
0670011 Hebron School District * * 0 0 0 * * 0 0 0 0
0680011 Kent School District 0 0 0 0 0 0 0 0 0 0 0
0690011 Killingly School District 35 13 8 * 0 24 11 * * * 0
0710011 Lebanon School District 69 8 7 6 0 51 * 0 11 * 0
0720011 Ledyard School District 41 18 12 10 0 29 14 0 0 0 0
0730011 Lisbon School District 18 * 7 * 0 * * 0 7 * 0
0740011 Litchfield School District 0 0 0 0 0 0 0 0 0 0 0
0760011 Madison School District 79 11 57 11 0 20 * 0 * * 0
0770011 Manchester School District 560 59 230 51 0 329 35 0 * * 0
0780011 Mansfield School District 9 * 8 * 0 * * 0 0 0 0

Annual Report on the Use of Physical Restraint and Seclusion in Connecticut, 2019-20 Page 15
All R/S Incidents Emergency Restraints Emergency Seclusions Forcible Escort Restraints
Code Organization Name Incident Count
Student Count
Incident Count
Student Count
Injury Count
Incident Count
Student Count
Injury Count
Incident Count
Student Count
Injury Count
0790011 Marlborough School District 11 * * * 0 9 * * 0 0 0
0800011 Meriden School District 786 88 374 67 * 168 39 0 244 57 0
0830011 Middletown School District 196 34 89 26 0 100 21 * 7 6 0
0840011 Milford School District 302 25 127 18 0 108 18 * 67 14 0
0850011 Monroe School District 86 * 20 * 0 18 * 0 48 * 0
0860011 Montville School District 80 19 43 15 0 14 8 0 23 7 0
0880011 Naugatuck School District 200 40 98 23 * 83 28 0 19 12 0
0890011 New Britain School District 758 99 227 68 * 405 55 * 126 38 *
0900011 New Canaan School District 10 * 10 * 0 0 0 0 0 0 0
0910011 New Fairfield School District 24 6 17 6 0 7 * 0 0 0 0
0920011 New Hartford School District 11 * 9 * 0 * * 0 0 0 0
0930011 New Haven School District 21 10 21 10 0 0 0 0 0 0 0
0940011 Newington School District 156 18 82 17 0 74 6 * 0 0 0
0950011 New London School District 91 28 69 22 * 21 11 0 * * *
0960011 New Milford School District 181 27 65 24 0 116 19 * 0 0 0
0970011 Newtown School District 46 12 37 11 0 7 * 0 * * 0
0980011 Norfolk School District 0 0 0 0 0 0 0 0 0 0 0
0990011 North Branford School District 107 10 80 10 * 14 6 0 13 6 *
1000011 North Canaan School District 0 0 0 0 0 0 0 0 0 0 0
1010011 North Haven School District 49 7 17 6 0 32 6 0 0 0 0
1020011 North Stonington School District 0 0 0 0 0 0 0 0 0 0 0
1030011 Norwalk School District 111 27 73 19 0 19 11 0 19 10 0
1040011 Norwich School District 276 36 267 36 0 8 6 0 * * 0
1060011 Old Saybrook School District 7 * * * 0 * * 0 0 0 0
1070011 Orange School District * * * * 0 0 0 0 * * 0
1080011 Oxford School District 14 * * * 0 10 * 0 0 0 0
1090011 Plainfield School District 141 35 109 27 * 13 10 0 19 11 0
1100011 Plainville School District 306 16 35 7 * 260 12 * 11 6 0
1110011 Plymouth School District 92 16 21 10 0 71 14 * 0 0 0
1120011 Pomfret School District 0 0 0 0 0 0 0 0 0 0 0
1130011 Portland School District 19 6 13 * 0 6 * 0 0 0 0
1140011 Preston School District * * * * 0 0 0 0 0 0 0
1160011 Putnam School District 11 7 8 6 0 * * 0 * * 0
1170011 Redding School District 80 6 70 * 0 * * 0 * * 0
1180011 Ridgefield School District 49 12 24 11 0 13 * 0 12 * 0
1190011 Rocky Hill School District 62 * 47 * 0 15 * 0 0 0 0

Annual Report on the Use of Physical Restraint and Seclusion in Connecticut, 2019-20 Page 16
All R/S Incidents Emergency Restraints Emergency Seclusions Forcible Escort Restraints
Code Organization Name Incident Count
Student Count
Incident Count
Student Count
Injury Count
Incident Count
Student Count
Injury Count
Incident Count
Student Count
Injury Count
1210011 Salem School District * * * * 0 0 0 0 0 0 0
1220011 Salisbury School District * * 0 0 0 * * 0 0 0 0
1230011 Scotland School District 0 0 0 0 0 0 0 0 0 0 0
1240011 Seymour School District 116 8 37 * 0 37 * * 42 8 0
1250011 Sharon School District 0 0 0 0 0 0 0 0 0 0 0
1260011 Shelton School District 125 18 50 17 * 53 9 * 22 * 0
1270011 Sherman School District 0 0 0 0 0 0 0 0 0 0 0
1280011 Simsbury School District 284 24 266 22 0 18 10 0 0 0 0
1290011 Somers School District 25 * * * 0 21 * * * * 0
1310011 Southington School District 92 13 48 7 0 44 10 0 0 0 0
1320011 South Windsor School District 8 6 6 * 0 * * 0 * * 0
1330011 Sprague School District 20 * * * 0 * * 0 13 * 0
1340011 Stafford School District 51 10 13 * 0 24 9 0 14 * 0
1350011 Stamford School District 245 40 204 29 0 41 16 0 0 0 0
1360011 Sterling School District 0 0 0 0 0 0 0 0 0 0 0
1370011 Stonington School District 114 * 14 * 0 49 * 0 51 * 0
1380011 Stratford School District 235 33 126 29 0 109 25 0 0 0 0
1390011 Suffield School District 73 8 25 6 0 48 * * 0 0 0
1400011 Thomaston School District * * 0 0 0 * * 0 0 0 0
1410011 Thompson School District 22 7 17 7 0 * * 0 0 0 0
1420011 Tolland School District 109 12 25 10 0 53 9 0 31 * 0
1430011 Torrington School District 141 25 68 21 * 53 14 * 20 8 0
1440011 Trumbull School District 220 23 114 22 0 89 10 * 17 9 0
1450011 Union School District 0 0 0 0 0 0 0 0 0 0 0
1460011 Vernon School District 516 34 223 26 0 182 23 * 111 23 0
1470011 Voluntown School District 0 0 0 0 0 0 0 0 0 0 0
1480011 Wallingford School District 153 23 116 22 0 29 7 0 8 * 0
1510011 Waterbury School District 358 85 188 51 0 169 51 0 * * 0
1520011 Waterford School District * * * * 0 0 0 0 0 0 0
1530011 Watertown School District 92 9 34 7 0 48 7 0 10 * 0
1540011 Westbrook School District * * * * 0 * * 0 0 0 0
1550011 West Hartford School District 121 22 19 13 0 69 18 0 33 12 0
1560011 West Haven School District 9 * 9 * 0 0 0 0 0 0 0
1570011 Weston School District 46 * 36 * 0 10 * 0 0 0 0
1580011 Westport School District 12 * 10 * * * * 0 * * 0
1590011 Wethersfield School District 57 14 36 13 0 21 7 0 0 0 0
Annual Report on the Use of Physical Restraint and Seclusion in Connecticut, 2019-20 Page 17
All R/S Incidents Emergency Restraints Emergency Seclusions Forcible Escort Restraints
Code Organization Name Incident Count
Student Count
Incident Count
Student Count
Injury Count
Incident Count
Student Count
Injury Count
Incident Count
Student Count
Injury Count
1600011 Willington School District 23 * * * 0 11 * 0 11 * 0
1610011 Wilton School District 6 * * * * * * * 0 0 0
1620011 Winchester School District 120 8 62 7 0 0 0 0 58 6 0
1630011 Windham School District 346 35 260 31 7 65 22 * 21 11 0
1640011 Windsor School District 91 23 32 12 0 30 13 0 29 15 *
1650011 Windsor Locks School District 55 12 22 9 0 29 6 0 * * 0
1660011 Wolcott School District 32 * 27 * 0 * * 0 0 0 0
1670011 Woodbridge School District 56 7 40 6 0 16 * 0 0 0 0
1690011 Woodstock School District 0 0 0 0 0 0 0 0 0 0 0
2010012 Regional School District 01 0 0 0 0 0 0 0 0 0 0 0
2040012 Regional School District 04 0 0 0 0 0 0 0 0 0 0 0
2050012 Regional School District 05 * * * * 0 0 0 0 0 0 0
2060012 Regional School District 06 9 * 7 * * 0 0 0 * * 0
2070012 Regional School District 07 0 0 0 0 0 0 0 0 0 0 0
2080012 Regional School District 08 * * * * * 0 0 0 0 0 0
2090012 Regional School District 09 90 * 90 * 0 0 0 0 0 0 0
2100012 Regional School District 10 13 * 13 * 0 0 0 0 0 0 0
2110012 Regional School District 11 0 0 0 0 0 0 0 0 0 0 0
2120012 Regional School District 12 11 * 7 * 0 * * 0 0 0 0
2130012 Regional School District 13 * * 0 0 0 0 0 0 * * 0
2140012 Regional School District 14 47 7 38 7 0 7 * 0 * * 0
2150012 Regional School District 15 10 * 9 * 0 * * 0 0 0 0
2160012 Regional School District 16 60 * 22 * * 15 * 0 23 * 0
2170012 Regional School District 17 * * * * 0 * * 0 * * 0
2180012 Regional School District 18 8 * * * 0 * * 0 * * 0
2190012 Regional School District 19 * * * * 0 0 0 0 * * 0
3370015 Dept. of Mental Health and Addiction Services
0 0 0 0 0 0 0 0 0 0 0
3470015 Unified School District #2 0 0 0 0 0 0 0 0 0 0 0
9000016 CT Technical Education and Career System
0 0 0 0 0 0 0 0 0 0 0
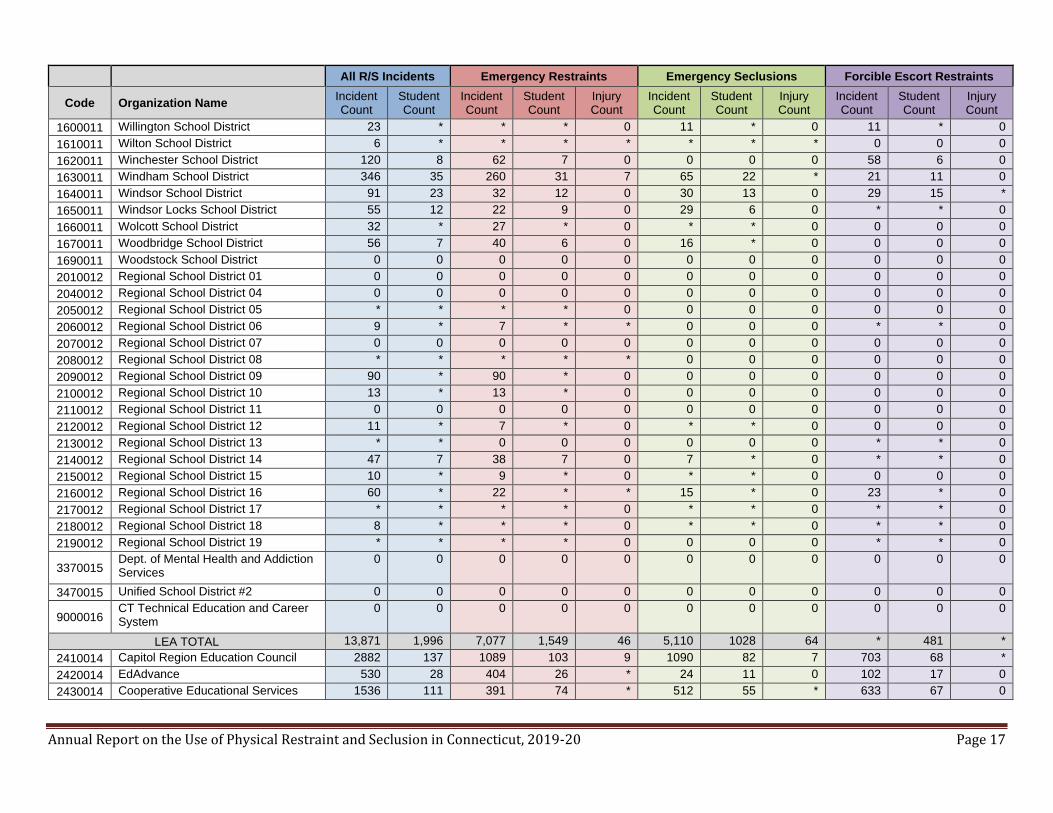
LEA TOTAL 13,871 1,996 7,077 1,549 46 5,110 1028 64 * 481 *
2410014 Capitol Region Education Council 2882 137 1089 103 9 1090 82 7 703 68 *
2420014 EdAdvance 530 28 404 26 * 24 11 0 102 17 0
2430014 Cooperative Educational Services 1536 111 391 74 * 512 55 * 633 67 0

Annual Report on the Use of Physical Restraint and Seclusion in Connecticut, 2019-20 Page 18
All R/S Incidents Emergency Restraints Emergency Seclusions Forcible Escort Restraints
Code Organization Name Incident Count
Student Count
Incident Count
Student Count
Injury Count
Incident Count
Student Count
Injury Count
Incident Count
Student Count
Injury Count
2440014 Area Cooperative Educational Services
1793 204 471 132 12 566 98 9 756 151 11
2450014 Learn 1102 44 610 33 0 260 30 0 232 25 0
2530014
Eastern Connecticut Regional Educational Service Center (EASTCONN)
735 65 198 49 6 102 38 0 435 45 *
RESC TOTAL 8,578 587 3,163 415 * 2,554 313 17 2,861 * 14
0046821 The Webb School in the Valley 61 8 9 * 0 52 7 0 0 0 0
0046921 Oak Hill School at Farmington Valley Montessori
11 * 11 * 0 0 0 0 0 0 0
0100161 Arch Bridge School 54 * 39 * 0 0 0 0 15 * 0
0170221 Oak Hill School at Chapter 126 34 * 33 * 0 0 0 0 * * 0
0170561 Oak Hill School at Hartford Secondary
21 * 21 * 0 0 0 0 0 0 0
0170821 Connecticut Junior Republic-Bristol 0 0 0 0 0 0 0 0 0 0 0
0190161 The Learning Clinic * * * * 0 0 0 0 0 0 0
0230121 Fresh Start School 0 0 0 0 0 0 0 0 0 0 0
0250161 The Webb School at Cheshire 190 15 116 15 * 74 13 0 0 0 0
0330161 Adelbrook-The Learning Center of Cromwell
3364 55 1322 45 0 697 34 0 1345 50 0
0360161 Connecticut Coastal Academy 0 0 0 0 0 0 0 0 0 0 0
0380261 Rushford Academy 0 0 0 0 0 0 0 0 0 0 0
0430121 Adelbrook-The Learning Center of East Hartford
7 * 7 * 0 0 0 0 0 0 0
0440221 Pathways Academy - East Haven * * * * 0 0 0 0 0 0 0
0450161 The Light House on Main St 10 * 6 * 0 * * 0 * * 0
0450261 The Light House on Pennsylvania Ave
* * * * 0 0 0 0 0 0 0
0460161 The Speech Academy-Easton 0 0 0 0 0 0 0 0 0 0 0
0490161 Natchaug Hospital School Joshua Center-Enfield
0 0 0 0 0 0 0 0 0 0 0
0510261 Giant Steps CT School 48 9 47 8 * 0 0 0 * * 0
0516061 Saint Catherine Academy * * * * 0 0 0 0 0 0 0
0530121 Natchaug Hospital Green Valley School
25 8 21 6 0 0 0 0 * * *
0570161 Eagle Hill School 0 0 0 0 0 0 0 0 0 0 0
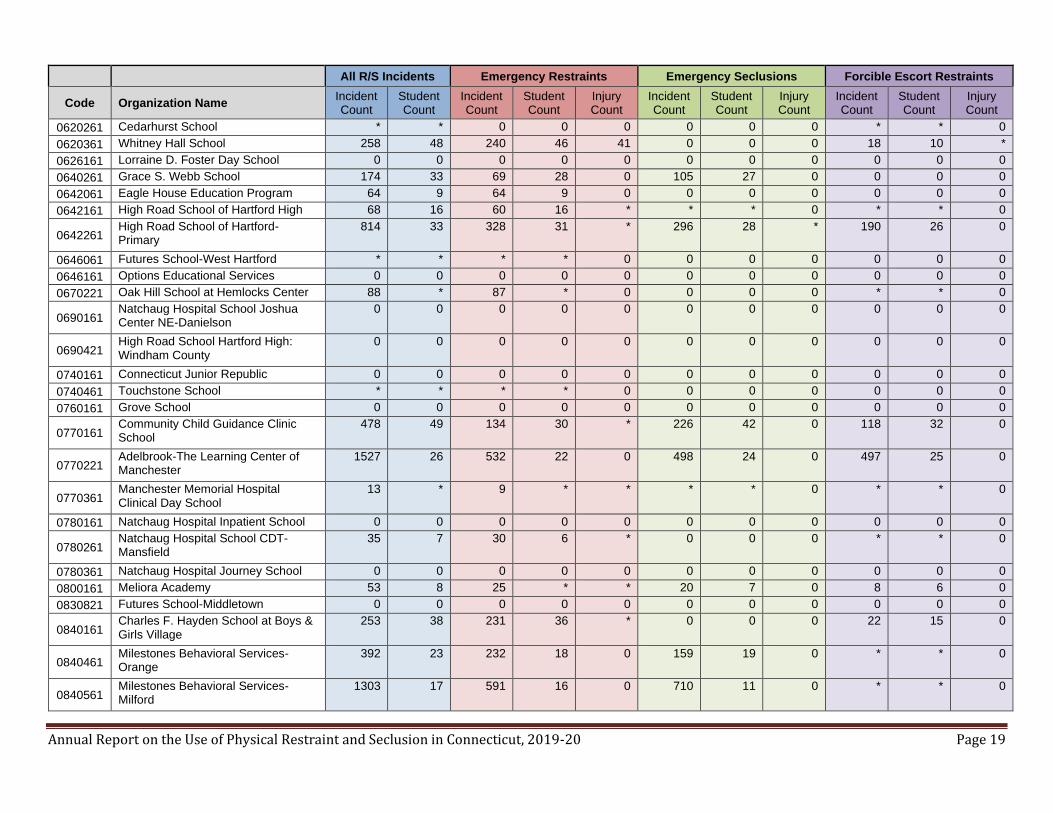
Annual Report on the Use of Physical Restraint and Seclusion in Connecticut, 2019-20 Page 19
All R/S Incidents Emergency Restraints Emergency Seclusions Forcible Escort Restraints
Code Organization Name Incident Count
Student Count
Incident Count
Student Count
Injury Count
Incident Count
Student Count
Injury Count
Incident Count
Student Count
Injury Count
0620261 Cedarhurst School * * 0 0 0 0 0 0 * * 0
0620361 Whitney Hall School 258 48 240 46 41 0 0 0 18 10 *
0626161 Lorraine D. Foster Day School 0 0 0 0 0 0 0 0 0 0 0
0640261 Grace S. Webb School 174 33 69 28 0 105 27 0 0 0 0
0642061 Eagle House Education Program 64 9 64 9 0 0 0 0 0 0 0
0642161 High Road School of Hartford High 68 16 60 16 * * * 0 * * 0
0642261 High Road School of Hartford-Primary
814 33 328 31 * 296 28 * 190 26 0
0646061 Futures School-West Hartford * * * * 0 0 0 0 0 0 0
0646161 Options Educational Services 0 0 0 0 0 0 0 0 0 0 0
0670221 Oak Hill School at Hemlocks Center 88 * 87 * 0 0 0 0 * * 0
0690161 Natchaug Hospital School Joshua Center NE-Danielson
0 0 0 0 0 0 0 0 0 0 0
0690421 High Road School Hartford High: Windham County
0 0 0 0 0 0 0 0 0 0 0
0740161 Connecticut Junior Republic 0 0 0 0 0 0 0 0 0 0 0
0740461 Touchstone School * * * * 0 0 0 0 0 0 0
0760161 Grove School 0 0 0 0 0 0 0 0 0 0 0
0770161 Community Child Guidance Clinic School
478 49 134 30 * 226 42 0 118 32 0
0770221 Adelbrook-The Learning Center of Manchester
1527 26 532 22 0 498 24 0 497 25 0
0770361 Manchester Memorial Hospital Clinical Day School
13 * 9 * * * * 0 * * 0
0780161 Natchaug Hospital Inpatient School 0 0 0 0 0 0 0 0 0 0 0
0780261 Natchaug Hospital School CDT-Mansfield
35 7 30 6 * 0 0 0 * * 0
0780361 Natchaug Hospital Journey School 0 0 0 0 0 0 0 0 0 0 0
0800161 Meliora Academy 53 8 25 * * 20 7 0 8 6 0
0830821 Futures School-Middletown 0 0 0 0 0 0 0 0 0 0 0
0840161 Charles F. Hayden School at Boys & Girls Village
253 38 231 36 * 0 0 0 22 15 0
0840461 Milestones Behavioral Services-Orange
392 23 232 18 0 159 19 0 * * 0
0840561 Milestones Behavioral Services-Milford
1303 17 591 16 0 710 11 0 * * 0

Annual Report on the Use of Physical Restraint and Seclusion in Connecticut, 2019-20 Page 20
All R/S Incidents Emergency Restraints Emergency Seclusions Forcible Escort Restraints
Code Organization Name Incident Count
Student Count
Incident Count
Student Count
Injury Count
Incident Count
Student Count
Injury Count
Incident Count
Student Count
Injury Count
0846061 The Foundation School-Milford * * * * 0 * * 0 * * 0
0846161 Woodhouse Academy 0 0 0 0 0 0 0 0 0 0 0
0860221 Bradley School-New London Regional
1032 45 331 37 * 430 35 0 271 32 0
0880521 IPPI Learning Academy at Prospect St. School
216 13 73 9 0 67 8 0 76 8 *
0890261 Oak Hill School at Bristol 21 6 21 6 0 0 0 0 0 0 0
0890361 Raymond Hill School 416 60 223 51 0 193 41 0 0 0 0
0890461 Solterra Academy 1712 90 1040 74 * 283 57 0 389 71 0
0895161 Oak Hill School at Hartford Primary 15 * 15 * 0 0 0 0 0 0 0
0920161 Oak Hill School at Ann Antolini School
10 * 10 * 0 0 0 0 0 0 0
0930661 Chapel Haven Schleifer Center, Inc. 0 0 0 0 0 0 0 0 0 0 0
0931461 Yale Child Study Center School 0 0 0 0 0 0 0 0 0 0 0
0950161 Connecticut College Child Development Lab School
0 0 0 0 0 0 0 0 0 0 0
0950421 High Road School of New London Middle/High School
31 9 23 8 * * * 0 * * 0
0950821 High Road School of New London Primary School
142 9 82 8 * 39 7 0 21 * 0
1010161 Elizabeth Ives School for Special Children
* * 0 0 0 * * 0 0 0 0
1036261 High Road School of Fairfield County 348 30 241 28 * 91 16 0 16 13 0
1040721 Natchaug Hospital School Joshua Center Thames Valley CDT
0 0 0 0 0 0 0 0 0 0 0
1060161 Natchaug Hospital School CDT-Shoreline
0 0 0 0 0 0 0 0 0 0 0
1070161 The Foundation School-Orange 0 0 0 0 0 0 0 0 0 0 0
1075061 Hope Academy 0 0 0 0 0 0 0 0 0 0 0
1100261 Northwest Village School/Wheeler Clinic
1721 94 813 88 20 801 84 12 107 36 0
1105261 Oak Hill School at Middle School of Plainville
* * * * 0 0 0 0 0 0 0
1106161 Oak Hill School at Haddam-Killingworth High School
* * * * 0 0 0 0 0 0 0
1130121 Oak Hill School at Portland 0 0 0 0 0 0 0 0 0 0 0

Annual Report on the Use of Physical Restraint and Seclusion in Connecticut, 2019-20 Page 21
All R/S Incidents Emergency Restraints Emergency Seclusions Forcible Escort Restraints
Code Organization Name Incident Count
Student Count
Incident Count
Student Count
Injury Count
Incident Count
Student Count
Injury Count
Incident Count
Student Count
Injury Count
1290321 The Speech Academy-Somersville 0 0 0 0 0 0 0 0 0 0 0
1350161 Villa Maria Education Center 0 0 0 0 0 0 0 0 0 0 0
1351321 IPPI Learning Academy: Stamford 68 * 28 * 0 19 * 0 21 * 0
1356621 The Spire School 0 0 0 0 0 0 0 0 0 0 0
1356721 The Pinnacle School, LLC 22 7 9 * 0 13 * 0 0 0 0
1380121 IPPI Learning Academy: Stratford 1452 48 481 38 0 407 34 0 564 39 0
1410161 River Run Academy at the Susan Wayne Center of Excellence
110 18 103 17 0 7 * 0 0 0 0
1410221 Bradley School-Windham County 241 9 153 8 * 70 9 0 18 6 0
1440161 St. Vincent's Special Needs School Program
0 0 0 0 0 0 0 0 0 0 0
1480161 Benhaven School 736 23 504 20 0 180 15 0 52 7 0
1480461 Benhaven Academy 0 0 0 0 0 0 0 0 0 0 0
1480521 High Road Academy - BEST Academy
250 22 109 12 * 119 14 * 22 10 0
1485061 High Road School of Wallingford 658 41 228 36 0 310 26 * 120 23 0
1500161 Devereux Glenholme School 19 * 13 * * * * 0 * * 0
1520161 Waterford Country School 36 16 35 16 * * * 0 0 0 0
1550161 Gengras Center 698 23 133 16 0 565 22 * 0 0 0
1550261 Intensive Education Academy 68 9 33 8 0 33 6 * * * 0
1550361 American School for the Deaf 0 0 0 0 0 0 0 0 0 0 0
1550561 Ben Bronz Academy 0 0 0 0 0 0 0 0 0 0 0
1550861 PACES 7 * 7 * 0 0 0 0 0 0 0
1610221 Westport Day School 0 0 0 0 0 0 0 0 0 0 0
APSEP TOTAL 19,401 1,003 8,992 857 98 6,486 606 19 3,923 439 *
9010022 Norwich Free Academy District * * * * 0 0 0 0 0 0 0
9020022 Gilbert School District 0 0 0 0 0 0 0 0 0 0 0
9030022 Woodstock Academy District 0 0 0 0 0 0 0 0 0 0 0
ACADEMY TOTAL * * * * 0 0 0 0 0 0 0
2610013 Jumoke Academy 0 0 0 0 0 0 0 0 0 0 0
2630013 Odyssey Community School * * * * 0 * * 0 0 0 0
2640013 Integrated Day Charter School 0 0 0 0 0 0 0 0 0 0 0
2650013 Interdistrict School for Arts and Comm.
0 0 0 0 0 0 0 0 0 0 0
2680013 Common Ground High School 0 0 0 0 0 0 0 0 0 0 0
2690013 The Bridge Academy 0 0 0 0 0 0 0 0 0 0 0

Annual Report on the Use of Physical Restraint and Seclusion in Connecticut, 2019-20 Page 22
All R/S Incidents Emergency Restraints Emergency Seclusions Forcible Escort Restraints
Code Organization Name Incident Count
Student Count
Incident Count
Student Count
Injury Count
Incident Count
Student Count
Injury Count
Incident Count
Student Count
Injury Count
2700013 Side By Side Charter School 0 0 0 0 0 0 0 0 0 0 0
2720013 Explorations 0 0 0 0 0 0 0 0 0 0 0
2790013 Amistad Academy * * * * 0 * * 0 * * 0
2800013 New Beginnings Inc Family Academy 0 0 0 0 0 0 0 0 0 0 0
2820013 Stamford Academy 0 0 0 0 0 0 0 0 0 0 0
2830013 Park City Prep Charter School 0 0 0 0 0 0 0 0 0 0 0
2850013 Achievement First Bridgeport Academy
* * * * 0 0 0 0 0 0 0
2860013 Highville Charter School * * * * 0 0 0 0 0 0 0
2880013 Achievement First Hartford Academy 8 * 8 * * 0 0 0 0 0 0
2890013 Elm City College Preparatory School 11 * 6 * * * * 0 0 0 0
2900013 Brass City Charter School 0 0 0 0 0 0 0 0 0 0 0
2910013 Elm City Montessori School * * * * 0 0 0 0 0 0 0
2940013 Great Oaks Charter School * * * * 0 0 0 0 0 0 0
2950013 Booker T. Washington Academy * * 0 0 0 * * 0 0 0 0
2960013 Stamford Charter School for Excellence
0 0 0 0 0 0 0 0 0 0 0
2970013 Capital Preparatory Harbor School 0 0 0 0 0 0 0 0 0 0 0
CHARTER SCHOOL TOTAL 36 19 * * * 13 7 0 * * 0
STATEWIDE 41,887 3,481 19,255 2,748 175 14,163 1,921 100 8,469 1,275 25

Annual Report on the Use of Physical Restraint and Seclusion in Connecticut, 2019-20 Page 23