
RESTORATION OF COMMON MURRE COLONIES IN … · restoration of common murre colonies in central...
67
RESTORATION OF COMMON MURRE COLONIES IN CENTRAL CALIFORNIA: ANNUAL REPORT 2004 REPORT TO THE APEX HOUSTON TRUSTEE COUNCIL Gerard J. McChesney 1 , Nathan M. Jones 2 , Travis B. Poitras 2 , Karen J. Vickers 2 , Lisa E. Eigner 2 , Harry R. Carter 3 , Richard T. Golightly 2 , Stephen W. Kress 4 , Michael W. Parker 5 , Kristina Studnicki 2 , Phillip J. Capitolo 2 , and James N. Hall 2 U.S. Fish and Wildlife Service San Francisco Bay National Wildlife Refuge Complex P.O. Box 524 Newark, CA 94560 FINAL REPORT 1 August 2005
Transcript of RESTORATION OF COMMON MURRE COLONIES IN … · restoration of common murre colonies in central...

RESTORATION OF COMMON MURRE COLONIES IN CENTRAL CALIFORNIA:ANNUAL REPORT 2004
REPORT TO THE APEX HOUSTON TRUSTEE COUNCIL
Gerard J. McChesney1, Nathan M. Jones2, Travis B. Poitras2, Karen J. Vickers2, Lisa E. Eigner2,Harry R. Carter3, Richard T. Golightly2, Stephen W. Kress4, Michael W. Parker5,
Kristina Studnicki2, Phillip J. Capitolo2, and James N. Hall2
U.S. Fish and Wildlife ServiceSan Francisco Bay National Wildlife Refuge Complex
P.O. Box 524Newark, CA 94560
FINAL REPORT 1 August 2005

RESTORATION OF COMMON MURRE COLONIES IN CENTRAL CALIFORNIA:ANNUAL REPORT 2004
REPORT TO THE APEX HOUSTON TRUSTEE COUNCIL
by
Gerard J. McChesney1, Nathan M. Jones2, Travis B. Poitras2, Karen J. Vickers2, Lisa E. Eigner2,Harry R. Carter3, Richard T. Golightly2, Stephen W. Kress4, Michael W. Parker5,
Kristina Studnicki2, Phillip J. Capitolo2, and James N. Hall2
1U.S. Fish and Wildlife Service, San Francisco Bay National Wildlife Refuge Complex,
P.O. Box 524, Newark, CA 945602Humboldt State University, Department of Wildlife, Arcata, CA 95521
3Carter Biological Consulting, 1015 Hampshire Road, Victoria, BC V8S 4S8 Canada 4National Audubon Society, 159 Sapsucker Road, Ithaca, NY 14850
5U.S. Fish and Wildlife Service, Red Rock Lakes National Wildlife Refuge,27820 Southside Centennial Road; Lima, MT 59739
U.S. Fish and Wildlife ServiceSan Francisco Bay National Wildlife Refuge Complex
P.O. Box 524Newark, CA 94560
FINAL REPORT 1 August 2005

ii
Suggested Citation: McChesney, G. J., N. M. Jones, T. B. Poitras, K. J. Vickers, L. E.Eigner, H. R. Carter, R. T. Golightly, S. W. Kress, M. W. Parker,K. Studnicki, P. J. Capitolo, and J. N. Hall. 2005. Restoration ofCommon Murre colonies in central California: annual report 2004.Unpublished report, U.S. Fish and Wildlife Service, San FranciscoBay National Wildlife Refuge Complex, Newark, California(prepared for the Apex Houston Trustee Council).

iii
TABLE OF CONTENTS
LIST OF FIGURES . . . . . . . . . . . . . . . . . . . . . . . . . . . . . . . . . . . . . . . . . . . . . . . . . . . . . . . . . . ivLIST OF TABLES . . . . . . . . . . . . . . . . . . . . . . . . . . . . . . . . . . . . . . . . . . . . . . . . . . . . . . . . . . . viACKNOWLEDGMENTS . . . . . . . . . . . . . . . . . . . . . . . . . . . . . . . . . . . . . . . . . . . . . . . . . . . . viiEXECUTIVE SUMMARY . . . . . . . . . . . . . . . . . . . . . . . . . . . . . . . . . . . . . . . . . . . . . . . . . . . . ixPROJECT STRUCTURE AND ADMINISTRATION . . . . . . . . . . . . . . . . . . . . . . . . . . . . . xiINTRODUCTION . . . . . . . . . . . . . . . . . . . . . . . . . . . . . . . . . . . . . . . . . . . . . . . . . . . . . . . . . . . . 1SCIENTIFIC PROGRAM . . . . . . . . . . . . . . . . . . . . . . . . . . . . . . . . . . . . . . . . . . . . . . . . . . . . . 3
METHODS . . . . . . . . . . . . . . . . . . . . . . . . . . . . . . . . . . . . . . . . . . . . . . . . . . . . . . . . . . . . . . . . 3Social Attraction . . . . . . . . . . . . . . . . . . . . . . . . . . . . . . . . . . . . . 3Monitoring Effort . . . . . . . . . . . . . . . . . . . . . . . . . . . . . . . . . . . . 5Seasonal Attendance Patterns . . . . . . . . . . . . . . . . . . . . . . . . . . . 5Productivity - Common Murre . . . . . . . . . . . . . . . . . . . . . . . . . . 6Adult Time Budgets - Common Murres . . . . . . . . . . . . . . . . . . 7Disturbance . . . . . . . . . . . . . . . . . . . . . . . . . . . . . . . . . . . . . . . . . . 7Brandt’s Cormorant Productivity and Nest Surveys . . . . . . . . 8Aerial Photographic Surveys . . . . . . . . . . . . . . . . . . . . . . . . . . . 9Colony Surveys - Other Species . . . . . . . . . . . . . . . . . . . . . . . . . 9
RESULTS . . . . . . . . . . . . . . . . . . . . . . . . . . . . . . . . . . . . . . . . . . . . . . . . . . . . . . . . . . . . . . . . 10Social Attraction . . . . . . . . . . . . . . . . . . . . . . . . . . . . . . . . . . . . 10Seasonal Attendance Patterns . . . . . . . . . . . . . . . . . . . . . . . . . . 10Productivity - Common Murre . . . . . . . . . . . . . . . . . . . . . . . . . 12Adult Time Budgets - Common Murres . . . . . . . . . . . . . . . . . 13Disturbance . . . . . . . . . . . . . . . . . . . . . . . . . . . . . . . . . . . . . . . . . 14Brandt’s Cormorant Productivity and Nest Surveys . . . . . . . 16Aerial Photographic Surveys . . . . . . . . . . . . . . . . . . . . . . . . . . 17Colony Surveys - Other Species . . . . . . . . . . . . . . . . . . . . . . . . 18
DISCUSSION . . . . . . . . . . . . . . . . . . . . . . . . . . . . . . . . . . . . . . . . . . . . . . . . . . . . . . . . . . . . . 18ENVIRONMENTAL EDUCATION PROGRAM . . . . . . . . . . . . . . . . . . . . . . . . . . . . . . . . . 21
OVERVIEW . . . . . . . . . . . . . . . . . . . . . . . . . . . . . . . . . . . . . . . . . . . . . . . . . . . . . . . . . . . . . . 21PARTICIPANTS . . . . . . . . . . . . . . . . . . . . . . . . . . . . . . . . . . . . . . . . . . . . . . . . . . . . . . . . . . . 21TEACHER RESOURCE MATERIALS . . . . . . . . . . . . . . . . . . . . . . . . . . . . . . . . . . . . . . . 22DECOY CLEANING AND REPAIR . . . . . . . . . . . . . . . . . . . . . . . . . . . . . . . . . . . . . . . . . . 23CLASSROOM PRESENTATIONS . . . . . . . . . . . . . . . . . . . . . . . . . . . . . . . . . . . . . . . . . . . 23
Initial Visits . . . . . . . . . . . . . . . . . . . . . . . . . . . . . . . . . . . . . . . . 23Final visits (Painting Decoys) . . . . . . . . . . . . . . . . . . . . . . . . . . 24
CLASSROOM EXTENSION ACTIVITIES . . . . . . . . . . . . . . . . . . . . . . . . . . . . . . . . . . . . 24EDUCATION PROGRAM SUMMARY . . . . . . . . . . . . . . . . . . . . . . . . . . . . . . . . . . . . . . . 24
LITERATURE CITED . . . . . . . . . . . . . . . . . . . . . . . . . . . . . . . . . . . . . . . . . . . . . . . . . . . . . . . 25APPENDIX 1. Raw counts of Common Murre birds, and Brandt’s and Double-crestedcormorant nests, sites and birds from aerial photographic surveys of central Californiacolonies, 2004. . . . . . . . . . . . . . . . . . . . . . . . . . . . . . . . . . . . . . . . . . . . . . . . . . . . . . . . . . . . . . . . 54

iv
LIST OF FIGURES
Figure 1. Map showing the location of the two study sites along the central California coast.Devil’s Slide Rock and San Pedro Rock are located within the Devil’s SlideColony Complex.
Figure 2. Devil’s Slide Colony Complex including colonies and subcolonies monitored bythe Common Murre Restoration Project.
Figure 3. Castle/Hurricane Colony Complex, including Bench Mark-227X (BM227X),Castle Rocks and Mainland (CRM), and Hurricane Point Rocks (Hurricane).Labels indicate subcolonies mentioned in the text.
Figure 4. GIS map of Devil’s Slide Rock, 2004. Common Murre breeding and territorialsites are shown in relation to social attraction equipment.
Figure 5. Photograph of Common Murre and Brandt’s Cormorant decoys on San PedroRock.
Figure 6. San Pedro Rock (south side) as it appears from the viewing location alongHighway 1. The rock is divided into five sections for recording bird and marinemammal locations (West End, East End, Lower, The Nose, Decoy Area).
Figure 7. Number of Common Murre breeding and territorial sites at Devil's Slide Rock,1996-2004.
Figure 8. Number of Common Murre breeding and territorial sites within and outside ofdecoy plots on Devil's Slide Rock, 1996-2004.
Figure 9. Seasonal attendance of Common Murres at Devil's Slide Rock, 11 November2003 to 11 August 2004. Attendance is reported as an average of threeconsecutive counts. Dashed line indicates pre-season (prior to 16 April).
Figure 10. Seasonal attendance of Common Ravens and Common Murres at San PedroRock, 17 April to 31 July 2004. Data are recorded as an average number of birdsseen per 10 minute scan during two hour watches.
Figure 11. Seasonal Attendance patterns of Common Murres at BM227X subcolony 02(Esselen), and Castle Rocks and Mainland subcolonies 02, 03 East, and 03 West,8 April to 29 July 2004. Dashed line indicates attendance after arrival of thejuvenile Brown Pelican on 24 June (see Disturbance).
Figure 12. Seasonal attendance patterns of Common Murres at Castle Rocks and Mainlandsubcolonies CRM 04, 05 and 07, 8 April to 29 July 2004. Dashed line indicatesattendance after arrival of the juvenile Brown Pelican on 24 June (seeDisturbance).
Figure 13. Seasonal attendance patterns of Common Murres at Hurricane Point Rockssubcolonies 01, 02 Ledge, and 02 Hump, 8 April to 29 July 2004. Dashed lineindicates attendance after arrival of the juvenile Brown Pelican on 24 June (seeDisturbance).
Figure 14. Survey areas from boat survey of seabird colonies in the San Pedro Rock toDevil’s Slide areas, 18 June 2004.

v
Figure 15. Aerial overview photograph of Devil’s Slide Rock, 3 March 2004.
Figure 16. Aerial overview photograph of Devil’s Slide Rock, 25 May 2004.
Figure 17. Prospecting Common Murre among decoys on San Pedro Rock, 21 June 2004.
Figure 18. Pair of Common Ravens attracted to mirrors on San Pedro Rock, 6 June 2004.
Figure 19. View to southwest from Castle Pullout of raven nesting cliff at Castle Mainland,2004. Arrow indicates approximate location of nest.
Figure 20. Common Raven with a murre egg, Castle Rocks subcolony 04, May 2004.
Figure 21. “Right” side of CRM-04 productivity plot, 12 June 2004.
Figure 22. Juvenile Brown Pelican on “right” side of CRM-04 productivity plot duringdisturbance event, late June 2004. Note the murre chick near the pelican’s tail.

vi
LIST OF TABLES
Table 1. Common Murre productivity at Devil’s Slide Rock (DSR) and Castle Rocks andMainland (CRM), 2004.
Table 2. Non-anthropogenic disturbances incidentally observed at the Castle/HurricaneColony Complex, 2004. Data listed includes: mean number and range ofmurres/eggs/chicks disturbed or lost per event, and the number of events.
Table 3. Common Murre egg and chick loss on Castle Rocks and Mainland, subcolony 04during Brown Pelican disturbances, 24 June to 2 July 2004.
Table 4. Aircraft sightings, boat sightings, and resulting disturbances incidentally observedat Devil’s Slide Rock, 2004.
Table 5. Brandt’s Cormorant breeding phenology and reproductive success at Devil’sSlide Rock and Mainland, 2004.
Table 6. Numbers of Brandt’s Cormorant poorly-built nests (PBN), fairly-built nests(FBN), and well-built nests (WBN) counted at the Devil’s Slide Rock andMainland colony, 2004.
Table 7. Table 7. Numbers of Brandt’s Cormorant poorly-built nests (PBN), fairly-builtnests (FBN), and well-built nests (WBN) counted at the Castle/Hurricane ColonyComplex, 2004. Not all subcolonies were counted on each day.
Table 8. Summary of aerial photograph counts of Common Murres (COMU), Brandt’sCormorants (BRCO), and Double-crested Cormorants (DCCO) at sample centralCalifornia breeding colonies, 2004.
Table 9. Numbers of Pelagic Cormorants, Western Gulls, Pigeon Guillemots, and BlackOystercatchers counted at breeding colonies on a boat survey between San PedroRock and Pillar Point, 18 June 2004. ND, no data.
Table 10. Numbers of Pelagic Cormorant, Western Gull, and Black Oystercatcher nests andPigeon Guillemot birds counted at the Castle/Hurricane Colony Complex, 2004.

vii
ACKNOWLEDGMENTS
The Apex Houston Common Murre Restoration Project is conducted cooperatively by the U.S.Fish and Wildlife Service, San Francisco Bay National Wildlife Refuge Complex (USFWS-SFBNWRC), Humboldt State University (HSU), the National Audubon Society (NAS), andother public and private organizations, with oversight by the Apex Houston Trustee Council(made up of USFWS, National Oceanic and Atmospheric Administration [NOAA], andCalifornia Department of Fish and Game [CDFG]).
Special thanks go to the Apex Houston Trustee Council for their unwavering support throughoutthe project: Dan Welsh (USFWS-Ecological Services), Maria Brown (NOAA-Gulf of theFarallones National Marine Sanctuary [GFNMS]), Paul Kelly (CDFG-Office of Spill Preventionand Response [OSPR]), Jennifer Boyce (NOAA alternate representative), Joelle Buffa (USFWSalternate representative). Thanks are also due to Carolyn Lown (Department of the Interior-Office of the Solicitor) for legal advice and assistance with landowner agreements.
Many other individuals and organizations have helped to make this project a great successthrough their support and hard work. Departing crew members A. Robinson and J. Koepke(HSU) assisted greatly with decoy removal, decoy deployment, winter observations, field seasonpreparation, and training new field biologists. Special thanks to Marge Kolar (Refuge ComplexManager) and all the other staff and volunteers of the USFWS-SFBNWRC for their constantsupport and assistance, especially: Sheila Baham, Joelle Buffa, Tess Dumaop, Juan Flores, DianeKodama, Danielle Le Fer, Clyde Morris, Ellen Tong, and Larry Wade; Betty Foster for hercontinued assistance with decoy repairs; Ken Clarkson for his assistance with the educationcomponent of the restoration project; and Joelle Buffa, Rachel Hurt, Jesse Irwin, Marc Mitchell,Sally Reynolds, and Natalie Wilson for their assistance with decoy deployment or removal. Wesorely missed Beverly Drollman this year, whom assisted with decoy repairs for several years. Many thanks to Kirstin Bixler for all of her volunteer assistance on many aspects of the project. Other assistance on system deployment and removal was provided by Eli Bernstein, AlexGenevsky, John Mason, Laura Pavliscak, Amy Whitesides, and Rich Young. In addition, themany students and teachers of our Education Program deserve special thanks for all their effortsrepainting our decoys.
Rheannon Okey and Talitha Penland from the Department of Wildlife, HSU, as well as JoeBonino and the staff at the HSU Foundation, deserve special thanks for assisting the project withtheir administrative efforts.
Special thanks to pilots Wayne Burnett, Larry Heitz, and Robert Morgan (CDFG- Air Services)for their continued support, expertise and safety on our aerial seabird surveys. Many thanks toPaul Kelly (CDFG-OSPR) for his continued support of these surveys.
Thanks also to: Julie Yee and Bill Perry (U.S. Geological Survey, Western Ecological ResearchCenter); Rose Borzik (National Audubon Society Seabird Restoration Project); Jan Roletto(NOAA-GFNMS); Deirdre Hall and Scott Kathey (NOAA, Monterey Bay National MarineSanctuary); Daniel Zatz, Lane Chesley, and Matt Pawuk (SeeMore Wildlife Systems); CarterStewart (U.S. Department of Justice); Brian Popper (USDA-Wildlife Services); Mike Hink andJack Van Zander (Bestor Engineers); Bill Sydeman, Russell Bradley, and Pete Warzybok (PointReyes Bird Observatory); Sue Schubel (Murremaid Music Boxes); and Roger Helm (USFWS).
Very special thanks to Armand and Elaine Neukermans for permission to access their Big Surproperty. The views afforded from this coastal location assisted greatly with our monitoring ofmurres at Castle Rocks and Mainland.
Aerial survey work in the Gulf of the Farallones and Monterey Bay National Marine Sanctuarieswere conducted under a permit from NOAA (permit GFNMS/MBNMS-2000-003-G).

viii
Observations of Devil’s Slide Rock and San Pedro Rock were conducted from the mainlandunder Encroachment Permit No. 0403-NSV0720 from the California Department ofTransportation.
Field site monitoring for the Common Murre Restoration Project in 2004 was conducted mainlyby: N. Jones, K. Vickers, and L. Eigner (Devil’s Slide Rock and Mainland, San Pedro Rock);and T. Poitras (Castle/Hurricane Colony Complex). The Education Program was run by K.Studnicki. Aerial surveys were conducted by G. McChesney and P. Capitolo, with assistancefrom N. Jones and J. Buffa. Counting of seabirds from aerial photographs was conducted mainlyby N. Jones, K. Vickers, E. Eigner, T. Poitras, P. Capitolo, and J. Hall.

ix
EXECUTIVE SUMMARY
The 1986 Apex Houston oil spill off the central California coast killed approximately 9,900seabirds, including 6,300 Common Murres (Uria aalge). A litigation settlement in August 1994provided funding for restoration of natural resources injured by the oil spill. To oversee theimplementation of restoration actions, the Apex Houston Trustee Council (AHTC) wasestablished and comprised of representatives from the U.S. Fish and Wildlife Service, CaliforniaDepartment of Fish and Game, and National Oceanic and Atmospheric Administration. Threerestoration projects have been approved to date: 1) the Common Murre Restoration Project; 2)the Marbled Murrelet (Brachyramphus marmoratus) Nesting Habitat Acquisition Project; and 3)seabird habitat restoration at the South Farallon Islands (Farallon National Wildlife Refuge).
The U.S. Fish and Wildlife Service (San Francisco Bay National Wildlife Refuge Complex;hereafter "Refuge") was selected by the AHTC to lead the Common Murre Restoration Project. Soon after the preparation of a publicly reviewed restoration plan the Refuge created thescientific and environmental education programs which constitute the Common MurreRestoration Project. Field data collection and analysis for the scientific aspect of the project isbeing conducted by biologists from the Refuge in collaboration with the U.S. Fish and WildlifeService (Ecological Services), Humboldt State University, and National Audubon Society. Additional assistance has been by: Carter Biological Consulting, U.S. Geological Survey, PointReyes Bird Observatory, National Park Service (Point Reyes National Seashore), Gulf of theFarallones and Monterey Bay National Marine Sanctuaries, California Department of Fish andGame, and the California Department of Transportation. The Refuge is also playing the lead rolein the implementation of the environmental education program. This report summarizes theresults for year nine (Federal Fiscal Year 2004) of the scientific and environmental educationprograms which make up the Common Murre Restoration Project.
Efforts to restore the Common Murre colonies at Devil’s Slide and San Pedro rocks using socialattraction equipment began in 1996 and 1998, respectively, and and have continued since then. At Devil’s Slide Rock on 5 March 2004, 112 adult murre decoys were re-deployed and the soundsystem turned back on. Social attraction equipment was re-deployed on San Pedro Rock on 10February 2004, including: 188 murre adult, 19 chick, and 15 egg decoys; 18 standing and 24incubating (on decoy nests) cormorant decoys; and the sound system turned back on. Tworemote video cameras were reinstalled on San Pedro Rock to assist monitoring efforts. AtDevil’s Slide Rock, the decoys were removed following the breeding season to be cleaned andre-painted and sound systems were turned off. All equipment was permanently removed fromSan Pedro Rock.
Besides the social attraction work, information associated with Common Murre breeding andpopulation ecology, as well as information concerning human and natural disturbances, wascollected at Devil’s Slide Rock, San Pedro Rock and at the Castle/Hurricane Colony Complex asin previous years. Point Reyes Headlands, which was monitored from 1996 to 2002, was notmonitored in 2004. Parameters monitored included: seasonal attendance patterns, colony andsubcolony population sizes, breeding phenology, reproductive success, and adult time budgets. Also, data on Brandt’s Cormorant (Phalacrocorax penicillatus) attendance and productivitywere collected. In addition, aerial photographic surveys of Common Murre, Brandt’sCormorant, and Double-crested Cormorant (P. auritus) colonies were conducted in northern andcentral California. These surveys showed higher numbers of all three species at most centralCalifornia colonies counted in 2004 compared to 2003. All information collected is used to helpevaluate and refine restoration efforts at Devil’s Slide Rock, San Pedro Rock, Castle/HurricaneColony Complex, and other colonies in central California where restoration may be needed. This information is helping us gain a better understanding of Common Murre breeding andpopulation biology, as well as the impacts of human and natural disturbances on murres incentral California.
x
Efforts of the Scientific Program resulted in 190 pairs of murres nesting and 133 chicks fledgingfrom Devil’s Slide Rock (DSR) in 2004, an increase of 80 nesting pairs and 63 fledged chicksfrom the 2003 breeding season. This was the fourth consecutive year of exceeding the 10-yearproject goal of 100 breeding pairs of murres on DSR, first obtained in year six (2001) ofrestoration efforts. For the seventh consecutive year since social attraction techniques began atSan Pedro Rock, no breeding occurred and murre attendance was low, leading to thediscontinuation of efforts there following the 2004 season. Murre plots monitored atCastle/Hurricane Colony Complex experienced almost complete breeding failure in 2004 due toraven and pelican disturbance and predation.
The Environmental Education Program continued for the ninth consecutive year in 2004. Theprogram focused on teaching students about: 1) the natural history and adaptations of CommonMurres; 2) the detrimental impacts humans have had on central California murres from the 1800sto the present; 3) efforts to restore Common Murres in central California; and 4) ways studentscan help restore and protect seabirds. The project also provided students with the opportunity toparticipate in the restoration project at Devil’s Slide Rock by repainting the murre decoys beforetheir re-deployment. Personnel from this year’s education outreach program taughtapproximately 880 students from nine San Francisco Bay Area schools about the conservationissues impacting seabirds in the student’s local area and around the world.

xi
PROJECT STRUCTURE AND ADMINISTRATION - 2004
TRUSTEE COUNCILU.S. Fish and Wildlife Service
Daniel Welsh, Primary Representative, Sacramento Fish and Wildlife Office (CouncilLeader)Joelle Buffa, Alternate Representative, San Francisco Bay National Wildlife RefugeComplex
National Oceanic and Atmospheric Administration
Maria Brown, Primary Representative, Gulf of the Farallones National Marine SanctuaryJennifer Boyce, Alternate Representative, NOAA Restoration Center
California Department of Fish and Game, Office of Spill Prevention and ResponsePaul Kelly, Primary Representative, Sacramento Office
U.S. FISH AND WILDLIFE SERVICE, SAN FRANCISCO BAY NATIONAL WILDLIFEREFUGE COMPLEX
Margaret Kolar, Refuge Complex ManagerGerard McChesney, Wildlife Biologist (Principal Investigator)
HUMBOLDT STATE UNIVERSITYRichard Golightly, Department of Wildlife, Professor (Principal Investigator)
NATIONAL AUDUBON SOCIETYSteve Kress, Seabird Restoration Program (Scientific Advisor)
CARTER BIOLOGICAL CONSULTINGHarry Carter (Biologist, Scientific Advisor)
U.S. FISH AND WILDLIFE SERVICE, RED ROCK LAKES NATIONAL WILDLIFEREFUGE
Michael Parker, Refuge Complex Manager (Scientific Advisor and past PrincipalInvestigator)

1
INTRODUCTION
Common Murre (Uria aalge) colonies in central California occur on certain nearshore rocks andadjacent mainland points between Marin and Monterey counties as well as at the North andSouth Farallon islands, 20 to 40 kilometers offshore (Carter et al. 1992, 1996, 2001). Trends inthis population of murres at all colonies have been well-documented since 1979 (Sowls et al.1980; Briggs et al. 1983; Ainley and Boekelheide 1990; Takekawa et al. 1990; Carter et al. 1992,1995, 2001; Sydeman et al. 1997; McChesney et al. 1998, 1999). A steep decline in the centralCalifornia population between 1980 and 1986 is attributed primarily to mortality in gill nets andoil spills, including the 1986 Apex Houston oil spill (Page et al. 1990; Takekawa et al. 1990;Carter et al. 2001, 2003b). Between 1982 and 1986, a colony of close to 3,000 breeding murreson Devil’s Slide Rock in northern San Mateo County was extirpated by these mortality events. Since 1996, the Common Murre Restoration Project has sought to restore this and other centralCalifornia colonies using social attraction and other techniques. Social attraction has beenutilized at Devil’s Slide Rock and nearby San Pedro Rock, which was extirpated in the early20th century primarily by commercial egg harvesters (Ray 1909, Carter et al. 2001). Efforts atother colonies, especially the Castle/Hurricane Colony Complex, have focused mainly onreducing anthropogenic disturbance and mortality factors.
Since 1989, murre breeding populations in central California have increased. The rate ofincrease for the total population was estimated at 5.9% per annum between 1985-1995 (Carter etal. 2001). This partial recovery of the central California Common Murre population has beenattributed to a series of gill-net fishing closures that have occurred in central California since1982, as well as reduced oiling from 1986-1995 (Carter et al. 2001). Despite populationincreases, Devil’s Slide Rock was not recolonized by 1995 and most colonies remained in areduced state. Until more extensive gill-net closures (<60 fathoms from Point Reyes to PointArguello) were enacted by California Department of Fish and Game in September 2002, gill-netmortality of murres continued through at least 2000 (Forney et al. 2001; National MarineFisheries Service, unpubl. data). In addition, oil pollution (e.g., Command Oil Spill, and theseries of oil releases from the sunken vessel S.S. Jacob Luckenbach) has continued to killthousands of murres in central California (Carter 2003, Carter and Golightly 2003, Hampton etal. 2003, Roletto et al. 2003) and anthropogenic disturbance has affected colonies as well(USFWS, unpubl. data).
The Apex Houston Oil SpillBetween 28 January and 4 February 1986, the barge Apex Houston discharged approximately20,000 gallons of San Joaquin Valley crude oil while in transit from San Francisco Bay to theLong Beach Harbor. Between Sonoma and Monterey counties, an estimated 9,900 seabirds werekilled, of which approximately 6,300 were Common Murres (Page et al. 1990, Carter et al.2003b). The murre colony at Devil’s Slide Rock (DSR) was subsequently abandoned(Takekawa et al. 1990; Carter et al. 2001, 2003b).
In 1988, state and federal natural resource trustees began litigation against potentiallyresponsible parties. In August 1994, the case was settled in a Consent Decree for $6,400,000. The Apex Houston Trustee Council, with representatives from California Department of Fish andGame (CDFG), National Oceanic and Atmospheric Administration (NOAA), and U.S. Fish andWildlife Service (USFWS), was given the task of overseeing restoration actions for naturalresources injured by the spill. The amount of $4,916,430 was assigned to USFWS for theimplementation of the Common Murre Restoration Project.
The Common Murre Restoration ProjectIn 1995, the Apex Houston Trustee Council developed a restoration plan consisting of aScientific Program and an Environmental Education Program for the Common MurreRestoration Project (USFWS 1995a). Field work for the Scientific Program has been conductedsince 1996 by USFWS, San Francisco Bay National Wildlife Refuge Complex (hereafter

2
“Refuge”), in collaboration with the USFWS-Ecological Services (Sacramento Field Office),Humboldt State University (HSU), and the National Audubon Society. Additional assistance hasbeen provided by: Carter Biological Consulting; CDFG; U.S. Geological Survey (WesternEcological Research Center; USGS); Point Reyes Bird Observatory (PRBO); National ParkService (Point Reyes National Seashore); National Oceanic and Atmospheric Administration(NOAA; Gulf of the Farallones and Monterey Bay National Marine Sanctuaries); and CaliforniaDepartment of Parks and Recreation.
The primary goals of the Scientific Program are the restoration of extirpated Common Murrecolonies at Devil’s Slide and San Pedro rocks (Figures 1, 2). Social attraction was selected asthe best-available technique to be used to recolonize these rocks (Parker et al. 1997, Carter et al.2003b) because of its effective use elsewhere in encouraging seabirds to recolonize extirpatedcolonies (Kress 1983; Podolsky 1985; Kress and Nettleship 1988; Podolsky and Kress 1989,1991; Schubel 1993).
In January 1996, social attraction equipment (murre decoys, mirror boxes, and two soundsystems) was deployed on DSR for the first time (Parker et al. 1997). Decoys have beendeployed in a similar manner each year since. Successful breeding was recorded in 1996 and thenumber of breeding pairs increased each season up to 2002. Because of the continuous annualgrowth of the DSR colony since 1996, the amount of social attraction equipment has beenreduced in recent years to provide additional breeding space within decoys areas. As the colonygrows over time, social attractants eventually will be phased out completely.
Common Murres have not been recorded breeding on San Pedro Rock (SPR) since 1908 (Ray1909, Carter et al. 2001). No murres were detected on SPR during ground and boat observationsor aerial surveys conducted in 1979-1997 (Parker et al. 1997, 1998; Carter et al. 2001). Socialattraction equipment (adult, egg, and chick decoys, mirrors, and two sound systems) was firstdeployed in April 1998 and small numbers of murres were observed among the decoysthereafter. Social attraction equipment has been used each year since 1998 but breeding has notoccurred.
We also monitored murre colonies at Castle Rocks and Mainland (CRM), Hurricane Point Rocks(HPR), and Bench Mark-227X, all located on the Big Sur coastline in Monterey County (Figures1, 3). The CRM and HPR colonies were impacted by the Apex Houston spill and declinedafterwards (Carter et al. 2001, 2003b). By 1997, they had recovered to about 52% of their pre-decline numbers (McChesney et al. 1999). Information from the Castle/Hurricane ColonyComplex has allowed us to assess the necessity of restoration actions, as well as examine aspectsof breeding biology at these disjunct, southernmost colonies.
This report summarizes restoration and monitoring efforts conducted by the Common MurreRestoration Project at DSR, SPR, CRM, HPR, and BM227X in 2004. Monitoring at thesecolonies included collecting data similar to previous years on murre colony population sizes,attendance patterns, productivity and nesting phenologies. Aircraft, vessel, and aviandisturbances are also summarized. We also report on Brandt’s Cormorant (Phalacrocoraxpenicillatus) nesting phenology and productivity at DSR and Mainland, and nesting phenologyonly at CRM. In addition, summaries of murre and cormorant counts from central Californiaaerial photographic surveys are provided.

3
SCIENTIFIC PROGRAM
METHODS
Social Attraction
Devil’s Slide RockOn 5 March 2004, 112 adult murre decoys (98 standing, 14 incubating) were re-deployed and thesingle solar-powered sound system turned back on (Figure 4). Decoys had been removed fromDSR on 16 September 2003 following the 2003 breeding season. Decoys were then cleaned andrepaired during the fall of 2003, using the same techniques employed in previous years (also seeEnvironmental Education, below).
The number of decoys deployed was 9.7% lower than in 2003 (N=124) and 71% lower than theoriginal plot design utilized in 1996-1998 (N=384 decoys). The placement and number ofstanding-posture and incubating-posture decoys was determined based in part on the locations ofusable decoy rods previously placed on DSR, and murre breeding and territorial sites fromprevious years. As in 2002-2003, the variable density plot treatment method was not utilized infavor of a more site-by-site approach in an attempt to increase densities of nesting murres andjoin some of the disjunct breeding groups on DSR. However, decoys were still placed mainlywithin the original plot boundaries. Our strategies involved thinning the decoys in high-densitynesting areas and removing decoys from portions of the rock with no active breeding sites.
The largest reduction of decoys was in plot 7, where 5 fewer decoys were deployed than in 2003. The breakdown of the number of decoys placed in each plot is as follows: Plot 1, 18 decoys; Plot2, 3 decoys; Plot 3, 7 decoys; Plot 4, 6 decoys; Plot 6, 13 decoys; Plot 7, 13 decoys; Plot 8, 17decoys; Plot 9, 12 decoys; Plot 10, 10 decoys; and Plot 12, 13 decoys.
As in 2003, uniquely painted wooden dowels 1.5 feet (0.46 m) in height were placed on existingdecoy rods in plots 1, 2, 3, 7, 9, 10 and 12 at or near former mirror locations to serve aslandmarks. One mirror box remained in plot 8.
Monitoring and analysis of murre site locations on DSR was again enhanced this year throughthe use of Geographic Information System (GIS) data collected in 2000 and 2001 (Parker et al.2001, 2002). During the 2004 breeding season, new nest sites and decoys were added to the GISdatabase by approximating their locations in the field based on previously mapped (by GPS)sites and equipment. Additional verification was done using using high quality aerialphotographs taken during colony surveys on 25 May 2004 and additional GPS work followingthe breeding season (see below). Numbers of breeding and territorial sites found within decoyareas were compared to numbers outside decoy areas. Murres were considered to be in a decoyarea if they were within approximately one murre-width (about 15 cm, or six inches) of a decoy.
Following the 2004 breeding season, decoys were removed from DSR on 4 October for cleaningand repainting. At this time, the sound system was still turned on but one speaker had beendisconnected from the system and the other was emitting only static. It is unknown how long thesystem had been in this condition, but we suspect that the one speaker had the cabledisconnected by a cormorant during the nest building stage in April-May. Also, several decoysand wooden dowels had been lost from the rock for unknown reasons.
GPS data collectionDuring decoy removal on 4 October 2004, additional GPS work was conducted to update theexisting GIS database. GPS data collection was conducted by M. Hink (Bestor Engineers) andW.M. Perry (U.S. Geological Survey). The GPS locations of existing decoys (standing,incubating, standing but fallen) and wooden dowels were obtained, as well as locations of all
4
breeding and territorial sites used during the 2004 breeding season. The estimation of sitelocations was collaborated by the three wildlife technicians that monitored DSR in 2004 (Jones,Vickers, and Eigner), with Vickers on the rock and Jones and Eigner viewing from the principalmainland viewing points at the “Traditional DSR Pullout” (Jones) and “The Bunker” (Eigner). Locations of existing decoys, dowels, mirror, and other natural features were used to determinemurre site locations.
Following GPS data collection, locations of equipment and murre sites that had beenapproximated during the field season were updated on the 2004 GIS map. Locations of decoysand dowels lost prior to GPSing were re-evaluated and changed if necessary. Although GPSprovided a more accurate description of the rock, we found little difference in locations ofdecoys or murre sites before and after GPSing.
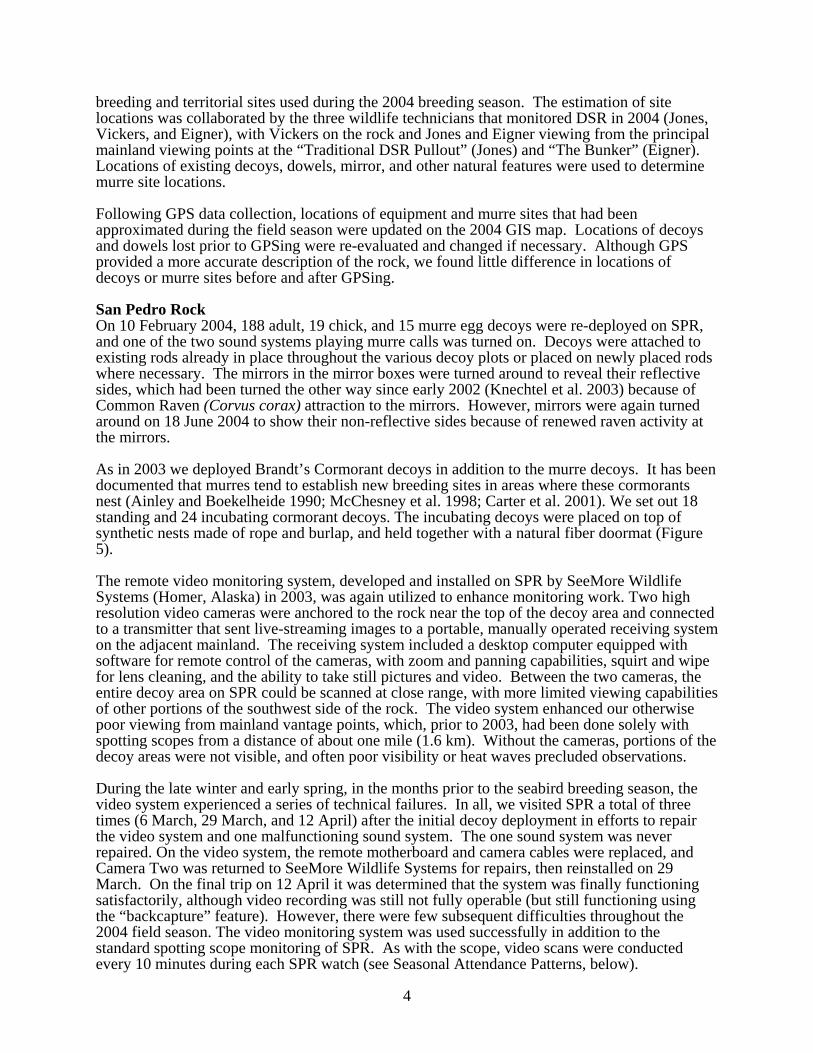
San Pedro RockOn 10 February 2004, 188 adult, 19 chick, and 15 murre egg decoys were re-deployed on SPR,and one of the two sound systems playing murre calls was turned on. Decoys were attached toexisting rods already in place throughout the various decoy plots or placed on newly placed rodswhere necessary. The mirrors in the mirror boxes were turned around to reveal their reflectivesides, which had been turned the other way since early 2002 (Knechtel et al. 2003) because ofCommon Raven (Corvus corax) attraction to the mirrors. However, mirrors were again turnedaround on 18 June 2004 to show their non-reflective sides because of renewed raven activity atthe mirrors.
As in 2003 we deployed Brandt’s Cormorant decoys in addition to the murre decoys. It has beendocumented that murres tend to establish new breeding sites in areas where these cormorantsnest (Ainley and Boekelheide 1990; McChesney et al. 1998; Carter et al. 2001). We set out 18standing and 24 incubating cormorant decoys. The incubating decoys were placed on top ofsynthetic nests made of rope and burlap, and held together with a natural fiber doormat (Figure5).
The remote video monitoring system, developed and installed on SPR by SeeMore WildlifeSystems (Homer, Alaska) in 2003, was again utilized to enhance monitoring work. Two highresolution video cameras were anchored to the rock near the top of the decoy area and connectedto a transmitter that sent live-streaming images to a portable, manually operated receiving systemon the adjacent mainland. The receiving system included a desktop computer equipped withsoftware for remote control of the cameras, with zoom and panning capabilities, squirt and wipefor lens cleaning, and the ability to take still pictures and video. Between the two cameras, theentire decoy area on SPR could be scanned at close range, with more limited viewing capabilitiesof other portions of the southwest side of the rock. The video system enhanced our otherwisepoor viewing from mainland vantage points, which, prior to 2003, had been done solely withspotting scopes from a distance of about one mile (1.6 km). Without the cameras, portions of thedecoy areas were not visible, and often poor visibility or heat waves precluded observations.
During the late winter and early spring, in the months prior to the seabird breeding season, thevideo system experienced a series of technical failures. In all, we visited SPR a total of threetimes (6 March, 29 March, and 12 April) after the initial decoy deployment in efforts to repairthe video system and one malfunctioning sound system. The one sound system was neverrepaired. On the video system, the remote motherboard and camera cables were replaced, andCamera Two was returned to SeeMore Wildlife Systems for repairs, then reinstalled on 29March. On the final trip on 12 April it was determined that the system was finally functioningsatisfactorily, although video recording was still not fully operable (but still functioning usingthe “backcapture” feature). However, there were few subsequent difficulties throughout the2004 field season. The video monitoring system was used successfully in addition to thestandard spotting scope monitoring of SPR. As with the scope, video scans were conductedevery 10 minutes during each SPR watch (see Seasonal Attendance Patterns, below).

5
Monitoring Effort
Prior to the start of regular breeding season monitoring (16 April), DSR was monitored for 52.42hours on 26 observation days between 12 November and 12 April 2004. After 15 April, DSRand Devil’s Slide Mainland (DSM) were monitored for a total of 618.48 hours on 117observation days between 15 April and 7 September. Prior to the start of regular breedingseason monitoring (before 17 April), SPR was monitored for a total of 44.32 hours, on 22 daysbetween 12 November and 12 April 2004. SPR was monitored for a total of 184.83 hours on 84observation days between 17 April and 31 July. CRM/HPR was monitored for a total of 462.40hours on 77 observation days between 8 April and 29 July (522.05 total person hours).
Seasonal Attendance Patterns
Common Murre seasonal attendance patterns were examined at DSR, SPR, and at subcolonieslocated at CRM, HPR, and BM227X using 65-130x Questar spotting scopes from standardizedmainland vantage points. Pre-breeding season (before 15 April) attendance was followed atDSR only, with counts conducted once or twice a week and generally between 08:00 and 11:00h, although times ranged from 07:10 to 14:15 h. During the breeding season, counts wereconducted at DSR every other day between 10:00 and 14:00 h. Breeding season attendance atCRM, HPR, and BM227X was determined from counts conducted twice per week (weatherpermitting), primarily between 08:00 and 12:00 h but times ranged 07:30 to 16:00 h. Eachcolony, subcolony, or study plot was counted three times consecutively and the means reported. SPR was counted differently, as described below. Seasonal attendance data were collected at allactive subcolonies from mid-April (late pre-laying) until all chicks fledged and adult attendanceceased for the season in monitored productivity plots.
Devil’s Slide RockPre-breeding season attendance was monitored sporadically from 11 November 2003 to 2 April2004. During the pre-breeding season when more than one count was made each day, the highcount was used to describe attendance patterns. “Breeding season” counts were conducted from16 April to 11 August 2004. During this period, when more than one count was made between10:00 and 14:00 h, the count closest to 10:00 h was used for better comparability. Counts wereconducted from a standardized observation site known as the Traditional DSR Pullout (seeParker et al. 1997). In addition, an aerial survey was conducted on 3 March 2004 to examinespatial distribution of murres on the rock prior to decoy deployment.
San Pedro Rock From 9 December 2003 to 2 April 2004, SPR was monitored with spotting scopes only. From 17April to 31 July 2004, the rock was monitored with a combination of video and scope work. During the latter period, attendance patterns were monitored during two-hour watches conductedabout every one to two days. To examine potential diurnal differences in attendance patterns,watches were conducted on a rotating time schedule with more effort in the morning hours whenhigher attendance would be expected: 06:20-08:20; 07:20-0920; 08:20-10:20; 12:20-14:20; and14:20-16:20 h. Observations were made from the “Pipe Pullout” along Highway 1 (see Parker etal. 1998), located about 1,700 m from the rock at an elevation of about 100 m. At the start ofeach watch, the numbers of birds and marine mammals of each species present on SPR and in thewaters within about 300 m of the rock were recorded.
Watches were divided into ten-minute scans. When weather and viewing conditions allowed,scans were conducted using both a Questar spotting scope and the remote video system. Datawere collected separately for both scope and video scans for comparison of each technique. When one observer conducted scans, the scope scan was conducted first followed by the video toreduce bias of the better viewing video system. When two observers were present, one viewed

6
with the scope while another viewed simultaneously with the video. It should be noted thatwhile the video provided substantially better views of the decoy area, only scope scans providedviews of the entire south side of the rock. For this report, scope and video scans have beencombined to summarize murre and raven activity. Preliminary analyses indicate that video andscope scans did not differ significantly in the number of birds detected.
During each scan we recorded the number of murres and ravens seen on SPR, as well as theirbehavior and location on the rock. Locations were recorded within one of five areas of the rock(Figure 6). Murres attending SPR were reported in units as “murre-observations”, with eachmurre seen during a scan constituting one murre observation. Information on raven attendancewas recorded in a similar manner, with each raven seen during a scan constituting one “ravenobservation.” Ravens were monitored because the presence of these nest predators may reducemurre attendance on the rock.
Castle/Hurricane Colony ComplexSeasonal attendance patterns of Common Murres were determined for 13 subcolonies atBM227X, CRM, and HPR (ten nearshore rocks and three mainland areas; Figure 3). All visiblebirds were counted at each subcolony from four standardized viewing locations. At threesubcolonies, separate subarea counts also were obtained as follows: 1) CRM-04, separate countswere obtained for the productivity plot and “South Finger” (an ephemeral nesting area); 2)CRM-06 South, counts were distinguished between areas 1 (South side) and 2 (North side; seeKnechtel et al. 2003); and 3) HPR-02, murre counts were distinguished between the traditional“Ledge” and “Hump” subgroups.
Productivity - Common Murre
As in prior years, we monitored productivity of Common Murre breeding pairs at DSR and CRMat least every two to three days (weather permitting) from mainland vantage points using 65-130x Questar spotting scopes. All plots were monitored in a manner consistent with “Type I"plots as described in Birkhead and Nettleship (1980). The locations of new, returning breeding,territorial, and sporadic sites were identified using maps updated from the 2003 breeding season. At DSR, locations of murre sites were refined through the interpretation of aerial photographstaken on 25 May 2004. We defined a “breeding site” as any site where an egg was laid and a“territorial site” as a site that had attendance greater than or equal to 15% of monitored days. Sporadic sites were attended on at least two days but on less than 15% of days; however, manypossible “sporadic” sites were not identified as such because of the frequent movement byvisiting birds. New breeding, territorial, and sporadic sites established in 2004 were numberedsequentially and added to existing maps created during previous years.
Although monitoring was conducted during all daylight hours, we conducted observationspredominantly in the morning when murre activity was greatest and lighting conditions werebest, which made site status easier to determine. Many observations also were conducted inevening hours after mid-day heat waves dissipated. Each monitoring day, we determined thestatus of each site, including the presence of adults, egg, or chick. Adult postures (i.e.,incubating or brooding postures) and other behaviors (e.g., apparent egg turning, chick feeding)also were used as indicators of site status, until presence or absence of an egg or chick could beverified. From these data, egg laying date, hatching date, and chick fledging date (as well as egglosses and egg replacements) were determined for each breeding site using a standardizedprotocol. Chicks were considered to have fledged if they survived to at least 15 days of age. Atbreeding sites where phenology was less certain, chicks were determined to have fledged basedon body size and plumage characteristics. From the data collected, we calculated the totalnumbers of eggs laid, chicks hatched, and chicks fledged per pair, as well as hatching, fledging,and breeding success.

7
Devil’s Slide RockWe monitored murre productivity at all active and inactive (recorded since 1996) sites on DSRwith the use of 65-130x Questar spotting scopes. Using aerial photographs, we verified that allsites could be seen from a combination of viewing locations along the mainland to the east andsoutheast of DSR. Distances from observation locations to the rock ranged from 300 to 400 m.On each observation day, all sites were monitored to determine the presence or absence of anegg or chick.
Castle/Hurricane Colony ComplexAll active and inactive murre nesting sites were monitored within one productivity plot on CRM-04 (established in 1996). An additional study plot on CRM-03 East, established in 1999, did nothost breeding murres in 2004. In 2004, the CRM-04 study plot consisted of 106 sites. Observations of the plot were conducted from or near the “Castle pullout” located off Highway1, approximately 300 m from the CRM-04 plot. An additional viewing location from privateproperty above Funt Cove was added in 2003 and utilized again with permission in 2004. BothQuestar (65-130X) and Kowa (20-60X) spotting scopes were used for observations.
Adult Time Budgets - Common Murres
Time budget (or, co-attendance) observations were conducted at DSR in the latter part of theseason when approximately 50% of the breeding sites had chicks. Time budgets were conductedonly on breeding pairs with chicks, based on the assumption that co-attendance during chickrearing is likely a better indicator of parental and feeding conditions than co-attendance duringincubation, since parents must feed themselves as well as their chick during this stage of thebreeding cycle. Criteria for selecting sites included:
1. Prior knowledge of the site as a nesting site;2. Ease of viewing both adults (when both were attending the site at the same
time);3. Proximity to other breeding sites; and4. Ability to include additional nearby breeding sites;
The same breeding pairs were monitored during each observation period. Three continuouswatches were conducted between 1-9 July from sunrise to sunset (weather permitting) on 12-13pairs of breeding murres.
Questar spotting scopes (65X-130X) were used to monitor arrivals, departures, and fooddeliveries to chicks (including prey type and size). Observations were conducted by a primaryobserver who was relieved every 2-3 hours. Information was recorded on a hand-held taperecorder and later transcribed onto paper data forms and then transferred to a computer database. The information reported here includes the average time pairs of murres spent in co-attendanceper day at their breeding sites, as well as the average number of prey deliveries to the chick. Forthe purposes of this report, co-attendance is defined as the period of time when two adults(assumed mates based on behavioral interactions; see Johnsgard 1987, Gaston and Jones 1998)were present together at a breeding site.
Disturbance
Disturbance events affecting murres at DSR and CRM/HPR were recorded incidentally whilecollecting productivity and attendance data. Disturbances recorded included any event whichcaused one or more of the following: adult murres to be flushed or otherwise displaced; any eggsor chicks to be exposed, displaced, or depredated. Events which prevented prey from being

8
delivered to chicks were also considered to be disturbances. Data were then categorized as non-anthropogenic or anthropogenic disturbances.
Due to the close proximity of breeding Brandt’s Cormorants to murres at DSR and highfrequency of small-scale cormorant disturbances, we recorded displacement and flushing eventscaused by cormorants only at murre breeding sites with an egg or chick present. In the case ofanthropogenic disturbances, aircraft flying at or below about 1,000 feet (305 m) above sea leveland boats within about 1,500 feet (460 m) of the nearest murre colony were recorded, even ifthey did not cause disturbance. Information recorded regarding aircraft and boats included: typeof craft, any identifying number(s), direction of travel, and distance from the nearest subcolonyof murres.
To analyze disturbance events, we separated the data by source and type of disturbance. Wepresent the number of non-anthropogenic and anthropogenic disturbances seen per hour ofobservation at each colony.
Brandt’s Cormorant Productivity and Nest Surveys
Productivity - Devil’s Slide Rock and MainlandSince 1996, monitoring of Brandt’s Cormorant (hereafter, “cormorant”) productivity has beenmonitored at DSR and the adjacent mainland. This monitoring is conducted to better understandthe influence of decoys on the DSR cormorant colony, the communal relationship betweenbreeding cormorants and Common Murres, and to examine differences in cormorantreproductive performance between years and subcolonies. To determine timing of breeding andproductivity, breeding activities were monitored in detail at DSR and two subcolonies on DSM:one on the south cliffs of the Devil’s Slide point (also known as “Mainland South”); and thetraditional Turtlehead Rock. Nests at all locations were monitored every three to seven daysfrom points along the mainland using a Questar (65-130x) or Kowa (20x) spotting scope. Chickswere considered to have fledged if they survived to at least 25 days of age. After 25 days, manychicks begin wandering from their nests, reducing the ability to determine which nests theyoriginated from (Carter and Hobson 1988; McChesney 1997). For each nest, we followed astandardized protocol to determine the laying, hatching, and fledging dates, as well as clutch andbrood sizes and numbers of chicks fledged. We rated data quality for each parameter, and onlyhigh-quality data were used for calculations. Means were then calculated for each parameter ateach subcolony.
Nest SurveysIn 2004, cormorant nest surveys were conducted at Devil’s Slide Rock and Mainland andCastle/Hurricane subcolonies once per week during the breeding season. At Devil’s Slide,counts were taken from the Traditional pullout along Highway 1 (see Parker et al. 1998) andfrom the mainland bluffs above mainland subcolonies. Counts were taken between 08:00 and11:00 h with a Questar spotting scope and 10x40 binoculars. At CRM/HPR, counts were takengenerally between 10:00 and 14:00 h from the Rocky Creek Bridge, Castle, and Hurricanepullouts using a Questar spotting scope. For each count, cormorant territorial and nest sites wereclassified into four groups to roughly describe breeding phenology: 1) little nesting material; 2)poorly built nest; 3) fairly built nest; and 4) well-built nest. Numbers of large chicks also werecounted. At CRM/HPR, we report on the high count of well-built nests per subcolony andassociated dates. When possible we differentiated between juvenile, immature, and adultcormorants, though age determinations were inconsistent because of distant viewing.

9
Aerial Photographic Surveys
In 2004, aerial photographic surveys were conducted at all murre colonies and most (greater thanabout 10 nests) Brandt’s and Double-crested (P. auritus) Cormorant colonies in northern andcentral California from the Oregon border south to Point Conception. These surveys are acontinuation of a long-term data set focused on monitoring seabird breeding populations inCalifornia (e.g., Takekawa et al. 1990, Carter et al. 2001, Capitolo et al. 2004). Surveys wereconducted between 24 May and 2 June and were flown in a California Department of Fish andGame twin-engine, high-wing Partenavia fixed-wing aircraft. Two personnel photographedcolonies through a hatch opening in the belly of the aircraft using 35 mm cameras. Overviewphotographs of each colony were taken with a 50 mm or 70-200 mm zoom lens, while close-upphotographs used for counting were taken mostly with 300 mm lenses or occasionally with a 70-200 mm zoom lens. Surveys of some areas were delayed by foggy conditions but werecompleted later in the survey period. Most colonies were photographed on one day only. Inaddition, a winter season survey was conducted on 3 March 2004 of nearshore murre coloniesbetween DSR and Point Reyes. This survey was conducted primarily to obtain photographicdocumentation of murre spatial distribution on DSR prior to decoy deployment and to comparewinter attendance at the different murre colonies in the area.
Counts at sample colonies were conducted using the “dotting” method and followed astandardized protocol. Standardized count areas at the South Farallon Islands followed Capitoloet al. (2002). As in other years since 1996, we obtained counts for all central California murrecolonies with additional counts of other Brandt’s Cormorant colonies in the Gulf of theFarallones area.
For murres, only birds were counted since they do not build nests. For cormorants, birds, nests,and territorial sites were counted. Nests and territorial sites were categorized as follows: 1) well-built nest with incubating/brooding adult; 2) nest with standing adult and visible chicks in thenest bowl; 3) empty nest (i.e., no eggs or chicks) with standing adult present; 4) abandoned nest(evidence of fairly to well-built nest with no adult present) ; 5) poorly built nest; 6) adult onterritorial site with little or no nesting material; and 7) undetermined site (either nest or territorialsite). We considered categories 1-5 as “nests” and categories 6 and 7 as territorial “sites”.
Colony Surveys - Other species
We conducted nest and bird surveys from boat and land at both the Devil’s Slide/San Pedro areaand Castle/Hurricane in 2004 to assess breeding populations of non-focal species, including:Pelagic Cormorant (P. pelagicus); Western Gull (Larus occidentalis); Pigeon Guillemot(Cepphus columba); and Black Oystercatcher (Haematopus bachmani). These species are notcovered in regular monitoring and many nesting areas cannot be seen from mainland vantagepoints. On 18 June 2004, we conducted a boat survey between SPR and Pillar Point and countedall potential nesting birds. The survey was conducted in the morning (07:00-10:50 h) whenlarger numbers of Pigeon Guillemots, a crevice-nesting species, congregate on the land surfaceand water at and adjacent to colonies. At Castle/Hurricane, nests and birds of all species werecounted from mainland vantage points on 9 June. A boat survey was attempted on 24 June butonly a partial survey was conducted due to rough sea conditions. For Pigeon Guillemots, wepresent the high seasonal count obtained from colony counts and sea surface scans.

10
RESULTS
Social Attraction
Devil’s Slide RockCommon Murre - In 2004, 241 active sites (190 breeding and 51 territorial) plus 11 sporadicsites were recorded on DSR (Figure 7). This was an increase of 43 (21.7%) active and 80(72.7%) breeding sites over the year 2003. Of the 190 breeding sites in 2004, 92 (48.4% ) werereused breeding sites from 2003, 40 (21.1%) were territorial sites in 2003, six (3.2%) were notused in 2003 but were used in previous years, and 46 (24.2%) were new sites in 2004. Ninety-two active sites (38.2%) occurred within decoy areas (Figure 8).
San Pedro RockCommon Murre - Murres were seen sporadically on SPR between 30 May and 31 July, but didnot establish territories or breed. Through a combination of Questar scope and remote videoscanning, murres were sighted on 14 of 84 (16.7%) observation days. Most murre sightingswere of single birds. Like past years, most activity occurred during the latter part of the breedingseason, particularly in late July. Most visiting murres attended a ledge below the main decoyarea that contained low densities of standing murre and cormorant decoys in a pattern resemblinga roosting area. This area is often used as a roost by pelicans, cormorants and gulls.
The high count for SPR in 2004 was 11 murres on 28 July at 10:30 h. There were 104 totalmurre observations, of which 87.5% were within decoy areas. Outside of decoy areas, therewere 10 murre observations on the “Nose Area” near the decoys, and three in the “Lower Area”of the rock on the west end (Figure 6). Although two or more murres were occasionally seenattending or flying on and off the rock together, no murres were seen billing, allopreening,parading, or otherwise demonstrating courtship or other breeding behavior.
Brandt’s Cormorant - Cormorants demonstrated no apparent response to the cormorant decoysplaced on SPR in 2004. Although cormorants often roosted in the lower “roost” portion of thedecoy area as well as other portions of the rock throughout the season, cormorants visited theupper “breeding” decoy area primarily late in the breeding season (mid-July to early August),where they roosted in small groups. There were no breeding-related behaviors observed.
Common Raven - Ravens demonstrated an intense interest in the mirror boxes once again in2004. These mirrors had been turned around during the 2003 season to hide the reflectivesurface, but were re-exposed in 2004 after removal of a nesting pair of ravens in 2003(McChesney et al. 2004). However, ravens were seen interacting with their reflections quitefrequently in 2004, exhibiting both aggressive and inquisitive behaviors. After the mirrors wereturned around once again on 18 June, raven activity directed toward mirror boxes ceased,although raven activity in other areas of SPR continued. Overall, raven activity was centered inthe Decoy Area and the adjacent Nose Area, with 82.4% of raven observations occurring in thesetwo areas.
Seasonal Attendance Patterns
Devil’s Slide RockCommon Murre - On DSR, murres were observed on 74 of 75 (98.7 %) colony count daysbetween 11 November 2003 and 11 August 2004 (Figure 9). Overall attendance this year washigh with 84% of counts exceeding 150 murres and 64% of counts exceeding the 2003 highcount of 214 murres. The 2004 high count was 336 murres on 28 April. However, this wasobtained at 07:30 h, outside the standardized seasonal attendance count period of 10:00-14:00 h,so was not included in Figure 9. The highest standardized seasonal attendance count was 304

11
murres on 22 June. Attendance during the pre-breeding and early egg-laying period was highlyvariable and then leveled out during the incubation period. Numbers increased during the chickperiod, ranging 254-304 birds, but numbers began a steady decline in mid-July as chicks fledgedand adults departed the colony.
A separate count of 285 murres (and 22 Brandt’s Cormorants) was obtained from aerialphotographs taken 3 March 2004 (Figure 15). These photographs showed the denseconcentrations that murres were attending on many days even prior to decoy deployment on 5March. A comparison count of 242 murres made from the standardized mainland locationindicated that these colony counts are not entirely complete.
No murres were recorded on the Devil’s Slide Mainland in 2004. Small numbers were observedamong nesting cormorants in 2003 (McChesney et al. 2004).
San Pedro Rock Common Murre - No murres were observed on 153 scans over 12 observation days during thepre-season from 9 December 2003 to 2 April 2004. Of the 1,109 scans completed on SPR duringthe field season (17 April - 31 July), 46 (4.1%) had at least one murre present, resulting in a totalof 104 “murre observations” (Figure 10). Thirty-one scans (67.4%) recorded one murre, threescans (6.5%) recorded two, three scans (6.5%) recorded three, two scans (4.3%) recorded four,three scans (6.5%) recorded five, one scan (2.2%) recorded six, two scans (4.3%) recorded nine,and one scan (2.2%) recorded eleven murres. Murres were not seen on SPR until 30 May andthe last murre was observed on the final day of observations on 31 July. However, the murre on30 May was oiled and likely was not associated with the social attraction system. Twelve of 14days of murre sightings occurred during the last six weeks of the season, with five of thefourteen occurring during the last ten days.
The video system allowed for an additional 254 scans not possible with the scope because ofpoor visibility. These accounted for 22.4% of all scans conducted at SPR during the fieldseason. Thirteen scans had murre sightings, totaling 14 murre-observations, or 13.5% of totalmurre-observations for the season.
Of 837 scans utilizing both video and scope, the scope detected murres on 10 scans when thevideo system missed them, and on 13 scans the video system detected murres while the scopemissed them. Part of this discrepancy was likely because video and scope scans usually were notconducted simultaneously (although occasionally two observers scanned simultaneously), andbirds may have arrived or departed in the brief moments between scan types. Overall, the videosystem detected murres with slightly higher frequency (0.08 murres per scan) than the scopemethod (0.07 murres per scan). This difference was not significant (paired t-test; t=-1.0,P=0.33).
Common Raven - Ravens were observed on SPR throughout the winter, sometimes in groups of5 or more. They were noted at least once on 13 of 18 (72.2%) observation days, with a highcount of 14 ravens on 2 April. During the breeding season, ravens were seen on SPR on 45 of 84(53.6%) observation days, and were observed on 187 of the 1,109 (16.9%) scans completed, fora total of 278 “raven observations” (Figure 10). Of the 278 raven observations, 115 (41.4%)occurred in the Nose Area, 25 (9.0%) on the “West End”, 114 (41.0%) in the “Decoy Area”, 13(4.7%) in the “Lower Area”, and the remaining 11 (4.0%) on the “East End” of the rock. Of the187 scans in which ravens were seen, 102 (54.5%) recorded one raven, 83 (44.4%) recorded tworavens, and two (1.1%) recorded five ravens.
Throughout our preseason observations we noted one pair of ravens in obvious association withone another, and these two birds were frequently seen attending SPR with no other ravenpresent. They frequented the decoy area, especially around the mirrors. An active nest was

12
discovered on 17 April, on the south side of SPR high on the western-most peak. In an attemptto discourage raven use of this area and learn more about the effects of ravens on the restorationeffort, one adult raven (probably the male of the pair) was collected , and the other member ofthe pair shot but just injured, on 7 May. All collections were done under permit by a U.S.Department of Agriculture wildlife biologist. The latter bird had been sitting in the nest earlierin the day. Subsequent to this action, ravens were not observed for several days (Figure 10). However, about a week later, what was likely a new raven pair began frequenting the rock,especially around the mirrors in the decoy area. Raven activity declined beginning in mid-June,and on 18 June the mirrors were turned back around so their reflective sides were not visible. This may have helped further reduce raven attendance by decreasing attractiveness of the site.
Castle/Hurricane Colony ComplexCommon Murre - Seasonal attendance patterns varied between subcolonies. Only foursubcolonies with confirmed breeding in 2004 were attended each count day from the start ofobservations on 8 April until the start of egg-laying: CRM-04; CRM-07, BM227X-02 (EsselenRock), and HPR-02 (Figures 11-13). At CRM-02, CRM-03 West, and CRM-05 attendance wasespecially sporadic until early May.
The subcolony on CRM-03 East did not attempt breeding in 2004. Murres attended sporadicallyfrom the start of observations on 8 April until 11 May, at which point they stopped attending therock. Ravens were recorded flushing this subcolony six times on five observation days withinthis period, and likely led to it’s abandonment. In 2003, ravens also caused several flushingevents at CRM-03 East and depredated at least three chicks (McChesney et al. 2004).
During May (early to mid-incubation period), attendance was somewhat variable at mostsubcolonies, followed by less variability in June during the late incubation and early chickperiods. Notable exceptions were at CRM-07, CRM-05 and both subcolonies at Hurricane PointRocks, which had more variable attendance throughout the breeding season.
Murre attendance again became sporadic after 24 June following a series of Brown Pelican(Pelecanus occidentalis) disturbance incidents (see Disturbance, below). During the nine daysthis single pelican was present, murres were flushed several times daily from the CRMsubcolonies and many birds spent considerable time rafting on the water nearby. Thus,attendance counts after 24 June are not comparable to prior counts or past years. Countspresented in Figures 11-12 after 24 June are the highest counts of up to several daily counts tobest represent the numbers of adults still attending the subcolonies, and are shown as dashedlines. Ultimately these disturbances led to near or total breeding failure of all CRM subcoloniesand early colony departure by breeding adults in 2004.
Productivity - Common Murre
Devils Slide RockOf 313 sites monitored at DSR in 2004, 190 (60.7%) were egg-laying, 51 (16.3%) wereterritorial, 11 (3.5%) were sporadically attended, and 61 (19.5%) were sites (breeding, territorial,or sporadic) in previous years that were unattended this season. Since they are difficult to follow,the number of sporadic sites is likely underestimated.
The first murre egg observed on DSR in 2004 was an abandoned egg seen on 15 April. It isunclear from which site this egg was laid, and this early egg may have been an infertile“dumped” egg and is not included in summaries of phenology and breeding success. The nextegg was first observed on 27 April at a monitored site. Based on “first” eggs (n=190), mean egg-laying date was 24 May (range = 27 April-3 July). “First” eggs include all sites where only oneegg was laid plus first eggs at sites where replacement clutches were laid. The first chick wasobserved on 3 June. Mean hatching and fledging dates were 22 June (n=137) and 18 July

13
(n=128), respectively (Table 1). Chicks that fledged remained on the rock for an average of 24.9days after hatching and the last chick was seen on DSR on 11 August.
A total of 201 eggs were laid, including 11 replacement eggs. A total of 142 eggs hatched(overall hatching success of 70.6%) and 133 chicks fledged (93.7% fledging success). Thenumber of chicks fledged per breeding pair was 0.70 (Table 1). Of 190 first eggs laid, 137hatched (72.1% hatching success) and 128 chicks fledged (93.4% fledging success). Of 11replacement eggs, 5 hatched (45.5% hatching success) and 5 chicks fledged (100% fledgingsuccess).
Castle/Hurricane Colony ComplexOf 106 monitored sites in the CRM-04 plot in 2004, 85 (80.1%) were egg-laying and 21 (19.8%)were territorial. There were four replacement eggs laid.
At the CRM-04 productivity plot, the first egg was seen on 1 May and the first chick wasobserved on 2 June. Based on first eggs only, the mean egg-laying date was 17 May (range= 30April-11 June) and the mean hatch date was 18 June (range = 2 June-25 June). The lastreplacement egg was laid on 15 June. Of the 89 eggs laid (including four replacement eggs), 54(60.7%) hatched and one (1.9 %) chick fledged. The number of chicks fledged per breeding pairwas 0.01 (Table 1). It should be noted that the single chick considered to have fledged waspresent on the rock for only 15 days, the minimum time required for fledging under our protocol. The 15-day mark was reached at the start of pelican disturbances, and it is unclear if the chickactually fledged or died as a result of these events. The last chick was seen on 29 June, five daysafter the start of pelican disturbance events.
Although productivity was not monitored at other CRM/HPR subcolonies, other subcolonieswith confirmed breeding in 2004 were: BM227X-02 (Esselen Rock); CRM subcolonies 02, 05,and 07; and HPR-02 (both Ledge and Hump). Breeding was not confirmed, though suspected,on CRM-03 West and HPR-01. All but Esselen Rock are established subcolonies with annualbreeding in recent years. At Esselen Rock, breeding has occurred sporadically since 1996. As inprevious years, but not 2003, murres attended this rock in association with nesting Brandt’sCormorants. No cormorants, and no more than 2-3 pairs of murres, bred on Esselen Rock in2003 (McChesney et al. 2004). Numbers of breeders also appeared to be small (possibly lessthan 10-20 pairs) in 2004. At HPR-02 Ledge, 46 unattended chicks were counted during apelican disturbance event on 25 June when all but 15 adults were flushed from the area. Thiswas believed to represent most, if not all, murre chicks present on the Ledge subarea.
Adult Time Budgets - Common Murres
Devil’s Slide RockCoattendance of breeding sites by pairs of mated murres during chick-rearing was determinedfrom observations conducted between 1-9 July. Twelve to thirteen breeding sites weremonitored from dawn to dusk on three days, resulting in a total of 38 site-days monitored. Murrepairs spent an average of 151.9 minutes per day in coattendance at their site (range 9-537min/day; n=38). On average, mates arrived at their sites 5.4 times per day (range 1-12/day;n=38). These mate arrivals resulted in prey deliveries 65.7% of the time. Chicks were fed onaverage 3.4 times a day per site (range 0-8/day; n=38). Of 204 mate arrivals observed, 134 werewith prey, 53 were without prey, and 17 were unknown. Of 134 prey deliveries, 128 resulted inchick-feeding, 4 resulted in an unknown prey fate, and 2 were eaten by the arriving adult. Inaddition, one chick feeding was recorded when a prey item was stolen from a neighbor by acoattending murre.

14
Disturbance
Disturbances are reported as either non-anthropogenic or anthropogenic. Disturbances per hourwere calculated based on total observation hours at each colony (see Monitoring Effort, above).
Non-anthropogenic Disturbance
During 2004, we incidentally observed 308 non-anthropogenic disturbances at the twomonitoring sites. Six disturbances were recorded at DSR, and 302 at CRM/HPR.
Devil’s Slide Rock - There were six non-anthropogenic disturbance events observed at DSR. This resulted in an average of 0.010 disturbances per observation hour. All six of thesedisturbances were caused by Brandt’s Cormorants and typically consisted of the cormorantlunging and jabbing at the murre, causing the murre to become displaced from its incubatingposition. Five disturbances were by cormorants nesting or attending a territory close to murresites, and four incidents resulted in egg loss.
Castle/Hurricane Colony Complex - Non-anthropogenic disturbances were difficult to record in2004. This was due to the high frequency, high impact, and long duration of many events. Inmany events of extended duration, birds were flushed and displaced repeatedly. In such cases,the extended event was treated as one disturbance event, and an approximate total number ofbirds affected was recorded.
There were 302 non-anthropogenic disturbance events recorded, resulting in 0.653 disturbanceevents per observation hour (Table 2). Of these events, 293 (91.6%) caused murres to flush, two(0.7%) caused murres to be displaced, and seven (2.3%) involved the loss of eggs or chicks. However, displacements are heavily underrepresented, since most flushing events also causedbirds to be displaced that were too difficult to follow. As a result of non-anthropogenicdisturbances, 45 egg and 28 chick depredations were observed. Common Ravens were responsible for most non-anthropogenic disturbance events, contributingto 184 (62.7%) flushing events, 37 (20.1%) egg depredations, and seven (3.8%) chickdepredations. Brown Pelicans were directly responsible for 97 (33.1%) flushing events and two(2.0%) chick depredations. Indirectly, the pelican was responsible for at least six depredatedeggs and 21 depredated chicks; these egg and chick losses were due to raven and to a lesserdegree Western Gull predation (Table 3). However, many other eggs and chicks, likelynumbering in the hundreds, were lost when adults were forced to abandon their sites because ofrepeated flushings by the pelican (see below for more details). Western Gulls caused four(1.3%) flushing events and two (50.0%) egg depredations, Peregrine Falcons (Falco peregrinus)caused two (0.6%) flushing events, a Turkey Vulture (Cathartes aura) contributed to one (0.3%)flushing event, and 14 (4.7%) flushing events were due to unknown causes. Ravens flushed anaverage of 89.5 murres per event and pelicans flushed an average of 111.3 murres per event. Western Gulls, Peregrine Falcons and Turkey Vultures flushed on average 35.5, 120 and 50murres per event, respectively.
On 25 April 2004, a raven nest was discovered low on a cliff face below Highway 1, about 100m southwest of the “Castle Pullout” observation site. The nest faced west and was about 10 mup the cliff from “Castle Cove” beach, approximately 300 m east of Subcolony CRM-04 (Figure19).
The first disturbance observed by a raven in 2004 occurred on 4 May, when approximately 150-200 murres flushed from CRM-04. The first observed predation on a murre egg by a ravenoccurred on 5 May. Subsequent to that event, a total of 35 murre egg predation events by ravenswere observed until the start of the pelican disturbance events on 24 June (see below). In

15
addition to the raven depredations, there were two observations of a Western Gull depredatingmurre eggs as a result of those eggs being exposed during raven-caused flushing events. On oneadditional occasion, an egg was dislodged during a raven flushing event and broken aftertumbling down the rock. In total, there were 38 lost murre eggs recorded due to ravendisturbance and predation prior to 24 June. Although both members of the raven pair wereresponsible for disturbing murres, most predation was performed by the male. The pair memberswere distinguished by plumage; the female, who performed incubation duties, had distinctivewhite wing patches, while the male was all black.
On 24 May, a raven was observed for the first time aggressively approaching small nestinggroups of murres, causing the murres to retreat and expose their eggs. Up until this date, theravens were taking advantage of exposed eggs during flushing events caused by their over-flights. On 26 May, both adult ravens were observed together for the first time on CRM-04; upuntil this date only a single adult raven had been observed during disturbance events. It was alsoon 26 May that a raven was first observed pulling a murre off it’s egg. The raven accomplishedthese tasks by grabbing the murre’s wing-tip, or tail-tip, and pulling it back until it’s egg wasexposed. This predatory technique became more common as the season progressed. On 3 June,a brood of four raven chicks was confirmed in the nest, all of which fledged by 18 June.
From 24 June to 2 July, an immature pelican was present at the CRM colony. During this periodthe pelican flew frequently between CRM-02, CRM-03 West, CRM-04, and CRM-07, andoccasionally CRM-05. It landed on each rock repeatedly and appeared to deliberately approachand flush groups of murres. The flushed murres would circle the rocks and either land on thewater nearby or return to the rocks in small groups, often only to be flushed again by thepelican’s movements. Many murre chicks left unattended gathered in groups (or, “creches”),with many hiding in small caves and crevices. The flushing events offered the opportunity forthe ravens, and to a lesser degree gulls, to depredate exposed murre eggs and chicks (Table 3). We believe the same immature pelican was responsible for these events at CRM based on itscontinuous attendance at the colony, consistent behavior, and lack of other pelicans roostingwithin the colony over that period (although flocks of migrating pelicans frequently passed by).
An additional immature pelican was observed behaving similarly and flushing murres fromHPR-02 on 25 June. Murres observed flushing from HPR-02 during a boat survey on 24 Junelikely resulted from this pelican as well. The two different pelicans were observedsimultaneously on 25 June, one at CRM and one at HPR-02. The HPR-02 pelican caused murresto flush from both the Ledge and Hump, and at one point flushed all adult murres from theLedge, exposing all chicks which gathered into a creche. The impact of these flushing events onHPR-02 subcolony are likely but unclear. HPR murres dispersed at roughly the same time as theCRM murres, suggesting either breeding failure or somewhat early (compared to previous years)and highly synchronous chick fledging.
A total of 86 flushing events were caused by the two immature pelicans during their stays. Otherpelican flushing events were caused by migrating flocks passing low over breeding murres. Inaddition to egg and chick depredations, one murre chick was kicked by an adult murre during aflushing event, and tumbled down the rock into the water. Between 24 June and 2 July weobserved six murre eggs and 21 murre chicks that were lost either directly or indirectly to pelicandisturbances.
Anthropogenic Disturbance
During 2004, we observed 11 aircraft disturbances and one boat disturbance at the twomonitored colonies. The disturbance rate at DSR was higher than at CRM/HPR. There were norecorded disturbances at SPR.
Devil’s Slide Rock - A total of 147 aircraft and boats were incidentally observed near DSR: 66

16
(44.9%) were planes; 58 (39.5%) were helicopters; 20 (13.6%) were motorboats; and three(2.0%) were kayaks. This resulted in an average of 0.238 motorcraft sightings per hour (Table4). Eight of these motorcraft caused birds to be flushed from DSR, resulting in an average of0.013 disturbances per hour. Seven of the eight disturbances were caused by helicopters (five ofwhich belonged to the U.S. Coast Guard) and one by a boat that came within 50 m of the rock. The greatest number of birds were disturbed on 22 May by a County Sheriff’s helicopter flyingat approximately 200 feet elevation that flushed about 50 birds, most of which were cormorants. Many of the planes were recorded on 25 April during the “Dream Machines” auto and air showat Half Moon Bay Airport. During the course of that day, 27 low overflights were recorded andno birds were observed flushing. However, by 10:30 h there were fewer than 50 murres on DSRand none remained by 13:30 h. It is believed that unusually warm air temperature on 25 Aprilcaused the colony to disperse to sea early in the day. On 26 June, 67 motorcycles heading southon Hwy 1 caused a large percentage of the murre colony to head-bob.
Castle/Hurricane Colony Complex - Only four anthropogenic disturbances resulted in birdsflushing at CRM/HPR, an average of 0.008 disturbances per hour. All of these occurred duringthe Big Sur Marathon on 25 April and were the result of a single California Highway Patrolhelicopter circling over the area. The helicopter was flying at approximately 1500 ft. duringeach pass and apparently caused birds to flush from CRM-03 East (5 murres), CRM-03 West (40murres) and twice from CRM-04 (40 and 5 murres, respectively). However, prior to theoverflights, murres had been flushing from the rocks for unknown reasons, which may havepartly explained their flushing due to an aircraft at fairly high altitude.
Brandt’s Cormorant Productivity and Nest Surveys
Productivity - Devil’s Slide Rock and MainlandIn 2004, Brandt’s Cormorants bred on DSR, the west and southwest side of the DSMpromontory (“Mainland South;” MS), and on Turtlehead Rock (TRTH; Figure 2). All clearlyvisible egg-laying sites on DSR and TRTH were monitored, as well as a large, contiguoussample of nests on MS. Total numbers of breeding sites followed in all locations were 91(DSR), 61 (MS), and 24 (TRTH).
On DSR, mean clutch initiation date for first clutches was 12 May (n=82 nests), with a rangefrom 15 April to 26 June. On average, 3.3 (n=63 nests) eggs were laid per first clutch (Table 5). The mean hatching date was 10 June (n=74), with a range from 23 May to 17 July. Chickshatched at 89.0% of breeding sites (including one successful replacement clutch), and fledged at83.5% of breeding sites. For first clutches only, an average of 2.3 (n=90) chicks hatched perbreeding pair, and hatching success of all eggs on DSR was 63.2% (n=62). Excluding thereplacement clutch, an average of 1.9 (n=90) chicks fledged per breeding pair, and fledgingsuccess of all chicks was 85.3% (n=90). Breeding success (number of chicks fledged per egglaid) was 53.4% (n=62). One replacement clutch of four eggs was observed on DSR. This efforthatched two chicks that were both raised to fledging age.
On MS, mean clutch initiation date was 4 May (n=57), and ranged from 10 April to 29 May(Table 5). On average, 3.4 eggs were laid per clutch (n=59). The mean hatching date was 5June (n=56), and ranged from 14 May to 28 June. Chicks hatched at 96.7% of breeding sites, andfledged at 95.1% of breeding sites. Hatching success was 80.6% (n=57), fledging success was90.1% (n=59), and breeding success was 72.4% (n=57). On average, 2.7 chicks hatched (n=59)and 2.4 chicks fledged (n=61) per breeding pair. No replacement clutches were observed.
On TRTH, mean clutch initiation date was 6 May (n=24) and ranged from 12 April to 21 May(Table 5). On average, 3.7 eggs were laid per clutch (n=23). The mean hatching date was 7June (n=24), and ranged from 27 May to 21 June. Chicks hatched and fledged at all breedingsites. Hatching success was 78.6% (n=23), fledging success was 79.7% (n=24), and breeding

17
success was 61.9% (n=23). On average, 2.9 chicks hatched (n=24) and 2.3 chicks fledged(n=24) per breeding pair. There were no replacement clutches.
Nest Surveys - Devil’s Slide Rock and MainlandPoorly-built and well-built cormorant nests were counted weekly on Devil’s Slide Rock and allmainland subcolonies beginning on 17 April 2004 (Table 6). Numbers of poorly-built nests werehighest in mid-April and began to decline as nests were completed at the onset of egg-laying inearly May. On 22 June and 30 June, approximately two weeks after the mean hatching date forall DSR subcolonies, peak counts of well-built nests were recorded. After this time, counts ofwell-built nests declined as chicks began to wander from nests and nests were destroyed.
Nest Surveys - Castle/Hurricane Colony ComplexWell-built cormorant nests were observed at the following subcolonies: BM227X-02 (EsselenRock), CRM-06 South, CRM-07,CRM-09, and HPR-02 (Table 7). Egg laying likely began inlate April, when the first well-built nests were observed, and probably continued into June. Numbers declined on CRM-07 after the start of the pelican disturbances on June 24, possiblyindicating low breeding success on this rock, although pelican disturbances were not observed tohave affected cormorants.
Aerial Photographic Surveys
Aerial photographic survey data on Common Murres, Brandt’s Cormorants, and Double-crestedCormorants at sample central California colonies are reported by colony in Table 8 and bysubcolony in Appendix 1.
Compared to 2003 (McChesney et al. 2004), murre counts increased at most colonies. Changesin bird numbers at individual colonies ranged from -20.6% at CRM to +57.6% at Double PointRocks, with an average change of +25.1%. The aerial survey count of 291 murres on DSR was51.6-102.1% higher than the two aerial counts in 2003, or 73.2% higher than the average of thetwo 2003 counts. This is consistent with the 72.7% increase in breeding pairs on DSR in 2004. Numbers also increased substantially at Miller’s Point Rocks (+47.0%), contributing to a 40.2%increase for the Drake’s Bay Colony Complex (including Point Resistance, Miller’s Point Rocks,and Double Point Rocks). The only colony showing substantial decline was CRM, but increasesat BM227X and HPR resulted in an overall increase of 4.5% for the Castle/Hurricane ColonyComplex. Counts at the two largest central California murre colonies, North and South FarallonIslands, were essentially unchanged (-0.7% each) for the second straight year. Numbers ofmurres at all colonies combined were 4.2% higher than in 2003, driven by a 21.1% increase atthe nearshore colonies.
Numbers of Brandt’s Cormorant nests increased at most colonies compared to 2003 (Capitolo etal. 2004, McChesney et al. 2004). Changes at individual colonies ranged from -48.7% (CRM) to+410% (Miller’s Point Rocks). Numbers increased within all colony complexes except NorthFarallon Islands (-48.0%), ranging from +20.2% at Lobos/Seal Rocks to 81.1% at Drake’s Bay. The largest Brandt’s Cormorant colony, South Farallon Islands, increased 25.1%. Devil’s Slideincreased 31.6% and Castle/Hurricane increased 28.2%. At all sample colonies combined, nestnumbers increased 30.7%. However, this total does not include all Brandt’s Cormorant coloniesin the region, as several large colonies occur between Año Nuevo and Castle Rocks. Inclusionof all colonies will be needed to further assess overall population changes for this species in2004.
Count data indicated the timing of surveys coincided well with Brandt’s Cormorant breedingphenology. For example, poorly-built nests (i.e, nests in early stages of construction) accountedfor less than 5% of nests at most colonies, and numbers of territoral sites were also low.

18
Phenology was earlier at Alcatraz Island, where 16% of nests had visible chicks. No othercolonies had visible chicks in nests in 2004.
We only counted one Double-crested Cormorant colony in the region, the South FarallonIslands. This is the only offshore colony in our focal area between Point Reyes and HurricanePoint, although several other colonies occur in the San Francisco Bay area. Our nest count at theSouth Farallones was 27.8% higher than in 2003.
Colony Surveys - Other Species
Results of colony surveys for Pelagic Cormorants, Western Gulls, Pigeon Guillemots, and BlackOystercatchers at Devil’s Slide/San Pedro and Castle/Hurricane are summarized in Tables 9 and10. Figure 14 shows the corresponding count areas between San Pedro Rock and Devil’s Slide. At CRM, the high count for Pigeon Guillemots occurred at the fairly late date of 1 July, when 13birds were counted on the water. Most sightings of guillemots at CRM occurred on or justoffshore of CRM-04, CRM-05, and CRM-07. Counts at Castle/Hurricane are not consideredcomplete since only a partial boat survey was conducted.
DISCUSSION
The 2004 breeding season marked the ninth consecutive year of seabird restoration andmonitoring efforts in central California by the Common Murre Restoration Project. Efforts havefocused on reestablishing breeding and increasing colony size at the recently extirpated murrecolony at DSR, reestablshing breeding at the long-extirpated SPR colony, assessing the status ofother nearshore murre colonies, and identifying other methods to restore the nearshore portion ofthe central California murre population.
A major project goal was to obtain 100 breeding pairs of murres on DSR within 10 years, usingsocial attraction techniques. The 2004 breeding season marked the fourth consecutive year thisgoal was reached and surpassed. The 190 breeding pairs was an increase of 73% over 2003 and54% higher than the previous high of 123 pairs in 2002. The increase in breeding pairs wascomplimented by an increase in overall attendance throughout both the pre-breeding andbreeding seasons. Most counts ranged from about 200 to 260 murres, and the 2004 high count of336 birds was 57% higher than our previous recent high of 214 birds in 2003. High attendanceand an increase in new breeding sites indicated a high level of recruitment to DSR in 2004 whichcan be expected to continue in future years. While recruitment likely resulted in part from birdshatched at other colonies, it likely included birds hatched at DSR since 1996, with most of thesehatched since the first larger cohorts began in 1999. Murres begin breeding at about age 3-9years (summarized in Ainley et al. 2002).
Murre breeding success on DSR (0.70 chicks per pair) was 9.4% higher than in 2003, whenbreeding efforts were hampered by mild El Niño conditions, disturbance by roosting pelicansand cormorants, and possibly aircraft disturbance (McChesney et al. 2004). Average lay dateswere also about eight days earlier in 2004 than in 2003. However, breeding success in 2004 wasbelow average and was the second lowest since 1999. Most nest failure occurred during the eggstage. Co-attendance (time budget) watches showed much higher average levels of co-attendancethan 2003 (151 min in 2004 compared to 63 min in 2003), but average number of mate arrivalswas similar and average number of chick feeds/day was actually less (3.5 in 2004 compared to4.5 in 2003). Lower breeding success and reduced chick feeding may reflect recruitment ofrelatively large numbers of first-time breeders which do not reproduce as well as moreexperienced adults.
Social attraction efforts at DSR in 2004 were little changed from 2003. Decoy numbers were

19
reduced somewhat (17.6%) but were placed in roughly the same configuration. The reduction indecoys appeared to have little to no effect on the murre colony. Most breeding sites werereturning sites, indicating a high level of return by previous breeders. Given the size of thecolony in 2004, in some areas decoys actually appeared to displace murres. Examination ofmurre attendance patterns before and after decoy deployment in early 2004 showed highattendance before deployment and suggested that on certain parts of the rock murres occurred inhigher densities before decoy deployment. After decoy deployment, certain decoys took upspace previously occupied by live murres.
Most new sites in 2004 were within or on the edge of previously existing breeding groups. “TheBridge” area between plots 9 and 10 experienced a substantial extension upslope into an areaused as a non-breeding “club” in 2003. Another “bridge” was formed between breeding groupsin plots 2 and 4 by the addition of several new breeding sites in the Plot 3 area. Murres alsoestablished new sites in formerly unused portions of DSR. For example, four breeding and threeterritorial sites were in a new area on the far southwest end of the rock, and three breeding andnine territorial sites were in two disjunct areas on the far northeastern portion of the rock. Weview these as positive steps toward the permanent reestablishment of a self-sustaining murrecolony on DSR which occupies most available breeding habitat and attains a population size inthe thousands, as existed in the past.
This was the seventh consecutive year of social attraction efforts at SPR. Efforts to increase theattractiveness of SPR for murres were expanded in 2004, with the re-deployment of cormorantdecoys (as in 2003), manipulation of mirrors, and removal of a breeding pair of ravens. However, results in 2004 were similar to most other years, with no pre-breeding seasonattendance, little breeding season attendance, most activity occurred in late July when chickswere fledging at other nearby colonies, most visits were to the lower portion of the rockfrequented by other roosting birds, and no breeding by murres. Cormorants also did not showinterest in the cormorant decoys, which were placed in hopes of attracting nesting cormorantsthat may have enhanced attraction of murres to the rock. While continued efforts over moreyears might eventually have led to recolonization of SPR by murres, after much thought anddiscussion we decided to discontinue these efforts following the 2004 season. Dwindling projectfunds and timeline plus a high level of difficulty installing and maintaining equipment on SPRguided this decision. However,valuable knowledge was gained from this effort that will benefitour assessment of restoration efforts at DSR and future efforts.
With almost if not total reproductive failure, breeding success at the Castle Rocks and Mainlandmurre colony in 2004 was by far the worst since we began monitoring in 1996. The presence ofa breeding pair of ravens that fledged four chicks on the CRM mainland cliffs had a large impacton the colony. The murre subcolony at CRM-03 East, which contained one of two productivityplots, was abandoned prior to egglaying following several disturbance events by ravens. Frequent disturbance during the pre- and early egg-laying period on other subcolonies, especiallyCRM-04, likely led to delayed breeding and nest abandonment at some sites. The high predationrate on murre eggs and chicks also contributed to low breeding success. However, even worsethan raven impacts was the extended visit by a single juvenile Brown Pelican that activelychased and flushed murres from breeding sites near continuously for the better portion of ninedays. Pelican impacts included losses of large numbers of eggs and chicks that were displacedand abandoned or exposed and scavenged by ravens and gulls. Similar disturbance on HPR-02by another juvenile pelican on one to two days in late June likely led to losses there as well, butto what degree is unknown. Curiously, seasonal murre attendance at both HPR subcoloniesceased earlier than average and almost simultaneously along with the failed CRM subcolonies(except for a brief resurgence at HPR-02), suggesting failed breeding at HPR as well.
Efforts to reduce anthropogenic disturbance were continued in 2004 with additional outreach,including: 1) in April 2004, an informational letter on the effects of aircraft disturbance onseabirds, methods to avoid disturbance, and maps of sensitive colonies was mailed to 123

20
airports, aviation companies, and flying clubs throughout the San Francisco Bay area; 2) on 28April, we coordinated with the Monterey Bay National Marine Sanctuary on a 45-minutepresentation of similar information that was given to the pilots of the Coast Guard Group SanFrancisco during one of their safety briefings; 3) on 25 April at the 2004 Dream Machines Carand Air Show at Half Moon Bay Airport, we handed out flyers on effects of human disturbanceto seabirds and coordinated with event organizers and air tour operators to reduce overflightsnear DSR during the show; and 4) on 25 April, we continued coordinating with organizers of theBig Sur Marathon and monitoring for disturbance during that event. These efforts appear to behaving substantial benefits, as aircraft overflights and disturbance during the Dream Machinesand Big Sur Marathon, as well as the remainder of the year, were highly reduced in 2004.
Efforts for reducing disturbance to seabirds were enhanced by the conviction in November 2004of a helicopter pilot (J. Cheatham of Verticare, Inc.) for disturbing murres at CRM, a violation ofthe federal Airborne Hunting Act (“Act”; 50 CFR 27.51). This disturbance was recorded duringthe Big Sur Marathon (“Marathon”) on 27 April 2003. During that event, the pilot’s helicopterflew low (<1,000 feet) over CRM several times, flushing birds on three passes according toproject observers. Aircraft similar to the defendant’s had been recorded flushing murres offCRM during past Marathons, which Verticare filmed each year, dating back at least to 1999(USFWS, unpubl. data). Many contacts had been made with Cheatham and other pilots to advisethem of the need to prevent disturbance of birds and the associated laws. Following recordeddisturbance from this pilot’s aircraft in the 2002 Marathon, USFWS law enforcement mailed thepilot a warning letter informing him of the law regulating harassment of wildlife by aircraft. In2003, disturbances were documented by project personnel and the information passed on toUSFWS law enforcement and the U.S. Attorney Office. Three citations were issued by USFWSlaw enforcement charging three separate violations of the Act. The defendant pled not guilty anda federal jury trial was conducted 16-19 November 2004 in San Jose, California. The defendantwas found guilty of one count of “harassing” murres with his aircraft. This conviction, alongwith other outreach, may have substantial benefits to murres and other seabirds by demonstratingthe will of federal agencies to enforce environmental laws that have been transgressed by aircraftand emphasizing the personal responsibility pilots have to avoid wildlife impacts.

21
ENVIRONMENTAL EDUCATION PROGRAM
OVERVIEW
The environmental education component of the Common Murre Restoration Project, conducted for2.5 months in the fall, continued for the ninth year. This program serves two main functions: 1) toprovide environmental education, especially on seabirds, to local children; and 2) to provideassistance to the project in maintaining murre decoys for the next year’s deployment. Theseobjectives are accomplished through classroom instruction and activities, including murre decoypainting.
In 2004, 33 classes ranging from kindergarten to 5th grade participated in the program.Approximately 6,250 students from the San Francisco Bay Area (Montara, Pacifica, Half MoonBay, El Granada, Fremont, San Jose, and San Leandro) have participated since the program’sinception. As in past years, the education project focused on: 1) natural history, ecology, biologyand physiology related to seabirds, especially Common Murres; 2) the 1986 Apex Houston oilspill and its impact on the Common Murre colony on DSR; 3) current and historical pressuresaffecting seabird decline; and 4) the social attraction restoration efforts at DSR and SPR. Theeducation program was divided into two separate presentations given about four weeks apart.The first presentation consisted of a participatory activity exploring seabird adaptations and aslide show summary of the project. The second presentation was conducted after decoys werecleaned and prepared for painting. This presentation included a review of seabird adaptations, anactivity emphasizing the importance of coloring for camouflage, painting the decoys, and agroup activity building a Common Murre food pyramid. All presentations were given between14 September 14 and 3 November.
PARTICIPANTS
In 2004, nine schools from four school districts with 32 teachers and approximately 880 studentsparticipated in the education program. There were no new schools participating this year. However,Sunset Ridge rejoined the program after taking a year off. There were also nine new teachersparticipating.
Cabrillo Unified School District
El Granda ElementaryJennifer Austin, 3rd grade, 22 studentsSue Hatfield, 3rd grade, 22 studentsPauline Shue, 3rd grade, 22 studentsLisa Steinburg, 3rd grade, 22 students
Farallone View ElementaryLinda Carroll, K/1st grade, 20 studentsLaura Cooke, K/1st grade, 20 studentsRebecca Johnson, 2nd/3rd grade, 20 studentsDiana Purucker, 2nd/3rd grade, 20 students
Hatch ElementaryMaria De La Cueva, 4th grade-immersion, 32 studentsLyn Kelly, 5th grade, 32 studentsBruce Linton, 5th grade-immersion, 32 studentsAnn Mangold, 4th grade, 32 studentsVicki Reno, 4th/5th grade, 32 students

22
Pacifica Union School District
Cabrillo Elementary SchoolTiffany Leung, 4th grade, 32 studentsDwan Padilla, 4th grade, 32 students
Ocean Shore ElementarySheila Gamble, 3rd grade, 32 studentsJonathon Harris, 4th/5th grade, 40 students
Sunset Ridge ElementaryPat Costa, 3rd grade, 18 studentsChris Elvander, 3rd grade, 18 students
Vallemar ElementaryDoreen Barnes, 5th grade, 32 studentsCheryl Bingham, 3rd grade, 20 studentsAnne Haas, 1st grade, 20 studentsJean McMartin, 5th grade, 32 studentsElizabeth Myers, 3rd grade, 20 studentsKatie Pardee, 1st grade, 20 studentsTami Taylor, 3rd grade, 20 studentsAlyce Wassall, 1st grade, 20 students
Union School District
Oster SchoolBarbara Finkle, 4th grade, 28 studentsBeth Miller, 4th grade, 28 studentsDawn Ullmark, 4th grade, 28 students
Fremont Unified School District
Warwick ElementaryMelanie Moreno, 4th grade, 96 students (3 classes)Ann Trammel, 4th grade, 32 students
TEACHER RESOURCE MATERIALS
Participating teachers were provided with the following educational materials:Returning Home: Bringing the Common Murre Back to Devil’s Slide Rock. (The
Common Murre Restoration Project 1999) VIDEO. 24 min.Trashing the Oceans. (NOAA 1988) VIDEO. 7 m in 21 sec.Learn About Seabirds Curriculum Guide with supplements. (USFWS 19995b)Poster: Threats to CA Coastal and Marine Life. California Coastal Commission.Zoobooks: Seabirds. (Burst 1995)A Guide to Alaska Seabirds. (Alaska Natural History Society 1995)Learn About Seabirds. (USFWS 1995b). SLIDESHOW (30 slides)Seabirds. (Rauzon 1996)Project Puffin: How We Brought Puffins Back to Egg Rock. (Kress and Salmansohn
1997)Giving Back to the Earth: A Teacher’s Guide for Project Puffin and Other Seabird
Studies. (Salmansohn and Kress 1997)Educator Workshops/Field Trip Sites Resource Information
Each school’s library has received one copy of:

23
Project Puffin: How We Brought Puffins Back to Egg Rock. (Kress and Salmansohn1997)
Seabirds. (Rauzon 1996)
DECOY CLEANING AND REPAIR
The process of cleaning decoys included soaking each decoy in water for about 24 hours,scrubbing them with a wire brush to remove excess guano, and rinsing with clean water. Thepower washer was not used this year as rinsing with a regular hose attachment providedsufficient rinsing. Murre Project staff and volunteers spent about 200 person hours cleaningdecoys in 2004.
During and following the decoy painting period, repairs were made to decoys in need.Approximately 100 wooden decoys needed head reattachment and/or bill repair. A woodendowel was used in reattaching heads to provide extra support. Wood filler was used to fill in anycracks after reattachment. A wooden dowel was also used for decoys that had half or more ofthe bill missing. A dowel was inserted to determine the correct bill length and wood filler wasformed around the dowel to create the shape of the bill. An electric sander was used to smoothout both head and bill repairs.
CLASSROOM PRESENTATIONS
Initial Visits
Adaptations Activity
After a short introduction to the Project, the majority of the presentation consisted of the “Builda Bird” activity modified from the Learn About Seabirds binder. This was a highly participatoryactivity in which all of the students were actively engaged. Whenever possible, questions wereused in the presentation to encourage creative thinking and problem solving during the activity. A student was randomly selected to be turned first into a bird, and then a seabird, and thenfinally a Common Murre. This transition was accomplished by attaching representative objectsto the student for each adaptation. Twelve students read aloud cards of bird/seabird adaptationsor seabird threats as needed, while the rest connected the adaptation/threat to the object on theirdesk and pinned it to the ‘bird.’ For example, the “Down Feathers” card printed with thestatement of function was read aloud and discussed; the down jacket was identified as arepresentative object for the adaptation; and finally the jacket was placed on the ‘bird.’ Otherrepresented adaptations included contour feathers, hollow bones, air sacs, bill/beak, webbed feet,oil gland, and salt gland; wings, guano and murre eggs were also discussed without anaccompanying card. The guano discussion included examining the ocean food web and the flowof nutrients. Once transformed into a Common Murre, four threats to seabirds were discussed ina similar format: disturbance; exotic and native predators; plastic trash; and oil pollution. Thestudents brainstormed ways to prevent and mediate these threats.
Slide ShowA slide show comprised the final 15 minutes of the presentations. This slide show gave anoverview of the Common Murre Restoration Project including: the natural history of theCommon Murre; the effects of the 1986 Apex Houston oil spill on the colony at DSR; and therestoration efforts on DSR and SPR. The annual activities were explained in chronological order,starting with the deployment of the decoys and concluding with the students’ role in preparingdecoys for deployment. Approximately 10 or more minutes were devoted to questions andanswers after the presentation.

24
AssistantsBoth a Murre Project staff member and the Environmental Education Specialist from theRefuge’s Visitors Center attended an initial visit for observation and assistance. Assistance wasprovided for about half of the painting presentations by a Refuge employee, volunteer, or SCAintern.
Final Visits (Painting Decoys)This presentation began with a review of the adaptations of the Common Murre. Studentsrecalled both the adaptation and its function. Next the students participated in a feeding-relay-race activity to reinforce the adaptive function of the camouflage in predation. The students wereseparated into four teams. Each team had an assigned ‘feeding ground’ consisting of a white orblack poster board covered with equal numbers of black and white fish-shaped pieces. The teams‘fed’ simultaneously for a set amount of time and then the results were analyzed in relation tocoloration. The students then painted the decoys. Many of the schools attended had two or fourclasses participating. The first class would paint the white part of the decoy while the secondclass would paint the black. This allowed time for the white paint to dry before the black waspainted to prevent the two colors from mixing. After the decoys were painted, the class created aCommon Murre food web together. Phytoplankton, zooplankton, squid, rockfish, sardines, andthe Common Murre were attached to a poster with Velcro when students correctly guessedwhere they belonged on the pyramid. The importance of bringing the murre back to Devil’sSlide Rock was discussed after the pyramid was fully constructed. The presentation concludedwith a question and answer period.
CLASSROOM EXTENSION ACTIVITIES
Teachers and students have used the curriculum materials to conduct a number of activities andprojects, varying from making paper mache eggs to writing stories. Participant classes receivedmonthly newsletters during the spring with updates of the number of Common Murres, eggs, andchicks on DSR and SPR. As the breeding season progressed students tracked the number ofCommon Murres attending DSR and SPR by using a data chart in their classroom.
EDUCATION PROGRAM SUMMARY
The ninth year of the Common Murre Restoration Project’s Environmental Education Programserved many students by providing active participation in a local natural resource restorationproject. Students continued to assist the project by repainting murre decoys while gainingknowledge of seabirds and marine conservation. Participants demonstrated a strong interest inCommon Murres and their restoration, and retained much of the presented information from thisyear and past years. Many students, parents, teachers, and school staff living near the sitesmentioned watching for the birds, decoys and biologists when they drive by the Devil’s Slidearea of Highway 1. The teachers who have participated for several years highly praised theproject as an essential part of their curriculum. This year’s education program was highlysuccessful, reaching approximately 880 students and welcoming 9 new teachers. However, dueto a reduction in the number of decoys deployed, the education program will no longer be able tooffer decoy painting to the schools. Therefore, it will be necessary to design a new curriculum ifthe Education Program is to continue in future years. Participating teachers received a letterregarding this change and were asked for input for a potential new curriculum.
25
LITERATURE CITED
Ainley, D.G. And R.J. Boekelheide. 1990. Seabirds of the Farallon Islands: Ecology, dynamics,and structure of an upwelling-system community. Stanford University Press, Stanford,California. 450 pp.
Ainley, D. G., D.N. Nettleship, H.R. Carter, and A.E. Storey. 2002. Common Murre (Uriaaalge). In The Birds o f North America, No. 666 (A. Poole and F. Gill, eds.). The Birdsof North America, Inc., Philadelphia, PA.
Alaska Natural History Association. 1995. A Guide to Alaska Seabirds. Northern Printing,Anchorage, Alaska.
Birkhead, T.R., and D.N. Nettleship. 1980. Census methods for murres, Uria species: a unifiedapproach. Canadian Wildlife Service Occasional Papers Paper Number 43. 25 pp.
Boekelheide, R. J. and D. G. Ainley. 1989. Age, resource availability, and breeding effort inBrandt’s Cormorant. Auk 106:389-401.
Boekelheide, R. J., D. G. Ainley, S. H. Morrell, and T. J. Lewis. 1990. Brandt’s Cormorant. Pp.163-194 in (Ainley, D.G. and R.J. Boekelheide, eds.), Seabirds of the FarallonIslands: Ecology, dynamics, and structure of an upwelling-system community. StanfordUniversity Press, Stanford, California.
Briggs, K.T., W.B. Tyler, D.B. Lewis, and K.F. Dettman. 1983. Seabirds of central and northernCalifornia, 1980-1983: status, abundance, and distribution. Final report, Center forMarine Studies, University of California, Santa Cruz, California. Available from U.S.Department of Commerce, National Technical Information Service, publication PB85-183846.
Burst. 1995. Zoobooks: Seabirds. Wildlife Education Ltd. San Diego, California.
Capitolo, P.J., H.R. Carter, and M.W. Parker. 2002. Protocol for identification of areas used forcounting seabirds from aerial photographs at South Farallon Islands, California.Unpublished report, Humboldt State University, Department of Wildlife, Arcata,California; and U.S. Fish and Wildlife Service, San Francisco Bay National WildlifeRefuge Complex, Newark, California. (Prepared for the Apex Houston Trustee Council.)
Capitolo, P.J., H.R. Carter, R.J. Young, G.J. McChesney, R.T. Golightly, and F. Gress. 2004. Changes in population size of Brandt’s and Double-crested Cormorants in California,1975-2003. Unpubl. report, Humboldt State University, Department of Wildlife, Arcata,California; and U.S. Fish and Wildlife Service, San Francisco Bay National WildlifeRefuge Complex, Newark, California.
Carter, H.R. 2003. Oil and California’s seabirds: an overview. Marine Ornithology 31:1-7.
Carter, H.R., and R.T. Golightly, editors. 2003. Seabird injuries from the 1997-1998 Point Reyes Tarball Incidents. Unpubl. Report, Humboldt State University, Department ofWildlife, Arcata, California.
Carter, H.R. and K.A. Hobson. 1988. Creching behavior of Brandt’s Cormorant chicks. Condor90:395-400.
Carter, H.R., P.J. Capitolo, M.W. Parker, R.T. Golightly, and J.L. Yee. 2003a. Population impacts to Common Murres at the Drake’s Bay Colony Complex, California. Pages 43-

26
67. In H.R. Carter and R.T. Golightly, editors. Seabird injuries from the 1997-1998Point Reyes Tarball Incidents. Unpubl. Report, Humboldt State University, Departmentof Wildlife, Arcata, California.
Carter, H.R., and D.S. Gilmer, J.E. Takekawa, R.W. Lowe, and U.W. Wilson. 1995. Breeding seabirds in California, Oregon and Washington. Pp. 43-49 in E.T. LaRoe, G.S. Farris,C.E. Puckett, P.D. Doran, and M.J. Mac (Eds.). Our living resources: a report to thenation on the distribution, abundance, and health of U.S. plants, animals, and ecosystems. National Biological Service, Washington D.C.
Carter, H.R., G.J. McChesney, D.L. Jaques, C.S. Strong, M.W. Parker, J.E. Takekawa, D.L.Jory, and D.L. Whitworth. 1992. Breeding populations of seabirds in California, 1989-1991. Vols. 1 and 2. Unpublished draft report, U.S. Fish and Wildlife Service, NorthernPrairie Wildlife Research Center, Dixon, California.
Carter, H.R., G.J. McChesney, J.E. Takekawa, L.K. Ochikubo, D.L. Whitworth, T.W. Keeney,W.R. McIver, and C.S. Strong. 1996. Population monitoring of seabirds in California:1993-1995 aerial photographic surveys of breeding colonies of Common Murres,Brandt’s Cormorants, and Double-crested Cormorants. Unpublished final report, U.S.Geological Survey, Biological Resources Division, California Science Center, Dixon,California. 213 pp.
Carter, H.R., U.W. Wilson, R.W. Lowe, D.A. Manuwal, M.S. Rodway, J.E. Takekawa, and J.L.Yee. 2001. Population trends of the Common Murre (Uria aalge californica). Pp. 33-133 in Manuwal, D.A., H.R. Carter, T.S. Zimmerman, and D.L. Orthmeyer (Eds.). Biology and conservation of the Common Murre in California, Oregon, Washington, andBritish Columbia. Volume 1: Natural History and population trends. U.S. GeologicalSurvey, Information and Technology Report, USGS/BRD/ITR-2000-0012, Washington,D.C.
Carter, H.R., V.A. Lee, G.W. Page, M.W. Parker, R.G. Ford, G. Swartzman, S.W. Kress, B.R. Siskin, S.W. Singer, and D.M. Fry. 2003b. The 1986 Apex Houston oil spill in centralCalifornia: seabird injury assessments and litigation process. Marine Ornithology 31:9-19.
Forney, K. A., S. R. Benson, and G. A. Cameron. 2001. Central California gillnet effort and bycatch of sensitive species, 1990-98. In (E. F. Melvin and J. K. Parrish, eds.), Seabirdbycatch: trends, roadblocks, and solutions. University of Alaska Sea Grant, Fairbanks,Alaska.
Gaston, A.J., and I.L. Jones. 1998. The Auks: Alcidae. Oxford University Press, New York. 349 pp.
Gilchrest, G.H.. 1999. Declining Thick-billed Murre colonies experience higher gull predationrates: an inter-colony comparison. Biological Conservation 87:21-29.
Hampton, S., R.G. Ford, H.R. Carter, C. Abraham and D. Humple. 2003. Chronic oiling and seabird mortality from the sunken vessel S.S. Jacob Luckenbach in central California. Marine Ornithology 31:35-41.
Johnsgard, P.A. 1987. Diving birds of North America. University Press, Lincoln, Nebraska. 262 pp.
Knechtel, H. A., N. M. Jones, M. Murphy, A. H., Robinson, K. Vickers, G. J. McChesney, H. R. Carter, S. W. Kress, R. T. Golightly, J. Buffa, and M. W. Parker. 2003. Restoration of

27
Common Murre Colonies in Central Coastal California: Annual Report 2002. Unpublished Report, U.S. Fish and Wildlife Service, San Francisco Bay NationalWildlife Refuge Complex, Newark, California (prepared for the Apex Houston TrusteeCouncil).
Kress, S.W. 1983. The use of decoys, sound recordings, and gull control in reestablishing a terncolony in Maine. Colonial Waterbirds 6:185-196.
Kress, S.W. and Nettleship. 1988. Reestablishment of Atlantic Puffins at a former breeding sitein the Gulf of Maine. Journal of Field Ornithology 59:161-169.
Kress, S.W., and P. Salmansohn. 1997. Project Puffin: How we brought puffins back to EggRock. National Audubon Society. Tilbury House, Publishers, Garner, Maine.
McChesney, G.J. 1997. Breeding biology of the Brandt’s Cormorants on San Nicolas Island,California. Unpublished M.S. thesis, California State University, Sacramento, California.
McChesney, G.J., H.R. Carter, M.W. Parker, J.E. Takekawa and J.L. Yee. 1998. Populationtrends and subcolony use of Common Murres and Brandt’s Cormorants at Point ReyesHeadlands, California, 1979-1997. Unpublished report, U.S. Geological Survey,Biological Resources Division, Western Ecological Research Center, Dixon, California;Humboldt State University, Department of Wildlife, Arcata, California; and U.S. Fishand Wildlife Service, San Francisco Bay National Wildlife Refuge Complex, Newark,California. (Prepared for the National Park Service and Apex Houston Trustee Council)
McChesney, G.J., H.R. Carter, M.W. Parker, P.J. Capitolo, J.E. Takekawa, and J.L. Yee. 1999. Population trends and subcolony use of Common Murres and Brandt’s Cormorants at theCastle/Hurricane Colony Complex, California, 1979-1997. Unpublished final report,U.S. Geological Survey, Biological Resources Division, Western Ecological ResearchCenter, Dixon, California; and U.S. Fish and Wildlife Service, San Francisco BayNational Wildlife Refuge Complex, Newark, California. (Prepared for the Apex HoustonTrustee Council)
McChesney, G. J. McChesney, A. H. Robinson, J. S. Koepke, H. A. Knechtel, N. M. Jones, C.M. Caurant, R. T. Golightly, H. R. Carter, S. W. Kress, and J. Stankiewizc. 2004.Restoration of Common Murre colonies in central coastal California: annual report 2003.Unpublished report, U.S. Fish and Wildlife Service, San Francisco Bay National WildlifeRefuge Complex, Newark, California (prepared for the Apex Houston Trustee Council).
Page, G.W., H.R. Carter, and R.G. Ford. 1990. Numbers of seabirds killed or debilitated in the1986 Apex Houston oil spill in central California. Pp. 164-174. In Sealy, S.G. (Ed.),Auks at sea. Studies in Avian Biology 14.
Parker, M.W., E.B. McClaren, S.E. Schubel, J.A. Boyce, P.J. Capitolo, M.A. Ortwerth, S.W.Kress, H.R. Carter, and A. Hutzel. 1997. Restoration of Common Murre Colonies inCentral California: Annual Report 1996. Unpublished report, U.S. Fish and WildlifeService, San Francisco Bay National Wildlife Refuge Complex, Newark, California(prepared for the Apex Houston Trustee Council).
Parker, M.W., E.B. McClaren, J.A. Boyce, V. Collins, D.A. Nothhelfer, R.J. Young, S.W. Kress,H.R. Carter, and A.M. Hutzel. 1998. Restoration of Common Murre Colonies in CentralCalifornia: Annual Report 1997. Unpublished report, U.S. Fish and Wildlife Service, SanFrancisco Bay National Wildlife Refuge Complex, Newark, California (prepared for theApex Houston Trustee Council).

28
Parker, M.W., J.A. Boyce, E.N. Craig, H. Gellerman, D.A. Nothhelfer, R.J. Young, S.W. Kress,H.R. Carter, and G. Moore. 1999. Restoration of Common Murre Colonies in CentralCoastal California: Annual Report 1998. Unpublished Report, U.S. Fish and WildlifeService, San Francisco Bay National Wildlife Refuge Complex, Newark, California(prepared for the Apex Houston Trustee Council).
Parker, M.W., J.A. Boyce, E.N. Craig, H. Gellerman, D.A. Nothhelfer, R.J. Young, S.W. Kress,H.R. Carter, and G. Moore. 2000. Restoration of Common Murre Colonies in CentralCoastal California: Annual Report 1999. Unpublished Report, U.S. Fish and WildlifeService, San Francisco Bay National Wildlife Refuge Complex, Newark, California(prepared for the Apex Houston Trustee Council).
Parker, M., C. Hamilton, I. Harrald, H. Knechtel, M. Murphy, V. Slowik, H Carter, S. Kress, R.Golightly and S. Boehm. 2001. Restoration of Common Murre Colonies in CentralCoastal California: Annual Report 2000. Unpublished Report, U.S. Fish and WildlifeService, San Francisco Bay National Wildlife Refuge Complex, Newark, California(prepared for the Apex Houston Trustee Council).
Parker, M.W., H. Knechtel, M. Murphy, N. Jones, C. Hamilton, C. Caurant, B. Acord. 2002. Restoration of Common Murre Colonies in Central Coastal California: Annual Report2001. Unpublished Report, U.S. Fish and Wildlife Service, San Francisco Bay NationalWildlife Refuge Complex, Newark, California (prepared for the Apex Houston TrusteeCouncil).
Podolsky, R.H. 1985. Colony formation and attraction of the Laysan Albatross and Leach'sStorm-Petrel. Unpubl. Ph.D. dissertation, University of Michigan, Ann Arbor, Michigan.
Podolsky, R.H., and S.W. Kress. 1989. Factors affecting colony formation in Leach's Storm-Petrel. Auk 106:332-336.
Podolsky, R.H., and S.W. Kress. 1991. Attraction of the endangered Dark-rumped Petrel torecorded vocalizations in the Galapagos Islands. Condor 94:448-453.
Rauzon, M.J. 1996. Seabirds. Franklin Watts/Grolier Publishing, New York, New York.
Ray, M.S. 1909. The passing of the Pedro Island seabird rookery. Condor 11:94-96.
Roletto, J., J. Mortenson, I. Harrald, J. Hall, and L. Grella. 2003. Beached bird surveys and chronic oil pollution in central California. Marine Ornithology 31:21-28.
Salmansohn, P., and S.W. Kress. 1997. Giving back to the earth: a teacher’s guide for ProjectPuffin and other seabird studies. National Audubon Society. Tilbury House, publishers,Gardner, Maine.
Schubel, S.E. 1993. A Common Murre attraction project on a Maine island. Unpublished report,National Audubon Society, Ithaca, New York.
Siskin, B.R., G.W. Page, and H.R. Carter. 1993. Impacts of the 1986 Apex Houston oil spill onmarine birds in central California. Unpubl. report, U.S. Dept. of Justice, Washington,D.C.
Sowls, A.L., A.R. Degange, J.W. Nelson, and G.S. Lester. 1980. Catalog of Californiaseabird colonies. U.S. Department of Interior, Fish and Wildl. Serv., Biol. Serv. Prog.FWS/OBS 37/80.

29
Swartzman, G. 1996. Resource modeling moves into the courtroom. Ecological Modeling92:277-288.
Sydeman, W.J., H.R. Carter, J.E. Takekawa, and N. Nur. 1997. Common Murre Uria aalgepopulation trends at the South Farallon Islands, California, 1985-1995. Unpublishedreport, Point Reyes Bird Observatory, Stinson Beach, California; U.S. GeologicalSurvey, Dixon, California; and U.S. Fish and Wildlife Service, Newark, California.
Takekawa, J.E., H.R. Carter, and T.E. Harvey. 1990. Decline of the Common Murre in CentralCalifornia 1980-1986. Studies in Avian Biology 14:149-163.
U.S. Fish and Wildlife Service. 1995a. Notice of availability, final Apex Houston oil spillrestoration plan. Federal Register 60(81):20739-20749.
U.S. Fish and Wildlife Service. 1995b. Learn About Seabirds: A Curriculum Teacher’s Guide.Second Printing.

30
Figure 1. Map showing the location of the two study sites along the central California coast. Devil’s Slide Rock and San Pedro Rock (notshown) are located within the Devil’s Slide Colony Complex.

31
Figure 2. Devil’s Slide Colony Complex including colonies and subcolonies monitored bythe Common Murre Restoration Project.
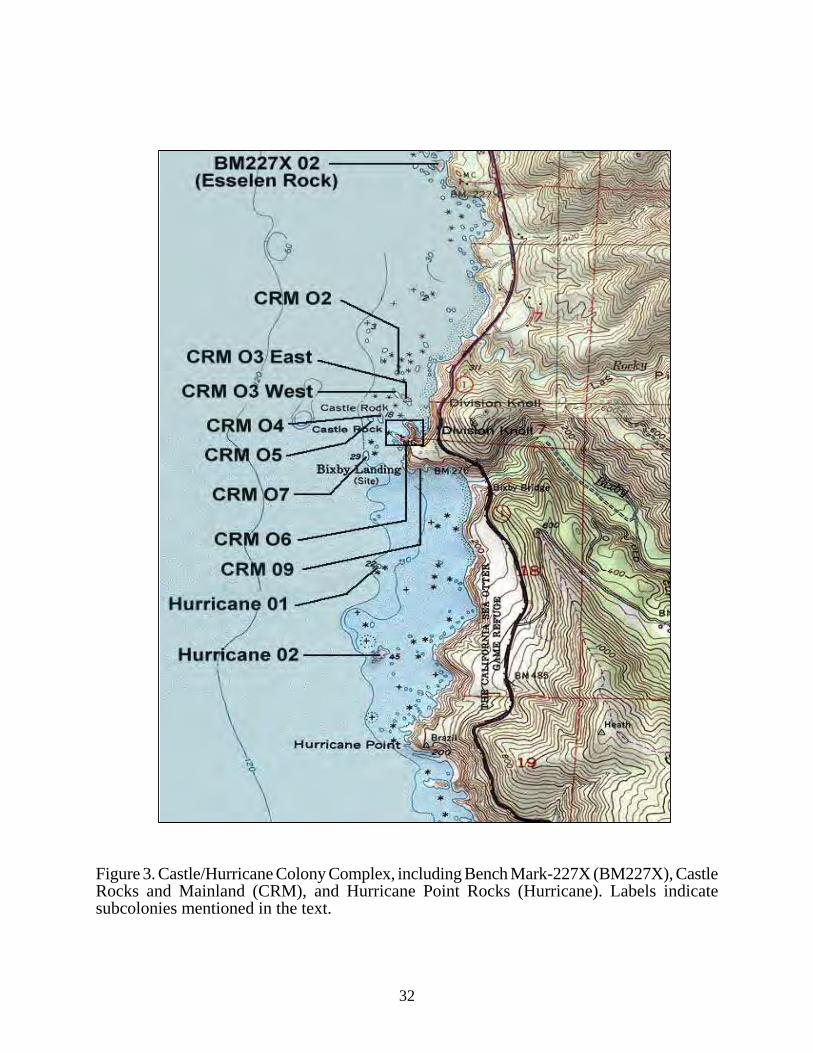
32
Figure 3. Castle/Hurricane Colony Complex, including Bench Mark-227X (BM227X), CastleRocks and Mainland (CRM), and Hurricane Point Rocks (Hurricane). Labels indicatesubcolonies mentioned in the text.

33
hhhhh hh
hh
h
h
hh
hh
hh
h
h
h
hhh
hh
hhh hhhh
h
hh
h hh
hh
h
hh
h h hhh
h
hhhh
h
h h
h
hhh
hhh
h
h
hhh
h
hhh
hh
hhh
hh
hh h
hhh
hhh
h
%U %U%U%U
%U
%U
%U%U
%U
%U
%U
%U%U
%U%U%U
%U%U%U
%U
%U
%U
%U
%U
%U
%U
%U
%U%U
%U%U
%U
%U
%U
%U%U
%U
%U
%U
%U
%U
%U%U
%U
%U%U%U
%U%U
%U
%U
%U
%U%U
%U%U
%U
%U
%U%U
%U%U
%U
%U%U %U
%U%U%U
%U
%U%U%U%U%U %U
%U%U%U
%U%U
%U%U%U %U
%U%U
%U%U%U
%U
%U%U%U
%U%U%U%U
%U%U%U%U
%U%U%U%U %U%U%U
%U
%U%U%U%U%U %U
%U%U%U%U
%U%U%U
%U
%U%U%U %U%U
%U%U%U%U%U%U
%U
%U%U%U
%U%U%U
%U%U%U
%U
%U%U%U%U
%U%U
%U%U
%U%U%U%U
%U%U%U%U
%U%U
%U%U
%U
%U%U%U%U
%U%U%U
%U%U%U%U %U
%U%U%U%U%U%U%U
%U%U%U
%U%U%U
%U%U
%U
%U
%U%U%U%U
%U%U
%U
%U%U%U %U
%U%U%U%U
%U%U
%U%U
%U%U%U%U%U
%U%U%U%U%U%U%U%U
%U
%U%U
%U%U
%U%U%U%U
%U %U
%U%U
ÊÚ ÊÚ
ÊÚ
ÊÚ
ÊÚ
12 3
9
1012
2 0 2 4 6 Meters
N
EW
S
Speaker
2x4
h
MirrorSolar panel
%U Territorial Sites %U Breeding Sites
ÊÚ DowelDecoys
Figure 4. GIS map of Devil’s Slide Rock, 2004. Common Murre breeding and territorial sites are shown in relation to social attractionequipment.
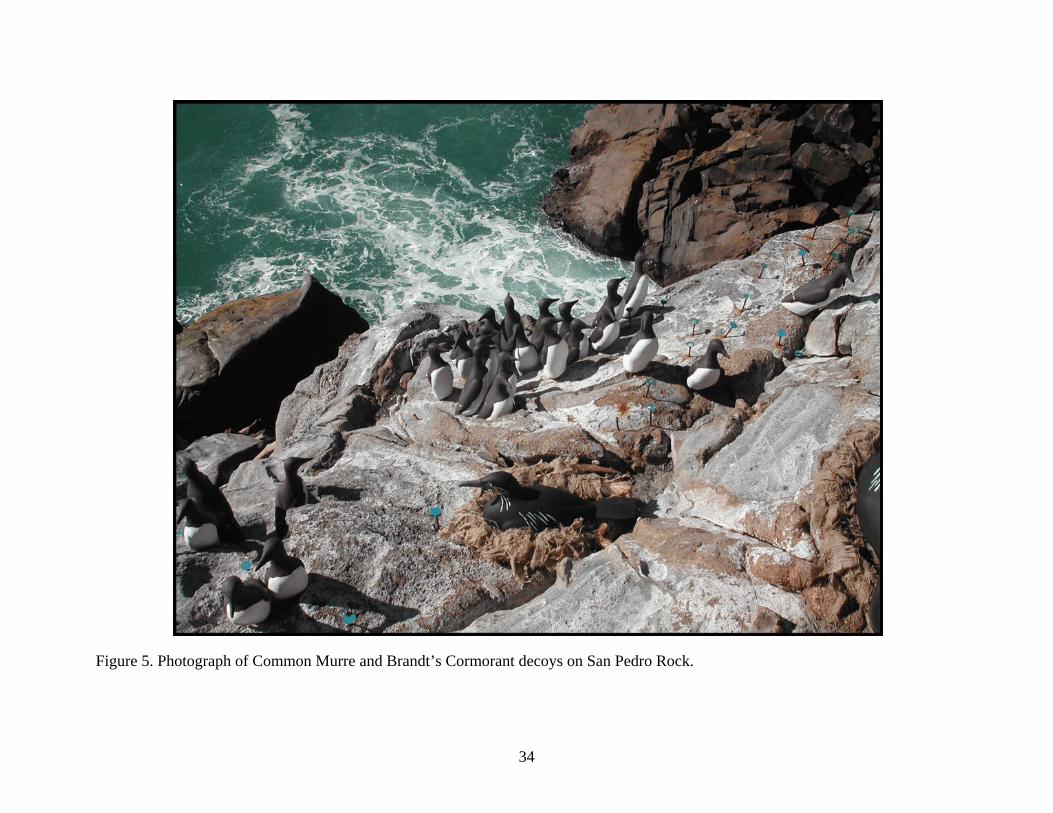
34
Figure 5. Photograph of Common Murre and Brandt’s Cormorant decoys on San Pedro Rock.
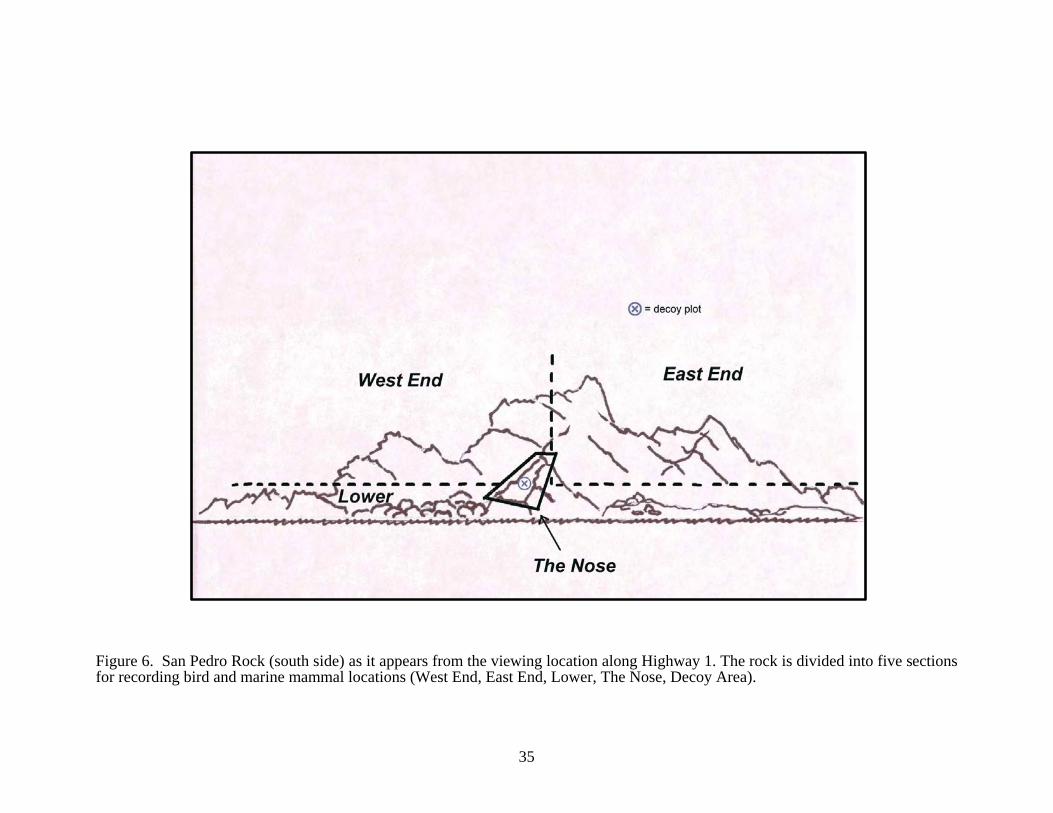
35
Figure 6. San Pedro Rock (south side) as it appears from the viewing location along Highway 1. The rock is divided into five sectionsfor recording bird and marine mammal locations (West End, East End, Lower, The Nose, Decoy Area).

36
6
5
9
9
13
1070
16
98
25
113
45
123
43
110
88
190
51
0
50
100
150
200
250N
o. C
omm
on M
urre
Site
s
1996 1997 1998 1999 2000 2001 2002 2003 2004
Year
Territorial
Breeding
Figure 7. Numbers of Common Murre breeding and territorial sites on Devil’s Slide Rock, 1996-2004.

37
0
20
40
60
80
100
120
140
160
No.
Com
mon
Mur
re si
tes
1996 1997 1998 1999 2000 2001 2002 2003 2004
Year
Figure 8. Number of Common Murre breeding and territorial sites within and outside of decoy plots on Devil's Slide Rock, 1996-2004.
Outside of Plot
Within Decoy Plot

38
Figure 9. Seasonal attendance of Common Murres at Devil's Slide Rock, 11 November 2003 to 11 August 2004. Attendance is reported as an average of three consecutive counts. Dashed line indicates pre-season (prior to 16 April).
0
50
100
150
200
250
300
350
11/1
1
11/2
5
12/9
12/2
3
1/6
1/20 2/3
2/17 3/2
3/16
3/30
4/13
4/27
5/11
5/25 6/8
6/22 7/6
7/20 8/3
No.
of M
urre
s

39
Common Ravens seen per scan
0.0
0.5
1.0
1.5
2.0
2.5
3.0
3.5
4.0
4.5
5.0
4/17
4/24 5/1
5/8
5/15
5/22
5/29 6/5
6/12
6/19
6/26 7/3
7/10
7/17
7/24
7/31
Date
Ave
rage
no.
per
scan
Common Murres seen per scan
0.0
0.5
1.0
1.5
2.0
2.5
3.0
3.5
4.0
4.5
5.0
4/17
4/24 5/1
5/8
5/15
5/22
5/29 6/5
6/12
6/19
6/26 7/3
7/10
7/17
7/24
7/31
Date
Ave
rage
no.
per
scan
Figure 10. Seasonal attendance of Common Ravens and Common Murres at San Pedro Rock, 17April to 31 July 2004. Data are presented as the average number of birds seen per 10 minute scanduring two hour watches.
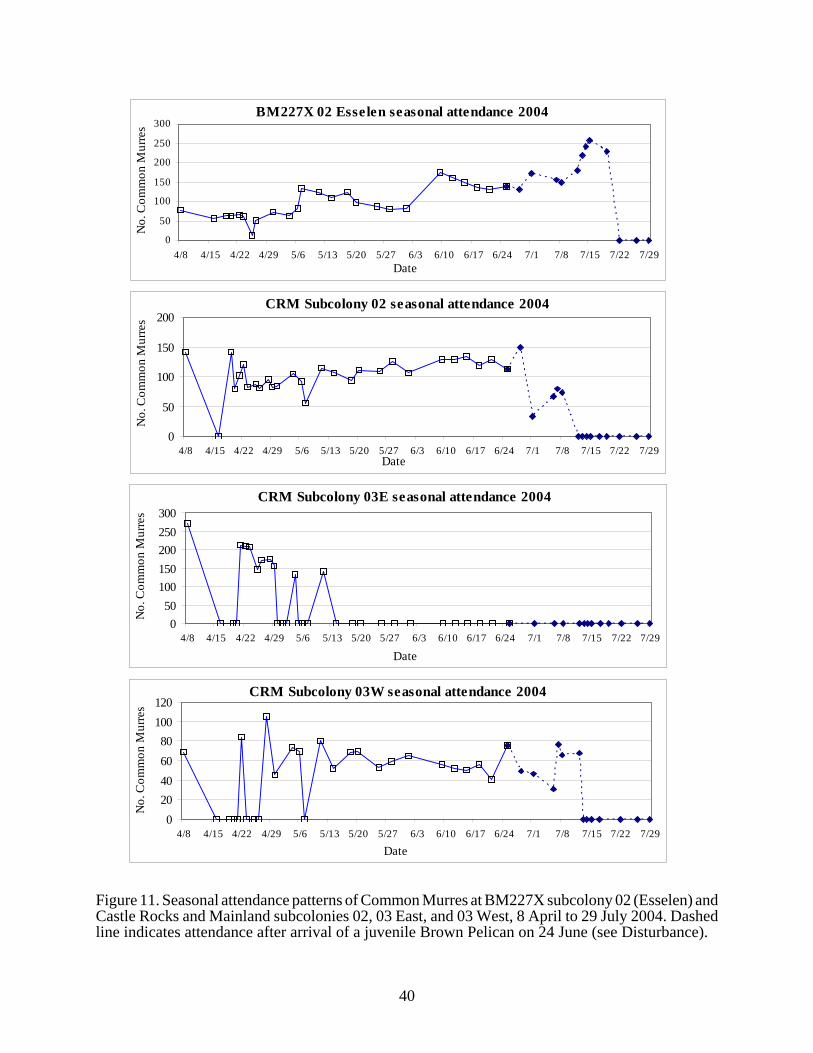
40
CRM Subcolony 02 seasonal attendance 2004
0
50
100
150
200
4/8 4/15 4/22 4/29 5/6 5/13 5/20 5/27 6/3 6/10 6/17 6/24 7/1 7/8 7/15 7/22 7/29Date
No.
Com
mon
Mur
res
CRM Subcolony 03E seasonal attendance 2004
050
100150200250300
4/8 4/15 4/22 4/29 5/6 5/13 5/20 5/27 6/3 6/10 6/17 6/24 7/1 7/8 7/15 7/22 7/29
Date
No.
Com
mon
Mur
res
CRM Subcolony 03W seasonal attendance 2004
020406080
100120
4/8 4/15 4/22 4/29 5/6 5/13 5/20 5/27 6/3 6/10 6/17 6/24 7/1 7/8 7/15 7/22 7/29
Date
No.
Com
mon
Mur
res
BM227X 02 Esselen seasonal attendance 2004
0
50
100
150
200
250
300
4/8 4/15 4/22 4/29 5/6 5/13 5/20 5/27 6/3 6/10 6/17 6/24 7/1 7/8 7/15 7/22 7/29Date
No.
Com
mon
Mur
res
Figure 11. Seasonal attendance patterns of Common Murres at BM227X subcolony 02 (Esselen) andCastle Rocks and Mainland subcolonies 02, 03 East, and 03 West, 8 April to 29 July 2004. Dashedline indicates attendance after arrival of a juvenile Brown Pelican on 24 June (see Disturbance).

41
CRM Subcolony 04 seasonal attendance 2004
0
100
200
300
400
500
600
700
800
4/8 4/15 4/22 4/29 5/6 5/13 5/20 5/27 6/3 6/10 6/17 6/24 7/1 7/8 7/15 7/22 7/29Date
No.
Com
mon
Mur
res
CRM Subcolony 05 seasonal attendance 2004
0
5
10
15
20
25
30
35
40
4/8 4/15 4/22 4/29 5/6 5/13 5/20 5/27 6/3 6/10 6/17 6/24 7/1 7/8 7/15 7/22 7/29Date
No.
Com
mon
Mur
res
CRM Subcolony 07 seasonal attendance 2004
0
50
100
150
200
250
300
350
4/8 4/15 4/22 4/29 5/6 5/13 5/20 5/27 6/3 6/10 6/17 6/24 7/1 7/8 7/15 7/22 7/29Date
No.
Com
mon
Mur
res
Figure 12. Seasonal attendance patterns of Common Murres at Castle Rocks and Mainlandsubcolonies CRM 04, 05, and 07, 8 April to 29 July 2004. Dashed line indicates attendance afterarrival of a juvenile Brown Pelican on 24 June (see Disturbance).
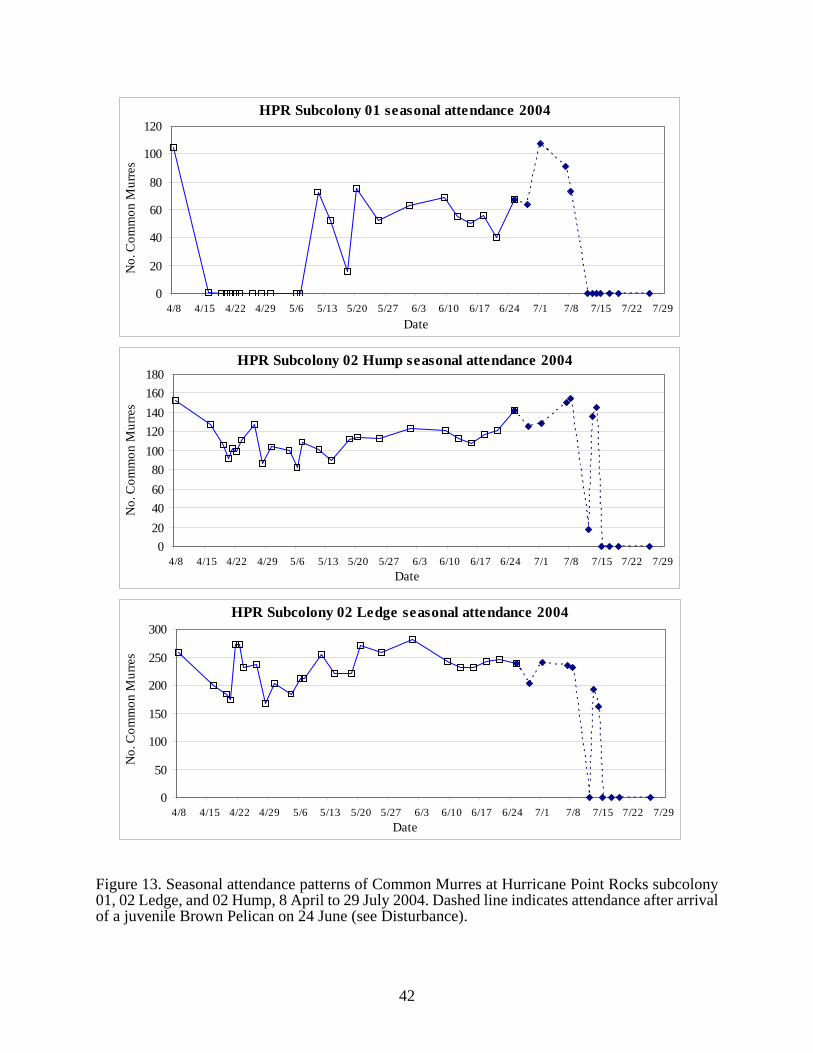
42
HPR Subcolony 01 seasonal attendance 2004
0
20
40
60
80
100
120
4/8 4/15 4/22 4/29 5/6 5/13 5/20 5/27 6/3 6/10 6/17 6/24 7/1 7/8 7/15 7/22 7/29Date
No.
Com
mon
Mur
res
HPR Subcolony 02 Hump seasonal attendance 2004
020406080
100120140160180
4/8 4/15 4/22 4/29 5/6 5/13 5/20 5/27 6/3 6/10 6/17 6/24 7/1 7/8 7/15 7/22 7/29Date
No.
Com
mon
Mur
res
HPR Subcolony 02 Ledge seasonal attendance 2004
0
50
100
150
200
250
300
4/8 4/15 4/22 4/29 5/6 5/13 5/20 5/27 6/3 6/10 6/17 6/24 7/1 7/8 7/15 7/22 7/29Date
No.
Com
mon
Mur
res
Figure 13. Seasonal attendance patterns of Common Murres at Hurricane Point Rocks subcolony01, 02 Ledge, and 02 Hump, 8 April to 29 July 2004. Dashed line indicates attendance after arrivalof a juvenile Brown Pelican on 24 June (see Disturbance).

43
Area 1
Area 2
Area 3
Area 4Area 5
Area 8
Area 9
Area 10
Area 11
Area 1
Area 2
Area 3
Area 4Area 5
Area 8
Area 9
Area 10
Area 11
Figure 14. Survey areas from boat survey of seabird colonies in the San Pedro Rock to Devil’s Slideareas, 18 June 2004.

44
2004 PICTORIAL HIGHLIGHTS
Figure 15. Aerial overview photograph ofDevil’s Slide Rock, 3 March 2004.
Figure 16. Aerial overview photograph ofDevil’s Slide Rock, 25 May 2004.
Figure 17. Prospecting Common Murreamong decoys on San Pedro Rock, 21 June2004.
Figure 18. Pair of Common Ravens attractedto mirrors on San Pedro Rock, 6 June 2004.
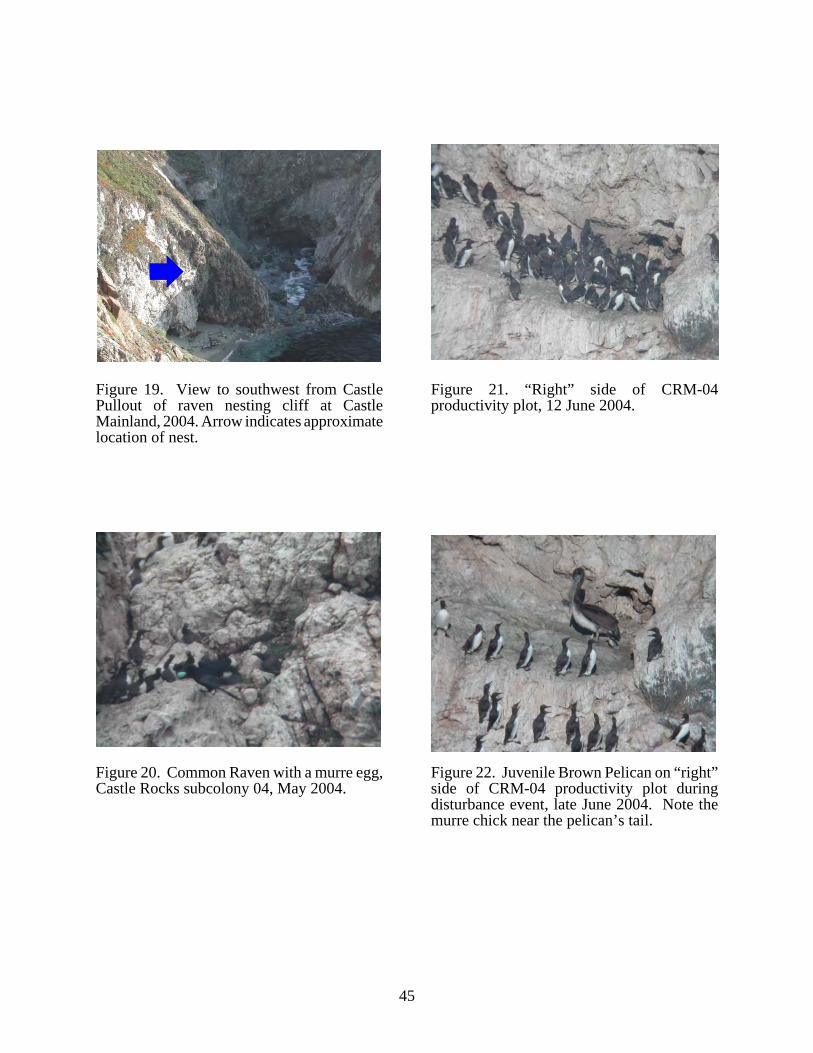
45
Figure 19. View to southwest from CastlePullout of raven nesting cliff at CastleMainland, 2004. Arrow indicates approximatelocation of nest.
Figure 20. Common Raven with a murre egg,Castle Rocks subcolony 04, May 2004.
Figure 21. “Right” side of CRM-04productivity plot, 12 June 2004.
Figure 22. Juvenile Brown Pelican on “right”side of CRM-04 productivity plot duringdisturbance event, late June 2004. Note themurre chick near the pelican’s tail.
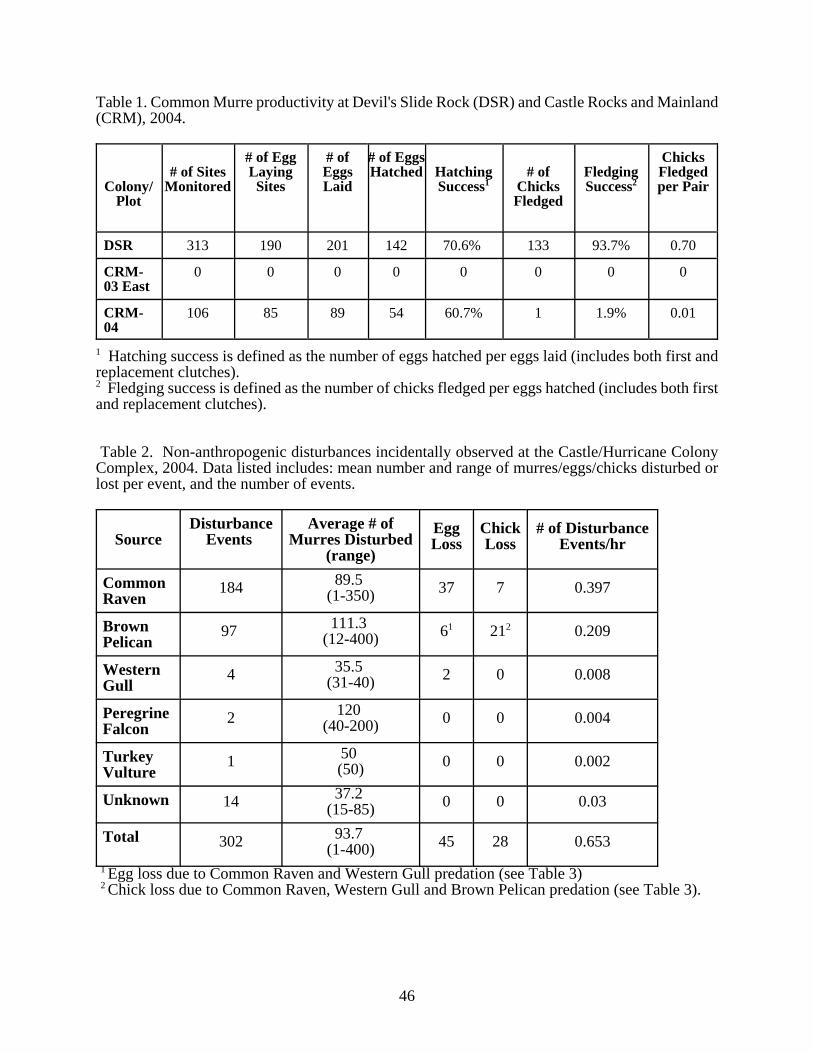
46
Table 1. Common Murre productivity at Devil's Slide Rock (DSR) and Castle Rocks and Mainland(CRM), 2004.
Colony/Plot
# of SitesMonitored
# of EggLaying
Sites
# ofEggsLaid
# of EggsHatched Hatching
Success1# of
ChicksFledged
FledgingSuccess2
ChicksFledgedper Pair
DSR 313 190 201 142 70.6% 133 93.7% 0.70
CRM-03 East
0 0 0 0 0 0 0 0
CRM-04
106 85 89 54 60.7% 1 1.9% 0.01
1 Hatching success is defined as the number of eggs hatched per eggs laid (includes both first andreplacement clutches).2 Fledging success is defined as the number of chicks fledged per eggs hatched (includes both firstand replacement clutches).
Table 2. Non-anthropogenic disturbances incidentally observed at the Castle/Hurricane ColonyComplex, 2004. Data listed includes: mean number and range of murres/eggs/chicks disturbed orlost per event, and the number of events.
SourceDisturbance
Events
Average # ofMurres Disturbed
(range)
EggLoss
ChickLoss
# of DisturbanceEvents/hr
CommonRaven
184 89.5 (1-350) 37 7 0.397
BrownPelican
97 111.3 (12-400) 61 212 0.209
WesternGull
4 35.5 (31-40) 2 0 0.008
PeregrineFalcon
2 120 (40-200) 0 0 0.004
TurkeyVulture
1 50 (50) 0 0 0.002
Unknown 14 37.2 (15-85) 0 0 0.03
Total 302 93.7 (1-400) 45 28 0.653
1 Egg loss due to Common Raven and Western Gull predation (see Table 3) 2 Chick loss due to Common Raven, Western Gull and Brown Pelican predation (see Table 3).
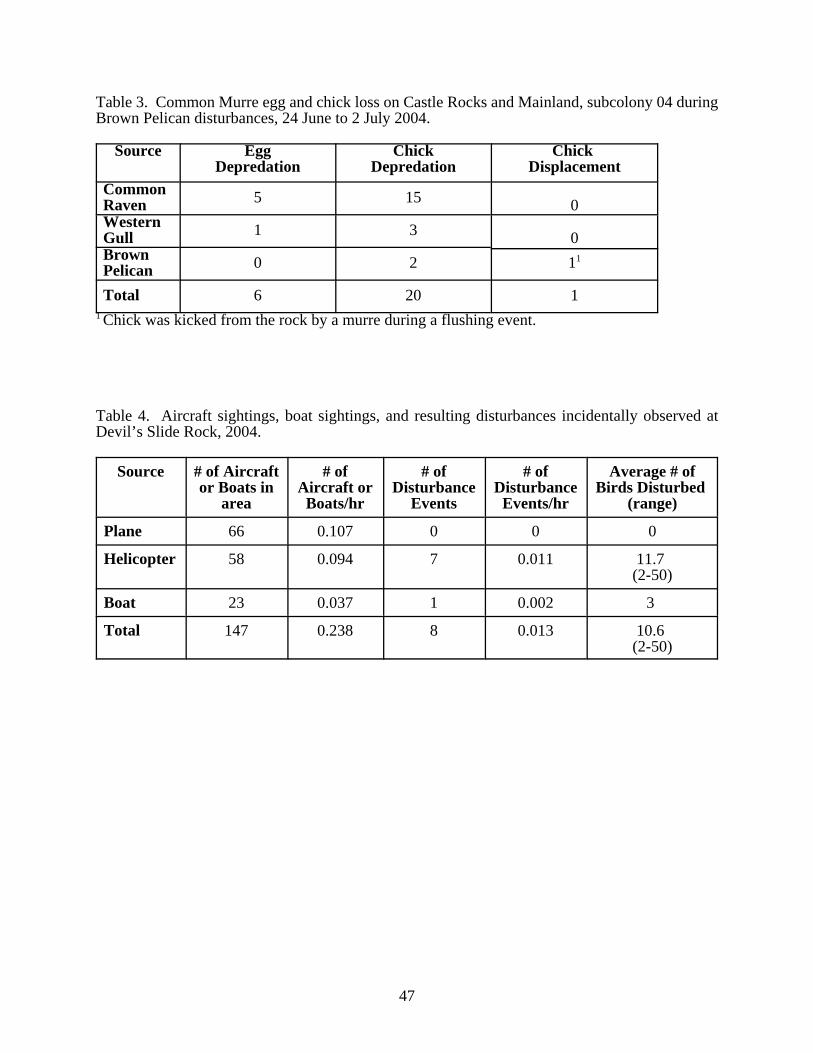
47
Table 3. Common Murre egg and chick loss on Castle Rocks and Mainland, subcolony 04 duringBrown Pelican disturbances, 24 June to 2 July 2004.
Source EggDepredation
ChickDepredation
Chick Displacement
CommonRaven 5 15 0WesternGull 1 3 0BrownPelican 0 2 11
Total 6 20 11 Chick was kicked from the rock by a murre during a flushing event.
Table 4. Aircraft sightings, boat sightings, and resulting disturbances incidentally observed atDevil’s Slide Rock, 2004.
Source # of Aircraftor Boats in
area
# ofAircraft or
Boats/hr
# ofDisturbance
Events
# ofDisturbance
Events/hr
Average # ofBirds Disturbed
(range)
Plane 66 0.107 0 0 0
Helicopter 58 0.094 7 0.011 11.7 (2-50)
Boat 23 0.037 1 0.002 3
Total 147 0.238 8 0.013 10.6 (2-50)

48
Table 5. Brandt’s Cormorant breeding phenology and reproductive success at Devil’s Slide Rock and Mainland, 2004.
Subcolony # of sitesmonitored
Mean laying date(range; n)
Mean hatchingdate (range; n)
Mean # ofeggs per site(range; n)
Mean # ofchicks per site
(range; n)
Mean # of chicksfledged per site
(range; n)
Devil’sSlide Rock 91
12 May(15 Apr - 26 June;
n=82)
10 June (23 May - 17 June;
n=74)3.3
(2-4; n=63)2.3
(0-4; n=90)1.9
(0-4; n=90)
MainlandSouth 61
4 May(10 Apr - 29 May;
n=57)
5 June(14 May - 28 June;
n=56)3.4
(2-5; n=59)2.7
(0-4; n=59) 2.4(0-4; n=61)
Turtlehead 246 May
(12 Apr - 21 May;n=24)
7 June(27 May - 21 June;
n=24)3.7
(2-5; n=23)2.9
(1-4; n=24)2.3
(1-4; n=24)
Total 1768 May
(10 Apr - 26 June;n=163)
7 June(14 May - 28 June;
n=154)3.4
(2-5; n=145)2.5
(0-4; n=173)2.1
(0-4; n=175)
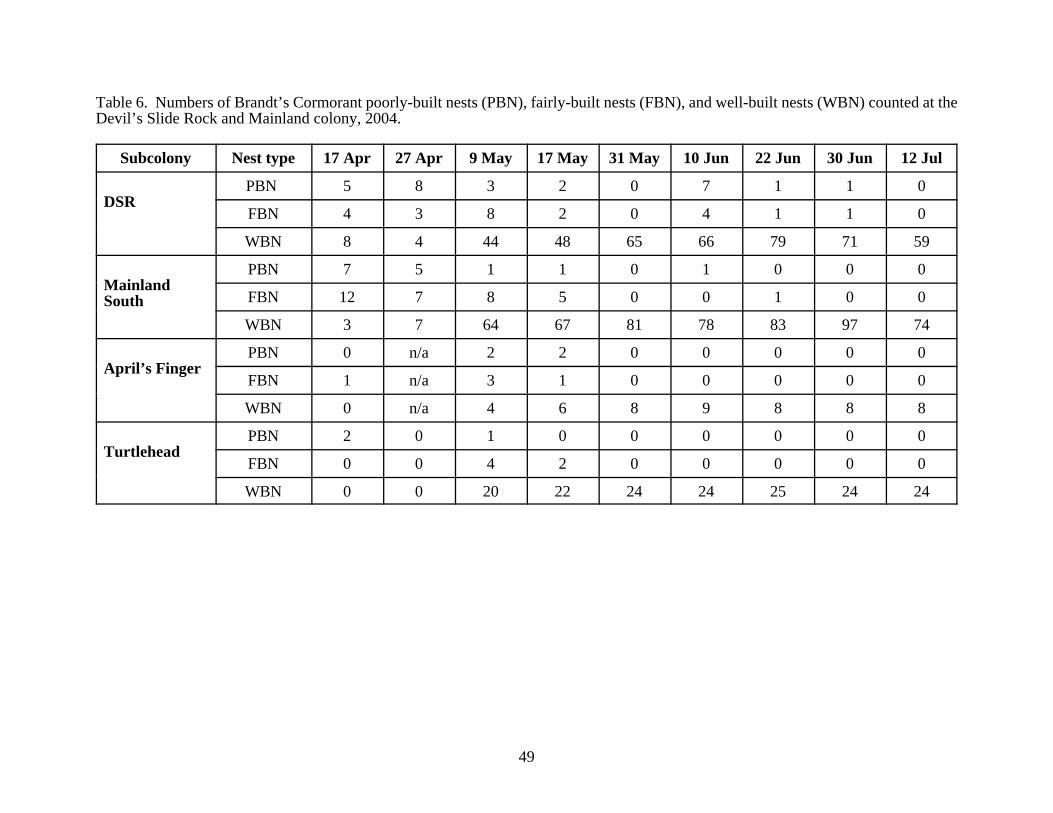
49
Table 6. Numbers of Brandt’s Cormorant poorly-built nests (PBN), fairly-built nests (FBN), and well-built nests (WBN) counted at theDevil’s Slide Rock and Mainland colony, 2004.
Subcolony Nest type 17 Apr 27 Apr 9 May 17 May 31 May 10 Jun 22 Jun 30 Jun 12 Jul
DSRPBN 5 8 3 2 0 7 1 1 0
FBN 4 3 8 2 0 4 1 1 0
WBN 8 4 44 48 65 66 79 71 59
MainlandSouth
PBN 7 5 1 1 0 1 0 0 0
FBN 12 7 8 5 0 0 1 0 0
WBN 3 7 64 67 81 78 83 97 74
April’s FingerPBN 0 n/a 2 2 0 0 0 0 0
FBN 1 n/a 3 1 0 0 0 0 0
WBN 0 n/a 4 6 8 9 8 8 8
TurtleheadPBN 2 0 1 0 0 0 0 0 0
FBN 0 0 4 2 0 0 0 0 0
WBN 0 0 20 22 24 24 25 24 24

50
Table 7. Numbers of Brandt’s Cormorant poorly-built nests (PBN), fairly-built nests (FBN), and well-built nests (WBN) counted at theCastle/Hurricane Colony Complex, 2004. Not all subcolonies were counted on each day.
Subcolony Nesttype
16Apr
22Apr
30Apr
7May
14May
18May
20May
9Jun
18Jun
25Jun
1Jul
8Jul
CR06S-S
PBN 3 n/a 0 0 0 n/a 0 n/a 0 n/a n/a n/a
FBN 2 n/a 0 0 0 n/a 0 n/a 0 n/a n/a n/a
WBN 3 n/a 9 29 18 n/a 21 n/a 20 n/a n/a n/a
CR07
PBN 1 0 0 0 0 n/a n/a 0 0 0 0 0
FBN 2 2 0 0 0 n/a n/a 0 0 0 0 0
WBN 1 3 6 6 6 n/a n/a 6 6 4 2 0
CR09
PBN 11 0 0 n/a 0 n/a 0 0 0 n/a n/a n/a
FBN 14 4 2 n/a 0 n/a 0 0 0 n/a n/a n/a
WBN 4 11 24 n/a 15 n/a 62 58 41 n/a n/a n/a
BM227X-02
PBN 21 1 0 1 0 0 2 1 0 n/a 0 n/a
FBN 19 2 1 7 5 2 3 0 0 n/a 0 n/a
WBN 52 19 34 59 42 44 120 101 94 n/a 12 n/a
H02
PBN 3 0 0 0 0 0 0 1 0 0 n/a 0
FBN 7 4 0 4 0 0 1 0 0 0 n/a 0
WBN 7 15 17 18 19 20 20 27 25 19 n/a 4

51
Table 8. Summary of aerial photograph counts of Common Murres (COMU), Brandt’s Cormorants (BRCO), and Double-crestedCormorants (DCCO) at sample central California breeding colonies, 2004.
Colony Name CCN1 USFWSCN2 Date COMUBrandt’s Cormorant Double-crested
CormorantBirds Nests Sites Birds Nests Sites Birds
Point Reyes MA-374-01 429-001 05/25/04 24,437 580 61 721 0 0 0
Point Resistance MA-374-03 429-024 05/25/04 4,246 14 0 33 0 0 0
Miller’s Point Rocks MA-374-04 429-002 05/25/04 904 148 9 191 0 0 0
Double Point Rocks MA-374-05 429-003 05/25/04 9,472 164 11 334 0 0 0
North Farallon Islands SF-FAI-01 429-051 05/25/04 43,071 51 9 139 0 0 0
South Farallon Islands SF-FAI-02 429-052 05/24/04 76,287 8,507 347 10,677 561 2 606
Alcatraz Island SFB-SF-11 429-036 05/25/04 0 789 0 993 0 0 0
Lobos Rock & Land’s End SF-374-02 429-029 05/25/04 0 119 0 185 0 0 0
Seal Rocks SF-374-03 429-009 05/25/04 0 0 0 131 0 0 0
Devil’s Slide Rock & Mainland SM-372-03 429-014 05/25/04 291 346 11 502 0 0 0
Año Nuevo Island SM-370-04 429-023 05/27/04 0 1,639 9 2,486 0 0 0
Bench Mark-227X MO-362-18 454-029 05/27/04 323 222 2 237 0 0 0
Castle Rocks & Mainland MO-362-19 454-010 05/27/04 1,737 171 0 198 0 0 0
Hurricane Point Rocks MO-362-20 454-011 05/27/04 804 34 1 39 0 0 0
TOTAL 161,572 12,784 460 16,866 561 2 606
1 CCN = California Colony Number2 USFWSCN = U.S. Fish and Wildlife Service Colony Number.

52
Table 9. Numbers of Pelagic Cormorants, Western Gulls, Pigeon Guillemots, and Black Oystercatchers counted at breeding colonies ona boat survey between San Pedro Rock and Pillar Point, 18 June 2004. ND, no data.
Colony Name Area
Pelagic Cormorant Nest Bird
Western Gull Nest Bird
Pigeon Guillemot Land H2O Total
Black Oystercatcher Nest Bird (land) Bird (fly) Bird (total)
San Pedro Rock North side 0 0 1 1 ND 37 37 0 0 0 0 South side 0 0 5 ND 0 40 40 1 ND 3 0 Total 0 0 6 ND ND 77 77 1 0 3 0San Pedro Point South side 0 0 0 0 2 0 2 0 0 0 0 Area 10 0 0 0 0 4 4 0 0 0 0 Total 0 0 0 0 2 4 6 0 0 0 0Devil’s Slide Rk. & Mainland Area 9 (“Pipe Point”) 0 0 0 0 8 8 0 0 2 2 Area 8 0 0 1 2 0 0 0 0 0 0 0 Turtlehead 31 1 0 0 0 0 0 0 0 0 0 Devil’s Slide Rock 0 0 2 2 0 0 0 0 0 0 0 Area 5 (Turtlehead Cove) 7 10 0 0 ND 62 62 0 0 4 4 Area 4 2 4 1 2 0 0 0 0 0 0 0 Area 3 4 7 0 0 0 0 0 0 0 0 0 Area 2 22 28 0 2 0 19 19 0 0 0 0 Area 1 19 33 0 0 0 8 8 0 0 1 1 Total 57 83 4 8 --- 97 97 0 0 72 72
Pillar Point 0 0 0 0 0 1 1 0 0 0 0
1 Seasonal total. One active nest remained 17 June.2 May include double counts of some birds since all birds were flying.

53
Table 10. Numbers of Pelagic Cormorant, Western Gull, and Black Oystercatcher nests and PigeonGuillemot birds counted at the Castle/Hurricane Colony Complex, 2004.1
Colony/Subcolony
PelagicCormorant
WesternGull
BlackOystercatcher
PigeonGuillemot
Bench Mark- 227X
BM-02 (Esselen Rk.) 0 2 0 0
BM-05 (Rk. W. of Sub. 02) 0 1 0 0
BM-06 (Slea Stack) 0 1 0 0
Total 0 4 0 0
Castle Rocks & Mainland
CRM-01 0 1 1 -
CRM-02 0 1 0 -
CRM-03A (Rock 03 West) 0 0 0 -
CRM-03B (Rock 03 East) 0 1 1 -
CRM-04 0 1 0 -
CRM-05 0 1 0 -
CRM-06 0 12 0 -
CRM-07 1 0 0 -
CRM-09 4 0 0 -
CRM-10 (Rk. SE of CRM-01) 0 1 0 -
CRM-11 (Rk. E. of CRM-03B) 0 1 0 -
Total 5 7 2 133
Hurricane Point Rocks
HPR-01 (North Rock) 0 1 0 0
HPR-02 (South Rock) 1 12 0 43
HPR-03 0 4 0 0
Total 1 17 0 43
1 Cormorant, gull, and oystercatcher nest counts from 9 June 2004 survey, unless otherwiseindicated.2 Count from aerial photographic survey, 27 May 2004.3 Seasonal high total from sea surface scans and colony counts. High count at CRM from 1 Julyand at HPR 12 July, respectively.

54
Appendix 1. Raw counts by subcolony of Common Murre birds and Brandt’s and Double-crested Cormorant nests, sites, and birdsfrom aerial photographic surveys of central California colonies, 2004. SC# = Subcolony Number.__________________________________________________________________________________________________________________________________________________________________________________________________________________________________________
Common Brandt’s Cormorant Double-crested Cormorant Date Colony Name SC# Subcolony Name Murre Nest Site Bird Nest Site Bird_____________________________________________________________________________________________________________________5/25/2004 Point Reyes 03B Lighthouse Rock 15100 0 0 0 0 0 05/25/2004 Point Reyes 03C NW Lighthouse Cliffs 1049 0 0 0 0 0 05/25/2004 Point Reyes 03D Aalge Ledge 0 0 0 0 0 0 05/25/2004 Point Reyes 03E The Bulb 309 0 0 0 0 0 05/25/2004 Point Reyes 03F SW Lighthouse Cliffs 94 0 0 0 0 0 05/25/2004 Point Reyes 04 S Lighthouse Cliffs 296 0 0 1 0 0 05/25/2004 Point Reyes 05B Boulder Rock 1807 0 0 0 0 0 05/25/2004 Point Reyes 05C Pebble Point 327 0 0 0 0 0 05/25/2004 Point Reyes 08A Trinity Point 15 247 44 316 0 0 05/25/2004 Point Reyes 09A Cliff Colony West 104 255 2 278 0 0 05/25/2004 Point Reyes 10A Northwest Rock 150 0 0 0 0 0 05/25/2004 Point Reyes 10B Flattop 1040 0 0 0 0 0 05/25/2004 Point Reyes 10C Middle Rock 874 0 0 0 0 0 05/25/2004 Point Reyes 10D East Rock 246 0 0 0 0 0 05/25/2004 Point Reyes 10E Beach Rock 257 0 0 0 0 0 05/25/2004 Point Reyes 10H Tim Tam 229 0 0 0 0 0 05/25/2004 Point Reyes 11B Face Rock 429 0 0 0 0 0 05/25/2004 Point Reyes 11E Mainland E. of Spine 0 10 5 20 0 0 05/25/2004 Point Reyes 13 Cone Rock 2028 0 0 0 0 0 05/25/2004 Point Reyes 14B Subcolony 14B 78 3 7 16 0 0 05/25/2004 Point Reyes 14D Miwok Rock 5 42 1 53 0 0 05/25/2004 Point Reyes 14E Miwok Mainland 0 23 2 33 0 0 05/25/2004 Point Reyes 19 Subcolony 19 0 0 0 4 0 0 05/25/2004 Point Resistance 02 Point Resistance 4246 14 0 33 0 0 05/25/2004 Miller's Point Rocks 01 North Rock 203 2 0 2 0 0 05/25/2004 Miller's Point Rocks 02 South Rock 701 146 9 189 0 0 05/25/2004 Double Point Rocks 01 Stormy Stack 9472 164 11 295 0 0 05/25/2004 Double Point Rocks 99 Rock N. of Stormy Stack 0 0 0 39 0 0 05/25/2004 North Farallon Islands 01 North Islet 6955 0 7 24 0 0 05/25/2004 North Farallon Islands 02 West Islet 13682 30 1 67 0 0 05/25/2004 North Farallon Islands 03 East Islet 14729 19 1 26 0 0 05/25/2004 North Farallon Islands 04 South Islet 7705 2 0 22 0 0 05/25/2004 South Farallon Islands 01 Southeast Farallon Island 31908 5966 273 7357 0 0 05/25/2004 South Farallon Islands 02 West End Island 30416 2479 71 3219 561 2 6065/25/2004 South Farallon Islands 03 The Islets 12156 62 3 95 0 0 05/25/2004 South Farallon Islands 04 Saddle Rock 1807 0 0 6 0 0 0________________________________________________________________________________________________________________________________

55
Appendix 1 (continued).__________________________________________________________________________________________________________________________________________________________________________________________________________________________________________
Common Brandt’s Cormorant Double-crested Cormorant Date Colony Name SC# Subcolony Name Murre Nest Site Bird Nest Site Bird_____________________________________________________________________________________________________________________5/25/2004 Alcatraz Island 01 Alcatraz Island 0 789 0 993 0 0 05/25/2004 Lobos Rock and Lands End 04 Lobos Rock 0 0 0 14 0 0 05/25/2004 Lobos Rock and Lands End 06 Nearshore Rock 0 119 0 171 0 0 05/25/2004 Seal Rocks 01 Seal Rocks 0 0 0 131 0 0 05/25/2004 Devil's Slide Rock & Mainland 01 Devil's Slide Rock 291 105 0 153 0 0 05/25/2004 Devil's Slide Rock & Mainland 02 April's Finger 0 11 0 12 0 0 05/25/2004 Devil's Slide Rock & Mainland 05 Mainland South/Turtlehead 0 230 11 303 0 0 05/25/2004 Devil's Slide Rock & Mainland 99 Elizabeth Rock 0 0 0 34 0 0 05/27/2004 Año Nuevo Island 01 Año Nuevo Island 0 1639 9 2486 0 0 05/27/2004 Bench Mark-227X 02 Esselen Rock 323 222 2 237 0 0 05/27/2004 Castle Rocks & Mainland 02 Rock 02 297 0 0 0 0 0 05/27/2004 Castle Rocks & Mainland 03A Rock 03 West 123 0 0 0 0 0 05/25/2004 Castle Rocks & Mainland 03B Rock 03 East 0 0 0 0 0 0 05/27/2004 Castle Rocks & Mainland 04 Rock 04 675 0 0 0 0 0 05/27/2004 Castle Rocks & Mainland 05 Rock 05 27 0 0 0 0 0 05/27/2004 Castle Rocks & Mainland 06B Mainland 06 South 0 47 0 53 0 0 05/27/2004 Castle Rocks & Mainland 07 Rock 07 615 18 0 25 0 0 05/27/2004 Castle Rocks & Mainland 08 0 0 32 0 35 0 0 05/27/2004 Castle Rocks & Mainland 09 0 0 74 0 85 0 0 05/27/2004 Hurricane Point Rocks 01 Rock 01 157 0 0 0 0 0 05/27/2004 Hurricane Point Rocks 02 Rock 02 647 34 1 39 0 0 0________________________________________________________________________________________________________________________________________________________________________________________________________________________________________________________________


![New York Settling the Middle [or “ Restoration ” ] Colonies.](https://static.fdocuments.in/doc/165x107/56649dd55503460f94acd4d5/new-york-settling-the-middle-or-restoration-colonies.jpg)

![AP U.S. History. New York Settling the Middle [or “ Restoration ” ] Colonies.](https://static.fdocuments.in/doc/165x107/56649e6c5503460f94b6b761/ap-us-history-new-york-settling-the-middle-or-restoration-colonies.jpg)


![THE MIDDLE COLONIES. New York Settling the Middle [or “Restoration”] Colonies.](https://static.fdocuments.in/doc/165x107/56649e2b5503460f94b19a72/the-middle-colonies-new-york-settling-the-middle-or-restoration-colonies.jpg)


![The Restoration Colonies - Ms. V Loves Historymsvanwoerkom.weebly.com/.../3675744/restoration_colonies.pdf[or “Restoration”] Colonies Old Netherlanders at New Netherlands 1600s](https://static.fdocuments.in/doc/165x107/60e9838a1f879f5bd7380747/the-restoration-colonies-ms-v-loves-or-aoerestorationa-colonies-old-netherlanders.jpg)