Restaurant Industry Sustainability: Barriers and … Industry Sustainability: Barriers and Solutions...
91
Restaurant Industry Sustainability: Barriers and Solutions to Sustainable Practice Indicators by Emily McConnell Freeman A Thesis Presented in Partial Fulfillment of the Requirements for the Degree Masters of Science Approved April 2011 by the Graduate Supervisory Committee: Hallie Eakin, Co-Chair George Basile, Co-Chair Eric Williams ARIZONA STATE UNIVERSITY May 2011
Transcript of Restaurant Industry Sustainability: Barriers and … Industry Sustainability: Barriers and Solutions...

Restaurant Industry Sustainability:
Barriers and Solutions to Sustainable Practice Indicators
by
Emily McConnell Freeman
A Thesis Presented in Partial Fulfillment of the Requirements for the Degree
Masters of Science
Approved April 2011 by the Graduate Supervisory Committee:
Hallie Eakin, Co-Chair
George Basile, Co-Chair Eric Williams
ARIZONA STATE UNIVERSITY
May 2011

ABSTRACT
Restaurants have a cumulative impact on the environment, economy, and society.
The majority of restaurants are small-to-medium enterprises (SMEs). Review of
sustainability and industry literature revealed that considering restaurants as
businesses with sustainable development options is the most appropriate way to
evaluate their sustainable practices or lack thereof. Sustainable development is the
means by which a company progresses towards achieving an identified set of
sustainability goals and harnesses competitive advantage. The purpose of this
thesis is to identify barriers to implementing sustainable practices in restaurants,
and explore ways that restaurateurs can incorporate sustainable business practices.
Energy consumption, water use, waste production, and food throughput are the
four sustainability indicators addressed in this thesis. Interviews were conducted
with five Tempe, Arizona restaurants, two of which consider their operations to
be sustainable, and three of which are traditional restaurants. Results show that for
traditional restaurants, the primary barriers to implementing sustainable business
practices are cost, lack of awareness, and space. For sustainability-marketed
restaurants, the barriers included a lack of knowledge or legal concerns. The
sustainability-marketed restaurants have energy-efficient equipment and locally
source a majority of their food purchases. There is a marked difference between
the two types of restaurants in perception of barriers to sustainable business
practices. I created a matrix to identify whether each indicator metric was
applicable and present at a particular restaurant, and the potential barriers to
i

implementing sustainable practices in each of the four indicator areas. Restaurants
can use the assessment matrix to compare their current practices with sustainable
practices and find ways to implement new or enhance existing sustainable
practices. Identifying the barriers from within restaurants increases our
understanding of the reasons why sustainable practices are not automatically
adopted by SMEs. The assessment matrix can help restaurants overcome barriers
to achieving sustainability by highlighting how to incorporate sustainable
business practices.
ii
ACKNOWLEDGEMENTS
I would like to thank my thesis committee for their insight,
guidance and contributions to my thesis. Hallie Eakin, PhD, was a co-chair who
provided invaluable background on sustainable food systems, help in my
approach to interview questions, and help in focusing my work and thought from
the micro-analysis of restaurant practices to the broader sustainability domain.
George Basile, PhD, was my other co-chair; his experience working with
businesses on strategies for sustainable practices added a practical as well as
academic vision to my thesis. Eric Williams, PhD, was a committee member who
provided access to information and help in the analysis of the energy and water
data. Kathryn Kyle helped me to edit my thesis. Beyond these roles, the
encouragement I received from all of these team members guided me throughout
this process and each challenged my thinking about sustainability and the
measurements used in assessment. Each is a mentor who played a critical,
supportive role and it was a pleasure to have them as part of my thesis committee.
Finally, I would also like to thank the restaurant owners and managers allowed me
to interview them about their practices and help them identify more sustainable
business practices.
iii
TABLE OF CONTENTS
Page
LIST OF TABLES ...……………………………………………………………..vi
LIST OF FIGURES …...………………………………………………………...vii
INTRODUCTION ………………………………………………………………..1
REVIEW OF LITERATURE …………………………………………………….5
Sustainability ……………………………………………………………..5
Competitive Advantage …………………………………………………..8
Progress Towards Business Sustainability ………………………………11
Indicators ………………………………………………………………...15
Energy …………………………………………………………………...18
Water …………………………………………………………………….22
Waste ………..………………………………………………………...…24
Food ……………………………………………………………………..27
Education and Access to Knowledge ……………………………………31
METHODS ……………………………………………………………………...32
RESULTS ……………………………………………………………………….33
Traditional Restaurants ………………………………………………….36
Sustainability-marketed Restaurants ……….……………………………42
DISCUSSION …………………………………………………………………...45
Energy and Water Savings Potential …………………………………….45
Food Waste Reduction …………………………………………………..48
iv

Page
Clarifying Recycling Challenges and Opportunities ...………………….50 Benefits and Challenges for a Broader Sustainability Perspective ……...52
Indicators and Sustainable Restaurants …………….……………………54
Future Study ……………………………………………………………..60
CONCLUSION ………………………………………………………………….60
WORKS CITED ………………………………………………………………...65
APPENDIX
A SEMI-STRUCTURED INTERVIEW QUESTIONS …………...71
B ASSESSMENT MATRIX ………………………………………75
C LINCOLN PROPERTY MANAGEMENT
COMINGLED RECYLING FLYER FOR TENANTS …………78
D CITY OF TEMPE COMMERCIAL COMIGLED
RECYCLING LIST ……………………………………………..81
v

LIST OF TABLES
Table Page
1. Four Common Sustainability Definition Themes ………………………...…7
2. Industrial and Organizational Barriers ……………………………………..11
3. Energy Savings Potential for Energy Star® Kitchen Equipment …………..21
4. Wasted-Water Data ……………………………………………………...…22
5. Water and Energy Savings Potential for Energy Star® Kitchen
Equipment …………………………………………………………..……...24
6. Energy Star Price Savings and Discounted Payback …………………….35
7. Eligible Equipment, Requirements, and Rebate Levels ……………………46
8. Energy Star Price Savings with Southwest Gas Corp. Rebate and
Payback ……………………………………………………………………47
vi
LIST OF FIGURES
Figure Page
1. Restaurant Industry Indicator Prevalence …………………………………..16
2. Energy use in a restaurant ………………………………………………….19
3. Water use in a restaurant …………………………………………………...23
4. U.S. EPA food waste recovery hierarchy …………………………………..49
vii

INTRODUCTION
This thesis examines sustainability indicators for the restaurant industry.
Sustainability researchers typically focus on renewable energies, climate change,
water resource management, and other environmental issues without examining
the impacts of a specific industry. Because restaurants have significant economic,
environmental, and social impacts, restaurants need to be studied from the
perspective of sustainability. Addressing the inputs and outputs of the industry, its
social influence, and its consumption and use practices will provide us a more
comprehensive consideration of sustainability.
I have chosen to study the restaurant industry for three reasons:
1) increasingly more people are starting to demand local, healthy foods from
restaurants, 2) restaurants are claiming to being either ‘green’ or ‘sustainable’
without certification or standards, and 3) academic literature is starting to define
measurable sustainability indicators for the restaurant industry. The high number
of restaurant locations, frequency of visits, impact on the US economy, and
community-building capacity, coupled with the cumulative environmental
impacts of energy, water and food consumption, and byproducts make a case for
examining the impacts of restaurants.
Currently, no government regulated or mandated measures exist to
monitor restaurants’ sustainability claims. Without standards and regulations,
business owners have been able to hide behind unsubstantiated claims, or plead
ignorance of what constitutes sustainable practices. A few private companies,
1

such as the Green Restaurant Association (GRA) and the Green Seal for
Businesses, offer sustainability consulting services for a fee; for small and
medium-sized restaurants, the fee can be prohibitive. However, the general public
is beginning to demand changes in restaurant practices and services.
My thesis aimed to understand and describe emerging sustainability
practices in the restaurant industry, and to evaluate those practices according to
sustainability principles and indicators. After analyzing data from the industry and
conducting interviews with Phoenix-area restaurant owners and managers, I
developed a flow matrix to help restaurateurs evaluate their sustainability efforts
and identify barriers to achieving their sustainability goals. The matrix can also
help restaurants identify new opportunities to achieve those goals. In the literature
review for my study, I identified recurring themes in the different iterations of
sustainability and sustainable development definitions. In this thesis, I identified
and discussed key sustainability indicators for the restaurant industry, and
examined how restaurant practices align with the sustainability indicators
discussed in the literature.
My study examined the current practices of five Tempe, Arizona
restaurants. The restaurant owners and managers informed me of the barriers they
perceive when considering adopting different types of sustainable business
practices. The primary research question was: What do restaurants identify as
barriers to sustainable practices through the lens of restaurant sustainability
indicators? Subsequent research questions included: Can the identified barriers
2

reveal opportunities for improving sustainability in the restaurant industry? What
are the major environmental impacts of restaurants? And, what are the benefits to
restaurants of incorporating sustainable business practices?
Two of the participating restaurants market themselves as sustainable
(Restaurants A and B), while the other three are traditional restaurants
(Restaurants C – E). Restaurant A is located on property owned by Arizona State
University (ASU), has a capacity of 60 in the dining room, and is a bistro-style
restaurant serving breakfast and lunch to young adults and professionals.
Restaurant A opened in 2006, closed for a time because of the economic collapse,
and reopened for business in September 2010. Restaurant B is located on ASU-
owned property, has a capacity of 250, and serves local, organic, and sustainable
food with a French influence, primarily to ASU students, faculty, and staff.
Restaurant B opened in October 2008 and recently expanded its hours to include
breakfast service. Restaurant C describes itself as a family-owned gastro-pub that
has been in operation since October 2009. Restaurant C has a capacity of 179 and
primarily serves ASU graduate students, faculty, City of Tempe staff, and ASU
Foundation staff. The restaurateur believes that the relatively high price of drinks
accounts for the lack of younger clientele. Restaurant D is located on ASU-owned
property, has a capacity of 40, and describes itself as a coffee bar and café that
serves breakfast, lunch, pastries, and other desserts to a blend of executives and
ASU faculty and students. Restaurant D opened in 2006, and the flow of business
is highly dependent on when ASU is in session. Restaurant E describes itself as a
3
full-service, fine-dining restaurant serving eclectic, contemporary-American food
with a twist. Restaurant E opened in 1987 and serves mostly professionals, local
business people, and ASU faculty and staff.
While the majority of restaurants are considered small businesses, the
restaurant industry has a large impact on the U.S. economy. Overall, restaurants
contribute to four percent of the U.S. gross domestic product, with the overall
economic impact of the restaurant industry expected to exceed $1.5 trillion
(National Restaurant Association, 2010). In 2010, the restaurant industry posted
sales of $577 billion (NRA, 2010). The U.S.’s 945,000 restaurant and foodservice
outlets employ approximately 13 million individuals, and are projected to create
1.8 million new employment opportunities in the next decade (NRA, 2010).
Restaurants have a major impact on the US economy; they also have an
important social function. The high frequency with which people in America eat
at restaurants is responsible for the industry’s success. The average American
eats a meal or snack at a restaurant 265 times per year: that equates to American
adults buying a meal or a snack from a restaurant 5.8 times per week on average
(NRA, 2010). The National Restaurant Association (2010) found that 78 percent
of adults agree that going out to a restaurant allows them an opportunity to
socialize, and 40 percent feel that visiting restaurants makes them more
productive in their day-to-day lives. Neglecting such a major industry and its
impact on community in the discussion of sustainability is detrimental to our
future well-being.
4

REVIEW OF LITERATURE
Sustainability
The complexity created by a globalized economy is compounded by rapid
population growth that propels energy, natural resource, and food consumption to
unprecedented levels. Increasing consumption and population growth stress the
environment, and consumers are becoming aware of their collective impacts.
These conditions created the context from which sustainability emerged.
The definition of sustainability varies according to the arena in which it is
applied. Academics define and redefine sustainability across varied temporal and
spatial scales (Kates et al., 2005). Sustainability literature agrees on the presence
and interconnectedness of environmental, social, and economic domains
(Dasgupta, 2000; National Science Board, 1999; World Bank, 1992; Kaiser et al.,
1995; Neuman, 1999). Sustainability developed as a response to quantitative
environmental and economic data that indicated that current trends in economic
growth were not viable in the long run (Gibson, 2006). Problems in any of the
three domains would directly affect the other two domains for current and future
generations (Sadalla et al., 2005). For example, a breakdown in the environment,
on any scale, would directly impact social and economic realms of activity. Thus,
authentically sustainable practices must involve all three domains of activity
(Berke, 2002).
Definitions of sustainability focus on four areas: education, process (as
opposed to product), community participation, and future conditions
5

(see Table 1). These four areas are common to different definitions of
sustainability, and together suggest a direction for effective sustainability practice.
The literature reviewed here reveals that while each author employs a unique
definition of sustainability or sustainable development, there are crosscutting
themes that suggest how sustainability can be put into practice. The four focal
areas of sustainability can be applied to the restaurant industry. For example,
owners must be educated on the collective impacts of their businesses and take
responsibility to educate consumers. Owners must be aware that sustainability is
not a product that can be achieved overnight, but a dynamic, long-term process.
The industry stresses the environment and the food system; therefore,
restaurateurs should be proactive to avoid creating negative future conditions.
6

Table 1 Four Common Sustainability Definition Themes Themes Definitions Education Constituting the capacity
Becoming increasingly aware
Lack of knowledge is a barrier Process-based Social practice
Cumulatively producing Is a process Defined in practice and action Implies a process
Future Conditions Long-term vitality of all generations
Communities anticipate
The needs of current & future generations
Viable in the long run
Sustained life over time Vision of the future
Community Participation Share involvement & take collective responsibility
Responsibility for their actions
Active participation & participatory engagement
Requires stakeholder participation Requires joint proactive effort Public involvement
________________________Guiding our actions
I propose that we need to distinguish between sustainability and
sustainable development to create a framework for applying sustainability
practices in the restaurant industry. Sustainability refers to an achieved desired
state or set of conditions that persist over time (Maclaren, 1996). Sustainable
development refers to the process by which an entity attains sustainability. In
business, sustainable development is the means by which a company progresses to
achieving the set of conditions that it has identified as sustainability goals.
Sustainability goals adapt to changing physical, social, and economic conditions,
and steps taken to reach goals must respond to the dynamic complexity of the
systems within which the business exists. Increased efficiency in natural resource
7

use and decreased production of waste and pollution are measureable markers of
progress towards sustainability. These markers can be used for large and small
businesses alike, including restaurants.
Competitive Advantage
Small and medium enterprises (SME’s) comprise the majority of
businesses in the restaurant industry. Seventy percent of all restaurants are
classified as small businesses; 91 percent of all restaurants have fewer than 50
employees (National Restaurant Association, 2010). SME’s have not traditionally
engaged in sustainable business practices because of owner and employee
attitudes, varied opinions on environmental matters, cost barriers to implementing
environmental management, and lack of financial incentives to purchase high-
efficiency appliances (Bubna-Litic & de Leeuw, 1999). SMEs identify
environmental management as important to their businesses, but struggle with
implementation. Waste management, water efficiency, and energy efficiency are
important environmental areas related to sustainability in the restaurant industry
(Bubna-Litic & de Leeuw, 1999). Many SME owners state that financial
incentives would motivate them to increase their environmental-management
efforts. SME owners state that the major barriers to environmental management
are time, cost, and government policies.
People affect business practices. Therefore, the social domain is as
significant to businesses as the economic and environmental domains (Pfeffer,
1995). Effective management can promote similar environmental values among
8

employees. Clear communication of the company values and mission statement is
essential to the success of the company. A clearly defined business model
conveys the company’s principles to employees and the public.
Competitive advantage is dynamic. To maintain an advantage, a business
must continually evaluate, adapt, and respond to outside pressures while ensuring
that any changes are explained to employees. Communicating the sustainability
goals of the business to employees is key to unhindered application of
sustainability practices.
Competitive advantage is tied to public perception of an industry’s
positive and negative impacts. Public awareness of environmental impacts has
increased as the risks posed by industrial activities have been increasingly
publicized. “NIMBY” (not in my backyard) entered the general public’s
vocabulary when the media began tapping into people’s concerns about the
environmental and health impacts of industrial activity. The public “no longer
accepts major environmental damage as the price for economic opportunity” (Post
& Altman, 1994, p. 66). Companies that do not implement environmental or
‘green’ initiatives may feel pressure from the public to make changes. Seventh
Generation, Patagonia, and Smith and Hawkins are companies that have embraced
environmental values and produced environmentally friendly goods, experiencing
increased profits as a result (Post & Altman, 1994). The public’s demand for
environmentally friendly products is the main reason companies produce them.
By meeting the demand, companies achieve higher profit margins.
9
‘Green’ companies have gained a competitive advantage. Competitive
advantage is a business principle that allows companies to adapt to environmental
issues confronting a business (Welford, 1998). The advantage depends on the
internal culture of the company and the social influences that define the
acceptability of the company’s economic and environmental behavior (Oliver,
1997). The choices made about materials efficiency, employee commitment, and
the predictions made about future regulations all affect a company’s competitive
advantage. Good choices and accurate predictions increase the efficiency and
long-term sustainability of the business. A company can rise above others in the
same industry by using strategies and structures (Oliver, 1997) that increase
economic profitability and create a sustainable competitive advantage.
Competitive advantage also requires owners and upper management to
allocate resources and distribute products more efficiently than their competitors
(Reed & DeFillippi, 1990). Streamlining resources creates a closed-loop
production process that produces an additional advantage. Being the first to
provide a product gives a company a capital advantage. Staying ahead of
technology regulations saves money in development, increases profit margins,
and establishes the company as an original, trusted provider. Thus, the pursuit of
competitive advantage can motivate sustainable development.
A business can increase its competitive advantage by engaging in
education and community outreach. For example, research studies have shown
that consumers prefer ‘green’ products to conventional ones (Laroche et al.,
10
2001). Therefore, companies that make consumers aware of the ‘green’ aspects of
their products or production processes are likely to increase their competitive
advantage. Restaurants can gain competitive advantage by requiring staff not only
to prepare and serve food, but also engage patrons in the restaurant’s
environmental efforts. By responding to public demand for ‘green’ products and
services, restaurants will not only enjoy a competitive advantage, but also
contribute to sustainable development of the restaurant industry.
Progress Towards Business Sustainability
Simply changing a company’s mission statement will not help the
company become environmentally friendly (Frederick, 1992). Industrial and
organizational barriers, as shown in Table 2, need to be addressed before progress
towards sustainability is possible.
Table 2 Industrial and Organizational Barriers Industrial Barriers Organizational Barriers Capital costs Attitudes of personnel Community concern Upper management adaptability Regulatory constraints Quality of communication Information and technical knowledge
Source: Post & Altman, 1994
Each company has unique issues. Owners and upper-level managers must
be flexible enough to try out different ways of doing things if barriers are to be
overcome. But flexibility alone is not enough. A company must develop a
coherent business plan to address the barriers. The plan should outline specific
steps for surmounting barriers and include ways to measure progress towards
11

becoming a sustainable company. Macnaughten and Jacobs (1997) focus on
public identification and cultural barriers to participation. Public identification
emphasizes participation and relates to “whether the public [identifies] with the
concept of sustainable development” (Macnaughten and Jacobs, 1997, 5).
Involving ordinary citizens in the decision-making and implementation processes
directly impacts social and economic drivers (Rio Earth Summit, 1992;
Macnaughten and Jacobs, 1997). The influence of the group may determine one’s
own personal values. Minimizing industrial and organizational barriers (Table 2)
gives a company the potential to be a sustainable business.
Creating a plan to address actual and perceived barriers to sustainable
practices helps companies overcome the industrial and organizational barriers.
The five steps in the Nidumolu el al. (2009) sustainable business development
theory help create a business plan that measures a company’s progress towards
becoming sustainable. If no plan existed, leadership could be questioned and
progress would be unclear. General Electric, Hewlett-Packard, and Wal-Mart
have demonstrated how, by following the steps outlined below, companies can
become environmentally friendly, while lowering costs and increasing revenues.
Step 1: View Compliance as Opportunity
Voluntary compliance provides opportunity because anticipating
regulatory changes saves companies money and creates a competitive
advantage. Companies should focus on meeting and exceeding current
national regulation standards.
12

Step 2: Make Value Chains Sustainable
Businesses must reduce pre- and post-consumer waste by using eco-
friendly materials, minimizing or eliminating packaging, and creating
closed-loop systems with suppliers. To accomplish this step, businesses
must analyze their supply chains and streamline product sources.
Step 3: Design Sustainable Products and Services
Designing a sustainable product line or service is one of many start-up
expenses. Successful development depends on understanding the
environmental concerns of consumers and examining the inputs and
outputs of the product or service.
Step 4: Develop New Business Models
As progress towards becoming a sustainable business continues, a
business must rethink and reinvent traditional business relationships.
Streamlining traditional business practices by combining separate
functions into a single process increases efficiency and decreases raw
material consumption. It can also make access to the business’s product or
service more convenient for the consumer. Executives must question
existing models and act entrepreneurially to develop a more successful
business model.
Step 5: Create Next-Practice Platforms
By changing business and management paradigms, businesses influence
profitability, the environment, and the values of the consumer.
13

By following these five steps, businesses put the philosophy of sustainability into
practice. Each company adopts each step at its own pace. The steps incorporate
the four areas of sustainability as a function of progress towards becoming a
sustainable business.
Nidumolu et al. (2009) used the five-step sustainable business
development theory to analyze the progress of large multi-national corporations
toward sustainable practices. To apply the theory to SMEs (70 percent of
restaurants are SMEs), it must be adapted. For SMEs, Step 1 may not include
expanding to a larger market. The tenet of ‘compliance as opportunity’ refers to
the adoption of environmentally efficient practices at all scales. SMEs should
consider the regulations passed by larger industries and surrounding states as
predictive of future regulations in their local area. Staying ahead of compliance
regulations provides a competitive advantage over businesses not anticipating
future trends, and a marketing advantage with consumers concerned with local
environmental impacts. Gaining a loyal customer base before competitors arrive
can lead to financial stability in the future. In the restaurant industry, Step 2 can
be accomplished through increased communication with suppliers and local food
providers. Step 3 is applicable to restaurants that develop seasonal menus to
reflect local food availability. Eating locally increases food quality and consumer
awareness of the connection between source and consumption. Step 4 suggests
that restaurants should annually review their sustainability goals and measure
progress within each of the restaurant sustainability indicators. The assessment
14

matrix developed as part of this study is a tool that can be applied in Step 4. Step
5 is a future-oriented step. Once a restaurant has met its initial goals for
sustainability, it may add new indicators to the original set. To remain sustainable,
restaurateurs will need to keep up with trends in sustainability and remain flexible
to adapt to the changing environment.
Indicators
Indicators are characteristics that we can measure to assess progress
towards a goal (Kates et al., 2005). Businesses need to develop standardized
indicators to measure progress towards achieving sustainability goals (Maclaren,
1996). The progress towards these goals is what we call sustainable development.
Restaurant industry literature describes indicator sets to measure the progress of
individual restaurants (Legrand et al., 2010; JingJing, et al., 2008). Legrand et al.
(2010) developed a set of restaurant indicators that includes all of the aspects of a
single restaurant. A standardized indicator set would provide restaurants with the
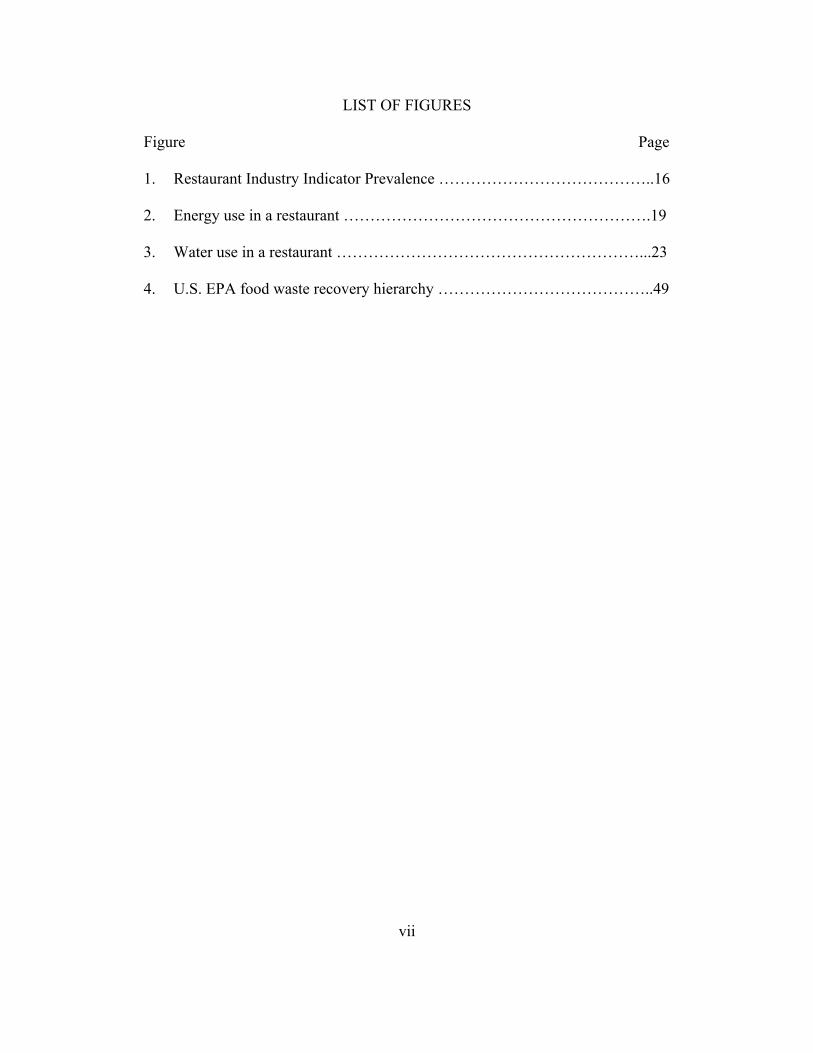
same way of measuring sustainable practices. The top four restaurant
sustainability indicators, proposed by numerous authors (see Figure 1), are
energy, water, waste, and food source. Focusing only on food source and
building-design indicators, such as LEED, is insufficient because food storage and
preparation, dining room components, and waste production have intensive
environmental impacts. I propose that greater weight should be given to energy,
water, waste, and food-source indicators because they have the most impact on
the environment, and across the literature, a majority of authors agree that these
15

four indicators should be included. The other indicators mentioned in the
literature, such as site choice, construction and design (C & D), furniture and
fittings, and corporate social responsibility (CSR), all need to be analyzed as well.
However, these indicators have not been universally recognized in the literature,
and they do not have as great an environmental impact as the top four indicators
do. Figure 1 shows the restaurant indicators mentioned in the restaurant
sustainability literature; energy, water, waste, and food are the most prevalent.
Therefore, the assessment matrix created for this study includes only these four
indicators. These are the indicators restaurants should focus on first.
Figure 1. Restaurant Industry Indicator Prevalence.
Sustainable development is a process that focuses on providing for future
needs. Therefore, indicators are necessary but not sufficient to assess a
restaurant’s progress in sustainable development because they can only measure
current states. The assessment matrix created provides a framework for
restaurants to assess current practices, identify gaps in these practices, and
16
0 1 2 3 4 5 6 7 8 9
Food
Plastics/Paper
Energy
Water
C&D
Furniture/fixings
Waste
CSR
Prevalence in literature of restaurant industry indicators

anticipate what kinds of practices will be necessary to operate sustainably in the
future.
The future-oriented nature of sustainable development involves education,
and requires community participation. Restaurants are more than material inputs
and outputs. Restaurants are a people-oriented industry. The restaurant
sustainability indicators noted, in Figure 1, do not address the social impacts or
the role of consumers because the metrics focus on practices and not on the sense
of identification and importance restaurants play in culture and community
building. The barriers to sustainable practices that have been identified by
restaurateurs and are captured in the assessment matrix demonstrate the role
restaurant patrons play in a restaurant’s sustainability efforts. The public can
identify the impacts of energy, water, waste, and food sources on the
environment. Therefore, a restaurant should find ways to educate diners about its
sustainability practices during the dining experience. This opportunity to shape
future demands through education and thus provide for future needs has not yet
been examined in the literature on restaurant sustainability. The current set of
indicators does not capture the importance of education and community
participation in sustainability assessment.
The restaurant industry is in the process of achieving sustainability.
However, most restaurants, including those that are trying to reduce energy and
water consumption, have not achieved full sustainability. Therefore, all
restaurants are situated at some point on a continuum of sustainable development.
17

Energy
The restaurant industry is the number-one electricity consumer in the retail
sector (Green Restaurant Association, 2005). Energy use in commercial and
industrial buildings in the U.S. contributes 45 percent of national emissions of
greenhouse gases (GHG) linked to global climate change. Electricity use is
responsible for roughly three-quarters of the GHGs (Energy Star, 2010). In
Florida, restaurants emit more than 30 billion pounds of CO2 and 84 million
pounds of SO2 into the air (Hu, 2010). Increasing restaurants’ energy and water
efficiency can save restaurant owners an estimated 10 to 20 percent on utility bills
and reduce GHG emissions (Energy Star, 2010).
Energy costs represent 30 percent of a typical commercial building's
annual budget, and increase at an average rate of 6 - 8 percent per year.
Restaurants use five times more energy per square foot than other commercial
buildings and five times more energy in the kitchen than in the rest of the building
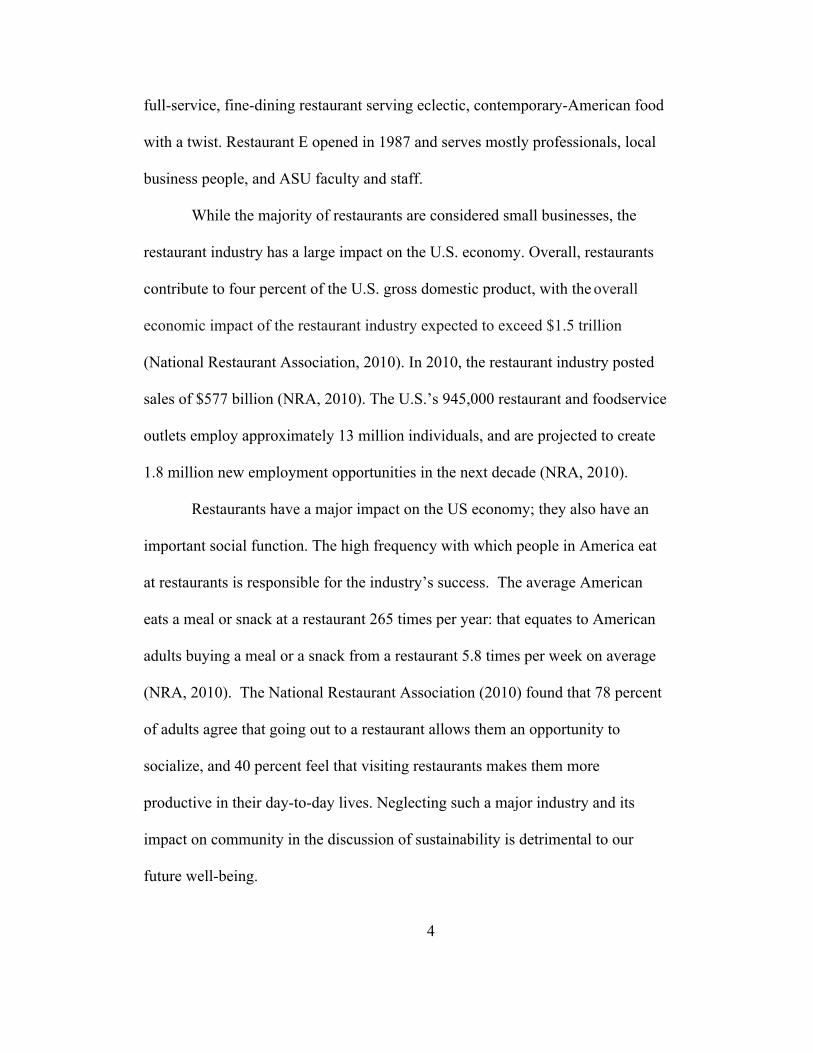
(Johnson, 2010). These figures make the case for using energy-efficient
equipment in the kitchen. Figure 2 represents the energy intensity of use in
different areas of a restaurant. Increased efficiency in natural-resource use, and
decreased production of waste and pollution are measureable markers of progress
towards sustainability. These markers can be used be large and small businesses
alike, including restaurants.
18

Figure 2. Energy use in a restaurant.
Source: (Energy Star, 2010)
This thesis focuses on Energy Star appliances for the energy and water
sectors of the sustainability assessment, because Energy Star is the national
standard for efficiency. Energy Star is certified by the U.S. EPA to provide
appliances that are energy and water efficient.
Restaurants that use appliances with the ENERGY STAR label consume
about 40 percent less energy than typical commercial buildings. A federal tax
deduction of up to $1.80 per square foot is available to owners of new or existing
commercial buildings that cut at least 50 percent of their energy costs, thus
meeting ASHRAE Standard 90.1-2001. Partial federal tax deductions of up to
$.60 per square foot are available for "green" measures affecting any one of three
building systems: the building envelope, lighting, or heating and cooling systems.
Building construction and design (C & D) is not included in the selected
19
Sanitation 18%
Food Preparation
35% HVAC 28%
Lighting 13%
Refrigeration 6%
Average Energy Consumption in a Full-service Restaurant in British Thermal Units [Btu]

restaurant sustainability indicator areas. Heating ventilation and air conditioning
(HVAC) is one component of C & D. HVAC consumption comprises 28 percent
of the total energy use in restaurants (Energy Star, 2010); however, most
restaurant owners do not have control over the C & D of the building that the
restaurant is in. The restaurant owners and managers interviewed stated that they
believe about 90-95 percent of all restaurants are leased or rented spaces. Three
out of the five restaurants in this thesis rent or lease the restaurant space. The two
restaurant owners included in this thesis, stated their situation was unique and that
most restaurateurs lease. One of the owners started with a lease of the building
and then bought the building and the adjoining property to expand. It is important
to note that this owner started by leasing the location because like the three other
restaurants, this owner did not have control of the building HVAC or C & D until
he purchased the property. Therefore, restaurant owner who do not own their
premises should not be held accountable for a lack of energy-efficient HVAC or
building C & D. As noted by the CEE (2010) and Energy Star (2010), lighting
and HVAC are typically the dominant energy consumers in commercial buildings.
Restaurants are unique commercial buildings that allow innovative, energy-
efficient technologies to address food preparation, sanitation, and refrigeration
consumption. These areas comprise 59 percent of a full-service restaurant’s
energy consumption.
20

Energy indicators (Legrand et al., 2010; JingJing et al., 2008) in the assessment
matrix are:
1. Electrical or gas equipment (refrigeration, boilers, fryers, etc.) are certified
energy-efficient.
The current energy indicators focus on energy-efficient equipment. Energy
Star certified kitchen equipment include refrigerators, freezers, fryers, holding
cabinets, pre-rinse spray valves, steamers, griddles, ice machines, and ovens.
Electrical and natural gas versions of the equipment exist. I focus primarily on gas
models because, in Arizona, the only rebates available for Energy Star
equipment are from Southwest Gas Corporation. Table 3 shows the annual energy
savings potential for commercial restaurant equipment.
Table 3 Energy Savings Potential for Energy Star® Kitchen Equipment Savings Equipment Type Actual Savings Potential (%) Refrigerator (solid door) 55 – 554 (kwh/yr) 26 – 38% Refrigerator (glass door) 326 – 608 (kwh/yr) 23 – 47% Freezer (solid door) 458 – 3713 (kwh/yr) 29 – 39% Freezer (glass door) 1562 – 7063 (kwh/yr) 38 – 44% Fryer 360 (therms/yr) 25 – 35% Source: CEE, 2010 For refrigerators and freezers, the solid door models use less total energy (kwh/yr)
per unit than glass door models. The variation in actual savings and savings
potential (%) relates to the range of different volumes depending on the model.
The percentage of savings potential between standard and Energy Star equipment
decreases for glass door refrigerators and freezers the larger volume the unit is.
21
Water
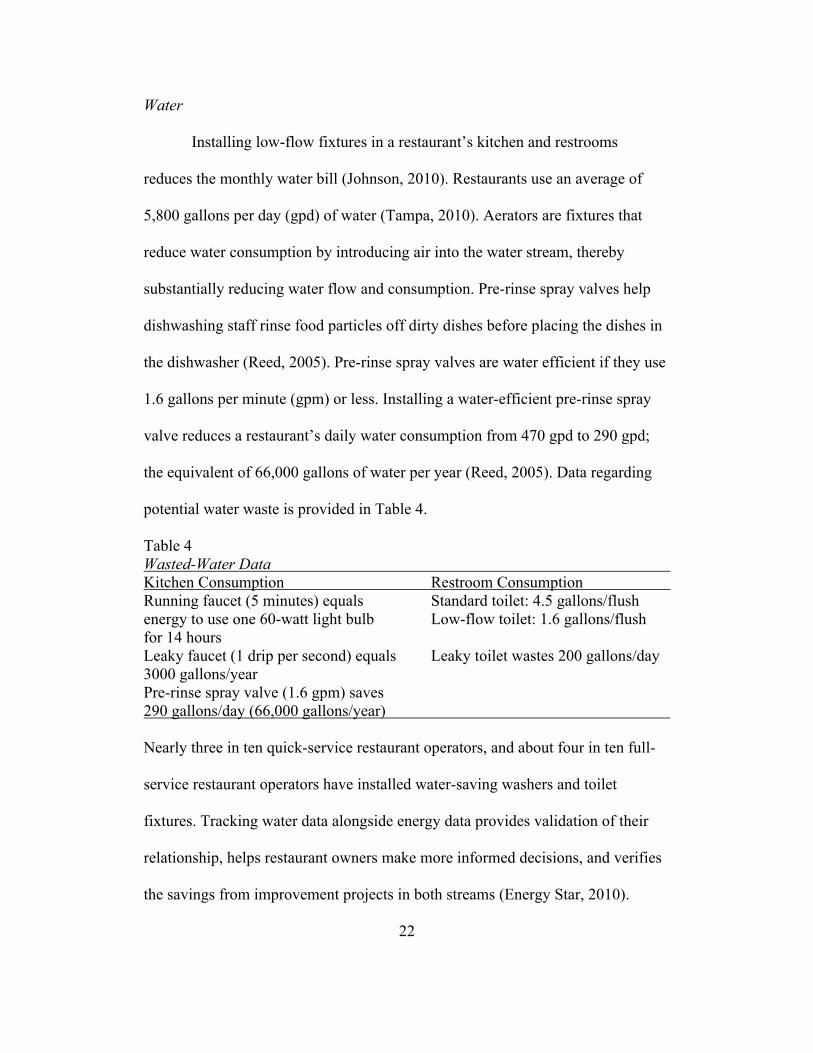
Installing low-flow fixtures in a restaurant’s kitchen and restrooms
reduces the monthly water bill (Johnson, 2010). Restaurants use an average of
5,800 gallons per day (gpd) of water (Tampa, 2010). Aerators are fixtures that
reduce water consumption by introducing air into the water stream, thereby
substantially reducing water flow and consumption. Pre-rinse spray valves help
dishwashing staff rinse food particles off dirty dishes before placing the dishes in
the dishwasher (Reed, 2005). Pre-rinse spray valves are water efficient if they use
1.6 gallons per minute (gpm) or less. Installing a water-efficient pre-rinse spray
valve reduces a restaurant’s daily water consumption from 470 gpd to 290 gpd;
the equivalent of 66,000 gallons of water per year (Reed, 2005). Data regarding
potential water waste is provided in Table 4.
Table 4 Wasted-Water Data Kitchen Consumption Restroom Consumption Running faucet (5 minutes) equals Standard toilet: 4.5 gallons/flush energy to use one 60-watt light bulb Low-flow toilet: 1.6 gallons/flush for 14 hours Leaky faucet (1 drip per second) equals Leaky toilet wastes 200 gallons/day 3000 gallons/year Pre-rinse spray valve (1.6 gpm) saves 290 gallons/day (66,000 gallons/year) Nearly three in ten quick-service restaurant operators, and about four in ten full-
service restaurant operators have installed water-saving washers and toilet
fixtures. Tracking water data alongside energy data provides validation of their
relationship, helps restaurant owners make more informed decisions, and verifies
the savings from improvement projects in both streams (Energy Star, 2010).
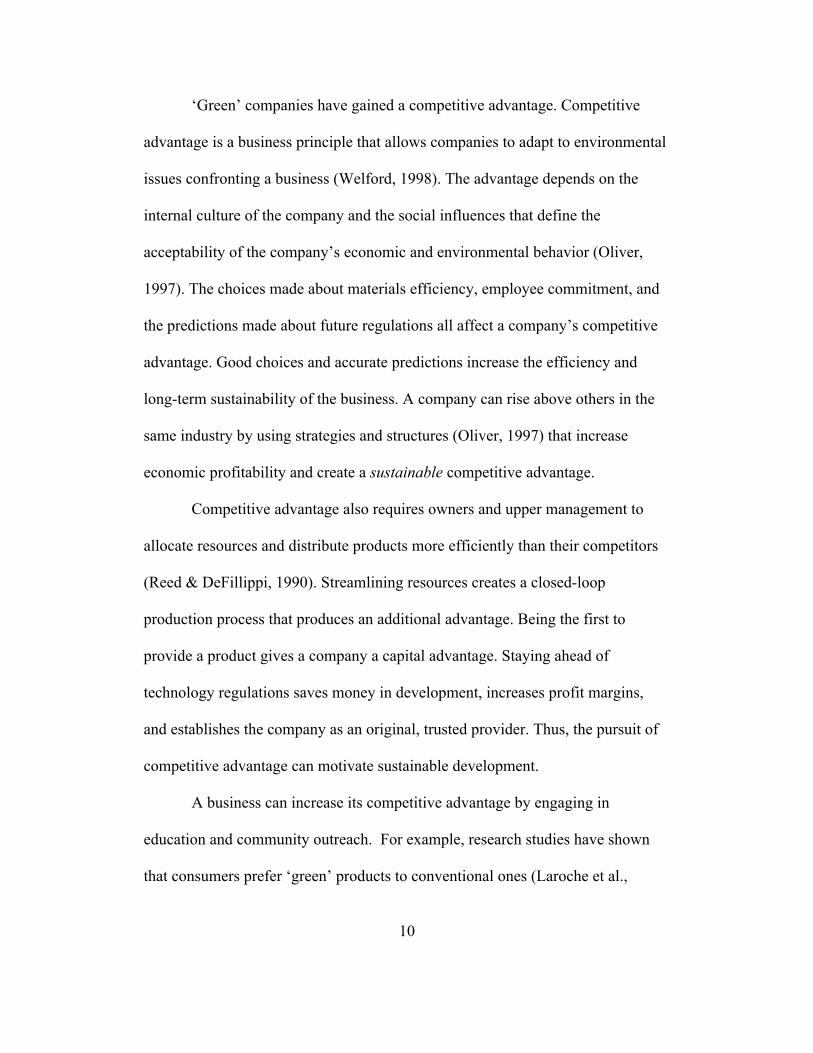
22

Figure 3 represents the percentage of water consumption in different areas of a
restaurant.
Figure 3. Water use in a restaurant.
Source: Calculated from MWD audit data of 89 restaurants (MWD, 2002) &
(Pacific Institute, 2010)
Water indicators (Legrand et al., 2010; JingJing et al. 2008) in the assessment
matrix are:
1. Equipment (pre-rinse spray valves, aerators, etc.) is certified water-
efficient.
2. Low-flow toilets are installed in the restrooms.
3. Waterless urinals are installed in the men’s restrooms.
Energy Star certified equipment for kitchen appliances that use water,
also consume energy. Table 5 reflects the equipment that use both water and
energy, and the potential savings per unit if an Energy Star appliance is used in
place of a standard appliance.
23
Kitchen 46%
Restroom 34%
Other 12%
Landscaping 6%
Cooling 2%
Water Use, by End Use, in the Restaurant Industry
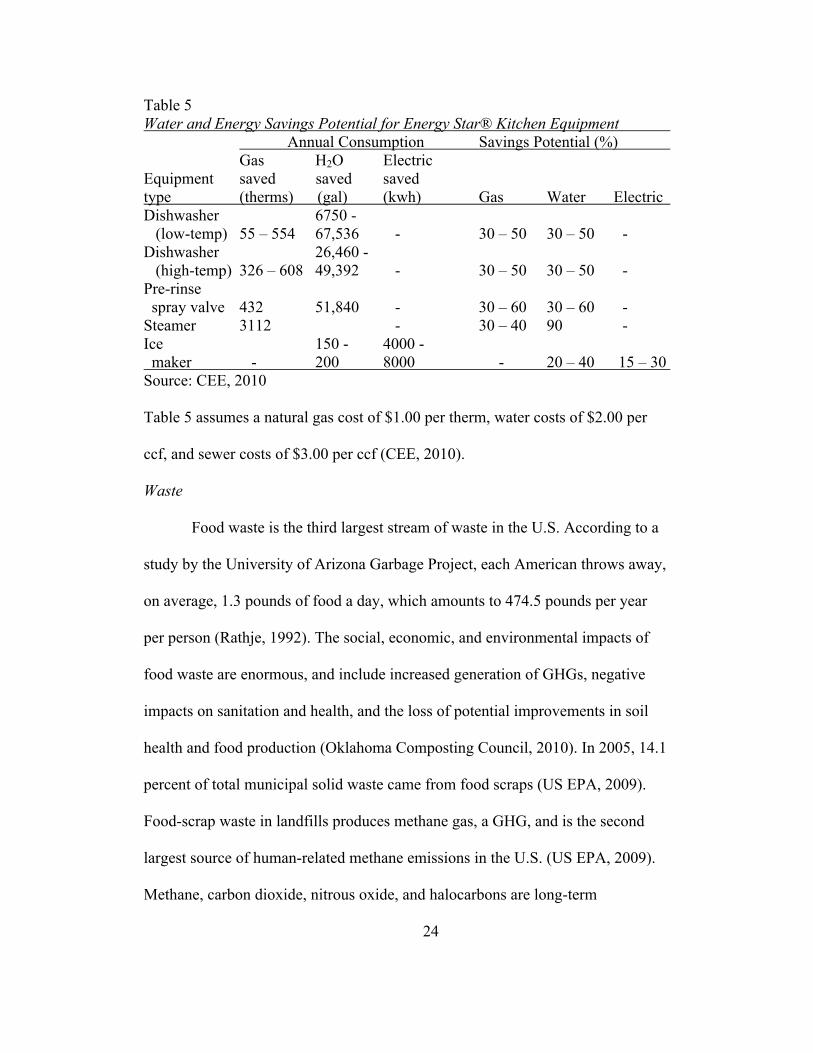
Table 5 Water and Energy Savings Potential for Energy Star® Kitchen Equipment Annual Consumption Savings Potential (%)
Gas H2O Electric Equipment saved saved saved type (therms) (gal) (kwh) Gas Water Electric Dishwasher 6750 - (low-temp) 55 – 554 67,536 - 30 – 50 30 – 50 - Dishwasher 26,460 - (high-temp) 326 – 608 49,392 - 30 – 50 30 – 50 - Pre-rinse spray valve 432 51,840 - 30 – 60 30 – 60 - Steamer 3112 - 30 – 40 90 - Ice 150 - 4000 - maker - 200 8000 - 20 – 40 15 – 30 Source: CEE, 2010 Table 5 assumes a natural gas cost of $1.00 per therm, water costs of $2.00 per
ccf, and sewer costs of $3.00 per ccf (CEE, 2010).
Waste
Food waste is the third largest stream of waste in the U.S. According to a
study by the University of Arizona Garbage Project, each American throws away,
on average, 1.3 pounds of food a day, which amounts to 474.5 pounds per year
per person (Rathje, 1992). The social, economic, and environmental impacts of
food waste are enormous, and include increased generation of GHGs, negative
impacts on sanitation and health, and the loss of potential improvements in soil
health and food production (Oklahoma Composting Council, 2010). In 2005, 14.1
percent of total municipal solid waste came from food scraps (US EPA, 2009).
Food-scrap waste in landfills produces methane gas, a GHG, and is the second
largest source of human-related methane emissions in the U.S. (US EPA, 2009).
Methane, carbon dioxide, nitrous oxide, and halocarbons are long-term
24

GHGs (IPCC, 2007). It takes 7 to 10 years for methane to break down in the
biosphere, while carbon dioxide cycles through the system and turns over in the
biosphere every three years. Methane accounts for 20 percent of total greenhouse
effects. Methane has a 21 times greater impact per unit mass basis on climate than
carbon dioxide (UNEP, 2001).
An average restaurant in the U.S. produces approximately 50,000 pounds
of waste every year (Nielsen, 2004). At least 50 percent of the waste generated at
a restaurant is food (Sonoma County WMA, n.d.). Food waste takes the form of
pre- and post-consumer waste. Restaurants can reduce pre-consumer waste by
tracking spoilage. Spoilage includes all the food in the kitchen that expires before
it can be used. Tracking spoilage is useful in adjusting purchases, thereby cutting
food costs.
Americans throw away more than 25 percent of all the food served to
them in restaurants. Restaurants can reduce post-consumer waste by tracking the
post-consumer waste. Food waste tracking is a source reduction technique.
Automated scales and tracking programs such as the ValuWaste Tracker (Lean
Path, 2010) provide a simple and quick means of tracking the type of food not
consumed by customers. Restaurants can use this information to make changes to
their menu, adjust portion sizes, and inform food purchasing. These are all
additional ways that restaurants can further reduce their direct food costs.
Besides source reduction through food waste tracking, composting is one
of the end-of-the-pipe possibilities for managing food scrap waste. Depending on
25

logistics, opportunities exist for composting in restaurants (Minnesota Solid
Waste Management Coordinating Board, 2000). Some states regulate food-scrap
composting. Most successful food-scrap composting is done in the kitchen with
pre-consumer food waste. Restaurateurs who compost their pre-consumer
organics typically must seek out partnerships with local food composters.
Organics primarily include animal and vegetative products, but also includes
other manufactured compostable materials such as soiled paper products, or
compostable utensils and cups. Some restaurants, like the Rockfish in Annapolis,
MD and Elevation Burger in Falls Church, VA, have found contacts within their
local community and are able to process food waste and recyclables at no cost.
However, making these connections is a challenge as is hauling compost waste to
the processer are prohibitive measures for restaurants. SMEs that implement a
composting or recycling program may incur a higher disposal cost. Using
recycling and composting bins, sustainable take-out containers, and “green”
signage are all ways to minimize waste, highlight a restaurant’s environmental
practices, and educate consumers about their personal dining impacts (US EPA,
2009). Benefits from composting include an end-product that can be used to help
improve soils, grow the next generation of crops, and improve water quality.
Restaurants must consider not only food waste, but also other products
that can be recycled. Glass, clean paper, cardboard, plastic wastes are usually able
to recycle through municipal recycling programs. Comingled recycling programs
allow commercial businesses to divert more products from the landfill and
26

harness downstream reuse values.
Waste indicators (Legrand et al., 2010) in the assessment matrix are:
1. The approach “reduce, reuse, and recycle” is followed; staff as well as
suppliers are trained and encouraged accordingly.
2. Sorting and collecting systems for waste with separate bins exist.
3. Paper products contain recycled content.
4. The use of plastic, aluminum, and polystyrene foam is discouraged.
5. Organic waste is reused or composted.
6. Grease and oil waste is collected and properly disposed or reused.
Food
Restaurateurs view food as something they prepare, serve and throw out.
They do not necessarily consider how the food they serve affects the food system
as a whole. Restaurants can affect what food is produced, farming profitability,
food waste, and the environmental intensity of food production. Indirect effects
impacts include resource origin, agricultural and harvesting practices, and the
packaging and distribution of goods (Heller & Keoleian, 2003). Offering a
seasonal menu is one way restaurants communicate high quality of food and
decreased Enforcing seasonality in the menu is restaurants communicate the value
they place on high-quality of food and environmental stewardship (Sundkvist et
al., 2005). Restaurants need a reliable supply of high quality foods to provide
consistent service to consumers. The chef and those involved in the restaurant’s
food procurement can influence and communicate with local farmers
27

about quality, taste, and demand for local and/or organic foods in the restaurant.
Food costs are one of the most important line items for a restaurateur.
Food and beverage costs represent about 33 cents of every dollar in restaurant
sales (NRA, 2009). Food is the most integral part of the restaurant experience.
The National Restaurant Association (NRA) found that the following trends are
popular in today’s restaurants: locally grown, sustainable and organic food and
beverage items; nutritionally balanced children's dishes and healthy children’s
side items; half portions or smaller portion for a smaller price; and gluten-free and
food-allergy conscious menu items (NRA, 2010).
Local food is defined as food that is grown within 50 to 250 miles of where it is
consumed (Johnson, 2010). Restaurant B’s produce is 90 percent locally sourced
according to the restaurant’s executive chef. That means that the produce comes
from within 100 miles of Restaurant B. Restaurant B partners with twelve farms
in and around the Phoenix area to meet its produce needs. Labeling and promoting
local foods in the restaurant raise public awareness of the environmental and
quality that accrue from local food. This awareness by can subsequently stimulate
the local economy by creating a higher demand for local food (Kirby, 2006).
Integrating local foods into the menu helps restaurants increases return visits from
customers and appeals to new customers. It also helps local farmers. The cost of
food typically represents 33 percent of the budget for a full-service restaurant.
Produce purchases likely represent 9 percent of food costs to restaurants (NRA,
2010).
28
When a restaurant uses food from national providers, it looses its
connection with growers and the seasons while grossly inflating food miles
traveled (Sundkvist et al., 2005). Restaurant B’s chef noted that it is the chef’s
responsibility to understand and be able to explain to the staff and consumers why
a piece of produce grown in a particular manner, from a particular type of farming
practice, tastes better than the same produce that has travelled over a thousand of
miles from where it has grow. Most food items travel an average of 1500 miles on
the journey from the farm to the distributor to the consumer (American Dietetic
Association, 2004). This distance is on average 50 percent further than the food
miles traveled in 1979 (Sudkvist et al., 2005). Conventional food travels 27 times
further than locally sourced food. Food miles are important to consider in
environmental impact because the transportation, including from producer to
retail, accounts for 15 percent of the GHG emissions from the food system
(Weber and Matthews, 2008). It is the chef, who verbally, and through the
composition of dishes can tell a story about the food. Sundkvist et al. (2005)
support the strengthening of communication links along the food chain as a means
to promote sustainable development in food systems. Restaurant B’s chef
recommends taking responsibility to communicate with farmers and educate
consumers, which aligns with the education and community participation themes I
present in this thesis.
The frequency with which a restaurant provides food highlights the major
role restaurants play in the economic makeup of the U.S. The average American
29

spends $910 per person per year on food consumed outside the home (NRA,
2009). Consumers spend an average 4.2 percent of their income on restaurant
food. Restaurants comprise 10 percent of the U.S. economy (GRA, 2009) making
restaurants as an important player in society.
Food indicators (Legrand et al., 2010) in the assessment matrix are:
1. Purchase a percentage of organically certified food products used for food
preparation.
2. Purchase a percentage of locally sourced food products used for food
preparation.
3. Adjust menu to use seasonal food products.
4. Purchase a percentage of sustainably source seafood.
5. Options of vegetarian, meat, and fish dishes offered on the menu.
6. Presence of organic wines offered on the wine list.
7. Use “Fairtrade” certified products.
8. Purchase a percentage of food products purchased directly at the local
farm with attention being paid to pay fair prices.
9. Options of meals that cater to specific dietary needs and food-allergies
(gluten-free/lactose-free choices are available).
10. Kitchen staff is trained on methods that enhance the dietary goals and
guidelines of the country (low fat, reduced salt, etc.).
11. The menu is labeled in regards to menu choices such “low fat,”
“vegetarian,” “gluten-free,” “vegan,” etc.
30

12. The menu communicates sustainable practices and initiatives of the
restaurant.
Education & Access to Knowledge
Customer awareness of sustainability practices may prompt them to look
for such practices in the restaurants they patronize, which in turn may prompt
restaurants to adopt such practices. In 2010, 56 percent of adults are more likely
to frequent a restaurant that offers organically grown or raised, or environmentally
friendly food (NRA, 2010). To understand patron motivations it is important to
understand patron demographics. Some patrons are willing to pay more to
purchase products with a lower environmental impact; others are not (Laroche,
Bergeron & Barbaro-Forteo, 2001; Hu et al., 2010). Both willing and unwilling
groups would choose to patronize an environmentally conscious restaurant over a
traditional restaurant (Hu et al., 2010).
Information cards, menu notes, and window displays help inform patrons
about a restaurant’s environmental efforts (Hu, 2010). Greater market
opportunities encourage business owners to participate in more environmentally
friendly activities. Hu (2010) notes the growing prevalence of certifications, such
as that provided by the Green Restaurant Association, as a means to tie
sustainability to business practices. Certifications are emerging as a response to
growing public concern about environmental and social impacts of the restaurant
industry. However, the lack of government standards and enforcement in the
certification process leads to confusion and decreased credibility when a
31
restaurant lays claim to being a sustainable business. Indicators fill the gap in
standards by providing a valid basis for certification.
METHODS
There are many definitions of sustainability and sustainable development.
I reviewed the definitions and identified four common themes of sustainability:
education, process (as opposed to product), community participation, and future
conditions. I identified energy, water, waste, and food as the most commonly
discussed areas in restaurant sustainability literature that had the greatest
environmental impact. I applied the indicator metrics developed by Legrand et al.
(2010) to each of the four selected indicator areas. Then I interviewed five
Tempe, Arizona restaurateurs to discover their current practices. Using the
information from these interviews, I identified common barrier to the four
indicator areas. I used statistics from the National Restaurant Association, Energy
Star for Restaurants and Small Businesses, the Green Restaurant Association,
and Green Seal for Businesses confirmed the environmental and economic
impacts of restaurants.
I developed a set of semi-structured interview questions. The questions
were intended to get at the culture of the restaurant, its perceived impacts on
environment, economic feasibility, costs, and business strategy, and social
impacts of restaurants. The complete survey is in Appendix A. The answers to the
questions sometimes determined the follow-up question. The flow of the
interview allowed restaurateurs to attend to business matters, ask questions of
32
their own, and allowed the interviewer to modify and ask additional questions as
needed. In the semi-structured interviews, the SME restaurateurs identified
barriers to different sustainable business practices in the areas of energy, water,
waste, and food. Additionally, the interviews helped identify a restaurant’s current
stage in the business development theory proposed by Nidumolu et al. (2009).
I developed the assessment matrix to help restaurants identify whether the
standards set by the metrics were attained, not attained or not applicable. If the
standard is not applicable, it does not detract from the overall performance target.
If a restaurant does not meet the standard, the matrix leads the restaurant to a list
of different possible barriers. The barriers are based on information the Tempe
restaurateurs provided during the interviews. The final step is to consult with the
restaurants to overcome the barriers and find potential solutions. The assessment
matrix is a vision of sustainable development for the restaurant industry and can
be used to help restaurants identify areas of sustainable business practice. See
Appendix B for the full assessment matrix that was created for this thesis.
RESULTS
Five Tempe restaurant owners and mangers participated in the interviews.
I divided their responses by restaurant type: restaurants that market themselves as
sustainable, and restaurants that do not. I refer to the former as sustainability-
marketed restaurants and to the latter as traditional restaurants. All of the
restaurants are primarily concerned with staying in business and connecting more
with the local community, including ASU. All have interacted with the Tempe
33

community through different events. The restaurants have their waste-hauling fees
incorporated into their Common Area Maintenance (CAM) fees for commercial
properties as part of their monthly lease or site contract, and all stated they do not
have a way of tracking their waste. All of the restaurants except for one recycled.
The types of materials that were recycled depended on what the waste contractor
accepts. The two waste companies that serviced the participating restaurants are
Waste Management, Inc. and the City of Tempe. All of the restaurants
emphasized that it was important for the restaurant to create an inviting,
welcoming, and comfortable place for people to gather with friends. In regards to
sustainable practices, none of the restaurants track their costs and or results of
sustainable practices. Restaurant managers sometimes implement sustainable
business practices because they believe it is the right thing to do, not because it is
a stated goal or trying to meet a regulation.
To determine if efficiency rated appliances could save restaurants money,
I used data from the U.S. Department of Energy (2011), Energy Star (2010), and
the Consortium for Energy Efficiency (2011) to calculate the payback period for
using an Energy Star appliance versus a standard appliance. The data is
presented in Table 6. The prices in Table 6 are at 50% off the list price. This price
is the cost to a restaurant at wholesale. The incremental cost difference between a
standard and Energy Star appliance was calculated. Using data from the
Department of Energy (2011), I found the savings per year on a utility bill for
using an Energy Star appliance. The simple payback period was calculated by
34

determining the number of years it would take for the savings per year to exceed
the incremental cost difference. The discounted payback period was calculated
because the value of the dollar tomorrow is less than the value of today’s dollar.
The discounted payback period reflects the real time it would take for a restaurant
to earn back the incremental cost difference using the annual utility bill savings
gained by using an Energy Star appliance. The discount rate used was 5 percent.
Table 6 Energy Star Price Savings and Discounted Payback Est. Utility Simple Discounted Est. Energy Incremental bill pay- pay- Standard Star cost savings back back Appliance price price difference (yr) (yr) (yr)__ __ Refrigerator $4300 $5000 $700 $60 11.3 17.9 Freezer $6200 $7800 $1600 $40 40 Never Fryer $1000 $4100 $3400 $360 9.4 13.1 Holding cabinet $2900 $6900 $4000 $430 9.3 12.8 Pre-rinse spray valve $2600* $1300** (-$1300) $1300 Instant Instant Steamer $5500 $5100 (-$400) $2700 Instant Instant Griddle $1900 $5600 $3700 $70 52.8 Never Ice machine $2000 $2700 $700 $320 2.1 2.4 Oven $6100 $6800 $700 $290 2.4 2.6 * Estimated price for 2.6 gpm pre-rinse spray valve
** Estimated price for 1.6 gmp pre-rinse spray valve
Source A: CEE, 2011
Source B: U.S. Department of Energy, 2011
Source C: www.centralrestaruant.com, 2011
The typical lifespan of a commercial kitchen appliance is ten years (CEE,
2011). Using the discounted payback period, only Energy Star ice machines and
ovens earn back the incremental cost difference during the typical lifespan of an
35

appliance. Both the Energy Star steamer and the Energy Star pre-rinse spray
valve cost less than the standard appliances and result in immediate savings.
Additionally, the Energy Star steamer has the potential to save a restaurant
$2700 annually in combined electric and water utility bills. The Energy Star
pre-rinse spray valve has the potential to save a restaurant $1300 annually.
Economic motivation is one way to open conversations about sustainable
practices, but alone does not fully address sustainability. Calculating the carbon
emissions for each appliance could further expand a discussion about the
cumulative influence of restaurants on the environment.
Traditional Restaurants
The long-term goals for traditional restaurants were focused on gaining
and retaining customers while providing a quality product. When questioned
about their sustainable practices, these restaurants did not claim they are taking
environmentally conscious actions. Only one mentioned without prompting that it
recycled and encouraged their customers to reuse their products. A second
recycles but did not initially volunteer this information and did not mention it as
being a sustainable business practice. The restaurants agreed that it is difficult to
set environmental goals that are financially feasible in this industry. Financial
stability is the primary concern; sustainable practices are secondary.
The traditional restaurants saw their biggest environmental impacts as
being food and glass waste. Other impacts included linens laundering and
electricity consumption for air conditioning and heating. Other than waste
36

production, the restaurants did not believe they had a large impact on the
environment because each is an SME. None of the restaurants mentioned the
electricity used for food storage and preparation as having an environmental
impact. Each restaurant only mentioned having one Energy Star appliance, and
each restaurant had a different energy-efficient device. The three appliances are a
refrigerator (Beverage Air), a dishwasher (EcoLab), and a tankless water heater.
Cost is the primary reason all three restaurants gave for not having more energy-
or water-efficient equipment. Restaurant C stated, “We would not buy energy-
efficient equipment unless [it was] less expensive” (2011). None of the restaurants
were aware of any financial incentives available for businesses to purchase
energy-efficient equipment. Two of the restaurants believe there is a real financial
advantage to having energy-efficient appliances, but initial cost remains a barrier.
An additional barrier was the lack of direct need. All three restaurants noted that
they have not had to purchase any new appliances; therefore they continue to use
what they have and have not gone out of their way to purchase new energy-
efficient appliances.
Two of the traditional restaurants had low-flow water toilets in the
restrooms. Universally, there was concern that “low flow [i.e. aerated faucets and
pre-rinse spray valves] doesn’t always do what it needs to do” in terms of
sanitation in the kitchen (Restaurant E, 2011). However, Energy Star (2010)
requires all new pre-rinse spray valves in commercial kitchens to be water-
efficient, using 1.6 gpm. Restaurant C is aware of the regulation change and is in
37

the process of changing its spray valves to low gpm devices.
Restaurant waste disposal can include compost and recycling. None of the
restaurants compost its food scraps. Restaurant D allows a customer to collect its
used coffee grounds, and the customer takes the coffee grounds home for use in
the garden. This restaurant also allowed an employee to collect the food scraps
and donate them to the Tempe City Garden. This action ended when the employee
left the restaurant. The primary barriers to composting are space, volume, and
nuisance. Other barriers mentioned by restaurants include logistics and no direct
benefit to the restaurant. Logistics refers to having no commercial collection
available for compost. Possible stated benefits of composting include creating a
competitive advantage, strengthening ties to the community, and providing a
reason for a restaurant to have their own garden. Restaurant E (2011) thought
their customers “would think it was pretty cool” to compost and stated that their
customers “think about things like that.” Restaurant D (2011) thought that
composting would be helpful only “if [its] customers cared about it.” Customer
support and buy-in appears to be a concern for these restaurants in the practices
they considering implementing.
Two of the traditional restaurants recycle, but only recycle cardboard.
They have different collection providers: the City of Tempe and Waste
Management, Inc. The restaurant that is serviced by Waste Management is
located on ASU property. Originally the restaurant did not have recycling, but the
owner talked to a person in ASU’s Facilities Department and it was agreed that
38

the restaurant could recycle its cardboard1. None of the other restaurants in the
strip located on ASU property participate in recycling. The other restaurant is
serviced by the City of Tempe and they only recycle cardboard. The restaurant
owner stated that “the City of Tempe doesn’t communicate their services” and
that “no good system for collecting glass exists” for restaurants, so they do not
recycle glass (Restaurant E, 2011)2. This restaurant is very interested in recycling
glass and said it would be easy to recycle glass uncontaminated if the City of
Tempe would collect it. The two restaurants that currently recycle cardboard
stated the barriers to recycling more materials include: lack of collection, extra
time for separation, space for extra storage bins, training of employees (high
employee turnover), lack of communication with the waste company, and lack of
transparency relating to accepted items. Both of these restaurants purchase
products that have recycled content. The Restaurant E purchases only recyclable
and compostable to-go containers. Restaurant D offers free drink refills during the
same visit, discounts for reusing cups during the day, and discounts for bringing
your own cup. It also collects the coffee sleeves next to the trash bin for reuse.
The third traditional restaurant does not recycle. The manager stated that
the “City of Tempe doesn’t provide and will not provide recycling bins for
businesses” (Restaurant C, 2011). This restaurant noted that financial costs and
1 In fact, the property manager’s records reflect that the tenants on this property can recycle more than just cardboard (see Appendix C) 2 The City of Tempe does offer commingled recycling to commercial businesses, including restaurants.
39

responsibility were barriers to recycling. The restaurant manager stated there is no
financial benefit to recycling and you are doing the city’s job for it; it is not the
responsibility of the restaurant to recycle. The manager also stated the restaurant
does not have a way to track what percentage of its purchases contains recycled
content.
The restaurants estimate that they use between 15 and 30 percent local
and/or organic food. The primary barrier to using local or organic food is cost.
None of these restaurants have seasonal menus. Only Restaurant E communicates
with a local farmer. Its chef communicates with the local farmer about products,
such as tomatoes, whose flavor varies according to growing conditions.
Restaurant D stays local by only serving pastries and gelato that are sourced from
local vendors. Its owner confused ‘local vendor’ with local food product, stating
that a local company provided all of their produce. I contacted the company and
was informed that it is a “full-scale produce company, so to meet the needs of the
restaurants, we source [our produce] from around the world” (personal
communication, 2011). This company does not source its produce from local
providers.
The traditional restaurants identified their biggest social impacts as giving
back to the community and creating a comfortable atmosphere. They said their
customers wanted to receive good service, quality food, and be served in a nice
atmosphere. Their economic impacts focused on costs; food and energy costs, and
investment in employees.
40
Each of the three traditional restaurants had a different view of how
sustainability applies to restaurants. Each of the restaurants also defined
sustainability differently. Restaurant C’s manager was unable to define
sustainability and stated, “I have no idea what the hell it means” (2011). The
manager subsequently stated that sustainability does not apply to restaurants
because she does not understand what it means. A lack of understanding and how
to translate the concept to practice appears to be a barrier in this restaurant’s
practices. The Restaurant E defined sustainability as “doing and practicing
systems that will not harm the environment or have the least impact on the
environment” (2011). The owner of this restaurant said, “sustainability should
apply to restaurants.” The word choice indicates that this owner believes
sustainability has a role in restaurants but that it is not yet practiced. This aligns
with statements alluding to the fact that the owners feel they are taking some steps
towards sustainability in recycling and locally sourced foods, but do not believe
they are doing enough to be considered sustainable at this time. Restaurant D
defined sustainability as being, “If I care enough or am able to recycle everything
possible and waste as little as possible. You have to care to do it and be able to do
it” (2011). This definition focuses on the personal level and does not touch on the
influence restaurants have on the greater community.
These restaurants noted difficulties with implementing sustainable
practices. Restaurant A’s manager, one of the sustainability-marketed restaurants,
said sustainability “takes extra steps and extra costs” which “in today’s economy
41

a lot of people skip and some just don’t care.” This holds true to the traditional
restaurant listing cost and convenience as their primary barriers.
Sustainability-Marketed Restaurants
The long-term goals of the sustainability-marketed restaurants want to
improve environmental initiatives and host more community events. Both of these
restaurants market themselves as sustainable and highlight different ways they
implement sustainable practices. Initial responses to questions about how they are
implementing sustainable practices include using low-impact products,
local/organic food sources, recycling, and environmental goals matching the
philosophy of the owner and mission statement. These restaurants’ environmental
goals were closely linked to community participation and educating tenants and
customers about environmental stewardship. Both restaurants mentioned the
company’s desire to implement environmental goals.
Neither of the two restaurants compost their food scraps; each gave a
different reason why not. Restaurant B participated in a few pilot compost
projects that have not continued. It identified the following barriers to continuum
composting, logistics, space, volume, and legal issues. Restaurant A’s barrier was
a lack of awareness. The manager at this restaurant stated, “we are not aware of
barriers” and “I don’t know why we don’t compost” (Restaurant A, 2011). This
statement was based on the ease with which the restaurant donates and recycles
food. Restaurant A’s manager believes it would be easy to track food wastes,
although the restaurant does not have a system in place to do so. While this
42
restaurant has never considered composting as an option for its food waste, it does
donate to the neighboring church and shelter.
Both of the sustainability-marketed restaurants have comingled recycling
provided by Waste Management. Neither has encountered barriers to recycling.
The managers’ stated that time might be a barrier because restaurants can be
chaotic environments, but they have already overcome the barrier. These
restaurants do not have a problem with limited space for recycling bins. Both
agreed that education, convenience, promotion, and good training are key to the
success of a restaurants recycling program.
Both of these restaurants focus on local and organic foods. Both stated that
80 to 90 percent or more of their food comes from local and/or organic sources.
The owners encourage their chefs and managers to stay in communication with,
and even visit, local farms to understand the food product, gather information for
the restaurant, and to be able to answer customer questions. The Monterey Bay
Aquarium’s Seafood Watch program and Clean Fish are programs the chefs use to
choose sustainable seafood. The connection to local food and farmers also is the
biggest economic impact of these restaurants.
The sustainability-marketed restaurants stated their biggest social impacts
as getting their name out and educating the public about the restaurants’
sustainable practices, and to increase public awareness of sustainability issues.
They said their customers want to receive good service, quality food, and to know
their food source and the environmental practices of the restaurant.
43

Both restaurants agree that sustainability applies to restaurants because of
the impact on everyone and the high consumption of energy, water, and output of
waste. The sustainability-marketed restaurants did not believe they had any
difficulty implementing sustainable practices. The Restaurant A defined
sustainability as “just being able to keep the earth and the human species going;
everything is just working together” (2011). Restaurant B’s manager felt that
sustainability is easy to implement because it is at the core of the restaurant’s
mission and the restaurant is already practicing sustainability. Restaurant B
defined sustainability as “looking at the social, environmental, and economic
impacts of our business and understanding how we can use resources responsibly
to have an impact on future generations” (2011). Restaurant B educates diners and
the public about its sustainability practices. It aims to reduce its environmental
footprint by educating and supporting patrons to make sustainability a part of their
daily lives. Both managers thought that recycling and energy and water
conservation practices are easy to implement. They noted that each restaurant will
encounter different barriers and their different customers influence how easy it is
to implement sustainable practices. The barriers I extracted from the interviews
varied by location. Restaurant A lacked knowledge on water-efficient equipment
an additional food waste reduction techniques. Restaurant B stated they faced
concerns about legal barriers to low-flow appliances for kitchen sanitation and
food donation. Despite the current barriers, both sustainability-marketed
restaurants are open to suggestions and making changes to their practices.
44
DISCUSSION
Traditional and sustainably marketed restaurants have different barriers to
sustainable practices. The sustainability-marketed restaurants interviewed have a
mission statement and management supporting their sustainable business
practices, but have more institutional barriers. The traditional restaurants
interviewed lacked stated sustainability goals, had varied support from
management, and lacked clarity on the benefits of sustainable practices and how
to access these practices. Traditional restaurants’ most common barriers are cost,
lack of awareness, and space. Sustainability-marketed restaurants barriers varied
by location. Restaurant A struggled with lack of knowledge relating to water-
efficiency and alternative food waste reduction techniques. Restaurant B has legal
barriers barring further water efficiency and food scrap diversion efforts.
Energy and Water Savings Potential
State-level incentives can help decrease the payback period for purchasing
efficiency-rated equipment. They also create differing contexts for appliance
purchasing decisions. The payback period for restaurants purchasing energy- and
water-efficient equipment is based on the direct purchasing cost and utility
savings per year. Depending on varying market conditions and incentive
programs, not all of the Energy Star rated appliances have a payback period that
is equivalent to the operative life of the equipment. In this case, it may be
necessary to purchase a new piece of that same equipment before the savings
from purchasing the Energy Star appliance were realized by the restaurant.
45

Thus, analysis is required to understand when “incentives” actually create
purchasing incentive.
This study looked at restaurants in Tempe, Arizona; Arizona incentives
are used. The Energy Star website has a list of the incentives, by state, that are
available for commercial restaurants, by searching for the Commercial Food
Service Equipment Incentive Finder. In Arizona, Southwest Gas provides three
incentives that restaurants can use in purchasing energy-efficient, natural gas
equipment. Table 7 lists the eligible equipment, requirements and rebate levels for
the restaurant equipment.
Table 7 Eligible Equipment, Requirements, and Rebate Levels Natural Gas Equipment Equipment Requirements Available Rebate____ Storage water heater Thermal efficiency 90% 50% of purchase price
and greater; 125,000 up to $1,200 btu / hr input and greater Tankless water heater Thermal efficiency 80% 50% of purchase price
and greater; 200,000 up to $300 btu / hr input and greater Griddle Energy Star qualified 50% of purchase price up to $1,500 Steamer Energy Star qualified 50% of purchase price up to $1,100 Fryer Energy Star qualified 50% of purchase price up to $1,800 Oven Combustion efficiency 50% of purchase price 40% and greater up to $3,000 Source: Southwest Gas Corporation, 2011 Only Energy Star rated equipment is used for comparison in this thesis. Using
the available rebates from Southwest Gas Corporation, I recalculated the
incremental cost difference between the estimated standard equipment price and
the estimated Energy Star equipment price, for equipment using natural gas.
46

Table 8 shows the changes in price differential and payback period for the Energy
Star appliances that qualify for the Southwest Gas rebates in Arizona.
Table 8 Energy Star Price Savings with Southwest Gas Corp. Rebate and Payback Energy Est. Star Incremental Simple Discounted Standard price with cost payback payback Appliance price rebate difference (yr) (yr) Griddle $1,900 $4,100 $2,200 31.4 Never Steamer $5,500 $4,000 (-$1,500) Instant Instant Fryer $1,000 $2,300 $1,300 3.7 4.1 Oven $6,100 $3,800 (-$2,300) Instant Instant
Restaurants that use Energy Star appliances benefit from lower utility bills.
Steamers, pre-rinse spray valves, and combination ovens are instantly less
expensive in the initial purchase cost with the help from incentives from
Southwest Gas. The other appliances with payback period within the operational
lifespan are holding cabinets and ice machines. In economic terms, purchasing an
Energy Star griddle will not earn back the investment over its normal
operational life. Therefore, if the only concern is the cost difference, restaurants
should purchase Energy Star fryers, ovens, pre-rinse spray valves, and steamers
to benefit from instant savings in purchasing and utility bill savings. Restaurants
should invest the money saved from the utility bill towards purchasing Energy
Star ice machines and holding cabinets which each have a payback period of
less than three years.
Converting all appliances to Energy Star equipment does not necessarily
save restaurants money. Good business practices dictate that when an appliance
needs to be replaced, restaurants should purchase equipment with the lowest cost.
47

As mentioned above, certain Energy Star equipment is less expensive than
standard equipment. Sustainable business practices must ensure financial
viability, but also include considerations for the environmental and social
domains. Therefore, cost savings alone should not dictate whether or not a
restaurant purchases energy- or water-efficient equipment.
The collective environmental and social impact of restaurants is immense.
These domains typically fall outside of a simple ‘dollars and cents’ business case
analysis. As social stewards, restaurants need to take actions that reduce negative
environmental impacts and educate customers on the restaurant’s environmental
efforts. Since restaurants are the highest energy consumers in the commercial
sector, plans to eventually purchase all equipment with Energy Star devices
should exist. Since Energy Star does not rate all appliances used in commercial
kitchens, when an Energy Star appliance is not available, the restaurant should
purchase the most energy efficient model available. This practice complies with
the sustainability principle of lowered consumption. Given SMEs cost barriers
and in an effort to minimize consumption, restaurants should replace kitchen
appliances only when replacement is required. When purchasing the new
appliance, priority needs to be placed on certified energy- and water-efficient
equipment.
Food Waste Reduction
In terms of organic waste practices, the indicators described by Legrand et
al. (2010) and JingJing et al. (2008) indicate restaurants primary alternative to
48

direct disposal is to compost and recycle. However, the U.S. EPA’s (2010) food
waste recovery hierarchy (see Figure 4) prioritizes options to manage food waste.
The hierarchy suggests source reduction or other waste mitigation strategies
before composting and other disposal practices such as landfill or incineration.
Figure 4. U.S. EPA food waste recovery hierarchy.
Waste audits and reducing pre- and post-consumer food waste are two techniques
of source reduction. Restaurant B is the only restaurant in this study that uses
waste audits. A number of leading national restaurant chains also use waste audits
as a means to reduce purchasing costs and waste production. Waste audits are a
technique that more restaurants should use to save money and lessen their
environmental impacts.
Restaurants have increasing access to source reduction tools and
techniques. For example, a company called Lean Path has two products that help
track pre- and post-consumer food waste. The ValueWaste Tracker is an
automated food waste tracking scale that makes it possible to record all the
information about a wasted food item in less than 10 seconds (Lean Path, 2010).
The ValueWaste Advantage 4 software system imports the data from the scale
49

to provide summary information and detailed subsets of a restaurant’s waste
stream. The ValueWaste products can be leased to allow a restaurant to
complete a short-term waste audit. Automated, computerized scales allow
restaurants the ability to quickly track their pre- and post-consumer food waste.
Tracking waste is a source reduction technique that directly reduces food costs.
Tabulated waste information allows management to know what and the reason
why food is being discarded. This information can be used to adjust a restaurant’s
menu items according to what is left on the plate and even adjust portion sizes.
Smarter purchasing decreases the restaurant’s direct food costs.
After source reduction has been maximized, food donation is the next step
in the food hierarchy. Restaurants can achieve this step by donating food to those
in need in their community. Restaurant E and Restaurant A both donate food to
the Tempe community. Restaurant B has a food donation pilot program and is
working with the ASU health inspector to navigate the legalities of food donation.
Many restaurants have food, that is not spoiled or used, that is thrown away at the
end of the shift. Feeding the hungry minimizes organic input into landfills, and
increases community participation and corporate social responsibility (CSR).
Clarifying Recycling Challenges and Opportunities
The principal barriers to recycling identified by the restaurants in this
study are cost, space, and concerns of convenience. Restaurants that do not have
comingled recycling believe that it would be easy to add a glass-recycling
program. As discussed above, cost can be a barrier to purchasing new energy- or
50

water-efficient appliances, and the initial purchasing of devices for source
reduction and to increase recycling. In actuality, recycling costs are negligible
beyond the initial fee for the collection bin, which includes delivery costs. Most
waste companies do not charge an extra fee for recycling collection if there is a
contract for waste collection. Compost is not a large-scale viable option for
Tempe restaurants. The creation of a commercial hauler that accepts food waste
would be necessary before composting of food scraps and other organics would
be possible for restaurants. Therefore, it is best to focus on source reduction and
food donation tactics to reduce food and other organic input to landfills.
Misunderstanding plays a role in some restaurants recycling practices.
Waste Management, Inc. provides waste and recycling services to three
restaurants in this thesis. Waste Management provides commingled recycling to
commercial businesses. Two of these three restaurants participate in the
commingled program, while one stated during the interview that they are only
allowed to recycle cardboard. I called Lincoln Property Company that manages
the restaurants in the ASU Foundation/Fulton Center. It was confirmed that Waste
Management services this restaurant and that Lincoln Property Company has
informed the tenants of the recycling options. Lincoln Property Company
provided the document that lists recyclable and non-recyclable items for this
restaurant (see Appendix C). Miscommunication or misunderstanding between
the property management company and implementation at the restaurants may be
a primary factor in why this restaurant only believes that it can recycle cardboard.
51

The interviews also revealed a number of discrepancies relating to
commercial recycling service. One of the restaurants serviced by the City of
Tempe stated they could only recycle cardboard and the other restaurant stated the
City of Tempe does not have recycling for commercial businesses, in particular
restaurants. According to the City of Tempe’s website and recycling coordinator,
Tempe offers commingled recycling to commercial businesses, including
restaurants. Tempe offers collection for commingled materials and for cardboard
only. Restaurants can purchase the commingled container and start comingled
recycling collection. Information regarding the containers and acceptable
comingled materials is provided in Appendix D. Once a week recycling collection
is free if the restaurant already pays for Tempe’s commercial trash pick-up. The
restaurants serviced by the City of Tempe did not know of the change to
commingled collection programs.
Benefits and Challenges for a Broader Sustainability Perspective
The benefits of sustainable development in restaurants extend beyond
direct environmental and cost savings. Other benefits, such as social ones, are
typically overlooked. Restaurants can market their efforts to use as a selling point.
Environmentally conscious consumers are likely to use the information to decide
where to dine. Utilizing this market strategy may give restaurants a wider
customer base and allow them to “build a business case” for their sustainability
efforts as a means to increase the restaurant’s competitive advantage. Competitive
advantage is not only a marketing advantage. As governments increase
52

regulations and apply stricter standards, restaurants could be affected. Those who
have begun changes will be less affected by future government regulations. The
restaurant industry is highly competitive. Any advantage and additional selling
point should be harnessed. Yet, restaurants are economically vulnerable. Many
restaurants fail in their first year of operations. Therefore, sustainable practices
must be financially feasible, as to not disrupt the delicate and often fluctuating
income of restaurants until they become better established. Thus, even given a
broad group of benefits, decisions about actions and sustainable practices will not
be adopted unless a direct or understandable indirect financial benefit is available.
While market advantages may be available from a sustainability
perspective, they may not be realized without being integrated into a restaurants’
mission. The mission statement outlines the core operational values of a business.
Currently, most restaurants do not reflect values and goals that embody
sustainability. Traditional restaurants are aware of general environmental issues
and may take some steps to mitigate their impacts at the restaurant. However,
these restaurants are not focused on environmental impacts. The cumulative
impact of U.S. restaurants can no longer be ignored. Restaurants need to be held
accountable for the harmful impacts they contribute to the U.S. environment.
Traditional restaurants are often impeded in their progress towards more
sustainable practices by a lack of transparency and misinformation. These types of
restaurants do not know what actions directly link to the system-wide
sustainability of restaurants. Many restaurants also rely on outdated or incorrect
53

information. Often restaurateurs are so focused on internal business matters and
meeting customer needs that they lack the resources to become more informed.
Higher-level intervention, which could be realized as a national standard or
regulation, would focus the attention of restaurants on their actions and impacts.
The sustainability-marketed restaurants have the same general concerns of staying
in business and generating a profit as traditional restaurants. Yet, the presence of
stated sustainable practices and goals in daily operations and core values
distinguishes the sustainability-marketed restaurants from traditional restaurants
and enables cohesive and strategic action. These restaurants are an example of the
direction the restaurant industry needs to take to successfully integrate
sustainability into the industry.
Indicators and Sustainable Restaurants
This thesis focused on environmental efficiency, areas that restaurateurs
have direct control over, and analyzing the current state of assessment tools from
restaurant sustainability literature by having restaurants identify barriers.
Therefore this thesis does not cover all points of that could be considered in a
restaurants sustainability assessment. The thesis did not have restaurants identify
what indicator areas they thought were applicable or have the restaurants provide
direct input on the relevance of the metrics. The restaurant literature indicators
lacked specific percentages and made it difficult to understand at what level the
metric is considered achieved.
54

Indicators and metrics are one way to quantify actions and impact. The
indicators proposed by Legrand et al. (2010) and JingJing et al. (2008) are strong
in some areas, but not all are relevant. The indicators attempt to measure various
aspects of restaurants to view the system as a whole. The metrics account for food
source, locality, end-of-life uses and disposal, and energy consumption. Each
metric touches on the major environmental impacts of restaurants. The major
weakness of the current indicator set is a lack of benchmarks. The indicators state
that a percentage must be met, but fail to say at what level the measured action is
sustainable. This situation leaves the indicators open to interpretation and the
application as a measure of sustainability ambiguous. Setting benchmarks
standardizes the level of action for all restaurants and moves towards being able
to set a nationally recognizable and accepted standard. Further development of
restaurant sustainability indicators must occur before a set national standard can
be achieved.
The U.S. EPA has began to standardize efficiency management and
tracking for various commercial appliances. However, Energy Star does not rate
all kitchen and restaurant technologies. Energy Star and the U.S. EPA need to
work to certify more all kitchen equipment. The U.S. EPA does not offer any
financial incentives to purchase Energy Star appliances. Only certain individual
states offer incentives for restaurants to incorporate Energy Star equipment. The
U.S. EPA should offer more incentives to purchase efficiency-rated appliances to
offset the discounted payback period.
55

This thesis is a starting point that can open conversations about national
standards for restaurants. The National Restaurant Association and the U.S. EPA
should work cooperatively to set a national indicator standard for restaurant
sustainability. Currently, only private organizations such as Green Seal for
Businesses and the GRA offer measurements of sustainable restaurants. Green
Seal and the GRA each have different methods of measuring sustainability in
restaurants. The different methods and measures creates ambiguity and allows
restaurants to claim to be sustainable, when their practices may only be
sustainable in certain areas; thus neglecting the system as a whole. The measures
that GRA and Green Seal developed are valid and applicable. I am advocating
that a single, nationally accepted standard be developed, based on the findings of
this thesis and the substantial work from the GRA and Green Seal.
The current list of indicators included in this study, and those proposed by
Green Seal and the GRA, are not necessarily the best measure of systemic
sustainability. The current indicator set looks at the practices of an individual
restaurant. However it is the cumulative impact of restaurants on the environment,
restaurants’ influence on the community, and the importance of revenue streams
to the U.S. economy that are why this industry must be examined through
sustainable practices. The current indicators do not include the role of the
community, considerations for labor and human rights, and product responsibility.
The Global Reporting Initiative (GRI) is a framework of how to conduct a more
complete sustainability report. Sustainability reports measure, disclose, and hold
56

businesses accountable to internal and external stakeholders for organizational
performance towards the goal of sustainable development (Global Reporting
Initiative, 2007). The G3.1 Guidelines (GRI, 2007) can be applied to
organizations, and industry, of any size or type, as a basis for sustainability
reporting. The restaurant, or food industry, sector has not been provided specific
sector guidelines, but the general guidelines for a more inclusive sustainability
report are available. The G3.1 Guidelines is a set of tools that should be
incorporated to move beyond the individualistic approach of current restaurant
sustainability indicators. Future studies of restaurant sustainability should
consider the G3.1 guidelines as an important addition to a more complete
sustainability reporting measure.
Applying the Nidumolu et al. (2009) sustainable business development
theory to the restaurants was my attempt to think about restaurants beyond their
individual practices; moving beyond practices to the progress made towards
transforming the business model. My assessment concludes that the sustainability-
marketed restaurants have progressed the furthest towards next-practice business
models. Restaurant A is currently at Stage 4: Develop New Business Models, and
Restaurant B is at Stage 5: Create Next-Practice Platforms, the final stage.
Restaurant A has an owner and management who are committed to sustainable
business practices, including expanding opportunities for environmentally
conscious consumption. Restaurant A has integrated a recycling program, energy-
efficient appliances and building design, community events, and recycled
57

products. A majority of its food is locally sourced. Restaurant A’s management
needs to start annually reviewing its actions, goals, and progress. A systematic
annual review is a new concept for restaurants. Restaurant B has reached Step 5
because there are stated sustainable practices goals, numerous sustainable
practices have already been implemented, the company’s approach and goals are
reviewed annually, the restaurant engages in community outreach, and is
researching opportunities to further their sustainable efforts. Restaurant B has
stated five-year goals and has developed plans to overcome current barriers.
Future efforts include composting, food donation, and more waste reduction
strategies.
The three traditional restaurants are at different stages of Nidumolu et al.’s
(2009) step theory. The major concern for all three of the traditional restaurants
was the initial cost in purchasing energy- or water-efficient equipment and the
perception that sustainable business practices were inconvenient. Restaurant D
and Restaurant E are currently at Step 1: View Compliance as Opportunity. Based
on current practices, these restaurants are beginning Step 2: Make Supply Chains
Sustainable. Restaurant D and Restaurant E have incorporated the cardboard
recycling and are interested in commingled programs that are now available. Both
restaurants were not aware they had energy-efficient equipment in their kitchens;
while both had at least one energy-efficient appliance. By incorporating, and
being willing to expand, recycling and recycled-products, and having some
efficiency rated equipment, these restaurants view compliance as opportunity,
58

thus completing Step 1. Restaurant D and Restaurant E are both starting recycling
programs and purchasing efficiency-rated equipment before compliance is
mandated on a city or federal level.
Restaurant D and Restaurant E are beginning Step 2 by seeking local food
providers, where it makes financial sense. Restaurant D’s definition of ‘local’
differs from the one used in this thesis, i.e. within 250 miles. While Restaurant D
purchases pastries from local bakeries, the breakfast and lunch items are sourced
from a local vendor that sources its food from across the U.S; these food items are
not local. Restaurant D also relied on customer and employee initiatives to
decrease their waste production, but was unable to continue the programs when
the support left. As a result of the transition between stages, and lacking
transparency in waste reduction strategies, the restaurants’ lack a cohesive
sustainable business strategy. To further their efforts, senior management would
need to develop specific sustainable practice goals.
Restaurant C has not embraced sustainable business practices. Restaurant
C has struggled to understand the definition of sustainability and, therefore,
struggles with understanding what this means for the restaurant and how it is
applicable. The restaurant’s management is very concerned with cost and
remaining in business (i.e. near-term business survival). They list these issues as
the reason they are not concerned with finding or practicing sustainability at their
restaurant. Therefore, Restaurant C has not started progress towards becoming a
sustainable company.
59

Future Study
Future restaurant sustainability studies need to focus on developing
thresholds and benchmarks for the indicators, as well as creating a set of measures
that reflects the cumulative impacts of the entire industry. I applied a qualitative
assessment of where the restaurants fit into the Nidumolu et al. (2009) theory and
research is needed to standardize the process of assigning restaurants to a
particular step. While this study focused on the barriers that traditional and
sustainably marketed restaurants faced, the sustainable development of restaurants
requires that all restaurants be held to the same standard. Future studies into
restaurant sustainability should focus on developing one standard of metrics to
assess the sustainable practices within each restaurant. The differences I advocate
are for restaurant properties and buildings that are leased versus owned. If they
properties are owned, C & D, including HVAC design and efficiency need to be
included in the sustainability assessment. The standard that is developed may look
similar to the LEED certifications.
CONCLUSION
My thesis study applied sustainability themes to the restaurant industry.
Businesses respond to measurements of progress; such measurements are
obtained by analyzing indicators. Applying this type of measurement provides
answers about what things or processes are present, but does not account for
planning and values. Sustainable business practices must not only meet certain
performance criteria, but also be part of the restaurateur’s value structure.
60

Indicators are useful as measurements of performance, but fail to fully integrate
the core concerns of sustainability and sustainable development. Sustainability
does not imply an end state, nor is there a clear demarcation between what is
sustainable and what is unsustainable. Sustainable development involves
qualitative assessment of the values that guide the decision-making process and
are communicated to staff and the public.
My work focused on the current measurement techniques that are used to
evaluate sustainable business practices in the restaurant industry. Simply meeting
the indicator requirements for energy, water, waste, and food does not necessarily
imply that sustainability has been accomplished. Applying Nidumolu et al.’s
(2009) step theory is one way to instate a broad discussion of sustainable
development in a business context. The step theory emphasizes the importance of
spreading the values of sustainability philosophy and changing systems
throughout the entire organizational structure. Indicators play a role in the initial
assessment and iterative evaluations to monitor continued progress towards
sustainable practice. Indicators respond to the need for compliance but do not
necessarily drive changes towards sustainability nor instigate a process of setting
goals for sustainable practice.. Indicator assessment is a key component of steps
one and two of Nidumolu et al.’s (2009) framework for sustainable businesses,
and indicators should play an ongoing role in the quantitative analysis of the
business practice. Yet, meeting indicator levels alone speaks only to ‘green’ing
practices and does not embody the principles of sustainability.
61

The key components of sustainability—education, community
participation, future-focused, and process—are not fully integrated into indicators.
Environmental indicators for restaurants usually account only for purchasing and
use practices, showing whether or not the metric is present at the restaurant. The
metrics that do aim at the education component of sustainability are: menus that
communicate the restaurants’ sustainable practices, kitchen staff trained in
methods of healthy cooking, and staff and suppliers trained and encouraged to
‘reduce, reuse, and recycle.’ To move beyond the current limited set of
environmental indicators, a holistic assessment of restaurant sustainability must
include qualitative assessments of the role that education and community
participation play, and of the degree to which the restaurant is focused on the
future. The assessment matrix created for this study allows restaurants to move
past the limitations of current indicators and into the future-focused phase of
sustainable business development. Capturing these components, as well as
restaurants’ environmental impacts, will provide a more complete picture of
sustainability in restaurants.
The operational measures of environmental sustainability are present in
the current indicators. However, the current list does not include internal
operational measures. Internal operational measures include upper management
support and employee connectedness. The integration of a value structure
throughout the entire business is essential to true sustainability. Sustainability is
not an end state, but a group of practices and values that need to be reviewed at
62

least annually. The review of practices and progress constitutes the process-based
aspect of sustainable development in businesses. Re-evaluation is an opportunity
for owners and managers to consider their progress, integration of new practices,
and provide a time to reflect on future goals. Restaurants are making progress
towards sustainability, but the industry must look beyond indicator analysis and
incorporate qualitative measures to address the key components of sustainability.
The restaurant industry is not alone in having cumulative impacts on the
environment, economy, and society. Every industry sector has cumulative
impacts. Most, if not all, businesses could increase their sustainability by
integrating measurements of value systems and goals with quantifiable metrics.
Businesses that want to be responsible, ethical community players will need to
participate in community education and outreach about sustainable practice.
Furthermore, sustainability in business is a process focused on the future. Sharing
knowledge and practices is one technique that helps bolster industry-wide
advancements in sustainable practices and reaches to the core of corporate social
responsibility (CSR). CSR is part of the social domain of sustainability and
implies that restaurants (and all businesses) have the responsibility to educate
their employees and the public, in order to help reduce the negative environmental
impacts of their industry. Sharing practices and information with similar
businesses may seem at odds with increasing competitive advantage. However,
knowledge sharing and CSR heightens the public’s perception of a business as an
industry leader, and creates an environment for the business to develop new
63

sustainable business practices. Sharing marketing strategies and business practices
lessens the gap between information and practice, increases transparency, and
makes the business a leader in solutions. Helping businesses increase
sustainability drives further innovation and enhances cumulative, industry-wide
sustainable business practice.
64

WORKS CITED
Berke, P.R. (2002). Does sustainable development offer a new direction for planning? Challenges for the twenty-first century. Journal of Planning Literature. 17(1), 21-36.
Berke, P.R. & Manta-Conroy, M. (2000). Are we planning sustainable development? An evaluation of 30 comprehensive plans. Journal of the American Planning Association. 66(1), 21-33.
Brain, D. (2005). From good neighborhoods to sustainable cities: Social science
and the social agenda of the new urbanism. International Regional Science Review. 28(2), 217-238.
Bubna-Litic, K. & de Leeuw, L. (1999). Adding the green advantage: A survey of
Australian SMEs. Ecobiz 99, The Business and the Environment Conference.
City of Tempe. (2011). Business recycling services. Retrieved from
http://www.tempe.gov/recycling/CommercialRecycling.htm. Consortium for Energy Efficiency. (2011). Commercial kitchens initiative.
Retrieved February 4, 2011 from http://www.cee1.org/com/com-kit/com kit-infomembers.php3.
Dasgutpa, P., Levin, S. & Lubchenco, J. (2000). Economic pathways to ecological
sustainability. BioScience, 50(4), 339-345. Energy Star. (2009). Greenhouse gas inventory and tracking in portfolio
manager. Retrieved from www.energystar.gov/ia/business/evaluate_performance/Emissions_Supporting_Doc.pdf.
Frederick, W. C. (1992). Anchoring values in nature: Toward a theory of business
values. Business Ethics Quarterly, 2(3), 283-303. Gibson, R.B. (2006). Sustainability assessment: Basic components of a practical
approach. Impact Assessment and Project Appraisal, 24(3), 170-182. Global Reporting Initiative. (2007). G3.1 Guidelines. Retrieved from
http://www.globalreporting.org/ReportingFramework/ReportingFramewor kOverview/
Green Restaurant Association. Retrieved from www.dinegreen.org.
65

Heller, M.C. & Keoleian, G.A. (2003). Assessing the sustainability of the US food system: A life cycle perspective. Agricultural Systems, 76, 1007-1041.
Hu, H-H., Parsa, H.G. & Self, J. (2010). The dynamics of green restaurant
patronage. Cornell Hospital Quarterly, 51(3), 344-362. Intergovernmental Panel on Climate Change. (2007). Radioactive Forcing
Functions. Jamieson, D. (1998). Sustainability and beyond. Ecological Economics. 24, 183-
192. JingJing, D., Xinze, L. & Sitch, R. (2008). Ethical consumers: Strategically
moving the restaurant industry towards sustainability. Thesis submitted for completion of Master of Strategic Leadership towards Sustainability, Blekinge Institute of Technology, Karlskrona, Sweden.
Johnson, M.R. (2010). Environmental sustainability within the restaurant
industry. Retrieved October 16, 2010 from http://courses.cit.cornell.edu. Kaiser, E., Godschalk, D. & Chapin, S.F. (1995). Urban land use planning.
Chicago: University of Illinois Press. Kates, R.W., Parris, T.M. & Leiserowitz, A.A. (2005). What is sustainable
development? Goals, indicators, values and practice. Environment. 47(3), 9-21.
Kirby, L.D. (2006). Restaurants as a potential market channel for locally-grown
food in western North Carolina. Appalachian Sustainable Agriculture Project.
Laroche, M., Bergeron, J. & Barbaro-Forleo, G. (2001). Targeting consumers who are willing to pay more for environmentally friendly products. Journal of Consumer Marketing, 18(6): 503-20. Legrand, W., Sloan, P., Simmons-Kaufman, C. & Fleischer, S. (2010). A review
of restaurant sustainable indicators. Advances in Hospitality and Leisure, 6, 167-183.
Maclaren, V.W. (1996). Urban sustainability reporting. Journal of American
Planning Association. 36, 281-288.
66

Macnaughten, P., & Jacobs, M. (1997). Public identification with sustainable development: Investigating cultural barriers to participation. Global Environmental Change, 7(1), 5-24.
Minnesota Solid Waste Management Coordinating Board. (2000). Statewide
MSW composition study: A study of discards in the State of Minnesota. 1-218.
Munier, N. (2005). Introduction to sustainability: Road to a better future. The
Netherlands: Springer. National Restaurant Association. (2010). Industry at a glance. Retrieved from
www.restaurant.org/research/ind_glance.cfm. National Restaurant Association (2010). Restaurant industry operations report.
Retrieved from www.restaurant.org/research/operations/report.cfm. National Science Board [NSB]. (1999). Environmental science and engineering
for the 21st century: The role of the National Science Foundation. Washington DC: National Science Board.
Neuman, M. (2000). Sustainability as a process. College Station: Texas A&M
University, Department of Landscape Architecture and Urban Planning. Neuman, M. (1999). The sustainability question: Beyond the compact city fallacy:
Planning sustainable urban development. Berkley, CA: The Michael Neuman Consultancy.
Nidumolu, R., Prahalad, C. K., & Rangaswami, M. R. (2009, September). Why
sustainability is now the key driver of innovation. Harvard Business Review, 87(9), 56-64.
Nielsen, B. (2004). Dining green: A guide to creating environmentally sustainable
restaurants and kitchens. Green Restaurant Association. Nilsson, J., Bjuggren, C. & Frostell, B. (1998). Greening of a campus restaurant
at Stockholm University: Sustainable development audits by means of the SDR methodology. Journal of Environmental Management, 52, 307-315.
Oklahoma Composting Council. (2010). EPA webinar series: Reduction food
waste reduction & management. Retrieved from http://okcompostingcouncil.org/2010/02/16/epa-webinar-series-reduction-food-waste-reduction-management/.
67

Oliver, C. (1997). Sustainable competitive advantage: Combining institutional and resource-based views. Strategic Management Journal, 18(9), 697-713.
Orr, D.W. (2002). Four challenges of sustainability. Conservation in Context.
16(6), 1457-1460.
Pacific Institute (2010). Commercial water use and potential savings: Appendix E. Retrieved from www.pacinst.org/reports/urban_usage/appendix_e.pdf
Pfeffer, J. (1995). Producing sustainable competitive advantage through the
effective management of people. The Academy of Management Executive, 9(1), 55-72.
Post, J. E., & Altman, B. W. (1994). Managing the environmental change process: Barriers and opportunities. Journal of Organizational Change, 7(4), 64- 81.
Rathje, W.L., & Murphy, C. (1992, July). Five major myths about garbage, and
why they’re wrong. Smithsonian Magazine, 1-8. Reed, C. (2005). Saving water counts in energy efficiency. Inside ASHAE: U.S.
EPA. Retrieved from http://www.energystar.gov/index.cfm?c=healthcare.ashe_sept_oct_2005.
Reed, R. & Defillippi, R.J. (1990). Causal ambiguity, barriers to imitation, and
sustainable competitive advantage. The Academy of Management Review, 15(1), 88-102.
Sadalla, E., Guhathakurta, S. & Ledlow, S. (2005). Environment and quality of
life: A conceptual analysis and review of empirical literature. In Sadalla, E. (ed.) The US-Mexican Border Environment: Dynamics of Human-Environment Interactions. San Diego: San Diego State University Press.
Sonoma County Waste Management Agency. (n.d.) Business food waste
composting. Retrieved from http://www.recyclenow.org/b_restaurant.html. Southwest Gas Corporation. (2011). Arizona commercial high-efficiency
equipment rebate program. Retrieved from www.swgas.com/efficiency/az/commercial_equipment.php.
Sundkvist, A, Milestad, R. & Jansson, A. (2005). On the importance of tightening
feedback loops for sustainable development of food systems. Food Policy, 30, 224-239.
68

Tampa City Government. (2010). Restaurant water efficiency checklist. Retrieved from http://www.tampagov.net/dept_Water/information_resources/Efficiency_checklists/restaurant_water_efficiency_checklist.asp.
Turner, B.L., Kasperson, R.E., Matson, P.A., McCarthy, J.J., Corell, R.W.,
Christensen, L., Eckley N., Kasperson, J.X., Leurs, A., Martello, M.L., Polsky, C., Pulsipher, A. & Schiller, A. (2003). A framework for vulnerability analysis in sustainability science. Proceedings of the National Academy of Sciences. 100(4), 8074-8079.
U.S. Composting Council. Keeping organics out of landfills. Ronkonkoma, NY. UNEP/GRID-Arendal. (2001). Climate change 2001: The scientific basis.
Retrieved from http://www.grida.no/climate/ipcc_tar/wg1/017.htm>. U.S. Department of Energy. (2011). Federal energy management program.
Retrieved February 28, 2011 from www1.eere.energy.gov/femp/technologies/eep_purchasingspecs.html.
U.S. Environmental Protection Agency. (2009). Organic materials | Common
wastes & materials | US EPA. Retrieved from http://www.epa.gov/epaoswer/non-hw/organics/fd-basic.htm.
U.S. Environmental Protection Agency. (2009). Environmental Protection
Agency - LMOP: Basic information. Retrieved from http://www.epa.gov/lmop/overview.htm.
U.S. Environmental Protection Agency. (2009). Energy Star guide for restaurants:
Putting energy into profit. Retrieved from http://www.energystar.gov/index.cfm?c=small_business.sb_restaurants.
Viederman, S. (1995). Knowledge for sustainable development: What do we need
to know? A Sustainable World: Defining and Measuring. Sacramento: IUCN.
Weber, C.L., and Matthews H.S. (2008). Food-miles and the relative climate
impacts of food choices in the United States. Environmental Science & Technology, 42, 3508-3513.
Welford, R. (1998). Corporate environmental management 1: Systems and
strategies. Earthscan, London.
69

World Bank. (1992). World development report. New York: Oxford University Press.
World Commission on Environment and Development [WCED]. (1987). Our
Common Future. New York: Oxford University Press.
70

APPENDIX A
SEMI-STRUCTURED INTERVIEW QUESTIONS
71

General Interest 1. What motivated you to get into the restaurant business? What is your role/title at the restaurant and how long have you been here? What is the seating capacity of the restaurant? How long have you been in business? What meals are served? What type of restaurant do you describe the restaurant? (full-service restaurant? Etc.) What is your cuisine? Describe the demographics of your clientele? 2. What are the restaurants’ short and long-term goals?
Beyond profitability, does the restaurant have any other goals or objectives you would like to highlight? How would you like the restaurant to be perceived by the public?
Does the restaurant have any environmental goals or aspirations? Over the long term do you see your restaurant moving more towards other environmental goals? What motivates you to have the environmental goals? What do you think about some of the restaurants in the area’s environmental efforts at their restaurants?
What do you think were the reasons these restaurants made these efforts? Have you heard about any problems these restaurants have experienced? What steps have and has the restaurant taken to reach its environmental goals?
Do you market the restaurant as sustainable or environmentally friendly? In what ways do you do this? Do you feel this effort has paid off for the restaurant? Do you have any social goals for how the restaurant interacts with the local community? What community are you talking about? Who is your target audience?
3. What do you think are areas of future growth and new initiatives that can help the restaurant meet its goals? Goals and Barriers – be specific to the restaurants own goals 4. Can you describe the successes and hardships the restaurant has experienced in achieving progress towards its goals?
What steps are you taking to overcome any hardships? Is there anything you can think of that would help you?
Now I’d like to ask you about a few different types of specific practices. 5. Do know you if the restaurant composts its food waste? What do you feel or know are the barriers to composting at a restaurant? Do you have any way of monitoring or measuring how much stuff is landfilled? Are you aware of any ways to track food waste?
(If so…) Can you describe how your restaurant tracks its food waste?
72

Putting aside any barriers, what do you think are some of the ways composting could help the restaurant? 6. Do know you if the restaurant recycles?
(If so…) Who collects your recycling? What do you feel or know are the barriers to recycling at a restaurant? Do you have any way of monitoring or measuring how much stuff is recycled? Putting aside any barriers, what do you think are some of the ways recycling could help the restaurant? Environmental 7. What do you feel are the biggest environmental impacts of the restaurant? Has the restaurant purchased energy efficient appliances at the restaurant?
(If so…) What brands of appliances are you currently using? If you do not have energy or water efficient appliances and fixtures, what is the reason?
What brands of appliances are you currently using? Are you aware of any incentives for purchasing energy efficient appliances? Do you know if the restaurant has any specific goals about purchasing energy efficient appliances? For example, if an appliance breaks down how important is it to you to purchase an energy efficient appliance as a replacement? 8. Do you know if the restaurant has a waste reduction program?
What are your tonnage/tipping fees per ton? What city or private provider collects your trash?
9. Do you know what percent of your purchases are for local/organic food? Does the restaurant encourage staff and the chefs to communicate with any local suppliers? 10. Has the restaurant installed low-flow water fixtures in the kitchen and bathrooms? When you are replacing devices that use water, what is the priority for purchasing water efficient appliances? 11. Do you know how much food waste is produced per day/per week/per month? Do you have any data that you can share? Economic 12. In general, what do you feel are your biggest costs and investment requirements? Does the restaurant track the costs (energy costs, food procurement and waste removal)?
How do you track it? Are you able to share the information with me? Do you have a way of tracking what percentage of your budget is dedicated to products with recycled-content? Local/organic food? 13. What types of changes in operations have occurred in the recent years?
73

Social 14. What do you feel are the biggest social impacts of the restaurant? What do you think are the primary interests and concerns of your restaurant patrons? Have you engaged your customers to get their opinion?
Do you have formal ways of assessing their interests and needs? What do they want to see? If so, is there anything they have communicated that is surprising to you? Have you noticed that they are interested in something beyond good food, cleanliness, at a decent price?
15. Do you think that restaurants have a role to play in community development and outreach?
If the restaurant has done any community events, can you describe the involvement?
Sustainability 16. In your own words define “sustainability.”
Do you think “sustainability” applies to restaurants? 17. Are there aspects of what you consider “sustainable” that you think are particularly difficult to implement in a restaurant? Why? Do you think there are aspects of sustainability that are easy to implement in a restaurant that would provide a demonstrable benefit?
74

APPENDIX B
ASSESSMENT MATRIX
75

Indicator Area Metric Presence Barrier
Yes No Energy
Electrical or gas equipment (refrigeration, air-conditioning, boilers, fryers, etc.) are certified energy-efficient N/A
- Cost
Yes No Water-efficient pre-rinse spray valves at 1.6 gpm and
aerators are used N/A Yes No Low-flow toilets are installed in the restrooms
N/A Yes No
Water
Waterless urinals are installed in the men’s restrooms N/A
- Cost - Health concern
Yes No The approach “reduce, reuse, and recycle” is followed;
staff and suppliers are trained accordingly N/A Yes No Sorting and collecting systems for waste with separate
bins exist N/A Yes No Paper products contain recycled content
N/A Yes No No plastic, aluminum, and polystyrene foam is used
N/A Yes No Organic waste is reused or composted
N/A Yes No
Waste
Grease and oil waste is collected and properly disposed or reused N/A
- Cost - Spatial - Collection service
76

Indicaor Area Metric Presence Barrier
Yes No Purchase organically certified food products used for food
preparation N/A Yes No Purchase locally sourced food products used for food
preparation N/A Yes No Adjust menu to use seasonal food products
N/A Yes No Purchase a percentage of sustainably source seafood
N/A Yes
No Options exist for vegetarian, meat, and fish dishes offered on the menu
N/A Yes No Presence of organic wines offered on the wine list
N/A Yes No Use “Fairtrade” certified products
N/A Yes No Purchase of food products purchased directly at the local
farm with attention being paid to pay fair prices N/A Yes No
Options of meals that cater to specific dietary needs and food-allergies (gluten-free/lactose-free choices are available) N/A
Yes No
Kitchen staff is trained on methods that enhance the dietary goals and guidelines of the country (low fat, reduced salt, etc.) N/A
Yes No The menu is labeled with choices such “low fat,”
“vegetarian,” “gluten-free,” “vegan,” etc. N/A Yes No
Food
The menu communicates sustainable practices and initiatives of the restaurant
N/A
- Cost - Vendor - Contract obligation
77

APPENDIX C
LINCOLN PROPERTY MANAGEMENT COMINGLED RECYCLING FLYER
FOR TENANTS
78

ASU TEMPE CAMPUS RECYCLING UPDATE – 5/27/10 (PLEASE FORWARD!)
You can now recycle a whole host of additional items in your commingled recycling bins thanks to Waste Management’s brand new expansion of its program! Check out the below details & stay tuned for the updated website & signage which will make their debut this summer!
FORMER FOES BECOME FRIENDS TO COMMINGLED RECYCLING BINS
Greasy pizza boxes, glass, soft plastic bags/wrap, liquid-free paper cups, vinyl banners, corrugated plastic signs, metal odds ‘n’ ends, & non-hazardous aerosol cans can join the looooong list of items that you can now toss in your outdoor commingled recycling bins. GREASY PIZZA BOXES We looked into this one thoroughly because we couldn’t believe it either but greasy pizza boxes are okay to put in the hamper for cardboard or in the larger commingled recycling bins! Just no cheese, sauce or crust please as food is still forbidden & trash the wax paper! GLASS No more having to walk to a designated glass bin to recycle your glass bottle! Just place it in any commingled bin whether it’s inside or outside. If you have broken glass or Pyrex (broken or unbroken), contact [email protected] for a pickup. SOFT PLASTIC So after hearing repeatedly that placing plastic bags/wrap in the commingled recycling bins is a huge no-no, we can now accept them in commingled recycling bins! This includes all clean pieces of plastic bags, zip lock bags, shrink wrap, freezer bags, bread bags, etc. Either put bags within bags (the best option) or place the bags as is in the recycling bins. Just make sure they don’t contain other recyclables or trash. Please continue to opt for reusable bags or packaging-free options as waste reduction is still the most magical of the 3 Rs. PAPER CUPS All paper cups, as long as they are free from polystyrene/StyrofoamTM, can now be recycled on the ASU Tempe campus! This includes paper cups made from plants like corn & potato starch. Just make sure that they are liquid-free.
79

VINYL BANNERS Please remove the metal grommets from the banners before recycling both the grommets & the banners in one of the larger commingled recycling bins, recycling compactors or outdoor commingled recycling bins. Better yet, here’s a waste reduction tip…when designing banners, consider creating them in a more generic way so that they can be used repeatedly.
CORRUGATED PLASTIC SIGNS (THINK ELECTION SIGNS!) Please remove the metal stakes from the corrugated signs before recycling both the metal & the signs in one of the larger commingled recycling bins, recycling compactors or outdoor commingled recycling bins.
METAL ODDS’N’ENDS Have a broken metal shelf or a whatchamacallit widget you don’t need any more but you don’t have enough to justify a special metal pickup? Then simply place them in any commingled recycling bin on campus. NON-HAZARDOUS AEROSOL CANS Speaking of metal, empty, non-hazardous aerosol cans (think whipped cream & other food-containing cans) can now be placed in commingled recycling bins. NOT ACCEPTABLE IN COMMINGLED RECYCLING BINS A big NO to StyrofoamTM (chunks, cups or trays), packaging peanuts, candy bar or granola bar wrappers, food, liquids, wax paper, & napkins in commingled recycling bins. However, if you have clean StyrofoamTM chunks, they can be recycled: http://uabf.asu.edu/recycling_styrofoam. Packaging peanuts & other packaging materials can be taken to UPS for reuse: http://uabf.asu.edu/recycling_packaging.
80

APPENDIX D
CITY OF TEMPE COMMERCIAL COMINGLED RECYCLING LIST
81

82

The items/substances listed below may not be placed in the recycling container
Unacceptable Materials Please do not place the following items/substances in the City of Tempe
Municipal Recycling Containers
• Styrofoam (packaging and peanuts)
• Plastic bags, shrink, and bubble wrap
• Plastic utensils (forks, knives, etc.)
• Food waste or liquids of any kind
• Paper towels, napkins, facial and toilet tissue
• Waxed coated fast food beverage cups
• Six pack plastic beverage rings • Self-sealing or cardboard mailing
envelopes with padding or bubble wrap
• Stained glass, light blubs, mirrors, porcelain and ceramics • Cereal box inserts
• Chemical containers • Dog or cat food bags
83