Responsibility Centered Management (RCM) Case Study: Engineering and Technology By H. Öner...
36
Responsibility Centered Management (RCM) Case Study: Engineering and Technology By H. Öner Yurtseven Indiana University Purdue University Indianapolis March 1, 2006 Asian Institute of Technology, Thailand
-
Upload
cassandra-armstrong -
Category
Documents
-
view
222 -
download
4
Transcript of Responsibility Centered Management (RCM) Case Study: Engineering and Technology By H. Öner...

Responsibility Centered Management (RCM)
Case Study: Engineering and Technology
By
H. Öner Yurtseven
Indiana University Purdue University Indianapolis
March 1, 2006
Asian Institute of Technology, Thailand

Indiana University• Largest state funded university in Indiana
• Eight campuses with 92,619 students
• Two core and six regional campuses– Indiana University, Bloomington (36,200 students)– Indiana University Purdue University Indianapolis
(28,193 students)– Each campus has a chancellor reporting to Indiana
University President– IUPUI Chancellor is also Indiana University
Executive Vice President

Indiana University -2
• Centralized budgeting and administration – Vice President and Chief Financial Officer for
all eight campuses– Vice Chancellor for Administration and
Finance at IUPUI reports to the Chief Financial Officer and also to the Chancellor of IUPUI
– Similar arrangements are in place for Bloomington campus and for all regional campuses

Indiana University Purdue University Indianapolis (IUPUI)
• Urban and research campus
• Comprehensive (liberal arts, business, medicine, science, engineering and technology, etc.)
• 16 Indiana University Schools
• 2 Purdue University Schools
• Merger of IU and Purdue: 1969
• Over 180 degree programs are offered
• The second largest School of Medicine in US
• The largest School of Nursing in US

IUPUI -2
• Each of the academic units has budget director and/or assistant/associate dean for finances who reports to dean of the school directly
• They are liaisons to IUPUI Budget Office and to University Budget Office
• They meet monthly with Vice Chancellor for Finance and Administration

Purdue School of Engineering and Technology
• Degree programs– 2 year AS programs in technology– 4 year BS programs in engineering and technology– MS programs in engineering and technology– PhD programs in engineering
• Size– 2,100 undergraduate and 200 graduate students– 80 full-time and 75 part-time faculty, 30 staff – Teach 48,000 credit hours/year with $3.5M annual research
• Organizational structure– 3 engineering and 5 technology departments– Centralized support services

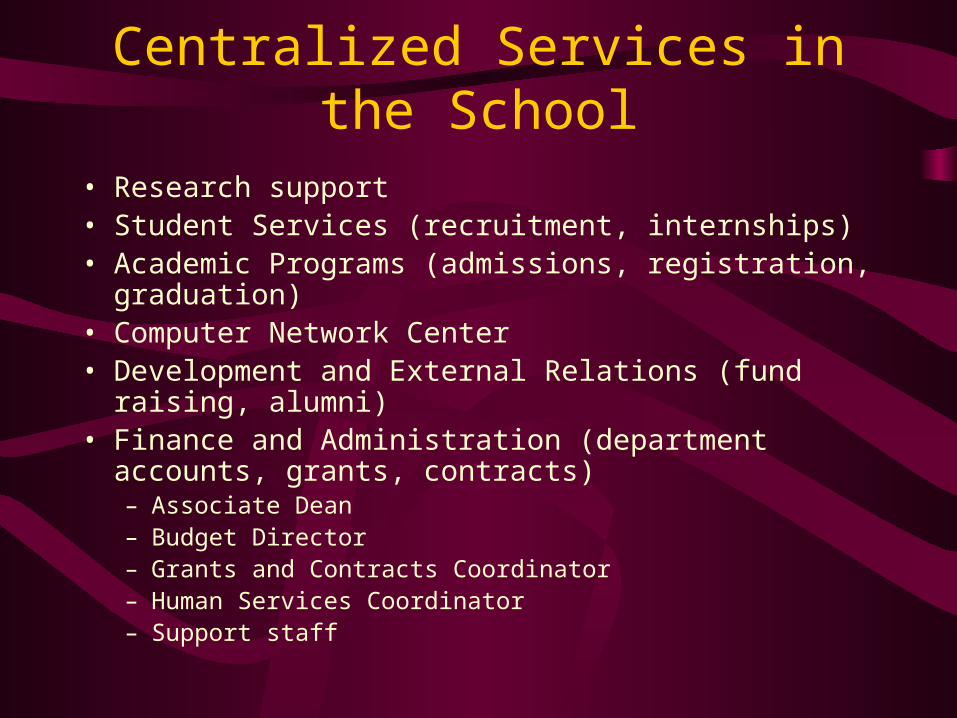
Centralized Services in the School
• Research support• Student Services (recruitment, internships)• Academic Programs (admissions, registration, graduation)• Computer Network Center• Development and External Relations (fund raising, alumni)• Finance and Administration (department accounts, grants,
contracts)– Associate Dean– Budget Director– Grants and Contracts Coordinator– Human Services Coordinator– Support staff

Objectives for RCM
• Integrate and coordinate both academic and fiscal planning• Decentralize the decision-making to the responsible units• Match costs with benefits and responsibility with authority• Increase awareness of costs and positive incentives for income
generation• Make the tradeoffs between choices more explicit• Foster an “information rich” arena for discourse on the budget• Reward multi-year planning with the carry-forward of
surpluses and deficits

RCM does not
• produce more money for an institution; or
• set academic priorities with its budget.
Thomas Ehrlich - Former President of Indiana University

Basic Principles of RCM• Assign all costs and income attributable to each
academic unit (income from fees and grants; costs of admission and library services)
• Assign cost of a support unit to all academic units (cost of computing services are divided by all academic units using and sharing the services)
• Create appropriate incentives for each academic unit to increase income and reduce costs to further a clear set of academic priorities (allow the academic unit keep the additional fees generated by short courses)

Steps to Establish RCM
• Identify RCM centers
• Create new accounts or consolidate existing accounts
• Attribute income to academic RCM centers
• Assign cost of support RCM centers to all academic RCM centers
• Build budgets

Identifying RCM Centers
• Academic unit carries the academic mission of the university by awarding degrees and bringing income through student fees and research grants and contracts (school of business, college of arts and sciences, combined smaller degree programs)
• Support unit is responsible for providing the services in support of the academic mission and it does not offer degree programs and it usually does not have core faculty (physical plant, library, combined offices of registrar, admissions, and financial aid)
• Executive management coordinates and guides planning efforts among academic and support units, establish policies, and allocates resources to the other RCM centers (chancellor or president’s office, vice presidents, institutional planning office)

Standards for Defining RCM Centers
• Organizational structure
• Clear definition of management responsibility
• Number of centers to reflect size and complexity
• Approximate parity among units
• Intracenter decentralization at the discretion of each center
• Policy issues
• Inclusion of all fund groups

Indiana University Operating Budget (2004-05)
• Income– State appropriation (24%) $530,565,000– Student fees (27%) 680,045,000– Other income (49%) 335,513,000
Total $1,546,123,000
• Expenditures– Compensation (64%) $1,332,963,000– Financial Aid (4%) 86,195,000– Other expenditures (32%) 629,306,000
Total $2,048,464,000

IUPUI Operating Budget* (2005-06) • Income
– State appropriation (45%) $208,249,464– Student fees (41%) 187,545,188– Other income (14%) 62,915,893
Total $458,710,545
• Expenditures– Compensation (63%) $289,562,944– Financial Aid (3%) 11,853,328– Other expenditures (34%) 157,294,273
Total $458,710,545
* General (instructional) Funds only

IUPUI Budget Summary
• General Funds ($458M)– Academic Units: $305M (67%)– Support Units: $153M (33%)
• Auxiliary Funds ($502M)– Grants and contracts– Utilities– Designated funds
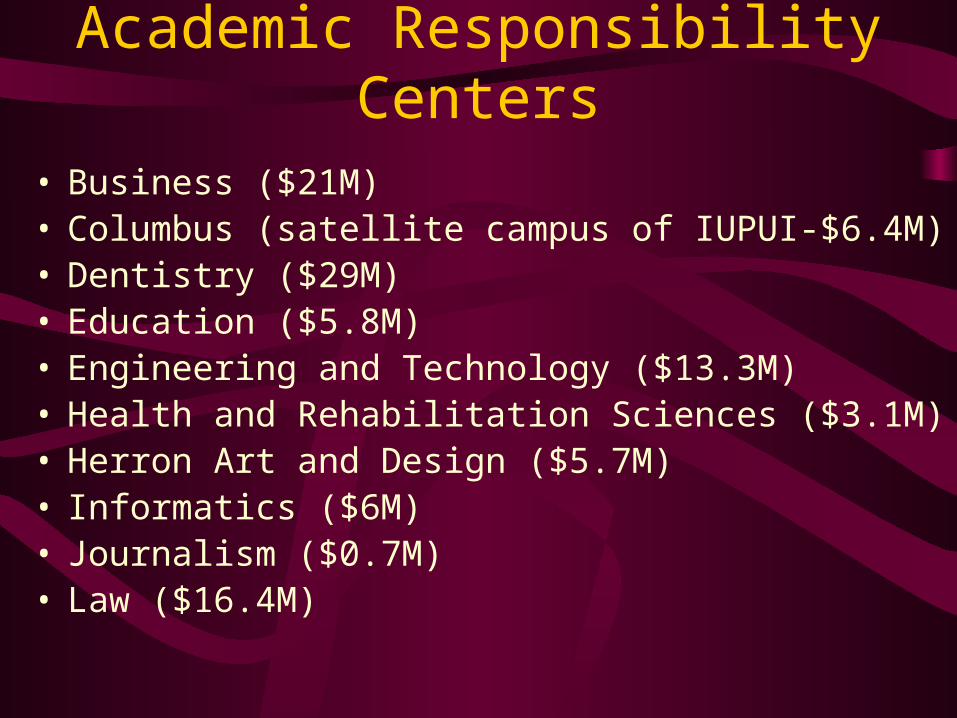
Academic Responsibility Centers
• Business ($21M)• Columbus (satellite campus of IUPUI-$6.4M)• Dentistry ($29M)• Education ($5.8M)• Engineering and Technology ($13.3M)• Health and Rehabilitation Sciences ($3.1M)• Herron Art and Design ($5.7M)• Informatics ($6M)• Journalism ($0.7M)• Law ($16.4M)
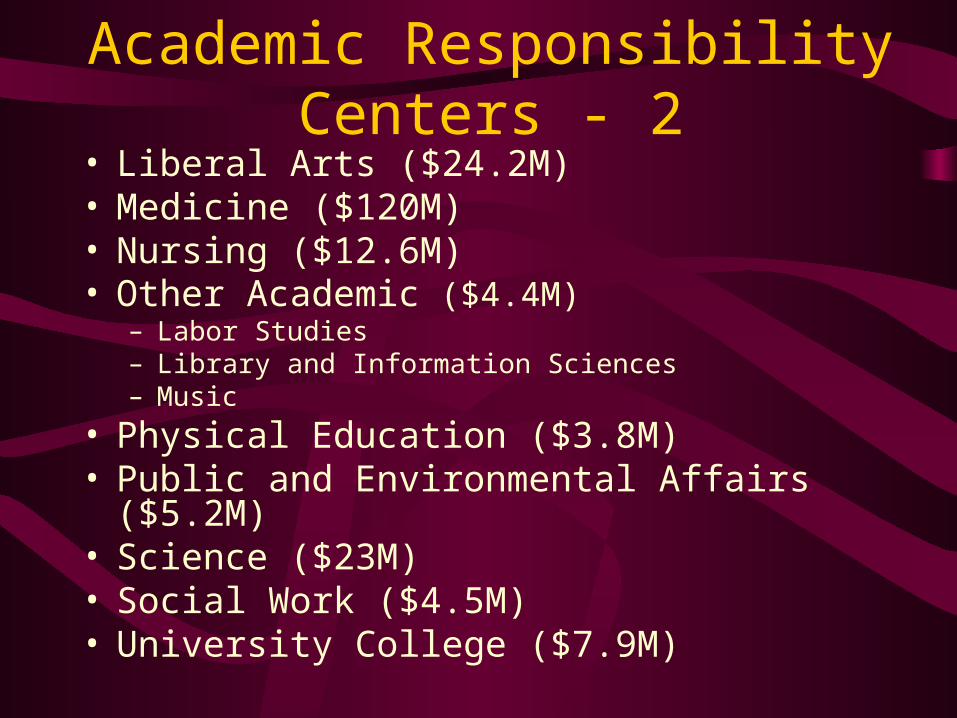
Academic Responsibility Centers - 2• Liberal Arts ($24.2M)• Medicine ($120M)• Nursing ($12.6M)• Other Academic ($4.4M)
– Labor Studies– Library and Information Sciences– Music
• Physical Education ($3.8M)• Public and Environmental Affairs ($5.2M)• Science ($23M)• Social Work ($4.5M)• University College ($7.9M)

Support Responsibility Centers
• Academic Support ($27.5M)• Administration and Finance ($13.2M)• Executive Management ($26.6M)• External Affairs ($2.8M)• Facilities Debt ($18.4M)• Library ($8.6M)• Physical Plant ($41.3M)• University Tax ($14M)• University Information Technology Services ($10.5M)

School of Engineering and Technology 2005-06 Income
• Student Fees (53.2%)• Indirect Cost Recovery (1.8%)• State Appropriation (45%)• Assessment Revenue (29.1%)
Total
• Research Contracts and Grants
Grand Total
$9,817,507
350,000
8,276,130
- 5,368,836
$13,074,801
3,438,458
$16,513,259
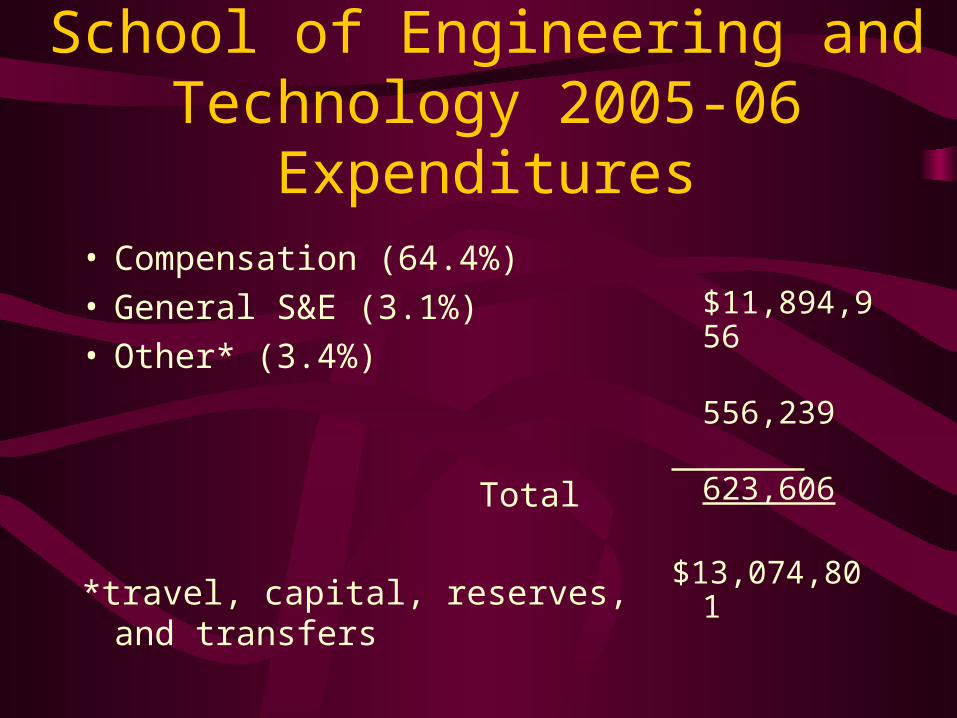
School of Engineering and Technology 2005-06 Expenditures
• Compensation (64.4%)• General S&E (3.1%)• Other* (3.4%)
Total
*travel, capital, reserves, and transfers
$11,894,956 556,239 623,606
$13,074,801

Income Types assigned to RCM Centers
• State support • Student credit hour fees • Course related fees • Other fee income • Indirect cost recovery income • Rent income • Interest income• Gifts and grants• Sales and service income

Methods of Income Attribution
• State support: Combination of a portion based on central administration decision and a portion based on specified performance indicators. In practice, however, IUPUI started with 1987-88 levels funding levels and adjusted the increase and decrease based on the original proportions
• Credit hour fees: Income goes to centers according to courses taught
• Course-related fees: Income goes to centers according to courses taught
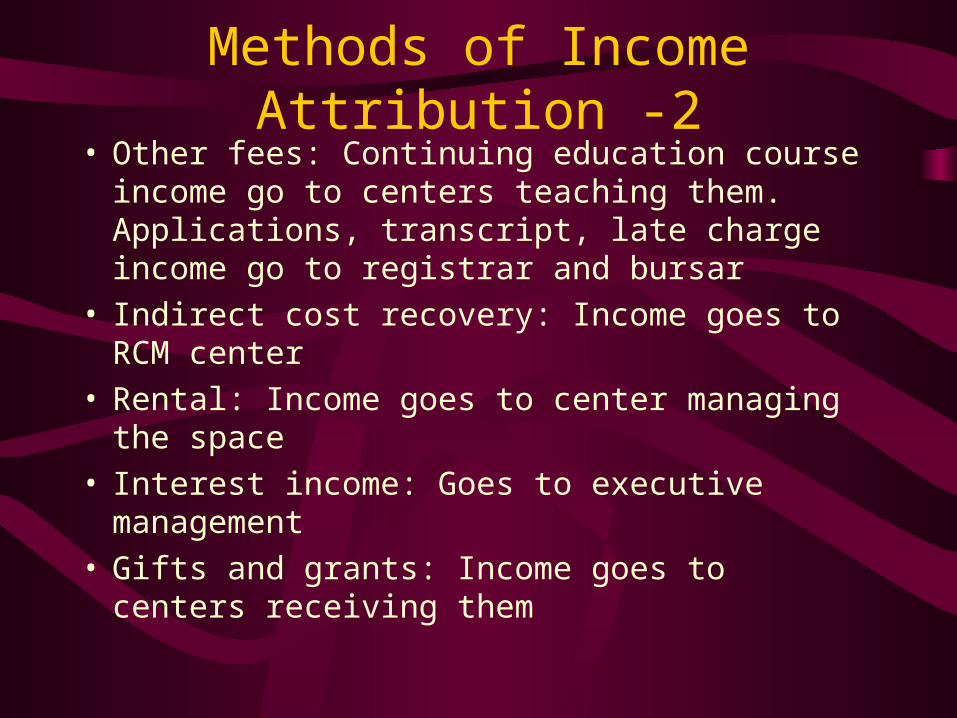
Methods of Income Attribution -2• Other fees: Continuing education course income
go to centers teaching them. Applications, transcript, late charge income go to registrar and bursar
• Indirect cost recovery: Income goes to RCM center
• Rental: Income goes to center managing the space• Interest income: Goes to executive management• Gifts and grants: Income goes to centers receiving
them

Methods of Income Attribution -3
• Auxiliary service charge: Income goes to center managing the services
• Sales and service: Income and other general income go to centers generating the income or to executive management if not determinable

Examples of Income Attribution
• State appropriation– Initial attribution was done in 1987-88 using the
existing distributions– Any change in State funding is carried on to
RCM centers using the same formula
• Indirect cost recovery from research contracts– Campus retains 20%– Schools receive 80%

Assigning Costs to RCM Centers
• Academic Support: academic affairs, research and graduate programs, learning resources, academic personnel
• Administration and Finance: admissions and registrar, student financial aid, bursar, non academic personnel
• Executive Management: Vice president at IUPUI, chancellor, and vice chancellors
• External Affairs: Community relations, alumni

Assigning Costs to RCM Centers -2
• Facilities Debt: Bonding for new buildings• Library• Physical Plant: Buildings, utilities, maintenance• University Tax: Trustees, President and
university wide offices (research, international programs)
• University Information Technology Services: computer networks, computing infrastructure, telecommunication

Examples of Early Cost Allocation
• Library: Weighted total for a center = 1.00 x faculty FTE + 0.05 x undergraduate FTE + 0.25 x graduate student FTE
• Academic computing: Weighted total for a center = (1.00 x faculty FTE + 1.50 x student FTE) x 0.75 x
• Physical Plant: Assigned cost for a center = unit cost x assignable square feet
past unfunded usage for a center
total part unfunded usage for a center

Examples of Early Cost Allocation -2
• Academic Support: Distribute in proportion to credit hour enrollment
• Administration and Finance: Distribute to centers in proportion to total direct expense of general, designated, and restricted funds
• Executive Management: Distribute in proportion to total direct expenses of general, designated, and other restricted funds as well as some auxiliary and service costs

Current Cost Allocation
• Assign the total cost of each support RCM center to academic RCM center using the equal weights of– Student credit hours generated by the unit– Total full-time equivalent of faculty and staff
members– Space in sq ft occupied by the unit

Budget Process • Academic RCM centers report projected student
credit hours for the coming fiscal year to campus budget office (all types of fees)
• Academic RCM centers also report projected indirect cost recovery funds and other income
• Campus budget office determines projected State appropriations and expenditures for each RCM center
• Each RCM center is given a proforma budget based on these projections and based on the assumptions of tuition increases, salary increases, and assessments
• Each RCM center then plans for its budget using the information on proforma

Budget Process -2• At the school level, department/program
budgets are built by using either a similar RCM methodology or traditional budgeting
• Total salary increase budget for faculty and staff are given to chairs/directors to decide
• Indirect cost recovery income is distributed– 20% to PI and 20% to department– 40% stays in the school
• Salary savings are distributed– PI, department, and school share equally

School of Engineering and Technology Assessment Revenues
• Academic Support (22%)• Administrative Affairs (9.6%)• Exe Management-IUPUI (5.3%)• External Affairs (2.8%)• Library (8.2%)• Physical Plant (22%)• University Tax (10%)• UITS (9.5%)
» Total
$ 1,131,253
493,971
275,736
142,489
423,594
1,657,285
528,994
488,136
$5,141,458

Resources
• Responsibility Center Budgeting, Edward L. Whalen, Indiana University Press, 1991
• RCM Review Reports, 1993, 1998, and 2003
• Conversations with Vice Chancellor for Administration and Finance, and with Associate Dean for Finance and Administration in the School