Response to Intervention: A Program Evaluation of ...
154
Gardner-Webb University Digital Commons @ Gardner-Webb University Education Dissertations and Projects School of Education 7-2016 Response to Intervention: A Program Evaluation of Implementation in a Rural School District Angela Garrison Rodgers Gardner-Webb University Follow this and additional works at: hps://digitalcommons.gardner-webb.edu/education_etd Part of the Elementary Education Commons , and the Language and Literacy Education Commons is Dissertation is brought to you for free and open access by the School of Education at Digital Commons @ Gardner-Webb University. It has been accepted for inclusion in Education Dissertations and Projects by an authorized administrator of Digital Commons @ Gardner-Webb University. For more information, please see Copyright and Publishing Info. Recommended Citation Rodgers, Angela Garrison, "Response to Intervention: A Program Evaluation of Implementation in a Rural School District" (2016). Education Dissertations and Projects. 176. hps://digitalcommons.gardner-webb.edu/education_etd/176
Transcript of Response to Intervention: A Program Evaluation of ...

Gardner-Webb UniversityDigital Commons @ Gardner-Webb University
Education Dissertations and Projects School of Education
7-2016
Response to Intervention: A Program Evaluation ofImplementation in a Rural School DistrictAngela Garrison RodgersGardner-Webb University
Follow this and additional works at: https://digitalcommons.gardner-webb.edu/education_etd
Part of the Elementary Education Commons, and the Language and Literacy EducationCommons
This Dissertation is brought to you for free and open access by the School of Education at Digital Commons @ Gardner-Webb University. It has beenaccepted for inclusion in Education Dissertations and Projects by an authorized administrator of Digital Commons @ Gardner-Webb University. Formore information, please see Copyright and Publishing Info.
Recommended CitationRodgers, Angela Garrison, "Response to Intervention: A Program Evaluation of Implementation in a Rural School District" (2016).Education Dissertations and Projects. 176.https://digitalcommons.gardner-webb.edu/education_etd/176

Response to Intervention: A Program Evaluation of Implementation in a Rural School
District
By
Angela Garrison Rodgers
A Dissertation Submitted to the
Gardner-Webb University School of Education
In Partial Fulfillment of the Requirements
For the Degree of Doctor of Education
Gardner-Webb University
2016

ii
Approval Page
This dissertation was submitted by Angela Garrison Rodgers under the direction of the
persons listed below. It was submitted to the Gardner-Webb University School of
Education and approved in partial fulfillment of the requirements for the degree of
Doctor of Education at Gardner-Webb University.
__________________________________ ________________________
Bruce W. Boyles, Ed.D. Date
Committee Chair
_________________________________ ________________________
Michael Fleming, Ed.D. Date
Committee Member
_________________________________ ________________________
Jeffrey Isenhour, Ed.D. Date
Committee Member
_________________________________ ________________________
Jeffrey Rogers, Ph.D. Date
Dean of the Gayle Bolt Price School
of Graduate Studies
iii
Acknowledgements
Completing this dissertation and doctoral program are certainly examples of the
words of Jules Michelet, “Achieving a goal is nothing. The getting there is everything.”
Earning this degree has been a personal goal for many years, delayed for a number of
reasons, but never forgotten. While “the getting there” has been a challenge, I am
humbled and thankful for the support and encouragement of many friends, family, and
colleagues. While it is impossible to acknowledge everyone in this small space, I do
want to say a special thank you to the following for helping me make this goal a reality:
Dr. Bruce Boyles, thank you for serving as the chair of my committee. Harvey
MacKay said, “A goal is a dream with a plan and a timeline.” I appreciate your extra
efforts and long hours to help me realize my goals by working through my plan and
timeline. I know I added to your workload at a time when your plate was full! I am so
thankful for your feedback, advice, support, and counseling. I could not have completed
this process without your direction.
Dr. Jeff Isenhour, thank you for serving on my committee and for your
encouragement. “A picture is worth a thousand words.” Thank you for allowing
members of our cohort to have our pictures made in your doctoral robe. My picture
served as inspiration through this process and will forever be a symbol to me to work
hard to achieve my goals. I appreciate the boost in confidence and the sense of urgency
you provided for completing my dissertation.
Dr. Michael Fleming, thank you for serving on my committee and your faith in
me when I doubt myself. I have been richly blessed to be able to count on your support
and guidance throughout the years. Words cannot express how much I appreciate you!
Blessings to you, my friend!

iv
Barbara, KP, and John, thank you for your help! I am grateful for your expertise,
your time, and your support.
Andy, my precious husband, I thank you for allowing me to chase this dream. I
realize it took both of us to make it happen. I appreciate your tolerating my weekends
away for class, taking on extra household duties, providing quiet time for me to write,
and encouraging me when I was tired and discouraged. Yes, it will soon be time for me
to take back the household duties! And, yes, you can talk to me anytime you want! I
look forward to our “new normal” and the adventures we have ahead of us. I love you so
much!
Finally, I dedicate this project to my parents, Larry and Shirley, and my mother-
in-law, Marlene. Mom and Dad, thank you for instilling in me the importance of hard
work and for encouraging me when I fall short to “try, try again.” Marlene, thank you for
your support and always being my cheerleader! You are all with me in spirit every day,
and I still work hard to make you proud. I love you and miss you!

v
Abstract
Response to Intervention: A Program Evaluation of Implementation in a Rural School
District. Rodgers, Angela Garrison, 2016: Dissertation, Gardner-Webb University,
Response to Intervention/Program Evaluation/Fidelity/Program Implementation/
Academic Support Services
The acquisition of reading skills is a key component to a student’s academic progress and
success in life. Effectively implemented early intervention programs have been shown to
improve reading performance of struggling readers. The purpose of this study was to
conduct a CIPP program evaluation of the implementation of a Response to Intervention
(RTI) Program in a rural school district. The focus of this study was an RTI program in
its second year of full implementation in kindergarten and first grade in 15 elementary
schools. This mixed-method study utilized data gathered from reading achievement and
special education referral data, district-level and school-level administrator interviews, a
teacher survey, and focus groups.
Findings from this study indicated there was no significant difference in reading
achievement and special education referral data in the 2 years of program
implementation. Administrators and teachers demonstrated knowledge of the purpose
and key elements of an RTI program, but fidelity of program implementation was an area
identified for improvement. Recommendations included clearly defining and
communicating program expectations to improve fidelity of implementation. In addition,
careful review, selection, and alignment of screening tools, intervention resources, and
progress monitoring measures were recommended to improve consistency of
implementation from school to school.
The RTI program evaluated in this study was in its second year of implementation.
Results of this program evaluation provided formative assessment data of the program’s
strengths and weaknesses. The results of this study could be useful to district- and
school-level administrators and teachers as they continue to work to implement an
effective RTI program designed to meet the needs of struggling kindergarten and first-
grade readers.
vi
Table of Contents
Page
Chapter 1: Introduction ........................................................................................................1
Introduction ..........................................................................................................................1
Historical Reform.................................................................................................................3
Background Data .................................................................................................................5
Overview of RTI ..................................................................................................................8
Statement of Problem .........................................................................................................10
Setting ................................................................................................................................11
Purpose of Study ................................................................................................................13
Overview of Methodology .................................................................................................13
Research Questions ............................................................................................................14
Definition of Terms............................................................................................................14
Chapter 2: Literature Review .............................................................................................16
Overview of the Chapter ....................................................................................................16
Effective Reading Instruction ............................................................................................16
Factors Leading to Reading Difficulty ..............................................................................21
RTI .....................................................................................................................................26
Tier 1–Effective Core Instruction ......................................................................................31
Tier 2–Supplemental Interventions ....................................................................................32
Tier 3–Intensive Interventions ...........................................................................................33
Implementing RTI for the Right Reasons ..........................................................................34
Essential Guiding Principles of RTI ..................................................................................35
Chapter Summary ..............................................................................................................39
Chapter 3: Methodology ....................................................................................................40
Problem Statement .............................................................................................................40
Methodology ......................................................................................................................41
CIPP Evaluation Model .....................................................................................................42
Research Site and Participants ...........................................................................................43
Research Questions ............................................................................................................43
Instruments .........................................................................................................................44
Limitations .........................................................................................................................51
Delimitations ......................................................................................................................51
Chapter Summary ..............................................................................................................52
Chapter 4: Results ..............................................................................................................53
Instruction ..........................................................................................................................53
Research Questions ............................................................................................................53
Setting and Participants......................................................................................................54
Overview ............................................................................................................................54
Quantitative Data Analysis ................................................................................................55
Teacher Survey ..................................................................................................................60
Interviews ...........................................................................................................................89
Focus Groups .....................................................................................................................97
Chapter Summary ............................................................................................................102
Chapter 5: Summary and Conclusions .............................................................................104
Introduction ......................................................................................................................104
Restatement of the Problem .............................................................................................104

vii
Research Questions ..........................................................................................................105
Summary of Findings .......................................................................................................105
Data Collection ................................................................................................................105
Context Evaluation Results ..............................................................................................106
Research Question 1 ........................................................................................................107
Input Evaluation Results ..................................................................................................108
Research Question 2 ........................................................................................................110
Process Evaluation Results ..............................................................................................110
Research Question 3 ........................................................................................................112
Product Evaluation Results ..............................................................................................113
Research Question 4 ........................................................................................................115
Conclusions ......................................................................................................................116
Recommendations ............................................................................................................118
Recommendations for Further Research ..........................................................................122
Limitations .......................................................................................................................123
Delimitations ....................................................................................................................124
References ........................................................................................................................125
Appendices
A Teacher Electronic Survey ...................................................................................133
B Focus Group .........................................................................................................141
C District Approval Letter .......................................................................................144
Tables
1 Descriptive Statistics: Spring Primary Map Reading Subtest–All Students ..........55
2 ANOVA Results: All Students Primary MAP Reading Scores–Spring
Reading Percentiles ................................................................................................56
3 Descriptive Statistics: Spring Primary MAP Reading Subtest–Kindergarten
Students ..................................................................................................................56
4 ANOVA Results: Kindergarten Primary MAP Reading Scores–Spring
Reading Percentiles ................................................................................................57
5 Descriptive Statistics: Spring Primary MAP Reading Subtest–First Grade
Students ..................................................................................................................57
6 ANOVA Results: First Grade Primary MAP Reading Scores–Spring
Reading Percentiles ................................................................................................58
7 Descriptive Data: Special Education Referrals–2010-2011 through
2014-2015 ..............................................................................................................59
8 Special Education Referral Data–Chi-Square Results ...........................................60
9 Years at Current Grade Level: Demographic Responses for All
Respondents, Kindergarten Teachers, and First-Grade Teachers ..........................62
10 Years of Teaching Experience: Demographic Responses for All
Respondents, Kindergarten Teachers, and First-Grade Teachers ..........................63
11 Highest Degree Earned: Demographic Responses for All Respondents,
Kindergarten Teachers, and First-Grade Teachers ................................................63
12 Survey Responses: All Participant Responses–Questions 5-9 (Context) ..............66

viii
13 Survey Responses: Kindergarten Paricipants–Questions 5-9 (Context) ................67
14 Survey Responses: First-Grade Participants–Questions 5-9 (Context) .................68
15 Fisher’s Exact Test Results–Questions 5-9 (Context) ...........................................69
16 Survey Responses: All Participants–Questions 10-14 (Input) ...............................71
17 Survey Responses: Kindergarten Teachers–Questions 10-14 (Input) ...................72
18 Survey Responses: First-Grade Teachers–Questions 10-14 (Input) ......................73
19 Fisher’s Exact Test Results–Questions 10-14 (Input) ...........................................75
20 Survey Responses: All Participants–Questions 15-22 (Process) ...........................78
21 Survey Responses: Kindergarten Teachers–Questions 15-22 (Process) ...............79
22 Survey Responses: First-Grade Teachers–Questions 15-22 (Process) ..................80
23 Fisher’s Exact Test Results–Questions 15-22 (Process) ........................................82
24 Survey Responses: All Participants–Questions 23-28 (Product) ...........................86
25 Survey Responses: Kindergarten Teachers–Questions 23-28 (Product) ...............87
26 Survey Responses: First-Grade Teachers–Questions 23-28 (Product) ..................88
27 Fisher’s Exact Test Results–Questions 23-28 (Product) .......................................89
28 Common Themes Identified from Interviews with District-Level
Administrators........................................................................................................94
29 Common Themes Identified from Interviews Conducted with
School-Level Administrators ................................................................................97
30 Common Themes Identified from Focus Group Conducted with
Kindergarten Teachers ........................................................................................100
31 Common Themes Identified from Focus Group Conducted with
First-Grade Teachers ...........................................................................................102
1
Chapter 1: Introduction
Introduction
Acquisition of early literacy skills is critical to the overall success of students.
Boushey and Moser (2009) found those who acquired early literacy skills had the tools to
expand their development of knowledge, while those who failed to develop early literacy
skills fell further and further behind other students. If students made only minimal
progress each year, they continued to fall behind year after year. Students who
completed high school with essential reading skills had greater opportunities to be
successful and increased their chances to lead fulfilling adult lives. Often, students who
experienced early reading failure faced difficulty in later grades and in life. By the time
struggling readers reached the secondary grades, they could be in danger of dropping out
of school (Gambrell, 2004). In addition, students whose reading skills failed to keep pace
with their peers experienced serious reading deficits and may have been found in need of
special education. Many students referred to special education programs largely on the
basis of reading failure remained in special education for many years, often for their
entire school careers (Slavin, Karweit, & Wasik, 1992). Students with poor reading skills
may have been at greater risk for poverty, welfare dependency, incarceration, and early
death in their adult lives (Buffum, Mattos, & Weber, 2010).
Children enroll in school with a wide range of backgrounds for reading. Some
enter kindergarten reading while others lack early reading and language experiences.
Additionally, reading difficulties may be the result of biological or neurological deficits
or environmental factors such as ineffective reading instruction, low socioeconomic
status, or limited English proficiency. There may be as much as a 2-year difference in the
range of early reading abilities which expands by third grade. Children who are not

2
minimally skilled readers by the end of third grade are unlikely to become skilled readers
in high school. A student’s future academic success can be predicted by their reading
level at the end of third grade. With wide differences in reading abilities, kindergarten
teachers often find themselves identifying students as at risk for reading failure in the first
year of school (Wolfe & Nevills, 2004).
Studies have shown early intervention can dramatically improve the likelihood of
success for students considered at risk due to poor early reading performance.
Intervention refers to systematic and intentional efforts to provide supplemental
education to at-risk students. Effective interventions identified and targeted students
from the moment they began to struggle (Neuman, 2007). In his testimony before the
Subcommittee on Education Reform of the U.S. House of Representatives in 2001, Dr.
G. Reid Lyon, chief of the Child Development and Behavior Branch of the National
Institute of Child Health and Human Development (NICHD), stated early identification
of struggling readers paired with comprehensive reading interventions could reduce the
number of students reading below level in fourth grade from 38 to 6% or less (Lyon,
2001). Denton and Vaughn (2010) preferred to refer to interventions for young children
as prevention because these students were just beginning to read and additional
instructional assistance was provided with the intention of preventing eventual reading
difficulties. Struggling students provided with regular, intense interventions that go
beyond typical classroom activities with regard to extra time and one-on-one or small
group instruction with a highly trained professional made good progress and avoided
reading difficulty in later school years (Hall, 2006; Neuman, 2007). Kotulak (1996)
pointed out there was an increasing number of children labeled learning disabled because
of difficulties learning to read. This number was significantly reduced through the use of
3
early interventions designed to prevent reading difficulties. Denton and Vaughn (2010)
reported “prereferral intervention” (p. 80) reduced the overidentification of students with
learning disabilities through intervention provided within general education.
Historical Reform
The Elementary and Secondary Education Act (ESEA), signed into law in 1965
by President Lyndon Baines Johnson, called for full educational opportunity for all.
ESEA sought to improve the quality of elementary and secondary education through
federal grants to state educational agencies. These grants assisted districts with low-
income students, helped districts supply textbooks and library books, and provided
special education centers. ESEA was reauthorized in 2001 under the Bush
Administration as No Child Left Behind (NCLB). NCLB put into place criteria to
identify achievement gaps among underserved students (United States Department of
Education [USDE], 2015). It emphasized all children should have the opportunity to
achieve in school and recognized the importance of well-prepared professionals,
evidence-based practice, and accountability (Pierangelo & Giuliani, 2008). The Reading
First Program, a key academic piece of the reauthorization of NCLB, addressed the need
to ensure all children read proficiently by the end of third grade. Reading First called for
the use of research-based reading and assessment programs. Reading First also indicated
the importance of developing teacher skills to screen and identify student weaknesses in
reading and barriers impeding student progress (USDE, Office of Elementary and
Secondary Education, 2002). Beginning in 2012, President Barack Obama’s
administration began offering flexibility to states with regard to certain requirements of
NCLB. States submitted flexibility waivers that included rigorous and comprehensive
state-developed plans intended to address achievement gaps, increase equity, improve the
4
quality of instruction, and increase outcomes for all students. To date, 42 states, the
District of Columbia, and Puerto Rico have received flexibility from NCLB (USDE,
2015). ESEA was again reauthorized in 2015 as the Every Student Succeeds Act
(ESSA). NCLB waivers will end August 1, 2016 with full implementation of ESSA
expected by the 2017-2018 school year. ESSA builds on school progress gained through
NCLB and continues to require high standards and accountability for students, teachers,
and administrators. Through ESSA, states and local decision makers have the
opportunity to develop programs and systems indicated by student need (“The Every
Student,” 2015). Changes to ESEA known under the reauthorized ESSA have yet to be
regulated or researched and therefore this study primarily references the ESEA version
known as NCLB.
The reauthorization of the Individuals with Disabilities Education Act (IDEA) in
2004 aligned IDEA with NCLB in the call for high-quality education for all children
(Pierangelo & Giuliani, 2008). It allowed states to identify learning disabilities as a lack
of learning progress although evidence-based instructional supports were in place
(Clarke, Gersten, & Newman-Gonchar, 2010). This change to IDEA recommended use
of an evidence-based intervention model rather than the discrepancy model for
identification of students for special education services and called attention to the need
for use of research-based interventions in the general curriculum (McCook, 2006).
Brown-Chidsey and Steege (2005) identified RTI as an evidence-based intervention with
the elements to meet this recommendation. RTI is a framework for teaching reading and
providing intervention strategies for students who struggle (Fisher & Frey, 2010). An
RTI approach provided students with earlier identification through a stronger emphasis
on prevention and a more individual approach through assessment and specially designed

5
instruction. This approach to assisting students who struggle with reading marked a
change to the “wait to fail” (p. 1) approach found with the discrepancy model (Fuchs,
Fuchs, & Vaughn, 2008). While RTI never appeared in IDEA, it is linked to
scientifically based research and evolved as a policy statement within IDEA (Sugai,
Horner, Fixsen, & Blase, 2010). Further, Pierangelo and Giuliani (2008) indicated the
RTI model was the most credible approach to replace the discrepancy model.
With its goal to decrease the number of students reading at an unacceptable level
and to prepare students for success in college, careers, and citizenship, South Carolina
passed the Read to Succeed Act (Read to Succeed) on June 4, 2014. Like NCLB and
IDEA, Read to Succeed called for implementation of a comprehensive and systemic
approach to reading instruction to provide high quality academic experiences for all
students. Read to Succeed required that the state department of education and each
district develop reading plans to address Read to Succeed requirements. The state plan,
approved June 10, 2015, reflected the requirement for interventions in prekindergarten
through Grade 12 for all struggling readers who were not able to comprehend grade-level
texts. More specifically, Read to Succeed required any student in prekindergarten
through Grade 3 who was not demonstrating proficiency based on assessment data or
teacher observation be provided interventions through small-group or individual
instruction. The state reading plan recommended a multi-tiered system of supports
(MTSS) which included RTI (Read to Succeed Team, 2015).
Background Data
Every 3 years, the Programme for International Student Assessment (PISA)
coordinated by the Organization for Economic Cooperation and Development (OECD)
measures the performance of 15-year-old students in math, science, and reading literacy.

6
Founded in 1961, OECD is a group of countries working together to “foster prosperity
and fight poverty through economic growth and financial stability” (OECD, 2015, p. 1).
In 2012, 510,000 students from 65 participating countries completed the PISA
assessment. Six thousand students from the United States were randomly selected from
161 schools to participate. These assessments were designed to provide students with
opportunities to show how well they can apply their skills and competencies. Results for
the United States were reported based on comparisons to the other 34 OECD countries.
In reading, the United States ranked 17th with trend data revealing no significant change
over time (OECD, 2012).
The National Assessment of Educational Progress (NAEP) provides the largest
regularly occurring assessment completed with students from across the country. The
assessment is administered uniformly and remains basically the same from year to year to
allow NAEP to monitor academic progress over time. South Carolina’s 2013 NAEP
scores for fourth-grade reading indicated an average score of 214 which is lower than the
national average of 221. This score has not significantly changed from 2011. Fourth
graders in South Carolina have shown growth on NAEP testing with an increase in the
average score of 11 points since 1994; but performance gaps existed between White
students and African-American, Hispanic, and lower socioeconomic students (USDE,
National Center for Education Statistics, 2013). National reading results from the 2015
administration of NAEP indicated one third of students scoring at the below basic level,
one third of students at the basic level, and one third of students scoring at the proficient
level. Scores for South Carolina fourth graders were not significantly different from
national scores (“The Nation’s,” 2015).
In 2012, a brochure prepared by the South Carolina Education Oversight

7
Committee indicated that one in five South Carolina students in third grade was not
reading on grade level. By eighth grade, one in three students was not reading on grade
level (South Carolina Education Oversight Committee, 2013). Reading results of the
2014 Palmetto Assessment of State Standards (SCPASS) indicated 21.1% of South
Carolina third-grade students scored in the “not met” category. SCPASS scores for third-
grade students in the district represented in this study indicated 20.2% fell in the “not
met” category. This number represented an increase in the number of district third
graders who scored “not met.” In 2012, 12.0% of third graders were “not met”; and in
2013, 12.5% of third graders were “not met” (South Carolina Education Oversight
Committee, 2014). Data analysis of SCPASS and South Carolina’s High School
Assessment results indicated three trends: considerable gaps in literacy achievement were
evident between demographic groups; literacy achievement declined from third grade to
eighth grade; and achievement gaps in literacy increased from third grade to eighth grade
(South Carolina State Department of Education, 2015b).
In the spring of 2015, South Carolina administered ACT Aspire testing to students
in Grades 3-8. This nationally available test was standards-based and provided
information concerning a student’s progress toward college and career readiness (ACT
Aspire LLC, 2015). Scoring benchmarks for this test were “in need of support” (below
the lowest cut score); “close” (at or above the lowest cut score but below the benchmark);
“ready” (at or above the benchmark but below the high cut score); and “exceeding” (at or
above the high cut score). Based on the results of the reading subtest, 48.9% of South
Carolina’s third-grade students scored in need of support; 19.3% scored close; 21.2%
scored ready; and 10.6% scored at the exceeding level (South Carolina State Department
of Education, 2015a). For third-grade students in the district represented in this study,
8
ACT Aspire reading results were as follows: 49.2% scored in need of support; 19.9%
scored close; 20.3% scored ready; and 10.6% scored exceeding (South Carolina State
Department of Education, 2015b).
Students may be identified for special education services through IDEA in a
number of categories including specific learning disability, speech, other health
impairment, autism, hearing or vision impairment, orthopedic impairment, or traumatic
brain injury. In 2011, students ages six through 21 were identified with a disability at the
following rates: nationally, 12.9%; and in South Carolina, 13.7%. Students identified
with a specific learning disability represent the largest percentage of students served
through special education. Nationally, 6% of students are identified in this category and
in South Carolina, 6.2% (USDE, 2013).
Overview of RTI
Fisher and Frey (2010) described RTI as a school improvement process designed
to ensure students received instruction, intervention, and support necessary to be
successful. In the regular classroom, RTI is intentional instruction and intervention
through which a teacher evaluates the needs of a learner and provides research-based
interventions as needed. The teacher monitors the success of the interventions through
assessment data or progress monitoring data. If there is a positive response, the learner
demonstrates progress. If there is no response (student makes no progress), the teacher
diagnoses the student’s difficulty, another intervention is tried, and the process continues.
The purpose of RTI is to make sure students who struggle are not misidentified as
disabled when different and/or more intensive instruction can address their needs.
RTI is a system of intervention based on three tiers that increase in time, intensity,
frequency, and expertise (Fisher & Frey, 2010). Its purpose is to provide all students
9
with interventions as soon as they demonstrate need. Tier 1 represents a rigorous, grade-
level curriculum and highly effective initial teaching. It is important for teachers to
remember that differentiation for individual student needs is essential in Tier 1. Student
needs are addressed by scaffolding content based on student strengths and weaknesses
and meeting with students in small groups (Buffum et al., 2010). Tier 1 meets the needs
of 75-85% of students (Fisher & Frey, 2010). Tier 2 provides an additional layer of
support to students who show signs of falling behind their peers. It offers small group
supplemental intervention that complements the core instruction all students receive.
These interventions take place within the general educational environment in order to
preserve the connection to the core curriculum (Fisher & Frey, 2010). Tier 2
interventions are most effective when they are focused on the cause of a student’s
struggles–a specific deficit skill. Giving students more of what did not work in Tier 1 is
not the intention of Tier 2 (Buffum et al., 2010). Ten to 15% of students may require
Tier 2 intervention (Fisher & Frey, 2010). Tier 3 intervention addresses needs of students
who do not respond to Tier 2 interventions. Tier 3 interventions are more intense and
require more time and smaller group or one-to-one instruction to target specific
weaknesses. These interventions may be needed by 5-10% of students and are provided
by specialists in specific academic content (Fisher & Frey, 2010). Students should
receive Tier 3 interventions in addition to core instruction. To remove students from core
instruction tracks at-risk students into below-grade-level curriculum. By diligently
intervening through the RTI process, a vast majority of students may never need to be
referred for special education testing. Students who do not respond to extra intervention
support may have a learning disability that may result in the need for special education
services (Sornson, Frost, & Burns, 2005).

10
RTI is not intended to be a process to identify students with special needs nor is it
a special education initiative or supplemental intervention program. When properly
implemented, RTI is defined as a schoolwide, systemic, collaborative process in which
all school resources are integrated and focused to ensure that every student learns at high
levels. To successfully implement RTI, staff members must move beyond the cultural
and structural barriers that exist between regular education and special education to create
a cooperative response in which general education instruction and support through an
intervention framework work together to meet the individual needs of every student
(Buffum, Mattos, & Weber, 2009).
Buffum et al. (2010) believed the only way for an organization to successfully
implement RTI was to do so within a professional learning community. Eaker, DuFour,
and DuFour (2002) identified schools that work within the framework of a professional
learning community had a shared mission, vision, values, and goals; collaborative teams
that worked interdependently to achieve common goals; and a focus on results was
evidenced by a commitment to continuous improvement. Schools doing this work had
clarity of purpose and a collaborative culture. Teachers worked together to identify at-
risk students, and teams problem solved to intervene for each student.
Statement of Problem
Reading proficiently is a fundamental life skill with the development of reading
skills serving as the primary foundation for all school-based learning (Wolfe & Nevells,
2004). Research indicated failure to develop early literacy skills has a negative impact on
school performance and success in life. Despite this knowledge, students continue to
perform at below acceptable levels in reading. Teachers are tasked with providing
educational opportunities that support high levels of learning for all students. RTI

11
programs, through the use of data and research-based intervention, have been viewed as a
means to support a wider range of individual student needs and potentially reduce the
number of students who developed reading difficulties. These interventions are designed
to address reading weaknesses before gaps in reading achievement occur (Glover &
Vaughn, 2010). Test scores in the district represented in this study indicated there are
students who are not meeting reading achievement benchmarks. Beginning with the
2017-2018 school year, South Carolina Read to Succeed legislation requires third-grade
students not reading on grade level be retained. For this reason, it is very important that
each student’s reading weaknesses and needs are identified early and addressed through
effective interventions (Read to Succeed Team, 2015).
The impact of an RTI program was determined by the quality of its
implementation (Glover & Vaughn, 2010). Hall (2008) indicated successful
implementation of an RTI program took 3-5 years. The school district represented in this
study is in the early stages of RTI implementation. Four of 15 elementary schools used
in this study were in the third year of implementation after serving as pilot schools for the
program. The remaining 11 elementary schools were in the second year of
implementation. An evaluation of the program was needed to determine the quality of
the RTI implementation in the district and to identify program strengths and weaknesses
in order to make recommendations for continuous improvement.
Setting
The school district selected for this study was a county-wide school system with
16 elementary schools, five middle schools, four high schools, and a career and
technology center. With an annual enrollment of about 16,600 students, the district was
the 12th largest school district in South Carolina. The high school with the largest

12
enrollment in the district had 1,735 students, and the school with the smallest enrollment
was an elementary school with 193 students. The district was composed of five
attendance areas and employed approximately 2,000 staff members including 1,250
certified staff and 800 classified staff (Eby, 2014). There were approximately 50
kindergarten teachers and 57 first-grade teachers in the district. Student enrollment in
kindergarten was approximately 1,010 students and in first grade, 1,042 students.
This district piloted RTI in five elementary schools during the 2013-2014 school
year and implemented the program in the remaining elementary schools the following
year. Each school was required to have a school-level RTI team which met monthly.
This team was made of general education teachers, special education teachers, school
level RTI coordinator, school-level administration, reading interventionist or instructional
coach, guidance counselor, and school psychologist. The team met monthly, analyzed
data, identified students in need of intervention, developed interventions, and discussed
student progress. This program was based on the tiered approach of RTI and included
universal screening and interventions with progress monitoring. Universal screening was
used to identify students in need of intervention. These benchmark screenings were
conducted in the fall, winter, and spring. Students falling in the 33rd percentile or below
were required to have interventions through differentiated instruction as part of their core
curriculum. A parent contact was required for students having difficulty and had to be
documented before a student moved to Tier 2 interventions. Tier 2 interventions were
provided by classroom teachers, teaching assistants, reading interventionists, or other
trained staff. Progress monitoring was required every 10 days for students receiving Tier
2 intervention. If students failed to make progress in Tier 2, they continued to Tier 3
interventions which might have included one-on-one intervention or more time in the

13
intervention process. Progress monitoring continued every 10 days at the Tier 3 level. If
the student did not show progress with Tier 3 interventions, the school-level RTI team
considered a referral for special education evaluation. Kindergarten teachers had access
to the My Sidewalks Early Intervention Program by Pearson. Kindergarten assistants
delivered small-group instruction to struggling readers using My Sidewalks. First-grade
teachers utilized Fountas and Pinnell’s (2016) Leveled Literacy Intervention (LLI) for
small-group intervention. In addition, first-grade students had access to a reading
recovery/reading interventionist who served students in addition to interventions
provided in the regular classroom (J. Harling, personal communication, August 25,
2015).
Purpose of the Study
The purpose of this study was to conduct a program evaluation of an RTI program
recently implemented in 16 elementary schools in a rural school district in South
Carolina. The program was in its third year for five pilot schools and its second year for
the other 11. One of the 16 schools, a pilot school was excluded from the study because
it was one in which this researcher was employed. The study concentrated on
kindergarten and first-grade teachers and students and sought to discover the overall
effectiveness of the RTI program by determining progress toward meeting identified
program goals, assessing the level of fidelity of program implementation, and identifying
the degree to which the program met the needs of struggling kindergarten and first-grade
readers.
Overview of Methodology
This study used a mixed-methods approach using both quantitative and qualitative
measures. The CIPP Evaluation Model developed by Daniel Stufflebeam (2000a) was
14
used for this program evaluation. This evaluation model is made up of four
interconnected evaluations: context, input, process, and product. One use of this
evaluation model is the evaluation of programs within school districts. The CIPP
Evaluation Model was chosen for this study because of its use for evaluating school-
based programs and the potential uses for information discovered from the evaluation. In
addition, methods for collecting data within the CIPP Evaluation Model were varied and
included analyzing data, surveying, and interviewing stakeholders. These methods of
collecting data were consistent with a mixed-methods study approach (Stufflebeam,
2000b). For this study, data were gathered by analyzing reading achievement test data
and special education referral data, conducting interviews, administering a survey, and
gathering responses from focus groups.
Research Questions
Research questions were developed based on the four complementary evaluations
within the CIPP Evaluation Model.
1. What conditions led to the implementation of an RTI program? (Context)
2. Does the RTI program meet the identified needs of struggling kindergarten
and first-grade readers? (Input)
3. To what degree is the RTI program implemented with fidelity? (Process)
4. How effective is the RTI program? (Product)
Definition of Terms
Fidelity of implementation. Classroom instruction at each of the 3 tiers of RTI
is implemented and delivered as designed and intended.
Intervention. Additional instructional support provided to students who are not
mastering instructional content that goes above and beyond instruction presented to all

15
students.
Progress monitoring. Regularly assessing student progress to determine if the
student is making desired academic gains.
RTI. A framework of evidence-based or research-based reading instruction
designed to provide early intervention to students not mastering key reading practices.
Universal screening. Assessing all students in a class or grade level to identify
those who may have difficulties and need additional support.

16
Chapter 2: Literature Review
The purpose of this study was to conduct a program evaluation of an RTI program
recently implemented in elementary schools in a rural school district in South Carolina.
The study concentrated on kindergarten and first-grade teachers and students. The study
sought to discover overall effectiveness of the RTI Program by determining progress
toward meeting identified program goals, assessing the level of fidelity of program
implementation, and identifying the degree to which the program meets the needs of
struggling kindergarten and first-grade readers.
Overview of the Chapter
This chapter provides an overview of effective reading instruction in the primary
grades and factors that may cause students to struggle when learning to read. In addition,
this chapter investigates responses to address needs of struggling readers including the
RTI program. The tiered-approach of the RTI program is discussed in detail along with
guiding principles for effective RTI implementation.
Effective Reading Instruction
Learning to read well is the key to academic success for children. Wolfe and
Nevills (2004) indicated learning to read fluently was a long process beginning in
infancy. Reading is a highly complex skill with most students becoming fluent readers
achieving a basic competency level in middle childhood. Although a small number of
children learn to read before entering kindergarten, most learn with effective, formal
instruction.
Formal reading instruction begins with an effective core curriculum in the
primary grades. This curriculum includes The National Reading Panel’s (NRP) five key
practices of effective reading instruction: phonemic awareness, phonics, fluency,

17
comprehension, and vocabulary (David, 2010; Denton & Vaughn, 2010). Teaching
students to verbally manipulate small segments of sound (phonemes) had a positive
impact on reading and spelling abilities. The panel reported instruction in phonics aided
all children and demonstrated the most improvement in reading instruction. Phonics
instruction emphasized correlations between letters and sounds and how they work
together in spelling and reading. Phonics instruction has been found to particularly
benefit students who struggle with reading and those from backgrounds of poverty.
Students who read with fluency were able to pronounce words at a sufficient rate with
accuracy and expression, increasing their level of understanding. Fluency was often an
overlooked skill in reading instruction. The panel found teaching students specific
reading comprehension strategies helped students improve their understanding of text.
Because readers cannot make meaning of what they read if they do not understand the
words they read, the panel indicated the importance of intentional vocabulary instruction
to improve reading skills (Carnine, Silbert, Kame’enui, Tarver, & Jungjohann, 2006).
Research suggested a link between the size of a child’s vocabulary and reading
comprehension. The greater the child’s vocabulary, the better the child was able to
comprehend what was read (David, 2010).
Providing effective reading instruction to insure all students read proficiently is a
challenging and complicated process. Students who received this type of instruction
were less likely to require specialized instruction to insure acquisition of necessary
reading skills. Effective instruction included not only the content of the five key
practices identified by NRP (phonemic awareness, phonics, fluency, comprehension, and
vocabulary) but also a skilled teacher who coordinated resources and worked with
students according to individual need in order to create a strong overall reading program.

18
Students entered classrooms with varying reading strengths and weaknesses. Successful
reading teachers had high expectations for all students regardless of reading level
(Taylor, 2008). Low teacher expectations may have had a negative impact on student
achievement (Boykin & Noguera, 2011). Good (1987) defined teacher expectations as
assumptions teachers made about a student’s performance based on what they know or
what they perceive about a student. Through his research, Good found teachers based
their expectations of students on a broad range of information including student record
information, test data, and comments from former teachers. These expectations changed
over time as teachers gathered more information about a student. Good indicated some
teachers treated lower and higher achieving students differently resulting in variations in
student achievement. Good identified specific teacher behaviors that communicated
varying expectations. For example, calling on lower achieving students less often than
higher achieving students; providing less academic feedback to lower achieving students;
or giving less wait time for lower achieving students to answer questions were examples
of varying expectations (Good, 1987). In a study conducted with approximately 1,900
elementary students, McKown and Weinstein (2002) found teacher expectations varied
according to students’ racial backgrounds. In addition, student perceptions of their
teachers’ expectations of their ability and performance had an impact on students’ overall
achievement. These researchers found lower expectations for African-American and
Latino students were associated with lower levels of reading achievement (McKown &
Weinstein, 2002).
In order to meet the varying needs of students, teachers must differentiate their
instruction. Tomlinson and Imbeau (2010) defined differentiation as “classroom practice
with a balanced emphasis on individual students and course content” (p. 14).
19
Differentiation involved intentional instructional planning designed to continually
address variations in students’ abilities due to readiness, style of learning, and
background. Teachers who effectively differentiated instruction reflected on classroom
successes and failures and adjusted their practice (Tomlinson & Imbeau, 2010). Based
on the work of Dweck (2006), Tomlinson and Imbeau (2010) described differentiation as
a “growth mind-set endeavor” (p. 33). Dweck indicated teachers demonstrating a growth
mindset believed all students had the capacity to learn if the student was willing to learn
and had support to do so. Teachers with a growth mindset focused on a student’s
potential and work ethic rather than past performance. Students who struggled in the past
made changes to their success level through hard work and determination. High
expectations, a growth mindset, quality learning activities, and teacher instructional
support were all necessary to provide effective instruction to students (Dean, Hubbell,
Pitler, & Stone, 2012).
Taylor, Pearson, Clark, and Walpole (2002) conducted a study with 14 low-
income elementary schools from across the United States. Schools selected for this study
implemented a program of reading reform and demonstrated greater than expected
reading achievement in the primary grades. Taylor’s study sought to identify programs
and instructional practices contributing to the effectiveness of these schools. Results of
the study indicated impoverished students in kindergarten, first, and second grades made
the most progress in reading when a large portion of their reading instruction was
presented in small achievement groups and their progress was monitored on a regular
basis. In addition, students who demonstrated the most growth have plenty of time to
read and apply strategies and skills (Taylor et al., 2002)
The amount of time spent on reading instruction is important. Taylor (2008)

20
stated, “Effective teachers spend 120-135 minutes per day on reading instruction in the
primary grades” (p. 21); however, simply spending time on reading was not enough to
make instruction effective. Effective reading instruction required active involvement of
both teacher and student. Research has shown a positive relationship to students’ reading
growth when higher levels of engagement and active responses were presented during
reading instruction. Organizational elements of time spent on reading were important to
advancing student proficiency. Teachers provided students opportunities to work on
reading skills through whole group, small group, and individual activities. Time spent in
each of these activities was proportioned in order to successfully present content and
provide students with the appropriate amount of time to interact with the teacher and/or
material. Research revealed too much time spent in whole group activities resulted in
passive student interaction, while too much time spent in small group activities required
too much work completed in pairs or individually (Taylor, 2008). Additionally, too much
whole-group instruction and independent work interfered with the inclusion of
supplemental interventions during instruction (Fisher & Frey, 2010). The activities
chosen for student completion during this time should be varied according to student
abilities and needs. In addition to grouping, teachers determined the appropriate amount
of teacher-directed instruction and teacher-supported instruction. The amount of each
was determined by reading content and needs of students and varied according to the
lesson. Teacher-directed instruction was teacher-led and included questioning,
clarification, and retelling of the story. Teacher-supported instruction allowed students to
work with assistance and coaching from the teacher. The level of challenge provided
during reading instruction was impacted by use of high-level and low-level questioning
and by opportunities allowing student engagement through thought-provoking discussion

21
about texts at the student’s level (Taylor, 2008).
Assessment is a key component to purposeful instruction. It was up to the
teacher, through the use of informal and formal assessment data, to determine which
instructional materials and strategies were appropriate to meet the needs of each student.
Making use of a variety of data sources including teacher observation and diagnostic
notes for each student guided teachers as they determined what adjustments were needed
in their instruction in order to insure students at any level of reading proficiency
continued to advance their reading skills. Teachers should understand the needs of
individual students in order to balance time spent working on particular skills. For
example, time spent teaching phonics to students who have already mastered these skills,
particularly in Grades 2 and 3, hindered reading progress. However, for a second-grade
student who struggled with phonics, phonics instruction was appropriate to continue to
build this student’s reading skills (Taylor, 2008).
Factors Leading to Reading Difficulty
Some children struggled with the acquisition of early literacy skills. Many of
these never learned to read fluently enough to derive meaning from what they read.
Wolfe and Nevills (2004) suggested two factors, biological and environmental, that led to
early difficulty with literacy skills acquisition. Biological factors included difficulties
based on structures of the brain; difficult events at birth; genetics, impairments of vision,
hearing, or memory; or attention deficit/hyperactivity disorder. Students with these types
of biological factors struggled making connections between oral language and printed
words (Carnine et al., 2006). Biological factors did not automatically mean that a child
would have difficulty learning to read. Because a young child’s brain is adaptable and
open to change, it is possible to address difficulties caused by biological circumstances

22
through remediation (Wolfe & Nevills, 2004).
Environmental factors also had an impact on a child’s ability to learn to read.
One environmental factor involved instruction provided to the child at school. The
choice and quality of reading programs had a direct impact on effectiveness of reading
instruction as did ability of the teacher who provided the reading instruction. A teacher’s
ability to select appropriate materials to address student needs was critical. There was
evidence suggesting a child who had poor reading instruction in the first year of school
continued to struggle with reading in subsequent grades even with adequate instruction in
the following years. Another environmental factor dealt with students whose first
language is not English. Many students who learn to read in their native language
become proficient readers but struggle when learning to read English (Wolfe & Nevills,
2004).
Poverty was an environmental factor that impacted reading achievement. Jensen
(2009) defined poverty as “a chronic and debilitating condition that results from multiple
adverse synergistic risk factors and affects the mind, body, and soul” (p. 6). Several
different forms of poverty were found under this definition. Situational poverty occurred
when there was a sudden and serious crisis within the family such as death, illness, loss
of employment, or divorce. Families in which two or more generations were born into
poverty did not have skills to better their situations and were considered to be in
generational poverty. Absolute poverty referred to lack of essential resources such as an
adequate home, running water, power, and/or food. Families whose income fell below
the defined poverty level were considered to be in relative poverty. Some families found
themselves in poverty based on where they lived. For example, some who lived in urban
areas encountered stress (urban poverty) from overcrowding or violence. People who

23
lived in rural areas may suffer from rural poverty where there were fewer resources and
services to address critical needs. Children whose families struggled with any form of
poverty were adversely affected. These children often lived in poorer neighborhoods and
had fewer cognitive resources resulting in fewer opportunities to interact with books
and/or build background knowledge (Jenson, 2009; Wolfe & Nevills, 2004). Children
from poverty began school with underdeveloped skills in the areas of oral language and
basic literacy awareness (Carnine et al., 2006). When compared to their middle-class
peers, these ill-prepared children appeared not ready for reading instruction (Harry &
Klingner, 2007). Often, instruction provided for students from poverty failed to consider
these weaknesses resulting in students falling behind from the beginning of their school
careers (Carnine et al., 2006). Dweck (2006) discussed Benjamin Bloom’s work
indicating, with the exception of the 2-3% of children with severe impairments, all
students can learn given “appropriate prior and current conditions of learning” (p. 66).
Students who struggled to read based on either biological or environmental factors
required additional support in order to make satisfactory reading achievement (Carnine et
al., 2006).
Students with delays due to biological or environmental factors required targeted
support to develop early reading skills in order to learn to read at a rate similar to their
peers. Early intervention programs in schools provided these students a systematic
reading program including explicit lesson delivery and data-driven instruction. A
systematic reading program provided activities for students aligned to key components of
reading instruction. These programs included instruction for students who read below, at,
or above grade level. Instruction was very specific and designed to be engaging for
students. These type of tasks helped students achieve mastery. Information was

24
introduced at a rate that allowed students time to practice and develop foundational
reading skills. Teachers gathered information about student progress through the use of
regular assessments. The results of these assessments guided instruction for each student.
This type system of reading was sequenced and consistent as it was implemented from
one grade to the next (Carnine et al., 2006).
In an effort to get help for a student who struggled with reading, teachers might
make a referral for special education services. Students referred by teachers due to
academic difficulty represented 73-90% of students who qualified for special education
services. Students served through special education numbered 13.5% of all students in
K-12 schools (National Education Association [NEA], 2007). Although these students
benefitted from special education instruction, often they were added to special education
when they had unique learning challenges rather than learning disabilities (Harry &
Klinger, 2006). Sailor (2009) cited Lyon (2001) who argued methods for identifying
students with learning disabilities seemed to place failure to make expected grade-level
progress as a deficiency with the child rather than considering other environmental causes
contributing all or part of a lack of success. In addition, Lyon suggested that a learning
disability in many cases was the result of a teaching disability. Research into the process
of placing African-American and Hispanic students into special education indicated, in
some cases, these students received inadequate classroom instruction before the referral
for special education (Harry & Klinger, 2006). NEA referred to overidentification/
labeling of certain demographic groups and minorities as “disproportionality in special
education” (p. 1). Disproportionality resulted in services that may be supplied but not
needed and may have had negative consequences for students because participation in
special education limited participation in challenging curriculum (NEA, 2007).
25
Identifying students for special education when they were not disabled may have other
adverse consequences. The self-confidence of these students may be negatively impacted
when a socially stigmatizing label was placed on them. Students in special education had
less interaction with other academically capable students. In addition, teachers might
have had lower expectations of special education students resulting in fewer academic
opportunities for them (Harry & Klinger, 2006). Graduation rates for students identified
with a disability were lower than those for nondisabled peers. During the 2011-2012
school-year, only 61% of students identified with a disability graduated from high school
(Stetser & Stillwell, 2014).
The Education for All Handicapped Children Act of 1975, also known as PL 94-
142, provided rights and accommodations for all children with disabilities in public
schools. Soon after the law was enacted, concerns arose over the number of students
identified with learning disabilities (Brown-Chidsey, 2007). Data from the time of the
enactment of PL 94-142 until 2002 indicated the number of students identified with a
learning disability increased more than 300%. Approximately 80% of students served
during this time were identified because of difficulties in reading and up to 40% of these
students had not had adequate instruction in reading (USDE, Office of Special Education
and Rehabilitative Services, 2002).
In 1997, NRP was tasked by the U.S. Congress to study research related to best
practices for teaching children to read proficiently. The panel released its report in 2000
and identified five key practices of effective reading instruction. These practices
included specific instruction in phonemic awareness, phonics, fluency, comprehension,
and vocabulary (David, 2010; Denton & Vaughn, 2010). In 2001, the Reading First
Program was enacted by the U.S. Congress with the goal to insure all students read at or

26
above grade level by third grade. The reauthorization of IDEA in 2004 indicated children
cannot be identified for special education service without first having instruction in the
five key practices identified by NRP (Pierangelo & Giuliani, 2008). In addition, IDEA
2004 directed that students could not be identified for special education service because
of poor classroom instruction, reading deficiencies due to a background of poverty, and
lack of competence in speaking and reading English. These new guidelines for
identification resulted in a drop from 5.7% to 4.7% of all students in public school
identified with a specific learning disability (Haynes, 2015).
Language found in PL 94-142 detailing the process for identifying students as
learning disabled led most states to choose the discrepancy model as a means to
determine if a child met the qualifications for special education service. The discrepancy
model was called the “wait to fail” model because a child had to demonstrate a severe
difference between intellectual ability and academic achievement in order to qualify for
special education services. By the time a severe difference was realized, the child was
well behind peers academically (Brown-Chidsey, 2007). IDEA 2004 allowed “the use of
response to scientific, research-based intervention” as an alternative to the discrepancy
based model (Pierangelo & Giuliani, 2008, p. 2). Schools determined eligibility for
special education by a student’s failure to respond to research-based interventions
(Allington, 2011, p. 40).
RTI
The use of research-based interventions coupled with a student’s response to them
is called RTI (Allington, 2011). Brown-Chidsey and Steege (2005) defined RTI as “a
systematic and data-based method for identifying, defining, and resolving students’
academic and/or behavior difficulties” (p. 2). It represented an observation of cause and
27
effect results of an academic intervention and a student’s response to the intervention.
The goal was to plan research-based instructional interventions to allow a student to be
successful (Burns & Gibbons, 2008). RTI was viewed as a prevention model because it
provides support for struggling students as soon as they need it rather than waiting until
achievement levels fall to a point that a discrepancy exists between ability and
achievement (Brown-Chidsey, 2007).
RTI had its beginnings in diagnostic teaching, curriculum-based measurement,
data-based decision making and formative assessment found in the 1970s (Johnson &
Street, 2013). The components of the RTI method have been used in classrooms for a
number of years but have come together as a recognized framework or system known as
RTI. For example, teachers have used specifically designed instruction to address student
academic needs. In addition, students have been assessed to determine academic
progress. With RTI, these two practices are integrated with all students screened and
monitored for academic growth with interventions provided when a specific weakness is
discovered. Monitoring academic success of all students was a core component of RTI
and worked to provide access to quality instruction for all students. Because instructional
practices used with RTI have been verified through research studies, RTI was considered
a scientifically based practice or evidence-based intervention practice. The use of
evidence-based interventions increase the probability for positive outcomes for students
because the interventions have proven successful through research with other groups of
students (Brown-Chidsey & Steege, 2005).
Two USDE policies, NCLB of 2001 and IDEA reauthorized in 2004, called for
the use of evidence-based practice to meet the needs of students (Burns & Gibbons,
2008). In addition, the 2015 reauthorization of ESEA known as ESSA also called for the
28
use of evidence-based instructional practices (“The Every Student,” 2015). NCLB
contained many references to the use of evidence-based instructional methods designed
to enhance learning results for all students including those with learning disabilities,
those for whom English was their second language, and those from low socioeconomic
families (Burns & Gibbons, 2008). Language included in NCLB calls for states to
provide proof of use of specific strategies shown to be effective when working with
struggling students. In addition, NCLB required monitoring student progress as
evidence-based strategies were implemented. Reading First, Early Reading First, and
Even Start were subsections of NCLB emphasizing use of a prevention model to pinpoint
instruction for struggling students (Brown-Chidsey & Steege, 2005). RTI was a
prevention-minded framework that met the requirements of NCLB including use of
specific instructional strategies and progress monitoring.
IDEA pointed out an increase in the number of students receiving special
education services as students with learning disabilities. According to IDEA, data
revealed the majority of these students were identified for special education due to a
weakness in reading. Because of this, IDEA indicated a need for efforts to address the
weaknesses of students who struggle with reading. IDEA included language calling for
inclusion of three elements of evidence-based methods. These three elements were
scientifically based reading instruction, assessment of how a student responded to
intervention, and use of data for decision making. These elements were core principles
found in RTI (Brown-Chidsey & Steege, 2005). Burns, Christ, Boice, and Szadokierski
(2010) indicated research showing RTI programs reduced the number of students
identified with learning disabilities to less than 2% of the student population. NCLB and
IDEA worked together by prescribing a cohesive instructional system with the goal of

29
meeting the needs of all students (DeRuvo, 2010).
While RTI had its beginnings in special education as one method for eligibility
determination, its emphasis on prevention and success for all students placed it,
appropriately, in general education (Sailor, 2009). RTI provided all students with high-
quality instruction including additional time and instructional support to avoid
achievement gaps causing them to fall academically behind their peers. Additional time
was needed for students who learned at different speeds, and additional support was
needed for students who learned differently (Buffum & Mattos, 2015). RTI was a multi-
tiered support system through which students were monitored through use of data and
provided immediate intervention when they had academic difficulty. It was a systems
approach integrating all resources found within the school: regular instruction, remedial
instruction, and special education. All members of a school’s staff had to be committed
to its implementation (Pierangelo & Giuliani, 2008).
While there was no set model for RTI, a generally accepted RTI model had three
tiers of learning support (Pierangelo & Giuliani, 2008). The three tiers were modeled
after levels of care found in public health and prevention. The first tier was similar to
medical services available to all in order to prevent disease. The second tier was like
secondary medical services for patients who, despite prevention efforts, developed an
illness requiring specific treatment. The third tier was related to a third level of medical
service in which a small number of patients developed complications demanding more in-
depth treatment (Johnson & Street, 2013). Within the RTI framework, the first tier
involved high-quality core instruction. The second tier provided supplemental
interventions to students who fell behind their peers despite effective core instruction.
These interventions addressed targeted skill areas and were provided for a short period of

30
time. The third tier provided students who continued to struggle with more intensive
interventions. These interventions were provided for students who had weaknesses in
multiple skill areas not successfully remediated through Tier 2 interventions. Tier 3
provided more intervention time to students and more intensive interventions than Tier 2
(Hall, 2008).
Assessment plays a key role in an RTI program. Universal screening, assessing
all students in a class or grade level, provided data indicating student strengths and
weaknesses. This type of assessment was part of the core curriculum and ideally occurs
three times a year. Universal screening helped identify students who may have
difficulties and need additional support. Progress monitoring provided regular
assessment of students to determine if a student made academic gains within an
instructional program. Progress monitoring took place in all tiers of RTI but was
typically used in Tiers 2 and 3. The assessments used for progress monitoring were
designed to be easy to use and provided readily available data from which teachers and
other school staff made decisions on how best to assist students and effectiveness of
interventions and/or programs. Progress monitoring assessments were given regularly
and served to guide intervention instruction. Within an RTI program, progress-
monitoring results assisted the teacher in determining a student’s response to an
intervention and helped determine which students were in need of additional intervention
(Mellard & Johnson, 2008).
“Fidelity of implementation” (Mellard & Johnson, 2008, p. 118) is important to
the success of an RTI program. There were three areas in which to consider the fidelity
of implementation within an RTI program. The first was the overall school process
which involved the consistency with which the elements of RTI are carried out in the
31
classroom and across grade levels. The second area related to the quality of selected
interventions. Those interventions with a strong research base had a greater chance of
improving student performance. The third area was found at the teacher level and was
determined by the quality in which a teacher implemented instruction, an intervention,
and/or progress monitoring (Mellard & Johnson, 2008). Failure to implement an RTI
program with fidelity at any of these levels resulted in the program becoming ineffective.
While it was important to preserve fidelity of the RTI model and interventions in order to
realize the student academic gains suggested by research, it was difficult to assess the
degree to which fidelity was maintained (McDougal, Graney, Wright, & Ardoin, 2010).
Glover (2010) agreed that it was difficult to assess fidelity of implementation but
suggested several methods for doing so. Collection and analysis of fidelity monitoring by
a variety of stakeholders including administrators, teachers, and specially trained staff
was a suggested means of monitoring fidelity of the program. This information included
self-reflections by teachers implementing the program and observations of
implementation of the program. Professional development for teachers with regard to the
components of the program and selecting appropriate interventions along with
implementation feedback was another approach recommended to encourage
implementation fidelity (Glover, 2010).
Tier 1–Effective Core Instruction
The first and most essential tier of RTI was initial instruction or core instruction
provided every day in classrooms. Effective core instruction addressed needs of 75-85%
of all students (Fisher & Frey, 2010). A strong core curriculum, as discussed at the
beginning of this chapter, was needed to reduce the number of students who need more
intensive interventions. While RTI involved a student’s response to instruction, effective

32
core instruction was responsive to needs of students (Fisher & Frey, 2012). The most
successful Tier 1 instruction provided students with second and third opportunities to
master material before moving on to Tier 2 interventions (Huff, 2015). Through
additional opportunities for mastery, teachers were able to provide timely, focused
interventions and avoided the need for remediation (Harrison, 2015). Too often the
instructional practice was to teach the material once and look outside the classroom for
additional help if students struggled (Huff, 2015). Providing organized reading
instruction filled with challenging opportunities that meet the needs of all students was a
difficult task for a teacher to undertake alone. In order to provide the highest level of
instruction, teachers needed to collaborate with others to reflect on instructional practices
and develop effective curriculum (Taylor, 2008). When teachers worked collaboratively
to reflect on classroom practice; maximize resources; share instructional ideas; and
brainstorm strategies to address student weaknesses, there was a positive impact on Tier 1
instruction (Huff, 2015). It is important to note that RTI was “undermined when schools
relied on Tier 2 and Tier 3 interventions to compensate for inadequate, unresponsive, and
erratic core classroom instruction” (Fisher & Frey, 2010, p. 25).
Tier 2–Supplemental Interventions
Tier 2 interventions were provided for approximately 10-15% of students who did
not make satisfactory progress despite high-quality instruction in the core curriculum
(Fisher & Frey, 2010). Sometimes referred to as “secondary prevention,” the goal of Tier
2 intervention was to close the gap between struggling readers and their on-level peers
(Denton & Vaughn, 2010). This gap was often identified through the universal screening
process (Fisher & Frey, 2010). In order to close this gap, interventions were provided in
addition to regular classroom instruction. Tier 2 interventions were best delivered

33
through small-group instruction to directly address specific skill weaknesses (Burns &
Gibbons, 2008). Because there was a need to quickly improve the reading skills of these
students, interventions had to be highly effective and targeted. These interventions were
presented with a high level of intensity to advance students at a greater rate (Denton &
Vaughn, 2010). Supplemental interventions that went above and beyond regular
classroom instruction provided a smaller setting and more time, occurred more often, and
involved more formal interventions. Students receiving Tier 2 interventions went
through the progress monitoring process to determine how well the provided
interventions were addressing skill weaknesses and how well the student was progressing
(Fisher & Frey, 2010).
Tier 3–Intensive Interventions
Tier 3 interventions were provided for the 5-10% of students who continued to lag
behind their peers even after Tier 1 and Tier 2 instruction. Tier 3 interventions differed
from Tier 2 interventions because they were provided in a smaller group setting, many
times one-to-one by someone with more specialized training. Interventions were often
individualized and targeted to individual student weaknesses (Fisher & Frey, 2010). Tier
3 support was administered in different ways depending on the design of the program.
Some programs declared students eligible for special education services at this point,
while others had a special education teacher provide intensive interventions although the
student was not identified for special education. Other models considered Tier 3
interventions a part of the general education program. Intensive progress monitoring
continued in Tier 3 (Denton & Vaughn, 2010). Providing effective interventions at the
Tier 3 level required a collaborative problem-solving process through which teachers
worked together to identify why students were not succeeding and determined evidence-

34
based interventions to improve student performance (Burns & Gibbons, 2008).
Implementing RTI for the Right Reasons
While there was evidence that effectively implemented RTI programs result in
higher levels of student achievement, there were still schools that struggled with
implementation because of beliefs about the purpose of an RTI program. Buffum et al.
(2010) indicated some schools saw RTI as a new way to refer students to special
education. They provided a few interventions through general education and continued
the process to refer students for special education services. Some viewed the
implementation of RTI as a compliance issue and worked to follow a perceived directive
to put the program in place resulting in little improvement in student achievement.
Others viewed RTI as a way to improve test scores which led to instructional practices
that undermined RTI’s purpose. Finally, some schools sought to blame external factors
such as parent support, lack of student effort, lack of student ability, poverty level, or lack
of funding to explain poor results through RTI. In these situations, it was often
unwillingness to attempt to meet the needs of all students that was the reason behind lack
of RTI success.
However, when implemented well, RTI provided learning benefits to students.
Burns and Gibbons (2008) pointed out, “The goal of RTI is not to identify children who
are ‘truly LD’ or even to improve the diagnostic procedures, but to enhance the learning
of all children” (p. 5). The authors pointed out an RTI program was designed to meet the
special needs of certain students without labeling them as learning disabled. Labeling
students as learning disabled could have a negative impact on teacher expectations for
them and a negative impact on the student’s attitude about their own ability to be
successful in school. RTI was about student success rather than finding children who
35
were learning disabled. The authors pointed out the mindset of those creating and
implementing the RTI program was important to its success. DeRuvo (2010) indicated
one core principle of RTI was that all students, when provided effective instruction
including early identification and appropriate intervention, could learn. For there to be
successful implementation of an RTI program, there had to be a change of thinking
among teachers, instructional staff, and administration. This change of thinking involved
developing the belief that all children had the potential to learn at high levels (Buffum et
al., 2010). The central premise of RTI is “that all students can reach high levels of
achievement if the system is willing (and able) to vary the amount of time students have
to learn and the type of instruction they receive” (Fisher & Frey, 2010, p. 15).
Essential Guiding Principles of RTI
Buffum et al. (2012) developed four guiding principles of RTI. Working
interdependently, these principles guide educators as they develop structures and
programs to insure students learn at high levels. For this purpose, the authors defined
“high levels of learning” as insuring a minimum of a high school education. Anything
less than a high school education did not provide students with skills necessary to be
successful adults. The first of Buffum et al.’s (2012) principles was “collective
responsibility” (p. 9). For the steps/tiers of RTI to be successfully implemented, there
must be ongoing teacher commitment and a sense of collective responsibility within the
school. Collective responsibility referred to a cultural belief that each member of the
organization was accountable for making sure all students learn at high levels (Buffum et
al., 2012). In addition, DeRuvo (2010) indicated the need for a cultural belief that all
students can learn and all students have the right to learn. Buffum et al. (2012) cited
Sergiovanni (1996) when explaining two assertions included in the idea of collective

36
responsibility. The first was educators accepted the premise of being accountable for all
students learning at high levels. The second assertion was “all students” means every
child. In order for implementation of RTI to be as effective as possible, there had to be a
culture aligned to these two assertions. Educators often felt challenged by environmental
situations and lack of educational experiences some students brought to the classroom.
However, research revealed highly effective schools were able to almost completely
overcome the challenges of ill-prepared students (Buffum et al., 2010). Lezotte and
McKee (2002) pointed out that in effective schools, the staff believed they had skills and
expertise necessary to help all students reach mastery.
In order to insure all students learned at high levels, teachers were no longer able
to be solely responsible for all students in their classrooms. Matching resources and
developing interventions within all three tiers was challenging for a classroom teacher
working alone (Sailor, 2009). One teacher did not have all of the knowledge and skills
necessary to meet the learning needs of every child in his or her classroom. In order to
insure high levels of learning for all students, teachers had to collaborate and share their
individual talents and skills to meet a wide variety of student learning needs. Burns and
Gibbons (2008) described collaboration as a critical element in the RTI process. The
authors indicated more effective cooperation was built through “sharing the
responsibility” (p. 59). Teachers shared the responsibility by providing immediate and
ongoing support for students and each other. By working together, teachers shared
instructional responsibility, used group problem-solving strategies, and provided
encouragement for each other (DeRuvo, 2010).
In order to facilitate the type of collaboration needed to effectively implement
RTI, teachers worked together in teams (Buffum et al., 2012). Buffum et al. (2012)

37
recommended use of professional learning communities (PLCs) to build the needed level
of collaboration. PLCs created partnerships among teachers providing emotional and
professional support as they worked together to achieve a common goal–in this case, high
levels of learning for all students (DuFour & Eaker, 1998). RTI collaborative
teams/PLCs allowed teachers to clearly determine what students need to learn. Sailor
(2009) pointed out RTI collaborative groups included representation from general
education and special education. General education teachers were often able to spot
individual student strengths while special education teachers identified strategies to
provide remediation. Working together, teachers developed effective Tier 1 instruction
based on identified student learning goals. Teams/PLCs assisted individual members as
they identified students who struggled and determined ways to differentiate instruction to
meet individual student needs. In addition, teams/PLCs designed and provided Tier 2
supplemental instruction for students who failed to master differentiated Tier 1
instruction and Tier 3 interventions for those who continued to struggle despite Tier 2
support (Buffum et al., 2012).
The second guiding principle of an effective RTI program identified by Buffum et
al. (2012) was “concentrated instruction” (p. 45). Concentrated instruction provided the
roadmap for Tier 1 instruction by clearly identifying the knowledge and skills students
must master. It was important for teachers to review curriculum to ensure it provided
high-quality instruction for all students. In addition, teachers should plan together to
identify materials, resources, and delivery systems (Stuart & Rinaldi, 2009). Burns and
Gibbons (2008) indicated quality instructional planning led to effective instruction.
Working collaboratively to identify specific student knowledge and accompanying skills
was essential to effective implementation of an RTI program. Having a concentrated

38
understanding of necessary curriculum allowed teachers to clearly identify interventions
for specific curricular needs. Through the collaborative process, teachers developed and
monitored Tier 1 instruction and planned when additional time and interventions were
provided to specific students. Additionally, teachers developed formative assessments to
monitor success of Tier 1 instruction (Buffum et al., 2012).
Buffum et al. (2012) stated the third guiding principle of a successful RTI
program was “convergent assessment” (p. 77). Convergent assessment was the process
of identifying student needs, providing instructional interventions, monitoring student
RTIs, and using data to determine the success of interventions. Support for students was
provided systematically and began with identification of student strengths and
weaknesses through universal screening. After specific student needs were determined,
appropriate strategies and interventions were matched to students according to need.
Once interventions were implemented, regular monitoring of student progress took place
to determine the student’s response to the intervention. School-based teams reflected to
determine if interventions provided were successful. If interventions failed to address a
student’s needs, teachers, working together, revised selected interventions and
implemented additional evidence-based interventions in order to ensure student success
(Stuart & Rinaldi, 2009). Convergent assessment “guides instruction, evaluates teaching
effectiveness, and identifies specifically which students are struggling and where they
need help” (Buffum et al., 2010, p. 159).
The fourth guiding principle of a successful RTI program identified by Buffum et
al. (2012) was “certain access” (p. 159). Certain access means there was a school-wide
system in place insuring all students received the support needed to successfully learn at
high levels. Burns and Gibbons (2008) discussed important elements included in an

39
effective school-wide RTI system. School-wide organization included a system for
continuous measurement of student progress with measures in place to identify struggling
students and provide progress monitoring for them. Providing time for teachers to
collaborate and problem solve was vital to the success of the RTI program. Effective
school-wide organization included creating grade-level schedules to provide flexible
student grouping and allow the concentration of resources available to the grade level.
The most important piece of this process was the identification of students in need of
support. Making sure all students who needed support were identified was the
cornerstone of certain access because students with weaknesses who go unidentified will
not learn at high levels (Buffum et al., 2012).
Chapter Summary
Although reading is viewed as a skill vital to one’s success, research indicated too
many students read below expected proficiency levels, resulting in poor academic
performance. While there are many factors leading to underachievement in reading, early
intervention has the potential to provide students with means to overcome challenges
caused by poor reading skills. An RTI program, through the use of early research-based
interventions, progress monitoring, and data analysis, can provide instruction necessary
to address skill deficits. In addition, an effectively implemented RTI program can
provide a schoolwide system designed to address student reading concerns before student
achievement is impacted.

40
Chapter 3: Methodology
Problem Statement
The acquisition of reading skills is a key component to a student’s academic
progress and success in life. Research indicated, however, a number of students read
below expected proficiency levels. NAEP national fourth-grade reading results for 2015
indicated one third of students scoring at the below basic level, one third of students at
the basic level, and one third of students scoring at the proficient level. Scores for South
Carolina fourth graders were not significantly different from national scores (“The
Nation’s,” 2015). In spring 2015, South Carolina administered ACT Aspire testing to
students in Grades 3-8. Scoring benchmarks for this test were “in need of support”
(below the lowest cut score); “close” (at or above the lowest cut score, but below the
benchmark); “ready” (at or above the benchmark, but below the high cut score); and
“exceeding” (at or above the high cut score). Based on the results of the reading subtest,
48.9% of South Carolina’s third-grade students scored in need of support; 19.3% scored
close; 21.2% scored ready; and 10.6% scored at the exceeding level (South Carolina State
Department of Education, 2015a). For third-grade students in the district represented in
this study, ACT Aspire reading results were as follows: 49.2% scored in need of support;
19.9% scored close; 20.3% scored ready; and 10.6% scored exceeding (South Carolina
State Department of Education, 2015b). Intervention provided to students who struggle
with early reading skills can improve reading skills, allowing struggling students to read
on grade level. RTI is a systematic program to provide necessary interventions.
The purpose of this study was to conduct a program evaluation of an RTI program
implemented in a rural school district in South Carolina. This program was implemented
in five pilot elementary schools during the 2013-2014 school year and in the remaining

41
11 elementary schools in the district in the 2014-2015 school year. The study
concentrated on kindergarten and first-grade teachers and students. This study sought to
discover the overall effectiveness of the RTI program by determining progress toward
meeting program goals, assessing the level of fidelity of program implementation, and
identifying the degree to which the program meets the needs of struggling kindergarten
and first-grade readers.
Methodology
This study used a mixed-methods approach using both quantitative and qualitative
measures. The use of mixed methods provided more reliable results due to the range of
approaches used. These approaches included norm-referenced data, rating scales,
interviews, and focus groups. One benefit to the use of a mixed-methods approach was
the way quantitative and qualitative measures worked together. Quantitative measures
provided easily reviewed and summarized standardized data, while qualitative measures
provided a more in-depth look at the program through descriptive information. The use
of both quantitative and qualitative methods allowed for quality control of findings when
the two approaches were integrated (Stufflebeam, 2000a).
“Evaluation is the process of delineating, obtaining, reporting, and applying
descriptive and judgmental information about some object’s merit and worth in order to
guide decision making, support accountability, disseminate effective practices, and
increase understanding of the involved phenomena” (Stufflebeam, 2000b, p. 280).
Program evaluation is important for identifying those aspects of a program that are
working and those that are not. Based on the results of a program evaluation, strengths
can be identified and suggestions for improvement can be made (Stufflebeam & Coryn,
2014). The evaluation of the district’s RTI program provided information for district and
42
school leadership and teachers concerning the program’s strengths and weaknesses and
its impact on student achievement, reading instruction, and teacher collaboration in
kindergarten and first grade. This information can be used to refine areas of strength and
improve areas of weakness within the program in an effort to improve reading instruction
and student reading achievement.
CIPP Evaluation Model
The CIPP Evaluation Model, developed by Daniel Stufflebeam, was used for this
program evaluation. This evaluation model included in its uses the evaluation of
programs within school districts. The CIPP Evaluation Model was chosen for this study
because of its use for evaluating school-based programs and the potential uses for
information discovered from the evaluation. In addition, methods for collecting data
within the CIPP Evaluation Model were varied and included analyzing data and
surveying and interviewing stakeholders. These methods of collecting data were
consistent with a mixed-methods study approach (Stufflebeam, 2000b).
The CIPP Evaluation Model is made up of four interconnected evaluations:
context, input, process, and product. Context evaluation was used to identify the major
elements of the program and served as a program needs assessment. In addition to
assessing needs and program goals, context evaluation also sought to discover challenges
and assets within the program that hinder or aide in meeting the organization’s goals and
mission. Input evaluation was used to assess the program to determine if it is the best
plan based on other programs or research literature for meeting the needs of the intended
group. This evaluation was used to identify processes, procedures, and strategies to meet
target population needs. It was utilized to review the program’s design to determine if it
met identified needs. Process evaluation was used to review the implementation of the
43
program to determine the degree to which program elements were effectively put into
place and to identify implementation problems. Process evaluation allowed for the
discovery of how those involved interpreted the quality of the program. Product
evaluation was used to determine if the program provided desired results. Product
evaluation combined information gathered through context, input, and process
evaluations to identify both intended and unintended outcomes. Information gathered
through product evaluation provided feedback to aide in determining program success
(Stufflebeam, 2000b).
Research Site and Participants
This study was conducted in 15 elementary schools in a rural school district in
South Carolina. The district has 16 elementary schools participating in the RTI program,
but one of the 16 schools was excluded from the study because it is one in which the
researcher is an administrator. The RTI program was in its third year for five pilot
schools and its second year for the other 11. The school in which the researcher was an
administrator was one of the five pilot schools. Participants invited to participate in the
study included kindergarten and first-grade teachers in the 15 selected schools. There
were approximately 50 kindergarten teachers and 57 first-grade teachers in these schools.
Student enrollment in kindergarten was approximately 1,010 students and in first grade,
1,042 students. In addition, two members of district-level administration, the special
service coordinator for elementary education and the director of elementary education,
and 15 building-level administrators participated in this study.
Research Questions
Research questions were developed based on the four complementary evaluations
within the CIPP Evaluation Model. This study sought to answer the following research
44
questions to conduct a program evaluation of the implementation of an RTI program in a
school district.
1. What conditions led to the implementation of an RTI Program? (Context)
2. Does the RTI Program meet the identified needs of struggling kindergarten
and first-grade readers? (Input)
3. To what degree is the RTI Program implemented with fidelity? (Process)
4. How effective is the RTI Program? (Product)
Instruments
Quantitative and qualitative study data gathered and analyzed for this study
included reading achievement test data, special education referral data, and participant
responses from interviews, a teacher survey, and focus groups.
Reading Achievement–Primary Map. Clemens, Shapiro, Hilt-Panahon, and
Gischlar (2011) indicated change to overall student achievement was the most important
first outcome found after the implementation of an RTI program. In addition, the authors
pointed out once there was improvement for all students including targeted interventions
for those who struggle, additional RTI program outcomes were realized such as reduction
to the number of students referred for special education services. This district
administered Primary Map to kindergarten and first-grade students in the spring of each
school year. Primary Map is a computer-adaptive assessment designed to measure
student growth and assist teachers with curriculum development including instructional
differentiation (“Measures of academic,” 2015, p.2). An analysis of variance (ANOVA)
is an inferential statistic commonly used in educational research to determine if there is a
difference between mean scores of more than two groups (Gall, Gall, & Borg, 2005). For
this study, an ANOVA was calculated to analyze Primary Map mean percentile scores in
45
order to determine if there was a difference in student reading achievement between the
groups of students tested in the years 2012 through 2015. Results were reported in tables
for each grade level and all students in the study.
Special education referrals. Special education referrals were analyzed for the
school years 2010-2011 through 2014-2015. Chi square is an inferential statistic used to
determine if results from categorical data differ from an expected rate (Gall et al., 2005).
For this study, chi square was used to determine if there was a change in referral rates in
kindergarten and first grade. An average rate of referrals for 2010-2011 and 2011-2012
was calculated and used as the expected rate for chi-square analysis of referral data for
the years 2012-2013, 2013-2014 (pilot year), and 2014-2015. Results were reported in
tables of descriptive data and chi-square results.
Survey. A survey, found in Appendix A, was used to gather feedback about the
RTI program from kindergarten and first-grade teachers. Five kindergarten and six first-
grade teachers at the researcher’s school pretested the study survey. Research indicated
pretesting the survey allowed the researcher to determine what questions work, determine
if the survey was a good length, and ensure questions were understood (Meta Connects-
Research, Practice & Social Change, 2015). Feedback from these teachers was used to
fine tune the survey. The survey was also reviewed for clarity by the special services
coordinator for elementary education and the director of elementary education.
All kindergarten and first-grade teachers in the 15 participating schools were
invited to participate in the survey. The survey used a five-point Likert scale including
the following options: strongly agree (A); agree (B); neither agree nor disagree (C);
disagree (D); and strongly disagree (E). A Likert scale was chosen because participants
were familiar with this type of scale, making it easier for them to share their answers

46
(Chavez, 2013). The survey included a section for comments after each question.
Participants were invited to participate in the survey by email. Text of the email
invitation is included in Appendix A. The survey was distributed electronically through
the use of Survey Monkey. An electronic survey was chosen because all participants had
access to complete the survey through the district’s email system. Response rates for
electronic surveys have been found to be similar to those for mailed surveys. In addition,
respondents were more likely to type more thorough answers than they would write on a
paper survey. An electronic survey was less expensive and allowed for quicker
responses. Also, an electronic survey provided data collection tools that allowed more
accurate data reporting and ease of working with data (Fitzpatrick, Sanders, & Worthen,
2004). Zheng (2011) indicated 80% of electronic survey responses are collected within 7
days after email invitations are sent, with another 11% collected in the second week. The
survey remained open for responses for 2 weeks. An email reminder indicating the
survey was still open for responses was sent at the end of the first week.
Survey data compiled for each question were analyzed within the CIPP program
evaluation framework to gather information for a formative assessment of the RTI
program. Percentages of teachers responding at each level of the Likert scale (strongly
agree, agree, neither agree nor disagree, disagree, and strongly disagree) for each
question were calculated. Survey question responses were analyzed by kindergarten
teacher responses, first-grade teacher responses, and respondents as a whole. A chi-
square analysis was used to analyze survey data at three response levels: strongly
agree/agree, neither agree nor disagree, and strongly disagree/disagree to determine if
teacher responses differed from an expected rate of 100% strongly agree and agree.
Because this study was a program evaluation, an expected rate of 100% strongly

47
agree/agree was chosen to determine the level of teacher identification of the basic
elements of the program and the degree to which teachers indicated the program was
implemented with fidelity. Tables were created to report survey response data and chi-
square results.
Interviews. Two interviews were conducted–one with the district’s special
services coordinator for elementary education and one with the director of elementary
education. These interviews determined background information that led to the district’s
decision to implement an RTI program, strengths of the implementation of the program,
and challenges to the success of the program. The researcher recorded and transcribed
interviews. Transcript-based analysis is considered the most rigorous type of analyzing
data (Onwuegbuzie, Dickinson, Leech, & Zoran, 2009). Responses were analyzed by
coding and categorizing interview responses. To begin the coding process, the researcher
read through a hard copy of the interview transcript from beginning to end. During a
second reading, the researcher read the transcript, highlighted text, and assigned codes.
Coding was the process of breaking down and organizing data by labeling segments of
information with words or phrases known as codes. Codes helped the researcher
summarize and synthesize data. During a third reading, the researcher reviewed codes
and grouped them into categories or themes (Saldana, 2009). Themes were reviewed and
applied to the elements found in the CIPP Evaluation Model: context, input, process, and
product. Interview data as they relate to the elements of the CIPP Evaluation Model were
presented in narrative form. A table was created to report common themes identified
from interview responses. Questions for these interviews included
1. What conditions led to the district’s decision to implement an RTI program?
(Context)

48
2. Before the implementation of RTI, what programs were in place to address the
needs of struggling kindergarten and first grade readers? (Input)
3. Why was an RTI program selected for use in the district? (Input)
4. What do you feel are the strengths of the program? (Context)
5. What challenges have you observed with the implementation of the program?
(Context)
6. How do you monitor the implementation of the program? (Process)
7. How do you measure the level of the fidelity of implementation of the
program? (Process)
8. How would you rate the quality of the implementation of the program?
(Product)
9. How would you rate the effectiveness of the program? (Product)
Individual interviews were conducted with school-level administrators of the 15
participating elementary schools. These interviews gathered information regarding
implementation of the RTI program, strengths of the implementation of the program, and
challenges to the success of the program. Interviews were recorded, transcribed, and
coded. A table was created to report common themes identified from interview
responses. Questions for these interviews included
1. Before the implementation of RTI, what programs were in place to address the
needs of struggling kindergarten and first-grade readers?
2. What do you feel are the strengths of the program?
3. What challenges have you observed with the implementation of the program?
4. How do you monitor the implementation of the program?
5. How would you rate the quality of the implementation of the program?

49
6. How would you rate the effectiveness of the program?
Focus group. A focus group is a small panel of people chosen based on
knowledge and perspective of a common topic. For this study, implementation of the
RTI program at a particular grade level was the characteristic for selecting participants
for each group. Members of a focus group met face-to-face with a facilitator to discuss
important aspects and themes of the topic (Rossi, Lipsey, & Freeman, 2004). Through
the use of focus groups, participants had the opportunity to share ideas with others in the
group as they discussed programs based on their own individual experiences. Through
their discussions, participants shared their observations and beliefs about the program.
They identified program strengths and weaknesses and recommended changes based on
their experiences. Focus groups are helpful in need assessments and program evaluations
because they can help determine if a program provided desired outcomes (Fitzpatrick et
al., 2004).
For this study, two focus groups, one with kindergarten teachers and one with
first-grade teachers, were used to gather additional information about the RTI program.
Members of two focus groups were randomly selected from kindergarten teachers and
first-grade teachers in the participating schools. Randomly selected participants from
each of the larger groups of participants allowed for generalization of thoughts and
positions of groups as a whole (Trochim, 2006). Focus groups are typically made up of
eight to 12 participants based on similar characteristics. For more complex topics, five to
seven members were recommended. For this study, each focus group was made up of at
least six teachers. Members of each group, kindergarten and first grade, were placed in
alphabetical order by last name. A randomized list was generated using Excel to select
20 potential candidates for each focus group. Randomly selected participants were
50
invited by email to participate in the appropriate grade-level focus group. The text of the
invitation email is included in Appendix B. Follow-up phone calls were made to
potential participants who failed to respond to the email invitations. Selected focus-
group members were given the opportunity to decline the invitation to participate in the
focus group.
A focus-group protocol was developed for this study. The protocol served as an
agenda for the group by outlining topics to be discussed. In addition, the protocol
allowed discussion to flow in a logical manner and set norms for the group by defining
member participation guidelines (Rossi et al., 2004). A protocol for this study’s focus
groups is included in Appendix B. Questions for the focus groups included
1. What are the goals of the RTI program? (Context)
2. What did reading instruction for struggling readers look like in your
classrooms before implementing RTI? (Input)
3. In your opinion, what are the strengths of RTI? (Input)
4. In your opinion, what are the challenges of RTI? (Input)
5. How do you insure the program is implemented with fidelity? (Process)
6. In your opinion, how effective is the RTI program? (Product)
A proxy facilitated both focus groups. A proxy was used to avoid a situation in which
members of a focus group felt they had to respond in a particular way and to minimize
the possibility of bias in participant responses (Latess, 2008). Discussion from each
focus group was audiotaped and transcribed by the researcher. Transcripts were
thoroughly reviewed and coded to identify themes found in focus-group responses.
Themes were reviewed and applied to the elements found in the CIPP Evaluation Model:
context, input, process, and product. Focus-group data, as they relate to the elements of

51
the CIPP Evaluation Model, were presented in narrative form. A table was used to record
the frequency of themes identified from focus-group responses.
On January 28, 2016, permission was granted by the assistant superintendent for
instructional services in the chosen district to conduct this research study. A copy of the
letter granting permission is found in Appendix C.
Limitations
Limitations are possible weaknesses in a study that are beyond the researcher’s
control. Limitations may narrow methodology and conclusions (Baltimore County
Schools, 2015). There were limitations to this study. Because the RTI program began
with a pilot year for four of the district’s elementary schools, the program was
implemented at two different time intervals. Some building-level administrators and
teachers worked with the program for 3 years and some for 2 years resulting in varying
levels of understanding of the program framework. In addition, reading achievement data
and special education referral data reflecting full district RTI implementation was only
available for 1 year. Finally, participant responses may be impacted because the
researcher was an administrator in the district and whose school participated in the pilot
year.
Delimitations
Delimitations are boundaries set by the researcher to focus the study and are
within the researcher’s control (Baltimore County Schools, 2015). This study was
designed within the scope of the CIPP Evaluation Model’s inter-related evaluations of
context, input, process, and product with regard to the implementation of an RTI
program. Development of interventions, professional development, special education
processes, and the role of building-level administrators as facilitators of the program were

52
not within the scope of this study.
Chapter Summary
The purpose of this study was to conduct a CIPP Program Evaluation of an RTI
program recently implemented in elementary schools in a rural school district in South
Carolina. The study concentrated on district- and building-level administrators,
kindergarten and first-grade teachers, reading achievement test results, and special
education referral rates of kindergarten and first-grade students. This study sought to
discover the overall effectiveness of the RTI program by determining progress toward
meeting program goals, assessing the level of fidelity of program implementation, and
identifying the degree to which the program meets the needs of struggling kindergarten
and first-grade readers. Data were collected through the analysis of reading achievement
test data, special education referral data, and use of interviews, teacher survey, and focus
groups. Data were analyzed within the CIPP framework and results reported in order to
provide information as to strengths, weaknesses, and level of success of program
implementation.

53
Chapter 4: Results
Introduction
The acquisition of reading skills is a key component to a student’s academic
progress and success in life. Reading interventions provided to students who struggle
with early reading skills can improve reading progress and allow struggling students to
read on grade level. RTI is a systematic program to provide needed interventions. This
mixed-methods research study was designed to conduct a program evaluation of an RTI
program implemented in a rural school district in South Carolina. The CIPP Program
Evaluation Model was used as the framework for this program evaluation because one of
the uses of this model is to evaluate programs within school districts. The CIPP
Evaluation Model gathered information through four interconnected evaluations: context,
input, process, and product in order to provide information as to strengths, weaknesses,
and level of success of the RTI program implementation (Stufflebeam, 2000b). This
program evaluation identified information to refine areas of strength and improve areas of
weakness within the program in an effort to improve reading instruction and student
reading achievement.
Research Questions
For this study, the following research questions were written based on the CIPP
Evaluation Model:
1. What conditions led to the implementation of an RTI program? (Context)
2. Does the RTI program meet the identified needs of struggling kindergarten
and first-grade readers? (Input)
3. To what degree is the RTI program implemented with fidelity? (Process)
4. How effective is the RTI program? (Product)
54
Setting and Participants
The setting for the research study was a rural school district in South Carolina.
Fifteen schools were included in the study. Four of these schools participated in a pilot
implementation of the RTI program during the 2013-2014 school year. All 15 schools
provided interventions to students through the RTI program during the 2014-2015 and
2015-2016 school years. This study included two members of district leadership: the
special services coordinator for elementary education and the director of elementary
education. Kindergarten and first-grade teachers and building-level administrators from
the 15 schools included in the study were also participants in the study.
Overview
In this chapter, results from data gathered through the analysis of a reading
achievement test and special education referral data, a teacher survey, and interviews
with district-level and school-level administrators were reviewed and analyzed as they
related to the CIPP Evaluation Model: context, input, process, and product. Context
evaluation was used to identify major elements of the program and served as a program
needs assessment. In addition to assessing needs and program goals, context evaluation
was used to discover challenges and assets within a program that hindered or aided in
meeting the organization’s goals and mission. Input evaluation was used to assess the
program to determine if it was the best plan for meeting needs of–in the case of this
study–struggling kindergarten and first-grade readers. Process evaluation was utilized to
review the implementation of the program to determine the degree to which program
elements are effectively put in place and to identify implementation problems. Process
evaluation allowed for the discovery of how those involved interpreted the quality of the
program. Product evaluation was used to combine information gathered through context,

55
input, and process evaluations and identified intended and unintended outcomes. This
information provided feedback to aide in determining program success (Stufflebeam,
2000b).
Quantitative Data Analysis
Primary MAP. Results from 2012, 2013, 2014, and 2015 spring administration
of Primary Map reading subtests were analyzed. Descriptive statistics including mean
percentiles and standard deviation were calculated for each year for all students,
kindergarten students, and first-grade students. In addition, an ANOVA using mean
spring percentiles was calculated for the same groups and same testing years to determine
if there was a difference in test scores between tested groups.
Results for all students indicated a mean percentile score of 55.74 with a standard
deviation of 27.541. The highest mean percentile (56.33) was scored in 2014, and the
lowest mean percentile (54.98) was found in 2015. Descriptive statistics for Primary
Map results for all students are found in Table 1.
Table 1
Descriptive Statistics: Spring Primary Map Reading Subtest – All Students
Year N Mean
Std.
Deviation
Std.
Error
95% Confidence
Interval for Mean
Lower
Bound
Upper
Bound Minimum Maximum
2012 2564 55.77 28.116 .555 54.68 56.86 1 99
2013 2567 55.88 27.461 .542 54.82 56.94 1 99
2014 2604 56.33 26.917 .527 55.29 57.36 1 99
2015 2519 54.98 27.666 .551 53.89 56.06 1 99
Total 10254 55.74 27.541 .272 55.21 56.28 1 99
The one-way ANOVA calculated for Primary Map for all student scores yielded

56
no significant difference between testing groups in kindergarten and first grade (F
(3,10250)=1.064, p>.05). Primary Map scores for all students did not differ significantly
between groups of students tested in 2012, 2013, 2014, and 2015. Primary Map ANOVA
results for all students are found in Table 2.
Table 2
ANOVA Results: All Students Primary MAP Reading Scores-Spring Reading Percentiles
Sum of Squares df Mean Square F Sig.
Between Groups 2421.640 3 807.213 1.064 .363
Within Groups 7774312.390 10250 758.470
Total 7776734.030 10253
In kindergarten, the mean percentile score for the 4 testing years included in the
study was 55.49 with a standard deviation of 28.059. The highest mean percentile
(56.57) was scored in 2014, and the lowest mean percentile (54.47) was found in 2015.
Descriptive statistics for kindergarten Primary Map results are found in Table 3.
Table 3
Descriptive Statistics: Spring Primary MAP Reading Subtest – Kindergarten Students
Year N Mean
Std.
Deviation
Std.
Error
95% Confidence
Interval for Mean
Lower
Bound
Upper
Bound Minimum Maximum
2012 1287 54.70 28.871 .805 53.12 56.28 1 99
2013 1291 56.12 27.724 .772 54.60 57.63 1 99
2014 1336 56.57 27.456 .751 55.10 58.04 1 99
2015 1192 54.47 28.171 .816 52.87 56.07 1 99
Total 5106 55.49 28.059 .393 54.72 56.26 1 99
The one-way ANOVA calculated for kindergarten Primary Map scores yielded no
significant difference between testing groups in kindergarten (F (3,5102)=1.745, p>.05).

57
Kindergarten Primary Map scores did not differ significantly between groups of students
tested in 2012, 2013, 2014, and 2015. ANOVA results for kindergarten Primary Map
scores are found in Table 4.
Table 4
ANOVA Results: Kindergarten Primary MAP Reading Scores – Spring Reading Percentiles
Sum of Squares df Mean Square F Sig.
Between Groups 4118.749 3 1372.916 1.745 .156
Within Groups 4014995.537 5102 786.945
Total 4019114.287 5105
In first grade, the mean percentile score for the 4 testing years included in the
study was 55.99 with a standard deviation of 27.017. The highest mean percentile
(56.85) was scored in 2012, and the lowest mean percentile (55.43) was found in 2015.
Descriptive statistics for first-grade Primary Map scores are found in Table 5.
Table 5
Descriptive Statistics: Spring Primary MAP Reading Subtest–First-Grade Students
Year N Mean
Std.
Deviation
Std.
Error
95% Confidence
Interval for Mean
Lower
Bound
Upper
Bound Minimum Maximum
2012 1277 56.85 27.302 .764 55.35 58.35 1 99
2013 1276 55.64 27.202 .762 54.15 57.14 1 99
2014 1268 56.07 26.345 .740 54.62 57.52 1 99
2015 1327 55.43 27.207 .747 53.97 56.90 1 99
Total 5148 55.99 27.017 .377 55.25 56.73 1 99
Primary Map ANOVA results yielded no significant difference between testing
groups in first grade (F (3,5144)=.694, p>.05). First-grade Primary Map scores did not
differ significantly between testing groups from the baseline year, 2012, and the

58
following years–2013, 2014, and 2015. Descriptive statistics for first-grade Primary Map
scores are found in Table 6.
Table 6
ANOVA Results: First-Grade Primary MAP Reading Scores–Spring Reading Percentiles
Sum of Squares df Mean Square F Sig.
Between Groups 1520.652 3 506.884 .694 .555
Within Groups 3755460.082 5144 730.066
Total 3756980.734 5147
Special education referral data. Special education referral data for kindergarten
and first grade for 5 school years (2010-2011 through 2014-2015) were analyzed.
Percentages of referrals for all students and each grade level were calculated. The data
indicated for each year, first-grade referrals were greater than kindergarten referrals.
Kindergarten and first-grade students referred for special education during the years
analyzed ranged from 2.02% to 2.81%. Special education referral descriptive data for all
students and each grade level are found in Table 7.

59
Table 7
Descriptive Data: Special Education Referrals–2010-2011 through 2014-2015
Year Grade Referred Non-Referred Total Percentage
Students Referred
2010-2011 K 14 1270 1284 1.09
1 36 1156 1192 3.02
Total 50 2426 2476 2.02
2011-2012 K 21 1283 1304 1.61
1 42 1248 1290 3.26
Total 63 2531 2594 2.43
2012-2013 K 17 1288 1305 1.30
1 56 1233 1289 4.43
Total 73 2521 2594 2.81
2013-2014 K 22 1350 1372 1.6
1 48 1246 1294 3.71
Total 70 2596 2666 2.63
2014-2015 K 23 1187 1210 1.90
1 44 1299 1343 3.28
Total 67 2486 2553 2.62
A chi-square test of independence was calculated comparing special education
referral rates to nonreferral rates. The mean referral rate for school years 2010-2011 and
2011-2012 was calculated and used as the expected referral rate. Chi square was
calculated for all students and for each grade level for school years 2012-2013, 2013-
2014, and 2014-2015. No significant relationship was found at any grade or any year. A
summary of chi-square results is found in Table 8.
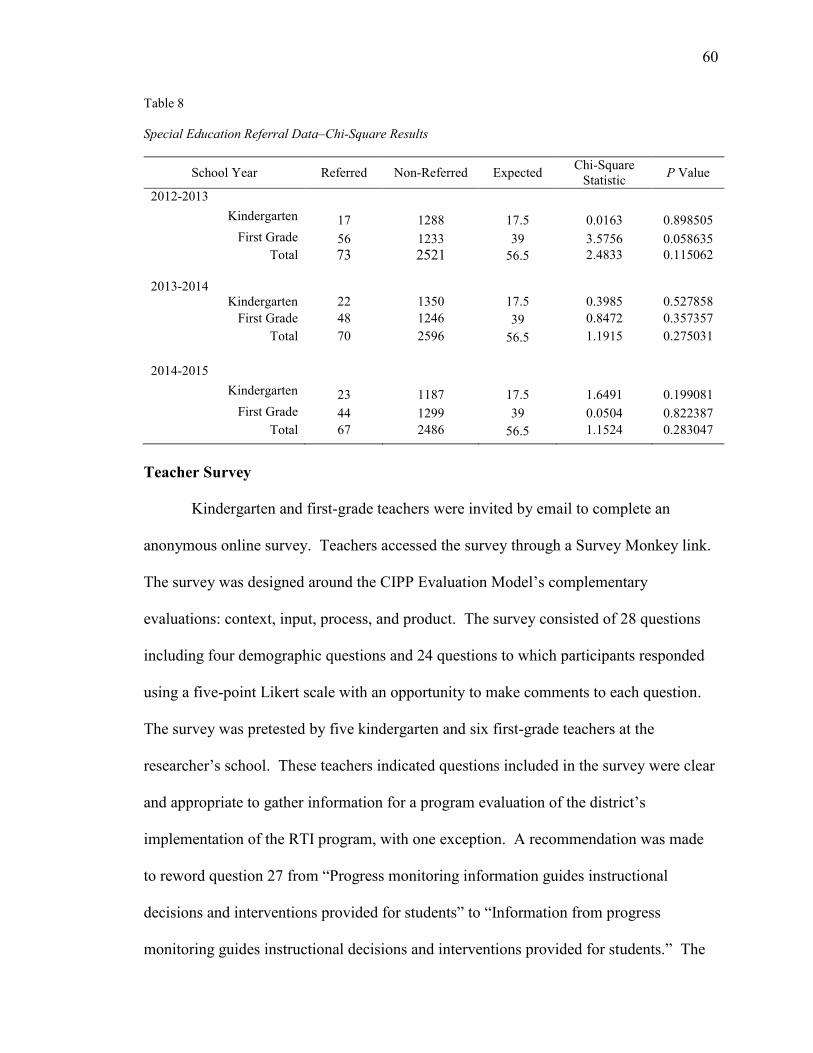
60
Table 8
Special Education Referral Data–Chi-Square Results
School Year Referred Non-Referred Expected Chi-Square
Statistic P Value
2012-2013
Kindergarten 17 1288 17.5 0.0163 0.898505
First Grade 56 1233 39 3.5756 0.058635
Total 73 2521 56.5 2.4833 0.115062
2013-2014
Kindergarten 22 1350 17.5 0.3985 0.527858
First Grade 48 1246 39 0.8472 0.357357
Total 70 2596 56.5 1.1915 0.275031
2014-2015
Kindergarten 23 1187 17.5 1.6491 0.199081
First Grade 44 1299 39 0.0504 0.822387
Total 67 2486 56.5 1.1524 0.283047
Teacher Survey
Kindergarten and first-grade teachers were invited by email to complete an
anonymous online survey. Teachers accessed the survey through a Survey Monkey link.
The survey was designed around the CIPP Evaluation Model’s complementary
evaluations: context, input, process, and product. The survey consisted of 28 questions
including four demographic questions and 24 questions to which participants responded
using a five-point Likert scale with an opportunity to make comments to each question.
The survey was pretested by five kindergarten and six first-grade teachers at the
researcher’s school. These teachers indicated questions included in the survey were clear
and appropriate to gather information for a program evaluation of the district’s
implementation of the RTI program, with one exception. A recommendation was made
to reword question 27 from “Progress monitoring information guides instructional
decisions and interventions provided for students” to “Information from progress
monitoring guides instructional decisions and interventions provided for students.” The

61
teachers made this recommendation because they felt the change in wording made the
question clearer and easier to read. The change was made to this survey question before
the survey was sent to teacher participants.
Kindergarten and first-grade participants were sent an email through the district
email system inviting them to participate in the survey. The email explained the survey
was designed to collect formative assessment data concerning the implementation of the
district’s RTI program. The teachers were informed the survey was anonymous and part
of a dissertation study. The survey remained open for responses for 2 weeks. Teachers
received an email reminding them to complete the survey 1 week from the opening of the
survey. The invitation to participate in the survey was sent to all 107 potential
kindergarten and first-grade teacher participants. Sixty-four teachers or 59.81%
completed the survey. Of all the respondents, 34 were kindergarten teachers and 30 were
first-grade teachers.
The survey was divided into five sections. The first section was a demographic
section to allow teachers to provide information concerning current grade taught, years
teaching at current grade level, years of teaching experience, and highest level of degree
earned. Demographic data were analyzed. The span of years teaching at the current
grade level and years of teaching experience were divided into the following year ranges:
1-5 years, 6-10 years, 11-15 years, 16-20 years, and 21 years and over. The majority of
teachers (kindergarten–41% and first grade–43%) indicated they have been teaching at
their current grade level from 1-5 years. Demographic information with regard to years
teaching at the current grade level is summarized in Table 9.

62
Table 9
Years at Current Grade Level
Demographic Responses for All Respondents, Kindergarten Teachers, and First-Grade Teachers
Years of Experience Teaching Number and Percentages of Responses
at Current Grade Level
All Respondents Kindergarten Teachers First-Grade Teachers
Years n=64 % n=34 % n=30 %
1-5 27 42 14 41 13 43
6-10 17 27 8 24 9 30
11-15 6 9 3 9 3 10
16-20 10 16 8 8 2 7
21+ 4 6 1 1 27 10
Based on responses from all teachers, kindergarten teachers, and first-grade
teachers, percentages of years of teaching experience ranged from 15-27% at each year
range with the exception of first-grade teachers in the 16-20 year range where there were
only 7%. Demographic information with regard to years of teaching experience is
summarized in Table 10.

63
Table 10
Years of Teaching Experience
Demographic Responses for All Respondents, Kindergarten Teachers, and First-Grade Teachers
Years of Teaching Number and Percentages of Responses
Experience
All Respondents Kindergarten Teachers First-Grade Teachers
Years n=64 % n=34 % n=30 %
1-5 13 20 5 15 8 27
6-10 12 19 6 18 6 20
11-15 15 23 7 21 8 27
16-20 10 16 8 24 2 7
21+ 14 22 8 24 6 20
The majority of teachers at each grade level (kindergarten, 69% and first grade,
67%) reported having earned advanced degrees. One kindergarten teacher and two first-
grade teachers indicated National Board Certification. Demographic information with
regard to teachers’ highest degree earned is summarized in Table 11.
Table 11
Highest Degree Earned
Demographic Responses for All Respondents, Kindergarten Teachers, and First-Grade Teachers
All Respondents Kindergarten Teachers First-Grade Teachers
Degree Earned n=64 % n=34 % n=30 %
Bachelor’s 18 30 10 29 9 30
Master’s 44 69 24 71 20 67
Doctorate 1 2 0 0 1 3
Following the demographic section, the remaining 24 survey questions were
divided into four sections, one for each of the four CIPP Program evaluations. Survey
responses were analyzed. Percentages of teachers who strongly agree/agree, neither
agree or disagree, and strongly disagree/disagree to each question were calculated. The

64
effectiveness of the implementation of the RTI program was measured by comparing
teacher response rates in participating schools with an expected response rate of 100%
strongly agree/agree (except for question 14, where the response of strongly
disagree/disagree was expected). Fisher’s Exact Test was used to get the chi-square
statistic. In some instances, survey results included a cell frequency of zero or a
frequency less than five responses. A cell frequency of zero in a regular chi-square test
would render infinity. Fisher’s Exact Test is a more accurate test when using a small
sample size and when expected values are less than five (McDonald, 2014). Teacher
survey data for each of the four CIPP model evaluations are discussed in subsections.
Context evaluation. Questions 5-9 referred to context evaluation. Context
evaluation was used to identify the major elements of the program and served as a
program needs assessment. In addition to assessing needs and program goals, context
evaluation also discovered challenges and assets within a program that hindered or aided
in meeting the organization’s goals and mission (Stufflebeam, 2000b). For questions 5-9,
teachers responded strongly agree or agree at a rate of 85% or higher to all questions with
the exception of question 7. Question 7 asked teachers to rate the following statement,
“All students have the ability to achieve at high levels.” For this question, teachers
responded 55.6% strongly agree or agree, 14.3% neither agree nor disagree, and 30.2%
strongly disagree or disagree. Teacher comments for question 7 indicated teacher
concerns based on the impact of poor student attendance and home life on student
performance. In addition, teachers pointed out “all students can learn, but not all children
can achieve at high levels.” Teachers indicated achieving at high levels was determined
by the child’s ability.
In additional comments provided for questions 5-9, teachers pointed out a well-

65
designed core curriculum was key to the RTI program. They also indicated the
“instructor must also be equally effective.” One teacher stated RTI “begins by providing
diverse, individualized classroom instruction and then moves to more intensive
instruction for those students who need it.” A common theme raised by first-grade
teachers was lack of time to implement intervention reading groups and need for
additional teachers and/or interventionists to assist with the program. First-grade teachers
pointed out a neighboring school district’s RTI program included additional personnel to
assist with progress monitoring and providing interventions.
Responses to questions 5-9 from kindergarten teachers and first-grade teachers
yielded similar percentages. A summary of all participant responses to context questions
5-9 is found in Table 12. A summary of kindergarten teacher responses is found in Table
13. A summary of first-grade teacher responses is found in Table 14. Responses are
reported by percentage in three categories: strongly agree and agree, neither agree or
disagree, and strongly disagree and disagree.

66
Table 12
Survey Responses: All Participant Responses – Questions 5-9 (Context)
CIPP Evaluation Model All Participants Response Percentages
Context (RQ1)
Question SA-A N SD-D Answered Skipped
5. One goal of the RTI program is to
insure all students receive necessary
instruction so that they read on grade
level.
93.5 0.0 6.5 n=62 n=2
6. The RTI program is a general
education initiative.
85.7 9.5 4.8 n=63 n=1
7. All students have the potential to
achieve at high levels.
55.6 14.3 30.2 n=63 n=1
8. An effectively designed core
curriculum is a key component of
RTI.
85.7 9.5 4.8 n=63 n=1
9. RTI is a program designed to provide
high-quality instruction and
interventions according to individual
student needs.
87.3 3.2 9.5 n=63 n=1
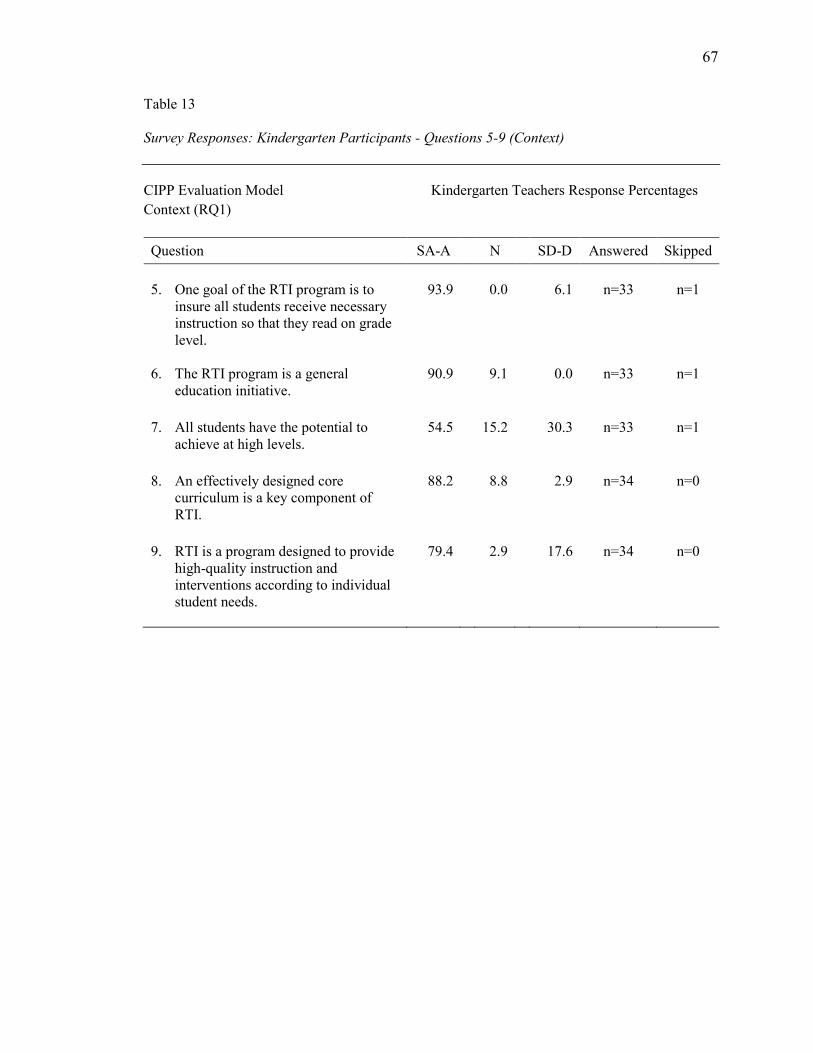
67
Table 13
Survey Responses: Kindergarten Participants - Questions 5-9 (Context)
CIPP Evaluation Model Kindergarten Teachers Response Percentages
Context (RQ1)
Question SA-A N SD-D Answered Skipped
5. One goal of the RTI program is to
insure all students receive necessary
instruction so that they read on grade
level.
93.9 0.0 6.1 n=33 n=1
6. The RTI program is a general
education initiative.
90.9 9.1 0.0 n=33 n=1
7. All students have the potential to
achieve at high levels.
54.5 15.2 30.3 n=33 n=1
8. An effectively designed core
curriculum is a key component of
RTI.
88.2 8.8 2.9 n=34 n=0
9. RTI is a program designed to provide
high-quality instruction and
interventions according to individual
student needs.
79.4 2.9 17.6 n=34 n=0

68
Table 14
Survey Responses: First-Grade Participants - Questions 5-9 (Context)
CIPP Evaluation Model First-Grade-Teachers Response Percentages
Context (RQ1)
Question SA-A N SD-D Answered Skipped
5. One goal of the RTI program is to
insure all students receive necessary
instruction so that they read on grade
level.
93.1 0.0 6.9 n=29 n=1
6. The RTI program is a general
education initiative.
80.0 10.0 10.0 n=30 n=0
7. All students have the potential to
achieve at high levels.
56.7 13.3 30.0 n=30 n=0
8. An effectively designed core
curriculum is a key component of
RTI.
82.8 10.3 6.9 n=29 n=1
9. RTI is a program designed to provide
high-quality instruction and
interventions according to individual
student needs.
93.3 3.3 3.3 n=30 n=0
Fisher’s Exact Test was calculated comparing the frequency of occurrences of
teacher responses in the following categories: strongly agree/agree and neither agree nor
disagree/strongly disagree/disagree to context evaluation survey items. Because this
study was a program evaluation, an expected rate of 100% was chosen. It was
hypothesized that all teachers would be in agreement with survey statements indicating
key components of an RTI program implemented with fidelity. Results of the calculation
indicated significant results for questions 6, 8, and 9 each with a p value of 0.0014,
p<.05. In addition, question 7 yielded significant results with a p value of 0.0000, p<.05.
These results indicate some teachers were in agreement (or identified) with key

69
components of the RTI Program presented in questions 6, 7, 8, and 9. However, teacher
responses were not at the hypothesized 100% expected rate. Question 5 yielded
nonsignificant results, p=.0595, p>.05. Teachers identified the goal of the RTI program
is to insure all students receive necessary instruction so they read on grade level. A
summary of Fisher’s Exact Test calculated for questions 5-9 is found in Table 15.
Table 15
Fisher’s Exact Test Results–Questions 5-9 (Context)
CIPP Evaluation Model Fisher’s Exact Test Results
Context (RQ1)
Question
Agree/
Strongly
Agree
Neither/
Disagree/
Strongly
Disagree
df
Fisher’s
Exact
Test
P< .05
5. One goal of the RTI program is to insure all
students receive necessary instruction so that they
read on grade level.
Teacher Responses 58 4 1 0.0595 Expected 62 0
6. The RTI program is a general education initiative.
Teacher Responses 54 9 1 0.0014
Expected 63 0
7. All students have the potential to achieve at high
levels.
Teacher Responses 35 28 1 0.0000
Expected 63 0
8. An effectively designed core curriculum is a key
component of RTI
RTI Schools 54 9 1 0.0014
Expected 63 0
9. RTI is a program designed to provide high-quality
instruction and interventions according to
individual student needs.
RTI Schools 55 9 1 0.0014
Expected 64 0

70
Input. Survey questions 10-14 dealt with input evaluation. Input evaluation was
used to assess program design to determine if it was the best plan for meeting the needs
of the target population and identified processes, procedures, and strategies to meet target
population needs (Stufflebeam, 2000b). In the case of this study, the target population
was struggling kindergarten and first-grade readers. One-hundred percent of respondents
strongly agreed or agreed to the statement “Interventions are necessary to address the
needs of struggling readers.” Additional comments provided for questions 10-14
indicated teachers felt interventions were crucial and help some children overcome
economic and environment disadvantages. Teachers shared that support from home was
also important to student success. First-grade teachers indicated Reading Recovery was
the most effective intervention in the RTI program. They felt Reading Recovery teachers
possessed the training and specialized skill to work with struggling readers. Some
indicated regular classroom teachers do not have the background and training to address
the needs of multiple struggling readers in one classroom. Teachers indicated they were
not aware of other programs to assist students with reading difficulties. Teacher
comments indicated differing views on the purpose of the RTI program. Some indicated
that RTI was designed to give targeted help to struggling students in order to “avoid
special education identification.” If students fail to make progress, documented RTI
interventions provided documentation should a child be referred for special education
testing. Others felt RTI was part of the process for identifying students for special
education. Teachers expressed concern over students who seemed to need testing for
special education, but the testing process seemed delayed by the RTI Program. A
summary of all participant responses to input questions 10-14 is found in Table 16. A
summary of kindergarten teacher responses is found in Table 17. A summary of first-
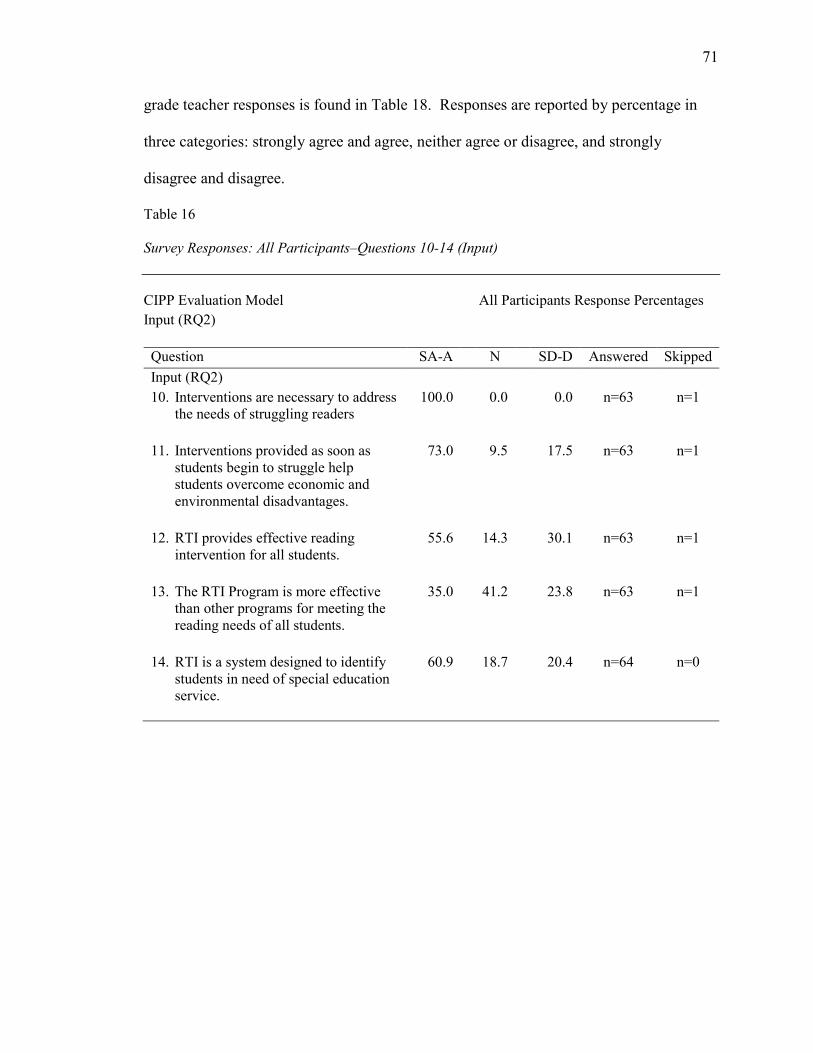
71
grade teacher responses is found in Table 18. Responses are reported by percentage in
three categories: strongly agree and agree, neither agree or disagree, and strongly
disagree and disagree.
Table 16
Survey Responses: All Participants–Questions 10-14 (Input)
CIPP Evaluation Model All Participants Response Percentages
Input (RQ2)
Question SA-A N SD-D Answered Skipped
Input (RQ2)
10. Interventions are necessary to address
the needs of struggling readers
100.0 0.0 0.0 n=63 n=1
11. Interventions provided as soon as
students begin to struggle help
students overcome economic and
environmental disadvantages.
73.0 9.5 17.5 n=63 n=1
12. RTI provides effective reading
intervention for all students.
55.6 14.3 30.1 n=63 n=1
13. The RTI Program is more effective
than other programs for meeting the
reading needs of all students.
35.0 41.2 23.8 n=63 n=1
14. RTI is a system designed to identify
students in need of special education
service.
60.9 18.7 20.4 n=64 n=0
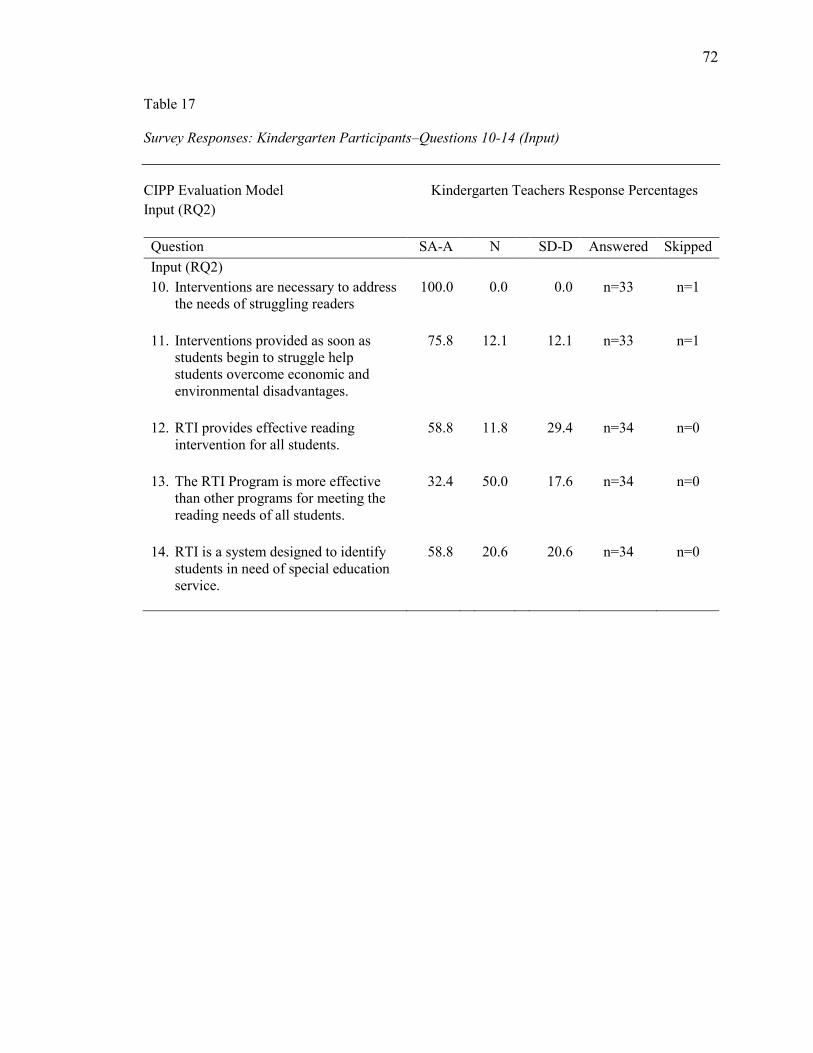
72
Table 17
Survey Responses: Kindergarten Participants–Questions 10-14 (Input)
CIPP Evaluation Model Kindergarten Teachers Response Percentages
Input (RQ2)
Question SA-A N SD-D Answered Skipped
Input (RQ2)
10. Interventions are necessary to address
the needs of struggling readers
100.0 0.0 0.0 n=33 n=1
11. Interventions provided as soon as
students begin to struggle help
students overcome economic and
environmental disadvantages.
75.8 12.1 12.1 n=33 n=1
12. RTI provides effective reading
intervention for all students.
58.8 11.8 29.4 n=34 n=0
13. The RTI Program is more effective
than other programs for meeting the
reading needs of all students.
32.4 50.0 17.6 n=34 n=0
14. RTI is a system designed to identify
students in need of special education
service.
58.8 20.6 20.6 n=34 n=0
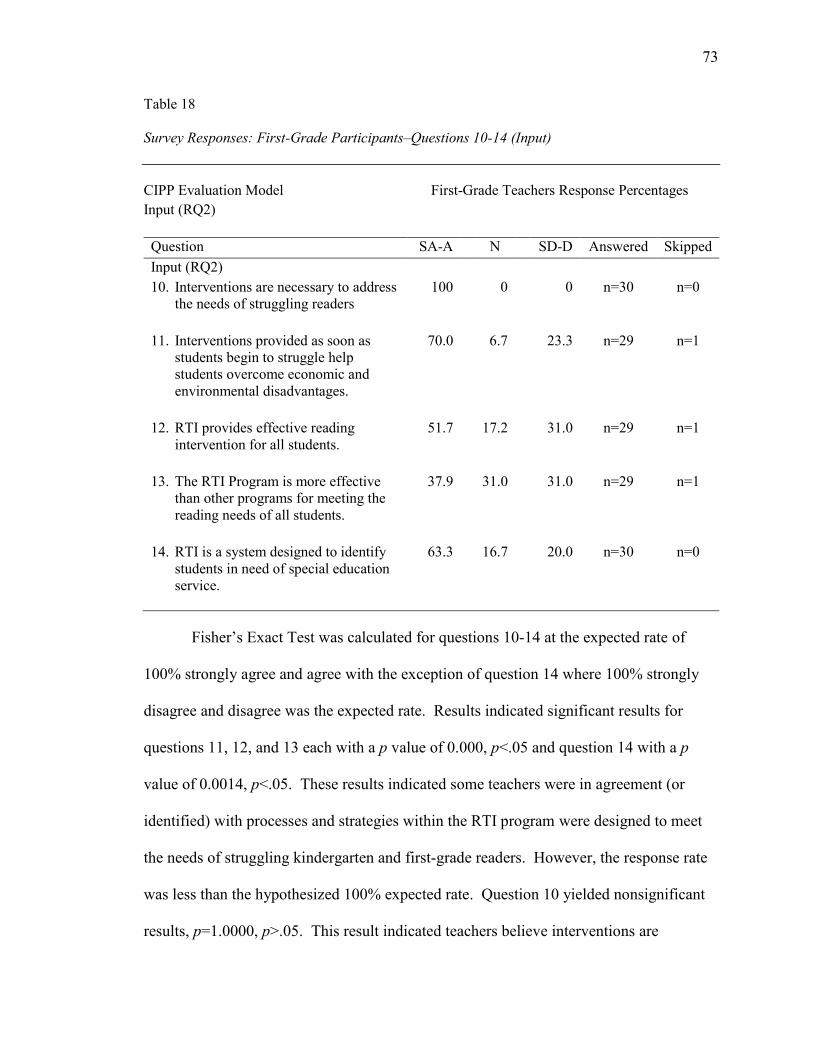
73
Table 18
Survey Responses: First-Grade Participants–Questions 10-14 (Input)
CIPP Evaluation Model First-Grade Teachers Response Percentages
Input (RQ2)
Question SA-A N SD-D Answered Skipped
Input (RQ2)
10. Interventions are necessary to address
the needs of struggling readers
100 0 0 n=30 n=0
11. Interventions provided as soon as
students begin to struggle help
students overcome economic and
environmental disadvantages.
70.0 6.7 23.3 n=29 n=1
12. RTI provides effective reading
intervention for all students.
51.7 17.2 31.0 n=29 n=1
13. The RTI Program is more effective
than other programs for meeting the
reading needs of all students.
37.9 31.0 31.0 n=29 n=1
14. RTI is a system designed to identify
students in need of special education
service.
63.3 16.7 20.0 n=30 n=0
Fisher’s Exact Test was calculated for questions 10-14 at the expected rate of
100% strongly agree and agree with the exception of question 14 where 100% strongly
disagree and disagree was the expected rate. Results indicated significant results for
questions 11, 12, and 13 each with a p value of 0.000, p<.05 and question 14 with a p
value of 0.0014, p<.05. These results indicated some teachers were in agreement (or
identified) with processes and strategies within the RTI program were designed to meet
the needs of struggling kindergarten and first-grade readers. However, the response rate
was less than the hypothesized 100% expected rate. Question 10 yielded nonsignificant
results, p=1.0000, p>.05. This result indicated teachers believe interventions are
74
necessary to address needs of struggling readers. While teachers noted the importance of
providing interventions to struggling readers, they were not in agreement that effective
reading intervention for all students was provided through the RTI program, nor the RTI
program was more effective than other programs for meeting student reading needs.
They were also not in agreement that the RTI program could help students overcome
economic and environmental disadvantages. For question 14, it was expected 100% of
teachers would disagree or strongly disagree when rating the survey statement, “RTI is a
system designed to identify students in need of special education service.” However, a
significant number of teachers did not disagree with this statement, implying teachers
view the RTI Program as a means for identifying students for special education. A
summary of Fisher’s Exact Test for questions 10-14 is found in Table 19.

75
Table 19
Fisher’s Exact Test Results–Questions 10-14 (Input)
CIPP Evaluation Model Fisher’s Exact Test Results
Input (RQ2)
Question
Agree/
Strongly
Agree
Neither/
Disagree/
Strongly
Disagree
df
Fisher’s
Exact
Test
P< .05
10. Interventions are necessary to address the needs of
struggling readers
Teacher Responses 63 0 1 1.0000 Expected 63 0
11. Interventions provided as soon as students begin to
struggle help students overcome economic and
environmental disadvantages.
Teacher Responses 46 17 1 0.0000
Expected 63 0
12. RTI provides effective reading intervention for all
students.
Teacher Responses 35 28 1 0.0000
Expected 63 0
13. The RTI Program is more effective than other
programs for meeting the reading needs of all
students.
RTI Schools 22 41 1 0.0000
Expected 63 0
14. RTI is a system designed to identify students in
need of special education service.
RTI Schools 13 51 1 0.0001
Expected 0 64
Process. Survey questions 15-22 dealt with process evaluation. Process
evaluation was used to review implementation of the program and the degree to which
program elements were effectively implemented. This evaluation also identified
implementation problems. Process evaluation also discovered how those involved

76
interpreted the quality of the program (Stufflebeam, 2000b). When asked if data from
universal screening were analyzed to determine students in need of interventions,
kindergarten teachers (90.9%) were in more agreement than first-grade teachers (66.7%).
Comments from first-grade teachers revealed a concern about the universal screening
process. Changes to this process with regard to the instrument used for universal
screening resulted in differences in the process. For 2015-2016, teachers used reading
results from Primary Map fall administration to determine students in need of
intervention. This process was different from previous years as EasyCBM was used for
both universal screening and progress monitoring. First-grade teachers expressed
concern that Primary Map was very different from EasyCBM making progress
monitoring difficult because there was no baseline data with which to compare. When
asked if teachers worked together to identify interventions for students who needed tiered
support, kindergarten teachers responded at a rate of 81.8% and first-grade teachers at a
rate of 72.4%. Comments from both sets of teachers indicated they met to review student
progress but did work together to develop interventions for students.
Only 66.7% of first-grade teachers (compared to 100% of kindergarten teachers)
indicated they were confident in their ability to implement tiered interventions for their
students. Further investigation of teacher comments found teachers were confident in
their overall teaching ability but not as confident when providing interventions. Two
common themes were found in first-grade teacher comments: training and time. Some
teachers indicated Reading Recovery teachers have specific training and expertise to
implement interventions and should provide them. Some teachers responded with a need
for more guidance and training. With regard to time, teachers expressed difficulty
finding time to provide interventions due to class size, needs of students, and demands of
77
other subject matter. First-grade teachers expressed a need for additional assistance to
implement the program.
As a group, 87.3% of kindergarten and first-grade teachers felt the RTI Program
was implemented with fidelity. As individual grade levels, 97.1% of kindergarten
teachers and 75.9% of first-grade teachers were in agreement the RTI program was
implemented with fidelity. Comments from teachers indicated the program differed from
school to school. Kindergarten teachers felt it was implemented with fidelity when their
teaching assistants were not pulled for other duties. First-grade teachers indicated
implementing the program was difficult for classroom teachers. One teacher commented,
“I believe there are systems in place to try and ensure this, but I disagree because so
much is dependent on the regular classroom teacher.”
Additional comments provided for questions 15-22 indicated teachers use LLI,
My Sidewalks, and Reading Recovery as research-based interventions but needed more
help finding additional research-based interventions. A summary of all participant
responses to process questions 15-22 is found in Table 20. A summary of kindergarten
teacher responses is found in Table 21. A summary of first-grade teacher responses is
found in Table 22. Responses are reported by percentage in three categories: strongly
agree and agree, neither agree or disagree, and strongly disagree and disagree.

78
Table 20
Survey Responses: All Participants–Questions 15-22 (Process)
CIPP Evaluation Model All Participants Response Percentages
Process (RQ3)
Question SA-A N SD-D Answered Skipped
Process (RQ3)
15. Data from universal screening is
analyzed to determine students in
need of interventions.
79.3 9.5 11.2 n=63 n=1
16. Research-based interventions are used
to address student needs.
88.9 6.3 4.8 n=63 n=1
17. Progress monitoring is used to
determine the effectiveness of
individual interventions.
87.1 8.1 4.8 n=62 n=2
18. Teachers work together to address the
needs of struggling readers.
85.2 8.2 6.6 n=61 n=3
19. School-based RTI team s work
together to identify interventions for
students who need tiered instructional
support.
77.7 12.9 9.4 n=62 n=2
20. I am confident in my ability to
implement tiered interventions for my
students.
84.3 6.3 9.4 n=64 n=0
21. All elements of the RTI program–
universal screening, tiered
intervention, and progress
monitoring– are implemented.
83.9 8.1 8.1 n=62 n=2
22. The RTI program is implemented
with fidelity.
69.9 17.4 12.7 63 1

79
Table 21
Survey Responses: Kindergarten Participants–Questions 15-22 (Process)
CIPP Evaluation Model Kindergarten Teachers Response Percentages
Process (RQ3)
Question SA-A N SD-D Answered Skipped
Process (RQ3)
15. Data from universal screening is
analyzed to determine students in need
of interventions.
90.9 6.1 3.0 n=33 n=1
16. Research-based interventions are used
to address student needs.
90.9 6.1 3.0 n=33 n=1
17. Progress monitoring is used to
determine the effectiveness of
individual interventions.
96.9 3.1 0.0 n=32 n=2
18. Teachers work together to address the
needs of struggling readers.
87.9 9.1 3.0 n=33 n=1
19. School-based RTI team s work
together to identify interventions for
students who need tiered instructional
support.
81.8 15.2 3.0 n=33 n=1
20. I am confident in my ability to
implement tiered interventions for my
students.
100.0 0.0 0.0 n=34 n=0
21. All elements of the RTI program–
universal screening, tiered intervention,
and progress monitoring–are
implemented.
87.9 6.1 6.1 n=33 n=1
22. The RTI program is implemented with
fidelity.
76.5 20.6 2.9 n=34 n=0

80
Table 22
Survey Responses: First-Grade Participants–Questions 15-22 (Process)
CIPP Evaluation Model First-Grade Teachers Response Percentages
Process (RQ3)
Question SA-A N SD-D Answered Skipped
Process (RQ3)
15. Data from universal screening is
analyzed to determine students in
need of interventions.
66.7 13.3 20.0 n=30 n=0
16. Research-based interventions are used
to address student needs.
86.6 6.7 6.7 n=30 n=0
17. Progress monitoring is used to
determine the effectiveness of
individual interventions.
76.7 13.3 10.0 n=30 n=0
18. Teachers work together to address the
needs of struggling readers.
82.2 7.1 10.7 n=28 n=2
19. School-based RTI team s work
together to identify interventions for
students who need tiered instructional
support.
72.4 10.3 17.3 n=29 n=1
20. I am confident in my ability to
implement tiered interventions for my
students.
66.7 13.3 20.0 n=30 n=0
21. All elements of the RTI program–
universal screening, tiered
intervention, and progress
monitoring–are implemented.
79.4 10.3 10.3 n=29 n=1
22. The RTI Program is implemented
with fidelity.
62.1 13.8 24.1 n=29 n=1
Fisher’s Exact Test was calculated for questions 15-22 at the expected rate of
100% strongly agree and agree. Results indicated significant results for all questions in
this section. The range of p values was 0.000- 0.0066, p<.05. Responses to questions

81
fell below the hypothesized expected rate of 100% strongly agree and agree. A summary
of Fisher’s Exact Test Results for questions 15-22 is found in Table 23.

82
Table 23
Fisher’s Exact Test Results–Questions 15-22 (Process)
CIPP Evaluation Model Fisher’s Exact Test Results
Input (RQ3)
Question
Agree/
Strongly
Agree
Neither/
Disagree/
Strongly
Disagree
df
Fisher’s
Exact
Test
P< .05
15. Data from universal screening is analyzed to determine
students in need of interventions.
Teacher Responses 50 13 1 0.0001 Expected 63 0
16. Research-based interventions are used to address student
needs.
Teacher Responses 56 7 1 0.0066
Expected 63 0
17. Progress monitoring is used to determine the
effectiveness of individual interventions.
Teacher Responses 54 8 1 0.0031
Expected 62 0
18. Teachers work together to address the needs of
struggling readers.
RTI Schools 52 9 1 0.0014
Expected 61 0
19. School-based RTI teams work together to identify
interventions for students who need tiered instructional
support.
RTI Schools 48 14 1 0.0000
Expected 62 0
20. I am confident in my ability to implement tiered
interventions for my students.
RTI Schools 54 10 1 0.0007
Expected 64 0
(continued)

83
Question Agree/
Strongly
Agree
Neither/
Disagree/
Strongly
Disagree
df
Fisher’s
Exact
Test
P< .05
21. All elements of the RTI program – universal screening,
tiered intervention, and progress monitoring – are
implemented.
RTI Schools 52 10 1 0.0007
Expected 62 0
22. The RTI Program is implemented with fidelity.
RTI Schools 44 19 1 0.0000
Expected 63 0
Product. Survey questions 23-28 dealt with product evaluation. Information
gathered through context, input, and process evaluations were used to conduct the
product evaluation. Intended and unintended outcomes were determined through product
evaluation. This information provided feedback to aide in determining program success
(Stufflebeam, 2000b). When asked if universal screening measures effectively identified
struggling students, overall 54.7% of teachers strongly agreed and agreed, with 76.5% of
kindergarten teachers in agreement and 46.7% of first-grade teachers in agreement.
Kindergarten teacher comments revealed they believe younger children may not have the
processing speed necessary to perform at expected levels on universal screening
assessments resulting in some students mistakenly identified for intervention.
Kindergarten teachers reported universal screening was one method for identification for
intervention and teacher judgement should be an identification factor also. First-grade
teachers expressed concerns over the use of Primary Map for universal screening. These
teachers reported some students have difficulty manipulating computers (mouse pads)
during testing and some students did not try their best. In addition, because Primary Map
was read to students, it did not effectively identify struggling readers. First-grade

84
teachers suggested a combination of EasyCBM and teacher input were more effective
universal screeners.
Seventy-seven percent of kindergarten and first-grade teachers agreed that
progress monitoring information guided instructional decisions and interventions
provided for students with 82.4% of kindergarten teachers in agreement and 70% of first-
grade teachers in agreement. Kindergarten teachers indicated progress monitoring helped
them make instructional decisions but did “not help guide further interventions.” In
addition, kindergarten teachers indicated interventions beyond My Sidewalks were
needed for some struggling readers. First-grade teachers sited alignment issues with
EasyCBM used as a progress monitoring tool. They indicated EasyCBM did not align
with LLI or their classroom interventions. Because of this, first-grade teachers indicated
they had to develop their own progress monitoring tools which, in addition to progress
monitoring, was time consuming.
When asked if the RTI program effectively met the needs of struggling readers,
kindergarten and first-grade teachers responded 74.2% in agreement. Kindergarten
teachers (72.5%) and first-grade teachers (75.8) response rates were similar.
Kindergarten teachers indicated the RTI program met the needs of most struggling
readers but not students with more advanced needs. First-grade teachers indicated the
RTI program helps in “that it requires teachers to work with struggling readers more
often and with research-based materials.” Common themes contained in first-grade
teacher comments for these survey items can be summarized by the following comment,
“I think time and my comfort are low.” Teachers expressed concerns over a lack of time
to provide interventions while teaching guided reading groups. A need for additional
personnel (“RTI interventionists”) to pull students and provide interventions was

85
expressed. Also, teachers indicated Reading Recovery teachers were more prepared due
to specialized training to provide interventions. One teacher commented, “We are trying
to make specialists out of general practitioners.”
A summary of all participant responses to input questions 23-28 is found in Table
24. A summary of kindergarten teacher responses is found in Table 25. A summary of
first-grade teacher responses is found in Table 26. Responses are reported by percentage
in three categories: strongly agree and agree, neither agree or disagree, and strongly
disagree and disagree.
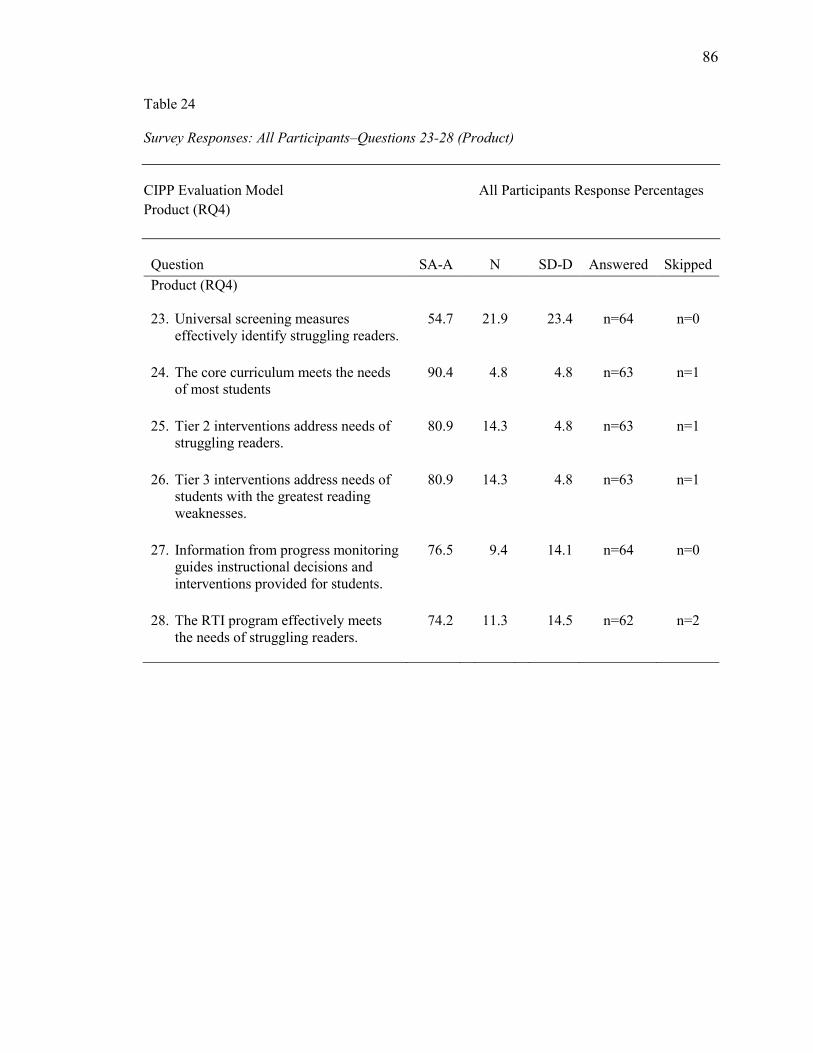
86
Table 24
Survey Responses: All Participants–Questions 23-28 (Product)
CIPP Evaluation Model All Participants Response Percentages
Product (RQ4)
Question SA-A N SD-D Answered Skipped
Product (RQ4)
23. Universal screening measures
effectively identify struggling readers.
54.7 21.9 23.4 n=64 n=0
24. The core curriculum meets the needs
of most students
90.4 4.8 4.8 n=63 n=1
25. Tier 2 interventions address needs of
struggling readers.
80.9 14.3 4.8 n=63 n=1
26. Tier 3 interventions address needs of
students with the greatest reading
weaknesses.
80.9 14.3 4.8 n=63 n=1
27. Information from progress monitoring
guides instructional decisions and
interventions provided for students.
76.5 9.4 14.1 n=64 n=0
28. The RTI program effectively meets
the needs of struggling readers.
74.2 11.3 14.5 n=62 n=2

87
Table 25
Survey Responses: Kindergarten Participants–Questions 23-28 (Product)
CIPP Evaluation Model Kindergarten Teachers Response Percentages
Product (RQ4)
Question SA-A N SD-D Answered Skipped
Product (RQ4)
23. Universal screening measures
effectively identify struggling readers.
64.8 23.5 14.7 34 0
24. The core curriculum meets the needs
of most students
88.2 5.9 5.9 34 0
25. Tier 2 interventions address needs of
struggling readers.
82.4 8.8 8.8 34 0
26. Tier 3 interventions address needs of
students with the greatest reading
weaknesses.
76.5 17.6 5.9 34 0
27. Information from progress monitoring
guides instructional decisions and
interventions provided for students.
82.4 11.8 5.9 34 0
28. The RTI program effectively meets
the needs of struggling readers.
75.8 12.1 12.1 33 1

88
Table 26
Survey Responses: First-Grade Participants–Questions 23-28 (Product)
CIPP Evaluation Model First-Grade Teachers Response Percentages
Product (RQ4)
Question SA-A N SD-D Answered Skipped
Product (RQ4)
23. Universal screening measures
effectively identify struggling readers.
46.7 20.0 33.3 30 0
24. The core curriculum meets the needs
of most students
93.3 3.4 3.4 29 1
25. Tier 2 interventions address needs of
struggling readers.
79.3 20.7 0.0 29 1
26. Tier 3 interventions address needs of
students with the greatest reading
weaknesses.
86.3 10.3 3.4 29 1
27. Information from progress monitoring
guides instructional decisions and
interventions provided for students.
70.0 6.7 23.3 30 0
28. The RTI program effectively meets
the needs of struggling readers.
72.5 10.3 17.2 29 1
Fisher’s Exact Test was calculated for questions 23-28 at the expected rate of
100% strongly agree and agree. Results indicated significant results for all questions in
this section. The range of p values was 0.000-0.0138, p<.05. Teacher responses varied
from the hypothesized expected rate of 100% strongly agree and agree with regard to
universal screening, progress monitoring, Tier 2 and 3 interventions, and effectiveness of
the RTI program to meet needs of struggling readers. A summary of Fisher’s Exact Test
Results for questions 23-28 is found in Table 27.

89
Table 27
Fisher’s Exact Test Results–Questions 23-28 (Product)
CIPP Evaluation Model Fisher’s Exact Test Results
Input (RQ4)
Question Agree/
Strongly
Agree
Neither/
Disagree/
Strongly
Disagree
df
Fisher’s
Exact
Test
P< .05
23. Universal screening measures effectively identify
struggling readers.
Teacher Responses 40 24 1 0.0000 Expected 64 0
24. The core curriculum meets the needs of most students.
Teacher Responses 57 6 1 0.0138
Expected 63 0
25. Tier 2 interventions address needs of struggling readers
Teacher Responses 51 12 1 0.0001
Expected 63 0
26. Tier 3 interventions address needs of students with the
greatest weaknesses.
RTI Schools 51 12 1 0.0001
Expected 63 0
27. Progress monitoring information guides instructional
decisions and interventions provided for students.
RTI Schools 49 15 1 0.0000
Expected 64 0
28. The RTI program effectively meets the needs of
struggling readers.
RTI Schools 46 16 1 0.0000
Expected 62 0
Interviews
Interviews were conducted with two district-level administrators and 15 school-
level administrators. Questions for these interviews were developed based on four
evaluations found in the CIPP Evaluation Model: context, input, process, and product.
District-level administrator interviews included the special services coordinator for
elementary education and the director of elementary education. Questions asked of both
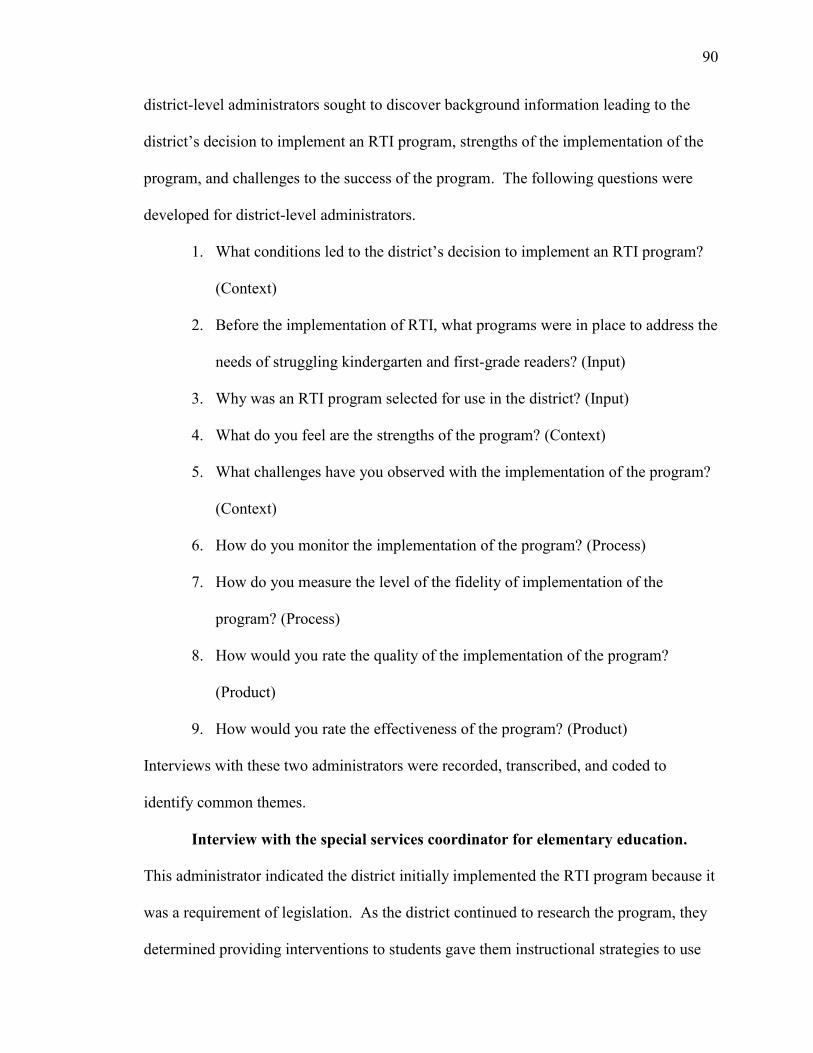
90
district-level administrators sought to discover background information leading to the
district’s decision to implement an RTI program, strengths of the implementation of the
program, and challenges to the success of the program. The following questions were
developed for district-level administrators.
1. What conditions led to the district’s decision to implement an RTI program?
(Context)
2. Before the implementation of RTI, what programs were in place to address the
needs of struggling kindergarten and first-grade readers? (Input)
3. Why was an RTI program selected for use in the district? (Input)
4. What do you feel are the strengths of the program? (Context)
5. What challenges have you observed with the implementation of the program?
(Context)
6. How do you monitor the implementation of the program? (Process)
7. How do you measure the level of the fidelity of implementation of the
program? (Process)
8. How would you rate the quality of the implementation of the program?
(Product)
9. How would you rate the effectiveness of the program? (Product)
Interviews with these two administrators were recorded, transcribed, and coded to
identify common themes.
Interview with the special services coordinator for elementary education.
This administrator indicated the district initially implemented the RTI program because it
was a requirement of legislation. As the district continued to research the program, they
determined providing interventions to students gave them instructional strategies to use

91
when they struggled and was best for children. Before the RTI program, schools relied
primarily on the Student Intervention Team (SIT) model. This model was used to
document difficulties of students who were struggling and not meeting grade-level
reading standards. This process varied from school-to-school with interventions provided
to students coming from websites or curriculum packages purchased at individual
schools. The only intervention provided systemically by the district was Reading
Recovery for struggling first-grade students. The coordinator pointed out the RTI
program was selected for implementation because it was considered a problem-solving
process that brings multiple parties together to help struggling young readers. She
indicated one of the strengths of the RTI program is it provides a curriculum intervention
framework for teachers so teachers do not have to spend time seeking interventions on
their own. She also indicated an additional strength of the RTI program was that it has
encouraged conversations between teachers at each school. She felt these conversations
led to teacher understanding that the RTI program was not designed as a system to
evaluate students for special education but was part of good general education or core
instruction. She indicated these conversations marked a beginning to change mindsets
and belief systems about general education as it relates to special education.
This administrator shared the size of the district made it difficult to monitor the
program’s implementation and ensure implementation fidelity. A change to district
personnel resulted in the loss of a position to work directly with the RTI program, assist
schools, and monitor the implementation fidelity. She pointed out implementation can
vary from school-to-school. When rating the quality of implementation of the RTI
program, this coordinator indicated the district has dedicated time and great effort to
make sure the program has been implemented with fidelity. These efforts have included

92
training for personnel and providing progress monitoring and intervention materials.
When asked to rate the effectiveness of the RTI program, she indicated progress
monitoring data indicated students receiving interventions were making progress. She
felt specific curricular resources have helped teachers with the implementation of the
program.
Interview with the director of elementary education. This administrator
indicated the district was roughly 10 years behind legislated requirements, and the need
to fulfill the law and differentiate instruction to meet student needs were conditions
leading to the district’s decision to implement an RTI program. Before the RTI program,
the district was very limited with programs designed to address needs of struggling
kindergarten and first-grade readers. This administrator indicated the SIT Team Model
was in place, but that process was not used a lot for kindergarten and first grade. She
shared most often readers who struggled in kindergarten and first grade were monitored
and given time to grow developmentally. In kindergarten, they could receive speech
therapy, and in first grade, Reading Recovery. She indicated the district chose the RTI
program because it was called for in legislation. This administrator felt a challenge was
finding the right elements and aligning them to all programs such as RTI, Read to
Succeed, and Student Learning Objectives (SLO). An additional challenge was finding
and using funding wisely to serve students at the very best levels. This administrator did
not feel the RTI program was being monitored well due to changes in personnel and a
lack of systemic delivery. She also felt there was room for improvement when
monitoring the implementation fidelity. She indicated that the size of the district made
the monitoring process difficult. She shared reading interventionists and instructional
coaches have been helpful at the school level with assisting teachers and school-level RTI
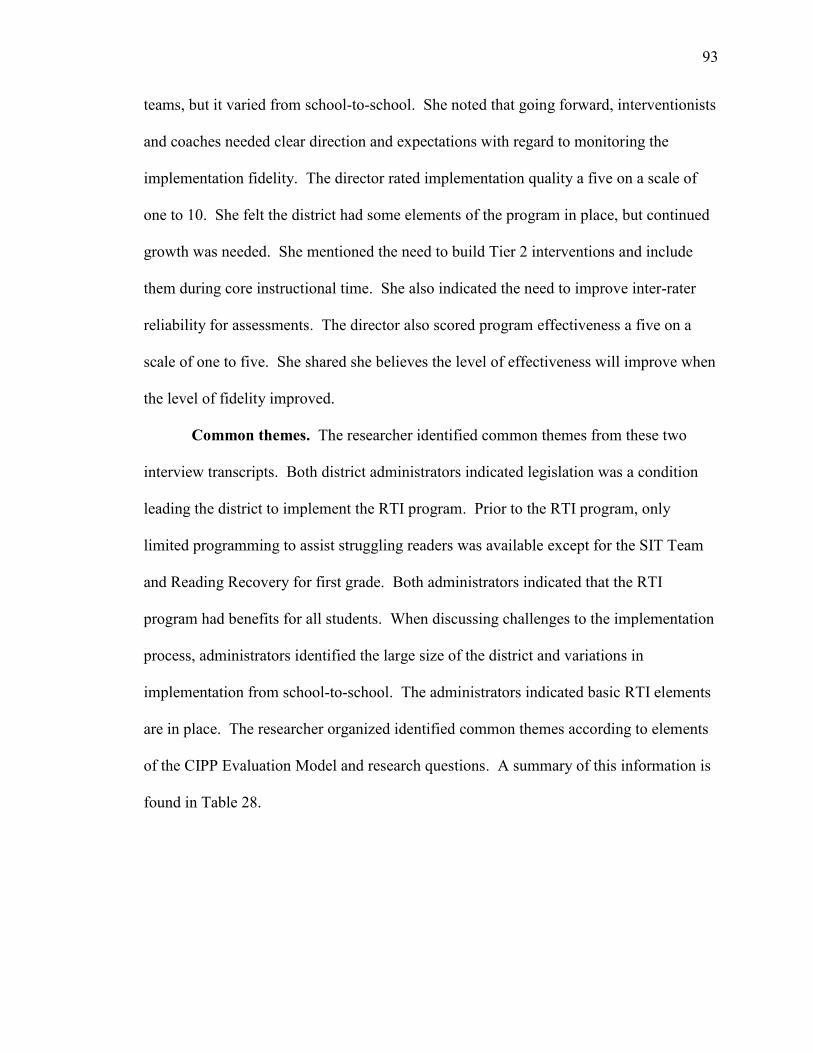
93
teams, but it varied from school-to-school. She noted that going forward, interventionists
and coaches needed clear direction and expectations with regard to monitoring the
implementation fidelity. The director rated implementation quality a five on a scale of
one to 10. She felt the district had some elements of the program in place, but continued
growth was needed. She mentioned the need to build Tier 2 interventions and include
them during core instructional time. She also indicated the need to improve inter-rater
reliability for assessments. The director also scored program effectiveness a five on a
scale of one to five. She shared she believes the level of effectiveness will improve when
the level of fidelity improved.
Common themes. The researcher identified common themes from these two
interview transcripts. Both district administrators indicated legislation was a condition
leading the district to implement the RTI program. Prior to the RTI program, only
limited programming to assist struggling readers was available except for the SIT Team
and Reading Recovery for first grade. Both administrators indicated that the RTI
program had benefits for all students. When discussing challenges to the implementation
process, administrators identified the large size of the district and variations in
implementation from school-to-school. The administrators indicated basic RTI elements
are in place. The researcher organized identified common themes according to elements
of the CIPP Evaluation Model and research questions. A summary of this information is
found in Table 28.
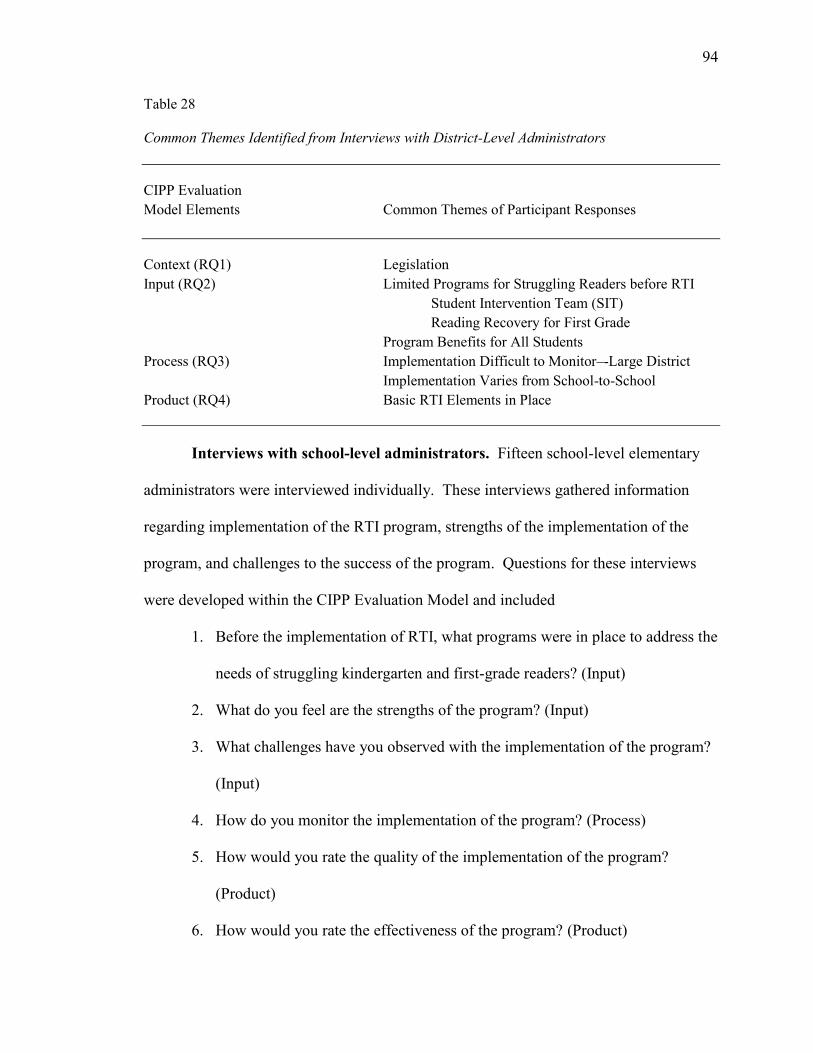
94
Table 28
Common Themes Identified from Interviews with District-Level Administrators
CIPP Evaluation
Model Elements Common Themes of Participant Responses
Context (RQ1) Legislation
Input (RQ2) Limited Programs for Struggling Readers before RTI
Student Intervention Team (SIT)
Reading Recovery for First Grade
Program Benefits for All Students
Process (RQ3) Implementation Difficult to Monitor–-Large District
Implementation Varies from School-to-School
Product (RQ4) Basic RTI Elements in Place
Interviews with school-level administrators. Fifteen school-level elementary
administrators were interviewed individually. These interviews gathered information
regarding implementation of the RTI program, strengths of the implementation of the
program, and challenges to the success of the program. Questions for these interviews
were developed within the CIPP Evaluation Model and included
1. Before the implementation of RTI, what programs were in place to address the
needs of struggling kindergarten and first-grade readers? (Input)
2. What do you feel are the strengths of the program? (Input)
3. What challenges have you observed with the implementation of the program?
(Input)
4. How do you monitor the implementation of the program? (Process)
5. How would you rate the quality of the implementation of the program?
(Product)
6. How would you rate the effectiveness of the program? (Product)

95
School-level administrators indicated that before implementation of the district’s
RTI program, there were no formal programs for assisting struggling kindergarten and
first-grade readers other than Reading Recovery for first graders. Schools relied on basal
reading programs, small-group instruction, and individual work with students to address
struggling readers. School-level administrators pointed out three strengths of the RTI
program. The first was the program provided a formal and consistent process to address
the needs of struggling kindergarten and first-grade readers. Monthly meetings were
identified as a positive of the program and have led to collaboration and a focus on
individual student needs. The third identified strength was progress monitoring which
provided data points to study and follow growth of students.
Four common themes were found in school-administrator descriptions of
challenges to implementation of the program. The first dealt with time and scheduling
interventions for struggling readers in the classroom. Administrators reported teachers
expressed concerns with balancing intervention time with activities for students who did
not receive interventions. In addition, many students in need of intervention also
received additional services such as speech and occupational therapy causing them to be
pulled out at varying times during the day. This common theme was related to support to
teachers through additional personnel. Administrators indicated a need for additional
reading interventionists and support staff to assist with the implementation of the
program.
Another related challenge was consistent completion of documentation and
paperwork. Administrators indicated teachers benefited from support and assistance with
scheduling interventions, progress monitoring, and paperwork completion. Finally,
school-level administrators indicated the need for a “change in mindset” as a challenge to

96
implementation of the RTI program. These administrators expressed a clear definition of
the RTI program as it relates to special education being needed. School-level
administrators indicated some teachers struggled with mindsets that RTI was a special
education initiative (“a gateway to testing”) rather than a general education initiative
designed provide interventions to students through the core curriculum.
When asked how they monitored implementation fidelity of the RTI program,
school-level administrators reported use of RTI teams made up of a combination of
school-level administrators, reading coaches, instructional coaches, school psychologists,
guidance counselors, and teachers. These teams met regularly, typically monthly. While
all school-level administrators reported the use of teams and regular meetings, their
responses indicated the process was slightly different from school-to-school. For
example, school-level teams were made up of different personnel, and leadership of the
school level teams varied. When asked to rate the quality of implementation of the RTI
program, school-level administrator responses varied. Gradually implementing the
program beginning with kindergarten and first grade was reported to be a point of
strength of the implementation. Administrators indicated changes to personnel at district
and school levels had a negative impact on implementation. They noted less follow-up
from the district level led to less consistency in the program from school-to-school. At
four schools, school-level personnel changes have led to slower implementation of
school-level RTI teams. School-level administrators rated overall effectiveness of the
RTI program using a scale of 1-10 with 10 being outstanding. The administrator’s
average effectiveness rating was 7.73. Several common themes emerged. The first was
the importance and effectiveness of classroom teacher skills to provide interventions to
students. Additionally, the administrators indicated the importance of a strong core
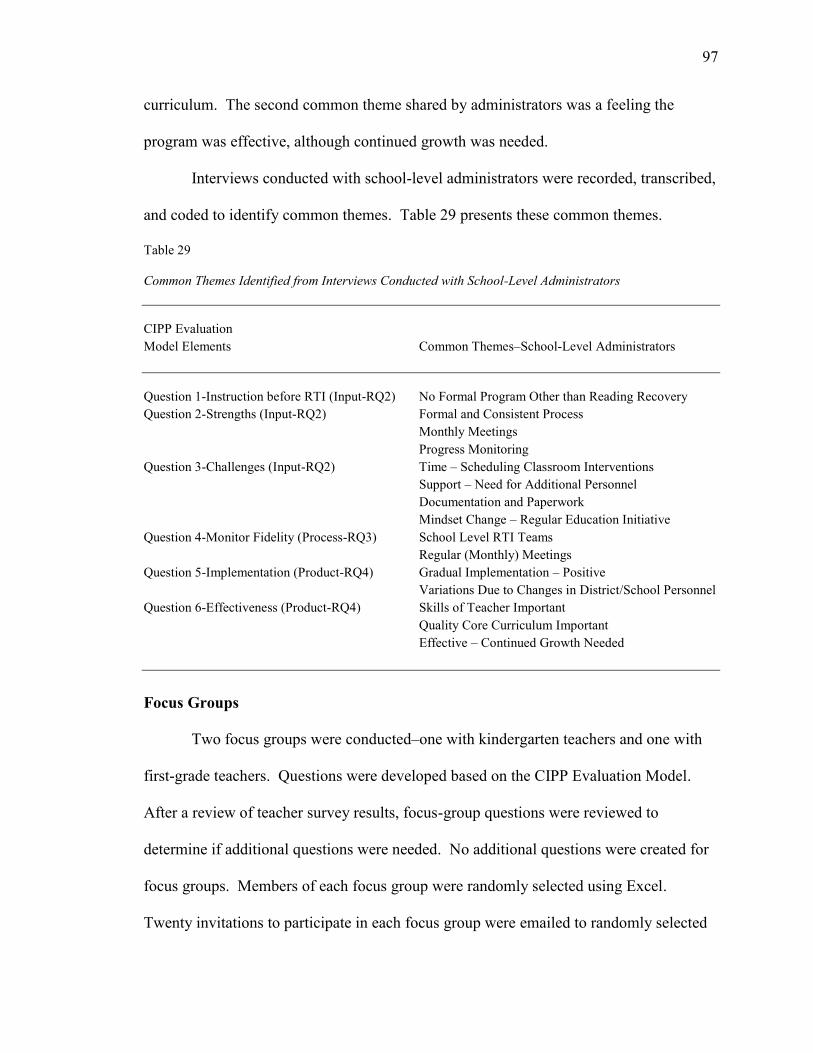
97
curriculum. The second common theme shared by administrators was a feeling the
program was effective, although continued growth was needed.
Interviews conducted with school-level administrators were recorded, transcribed,
and coded to identify common themes. Table 29 presents these common themes.
Table 29
Common Themes Identified from Interviews Conducted with School-Level Administrators
CIPP Evaluation
Model Elements Common Themes–School-Level Administrators
Question 1-Instruction before RTI (Input-RQ2) No Formal Program Other than Reading Recovery
Question 2-Strengths (Input-RQ2) Formal and Consistent Process
Monthly Meetings
Progress Monitoring
Question 3-Challenges (Input-RQ2) Time – Scheduling Classroom Interventions
Support – Need for Additional Personnel
Documentation and Paperwork
Mindset Change – Regular Education Initiative
Question 4-Monitor Fidelity (Process-RQ3) School Level RTI Teams
Regular (Monthly) Meetings
Question 5-Implementation (Product-RQ4) Gradual Implementation – Positive
Variations Due to Changes in District/School Personnel
Question 6-Effectiveness (Product-RQ4) Skills of Teacher Important
Quality Core Curriculum Important
Effective – Continued Growth Needed
Focus Groups
Two focus groups were conducted–one with kindergarten teachers and one with
first-grade teachers. Questions were developed based on the CIPP Evaluation Model.
After a review of teacher survey results, focus-group questions were reviewed to
determine if additional questions were needed. No additional questions were created for
focus groups. Members of each focus group were randomly selected using Excel.
Twenty invitations to participate in each focus group were emailed to randomly selected

98
kindergarten and randomly selected first-grade teachers. Eight kindergarten teachers and
six first-grade teachers accepted invitations to participate in respective focus groups. A
moderator facilitated both focus groups. Focus groups were audiotaped and transcribed
for coding and common theme identification. The following questions based on the CIPP
Evaluation Model were asked of each focus group.
1. What are the goals of the RTI program? (Context)
2. What did reading instruction for struggling readers look like in your
classrooms before implementing RTI? (Input)
3. How does reading instruction for struggling readers look like with RTI?
(Input)
4. In your opinion, what are the strengths of RTI? (Input)
5. In your opinion, what are the challenges of RTI? (Input)
6. How do you insure the program is implemented with fidelity? (process)
7. In your opinion, how effective is the RTI program? (product)
In order to analyze data from a focus group, Latess (2008) recommended reading
through focus-group transcripts a number of times to identify common themes. Once all
possible common themes were identified, the researcher developed a discussion section
for questions and common themes.
Kindergarten focus group. Kindergarten teachers indicated goals of the RTI
program were to meet needs of lower-performing students to avoid special education
identification and/or retention. They also pointed out the RTI process allowed teachers to
collect data to share with parents when discussing their child’s progress. Before
implementation of the RTI program, kindergarten teachers indicated reading instruction
for struggling readers consisted of small-group instruction in their classrooms. Since
99
implementation of RTI, kindergarten teachers pointed out students received additional
instructional time. With RTI, teachers indicated struggling students received small-group
instruction from their teacher and an additional pull-out group with the kindergarten
assistant. These teachers felt extra time and skill repetition have led to growth for
struggling students. Kindergarten teachers identified repetition, additional instructional
time, and structure as strengths of the RTI program.
In kindergarten, teaching assistants pulled small intervention groups and worked
with struggling students using the My Sidewalks Program by Pearson. Kindergarten
teachers identified one challenge to RTI program implementation was locating a
consistent location for teaching assistants to facilitate small groups. Scheduling
intervention time was also regarded as a challenge. Teacher discussion indicated
scheduling was handled differently at each of their schools. Lack of training for
assistants to facilitate My Sidewalks Curriculum was a concern of each participant. In
addition, another reported challenge was the importance of having an instructionally
skilled assistant willing to provide quality intervention instruction to struggling students.
Kindergarten teachers felt progress monitoring helped insure the program was
implemented with fidelity. They pointed out progress monitoring provided information
on student progress, and if the program was implemented “as it should be,” most students
would show growth. When asked to rate the effectiveness of the RTI program, each
indicated “very effective.” They shared evidence of students who benefitted from
interventions and became better readers. The researcher identified and organized
common themes according to the elements of the CIPP Evaluation Model elements and
research questions. A summary of this information is found in Table 30.

100
Table 30
Common Themes Identified from Focus Group Conducted with Kindergarten Teachers
CIPP Evaluation
Model Elements Common Themes–Kindergarten Teacher Responses
Question 1–Goals (Context-RQ1) Meet Needs of Lower Performing Students
Avoid Special Education Placement
Avoid Retention
Collect Data to Share with Parents
Question 2–Instruction before RTI (Input-RQ2) Meet Struggling Students in Small Classroom Groups
Question 3–Instruction after RTI (Input-RQ2) Provide Additional Instructional Time for Strugglers
Provide More Repetition
Question 4–Strengths (Input-RQ2) Additional Instructional Time
Structure
Question 5–Challenges (Input-RQ2) Location for Assistant to Facilitate Small Group
Training for Assistants
Skilled and Willing Assistant
Question 6–Insure Fidelity (Process-RQ3) Progress Monitoring
Question 7–Effectiveness (Product-RQ4) Effective Program
First-grade focus group. First-grade teachers indicated the goal of the RTI
program was to provide early intervention for at-risk students to allow them to read on
grade level and not get behind their peers. Teachers reported reading instruction before
RTI program implementation was similar to reading instruction after implementation but
was not as data driven. Struggling students had access to a Reading Recovery teacher.
After implementation, first-grade teachers added Fountas and Pinnell’s (2016) LLI for
small-group intervention. Additional reading groups were formed to meet the needs of
struggling students. In addition, first-grade students continued to have access to a
Reading Recovery teacher or reading interventionist who served students in addition to
interventions provided in the regular classroom. When asked what they viewed as
strengths of the RTI program, first-grade teachers identified data collection and
addressing needs of struggling readers as strengths. They indicated data collection

101
through progress monitoring helped them analyze student strengths and weaknesses and
provided individual student information to the RTI team.
First-grade teachers indicated three challenges to RTI program implementation.
The first was a need for additional help in the classroom through the help of other
teachers, extra reading interventionists, or assistants. They pointed out they felt the RTI
program has added more work for them and, because of this, extra help was needed.
Scheduling was also identified as a challenge to the program. First-grade teachers
indicated their students, particularly their struggling students, received a number of
additional services such as speech, occupational therapy, and Reading Recovery or
reading intervention making it difficult to schedule intervention time in the regular
classroom. The third challenge expressed was lack of consistency from teacher to teacher
and from school to school. Examples shared included differences in beginning-of-the-
year benchmarking (what assessment was used for benchmarking and time of the year),
how regularly interventions were provided, and level of documentation kept from teacher
to teacher. These teachers shared students enrolled from other schools may not have
received interventions and progress monitoring according to the program outline. First-
grade teachers indicated more specific direction from the district could improve this
challenge.
To insure the RTI program was implemented with fidelity, first-grade teachers
indicated they progress monitor as the program requires. This information was shared
during monthly RTI Team Meetings making them more accountable. These teachers
indicated participants in RTI Team Meetings seemed to vary from school to school.
When asked to rate program effectiveness, they stated struggling students made progress
as a result of interventions provided; however, they again expressed the level of program

102
success was determined by how each teacher implemented it. They feared they did not
spend quality time with their advanced readers because of the time spent providing
interventions for struggling ones. The researcher organized identified common themes
according to the elements of the CIPP Evaluation Model elements and research questions.
A summary of this information is found in Table 31.
Table 31
Common Themes Identified from Focus Group Conducted with First-Grade Teachers
CIPP Evaluation Common Themes–First-Grade Teacher Responses
Model Elements
Question 1–Goals (Context-RQ1) Provide Early Intervention for At-Risk Students
Question 2–Instruction before RTI (Input-RQ2) Similar to Reading Instruction with RTI
Less Data Driven
Question 3–Instruction after RTI (Input-RQ2) Additional Reading Groups for Struggling Readers
Use of LLI
Continued Reading Recovery/Reading Interventionist
Question 4–Strengths (Input-RQ2) Data Collection
Addresses Needs of Struggling Readers
Question 5–Challenges (Input-RQ2) Need for Additional Classroom Help
Scheduling Difficulties
Lack of Consistency (Teachers and Schools)
Question 6–Insure Fidelity (Process-RQ3) Progress Monitoring
Question 7–Effectiveness (Product-RQ4) Effective Program When Implemented Consistently
Chapter Summary
The purpose of this study was to conduct a CIPP Program Evaluation of an RTI
program implemented in a rural school district in South Carolina. Triangulation is the
process of increasing study strength through use of multiple data collection methods and

103
data sources. Triangulation reduces bias and increases validity of a study (Gall et al.,
2005). Triangulation of data was achieved by including reading achievement and special
education referral data, teacher survey data, interviews of district and school-level
administrators, and focus groups.
This study utilized mixed methods and included quantitative data (reading
achievement data, referral data, and teacher survey) and qualitative data (teacher survey
comments, interviews, and focus groups). Reading achievement scores, special education
referral data, and Likert scale responses on the teacher survey were analyzed with
inferential statistics including ANOVA, chi square, and Fisher’s Exact Test. Teacher
survey comments, administrator interview data, and focus-group data were coded and
analyzed. In addition, descriptive statistics for test scores and referral data (mean,
standard deviation) and teacher survey (percentages of Likert Scale Responses) were
calculated and analyzed. Quantitative analysis yielded no significant difference between
tested groups and special education referrals. The majority of teacher survey responses
were significant and did not meet the hypothesized 100% expected rate. Quantitative
data provided administrator and teacher perceptions of quality of implementation and
effectiveness of the program. Overall, qualitative data results indicated the basic
elements of the RTI program are in place, and strengths and weaknesses can be
identified.

104
Chapter 5: Summary and Conclusions
Introduction
The acquisition of early literacy skills in kindergarten and first-grade students is
critical to their overall academic success. For students who fall behind and demonstrate
poor reading performance, studies show targeted early interventions provided for students
as soon as they begin to struggle can improve the likelihood of their success (Neuman,
2007). RTI is a framework for providing tiered interventions to struggling students
(Fisher & Frey, 2010). In this chapter, the researcher summarizes results and findings of
a CIPP Program Evaluation of an RTI program in a small rural district in South Carolina.
In addition, the researcher discusses the implications of four inter-related evaluations
within the CIPP Model (context, input, process, and product) in relation to
implementation of the RTI program in order to make recommendations based on
identified program strengths and weaknesses. Study limitations and delimitations and
suggestions for future research are included in this chapter.
Restatement of the Problem
The purpose of this study was to conduct a CIPP Program Evaluation of the
implementation of an RTI program in a rural school district. The CIPP Model was
selected because of its use for evaluating school-based educational programs
(Stufflebeam, 2000b). The district on which this study focused implemented an RTI
program in five pilot elementary schools during the 2013-2014 school year and in the
remaining 11 elementary schools in the district in the 2014-2015 school year. Because
the program was relatively new to the district, the researcher sought to discover overall
effectiveness of implementation of the RTI program by determining progress toward
meeting program goals, assessing the level of fidelity of program implementation, and

105
identifying the degree to which the program meets the needs of struggling kindergarten
and first-grade readers. This study employed a mixed-methods approach with
quantitative and qualitative data gathered and analyzed. Data gathered for this study
included reading achievement test data, special education referral data, and participant
responses from district- and school-level administrator interviews, a teacher survey with
comments, and focus groups.
Research Questions
Research questions were developed based on the four complementary evaluations
within the CIPP Evaluation Model. This study sought to answer the following research
questions in order to conduct a program evaluation of the implementation of an RTI
program in a school district.
1. What conditions led to the implementation of an RTI program? (Context)
2. Does the RTI program meet the identified needs of struggling kindergarten
and first-grade readers? (Input)
3. To what degree is the RTI program implemented with fidelity? (Process)
4. How effective is the RTI program? (Product)
Summary of Findings
Findings are discussed and organized by each CIPP Model evaluation and
corresponding research question. Data gathered from district-level and school-level
administrators, teachers, and members of focus groups were cross-referenced and
reviewed for commonalities and differences. Quantitative data were presented under the
appropriate evaluation and research question.
Data Collection
The researcher used interviews with district-level and school-level administrators,

106
a teacher survey including teacher comments, focus groups made up of kindergarten and
first-grade teachers, and analysis of reading achievement scores and special education
referral numbers to gather data for this study. For each question on the teacher survey,
Fisher’s Exact Test was calculated to determine the level of significance. The researcher
chose an expected rate of 100% strongly agree and agree to demonstrate teacher
knowledge of the RTI program. Results indicated all but two questions were significant,
falling short of the 100% expected response. An ANOVA was calculated with Primary
Map scores of kindergarten and first-grade students to determine if there were
achievement differences within groups over a 4-year period. Results indicated Primary
Map scores did not differ significantly between groups of students. A chi-square
calculation using yearly special education referral data was calculated. Results indicated
no significant relationships were found.
Context Evaluation Results
Context evaluation was used to identify major elements of the RTI program:
goals, needs, challenges, and assets. Results of context evaluation data collected from
district-level administrators and teachers indicated knowledge of key components of the
RTI program as implemented in the district. Burns and Gibbons (2008) found one goal
of RTI is to plan instructional interventions to allow a student to be successful. District-
level administrators and teachers indicated RTI was a general education initiative
designed to provide students with high-quality instruction and interventions. Surveyed
teachers indicated, at a rate of 85.7%, “RTI was a general education initiative.” An
identified strength of the program was development of a curriculum intervention
framework for teachers allowing them to save time when searching for interventions.
Research indicated RTI is not intended to be a process to identify students with special

107
needs, nor is it a special education initiative or supplemental intervention program
(Buffum et al., 2009). Conversations between teachers have led to greater understanding
that RTI was not a system for evaluating students for special education but rather a part
of good core education instruction. Changing mindsets and belief systems about general
education as it relates to special education was noted by school-level administrators as a
challenge of the program. Teacher survey results indicated kindergarten and first-grade
teachers responded at a rate of 57.8% strongly agree and agree to “RTI is a system
designed to identify students in need of special education service.” In addition, lack of
consistency of implementation from school to school was discussed by all respondents as
a challenge to fidelity of implementation. Fidelity of implementation is discussed under
Research Question 3. Another identified program challenge was alignment of RTI with
other programs such as Read to Succeed and SLO. District- and school-level
administrators indicated basic RTI elements were in place which was also evidenced by
teacher survey results and focus-group responses.
Research Question 1
What conditions led to the implementation of an RTI program? Conditions
leading to implementation of the RTI program were legislative requirements found at the
federal and state level (NCLB, IDEA, ESSA, and Read to Succeed). The district
determined a need for a structured plan within the instructional program to assist teachers
as they worked with struggling reading students. Their research led them to RTI (found
in legislation and research) as a defined program to be used systemically in the district.
The district viewed RTI as a problem-solving model to bring multiple people together to
address student needs and improve academic achievement.
108
Input Evaluation Results
Input evaluation was used to assess program design in order to determine if the
program was the best plan for meeting the needs of the target population and identifying
processes, procedures, and strategies to meet target population needs (Stufflebeam,
2000b). The researcher used interviews with district-level and school-level
administrators, a teacher survey, and focus groups made up of kindergarten and first-
grade teachers to gather data for input evaluation. School-level administrators and
teachers agreed with district-level administrators that before implementation of RTI,
there were few resources, except Reading Recovery for first graders and student
intervention teams, to address needs of struggling kindergarten and first-grade readers.
Teacher survey questions 10-14 dealt with providing interventions and whether teachers
felt the RTI program was an effective program to meet the needs of all students.
Although 100% of teachers indicated interventions were necessary to address needs of
struggling readers, only 55.6% felt the RTI program provided effective reading
interventions for all students. Survey comments from kindergarten teachers and
responses from teachers participating in the kindergarten focus group indicated additional
interventions beyond the My Sidewalks Intervention Program were needed.
Kindergarten teachers expressed concern with use of their assistants to provide
interventions through My Sidewalks. They indicated not all assistants were skilled
and/or willing to work with students using My Sidewalks. Scheduling My Sidewalks
including time and location were also identified as challenges for kindergarten teachers.
Survey comments from first-grade teachers and responses from teachers participating in
the first grade focus group indicated lack of time, scheduling challenges, and manpower
as concerns when providing interventions. Information shared by first-grade teachers

109
participating in the focus group indicated concerns for lack of consistency teacher to
teacher and school to school when implementing the RTI program. They cited variances
in benchmarking, progress monitoring, and documentation as examples.
Teacher survey results found 34.9% of kindergarten and first-grade teachers
indicated the “RTI Program was more effective than other programs for meeting reading
needs of all students.” Kindergarten teachers indicated they were not aware of other
programs to assist struggling readers. They also expressed concern that My Sidewalks
did not meet the needs of all kindergarten struggling readers. First-grade teachers
indicated Reading Recovery was a more effective program for meeting the needs of
struggling readers. They felt Reading Recovery teachers possessed expertise they lacked
when providing interventions. First-grade teachers responded at a rate of 66.7% to the
survey item, “I am confident in my ability to implement tiered interventions for my
students.”
School-level administrators echoed teacher concerns regarding time and
scheduling for interventions. They shared a struggling reader typically receives related
services such as speech and occupational therapy through a classroom pullout, making it
difficult to balance scheduling interventions for teachers and a challenge for students
because they receive multiple services. These administrators also indicated the need for
additional personnel to assist with implementation of the program. In addition, consistent
completion of documentation was also indicated as a challenge for the RTI program.
Input evaluation results indicated challenges within the processes, procedures, and
strategies used within the RTI program when meeting the needs of struggling
kindergarten and first-grade readers. Specific challenges were found within materials
used for interventions including the appropriateness of materials used for all students and

110
a need for additional materials. In addition, time and scheduling of interventions and
balancing demands of the RTI program and regular classroom instruction were noted as
struggles when working with students in need of intervention. Finally, consistency with
regard to implementation of the program from teacher to teacher and school to school
was found as a challenge.
Research Question 2
Does the RTI program meet the identified needs of struggling kindergarten and
first-grade readers? Clemens et al. (2011) indicated change to overall student
achievement was the most important first outcome found after the implementation of an
RTI program. An ANOVA was calculated with Primary Map scores of kindergarten and
first-grade students to determine if there were achievement differences within groups
over a 4-year period. The 4-year period represented 2 testing years prior to the pilot year,
the pilot year, and 1 year after the pilot year. Results indicated Primary Map scores did
not differ significantly between groups of students. A chi-square calculation using yearly
special education referral data was calculated. Results indicated no significant
relationships were found. While reading achievement data and special education referral
rate data yielded no significant differences in achievement and referral rates since the
implementation of the program, when asked to respond to the following survey statement,
“The RTI Program effectively meets the needs of struggling readers,” 74.2% of
kindergarten and first-grade teachers responded strongly agree and agree. Focus-group
responses from both kindergarten and first-grade teachers indicated they felt the program
was effective when consistently implemented.
Process Evaluation Results
Process evaluation was used to review implementation of the program, the degree
111
to which program elements were effectively implemented, and implementation concerns.
Process evaluation was also used to discover how those involved interpreted the quality
of the program (Stufflebeam, 2000b). The researcher used interviews with district-level
and school-level administrators, a teacher survey, and focus groups made up of
kindergarten and first-grade teachers to gather data for process evaluation. Several
challenges to program implementation were identified by district-level administrators.
The size of the district made monitoring for program fidelity difficult. Also, these
administrators indicated that although basic RTI elements were in place, implementation
varied from school to school. School-level administrators monitored program fidelity
through the use of school-level teams that met monthly to review progress monitoring
information and other concerns for students receiving interventions. Like district-level
administrators, school-level administrators indicated implementation fidelity differences
from school to school. Examples of differences in implementation between schools
included RTI teams led by different staff members, personnel makeup of school-level
teams differed, varying expectations for documentation presented at meetings, and
differing formats for meetings. Both sets of administrators indicated changes to district-
level and school-level personnel impacted fidelity of implementation. Kindergarten and
first-grade teachers insured fidelity of implementation by progress monitoring student
growth as required by the program and presenting this information during monthly RTI
meetings. Teacher survey comments included not only the importance of curriculum
implemented for interventions but also “the instructor must also be as equally effective.”
On the teacher survey, teachers responded affirmatively at a rate of 83.9% to the
statement, “All elements of the RTI Program–universal screening, tiered intervention,
and progress monitoring–are implemented.”

112
Research indicated three areas in which to consider fidelity of implementation
within an RTI program. The first is overall school process which involved the
consistency with which the elements of RTI are carried out in the classroom and across
grade levels. The second area related to quality of selected interventions. Those
interventions with a strong research base have a greater chance of improving student
performance. The third area was found at the teacher level and was determined by the
quality in which a teacher implements instruction, an intervention, and/or progress
monitoring (Mellard & Johnson, 2008). Failure to implement an RTI program with
fidelity at any of these levels may result in the program becoming ineffective (McDougal
et al., 2010). Results from the teacher survey, interviews with district and school-level
administrators, and responses from focus-group members indicated concerns from all
participants as to the fidelity of implementation of the RTI program.
Research Question 3
To what degree is the RTI program implemented with fidelity? Administrators
and teachers indicated concerns with fidelity of implementation of the RTI program. One
district administrator pointed out monitoring fidelity of implementation became more
difficult when district-level positions were lost. These positions were tasked with
providing oversight of the program and training for teachers. Losing this concentrated
and consistent level of program monitoring has resulted in a “mixture of whatever each
school decided” for grade levels served, monitoring meetings, and training. A common
theme shared by school-level administrators was variations in implementation from
school to school. One school-level administrator reported, “The quality of
implementation is not as good as it could be and varies from school-to-school.” Another
commented, “It is mostly up to schools to implement with fidelity.” Another shared, “I

113
would say we started off well, but there has not been quite as much follow-up this year
from a district perspective so I think we have lost the fidelity of implementation we had.”
Teachers also indicated program implementation differed from school to school.
Kindergarten teachers felt it was implemented with fidelity when their teaching assistants
were not pulled for other duties. First-grade teachers indicated implementing the
program was difficult for classroom teachers because of logistical concerns (time,
schedule, and personnel) and how these logistics were handled differently from school to
school. Results from the teacher survey indicated 69.9% of kindergarten teachers and
first-grade teachers responded strongly agree or agree to the survey statement, “The RTI
program is implemented with fidelity.” Kindergarten teachers responded at a rate of
76.5% in agreement, and first-grade teachers were in agreement at a rate of 62.1%.
Teacher survey comments indicated some teachers responded to this survey statement
based on implementation in their individual classrooms.
Administrator and teacher data results indicated varying degrees of fidelity of
implementation. Differences in implementation from school to school were reported
from all participant groups. One school administrator commented, “We have made great
strides, but still have room for improvement.”
Product Evaluation Results
Product evaluation was used to combine information gathered through context,
input, and process evaluations to identify intended and unintended outcomes. This
information provided feedback to aide in determining program success (Stufflebeam,
2000b). The researcher used interviews with district-level and school-level
administrators, a teacher survey with comments, and focus groups made up of
kindergarten and first-grade teachers to gather data for product evaluation. The RTI
114
program was implemented to provide assistance for struggling kindergarten and first-
grade readers through a district-wide system of providing tiered intervention support.
Intended outcomes identified through this study included administrator and teacher
identification of the essential elements of the program. Information collected through
universal screening and progress monitoring led to instructional planning with use of
individual student data. Through the use of school-based RTI teams, multiple staff
members (administrators, reading coaches, special education teachers, Reading Recovery
teachers, and classroom teachers) collaborated to review student progress and make
recommendations for future instruction.
Several unintended outcomes were identified. One was the perceived stress
expressed by kindergarten and first-grade teachers. Many shared they felt they had
difficulty managing interventions for struggling students and providing quality
instruction for the rest of their students. In addition, in some cases, the program
increased stress levels of kindergarten assistants as they provided interventions through
My Sidewalks and between kindergarten teachers and their assistants due to this added
responsibility for assistants. Differences in implementation from school to school were
also an unintended outcome. Unforeseeable changes to district-level personnel resulting
in less attention to the implementation caused varying levels of fidelity of
implementation. The expression of some first-grade teachers who felt they did not have
the expertise (when compared to Reading Recovery teachers) to address needs of some
struggling readers was an additional unintended outcome. While school-level
administrators and teachers indicated the RTI program was part of the core curriculum,
some confusion was expressed about the connection of the RTI program and the referral
process for special education services. Respondents indicated lack of clear expectations
115
for the referral process.
Research Question 4
How effective is the RTI program? The director of elementary education rated
the level of effectiveness of the RTI program a five on a scale of one to 10, with 10 being
outstanding. She shared,
I think it is effective for some students, but can be much more effective for
a greater number once we get some fidelity with it. When everybody is
using the same language and same level of understanding that will change
how effective we see it.
The special services coordinator for elementary education indicated during the first year
when program monitoring was very good, progress monitoring data demonstrated
students receiving interventions were making progress. She reported percentages of
growth played some part in the amount of referrals (fewer) to special education, but with
lack of program monitoring, that correlation was no longer evident. She stated, “I think
that is directly related to the lack of support for each individual school to implement it
well.” School-level administrator effectiveness ratings averaged 7.73 on the same one to
10 scale. One administrator commented, “I think if you are implementing and doing it
right with everyone on board, it can be very effective, but we are a far cry from that. We
are above average, but have not arrived, that is for sure.” First-grade teachers also
observed students who received interventions demonstrated growth. Kindergarten
teachers participating in a focus group rated the RTI program as “very effective.” On the
teacher survey, teachers responded at a rate of 74.2% to the survey statement, “The RTI
Program effectively meets the need of struggling readers.” One first-grade teacher
commented, “It helps tremendously in that it requires teachers to work with struggling

116
readers more often and with research-based materials. However, many struggling readers
need more support than just what they get in the classroom.” Overall, results indicated
the RTI program met the needs of some struggling readers, but implementation
difficulties hindered the effectiveness of the program. Participants shared while there are
some positive outcomes for students participating in the program, improvement in fidelity
of implementation was needed to improve the program so it met the needs of struggling
kindergarten and first-grade readers.
Conclusions
This study was a formative assessment of the implementation of an RTI program
in a school district in order to provide information on the program’s strengths and
weaknesses and recommendations for program improvement. Strengths found within the
program included respondent knowledge of the purpose and basic elements of an RTI
program. Respondents indicated RTI was a general education initiative designed to
provide struggling students with interventions and support needed to be successful. An
additional strength found was administrators and teachers put into practice universal
screening and progress monitoring and worked together through school-based RTI teams
to review student progress and make recommendations for future intervention and
instruction.
With basic elements identified, consistent implementation of these elements was
found to be a weakness and to be an area for concentrated improvement. Research
indicated the impact of an RTI program was determined by the quality of its
implementation (Glover & Vaughn, 2010). In addition, Hall (2008) indicated that
successful implementation of an RTI program takes 3-5 years. This program is in its
second year of implementation for the majority (11 of 15) of schools in the district, with

117
the other four schools in their third year of implementation. While participants indicated
basic knowledge and understanding of the program, challenges for successful
implementation were identified. For example, respondents indicated universal screening
instruments have changed and are not aligned with progress monitoring measures. The
need to identify additional curriculum and materials to provide interventions was shared
by teachers. Participants reported scheduling time to provide interventions and a need for
additional classroom assistance as challenges for implementing the program.
Research indicated the most important first outcome found after the
implementation of an RTI program was a change to overall student achievement
(Clemens et al., 2011). Results from an ANOVA calculated using Primary Map mean
reading percentiles for students in all schools included in the study did not indicate any
significant differences in test scores during the testing years 2012-2015. However,
results from an additional ANOVA calculated using kindergarten Primary Map data from
only the pilot schools for the same testing years (2012-2015) indicated significant
differences (in a positive direction) in mean reading percentiles between 2012 and 2014
and between 2012 and 2015. There was no significant difference in first grade pilot
school Primary Map scores for the same testing years. A chi-square analysis was
calculated for special education referral data for the pilot schools. No statistical
significance was found.
Varying degrees of fidelity of implementation have resulted because the level of
district monitoring has been reduced. Less monitoring has led to a lack of consistency for
implementation expectations and differences in implementation from school to school.
McDougal et al. (2010) indicated it is difficult to monitor the fidelity of implementation
of an RTI program, but failure to do so and insure the program is implemented with

118
fidelity may result in the program becoming ineffective. School-level administrators
indicated making sure the program had accountability through program monitoring and
follow-up of the process was needed to ensure the program was being implemented
effectively. School-level administrators and a district-level administrator reported the
current year’s implementation had not been as effective as the previous year because of
lack of program monitoring. Continued improvement through clearly defined program
goals and fidelity of implementation is needed in order to continue development of the
RTI program so it successfully meets its goal to address the needs of struggling
kindergarten and first-grade readers.
Recommendations
In its second year of district-wide implementation, the RTI program evaluated in
this study is relatively new. This district has the basic structure of an RTI program
defined and in place, but results reveal needed review and improvement in the program’s
implementation. Hall (2008) found successful implementation of an RTI program takes
3-5 years. With this in mind, continual review of implementation weaknesses identified
in this study and review of RTI programming as it relates to the district’s program is
needed. Sparks (2016) discussed concerns that RTI programs were not having the
expected positive impact for struggling readers. Screening tools, interventions, and
progress monitoring were discussed as possible causes for this observation. Screening
tools used to determine student needs should provide a full indication of student
weaknesses. Selected interventions should be related to these student weaknesses and
progress monitoring methods should assess progress toward improvement in the
determined area of weakness (Sparks, 2016).
Concerns expressed by Sparks (2016) were found in this district’s RTI
119
implementation. For example, first-grade teachers revealed specific concerns with the
use of Primary Map as a universal screening instrument. The district should investigate
going back to the use of EasyCBM or the use of a different universal screening
instrument to better align the universal screener with the progress monitoring instrument.
Teachers participating in the study indicated a need for more intervention materials in
order to effectively provide intervention support to students. Teachers also expressed
concern that the universal screening assessment did not match up to the progress
monitoring assessments. Careful review, selection, and alignment of screening tools,
intervention resources, and progress monitoring measures will assist this district as it
continues to work to implement an effective program.
It is recommended that the district continue to build administrator and teacher
support for the program by communicating its importance from the district level.
Promoting the RTI program as an integral component of both the district literacy model
and the state-mandated reading plan will provide greater understanding and relevance of
the program to teachers and building-level administrators. In addition, the district can
build teacher and building-level administrator support for the program by clearly
communicating expectations for program implementation. Building-level administrators
can also build teacher support for the program by making it a priority within the
instructional program. Assisting teachers with logistical concerns such as facilitating
scheduling of universal screening and interventions, creating space for intervention
groups, and providing time for RTI teams to meet will demonstrate a commitment to the
program and increase its level of effectiveness.
Providing ongoing professional development to support building-level
administrators and teachers in the implementation of the RTI program and providing
120
opportunities for collaboration would strengthen this program. Recommended topics for
professional development include the use of screening tools, development of
interventions, and methods for effective progress monitoring with appropriate
recordkeeping. Burns and Gibbons (2008) described collaboration as a critical element in
the RTI process. Intentionally scheduling learning opportunities for building-level
administrators, general education teachers, and special education teachers would provide
emotional and professional support as these educators work together to achieve the goal
of implementing an effective RTI program that benefits all students (Dufour & Eaker,
1998).
Responses from participants in this study indicated the role of RTI in relationship
to the district’s special education referral process was not clear. Burns and Gibbons
(2008) indicated an RTI program was designed to meet the special needs of certain
students without labeling them as learning disabled. Buffum et al. (2009) pointed out that
RTI is not intended to be a process to identify students with special needs, nor is it a
special education initiative. Clear definition of the relationship of the RTI program to
general education, to special education, and to the process for identifying students for
referral for special education evaluation is needed. Making clear these relationships
would provide clarification as to the purpose of the program.
Teachers indicated a need for additional assistance in order to effectively
implement the RTI program. In addition, district-level and building-level administrators
indicated monitoring the implementation of the RTI program was difficult due to the loss
of personnel assigned to the program. A review of staffing is recommended to determine
if redeployment of current staff members or additional personnel to assist with RTI is
feasible.

121
Buffum et al. (2010) described one guiding principle of an RTI program is the
idea of “collective responsibility” (p. 9). These researchers defined collective
responsibility as a cultural belief that each member of the organization was accountable
for making sure all students learned at high levels. Dweck (2006) indicated teachers
demonstrating a growth mindset believed all students had the capacity to learn, if the
student was willing to learn and had support to do so. Teachers with a growth mindset
focus on a student’s potential and work ethic rather than past performance. Teachers
responded at a rate of 30% disagree or strongly disagree to the statement, “All students
have the potential to achieve at high levels.” Examining the mindset of teachers as it
relates to all students achieving at high levels may be beneficial in order to increase the
success of the district’s RTI program.
This study was a formative assessment of the district’s RTI program. Feedback
from this study provides an opportunity to build on strengths and make adjustments based
on challenges discovered through this study. In order to assist with monitoring and
increase fidelity of implementation, the district should investigate training and utilizing
state-mandated reading coaches found at each school to help with the program. To add
an additional level of monitoring support, “lead reading coaches” for each of the four
attendance areas could be designated and paid a stipend to assist with program
implementation. These lead reading coaches could work with other reading coaches to
design professional development based on the needs of the teachers and administrators in
their areas, assist with facilitation of monthly RTI team meetings, and provide guidance
to teachers. In addition, reading coaches could be tasked with building a bank of
research-based interventions from which teachers can pull as needed. Finally, the district
can work to break down the wall that separates special education and general education.

122
As mentioned earlier, clearly defining the RTI program’s role in general education and
special education is needed. Including special education teachers along with general
education teachers in monthly RTI team meetings will allow sharing of ideas from
educators who are experts in their own areas. With the key elements of the RTI program
in place, building on identified strengths and weaknesses will help improve the overall
effectiveness of the program.
Recommendations for Further Research
The purpose of this study was to conduct a CIPP Program Evaluation on a
recently implemented RTI program. The researcher used reading achievement data,
special education referral data, responses from interviews, a teacher survey, and focus
groups to conduct this study. The following recommendations for further research based
on data collected during this study may be helpful to others who may study this topic.
This study revealed weaknesses in fidelity of implementation of the RTI
program. Further research may be needed to determine how to monitor
fidelity of implementation. Glover and Vaughn (2010) indicated it is difficult
to determine how to assess the fidelity of implementation but did suggest
several methods including collecting and analyzing progress monitoring data
and reviewing implementation feedback.
Conduct a CIPP evaluation of one of the components of the RTI program such
as universal screening, selecting interventions, and/or progress monitoring.
Conduct a study of interventions used by teachers at each tier of an RTI
program to determine if the intervention matches universal screening data and
is assessed with an effective progress monitoring measure.
123
Conduct a study of professional development provided for administrators and
teachers to determine its level of effectiveness in contributing to success of an
RTI program.
Conduct a cohort study of students who have participated in the RTI program–
tracking them from grade to grade and monitoring their reading achievement
levels.
In order to implement a successful RTI program, research indicated staff
members must move beyond cultural and structural barriers existing between
regular education and special education to create a cooperative response
working together to meet the individual needs of every student (Buffum et al.,
2009). Future research may conduct a study to determine the level of
collaboration and cooperation between general education and special
education teachers within an RTI program.
Limitations
Limitations are possible weaknesses in a study that are beyond the researcher’s
control. Limitations may narrow methodology and conclusions (Baltimore County
Schools, 2015). There were limitations to this study. Because the RTI program began
with a pilot year for four of the district’s elementary schools, the program was
implemented at two different time intervals. Some building-level administrators and
teachers worked with the program for 3 years and some for 2 years, resulting in varying
levels of understanding of the program framework. In addition, reading achievement data
and special education referral data reflecting full district RTI implementation were only
available for 1 year. Finally, participant responses may be impacted because the

124
researcher is an administrator in the district and whose school participated in the pilot
year.
Delimitations
Delimitations were boundaries set by the researcher to focus the study and were
within the researcher’s control (Baltimore County Schools, 2015). This study was
designed within the scope of the CIPP Evaluation Model’s inter-related evaluations of
context, input, process, and product with regard to the implementation of an RTI
program. Development of interventions, professional development, special education
processes, and the role of building-level administrators as facilitators of the program were
not within the scope of this study.
125
References
ACT Aspire LLC. (2015). State assessment solutions. Retrieved from
http://www.discoveractaspire.org/states/
Allington, R. L. (2011). What at-risk readers need. Educational Leadership, 68(8), 40-45.
Baltimore County Schools. (2015). Develop a research proposal: Planning the
methodology – limitations and delimitations. Retrieved from
https://www.bcps.org/offices/lis/researchcourse/develop_writing_methodology_li
mitations.html
Boushey, G., & Moser, J. (2009). The café book: Engaging all student in daily literacy
assessment & instruction. Portland, ME: Stenhouse Publishers.
Boykin, A. W., & Noguera, P. (2011). Creating the opportunity to learn. Alexandria,
VA: ASCD.
Brown-Chidsey, R. (2007). No more “waiting to fail.” Educational Leadership 65(2), 40-
46.
Brown-Chidsey, R., & Steege, M.W. (2005). Response to intervention: Principles and
strategies for effective practice. New York, NY: The Guildford Press.
Buffum, A., & Mattos, M. (2015). It’s about time: Planning interventions and extensions
in elementary school. Bloomington, IN: Solution Tree Press.
Buffum, A., Mattos, M., & Weber, C. (2009). Pyramid response to intervention.
Bloomington, IN: Solution Tree Press.
Buffum, A., Mattos, M., & Weber, C. (2010). The why behind RTI. Educational
Leadership, 68(2), 10-16.
Buffum, A., Mattos, M., & Weber, C. (2012). Simplifying response to intervention: Four
essential guiding principles. Bloomington, IN: Solution Tree Press.
Burns, M. K., Christ, T. J., Boice, C. H., & Szadokierski, I. (2010). Special education in
an RTI model: Addressing unique learning needs. In T. A. Glover & S. Vaughn
(Eds.), The promise of response to intervention: Evaluating current science and
practice (pp. 267-285). New York, NY: The Guilford Press.
Burns, M. K., & Gibbons, K. A. (2008). Implementing response-to-intervention in
elementary and secondary schools: Procedures to assure scientific-based
practices. New York, NY: Taylor and Francis Group.

126
Carnine, D. W., Silbert, J., Kame’enui, E. J., Tarver, S. G., & Jungjohann, K. (2006).
Teaching struggling and at-risk readers: A direct instruction approach. Upper
Saddle River, NJ: Pearson Education, Inc.
Chavez, C. (2013). Survey design. Loyola Marymount University. Retrieved from
http://www.lmu.edu/Assets/Academic+Affairs+Division/Assessment+and+Data+
Analysis/Christine$!27s+Folder/Surveys+Website/Survey+Design+Resource.pdf
Clarke, B., Gersten, R., & Newman-Gonchar, R. (2010). RTI in mathematics: Beginnings
of a knowledge base. In T. A. Glover & S. Vaughn (Eds.), The promise of
response to intervention: Evaluating current science and practice. (pp. 187-203).
New York, NY: The Guilford Press.
Clemens, N. H., Shapiro, E. S., Hilt-Panahon, A., & Gischlar, K. L. (2011). Student
achievement outcomes. In E.S. Shapiro, N. Zigmond, T. Wallace, & D. Marston
(Eds.), Models for implementing response to intervention: Tools, outcomes, and
implications (pp. 77-98). New York, NY: The Guildford Press.
David, J. L. (2010). Closing the vocabulary gap. Educational Leadership, 67(6), 85-86.
Dean, C. B., Hubbell, E. R., Pitler, H., & Stone, B. J. (2012). Classroom instruction that
works: Research-based strategies for increasing student achievement (2nd ed.).
Alexandria, VA: ASCD.
Denton, C. A., & Vaughn, S. (2010). Preventing and remediating reading difficulties:
Perspectives from research. In T. A. Glover & S. Vaughn (Eds.), The promise of
response to intervention: Evaluating current science and practice. (pp. 78-112).
New York, NY: The Guilford Press.
DeRuvo, S. L. (2010). The essential guide to RTI: An integrated, evidence-based
approach. New Jersey: John Wiley & Sons.
Dufour, R., & Eaker, R. (1998). Professional learning communities that work: Best
practices for enhancing student achievement. Alexandria, VA: ASCD.
Dweck, C. S. (2006). Mindset: The new psychology of success. New York: Random
House.
Eaker, R., DuFour, R., & DuFour, R. (2002). Getting started: Reculturing schools to
become professional learning communities. Bloomington, IN: National
Educational Service.
Eby, J. (2014). District overview. Retrieved from https://pickensk12-
public.sharepoint.com/Pages/Our%20District/District-Overview.aspx
The Every Student Succeeds Act: Explained. (2015). Education Week, 35(14), 17.

127
Fisher, D., & Frey, N. (2010). Enhancing RTI: How to ensure success with effective
classroom instruction & intervention. Alexandria, VA: ASCD.
Fitzpatrick, J., Sanders, J. R., & Worthen, B. R. (2004). Program evaluation: Alternative
approaches and practical guidelines (3rd ed.). Boston, MA: Pearson.
Fountas, I. C., & Pinnell, G. S. (2016). Turn struggling readers into successful readers
with teaching that works with Fountas & Pinnell Literacy Intervention Resources.
Retrieved from http://www.heinemann.com/fountasandpinnell/reading-
intervention-resources.aspx
Fuchs, D., Fuchs, L. S., & Vaughn, S. (2008). Introduction. In D. Fuchs, L.S. Fuchs, & S.
Vaughn (Eds.), Response to intervention: A framework for reading educators (1-
4). Newark: DE: International Reading Association, Inc.
Gall, J. P., Gall, M. D., & Borg, W. R. (2005) Applying educational research: A practical
guide (5th ed.), Boston, MA: Pearson.
Gambrell, L. B. (2004). Early literacy development. In J. Smink & F.P. Schargel (Eds.),
Helping students graduate (pp. 1-19). Larchmont, NY: Eye on Education.
Glover, T. A. (2010). Key RTI service delivery components: Considerations for research-
informed practice. In T.A. Glover & S. Vaughn (Eds.), The promise of response
to intervention: Evaluating current science and practice (pp. 7-22). New York,
NY: The Guilford Press.
Glover, T. A., & Vaughn, S. (2010). In T.A. Glover & S. Vaughn (Eds.), The promise of
response to intervention: Evaluating current science and practice (pp. ix-x). New
York, NY: The Guilford Press.
Good, T. L. (1987). Two decades of research on teacher expectations: Findings and
future directions. Journal of Teacher Education, 38(4), 32-47.
Hall, S. L. (2006). I’ve dibel’d, now what? Boston, MA: Sopris West Educational
Services.
Hall, S. L. (2008). A principal’s guide: Implementing response to intervention. Thousand
Oaks, CA: Corwin Press.
Harrison, M. (2015). Working in an RTI construction zone. In A. Buffum & M. Mattos
(Eds.), It’s about time: Planning interventions and extensions in elementary
school (pp. 147-162). Bloomington, IN: Solution Tree Press, Inc.
Harry, B., & Klingner, J. (2006). Why are so many minority students in special
education? Understanding race and disability in schools. New York: Teachers
College Press, Columbia University.
128
Harry, B., & Klingner, J. (2007). Discarding the deficit model. Educational Leadership
64(5), 16-21.
Haynes, M. (2015). The next chapter: Supporting literacy within ESEA. Retrieved from
http://all4ed.org/wp-content/uploads/2015/08/LiteracyWithinESEA.pdf
Huff, S. B. (2015). Teaming up in tier 1. In A. Buffum & M. Mattos (Eds.), It’s about
time: Planning interventions and extensions in elementary school (pp. 101-127).
Bloomington, IN: Solution Tree Press, Inc.
Jenson, E. (2009). Teaching with poverty in mind. Alexandria, VA: ASCD.
Johnson, K., & Street, E. M. (2013). Response to intervention and precision teaching:
Creating synergy in the classroom. New York, NY: The Guilford Press.
Kotulak, R. (1996). Inside the brain: Revolutionary discoveries of how the mind works.
Kansas City, MO: Andrews McMeel Publishing.
Latess, J. D. (2008). Focus-group research for school improvement: What are they
thinking? Lanham, MD: Rowman and Littlefield Education.
Lezotte, L. W., & McKee, K. M. (2002). Assembly required: A continuous school
improvement system. Okemos, MI: Effective Schools Products, Ltd.
Lyon, G. R. (2001). Measuring success: Using assessments and accountability to raise
student achievement. Department of Health and Human Services. Retrieved from
http://www.hhs.gov/asl/testify/t010308.html
McCook, J. (2006). The RTI guide: developing and implementing a model in your
schools. Horsham, PA: LRP Publications.
McDonald, J. H. (2014). Handbook of biological statistics. Retrieved from
http://www.biostathandbook.com/fishers.html
McDougal, J. L., Graney, S. B., Wright, J. A., & Ardoin, S. P. (2010). RTI in practice: A
practical guide to implementing effective evidence-based interventions in our
school. Hoboken, NJ: John Wiley & Sons, Inc.
McKown, C., & Weinstein, R. S. (2002). Modeling the role of child ethnicity and gender
in children’s differential response to teacher expectations. Journal of Applied
Social Psychology, 32(1), 159-184.
Measures of academic progress interim assessments for grades K-12 (2015). Northwest
Evaluation Association. Retrieved from
https://www.nwea.org/content/uploads/2014/07/Introduction-to-MAP-Brochure-
SEPT15.pdf

129
Mellard, D. F., & Johnson, E. (2008). RTI: A practitioner’s guide to implementing
response to intervention. Thousand Oaks, CA: Corwin Press.
Meta Connects-Research, Practice & Social Change. (2015). Surveys as a research
method: The backbone of quantitative research is within your organization’s
reach-pre-testing. Retrieved from http://metaconnects.org/survey-pretest
The Nation’s Report Card. (2015). 2015 Mathematics and Reading Assessments.
Retrieved from http://www.nationsreportcard.gov/
National Education Association. (2007). Truth in labeling: Disproportionality in special
education. Retrieved from
http://www.nea.org/assets/docs/HE/EW-TruthInLabeling.pdf
Neuman, S. B. (2007). Changing the odds. Educational Leadership, 65(2), 16-21.
Onwuegbuzie, A. J., Dickinson, W. B., Leech, N. L., & Zoran, A. G. (2009). A
qualitative framework for collecting and analyzing data in focus group research.
International Journal of Qualitative Methods, 8(3), 1-21.
Organization for Economic Cooperation and Development. (2012). United States PISA
results. Retrieved from http://www.oecd.org/unitedstates/PISA-2012-results-
US.pdf
Organization for Economic Cooperation and Development. (2015). What we do and how.
Retrieved from http://www.oecd.org/about/whatwedoandhow/
Pierangelo, R., & Giuliani, G. (2008). Frequently asked questions about response to
intervention. Thousand Oaks, CA: Corwin Press.
Read to Succeed Team, Office of School Transformation, Division of Innovation and
Effectiveness, South Carolina State Department of Education. (2015). South
Carolina state reading plan. Retrieved from
http://ed.sc.gov/scdoe/assets/File/instruction/read-to-
succeed/SC_State_Reading_Plan_2015-06-10_Final.pdf
Rossi, P. H., Lipsey, M. W., & Freeman, H. E. (2004). Evaluation: A systematic
approach (7th ed.). Thousand Oaks, CA: Sage Publications, Inc.
Sailor, W. (2009). Making RTI work: How smart schools are reforming education
through schoolwide response-to-intervention. San Francisco, CA; John Wiley &
Sons, Inc.
Saldana, J. (2009). The coding manual for qualitative researchers. Washington, DC:
Sage Publications.
130
Slavin, R. E., Karweit, N. L., & Wasik, B. A. (1992). Preventing early school failure:
what works? Educational Leadership, 50(1), 10-18.
Sornson, R., Frost, F., & Burns, M. (2005). Instructional support teams in Michigan: Data
from Northville public schools. Communique, 33(5), 28-29.
South Carolina Education Oversight Committee (2013). Children need to dream big.
Retrieved from
http://www.eoc.sc.gov/Home/Reading%20Brochure%20and%20Billboard/Readin
g%20TIPS%20Brochure.pdf
South Carolina Education Oversight Committee. (2014). At-a-Glance: 2014 annual
school and district ratings release. Retrieved from
http://www.eoc.sc.gov/Home/Report%20Card%20Data/2014/2014%20Ratings%
20at%20a%20glance.pdf
South Carolina State Department of Education (2015a). 2015 ACT Aspire test scores.
Retrieved from http://ed.sc.gov/data/test-scores/state-assessments/act-aspire-test-
scores/2015-wqoueg321u3/
South Carolina State Department of Education (2015b). District scores by grade level.
Retrieved from http://ed.sc.gov/data/test-scores/state-assessments/act-aspire-test-
scores/2015/district-aspire-scores/?ID=3901
Sparks, S. D. (2016, March). RTI practice falls short of promise. Education Digest, 81(7),
37-41.
Stetser, M. C., & Stillwell, R. (2014). Public high school four-year on-time graduation
rates and event dropout rates: School years 2010-2011 and 2011-2012. Retrieved
from http://nces.ed.gov/pubs2014/2014391.pdf
Stuart, S. K., & Rinaldi, C. (2009). A collaborative planning framework for teachers
implementing tiered instruction. Teaching Exceptional Children, 42(2), 52-57.
Stufflebeam, D. L. (2000a). Foundational models for 21st century program evaluation. In
D.L. Stufflebeam, G.F. Madaus, & T. Kellaghan (Eds.), Evaluation models:
Viewpoints on educational and human services evaluation (2nd ed., pp. 33-83).
Boston, MA: Kluwer Academic Publishers.
Stufflebeam, D. L. (2000b). The CIPP model for evaluation. In D.L. Stufflebeam, G.F.
Madaus, & T. Kellaghan (Eds.), Evaluation models: Viewpoints on educational
and human services evaluation, (2nd ed., pp. 279-317). Boston, MA: Kluwer
Academic Publishers.
Stufflebeam, D. L., & Coryn C. L. (2014). Evaluation theory, models, & applications:
Research methods for the social sciences (2nd ed.). San Francisco, CA: Josey-
Bass.

131
Sugai, G., Horner, R. H., Fixsen, D., & Blase, K. (2010). Developing systems-level
capacity for response to intervention implementation: Current efforts and future
directions. In T.A. Glover & S. Vaughn (Eds.) Response to intervention:
Empowering all students to learn – A critical account of the science and practice
(pp. 286-309). New York: Guilford.
Taylor, B. M. (2008). Effective classroom reading instruction in the elementary grades.
In D. Fuchs, L.S. Fuchs, & S. Vaughn (Eds.), Response to intervention: A
framework for reading educators (pp. 5-25). Newark: DE: International Reading
Association, Inc.
Taylor, B. M., Pearson, P. D., Clark, K., & Walpole, S. (2002). Effective schools and
accomplished teachers: Lessons about primary grade reading instruction in low-
income schools. In B.M. Taylor & P.D. Pearson (Eds.), Teaching reading:
Effective schools, accomplished teachers (3-72). Mahwah, NJ: Lawrence Erlbaum
Associates.
Tomlinson, C. A., & Imbeau, M. B. (2010). Leading and managing a differentiated
classroom. Alexandria, VA: ASCD.
Trochim, W. M. K. (2006). Random selection & assignment. Web Center for Social
Research Methods. Retrieved from
http://www.socialresearchmethods.net/kb/random.htm
United States Department of Education. (2013). Identification of children with
disabilities: Data display: South Carolina. Retrieved from
http://www2.ed.gov/fund/data/report/idea/partbspap/2013/sc-acc-stateprofile-11-
12.pdf
United States Department of Education. (2015). Elementary and secondary education
act. Retrieved from http://www.ed.gov/esea
United States Department of Education, National Center for Education Statistics. (2013).
NAEP State Profiles. Retrieved from
http://nces.ed.gov/nationsreportcard/subject/publications/stt2013/pdf/2014464SC4
United States Department of Education, Office of Elementary and Secondary Education
(2002). Guidance for the Reading First Program. Retrieved from
http://www2.ed.gov/programs/earlyreading/index.html

132
United States Department of Education, Office of Special Education and Rehabilitative
Services (2002). A new era: Revitalizing special education for children and their
families. Retrieved from
http://ectacenter.org/~pdfs/calls/2010/earlypartc/revitalizing_special_education.pd
f
Wolfe, P., & Nevills, P. (2004). Building the reading brain, preK-3. Thousand Oaks, CA:
Corwin Press.
Zheng, J. (2011, June 8). How many days does it take for respondents to respond to your
survey? Retrieved from https://www.surveymonkey.com/blog/2011/06/08/time-
to-respond/

133
Appendix A
Teacher Electronic Survey

134
Email Inviting Teachers to Participate in Research Survey
As a kindergarten or first-grade teacher in the district, you are invited to
participate in a survey designed to collect data concerning the implementation of the
Response to Intervention Program (RTI) in the district. Information gathered from this
survey will be used as part of a formative assessment of the program and is part of a
dissertation study. The evaluation of the RTI Program will be conducted using the CIPP
Evaluation Model. The survey consists of 28 multiple choice questions and should take
approximately 5-10 minutes to complete. This survey is completely anonymous and
responses and comments are not identifiable to a particular respondent. By continuing
with the survey, you are giving your consent to participate in this study. You may choose
to discontinue the survey at any time. The link to the survey is found below.
Thank you in advance for your assistance and input,
Angie Rodgers
Survey Link

135
RTI Program Evaluation Survey: Kindergarten and First Grade Teachers
Directions: Please choose one answer to each question in the survey. You may provide
additional information under comments at the end of each section of the survey.
Demographics 1. Current Grade Level:
2. Number of years teaching at current grade level:
3. Number of years teaching experience:
4. Highest degree earned:
CIPP – Context (Program Needs, Goals, Basic Elements)
5. One goal of the RTI program is to insure all students receive necessary instruction
so that they read on grade level.
A. Strongly Agree
B. Agree
C. Neither Agree nor Disagree
D. Disagree
E. Strongly Disagree
Comments:
6. The RTI program is a general education initiative.
A. Strongly Agree
B. Agree
C. Neither Agree nor Disagree
D. Disagree
E. Strongly Disagree
Comments:
7. All students have the potential to achieve at high levels.
A. Strongly Agree
B. Agree
C. Neither Agree nor Disagree
D. Disagree
E. Strongly Disagree
Comments:
8. An effectively designed core curriculum is a key component of RTI

136
A. Strongly Agree
B. Agree
C. Neither Agree nor Disagree
D. Disagree
E. Strongly Disagree
Comments:
9. RTI is a program designed to provide high-quality instruction and interventions
according to individual student needs.
A. Strongly Agree
B. Agree
C. Neither Agree nor Disagree
D. Disagree
E. Strongly Disagree
Comments:
CIPP – Input (Program Design)
10. Interventions are necessary to address the needs of struggling readers.
A. Strongly Agree
B. Agree
C. Neither Agree nor Disagree
D. Disagree
E. Strongly Disagree
Comments:
11. Interventions provided as soon as students begin to struggle help students
overcome economic and environmental disadvantages.
A. Strongly Agree
B. Agree
C. Neither Agree nor Disagree
D. Disagree
E. Strongly Disagree
Comments:
12. RTI provides effective reading intervention for all students.
A. Strongly Agree
B. Agree
C. Neither Agree nor Disagree
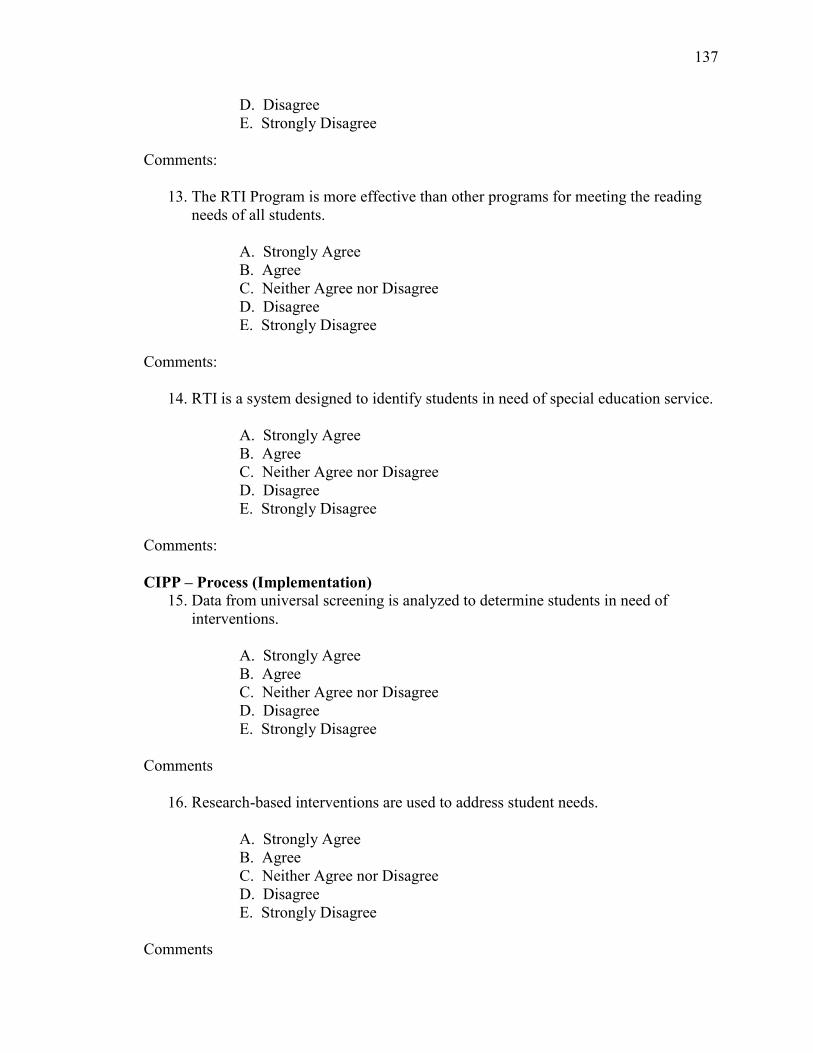
137
D. Disagree
E. Strongly Disagree
Comments:
13. The RTI Program is more effective than other programs for meeting the reading
needs of all students.
A. Strongly Agree
B. Agree
C. Neither Agree nor Disagree
D. Disagree
E. Strongly Disagree
Comments:
14. RTI is a system designed to identify students in need of special education service.
A. Strongly Agree
B. Agree
C. Neither Agree nor Disagree
D. Disagree
E. Strongly Disagree
Comments:
CIPP – Process (Implementation)
15. Data from universal screening is analyzed to determine students in need of
interventions.
A. Strongly Agree
B. Agree
C. Neither Agree nor Disagree
D. Disagree
E. Strongly Disagree
Comments
16. Research-based interventions are used to address student needs.
A. Strongly Agree
B. Agree
C. Neither Agree nor Disagree
D. Disagree
E. Strongly Disagree
Comments

138
17. Progress monitoring is used to determine the effectiveness of individual
interventions.
A. Strongly Agree
B. Agree
C. Neither Agree nor Disagree
D. Disagree
E. Strongly Disagree
Comments
18. Teachers work together to address the needs of struggling readers.
A. Strongly Agree
B. Agree
C. Neither Agree nor Disagree
D. Disagree
E. Strongly Disagree
Comments:
19. School-based RTI team s work together to identify interventions for students who
need tiered instructional support.
A. Strongly Agree
B. Agree
C. Neither Agree nor Disagree
D. Disagree
E. Strongly Disagree
Comments:
20. I am confident in my ability to implement tiered interventions for my students.
A. Strongly Agree
B. Agree
C. Neither Agree nor Disagree
D. Disagree
E. Strongly Disagree
Comments:
21. All elements of the RTI program - universal screening, tiered intervention, and
progress monitoring - are implemented.
A. Strongly Agree
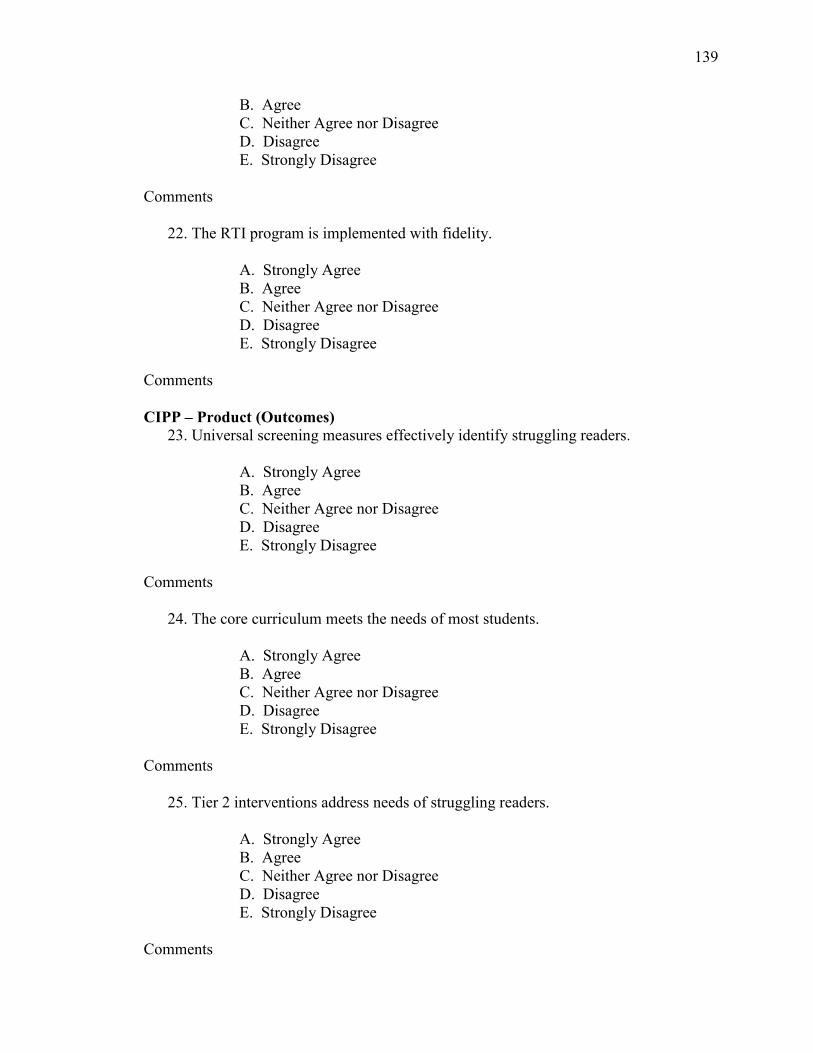
139
B. Agree
C. Neither Agree nor Disagree
D. Disagree
E. Strongly Disagree
Comments
22. The RTI program is implemented with fidelity.
A. Strongly Agree
B. Agree
C. Neither Agree nor Disagree
D. Disagree
E. Strongly Disagree
Comments
CIPP – Product (Outcomes)
23. Universal screening measures effectively identify struggling readers.
A. Strongly Agree
B. Agree
C. Neither Agree nor Disagree
D. Disagree
E. Strongly Disagree
Comments
24. The core curriculum meets the needs of most students.
A. Strongly Agree
B. Agree
C. Neither Agree nor Disagree
D. Disagree
E. Strongly Disagree
Comments
25. Tier 2 interventions address needs of struggling readers.
A. Strongly Agree
B. Agree
C. Neither Agree nor Disagree
D. Disagree
E. Strongly Disagree
Comments
140
26. Tier 3 interventions address needs of students with the greatest reading
weaknesses.
A. Strongly Agree
B. Agree
C. Neither Agree nor Disagree
D. Disagree
E. Strongly Disagree
Comments
27. Information from progress monitoring guides instructional decisions and
interventions provided for students.
A. Strongly Agree
B. Agree
C. Neither Agree nor Disagree
D. Disagree
E. Strongly Disagree
Comments
28. The RTI program effectively meets the needs of struggling readers.
A. Strongly Agree
B. Agree
C. Neither Agree nor Disagree
D. Disagree
E. Strongly Disagree
Comments

141
Appendix B
Focus Group

142
Email Inviting Teachers to Participate in Focus Group
You have been randomly selected to participate with other kindergarten (or first
grade) teachers in a focus group to discuss the implementation of the RTI program in the
district. This focus group is a follow-up to the RTI research survey teachers were invited
to complete. This group provides an opportunity for participants to share their ideas about
the RTI program. Information gathered from this focus group will be used as part of a
formative assessment of the program and is part of a dissertation study. This study seeks
to discover the overall effectiveness of the RTI program by determining progress toward
meeting program goals, assessing the level of fidelity of program implementation, and
identifying the degree to which the program meets the needs of struggling kindergarten
and first grade readers.
The focus group will meet once and participation in the group will require
approximately two hours of your time. Your participation in the group is confidential.
Your name will never be made public or recorded in data.
Please indicate your willingness to participate or your desire not to participate in
the group by responding to this email. By indicating your willingness to be a member of
this focus group, you give your consent to participate in this study. The focus group will
meet at West End Elementary on (data and time to be determined once data collection
begins). This group will be facilitated by Kela Simpson.
Thank you in advance for your consideration,
Angie Rodgers

143
Focus Group Protocol
Date
Welcome and Introductions
Facilitator
o As facilitator, the researcher will encourage discussion within the group
Participants
Purpose and Assurances
The purpose of this focus group is to discuss the implementation of the RTI
program in the district. Each focus group member will have the opportunity to
share his or her thoughts about a series of questions.
Conducting this focus group is a part of research conducted for a dissertation
study designed to complete an evaluation of the implementation of RTI – its
strengths, weaknesses, needs, etc.
Everyone’s thoughts and opinions are welcome and respected.
Discussion will be audio taped in order to analyze the points discussed.
Participation in the group and thoughts shared are confidential.
Questions
5. What are the goals of the RTI program? (Context)
6. What did reading instruction for struggling readers look like in your
classrooms before implementing RTI? (Input)
7. How does reading instruction for struggling readers look like with RTI?
(Input)
8. In your opinion, what are the strengths of RTI? (Input)
9. In your opinion, what are the challenges of RTI? (Input)
10. How do you insure the program is implemented with fidelity? (process)
11. In your opinion, how effective is the RTI program? (product)

144
Appendix C
District Approval Letter

145
January 28, 2016
Dear Ms. Angie Rodgers:
I have received and reviewed your request to conduct a CIPP Program Evaluation of the
Response to Intervention (RTI) Program in the district. I understand that you will
examine the overall effectiveness of the RTI program by determining progress toward
meeting program goals, assessing the level of fidelity of program implementation, and
identifying the degree to which the program meets the needs of struggling kindergarten
and first grade readers. You have permission to use assessment data, administer surveys,
meet with focus groups, and conduct interviews to gather the information needed for your
study. We ask that the confidentiality of all individual student data be maintained.
We wish you the best in your endeavors and look forward to a successful outcome. If I
can be of any assistance, please do not hesitate to contact me.
Sincerely,
Assistant Superintendent of Instructional Services