Reconfigurable Intelligent Surface Optimization for Uplink ...
Research ArticleResponse Surface Optimization of Bioethanol Production fromSugarcane Molasses by Pichia veronae Strain HSC-22
Hamed I. Hamouda,1 Hussein N. Nassar,1 Hekmat R. Madian,1
Salem S. Abu Amr,2 and Nour Sh. El-Gendy1
1Egyptian Petroleum Research Institute, P.O. Box 11727, Nasr City, Cairo, Egypt2Malaysian Institute of Chemical and Bioengineering Technology, Universiti Kuala Lumpur, Melaka, Malaysia
Correspondence should be addressed to Nour Sh. El-Gendy; [email protected]
Received 30 July 2015; Revised 21 October 2015; Accepted 12 November 2015
Academic Editor: Marika Kokko
Copyright © 2015 Hamed I. Hamouda et al. This is an open access article distributed under the Creative Commons AttributionLicense, which permits unrestricted use, distribution, and reproduction in any medium, provided the original work is properlycited.
Pichia veronae strain HSC-22 (accession number KP012558) showed a good tolerance to relatively high temperature, ethanol andsugar concentrations. Response surface optimization based on central composite design of experiments predicted the optimalvalues of the influencing parameters that affect the production of bioethanol from sugarcane molasses to be as follows: initial pH5, 25% (w : v) initial molasses concentration, 35∘C, 116 rpm, and 60 h. Under these optimum operating conditions the maximumbioethanol production on a batch fermenter scale was recorded as 32.32 g/L with 44% bioethanol yield.
1. Introduction
Recently, the worldwide application of biofuels as alternativeor complementary for petrofuels has grown.This is due to thelimitation of oil reserves, fluctuation of oil price, the increasedconcern about the global warming and climate change causedby the increment of the greenhouse gas emissions, and theawareness to promote rural economics [1]. Ethanol, in spiteof its lower heating value than gasoline, it has become asone of the most important renewable fuels in the worldwidemarkets, due its economic and environmental benefits [2].Saccharomyces cerevisiae has been the most commonly usedmicroorganism for the ethanol production by the alcoholicfermentation of different feedstock rich in sugars [1, 3, 4].From the economic view point, molasses as an agroindustrialwaste is widely used as a raw material for the productionof ethanol [1, 3–11]. To our knowledge, there is no reportpublished on the bioethanol fermentation from molasses byPichia veronae.
A number of factors like high temperature, low ethanol,and sugar tolerance of the yeast limit the industrial pro-duction of ethanol at low production costs. The use of
concentrated sugar substrate is one of the ways to obtainhigh ethanol yield during fermentation. However, high sub-strate concentrations are inhibitory to fermentation due tothe osmotic stress. Also, it is known that the pH of thefermentationmedium significantly affects the process [10, 12].The usage of multivariant techniques for the optimization ofprocesses has increased since the past few years [4, 9–11].
The aim of this study is to optimize the productionof ethanol by Egyptian yeast strain Pichia veronae HSC-22 (accession number KP012558) on the batch flasks scale.Response surface methodology RSM based on central com-posite design CCD of experiments was used in this study,to overcome the limitation of one-at-a-time-parameter opti-mization. The production of bioethanol under the obtainedoptimum operating conditions was also investigated on afermenter scale.
2. Materials and Methods
2.1. Feedstock. Sugarcane molasses was purchased from Sug-ars and Integrated Industries Egyptian Distillation Plants inHawamdia City, Giza, Egypt, and stored at 4∘C until use.
Hindawi Publishing CorporationBiotechnology Research InternationalVolume 2015, Article ID 905792, 10 pageshttp://dx.doi.org/10.1155/2015/905792

2 Biotechnology Research International
Table 1: Parameters and levels of the experimental design.
Parameters Levels−1 0 +1
pH 4 5 6Molasses concentration, wt.% (w : v) 15 20 25Temp., ∘C 25 30 35Mixing rate, rpm 50 100 150Incubation period, h 24 48 72
2.2. Media. WickerhamWHmedium prepared according toWickerham [13] was used for maintenance and inoculumpreparation.
Medium for fermentation experiments was prepared asfollows: 2 g KH
2PO4, 10 g (NH
4)2SO4, 1 g MgSO
4⋅7H2O, and
2 g yeast extract were dissolved in 1 L distilled water andmolasses and pH values were then adjusted according tothe experimental conditions (Table 1), before sterilization, at121∘C for 20min to avoid contamination.
2.3. Microorganism and Inoculum Preparation. The yeastPichia veronae strain HSC-22 (accession number KP012558)used in this study was obtained from Petroleum Biotech-nology Lab, Egyptian Petroleum Research Institute EPRI.Active cultures for fermentation experiments were preparedby growing HSC-22 in WH medium for 48 h at 30∘C inshaking incubator 150 rpm. Harvested cells were washedtwice with sterile saline (8.5 g NaCl per 1 L distilled water)and then resuspended in sterile saline to be used as a freshand pure stock for inoculation.
2.4. Analytical Methods. The types and concentration ofsugars in molasses were determined using high performanceliquid chromatography HPLC (1200 Series Agilent HPLC,USA) equipped with a refractive index RI detector (modelAgilent 1260 infinity, USA) and Spherisorb Amino (NH
2)
Cartridge column (pore size 80 A, inner diameter 4.6mm,length 250mm, and particle size 5 𝜇m, Waters, Ireland).The mobile phase was acetonitrile : water (80 : 20 v/v), flowrate was 1.5mL/min, and injection volume was 10𝜇L andthe column temperature was 35∘C. Ethanol concentration(g/L) was measured by gas chromatography (model 6890(G1530A), Agilent, USA), equipped with flame ionizationdetector and nominal capillary column (HP-5, 5% phenyl-95% methylsiloxane 30m × 250𝜇mID, 5.00𝜇m film, USA).Nitrogen was the carrier gas; flow rate was 25mL/min. Ovenand detector temperaturewas 300∘C, and the bioethanol yieldwas calculated according to the following equation:
Bioethanol yield (%)
=
Produced bioethanol concentration g/LAmount of total sugars in the substrate g/L
× 100.
(1)
The fermentation efficiency was calculated according to El-Refai et al. [6]:
Actual ethanol contentTheoretical ethanol content
× 100,(2)
where the theoretical ethanol content = total fermentablesugar × 0.64 [14].
All of the aforementioned analyses were done in CentralAnalytical Lab, Egyptian Petroleum Research Institute. Allother chemical characterizations of molasses were done inAgricultural ResearchCenter, Giza, Egypt. Estimation of totalreducing sugars in the collectedmolasses samples was carriedout by 3,5-dinitrosalicylic acid (DNS) [15]. All experimentswere carried out in triplicate, and the listed results are theaverage.
2.5. Fermentation Experiments. Batch fermentations weredone in 100mL Erlenmeyer flasks fitted with rubber stoppers,containing 50mL of culture media with different molassesconcentrations (wt.%) and pH values, adjusted according tothe required experimental conditions (Table 1), and wereinoculated with 10% (v/v) yeast suspension (≈105 cells/mL).Incubation was performed in shaking incubator, set at dif-ferent temperatures and shaking speeds according to therequired experimental conditions. Samples for analyses weretaken at the beginning and end of fermentation at differentprescribed incubation periods.
2.6. Experimental Design. Response surface methodology(RSM) was used to optimize bioethanol production processfrom sugarcanemolasses (SCM) and investigate the influenceof different fermentation process variables on the bioethanolyield.The central composite designCCDwas applied to studyprocess variables. The experimental runs were carried outaccording to a 25 full factorial design for the five identi-fied design independent variables, namely, initial pH (𝐴),molasses concentration wt.% (𝐵), incubation temperature∘C (𝐶), mixing rate rpm (𝐷), and incubation period h (𝐸),with low (−1) and high (+1) levels. The total number ofexperiments (runs) was given by the simple formula [50 =2
𝑘
+ 2𝑘 + 8], where 𝑘 is the number of independent variables(𝑘 = 5); this includes the following: 32 factorial points from42 full factorial CCD were augmented with 8 replicates atthe center point to assess the pure error. Response selectedwas bioethanol yield. The levels were selected based onpreliminary study results. The design factors (variables) withlow −1 and high +1 levels are, namely, 𝐴 [4 and 6], 𝐵 [15 and25wt%], 𝐶 [25 and 35∘C],𝐷 [50 and 150 rpm], and 𝐸 [24 and72 h].The central values (zero levels) chosen for experimentaldesignwere as follows: pH 5, 20%, 30∘C, 100 rpm, and 48 h for𝐴, 𝐵, 𝐶,𝐷, and 𝐸, respectively (Table 1).
2.7. Statistical Analysis. Once the experiments were pre-formed, the next step was to perform a response surfaceexperiment to produce a prediction model to determinecurvature, detect interactions among the design factors(independent variables), and optimize the process, that is,determine the local optimum independent variables with

Biotechnology Research International 3
maximum yield of bioethanol. The model used in this studyto estimate the response surface is the quadratic polynomialrepresented by the following equation:
𝑌 = 𝛽
𝑜+
5
∑
𝑖=1
𝛽
𝑖𝑥
𝑖+
4
∑
𝑖=1
5
∑
𝑗=𝑖+1
𝛽
𝑖𝑗𝑥
𝑖𝑥
𝑗+
5
∑
𝑖=1
𝛽
𝑖𝑖𝑥
2
𝑖
, (3)
where 𝑌 is the bioethanol yield (g/L), 𝛽𝑜is the value of the
fixed response at the center point of the design, and 𝛽𝑖, 𝛽𝑖𝑗,
and 𝛽𝑖𝑖are the linear, interactive, and quadratic coefficients,
respectively. 𝑥𝑖and 𝑥
𝑗are the independent variables (factors)
under study.The statistical software Design Expert 6.0.7. (Stat-Ease
Inc., Minneapolis, USA) was used for design of experiments,regression, and graphical analysis of the data obtained andfor statistical analysis of the model to evaluate the analysis ofvariance (ANOVA) and it was used also for the optimizationof the bioethanol fermentation process.
2.8. Batch Fermentation under OptimumConditions. A batchfermentation of SCMwas performed under the selected opti-mum conditions, in a self-sterilizer 10 L bioreactor (BiotronLiflus SL, Korean Republic) with a working capacity of 5 L;after the sterilization step, the broth was cooled and theninoculated with 10% (v/v) yeast suspension (≈105 cells/mL).The batch fermentation was conducted for 72 h, and theproduced ethanol and residual sugars’ concentrations weredetermined, during the prescribed time intervals.
3. Results and Discussion
3.1. Chemical Composition of Molasses. Sugarcane molasseswas a dark viscous fluid with pH value of 5 and veryrich in nutrients required by most microorganisms. Carbon,nitrogen, phosphors, sodium, and potassium contents were64, 6, 0.5, 0.9, and 5.5 (wt.%), respectively. Nonnitrogenouscompounds (e.g., citric acid, oxalic acid) represented 2–8% (wt.%). Molasses had no furfural which is toxic to most offermenting microorganisms. The ashes (11%wt.%) constitutea source of mineral elements. Molasses was found to berich in calcium ≈1.7% and contained significant quantities oftrace minerals: copper (5.4 ppm), zinc (8.8 ppm), manganese(11.6 ppm), iron (190.6 ppm), and magnesium (3379 ppm). Ithad total sugars of 292.82 g/L, where sucrose recoded thelargest percentage of 70.97%, followed by glucose 16.54%,fructose 9.67%, xylose 2.10%, and maltose 0.72%. The SCMcontained total reducing sugars TRS (69.6 g/L). The SCMwas rich in fermentable sugars ≈55% (wt%) and the nonfer-mentable sugars recorded ≈5% (wt%).
Most of the chemical parameters determined in thisstudy were in close agreement with those reported by Chenand Chou [16], who found that molasses contains 45–55%total sugars, 20–25% reducing sugars, 10–16% ash, 0.4–0.8%calcium, 0.1–0.4% sodium, 1.5–5% potassium, and pH 5–5.5. These results were in agreement with those reported byNakata et al. [17], where themain compound in canemolassesis sucrose, while glucose and fructose are found in lowerconcentrations.
A B C D E AB AC AD AE BC BD BE CD CE DE
6
4
2
0
−2
−4
−6
−8
−10
−12
−14
A2
B2
C2
D2
E2
Figure 1: Pareto chart showing the effect of different independentvariables on bioethanol yield.
3.2. RegressionModel and Its Validation. Themain concern inthis study is the actual amount of produced bioethanol, thatis, the actual yield of bioethanol relative to the amount of totalsugars in the initial substrate (molasses) concentration.
The complete design matrix with experimental and pre-dicted values of the produced bioethanol yield (%) is pre-sented in Table 2. Based on CCD and experimental data, thefollowing second-order quadratic model equation describingthe influence of different considered variables on processyield was obtained:
𝑌 = 35.4 + 0.509𝐴 + 1.63𝐵 + 1.45𝐶 + 1.84𝐷 + 4.28𝐸
− 12.3𝐴
2
+ 1.86𝐵
2
+ 0.855𝐶
2
+ 0.48𝐷
2
− 9.98𝐸
2
− 0.244𝐴𝐵 − 0.676𝐴𝐶 + 0.394𝐴𝐷 − 0.0294𝐴𝐸
+ 0.166𝐵𝐶 − 1.02𝐵𝐷 + 0.618𝐵𝐸 − 0.308𝐶𝐷
+ 0.392𝐶𝐸 + 1.25𝐷𝐸,
(4)
where 𝑌 is the bioethanol yield % and positive sign in frontof the terms indicates synergetic effect, whereas negative signindicates antagonistic effect.
Pareto charts, which are very useful in design of exper-iments, were used in this work, to make it much easier tovisualize the main and interaction effects of all factors to theresponse variable, that is, bioethanol yield (Figure 1). Themodel identified that within the studied range of experimentsthe incubation period has the highest positive impact onthe fermentation process followed by the mixing rate, initialmolasses concentration, and incubation temperature, in adecreasing order. While the initial pH has a slight positiveimpact on the bioethanol yield (%), its quadratic effect hasthe highest negative impact on the fermentation process,followed by the negative quadratic effect of incubation period.While the quadratic effects of the initial molasses concentra-tion, incubation temperature, andmixing rate have a positiveimpact on the fermentation process in a decreasing order,the positive interactive effect of the studied parameters canbe ranked in the following decreasing order: mixing rateand incubation period > initial molasses concentration andincubation period > initial pH and mixing rate ≈ incubationperiod and temperature > initial molasses concentration andincubation temperature. But the negative interactive effect

4 Biotechnology Research International
Table 2: Experimental design matrix with experimental and predicted bioethanol yield.
Runnumber
Initial pH𝐴
Molassesconcentration𝐵
Incubationtemperature𝐶
Mixingrate𝐷
Incubationperiod𝐸
Bioethanolconcentration
g/L
Bioethanol yield%
Actual Predicted1 0 −1 0 0 0 18.2 41.4 39.12 −1 −1 −1 −1 +1 4.01 9.13 11.23 1 −1 −1 −1 +1 6.29 14.3 13.24 0 0 0 −1 0 19.3 33.0 34.15 0 0 0 0 +1 18.4 31.4 29.76 −1 0 0 0 0 15.3 26.1 22.67 0 0 −1 0 0 20.3 34.7 34.88 +1 −1 −1 +1 −1 4.61 10.5 13.99 +1 +1 +1 +1 +1 22.3 30.5 26.510 −1 +1 +1 −1 +1 19.5 26.7 23.911 −1 −1 +1 −1 −1 3.96 9.02 10.912 −1 −1 +1 −1 +1 6.48 14.8 16.513 +1 −1 +1 −1 −1 4.64 10.6 10.314 0 +1 0 0 0 23.5 32.1 38.915 +1 −1 +1 +1 +1 8.90 20.3 24.216 0 0 0 0 0 20.6 35.2 35.417 0 0 0 +1 0 22.1 37.7 37.718 −1 −1 −1 +1 −1 4.31 9.82 10.219 0 0 0 0 0 21.3 36.4 35.420 −1 +1 +1 +1 −1 8.80 12.0 13.521 0 0 +1 0 0 21.5 36.7 37.722 +1 +1 +1 +1 −1 9.44 12.9 13.523 +1 −1 +1 −1 +1 7.96 18.1 15.924 0 0 0 0 0 21.4 36.6 35.425 +1 0 0 0 0 11.1 19.0 23.626 0 0 0 0 0 20.9 35.6 35.427 0 0 0 0 0 21.3 36.4 35.428 +1 +1 −1 +1 −1 11.9 16.2 13.029 −1 +1 +1 +1 +1 19.4 26.5 26.630 0 0 0 0 0 21.3 36.4 35.431 −1 +1 −1 −1 −1 8.45 11.6 11.432 +1 +1 +1 −1 +1 14.7 20.1 22.233 +1 +1 −1 −1 −1 10.8 14.8 12.534 −1 −1 −1 −1 −1 3.39 7.72 7.1335 +1 +1 −1 +1 +1 17.1 23.4 24.536 0 0 0 0 0 20.9 35.7 35.437 +1 −1 −1 −1 −1 3.60 8.20 9.2638 +1 −1 −1 +1 +1 10.7 24.4 22.939 0 0 0 0 −1 10.8 18.4 21.140 0 0 0 0 0 20.6 35.3 35.441 +1 +1 +1 −1 −1 10.6 14.5 14.242 −1 −1 +1 +1 +1 9.54 21.7 23.443 +1 −1 +1 +1 −1 7.07 16.1 13.744 +1 +1 −1 −1 +1 13.6 18.5 19.045 0 −1 +1 +1 −1 6.26 14.3 12.746 0 +1 −1 −1 +1 12.9 17.7 17.9

Biotechnology Research International 5
Table 2: Continued.
Runnumber
Initial pH𝐴
Molassesconcentration𝐵
Incubationtemperature𝐶
Mixingrate𝐷
Incubationperiod𝐸
Bioethanolconcentration
g/L
Bioethanol yield%
Actual Predicted47 0 +1 −1 +1 −1 7.31 9.99 10.348 0 +1 −1 +1 +1 15.7 21.5 21.949 0 +1 +1 −1 −1 12.2 16.7 15.850 0 −1 −1 +1 +1 8.74 19.9 19.3
Table 3: Analysis of variance of fitted quadratic regression model equation (4).
Source SS∗ df∗ MS∗ 𝐹-value 𝑃 value RemarksModel 4.79E + 003 20 240 29.1 <0.0001 Very highly significant𝐴 8.80 1 8.80 1.07 0.309 Nonsignificant𝐵 90.4 1 90.4 11.0 0.00245 Significant𝐶 71.2 1 71.2 8.67 0.00632 Significant𝐷 115 1 115 13.9 0.000818 Highly significant𝐸 624 1 624 75.9 <0.0001 Very highly significant𝐴
2 376 1 376 45.8 <0.0001 Very highly significant𝐵
2 8.60 1 8.60 1.05 0.315 Nonsignificant𝐶
2 1.81 1 1.81 0.220 0.643 Nonsignificant𝐷
2 0.569 1 0.569 0.0693 0.794 Nonsignificant𝐸
2 246 1 246 30.0 <0.0001 Very highly significant𝐴𝐵 1.91 1 1.91 0.233 0.633 Nonsignificant𝐴𝐶 14.6 1 14.6 1.78 0.193 Nonsignificant𝐴𝐷 4.98 1 4.98 0.606 0.443 Nonsignificant𝐴𝐸 0.0276 1 0.0276 0.00336 0.954 Nonsignificant𝐵𝐶 0.878 1 0.878 0.107 0.746 Nonsignificant𝐵𝐷 33.3 1 33.3 4.06 0.0534 Possibly significant𝐵𝐸 12.2 1 12.2 1.49 0.232 Nonsignificant𝐶𝐷 3.04 1 3.04 0.370 0.548 Nonsignificant𝐶𝐸 4.91 1 4.91 0.598 0.446 Nonsignificant𝐷𝐸 50.3 1 50.3 6.12 0.0195 Possibly significantResidual 238 29 8.22Pure error 2.13 7 0.304Corrected total 5.03E + 003 49∗SS: sum of squares; df: degree of freedom; MS: mean square.
of the studied parameters can be ranked in the followingdecreasing order: initial molasses concentration and mixingrate > initial pH and incubation temperature > incubationtemperature and mixing rate > initial pH and molassesconcentration > initial pH and incubation period.
The validity of the fitted model was evaluated and thestatistical significance was controlled by 𝐹-test. The analysisof variance (ANOVA) for the response surface full quadraticmodel is given in Table 3. It can be indicated that the model(4) is very highly statistically significant at 95% confidencelevel, with 𝐹-value of 29.1 and very low probability 𝑃 valueof < 0.0001; that is, there is less than 0.01% chance that thiserror is caused by noise. The values of the determinationcoefficients, 𝑅2 and 𝑅2adj, which measure the model fittingreliability, were calculated and found to be 0.953 and 0.920,
respectively. This suggests that approximately 95.3% of thevariance is attributed to the variables, which indicated thehigh significance of the model, where only 4.7% of the totalvariations cannot be explained by the model (4), whichensures the good adjustment of the above predicted modelto the experimental data. Confirmation of the adequacy ofthe regression model was reflected also by the good agree-ment between the experimental and the predicted valuesof the response variables as shown in Table 2, where theexperimental bioethanol yield ranged from 8.20 to 41.4%and the corresponding predicted values were 9.26 and 39.1%,respectively. The “Adeq Precision” measures the signal tonoise ratio. A ratio greater than 4 is desirable. The ratio of17.1 for model (4) indicated the adequate signal. This modelis reliable and can be used to navigate the design space.

6 Biotechnology Research International
Actual
Pred
icte
d
6.72
15.4
24.1
32.7
41.4
6.72 15.4 24.1 32.7 41.4
Experimental values versus predicted values for model equation (4)
(a)
PredictedSt
anda
rdiz
ed re
sidua
ls
7.13 15.1 23.0 31.0 38.9
Residual versus predicted response
3.00
1.43
−0.139
−1.71
−3.28
(b)
Figure 2: Validity of model equation (4).
The standard deviation SD and the coefficient of variancewere low, recording 2.87 and 12.8 for model equation (4),respectively.
The performance of the model can be observed bythe plots of the predicted versus experimental results ofbioethanol yield (Figure 2(a)), which showed high correlationcoefficients (𝑅2 = 0.94), indicating that the predictedand experimental values were in reasonable agreement. Thismeans that the data fit well with the models and give aconvincingly good estimate of response for the system in thestudied experimental range. Figure 2(b) presents a plot ofthe residual distribution, defined as the difference betweencalculated and observed values of the response variable stud-ied, versus predicted response. The quality of the fit is goodbecause the residual distribution does not follow a trend withrespect to the predicted values of response variable, whichindicate that the quadratic model adequately represents thebioethanol % yield over the studied experimental range.
The perturbation plot (Figure 3) shows the compara-tive effects of all the studied independent variables on thebioethanol yield %. The curvatures of the five studied factorsfrom the center point confirm the statistical data obtainedfrom analysis of variance (ANOVA, Table 3), that is, thesignificance of each parameter (coefficient). It is obvious fromthe sharp curvature of the independent variables initial pH(𝐴) and incubation period (𝐸, h) that the bioethanol yieldincreased with the increment of initial pH and incubationperiod until reaching the central point around pH 5 and48 h and then the yield sharply decreased with higher pHbut the longer incubation period caused a relative decreasein the bioethanol yield. The comparatively low curvatureof initial molasses concentration (𝐵, % w : v), incubation
Deviation from reference point
Etha
nol y
ield
(%)
7.72
16.5
25.3
34.1
42.9
A A
BB
CC
DD
E
E
−2.00 −1.25 −0.500 0.250 1.00
Figure 3: Perturbation plot.
temperature (𝐶, C∘), and mixing rate (𝐷, rpm) showed lesssensitivity of bioethanol yield towards the changes in thesethree factors and the increase of bioethanol yield with theincrement of these three parameters. The curvatures alsoconfirm the data illustrated in Pareto chart (Figure 1). Thiswas also confirmed by the analysis of variance (ANOVA) ofthe regression model, where the statistical significance of themain and interacting effects of different studied parameterson the bioethanol yield at 95% confidence level was studied

Biotechnology Research International 7
26.0
29.9
33.8
37.7
41.6
Etha
nol y
ield
(%)
4.00
4.50
5.00
5.50
6.00
15.017.5
20.022.5
25.0 pH
Molasses concentration (wt%)
(a)
11.7
19.1
26.6
34.0
41.5
Etha
nol y
ield
(%)
4.00
4.50
5.00
5.50
6.00
24.036.0
48.060.0
72.0 pH
Incubation period (h)
(b)
24.028.432.737.141.5
Etha
nol y
ield
(%)
50.075.0
100.0
125.0
150.0
24.0
36.0
48.0
60.0
72.0
Mixing rate (rpm)
Incubation period (h)
(c)
37.939.340.742.043.4
Etha
nol y
ield
(%)
15.017.5
20.022.5
25.0
25.0
27.5
30.0
32.5
35.0
Molasses concentration (wt%)
Temperature ( ∘C)
(d)
Figure 4: RSM and contour plots.
and illustrated in Table 3. The significance of each coefficientwas determined by 𝐹-values and 𝑃 values. The larger themagnitude of the 𝐹-value, the smaller the 𝑃-values and themore significant the corresponding coefficient. This impliesthat the main effect of mixing rate, incubation temperature,and initial molasses concentration has statistically positiveimpact on bioethanol yield (𝑃 = 0.0008, 0.006, and 0.002,resp.), while the quadratic effects of initial pH and incubationperiod have a very highly negative statistically significanteffect on bioethanol yield (𝑃 < 0.0001), that is, decrease inbioethanol yield with increment of these parameters. But theinteractive effect of the mixing rate and incubation periodhas a statistically possible positive impact on the bioethanol
yield (𝑃 = 0.0195), while the interactive effect of the initialmolasses concentration and mixing rate has a statisticallypossible negative impact on the bioethanol yield (𝑃 =0.0534).
3.3. Optimization of the Fermentation Process. Three-dimensional response surfaces were plotted on the basis ofthe predicted model equation to investigate the interactionamong the variables and to determine the optimumconditionof each factor for maximum bioethanol yield %.
It is obvious from the RSM and contour plots of theinteractive effect of the initial molasses concentration andpH (Figure 4(a)) that with the increase of initial pH the
8 Biotechnology Research International
bioethanol yield increased reaching its maximum withinpH 5 but decreased again with further increase of initialpH, while the bioethanol yield increased with the incrementof the initial molasses concentration, recording maximumbioethanol yield at pH 5 and 25% initial molasses concentra-tion. The elliptical shape (Figure 4(b)) showed the negativeinteractive effect of initial pH and incubation period on thebioethanol yield, where the bioethanol yield increased withthe increment of the incubation period and initial pH andrecorded its maximum of ≈42% at pH 5 within 48–60 hincubation period but decreased with further increment ininitial pH and incubation period. But the RSM and contourplots (Figure 4(c)) showed the positive interactive effect of themixing rate and incubation period on the bioethanol yield,where the bioethanol yield increased with the increment ofmixing rate and incubation period recording its maximumwithin 48–60 h but decreased with longer incubation period.The plots showed also that the bioethanol yieldwas not highlyincreased at higher mixing rate (≥120 rpm). Figure 4(d)shows the positive interactive effect of molasses concentra-tion and incubation temperature, where the bioethanol yieldincreased with the increment of those two factors recordingits maximum of ≈44% at 25% initial molasses concentrationat 35∘C.
Maiorella et al. [18], Cazetta et al. [19], and Shafaghatet al. [11] reported the pH of fermentation medium as animportant parameter affecting the microbial growth andproduct formation. Misono and Yamaguchi [5] reported thatthe optimum pH for the alcoholic fermentation of molasseswas pH 5 and decreased with the increase of pH to pH6. Yadav et al. [9] reported molasses fermentation by S.cerevisiae HAU-1, where the increase in pH from 4 to 5increased the alcohol productivity and concentration, whilethe optimum pH range was within pH 4.5–5. Morimura etal. [8] reported a yeast strain K211 that showed highest cellviability and ethanol productivity in amolasses medium con-taining 25% (w : v) at 35∘C. Cazetta et al. [19] reported max-imum bioethanol fermentation of molasses by Zymomonasmobilis at 35∘C and higher temperature has negative impacton fermentation process. Shafaghat et al. [11] reported maxi-mum bioethanol fermentation of molasses by Saccharomycescerevisiae PTCC24860 at pH 5.3 and incubation time of 24 h,where bioethanol production decreased at longer incubationperiod, due to sugar depletion, ethanol oxidation, and organicacid formation. Dombek and Ingram [20] reported thatthe accumulation of ethanol in fermentation broth causesdeactivation of alcohol producing enzymes.
The optimization process was carried out to determinethe optimum values of the studied five parameters affectingthe fermentation process of sugarcane molasses by Pichiaveronae strain HSC-22, to maximize the bioethanol produc-tion (g/L) and bioethanol yield%.Thiswas done usingDesignExpert 6.0.7 software (Stat-Ease Inc., Minneapolis, USA).According to the software optimization step, the desiredgoal for each fermentation parameter (𝐴 initial pH, 𝐵 initialmolasses concentration wt%, 𝐶 incubation temperature ∘C,𝐷 mixing rate rpm, and 𝐸 incubation period h) was definedwithin the studied levels range to achieve the highest per-formance. The program combines the individual desirability
into a single number and then searches to optimize thisfunction based on the response goal. Accordingly, the opti-mum conditions giving the maximum calculated bioethanolproduction of 30.7 g/L with bioethanol yield of 42% wereas follows: pH 5, 25% initial molasses concentration, 35∘C,116 rpm, and 60 h, with desirability function value of 1. Theexperimental result of these conditionswas found to be 32 g/Lwith bioethanol yield of 43.57%. That indicates the processoptimization based on CCD of experiments was capable andreliable to optimize the bioethanol fermentation process ofSCM by Pichia veronae strain HSC-22.
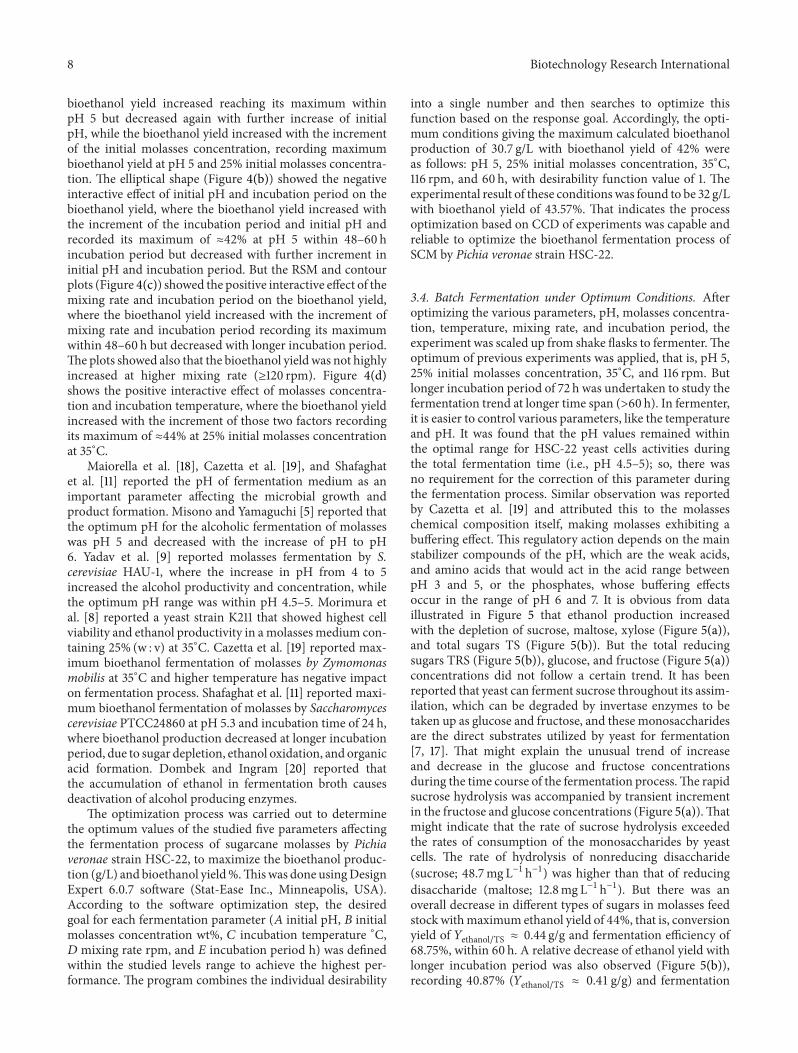
3.4. Batch Fermentation under Optimum Conditions. Afteroptimizing the various parameters, pH, molasses concentra-tion, temperature, mixing rate, and incubation period, theexperiment was scaled up from shake flasks to fermenter.Theoptimum of previous experiments was applied, that is, pH 5,25% initial molasses concentration, 35∘C, and 116 rpm. Butlonger incubation period of 72 h was undertaken to study thefermentation trend at longer time span (>60 h). In fermenter,it is easier to control various parameters, like the temperatureand pH. It was found that the pH values remained withinthe optimal range for HSC-22 yeast cells activities duringthe total fermentation time (i.e., pH 4.5–5); so, there wasno requirement for the correction of this parameter duringthe fermentation process. Similar observation was reportedby Cazetta et al. [19] and attributed this to the molasseschemical composition itself, making molasses exhibiting abuffering effect. This regulatory action depends on the mainstabilizer compounds of the pH, which are the weak acids,and amino acids that would act in the acid range betweenpH 3 and 5, or the phosphates, whose buffering effectsoccur in the range of pH 6 and 7. It is obvious from dataillustrated in Figure 5 that ethanol production increasedwith the depletion of sucrose, maltose, xylose (Figure 5(a)),and total sugars TS (Figure 5(b)). But the total reducingsugars TRS (Figure 5(b)), glucose, and fructose (Figure 5(a))concentrations did not follow a certain trend. It has beenreported that yeast can ferment sucrose throughout its assim-ilation, which can be degraded by invertase enzymes to betaken up as glucose and fructose, and these monosaccharidesare the direct substrates utilized by yeast for fermentation[7, 17]. That might explain the unusual trend of increaseand decrease in the glucose and fructose concentrationsduring the time course of the fermentation process.The rapidsucrose hydrolysis was accompanied by transient incrementin the fructose and glucose concentrations (Figure 5(a)).Thatmight indicate that the rate of sucrose hydrolysis exceededthe rates of consumption of the monosaccharides by yeastcells. The rate of hydrolysis of nonreducing disaccharide(sucrose; 48.7mg L−1 h−1) was higher than that of reducingdisaccharide (maltose; 12.8mg L−1 h−1). But there was anoverall decrease in different types of sugars in molasses feedstock withmaximum ethanol yield of 44%, that is, conversionyield of 𝑌ethanol/TS ≈ 0.44 g/g and fermentation efficiency of68.75%, within 60 h. A relative decrease of ethanol yield withlonger incubation period was also observed (Figure 5(b)),recording 40.87% (𝑌ethanol/TS ≈ 0.41 g/g) and fermentation
Biotechnology Research International 9
0
0.3
0.6
0.9
1.2
1.5
1.8
0
10
20
30
40
50
60
0 10 20 30 40 50 60 70
Mal
tose
, xyl
ose (
g/L)
Sucr
ose,
gluc
ose,
and
fruc
tose
(g/L
)
Time (h)
Sucrose
GlucoseFructoseMaltoseXylose
(a)
0
10
20
30
40
50
0
15
30
45
60
75
0 10 20 30 40 50 60 70 80
Prod
uced
bio
etha
nol y
ield
Suga
rs (g
/L)
Time (h)
TRS (g/L)TS (g/L)
Bioethanol (g/L)Bioethanol yield (%)
(b)
Figure 5: Time profile of sugars consumption and bioethanol production.
efficiency of 63.86%, at the end of the fermentation process72 h. This low ethanol yield relevant to the consumptionof TS (75%) might be due to the inhibitory effect of otherbyproducts. Ergun andMutlu [10] reported that fermentationinhibition might occur by secondary fermentation products,which would consequently limit the ethanol productivity.But the bioethanol yield recorded in this study is withinthe reported yield in the literature; Roukas [21] reportedethanol yield 𝑌ethanol/TS ≈ 0.3 g/g from beet molasses bySaccharomyces cerevisiae. Kopsahelis et al. [22] reportedethanol yield 𝑌ethanol/TS ≈ 0.47 g/g from waste molasses bySaccharomyces cerevisiae.
4. Conclusion
The central composite design CCD of experiments was foundto be applicable for modeling the productivity of ethanolthroughout the batch fermentation of sugarcane molassesSCM by the Egyptian yeast isolate Pichia veronae strainHSC-22 (accession number KP012558). By the use of thedeveloped quadratic model, response surfaces, and contourplots, the investigation for the variation of the bioethanolyield depending on the changes in the process variables, pH,molasses concentration, temperature, mixing rate, and time,and the maximization of the bioethanol yield was found tobe easily studied and predicted. Further work is undertakennow in EPRI Biotechnology Lab to investigate the effect ofthe molasses constituents and the secondary fermentationbyproducts on the fermentation process and the bioethanolyield. Also, modeling and simulation for the rate of ethanolproduction with the rate of the sugars consumption and yeastgrowth are under investigation and will be published soon.
Conflict of Interests
The authors declare that there is no conflict of interestsregarding the publication of this paper.
References
[1] D. Sarris, L. Matsakas, G. Aggelis, A. A. Koutinas, and S.Papanikolaou, “Aerated vs non-aerated conversions of molassesand olive mill wastewaters blends into bioethanol by Saccha-romyces cerevisiae under non-aseptic conditions,” IndustrialCrops and Products, vol. 56, pp. 83–93, 2014.
[2] A. Gupta and J. P. Verma, “Sustainable bio-ethanol produc-tion from agro-residues: a review,” Renewable and SustainableEnergy Reviews, vol. 41, pp. 550–567, 2014.
[3] H. Bouallagui, Y. Touhami, N. Hanafi, A. Ghariani, and M.Hamdi, “Performances comparison between three technologiesfor continuous ethanol production frommolasses,”Biomass andBioenergy, vol. 48, pp. 25–32, 2013.
[4] N. S. El-Gendy, H. R. Madian, and S. S. A. Amr, “Design andoptimization of a process for sugarcane molasses fermentationby saccharomyces cerevisiae using response surface methodol-ogy,” International Journal of Microbiology, vol. 2013, Article ID815631, 9 pages, 2013.
[5] H. M. Misono and Y. Yamaguchi, “The alcoholic fermentationofmolasses,” Journal of Fermentation Technology, vol. 8, pp. 210–218, 1990.
[6] A. H. El-Refai, M. S. El-Abyad, A. I. El-Diwany, L. A. Sallam,and R. F. Allam, “Some physiological parameters for ethanolproduction from beet molasses by Saccharomyces cerevisiae Y-7,” Bioresource Technology, vol. 42, no. 3, pp. 183–189, 1992.
[7] K. Takeshige and K. Ouchi, “Factors affecting the ethanolproductivity of yeast in molasses,” Journal of Fermentation andBioengineering, vol. 79, no. 5, pp. 449–452, 1995.
[8] S. Morimura, Z. Y. Ling, and K. Kida, “Ethanol productionby repeated-batch fermentation at high temperature in amolasses medium containing a high concentration of totalsugar by a thermotolerant flocculating yeast with improved salt-tolerance,” Journal of Fermentation and Bioengineering, vol. 83,no. 3, pp. 271–274, 1997.
[9] A. Yadav, N. Dilbaghi, and S. Sharma, “Pretreatment of sugar-cane molasses for ethanol production by yeast,” Indian Journalof Microbiology, vol. 37, no. 1, pp. 37–40, 1997.

10 Biotechnology Research International
[10] M. Ergun and S. F. Mutlu, “Application of a statistical techniqueto the production of ethanol from sugar beet molasses bySaccharomyces cerevisiae,” Bioresource Technology, vol. 73, no. 3,pp. 251–255, 2000.
[11] H. Shafaghat, G. D. Najafpour, P. S. Rezaei, andM. Sharifzadeh,“Optimal growth of Saccharomyces cerevisiae (PTCC 24860) onpretreated molasses for the ethanol production: the applicationof the response surface methodology,” Chemical Industry andChemical EngineeringQuarterly, vol. 16, no. 2, pp. 199–206, 2010.
[12] R. P. Jones, N. Pamment, and P. F. Greenfield, “Alcohol fermen-tation by yeast: the effect of environmental and other variables,”Process Biochemistry, vol. 16, pp. 42–49, 1981.
[13] L. J. Wickerham, Taxonomy of Yeasts, Technical Bulletin no.1029, US Department of Agriculture, Washington, DC, USA,1951.
[14] R. K. Sedha, G. Verma, R. P. Gupta, and H. K. Tewari, “Ethanolproduction frommolasses using cell recycling of Saccharomycescerevisiae,” Journal of Fermentation Technology, vol. 62, pp. 471–476, 1984.
[15] G. L. Miller, “Use of dinitrosalicylic acid reagent for determina-tion of reducing sugar,” Analytical Chemistry, vol. 31, no. 3, pp.426–428, 1959.
[16] J. C. Chen and C. C. Chou,Cane Sugar Handbook: AManual forCane Sugar Manufacturers and Their Chemists, John Wiley andSons, New Jersey, NJ, USA, 2003.
[17] H. Nakata, M. Tamura, T. Shintani, and K. Gomi, “Evaluation ofbaker’s yeast strains exhibiting significant growth on Japanesebeet molasses and compound analysis of the molasses types,”Journal of Bioscience and Bioengineering, vol. 117, no. 6, pp. 715–719, 2014.
[18] B. L. Maiorella, H. W. Blanch, and C. R. Wilke, “Feed com-ponent inhibition in ethanolic fermentation by Saccharomycescerevisiae,” Biotechnology and Bioengineering, vol. 26, no. 10, pp.1155–1166, 1984.
[19] M. L. Cazetta, M. A. P. C. Celligoi, J. B. Buzato, and I. S.Scarmino, “Fermentation of molasses by Zymomonas mobilis:effects of temperature and sugar concentration on ethanolproduction,” Bioresource Technology, vol. 98, no. 15, pp. 2824–2828, 2007.
[20] K. M. Dombek and L. O. Ingram, “Ethanol production duringbatch fermentation with Saccharomyces cerevisiae: changes inglycolytic enzymes and internal pH,” Applied and Environmen-tal Microbiology, vol. 53, no. 6, pp. 1286–1291, 1987.
[21] T. Roukas, “Ethanol production from non-sterilized beetmolasses by free and immobilized cells using fed-batch culture,”Biotechnology and Bioengineering, vol. 43, pp. 189–194, 1996.
[22] N. Kopsahelis, N. Agouridis, A. Bekatorou, and M. Kanellaki,“Comparative study of spent grains and delignified spentgrains as yeast supports for alcohol production frommolasses,”Bioresource Technology, vol. 98, no. 7, pp. 1440–1447, 2007.